Amplify Energy Corp. · NYSE:AMPY
Amplify Energy — Investor Presentation (November 2024)
29 slides from Amplify Energy's investor presentation, Nov 6, 2024
Slide 1: Amplify Energy Corp. November 2024 Investor Presentation
NYSE: AMPY Amplify Energy Corp. November 2024 Investor Presentation November 6, 2024
Slide 2: Forward Looking Statements
Forward Looking Statements This presentation includes “forward-looking statements” within the meaning of Section 27A of the Securities Act of 1933, as amended, and Section 21E of the Securities Exchange Act of 1934, as amended. All statements, other than statements of historical fact, included in th
Slide 3: Non-GAAP Disclosure
Non-GAAP Disclosure Use of Non-GAAP Financial Measures. Amplify uses the non-GAAP financial measures of Adjusted EBITDA, free cash flow, net debt, PV-10 and cash G&A. The accompanying schedules include the non-GAAP financial measures of Adjusted EBITDA, free cash flow, net debt, PV-10 and cash G&A.
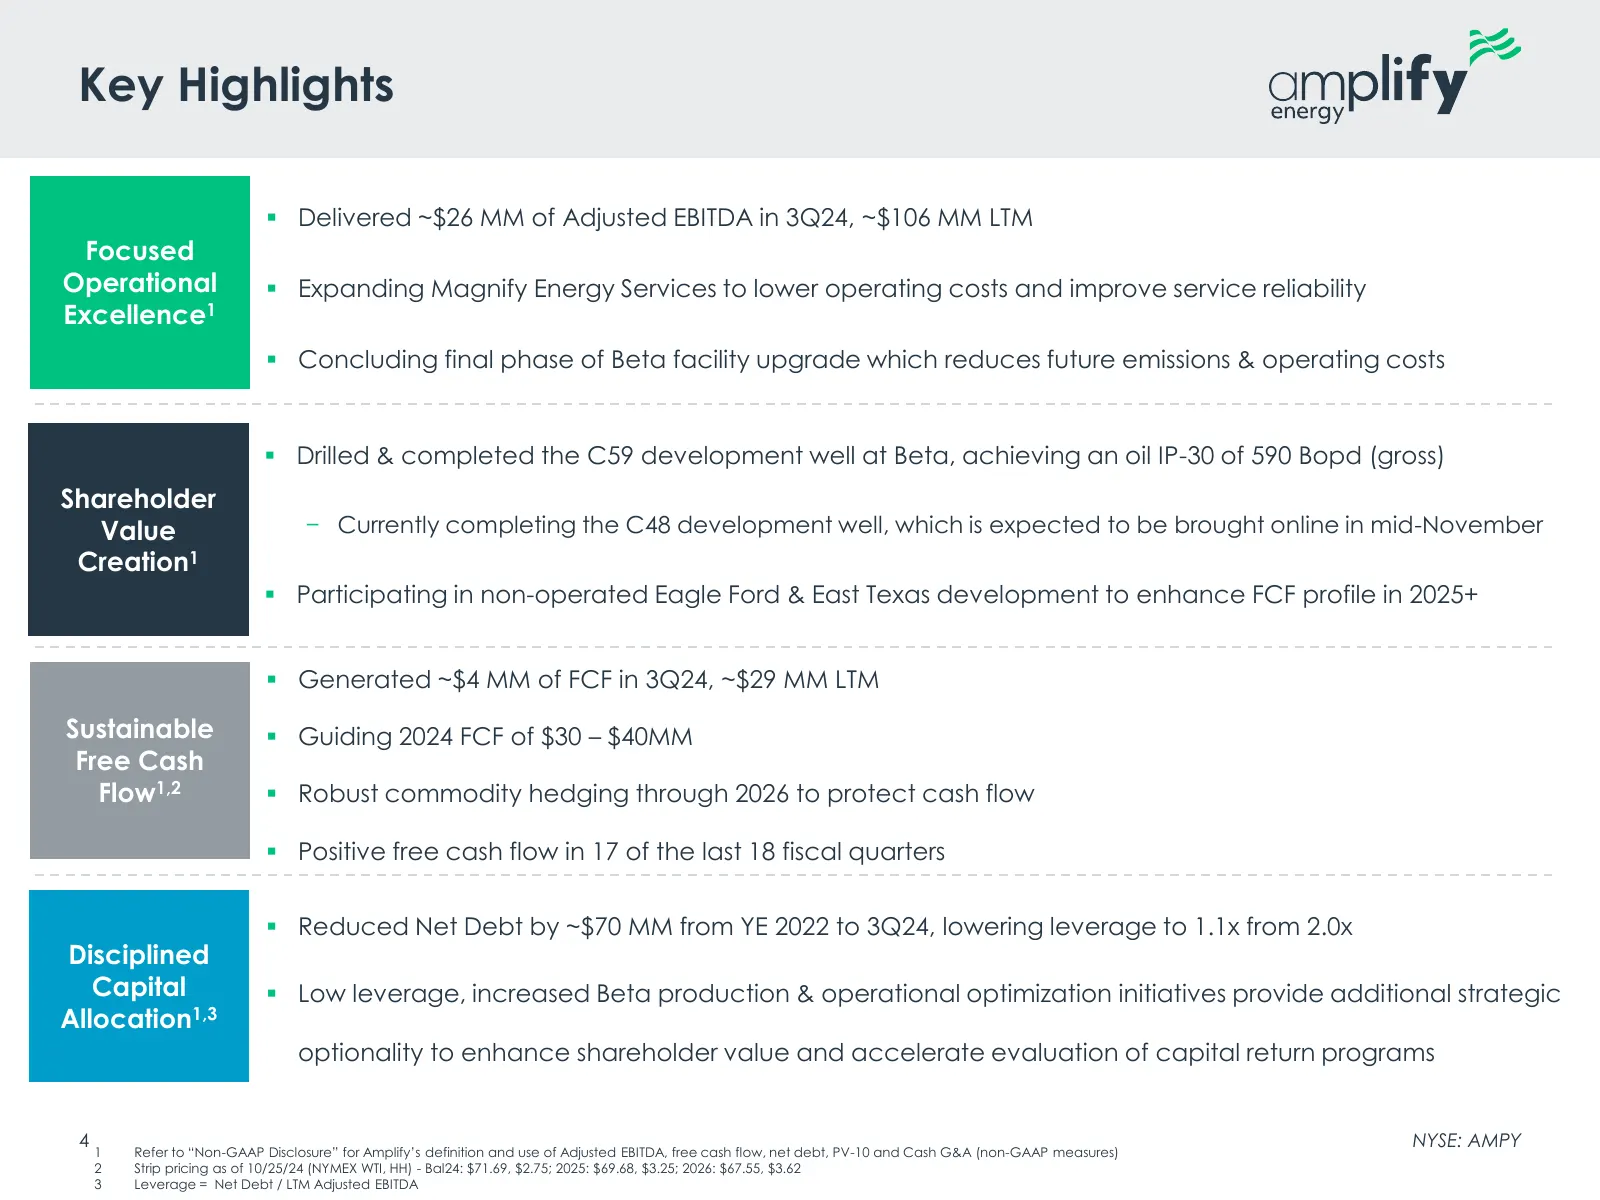
Slide 4: Key Highlights
Key Highlights ▪ Delivered ~$26 MM of Adjusted EBITDA in 3Q24, ~$106 MM LTM Focused Operational ▪ Expanding Magnify Energy Services to lower operating costs and improve service reliability Excellence1 ▪ Concluding final phase of Beta facility upgrade which reduces future emissions & operating costs
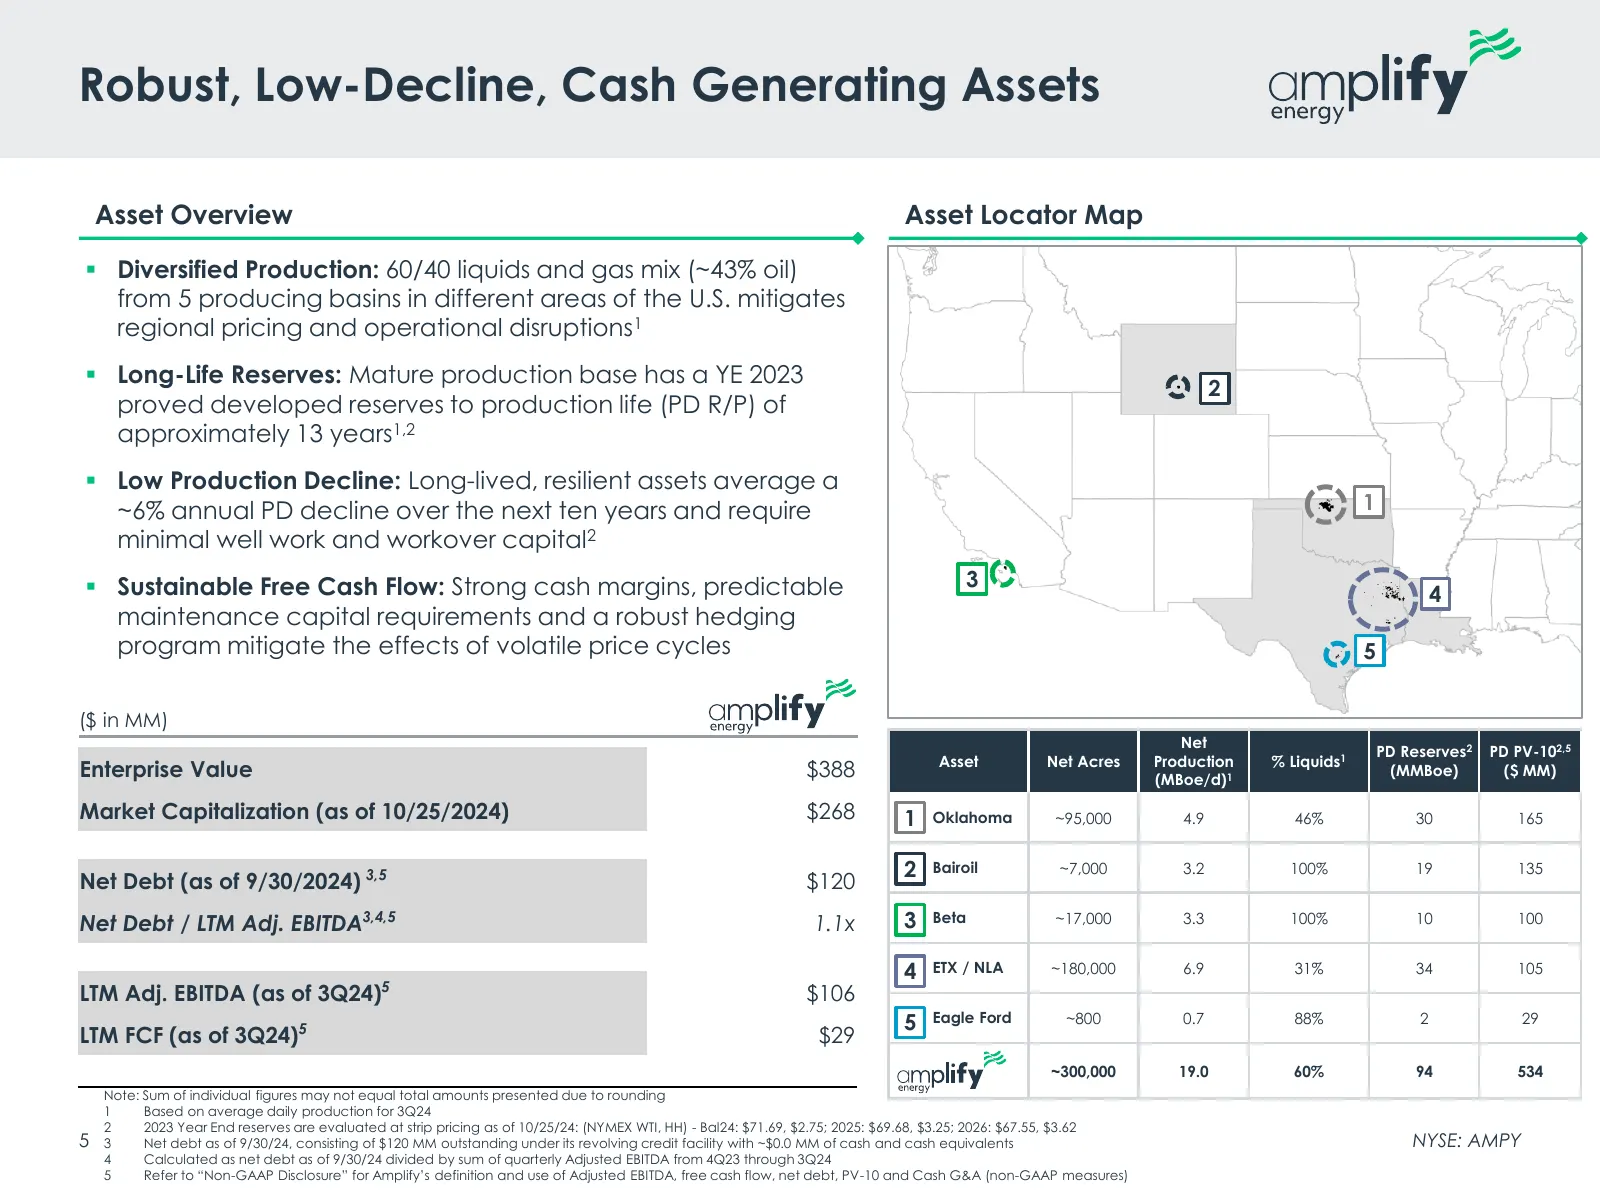
Slide 5: Robust, Low-Decline, Cash Generating Assets
Robust, Low-Decline, Cash Generating Assets Asset Overview Asset Locator Map ▪ Diversified Production: 60/40 liquids and gas mix (~43% oil) from 5 producing basins in different areas of the U.S. mitigates regional pricing and operational disruptions1 ▪ Long-Life Reserves: Mature production base has
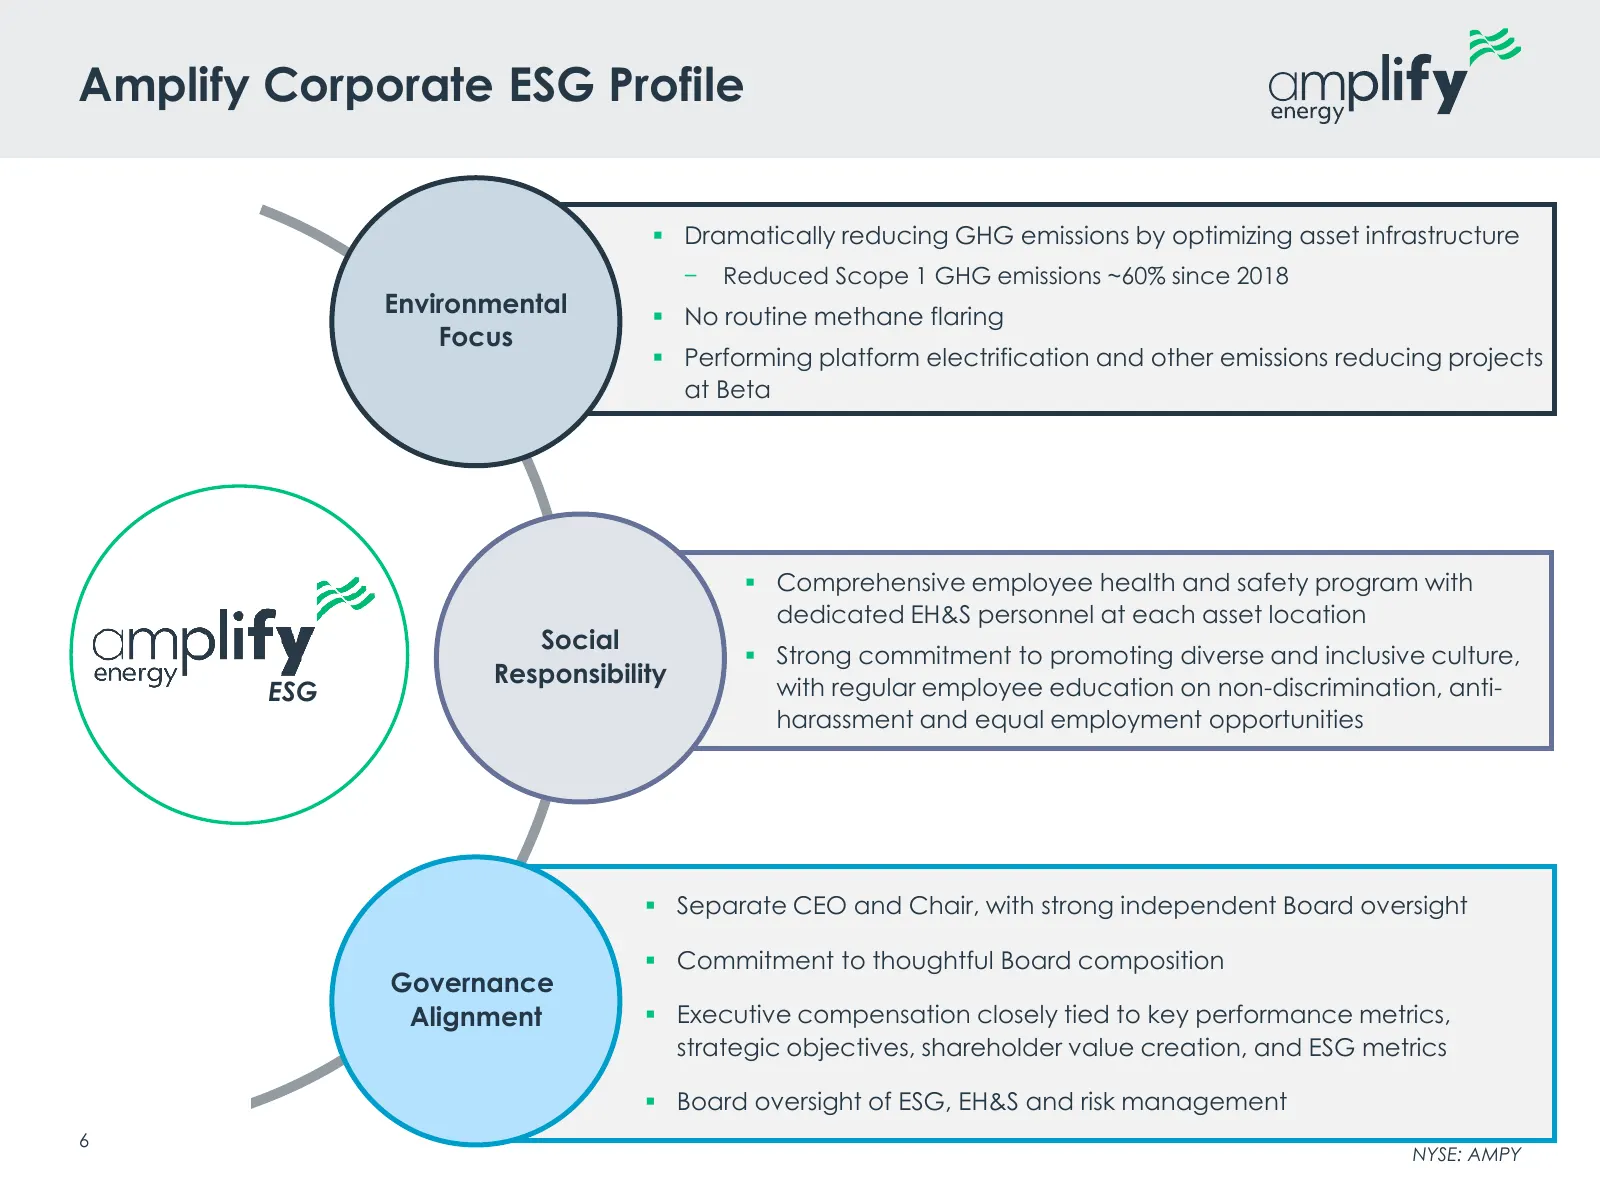
Slide 6: Amplify Corporate ESG Profile
Amplify Corporate ESG Profile ▪ Dramatically reducing GHG emissions by optimizing asset infrastructure − Reduced Scope 1 GHG emissions ~60% since 2018 Environmental ▪ No routine methane flaring Focus ▪ Performing platform electrification and other emissions reducing projects at Beta ▪ Comprehensive
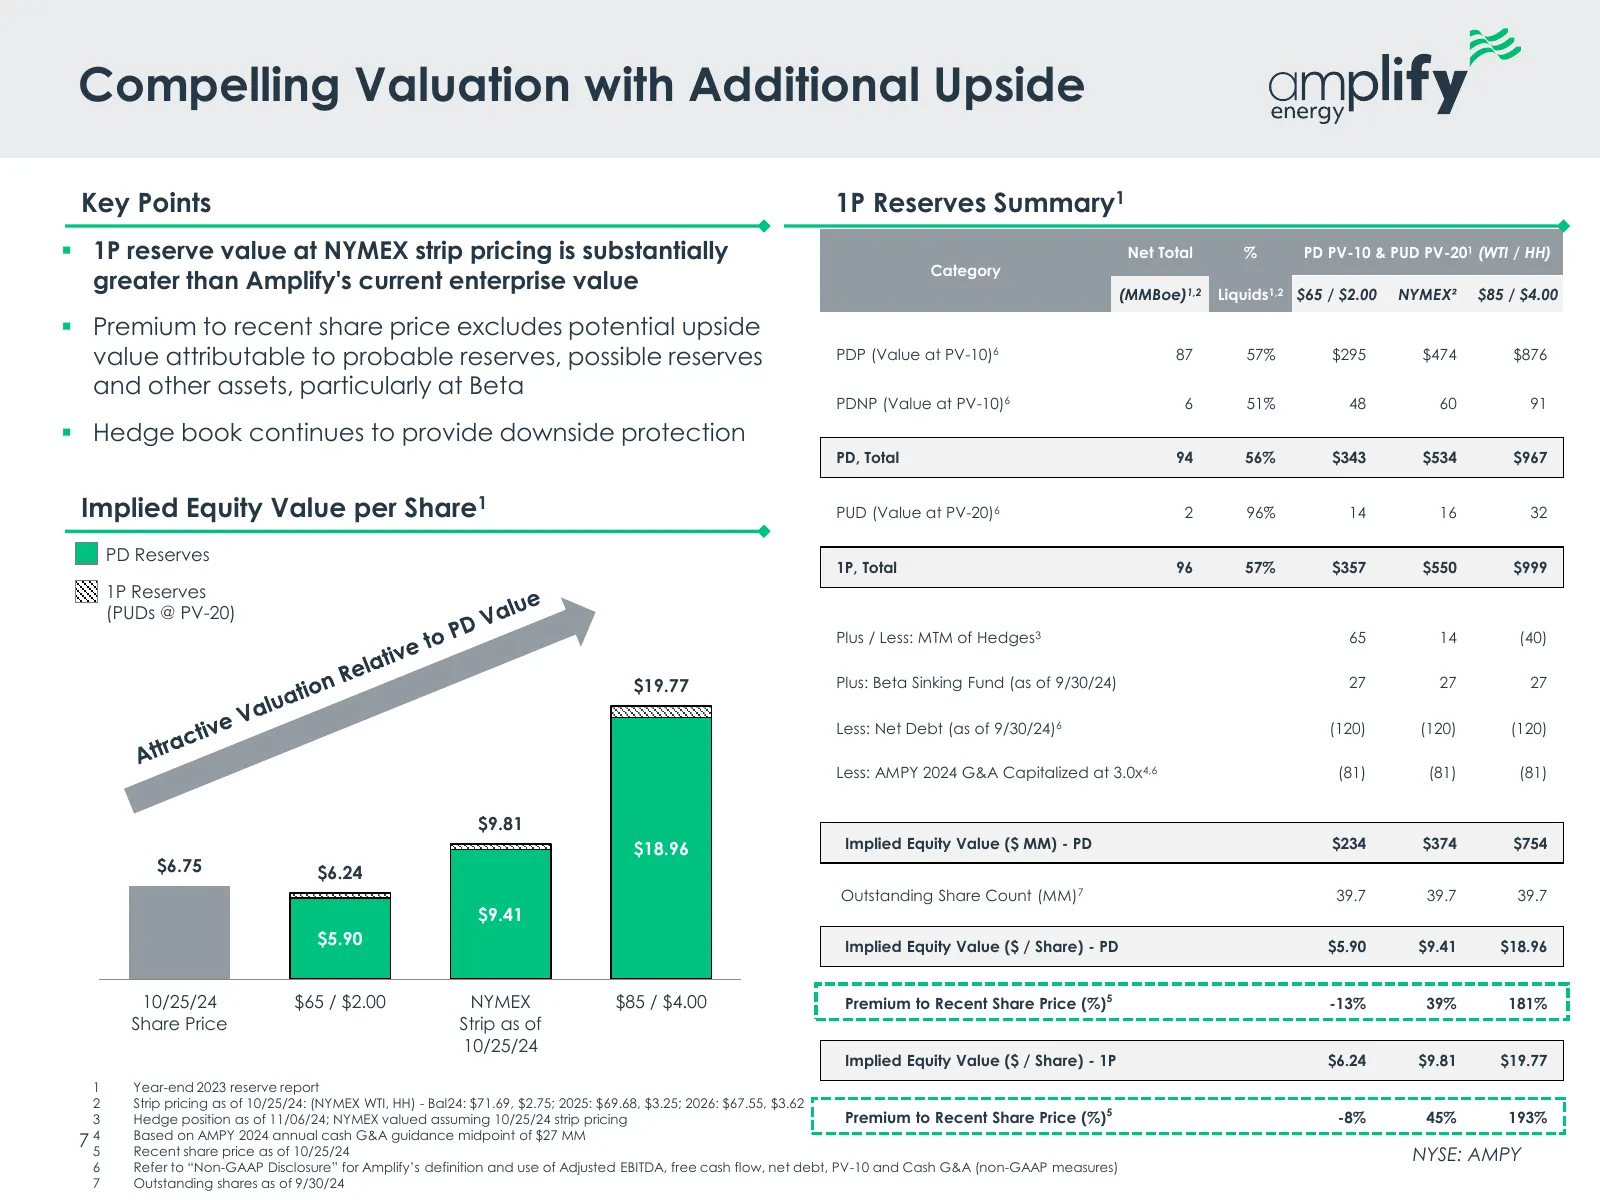
Slide 7: Compelling Valuation with Additional Upside
Compelling Valuation with Additional Upside Key Points 1P Reserves Summary1 ▪ 1P reserve value at NYMEX strip pricing is substantially Net Total % PD PV-10 & PUD PV-201 (WTI / HH) Category greater than Amplify's current enterprise value (MMBoe)1,2 Liquids1,2 $65 / $2.00 NYMEX² $85 / $4.00 ▪ Premium
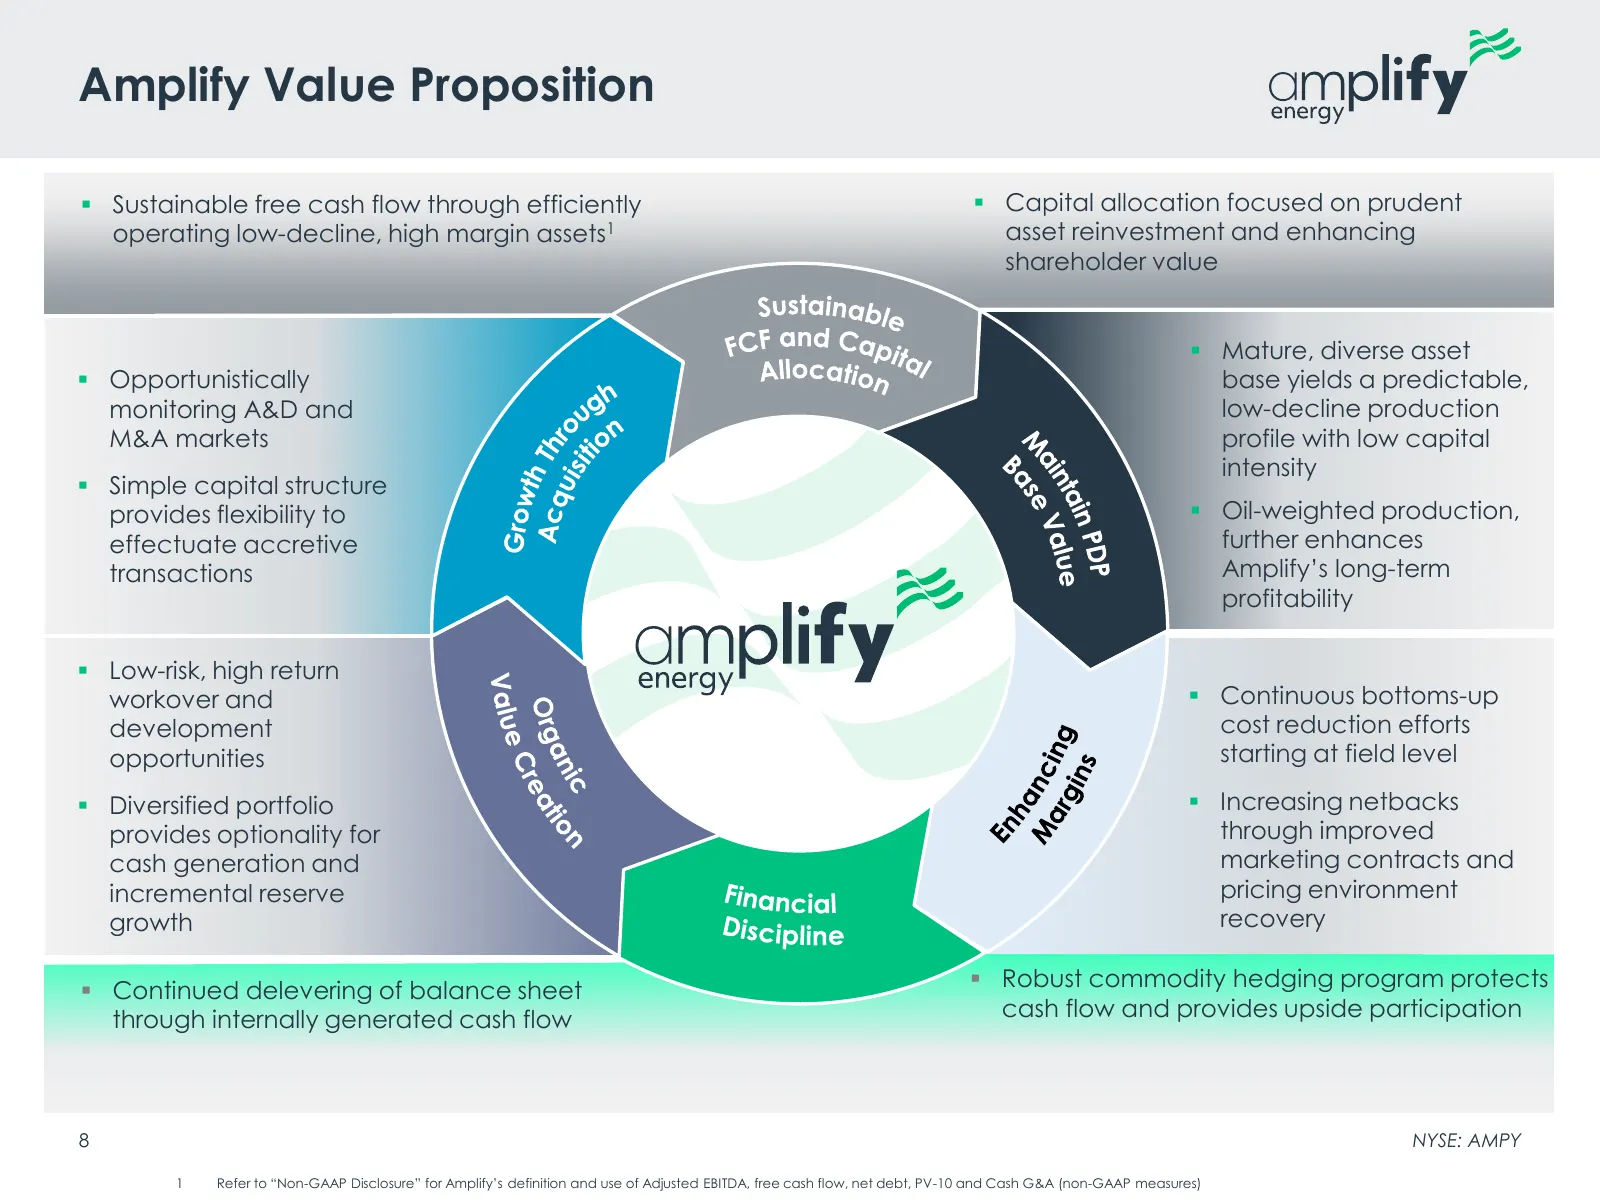
Slide 8: Amplify Value Proposition
Amplify Value Proposition ▪ Sustainable free cash flow through efficiently ▪ Capital allocation focused on prudent operating low-decline, high margin assets1 asset reinvestment and enhancing shareholder value Sustainable FCF and Capita ▪ Mature, diverse asset ▪ Opportunistically Allocation l base yi
Slide 9: Low-Decline, Mature Producing Properties
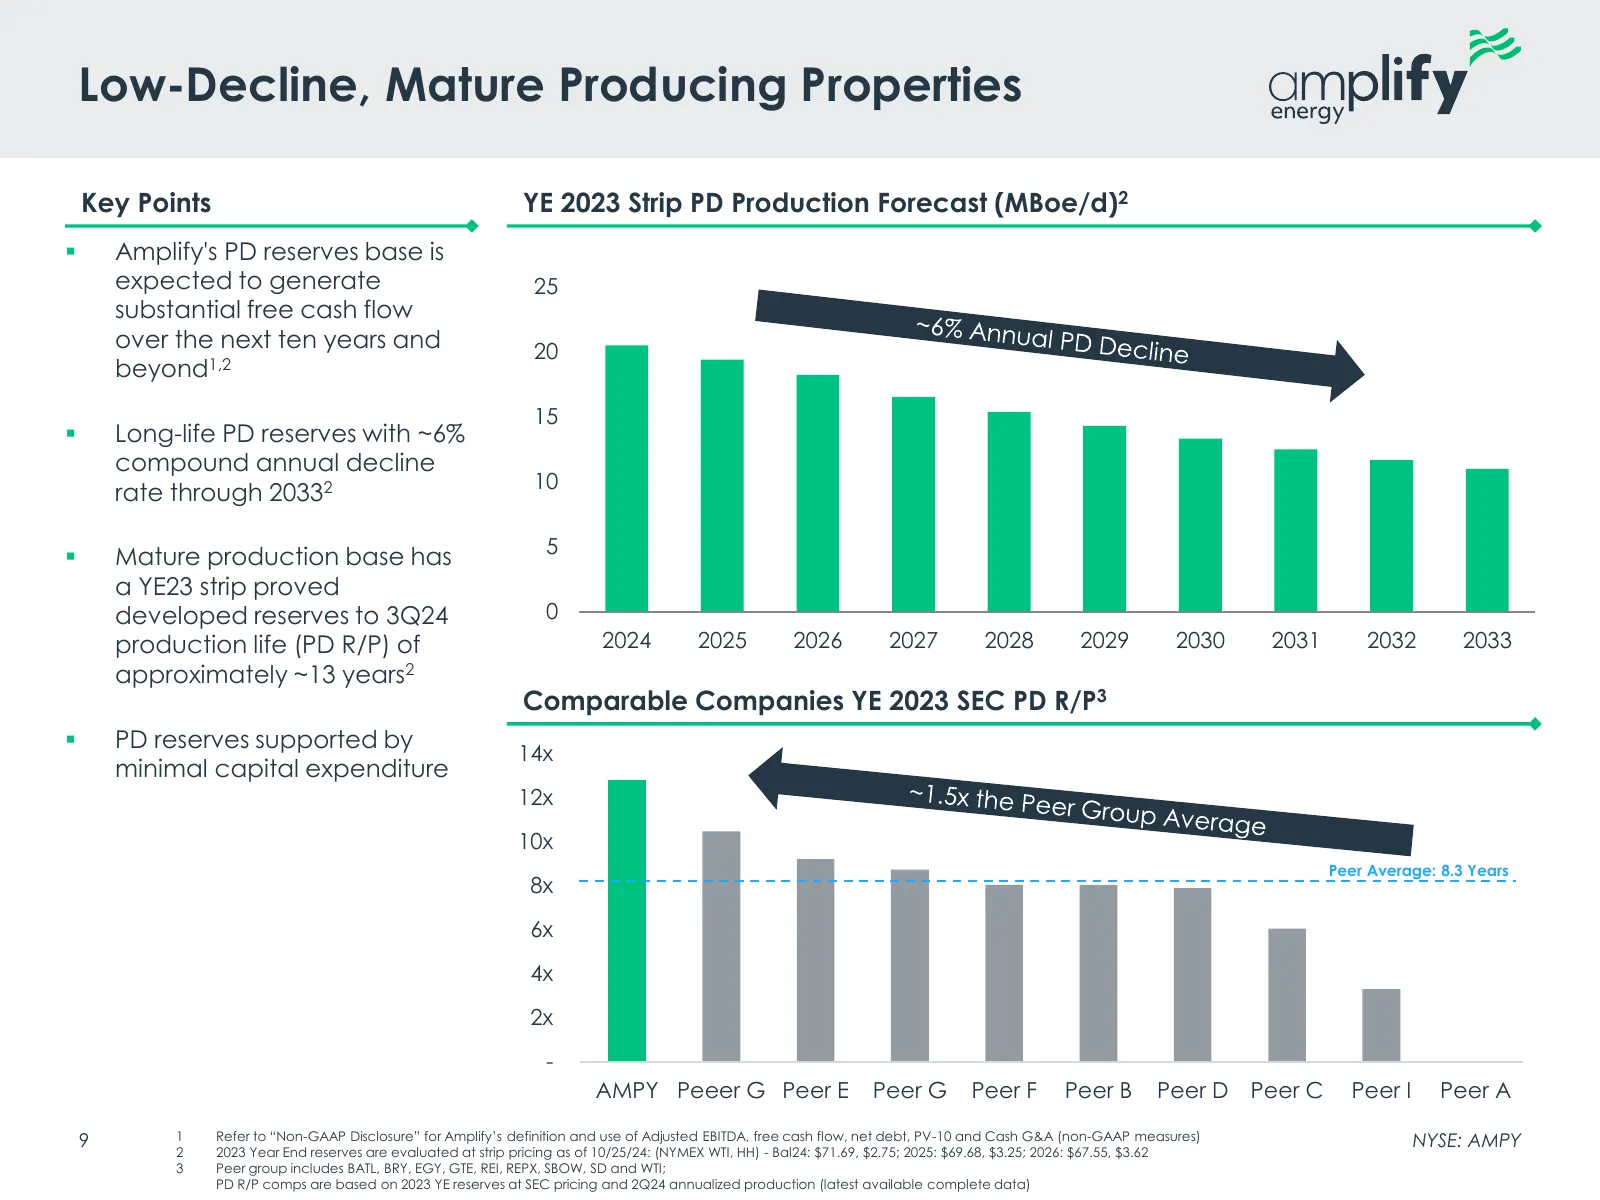
Low-Decline, Mature Producing Properties Key Points YE 2023 Strip PD Production Forecast (MBoe/d)2 ▪ Amplify's PD reserves base is expected to generate 25 substantial free cash flow over the next ten years and 20 beyond1,2 15 ▪ Long-life PD reserves with ~6% compound annual decline 10 rate through 2
Slide 10: Maintaining Financial Discipline Through Cycles
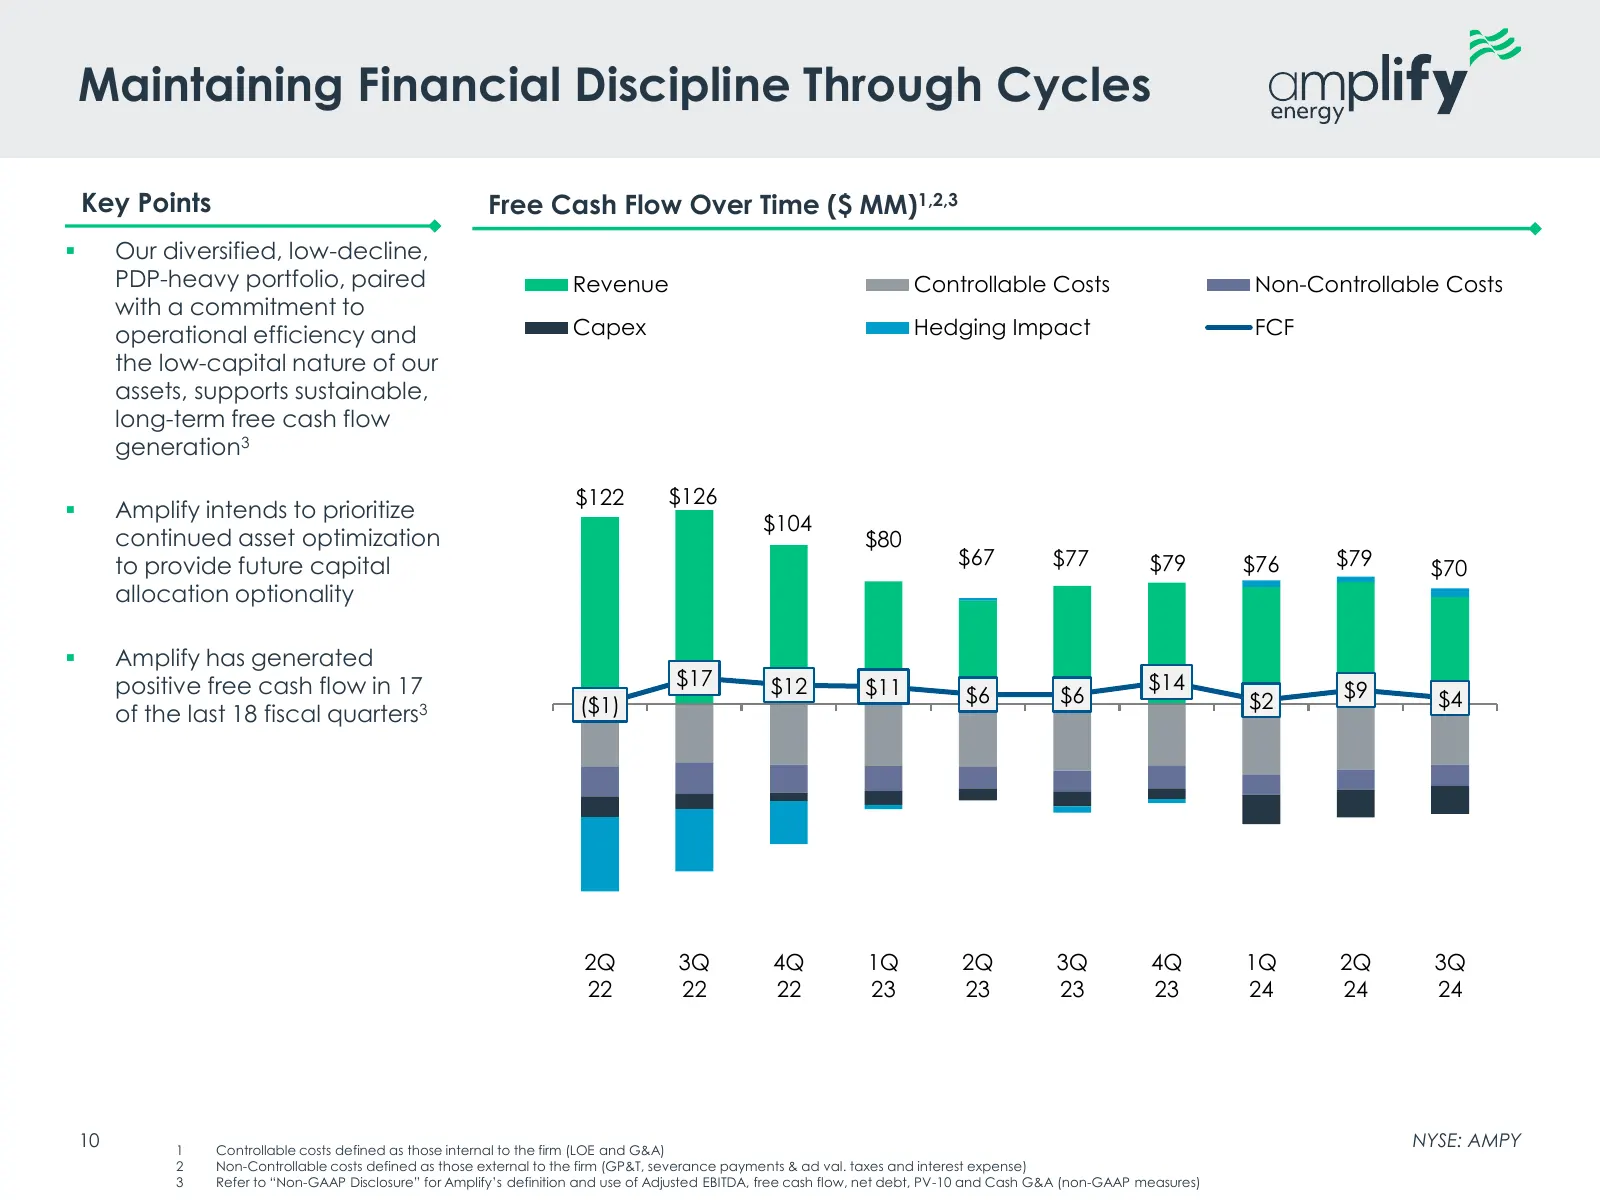
Maintaining Financial Discipline Through Cycles Key Points Free Cash Flow Over Time ($ MM)1,2,3 ▪ Our diversified, low-decline, PDP-heavy portfolio, paired Revenue Controllable Costs Non-Controllable Costs with a commitment to operational efficiency and Capex Hedging Impact FCF the low-capital natur
Slide 11: Lease Operating Expense Reductions
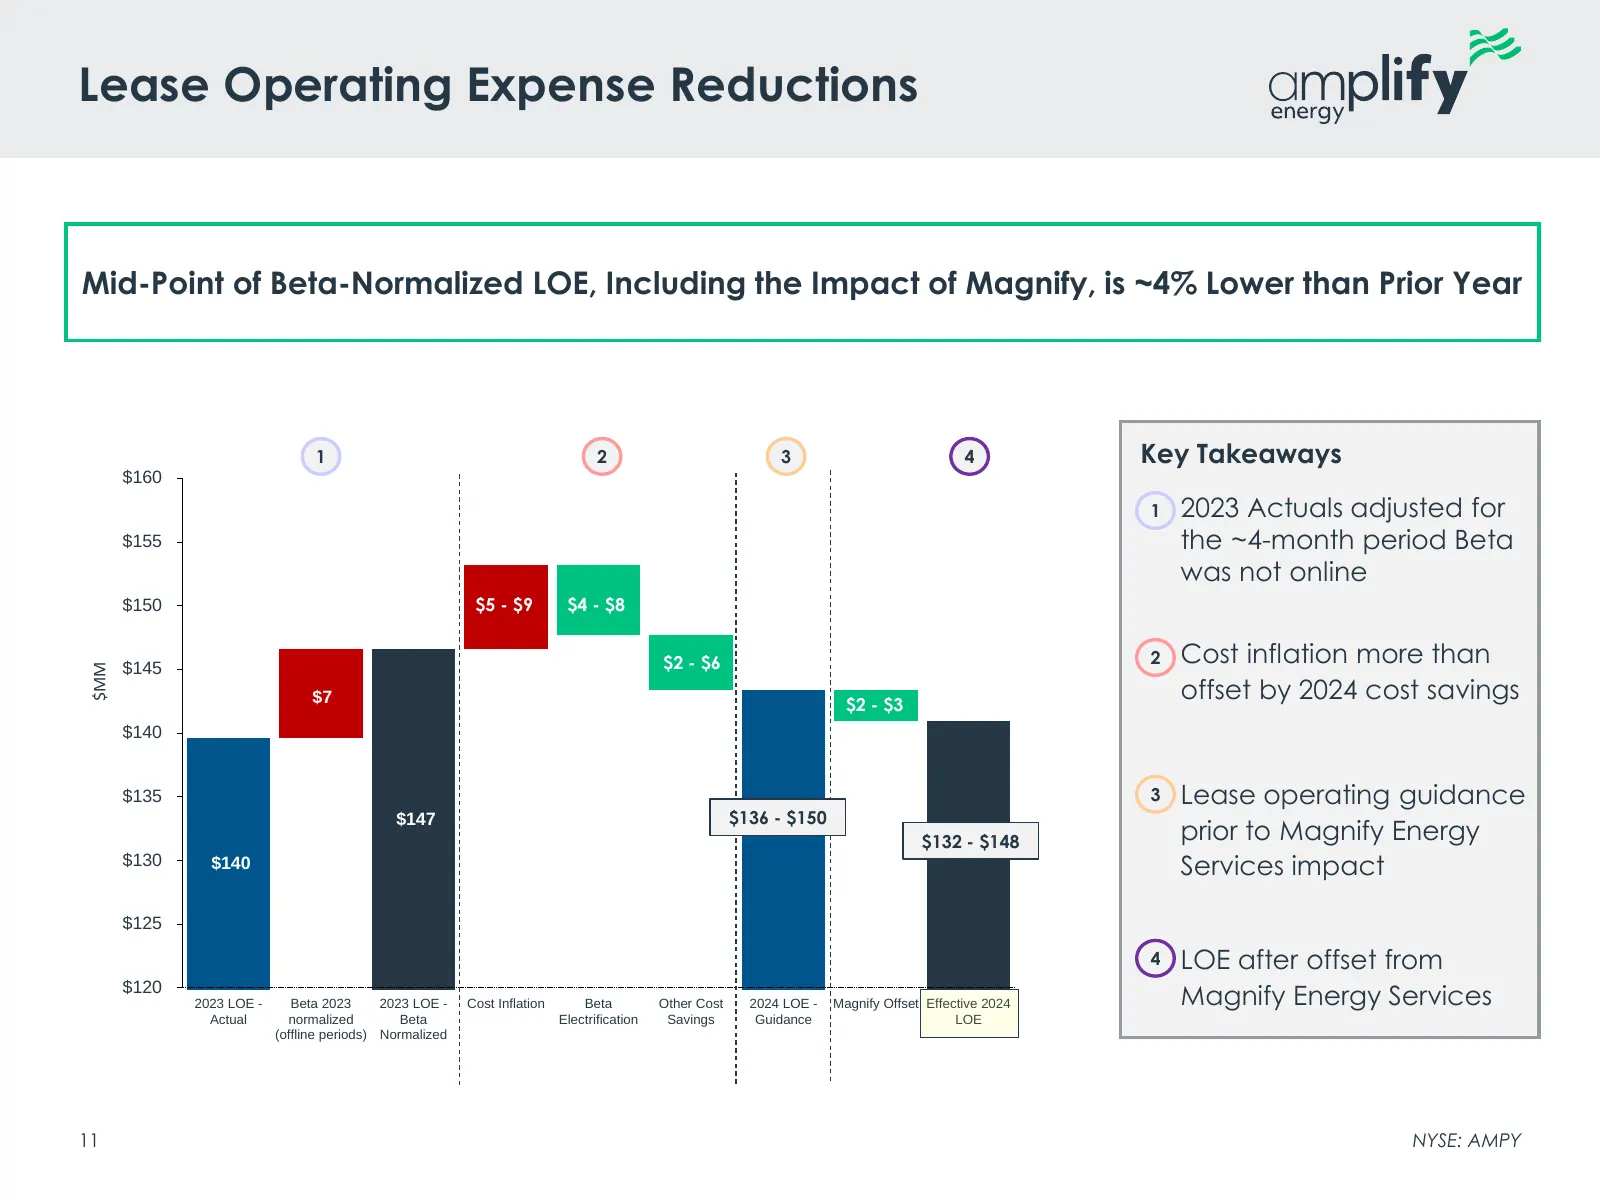
Lease Operating Expense Reductions Mid-Point of Beta-Normalized LOE, Including the Impact of Magnify, is ~4% Lower than Prior Year 1 2 3 4 Key Takeaways $160 ▪1 2023 Actuals adjusted for $155 the ~4-month period Beta was not online $150 $5 - $9 $4 - $8 $145 $2 - $6 ▪2 Cost inflation more than $MM $7
Slide 12: Creating Value & Building Long-Term Profitability
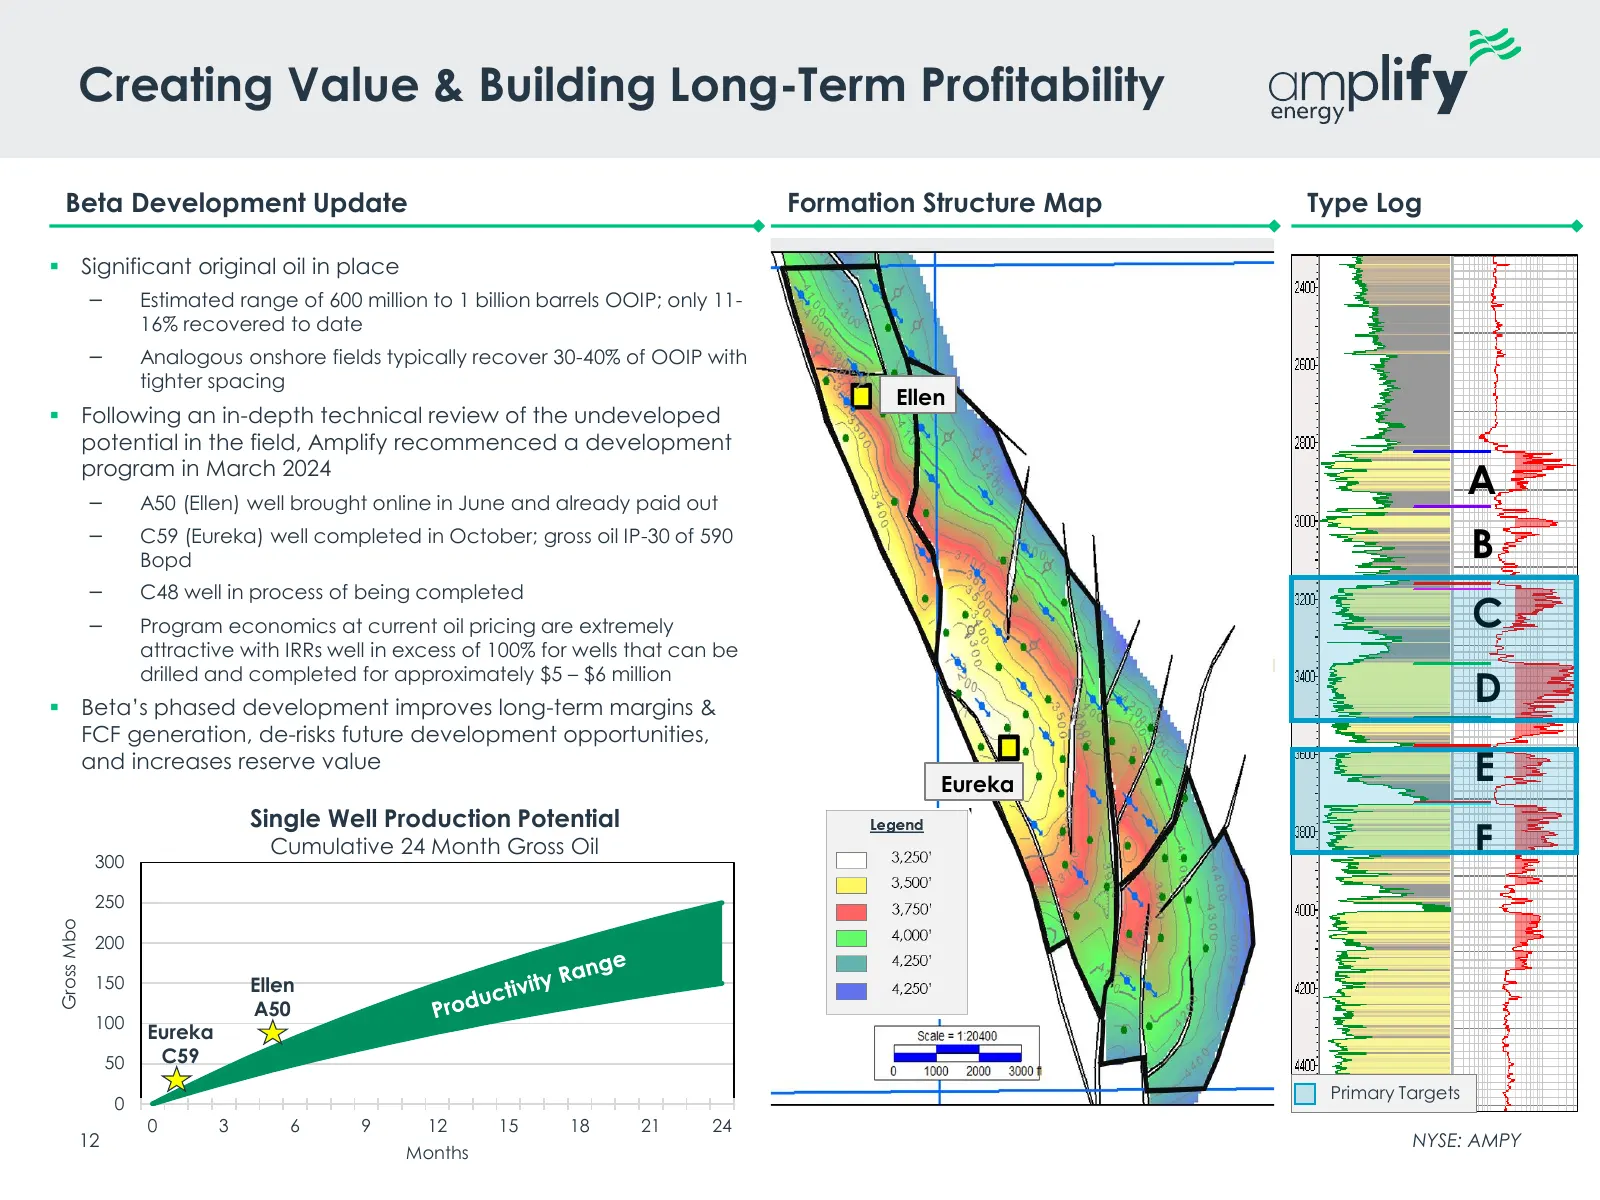
Creating Value & Building Long-Term Profitability Beta Development Update Formation Structure Map Type Log ▪ Significant original oil in place – Estimated range of 600 million to 1 billion barrels OOIP; only 11- 16% recovered to date – Analogous onshore fields typically recover 30-40% of OOIP with t
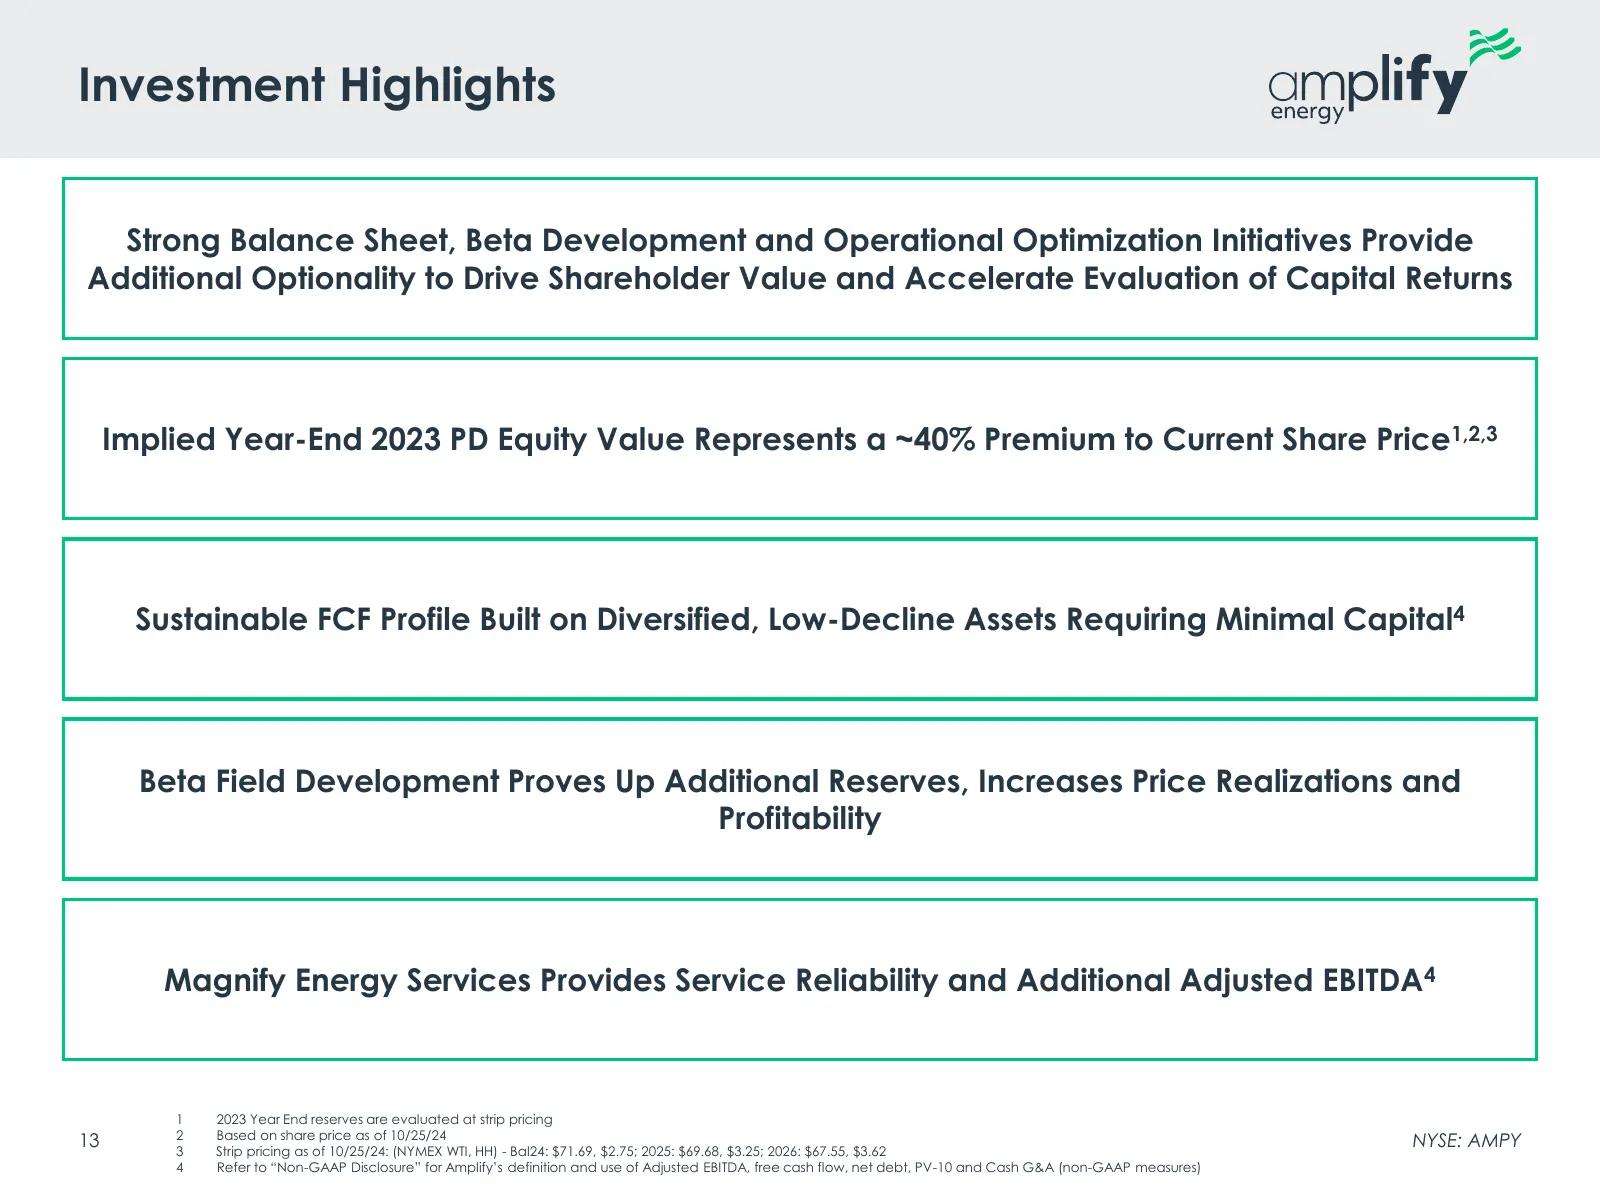
Slide 13: Investment Highlights
Investment Highlights Strong Balance Sheet, Beta Development and Operational Optimization Initiatives Provide Additional Optionality to Drive Shareholder Value and Accelerate Evaluation of Capital Returns Implied Year-End 2023 PD Equity Value Represents a ~40% Premium to Current Share Price1,2,3 Sus
Slide 14: Appendix
xX “4 amplify energy Appendix NYSE: AMPY
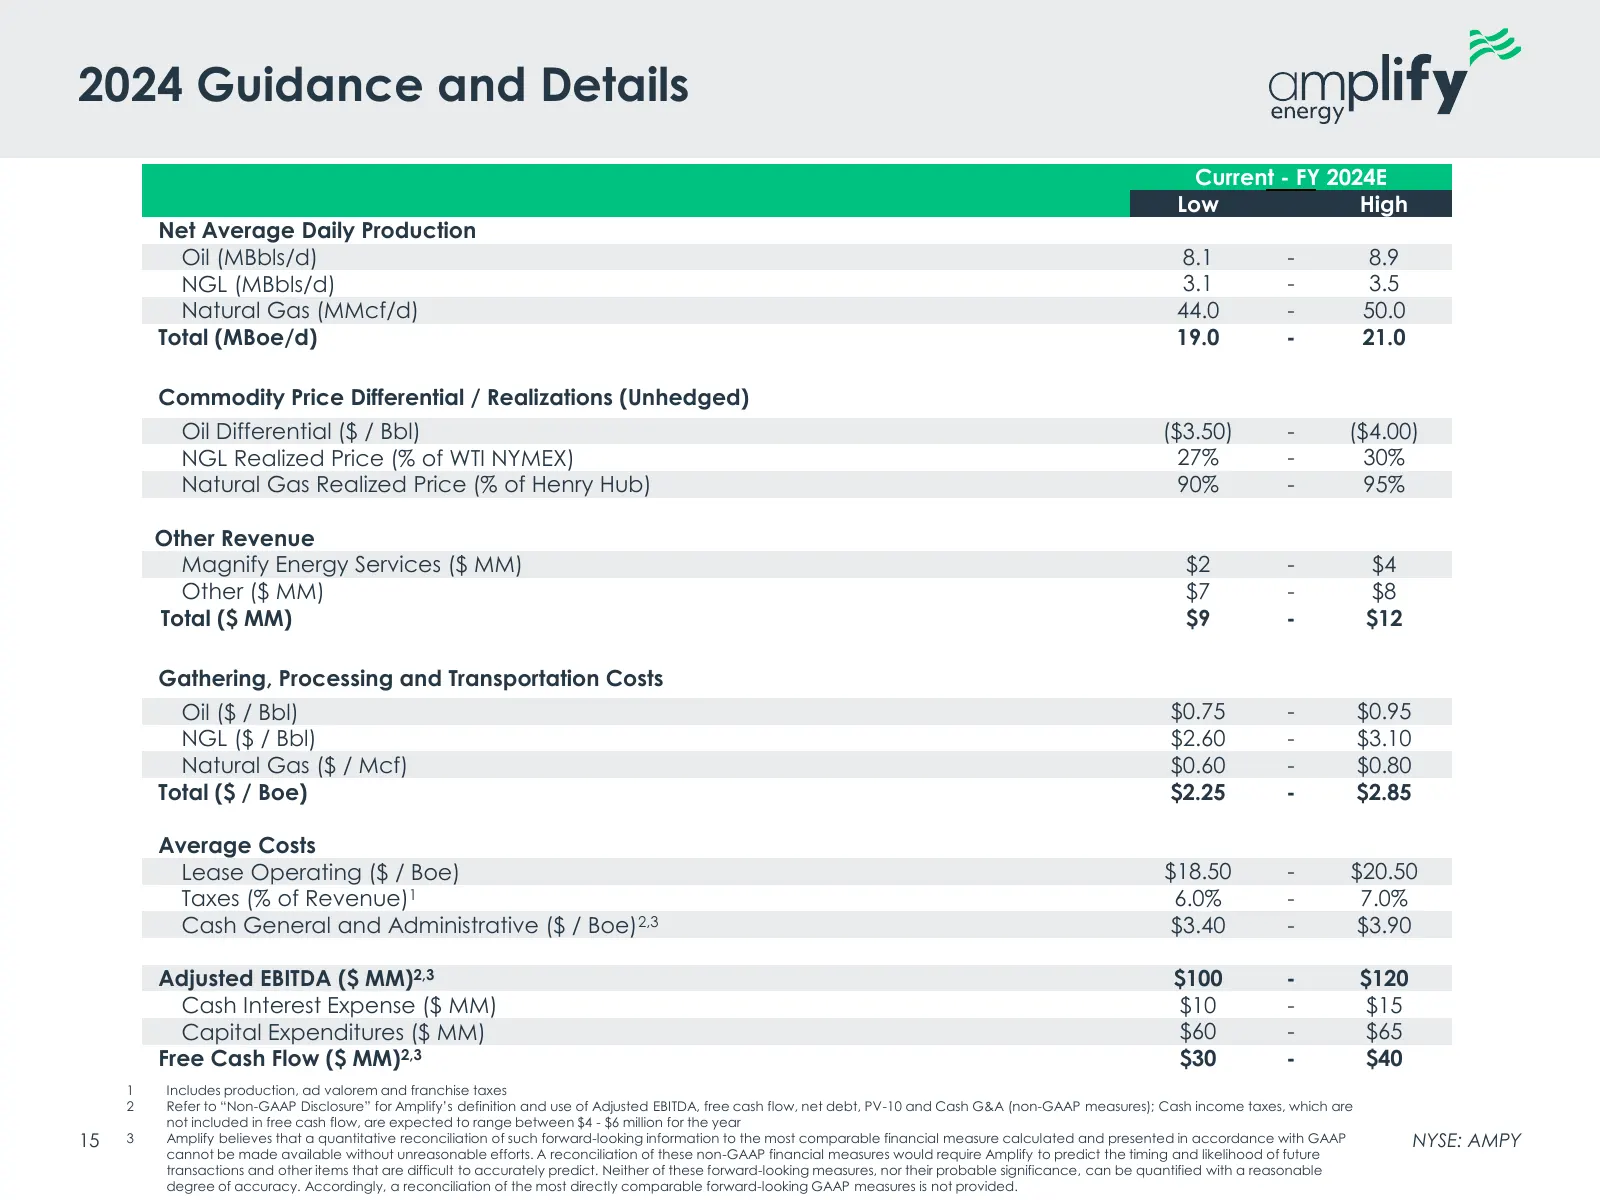
Slide 15: 2024 Guidance and Details
2024 Guidance and Details Current - FY 2024E Low High Net Average Daily Production Oil (MBbls/d) 8.1 - 8.9 NGL (MBbls/d) 3.1 - 3.5 Natural Gas (MMcf/d) 44.0 - 50.0 Total (MBoe/d) 19.0 - 21.0 Commodity Price Differential / Realizations (Unhedged) Oil Differential ($ / Bbl) ($3.50) - ($4.00) NGL Reali
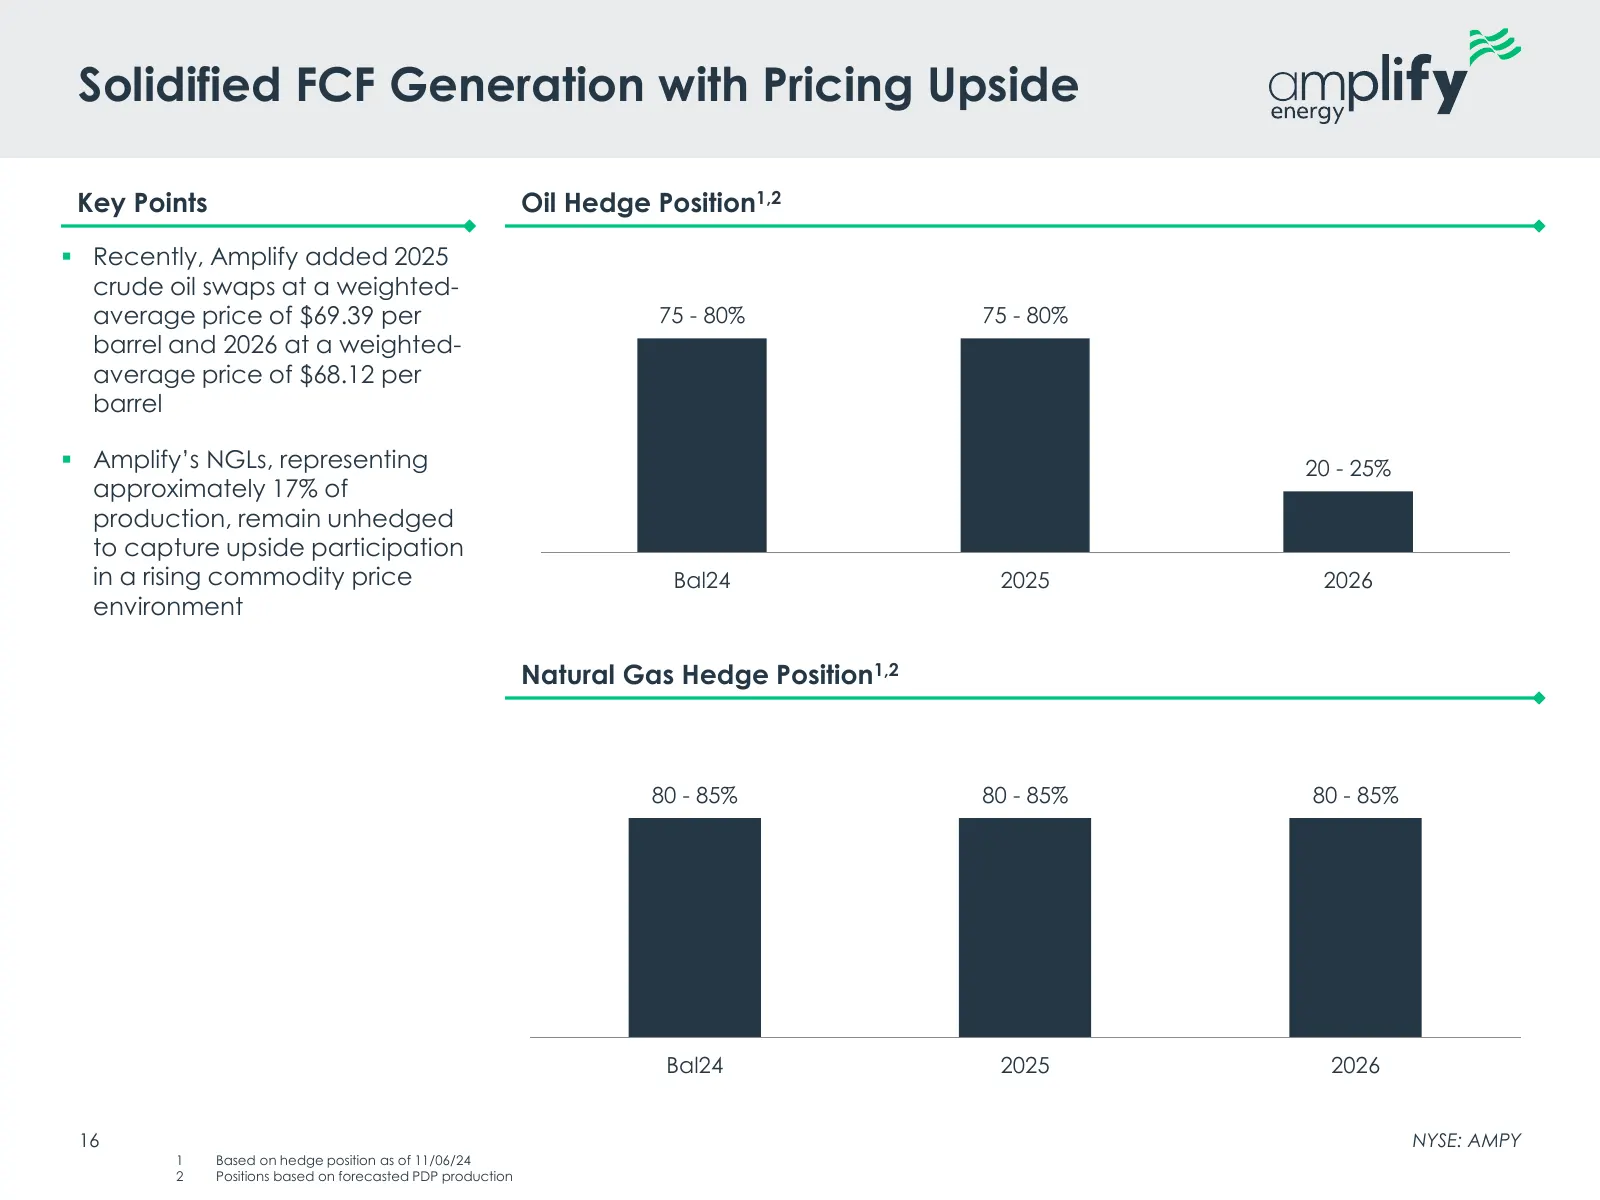
Slide 16: Solidified FCF Generation with Pricing Upside
Solidified FCF Generation with Pricing Upside Key Points Oil Hedge Position1,2 ▪ Recently, Amplify added 2025 crude oil swaps at a weighted- average price of $69.39 per 75 - 80% 75 - 80% barrel and 2026 at a weighted- average price of $68.12 per barrel ▪ Amplify’s NGLs, representing 20 - 25% approxi
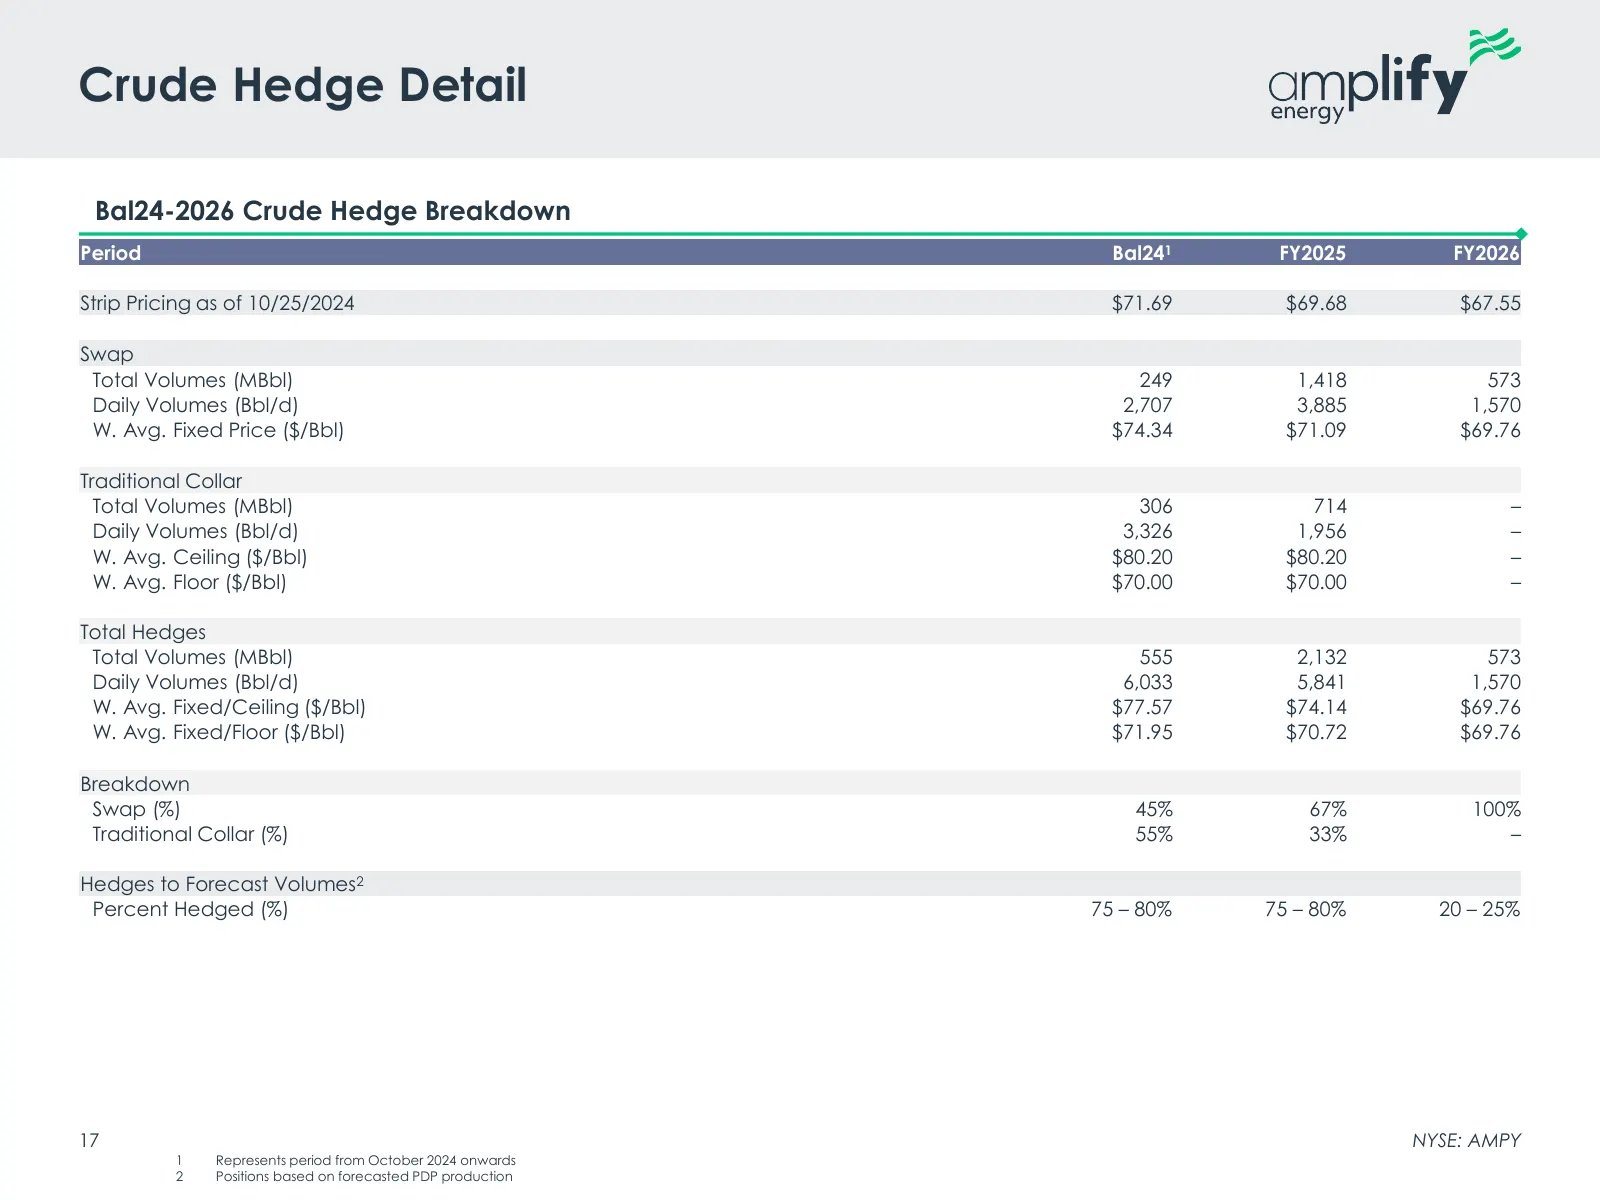
Slide 17: Crude Hedge Detail
Crude Hedge Detail Bal24-2026 Crude Hedge Breakdown Period Bal241 FY2025 FY2026 Strip Pricing as of 10/25/2024 $71.69 $69.68 $67.55 Swap Total Volumes (MBbl) 249 1,418 573 Daily Volumes (Bbl/d) 2,707 3,885 1,570 W. Avg. Fixed Price ($/Bbl) $74.34 $71.09 $69.76 Traditional Collar Total Volumes (MBbl)
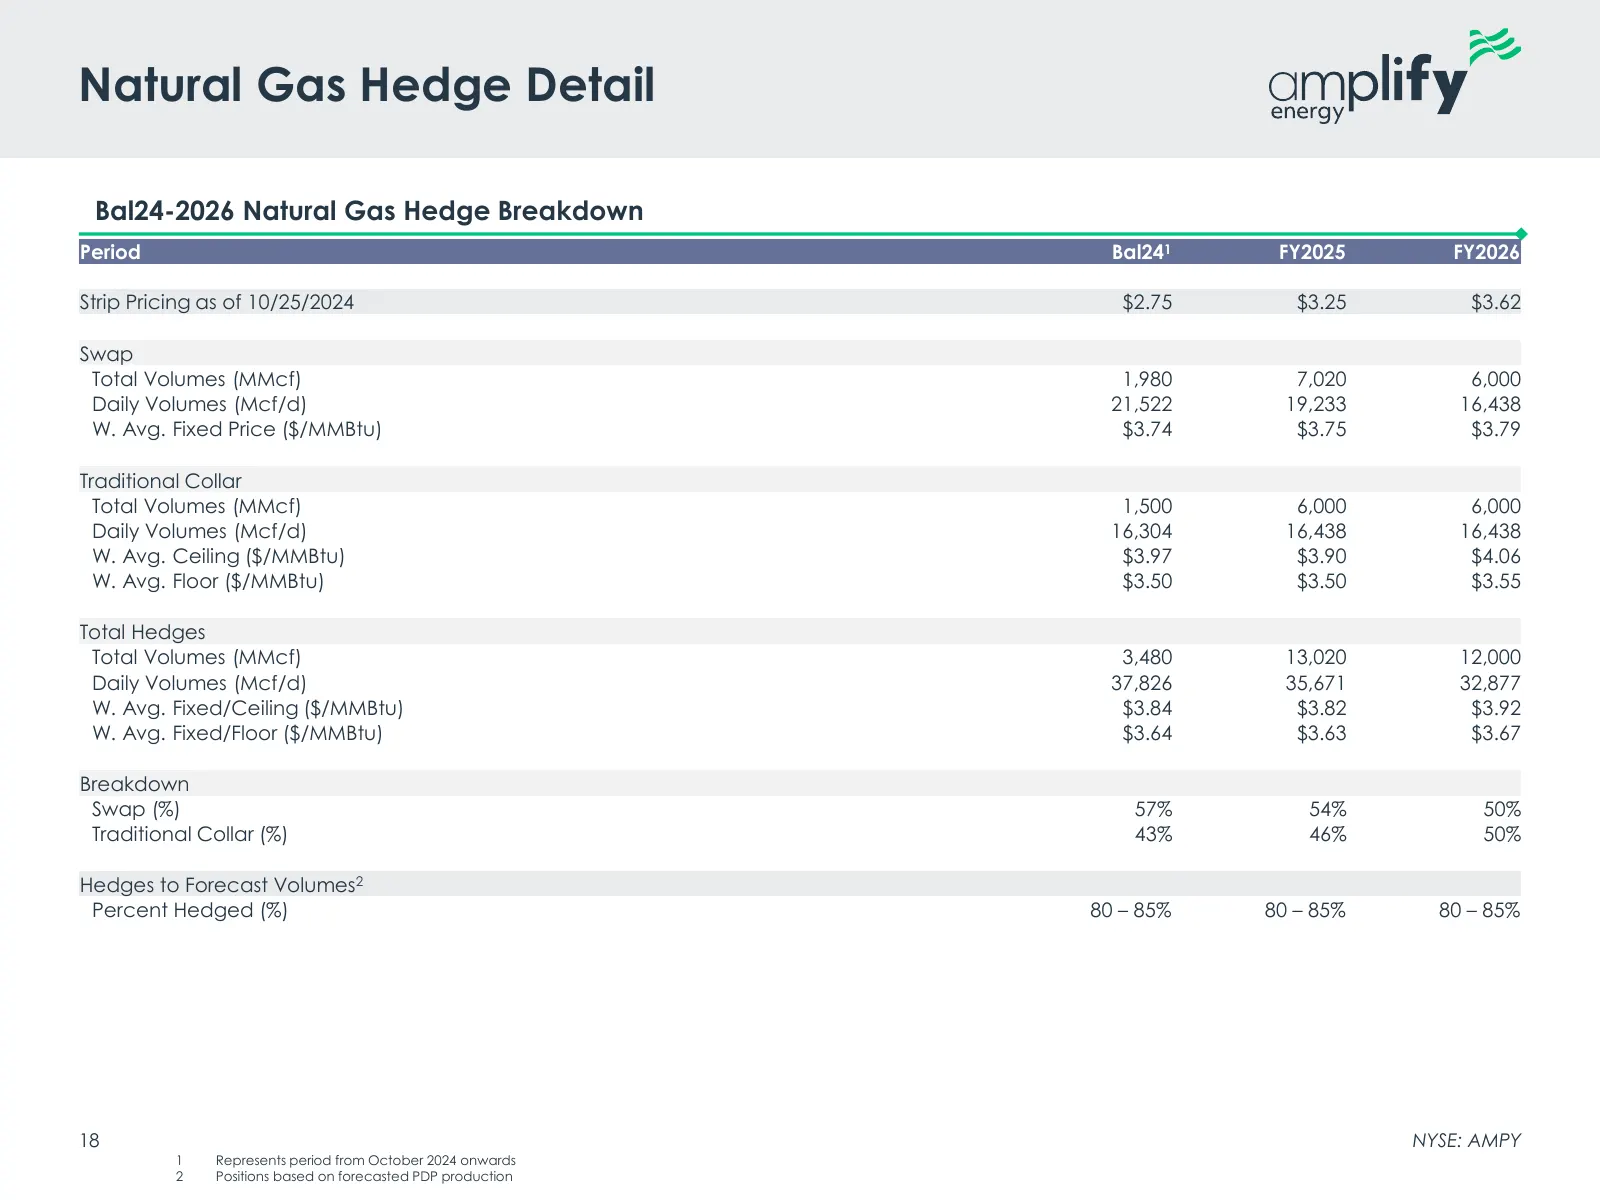
Slide 18: Natural Gas Hedge Detail
Natural Gas Hedge Detail Bal24-2026 Natural Gas Hedge Breakdown Period Bal241 FY2025 FY2026 Strip Pricing as of 10/25/2024 $2.75 $3.25 $3.62 Swap Total Volumes (MMcf) 1,980 7,020 6,000 Daily Volumes (Mcf/d) 21,522 19,233 16,438 W. Avg. Fixed Price ($/MMBtu) $3.74 $3.75 $3.79 Traditional Collar Total
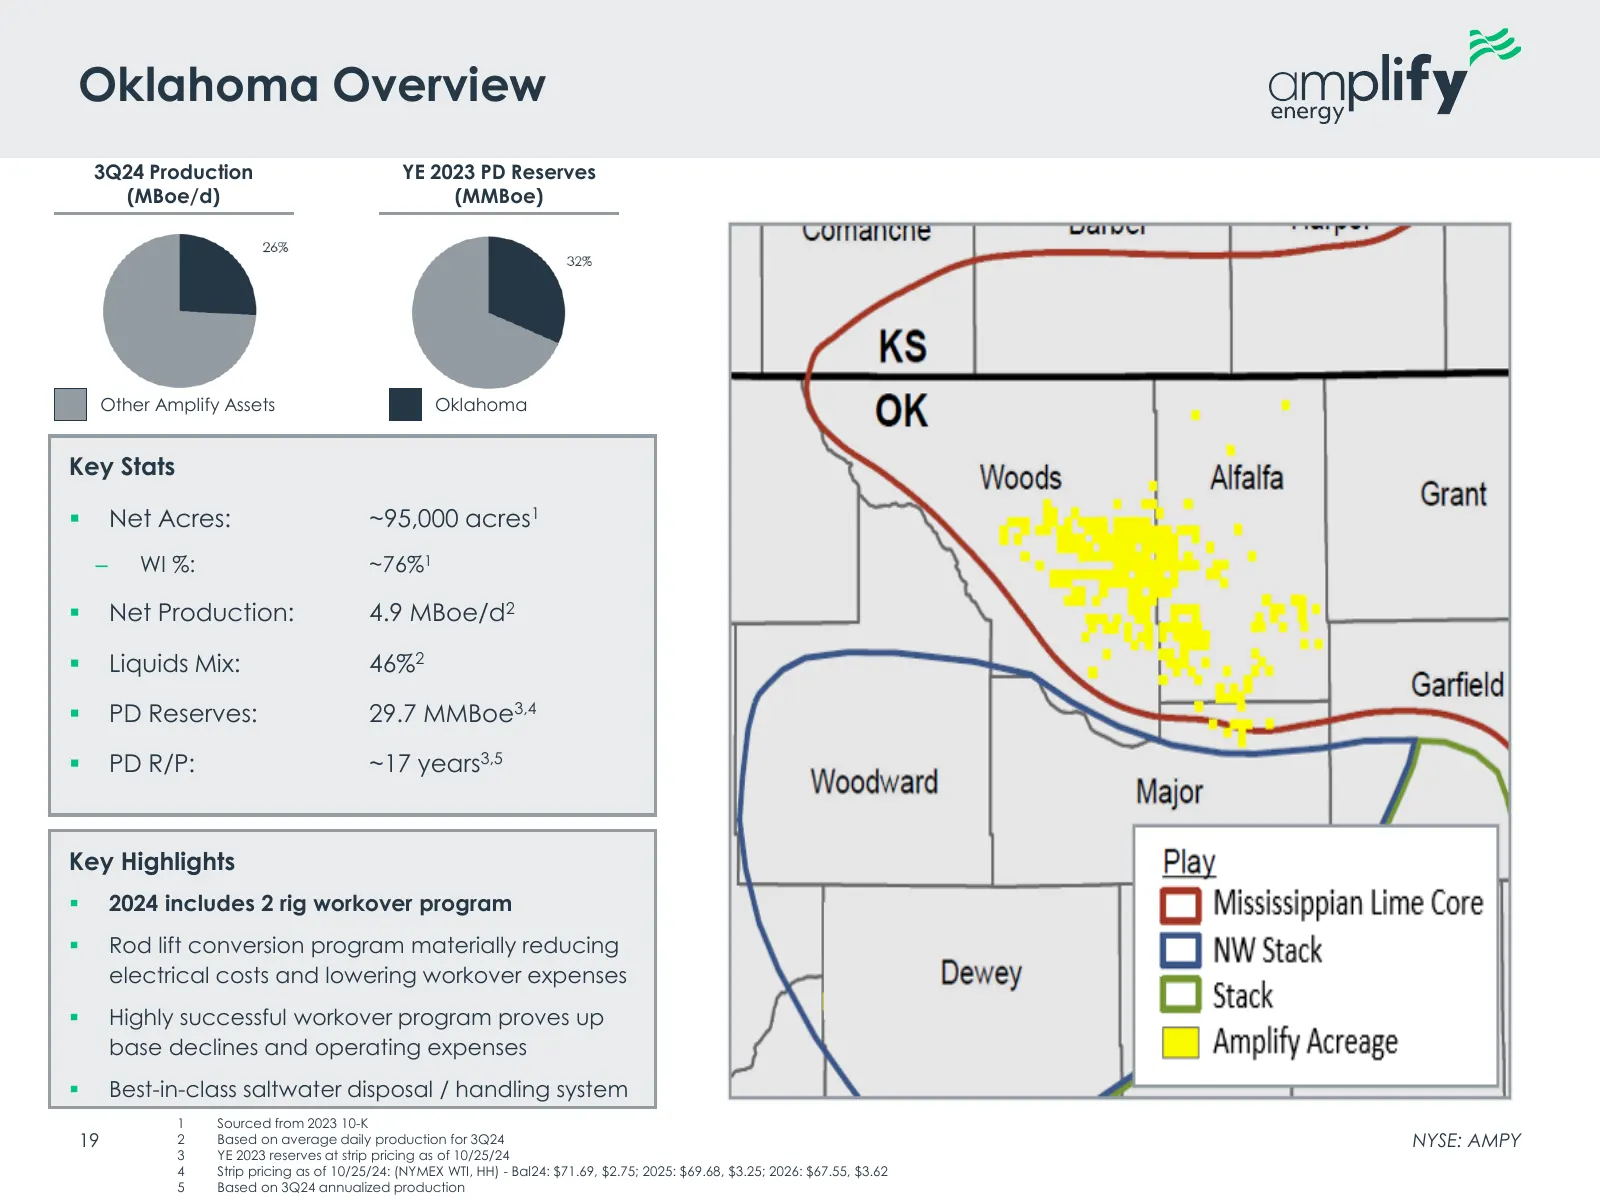
Slide 19: Oklahoma Overview
Oklahoma Overview 3Q24 Production YE 2023 PD Reserves (MBoe/d) (MMBoe) Other Amplify Assets Oklahoma Key Stats ▪ Net Acres: ~95,000 acres1 ‒ WI %: ~76%1 ▪ Net Production: 4.9 MBoe/d2 ▪ Liquids Mix: 46%2 ▪ PD Reserves: 29.7 MMBoe3,4 ▪ PD R/P: ~17 years3,5 Key Highlights ▪ 2024 includes 2 rig workover
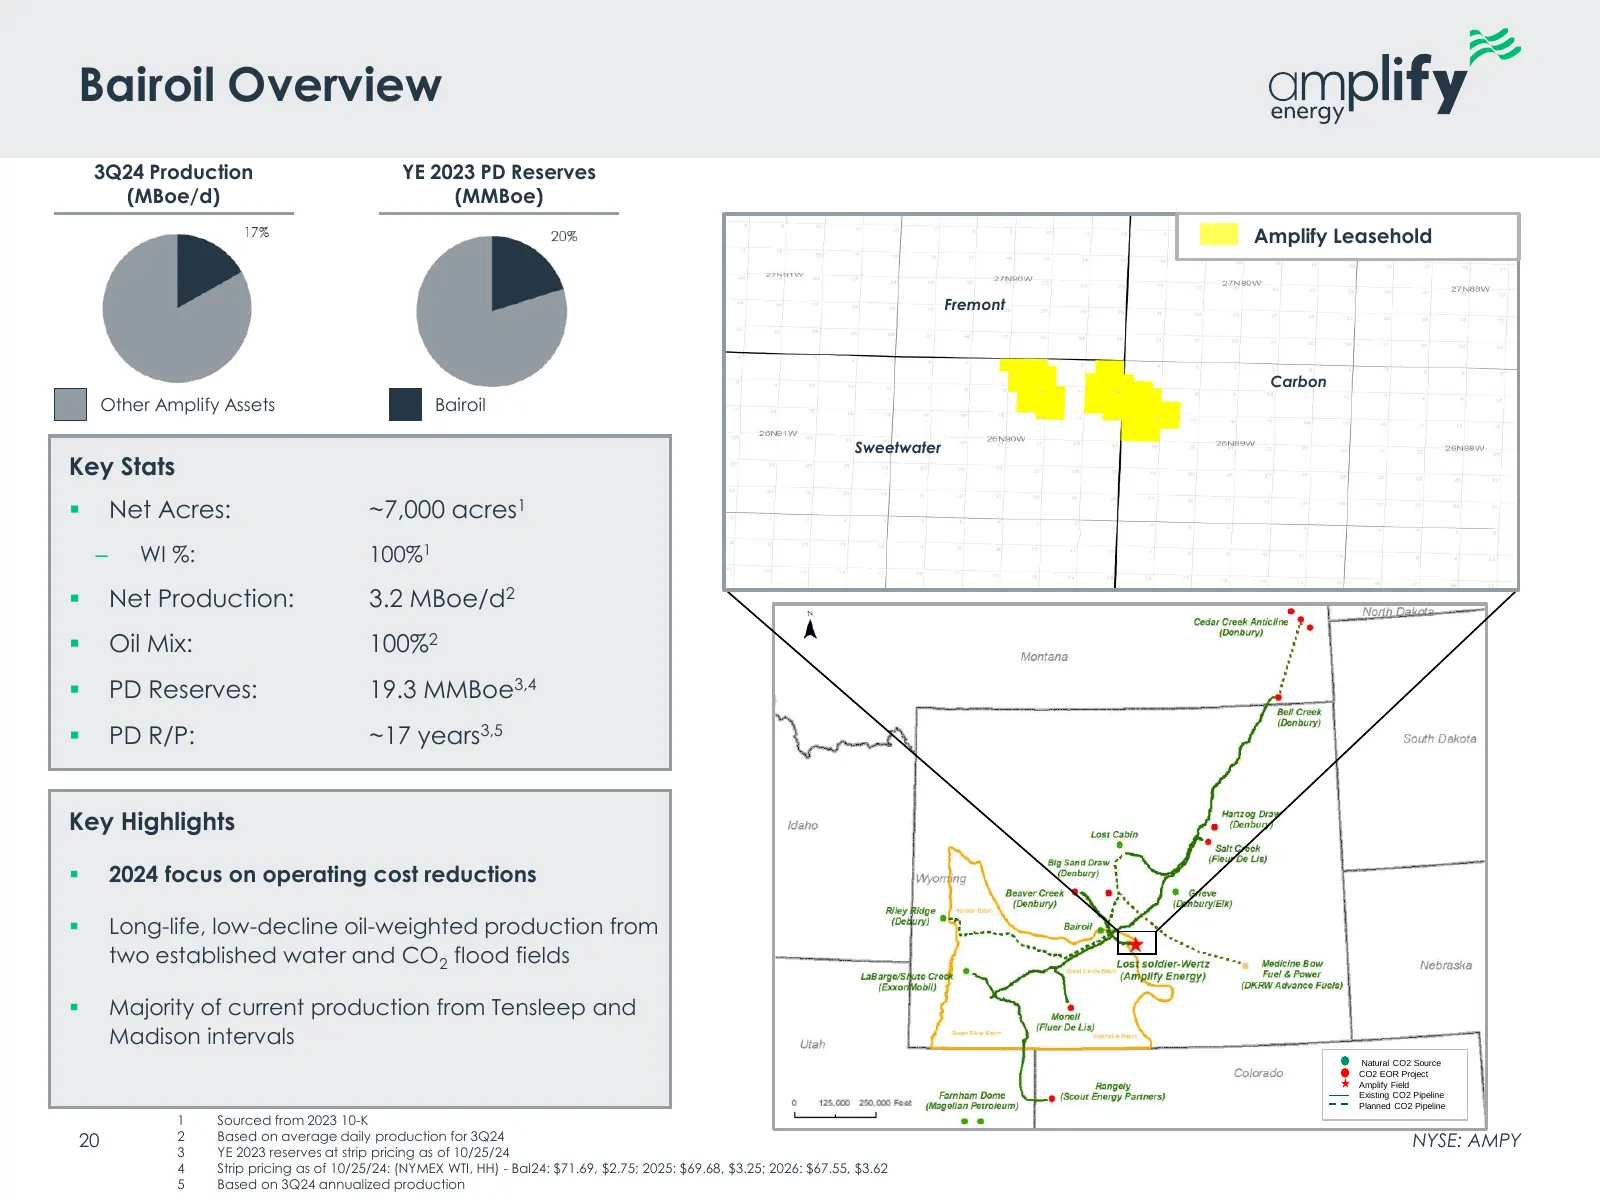
Slide 20: Bairoil Overview
Bairoil Overview 3Q24 Production YE 2023 PD Reserves (MBoe/d) (MMBoe) Amplify Leasehold Fremont Carbon Other Amplify Assets Bairoil Sweetwater Key Stats ▪ Net Acres: ~7,000 acres1 ‒ WI %: 100%1 ▪ Net Production: 3.2 MBoe/d2 ▪ Oil Mix: 100%2 ▪ PD Reserves: 19.3 MMBoe3,4 ▪ PD R/P: ~17 years3,5 Key Hig
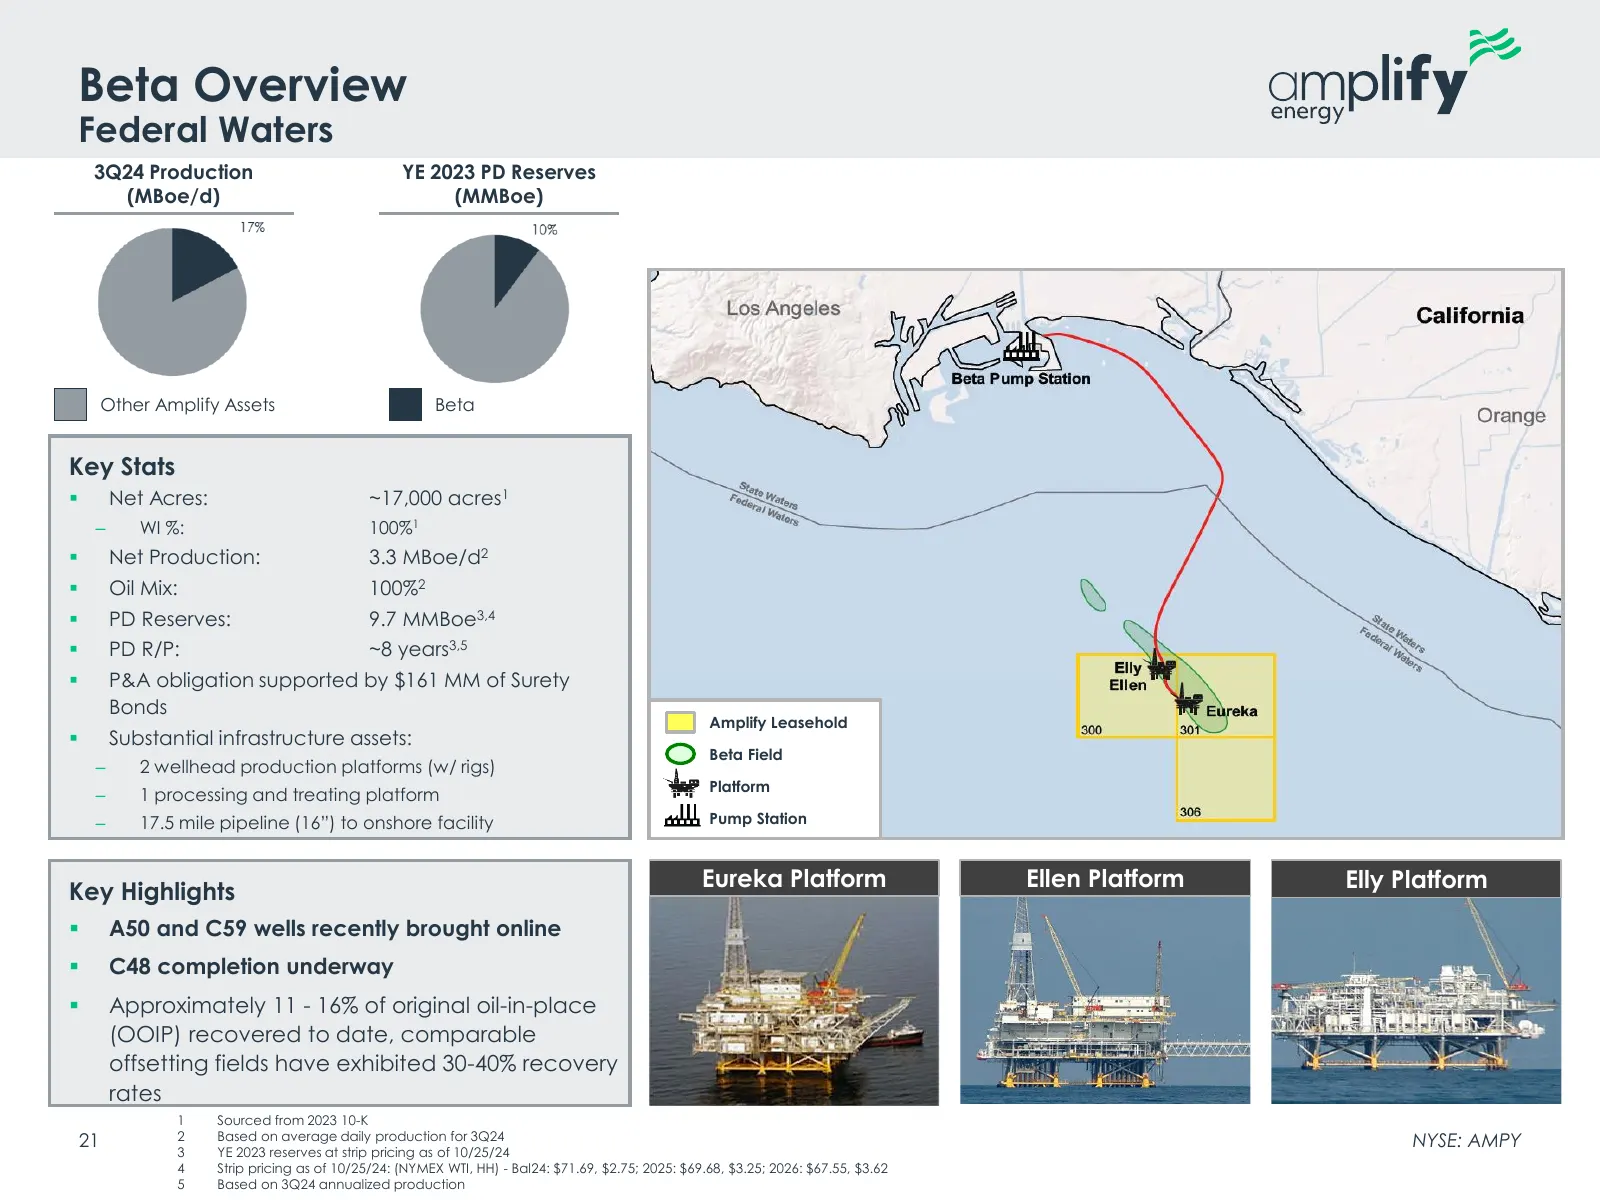
Slide 21: Beta Overview
Beta Overview Federal Waters 3Q24 Production YE 2023 PD Reserves (MBoe/d) (MMBoe) Other Amplify Assets Beta Key Stats ▪ Net Acres: ~17,000 acres1 ‒ WI %: 100%1 ▪ Net Production: 3.3 MBoe/d2 ▪ Oil Mix: 100%2 ▪ PD Reserves: 9.7 MMBoe3,4 ▪ PD R/P: ~8 years3,5 ▪ P&A obligation supported by $161 MM of Su
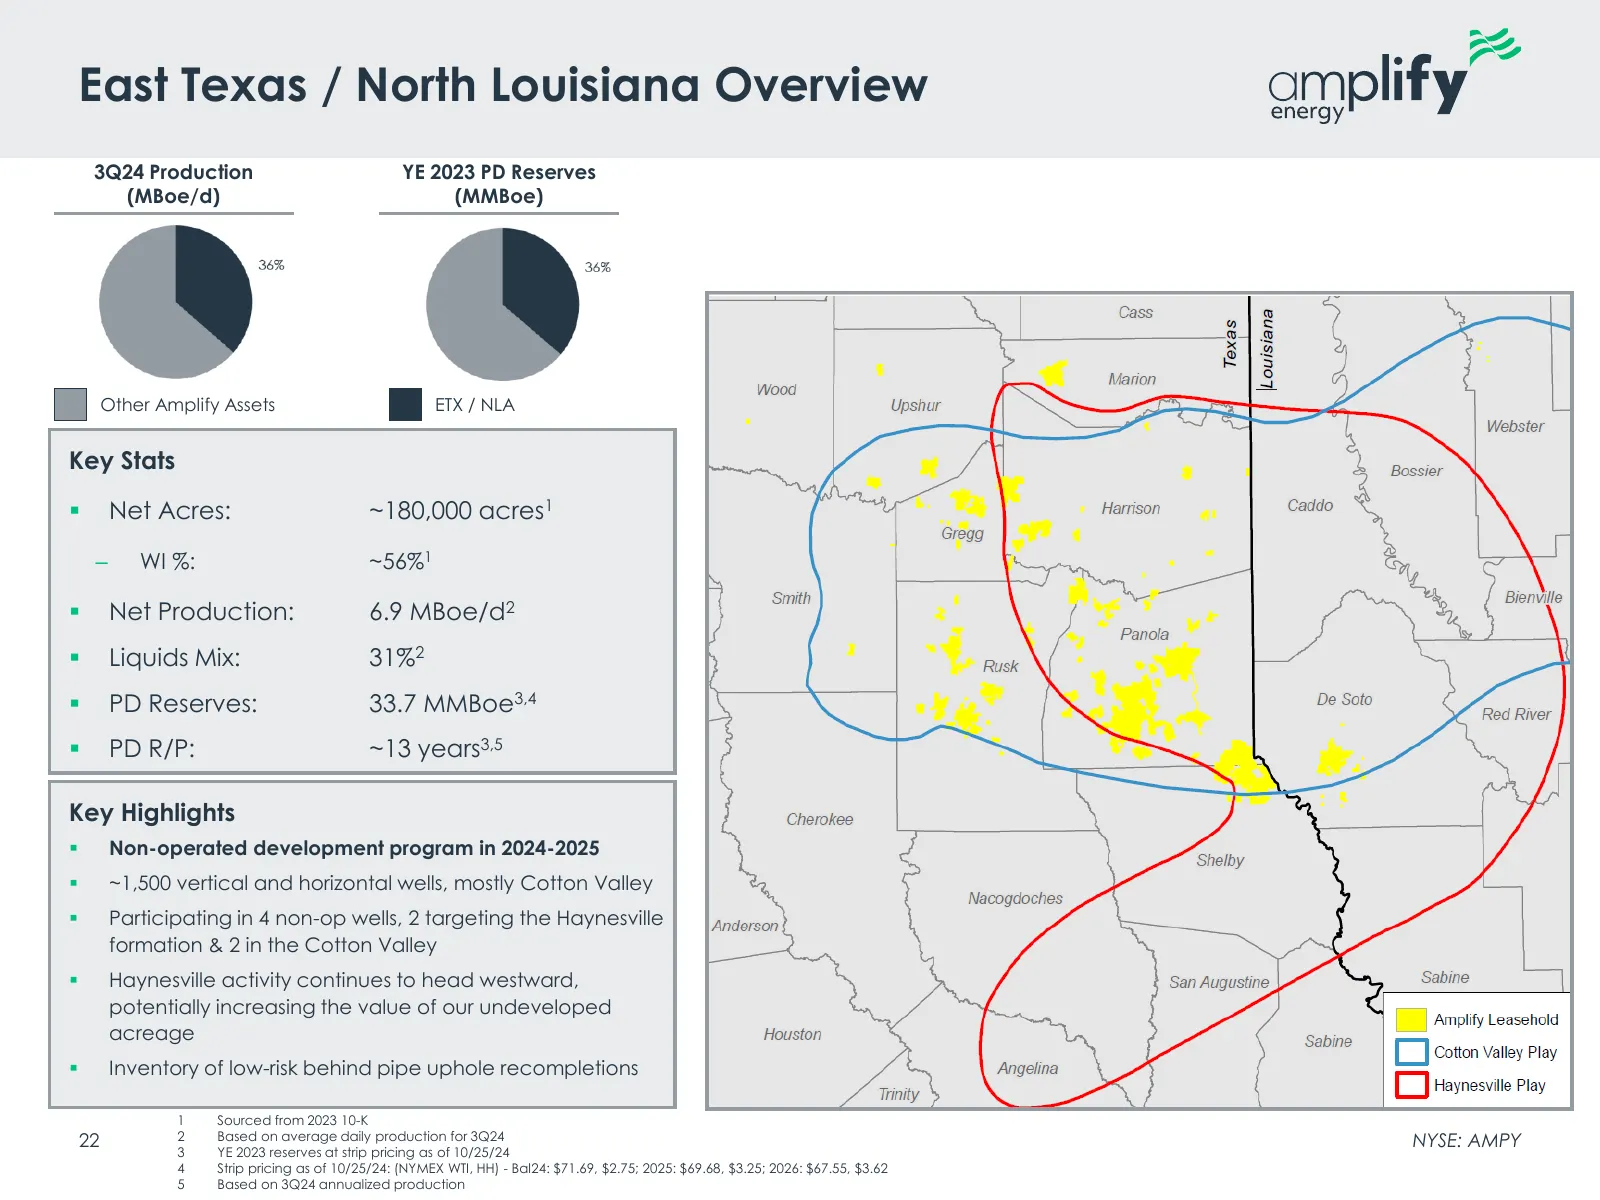
Slide 22: East Texas / North Louisiana Overview
East Texas / North Louisiana Overview 3Q24 Production YE 2023 PD Reserves (MBoe/d) (MMBoe) Other Amplify Assets ETX / NLA Key Stats ▪ Net Acres: ~180,000 acres1 ‒ WI %: ~56%1 ▪ Net Production: 6.9 MBoe/d2 ▪ Liquids Mix: 31%2 ▪ PD Reserves: 33.7 MMBoe3,4 ▪ PD R/P: ~13 years3,5 Key Highlights ▪ Non-op
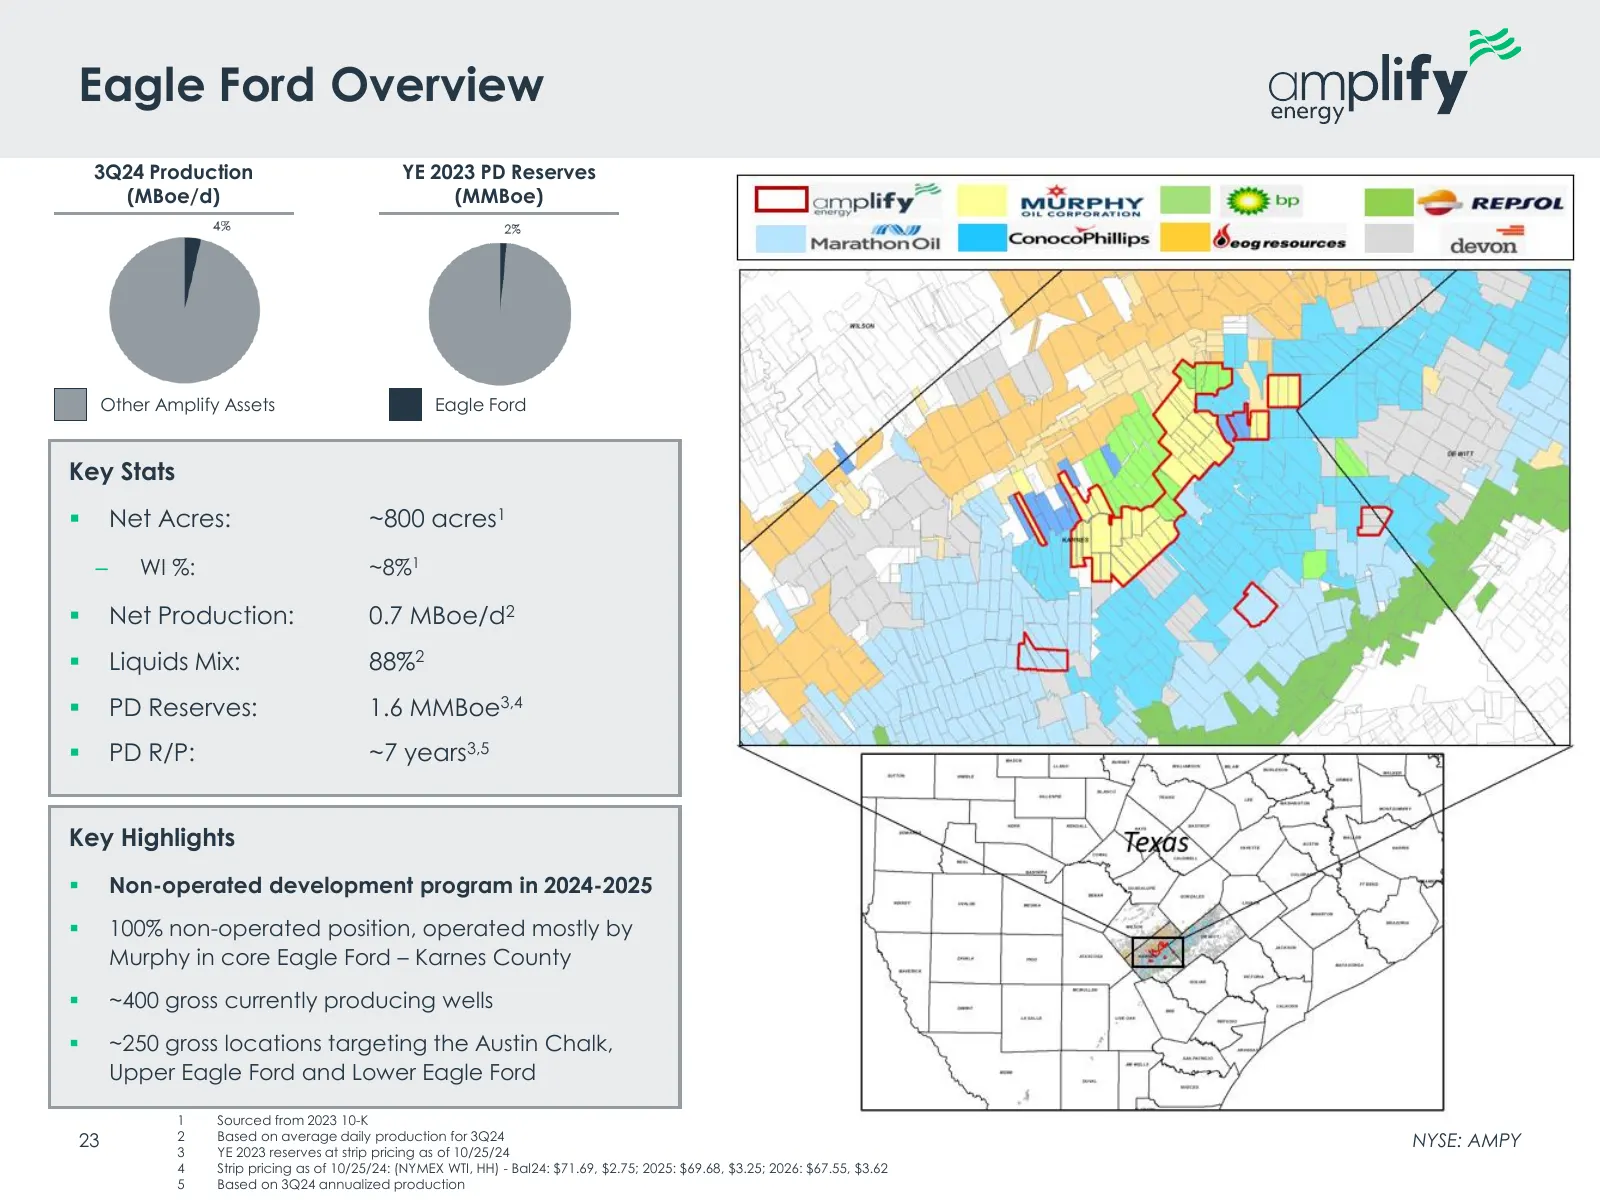
Slide 23: Eagle Ford Overview
Eagle Ford Overview 3Q24 Production YE 2023 PD Reserves (MBoe/d) (MMBoe) Other Amplify Assets Eagle Ford Key Stats ▪ Net Acres: ~800 acres1 ‒ WI %: ~8%1 ▪ Net Production: 0.7 MBoe/d2 ▪ Liquids Mix: 88%2 ▪ PD Reserves: 1.6 MMBoe3,4 ▪ PD R/P: ~7 years3,5 Key Highlights ▪ Non-operated development progr
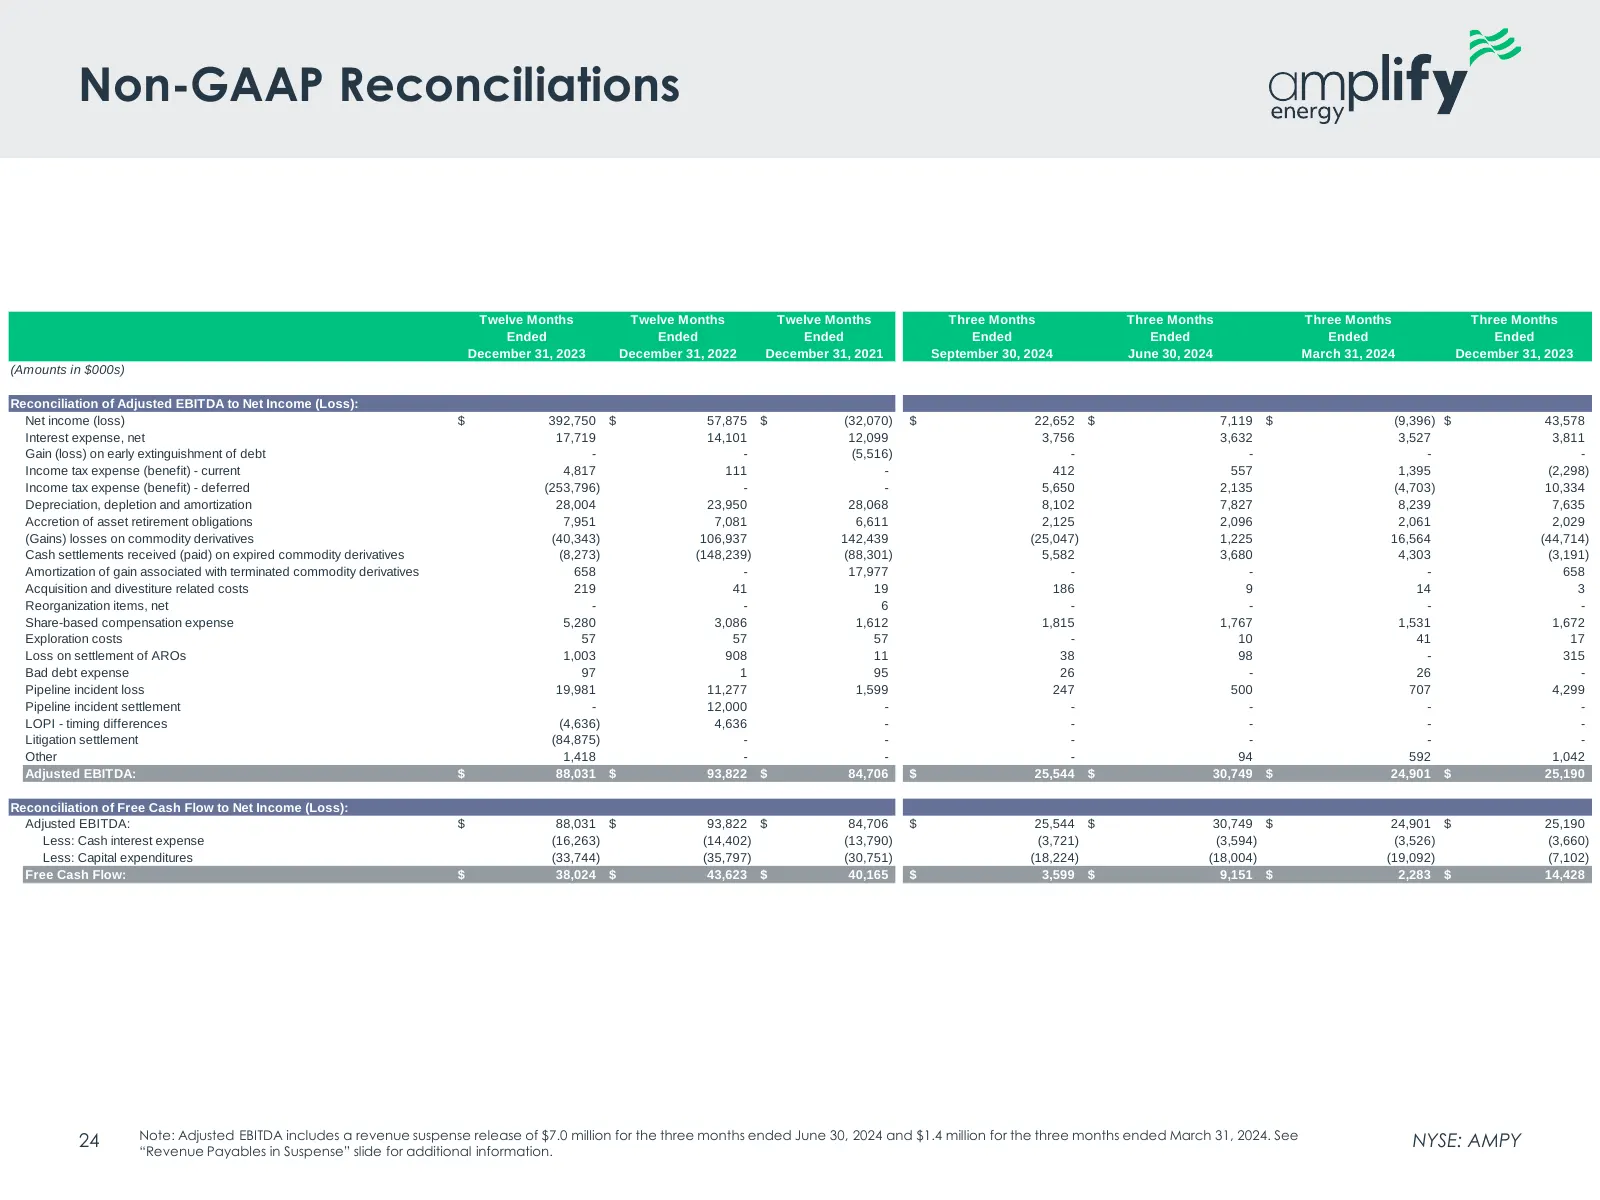
Slide 24: Non-GAAP Reconciliations
Non-GAAP Reconciliations Twelve Months Twelve Months Twelve Months Three Months Three Months Three Months Three Months Ended Ended Ended Ended Ended Ended Ended December 31, 2023 December 31, 2022 December 31, 2021 September 30, 2024 June 30, 2024 March 31, 2024 December 31, 2023 (Amounts in $000s)
Slide 25: Non-GAAP Reconciliations (Cont'd)
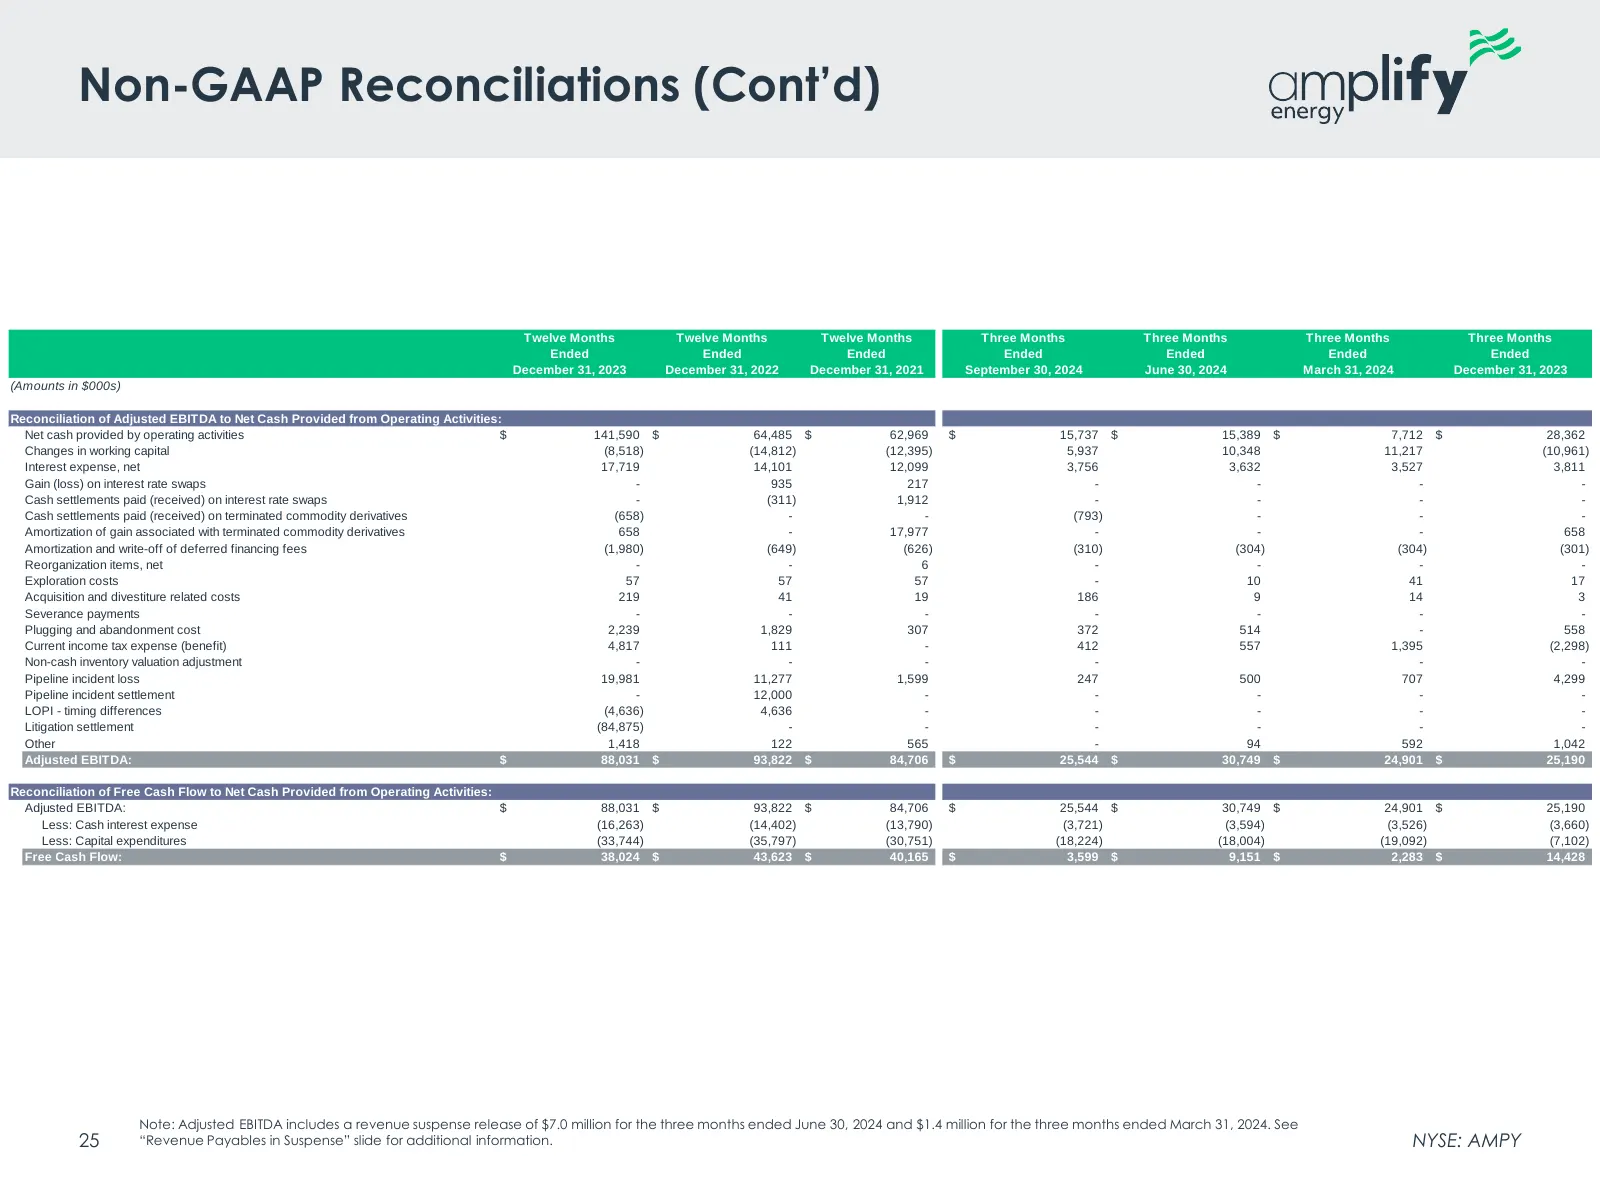
Non-GAAP Reconciliations (Cont’d) Twelve Months Twelve Months Twelve Months Three Months Three Months Three Months Three Months Ended Ended Ended Ended Ended Ended Ended December 31, 2023 December 31, 2022 December 31, 2021 September 30, 2024 June 30, 2024 March 31, 2024 December 31, 2023 (Amounts i
Slide 26: Non-GAAP Reconciliations (Cont'd)
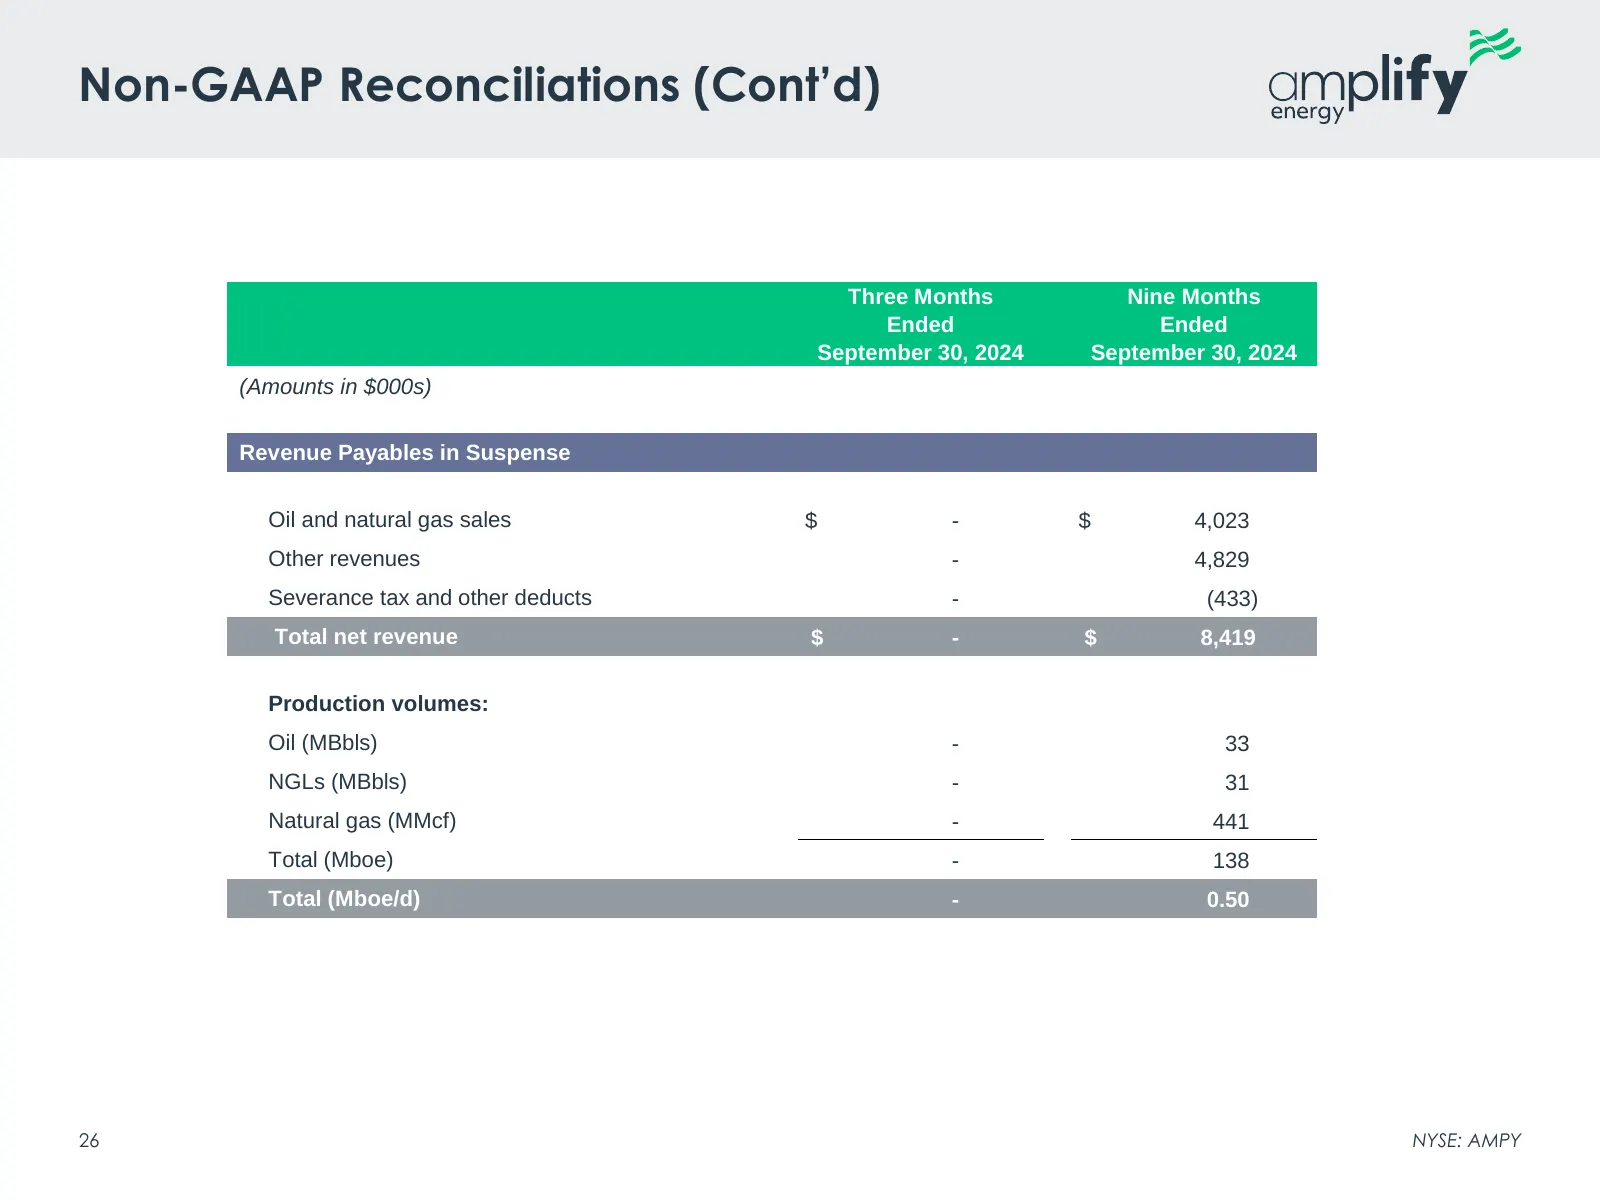
Non-GAAP Reconciliations (Cont’d) Three Months Nine Months Ended Ended September 30, 2024 September 30, 2024 (Amounts in $000s) Revenue Payables in Suspense Oil and natural gas sales $ - $ 4,023 Other revenues - 4,829 Severance tax and other deducts - (433) Total net revenue $ - $ 8,419 Production v
Slide 27: Non-GAAP Reconciliations (Cont'd)
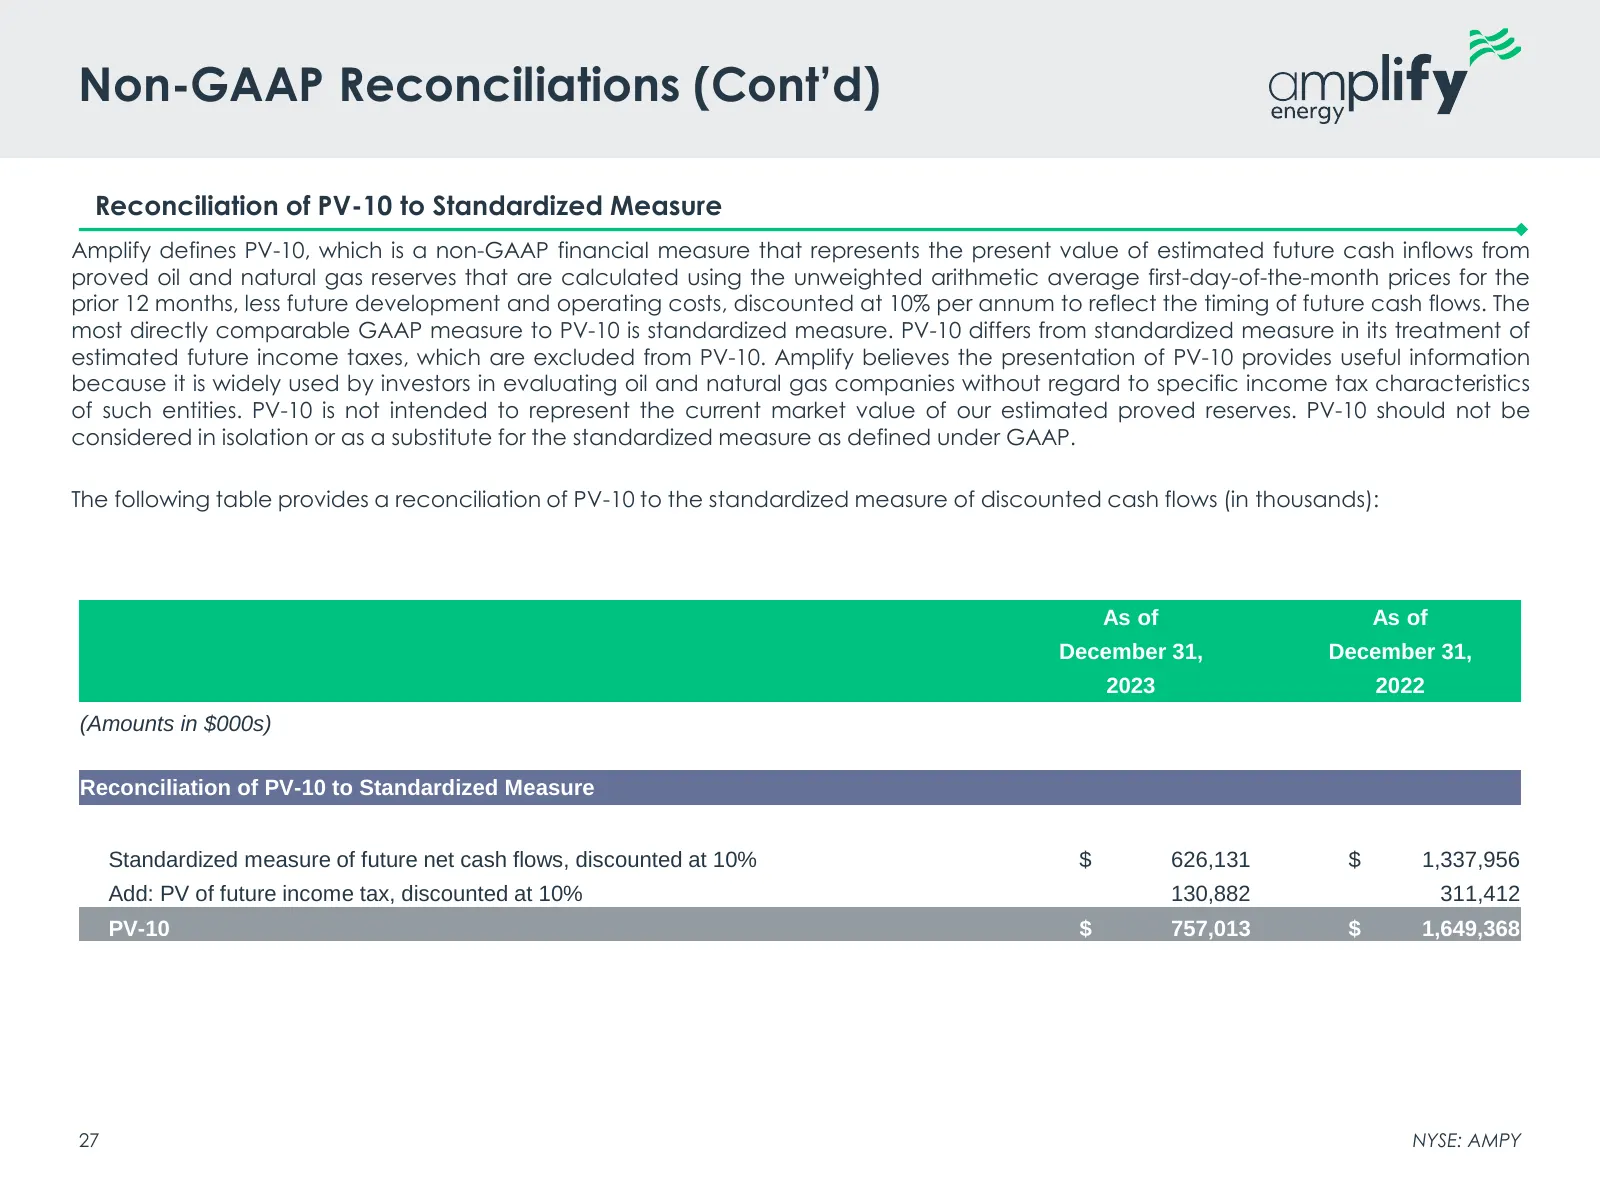
Non-GAAP Reconciliations (Cont’d) Reconciliation of PV-10 to Standardized Measure Amplify defines PV-10, which is a non-GAAP financial measure that represents the present value of estimated future cash inflows from proved oil and natural gas reserves that are calculated using the unweighted arithmet
Slide 28: Non-GAAP Reconciliations (Cont'd)
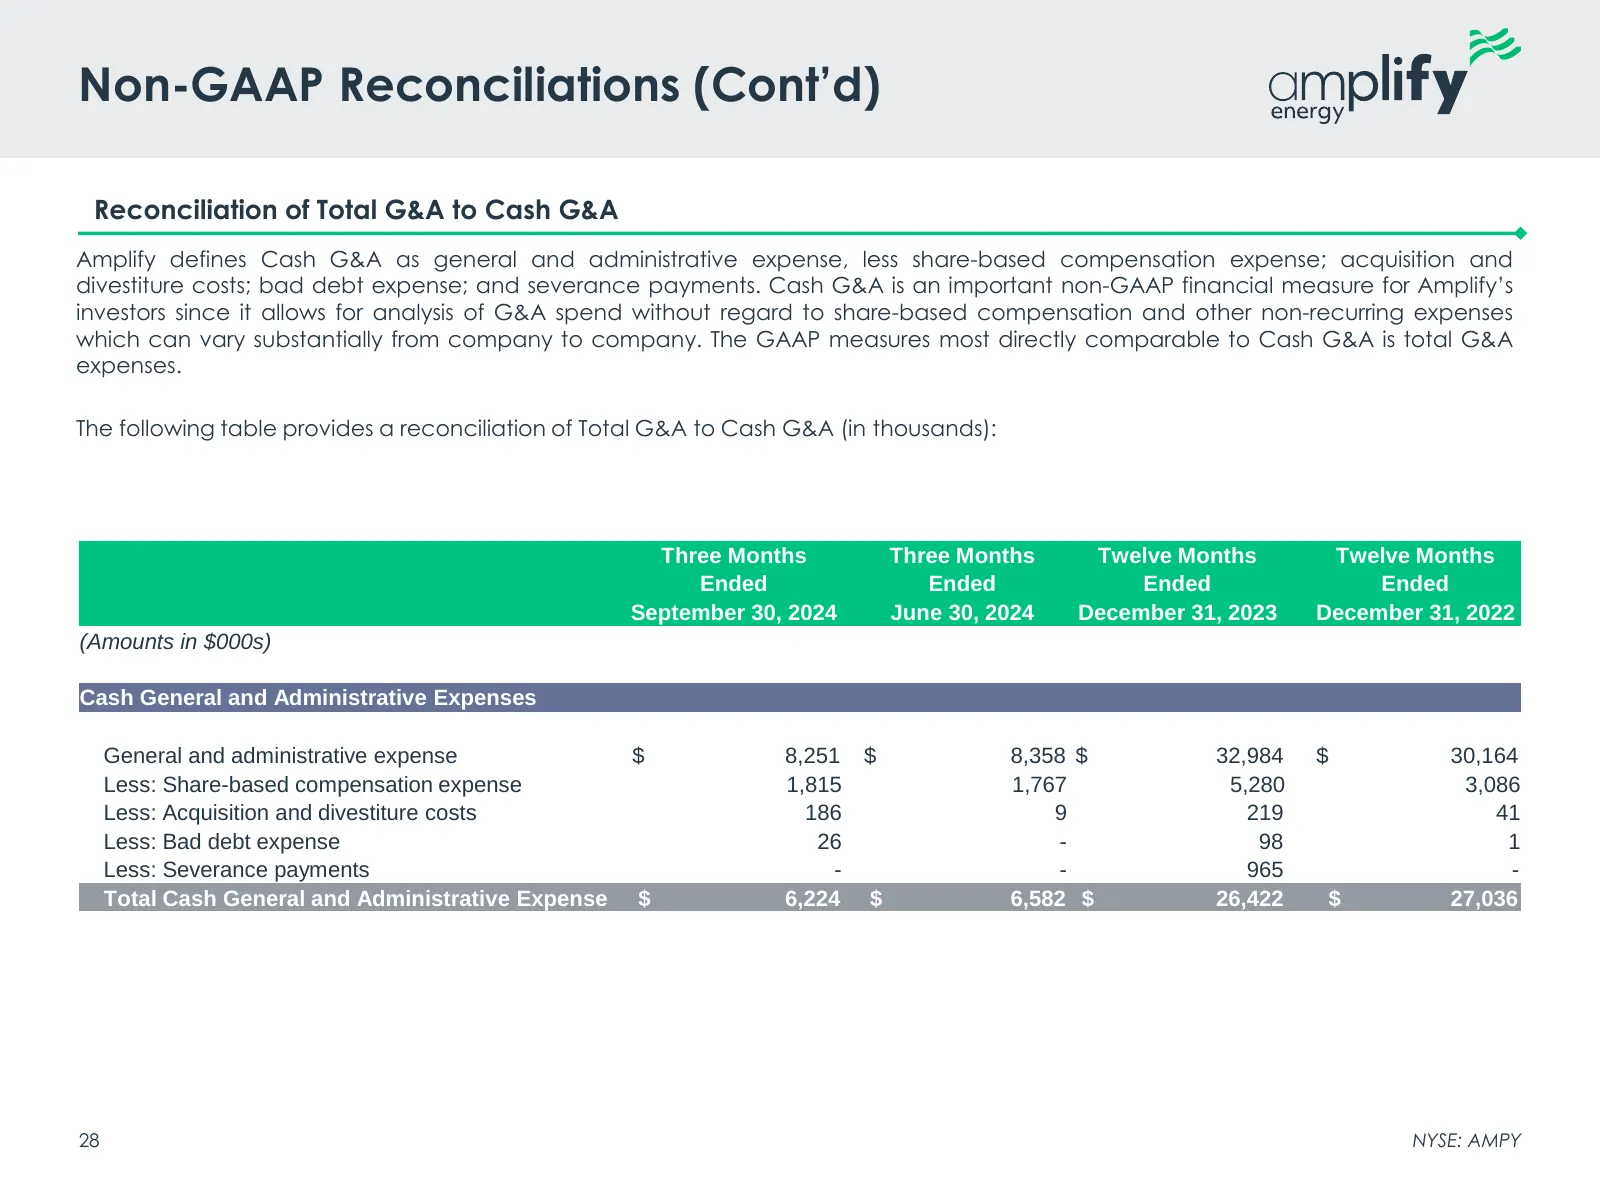
Non-GAAP Reconciliations (Cont’d) Reconciliation of Total G&A to Cash G&A Amplify defines Cash G&A as general and administrative expense, less share-based compensation expense; acquisition and divestiture costs; bad debt expense; and severance payments. Cash G&A is an important non-GAAP financial me
Slide 29: NYSE: AMPY
ampli lify energy \yY ws
Source: Internet Archive copy of s24.q4cdn.com
More decks from Amplify Energy Corp.
 Q3 2026 Earnings Presentation31 slides · Nov 9, 2026
 Q2 2026 Earnings Presentation31 slides · Aug 10, 2026
 Investor Presentation (May 2026)30 slides · May 11, 2026
 Investor Presentation (March 2026)28 slides · Mar 9, 2026
 Investor Presentation (August 2025)28 slides · Aug 6, 2025
 Q1 2025 Earnings Presentation33 slides · May 13, 2025