Amplify Energy Corp. · NYSE:AMPY
Amplify Energy — Q3 2026 Earnings Presentation
31 slides from Amplify Energy's earnings presentation, Nov 9, 2026

Slide 1: Investor Presentation
NYSE: AMPY www.amplifyenergy.com Investor Presentation November 9, 2026
Slide 2: Forward Looking Statements
Forward Looking Statements This presentation includes “forward-looking statements” within the meaning of Section 27A of the Securities Act of 1933, as amended, and Section 21E of the Securities Exchange Act of 1934, as amended. All statements, other than statements of historical fact, included in th
Slide 3: Non-GAAP Disclosure / Oil and Gas Reserves
Non-GAAP Disclosure / Oil and Gas Reserves Use of Non-GAAP Financial Measures. Amplify uses the non-GAAP financial measures of Adjusted EBITDA, free cash flow, PV-10/20 and cash G&A. The accompanying schedules include the non-GAAP financial measures of Adjusted EBITDA, free cash flow, PV-10/20 and c
Slide 4: Executing on Amplify's Strategy
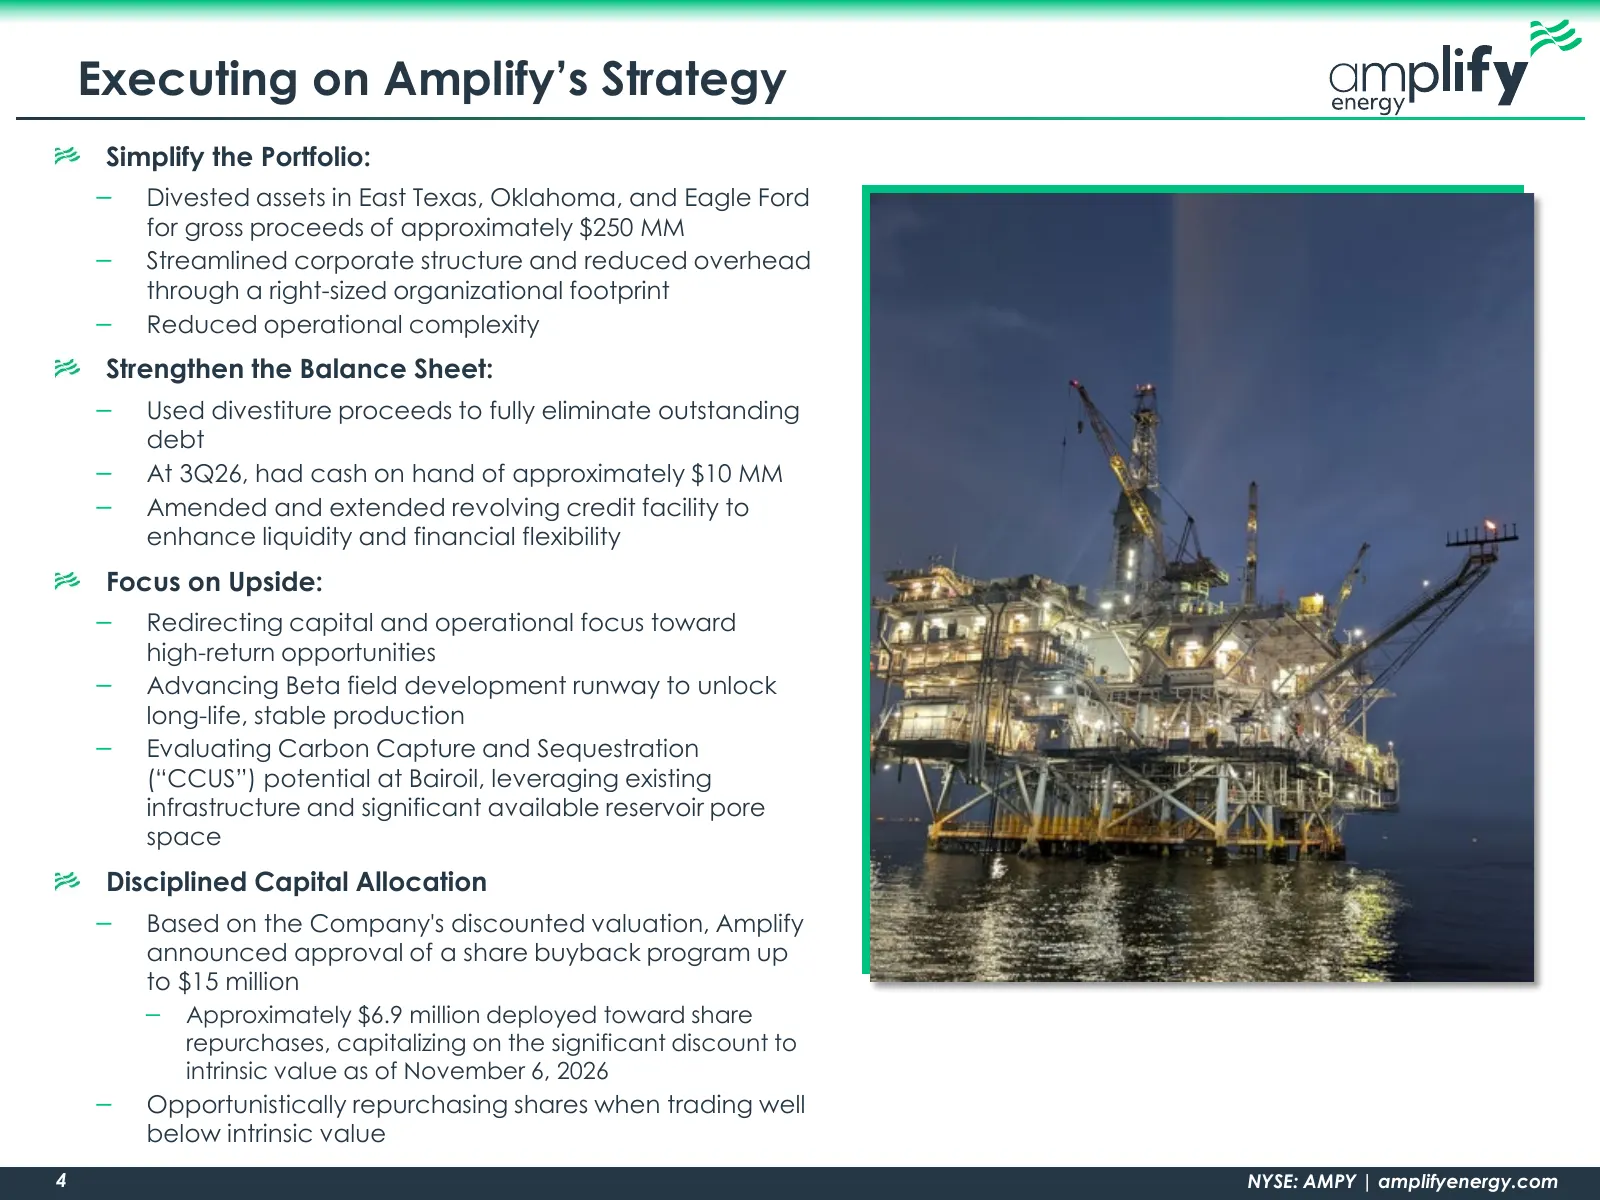
Executing on Amplify’s Strategy Simplify the Portfolio: – Divested assets in East Texas, Oklahoma, and Eagle Ford for gross proceeds of approximately $250 MM – Streamlined corporate structure and reduced overhead through a right-sized organizational footprint – Reduced operational complexity Strengt
Slide 5: Portfolio Overview
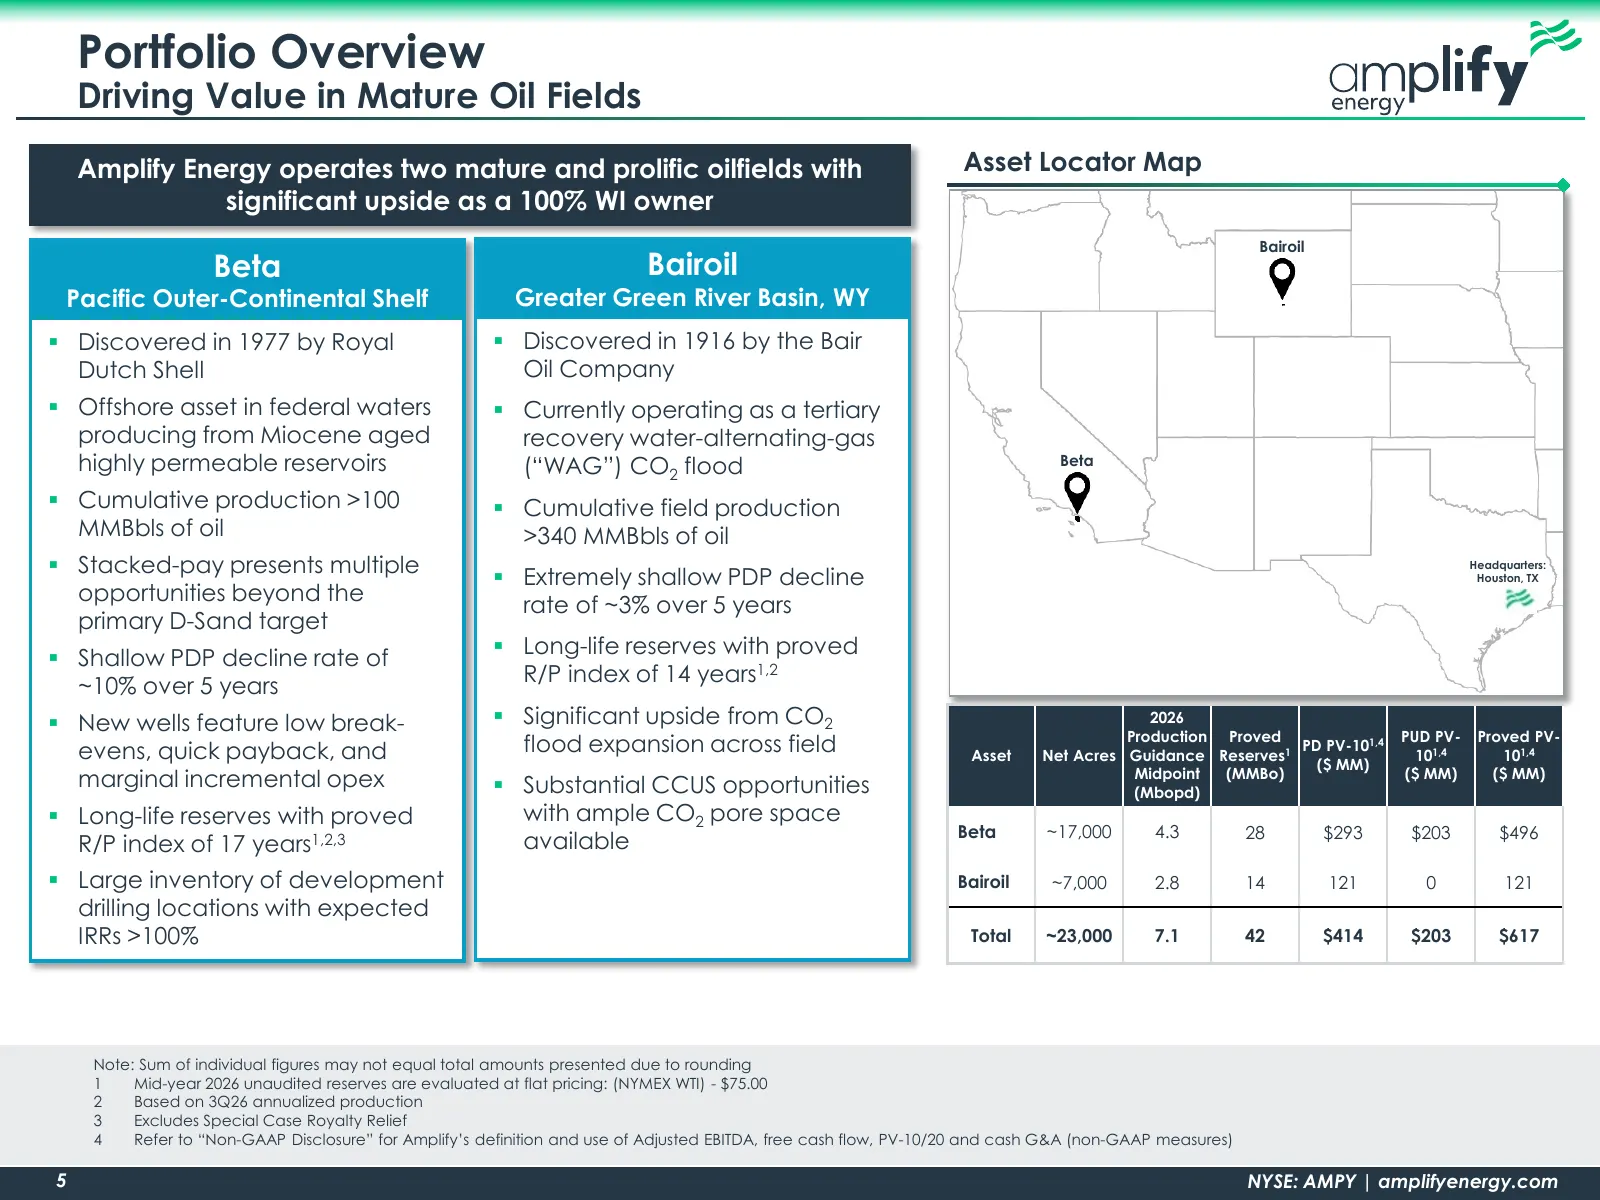
Portfolio Overview Driving Value in Mature Oil Fields Amplify Energy operates two mature and prolific oilfields with Asset Locator Map significant upside as a 100% WI owner Bairoil Beta Bairoil Pacific Outer-Continental Shelf Greater Green River Basin, WY Discovered in 1977 by Royal Discovered i
Slide 6: Compelling Valuation with Additional Upside
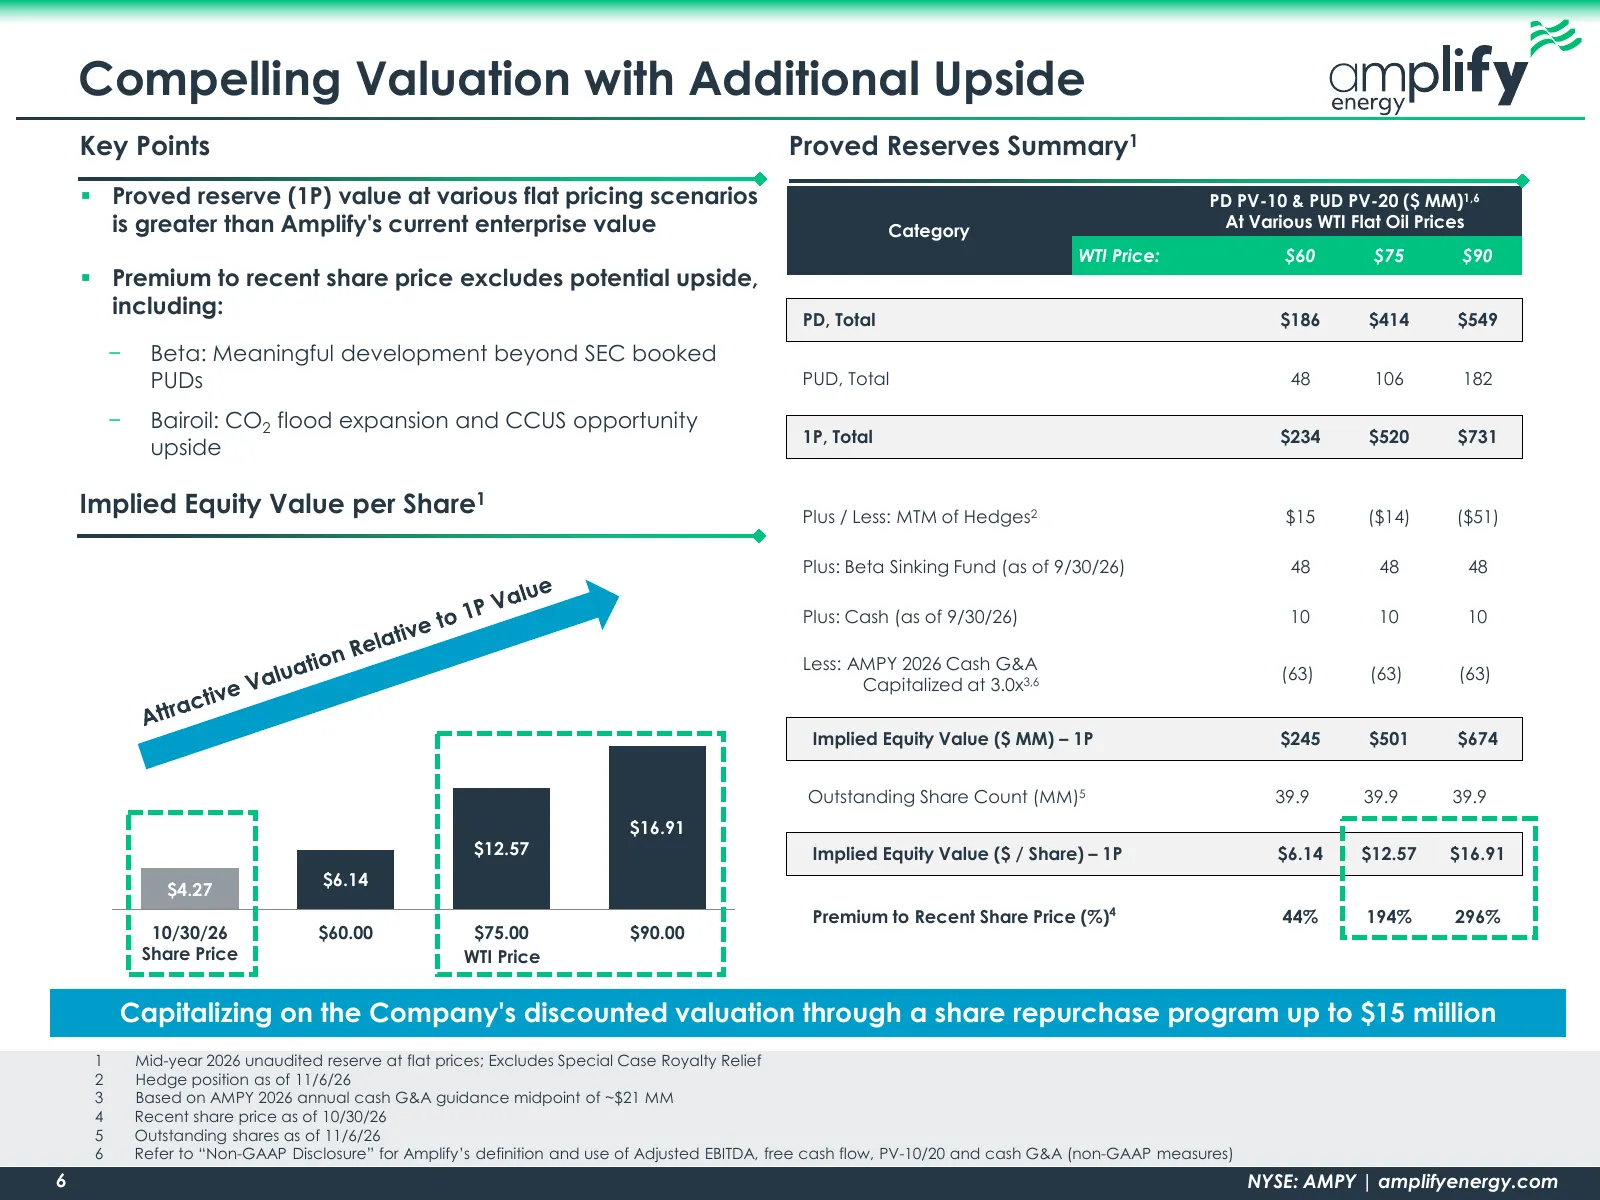
Compelling Valuation with Additional Upside Key Points Proved Reserves Summary1 Proved reserve (1P) value at various flat pricing scenarios PD PV-10 & PUD PV-20 ($ MM)1,6 is greater than Amplify's current enterprise value Category At Various WTI Flat Oil Prices WTI Price: $60 $75 $90 Premium to
Slide 7: Beta Overview
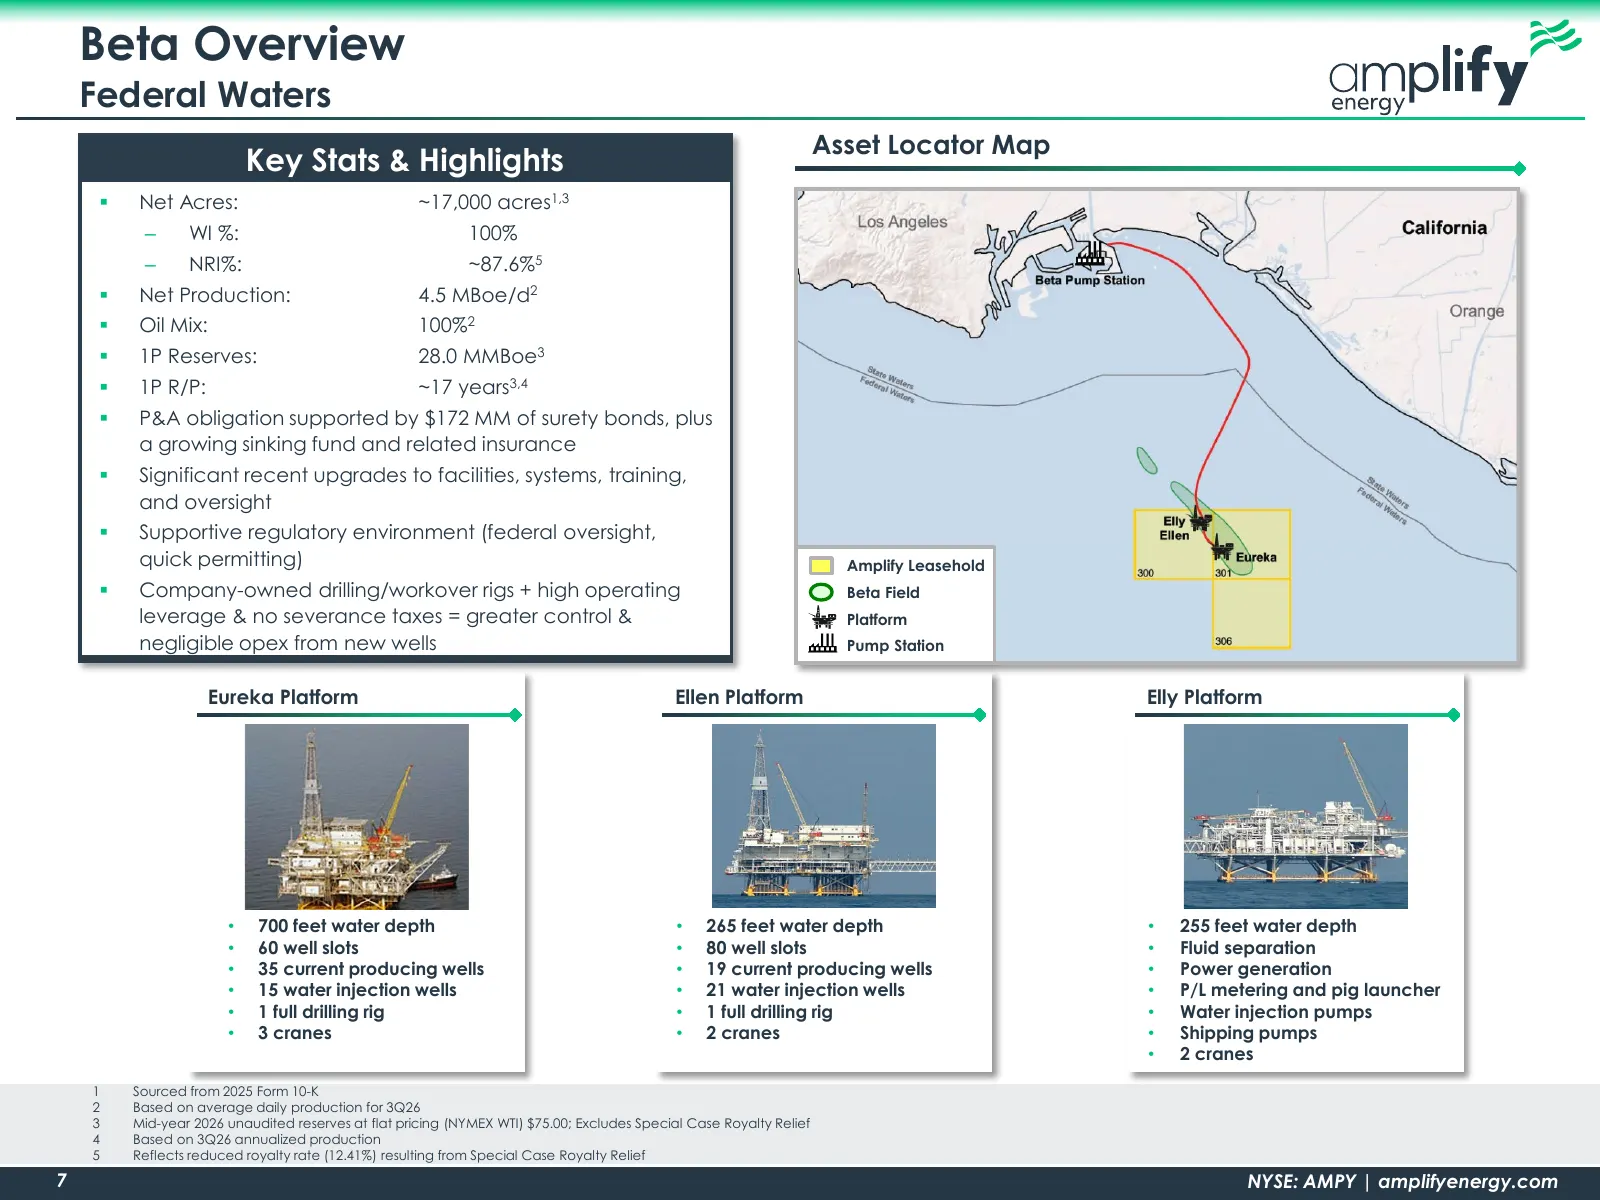
Beta Overview Federal Waters Asset Locator Map Key Stats & Highlights Net Acres: ~17,000 acres1,3 ‒ WI %: 100% ‒ NRI%: ~87.6%5 Net Production: 4.5 MBoe/d2 Oil Mix: 100%2 1P Reserves: 28.0 MMBoe3 1P R/P: ~17 years3,4 P&A obligation supported by $172 MM of surety bonds, plus a growing sink
Slide 8: Beta Geology & Reservoir Overview
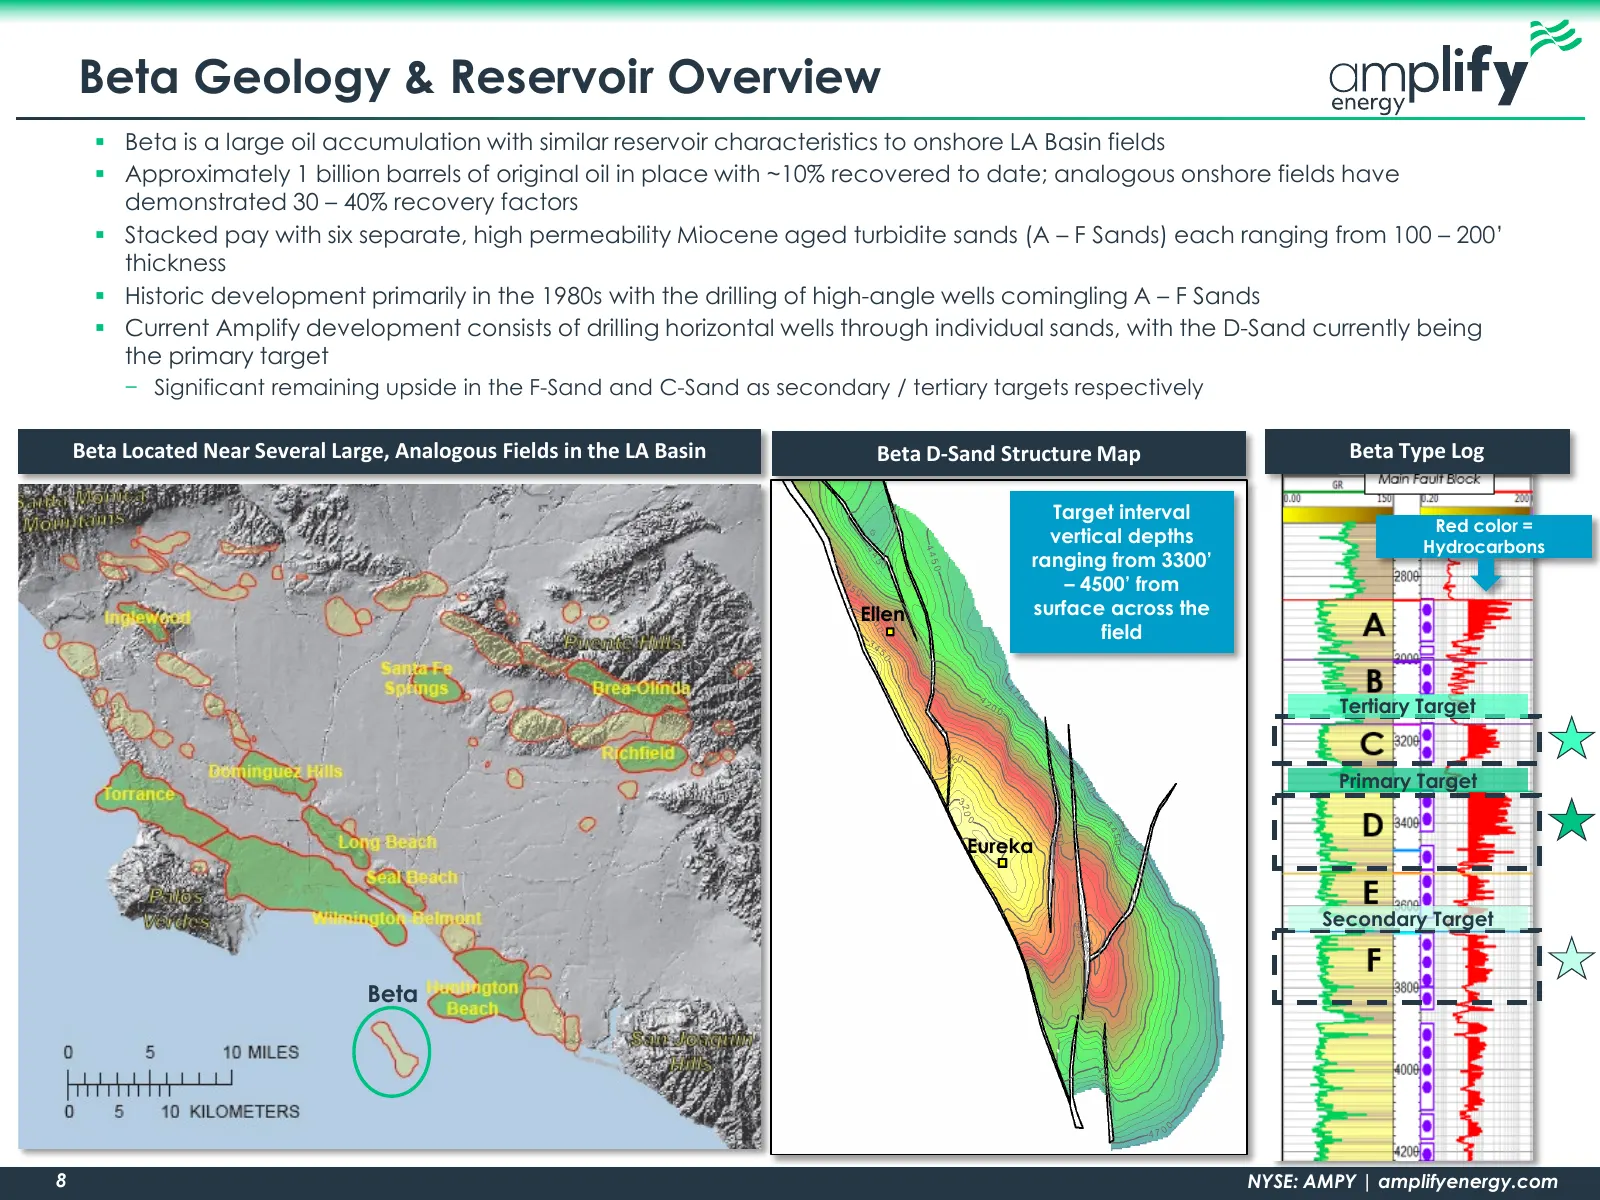
Beta Geology & Reservoir Overview Beta is a large oil accumulation with similar reservoir characteristics to onshore LA Basin fields Approximately 1 billion barrels of original oil in place with ~10% recovered to date; analogous onshore fields have demonstrated 30 – 40% recovery factors Stacke
Slide 9: Development Evolution & Risk Mitigation
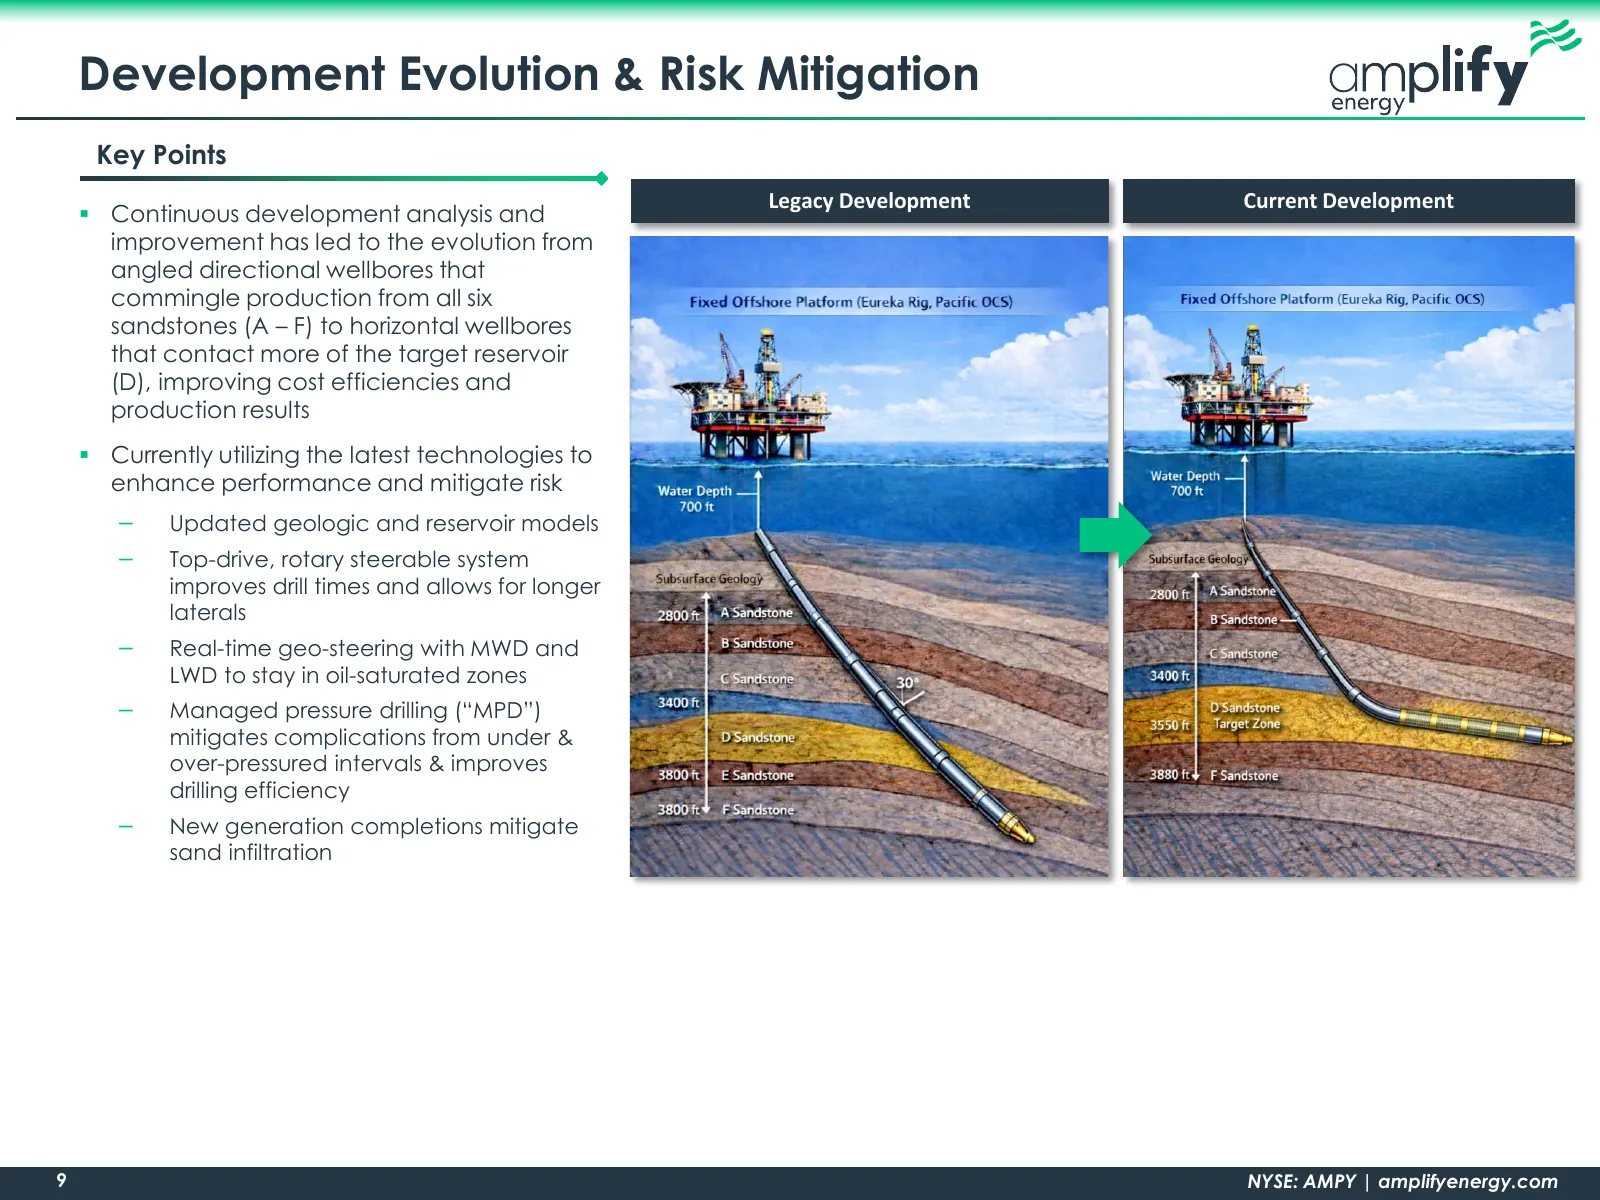
Development Evolution & Risk Mitigation Key Points Legacy Development Current Development Continuous development analysis and improvement has led to the evolution from angled directional wellbores that commingle production from all six sandstones (A – F) to horizontal wellbores that contact more o
Slide 10: Average Net Production (Bopd)
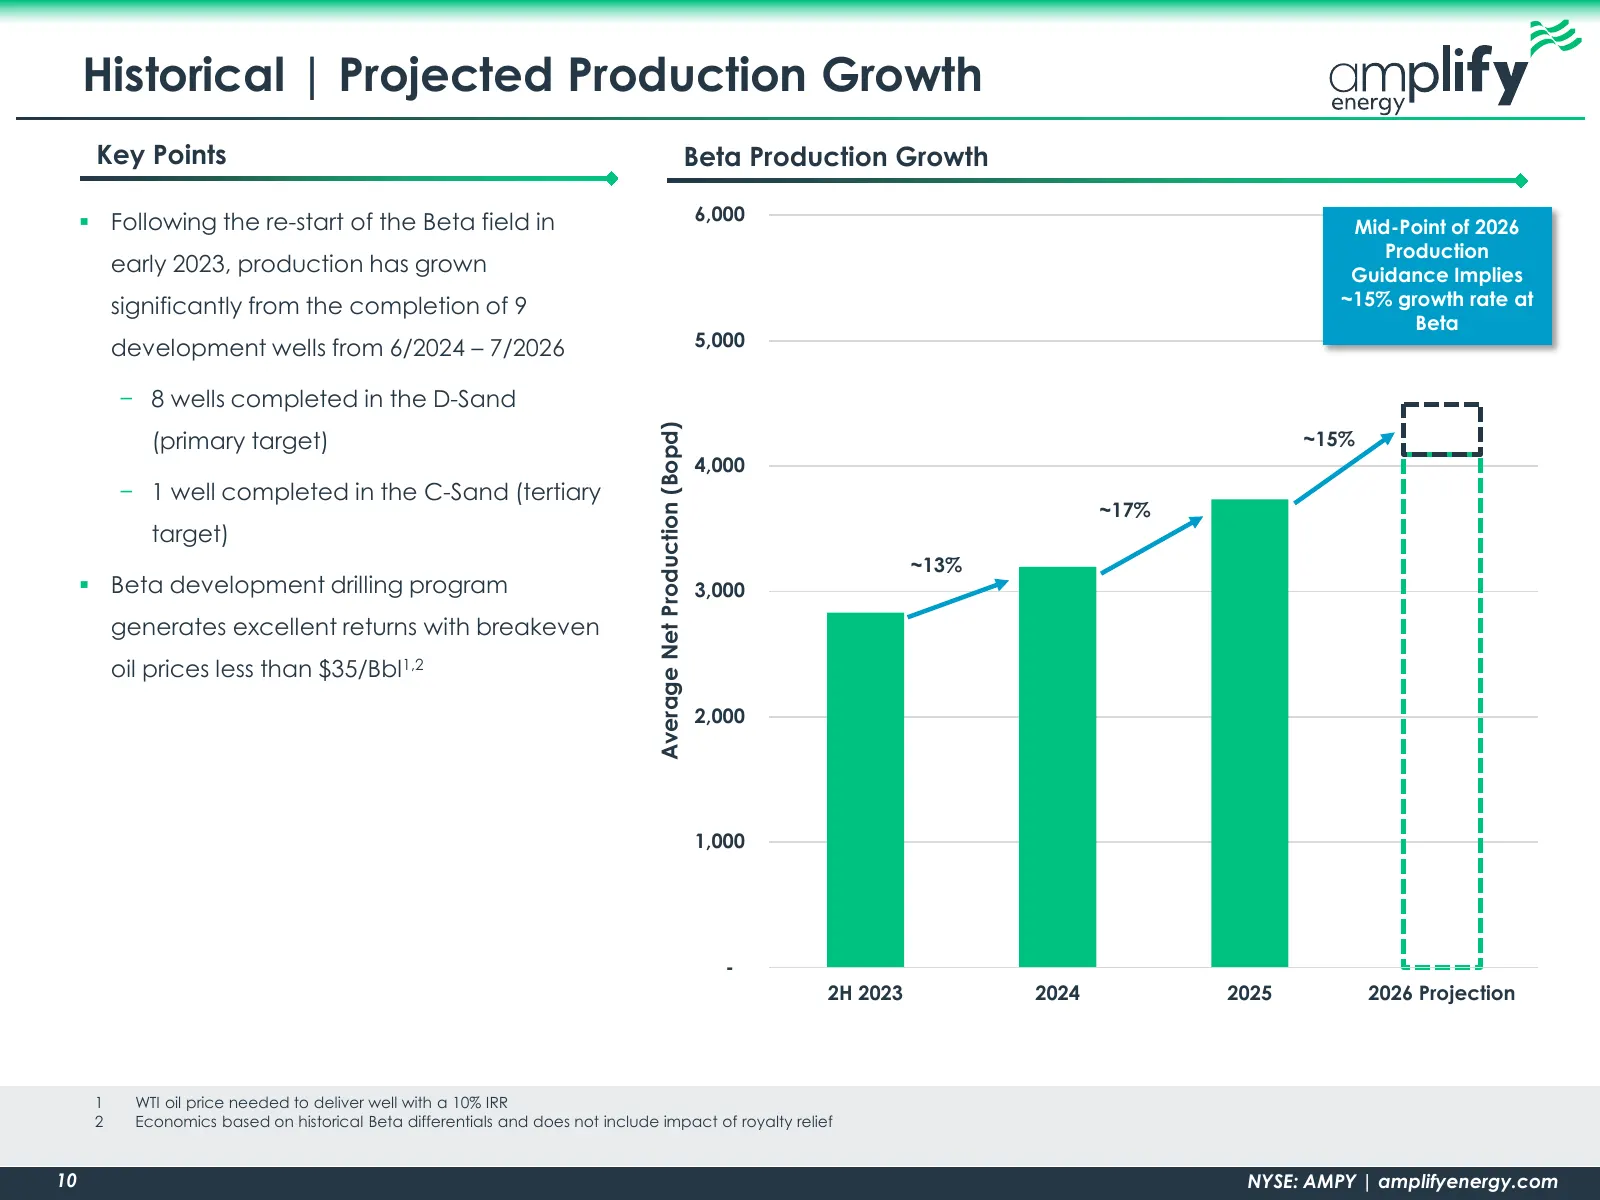
Historical | Projected Production Growth Key Points Beta Production Growth Following the re-start of the Beta field in 6,000 Mid-Point of 2026 Production early 2023, production has grown Guidance Implies significantly from the completion of 9 ~15% growth rate at Beta development wells from 6/2024
Slide 11: Beta Development Well Locations
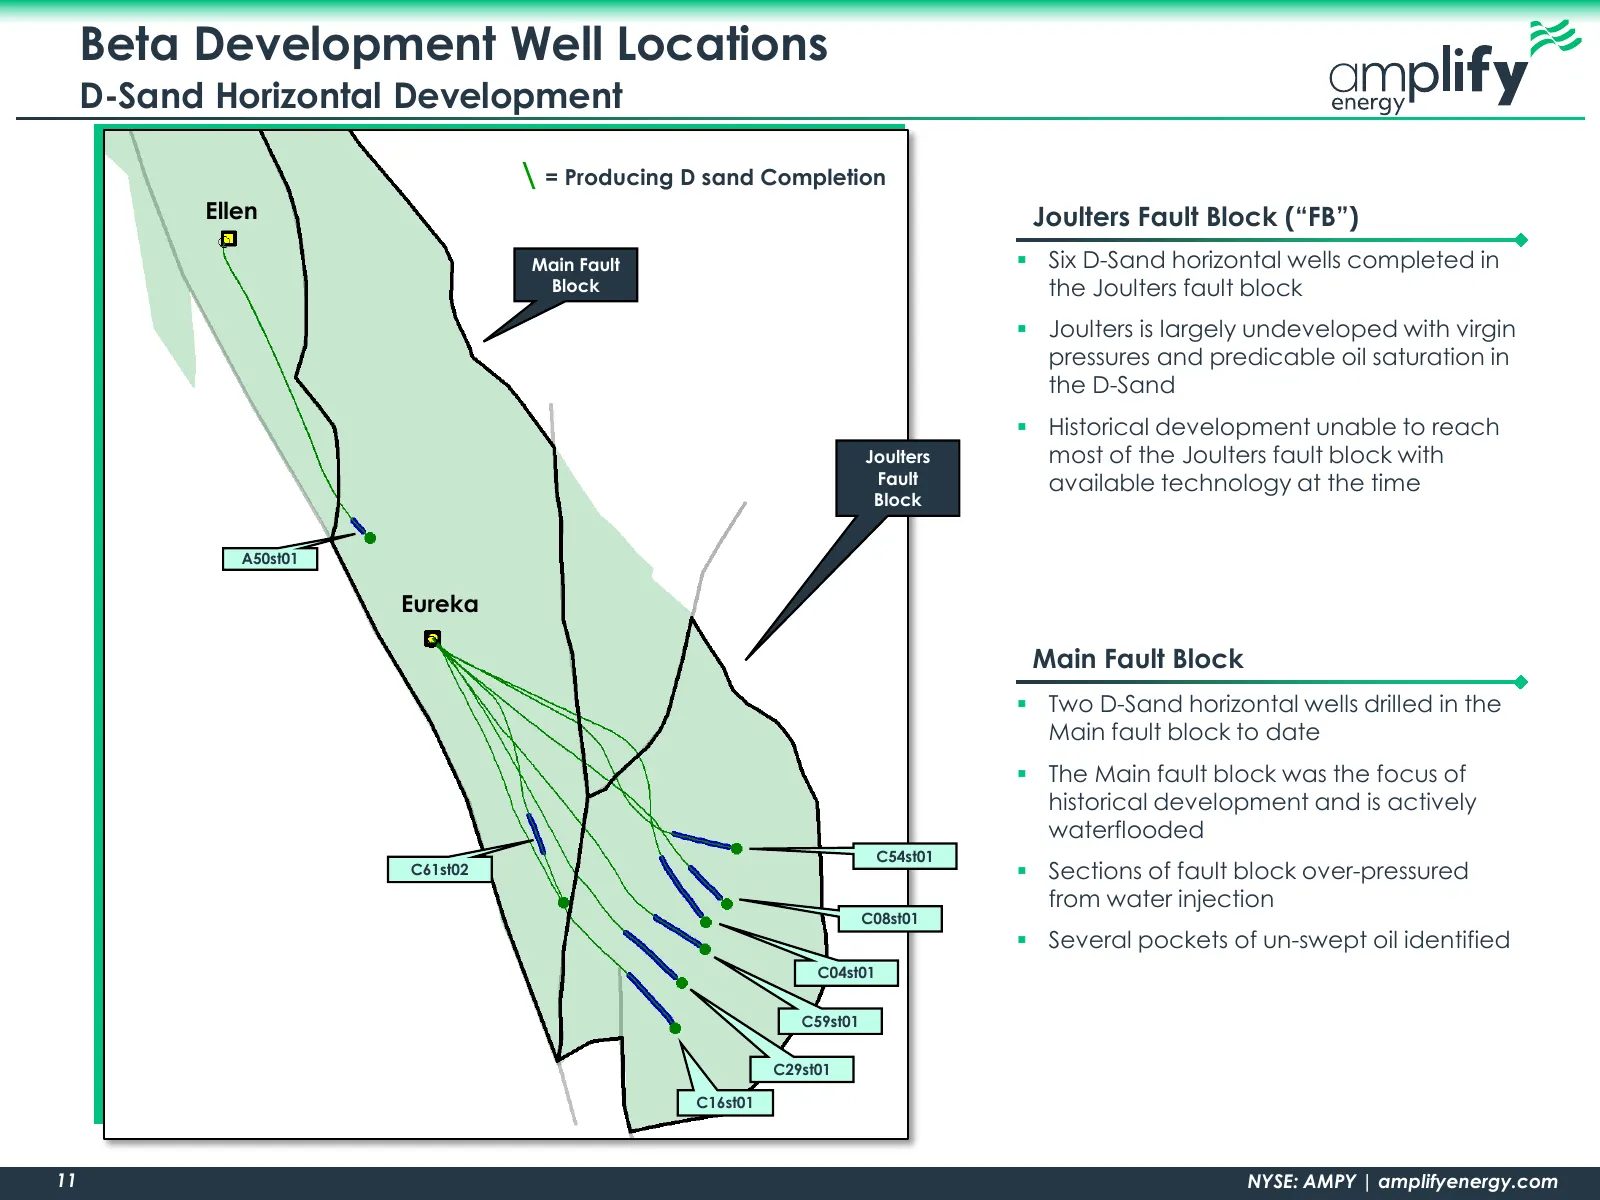
Beta Development Well Locations D-Sand Horizontal Development \ = Producing D sand Completion Ellen Joulters Fault Block (“FB”) Main Fault Six D-Sand horizontal wells completed in Block the Joulters fault block Joulters is largely undeveloped with virgin pressures and predicable oil saturation i
Slide 12: Joulters Fault Block Overview
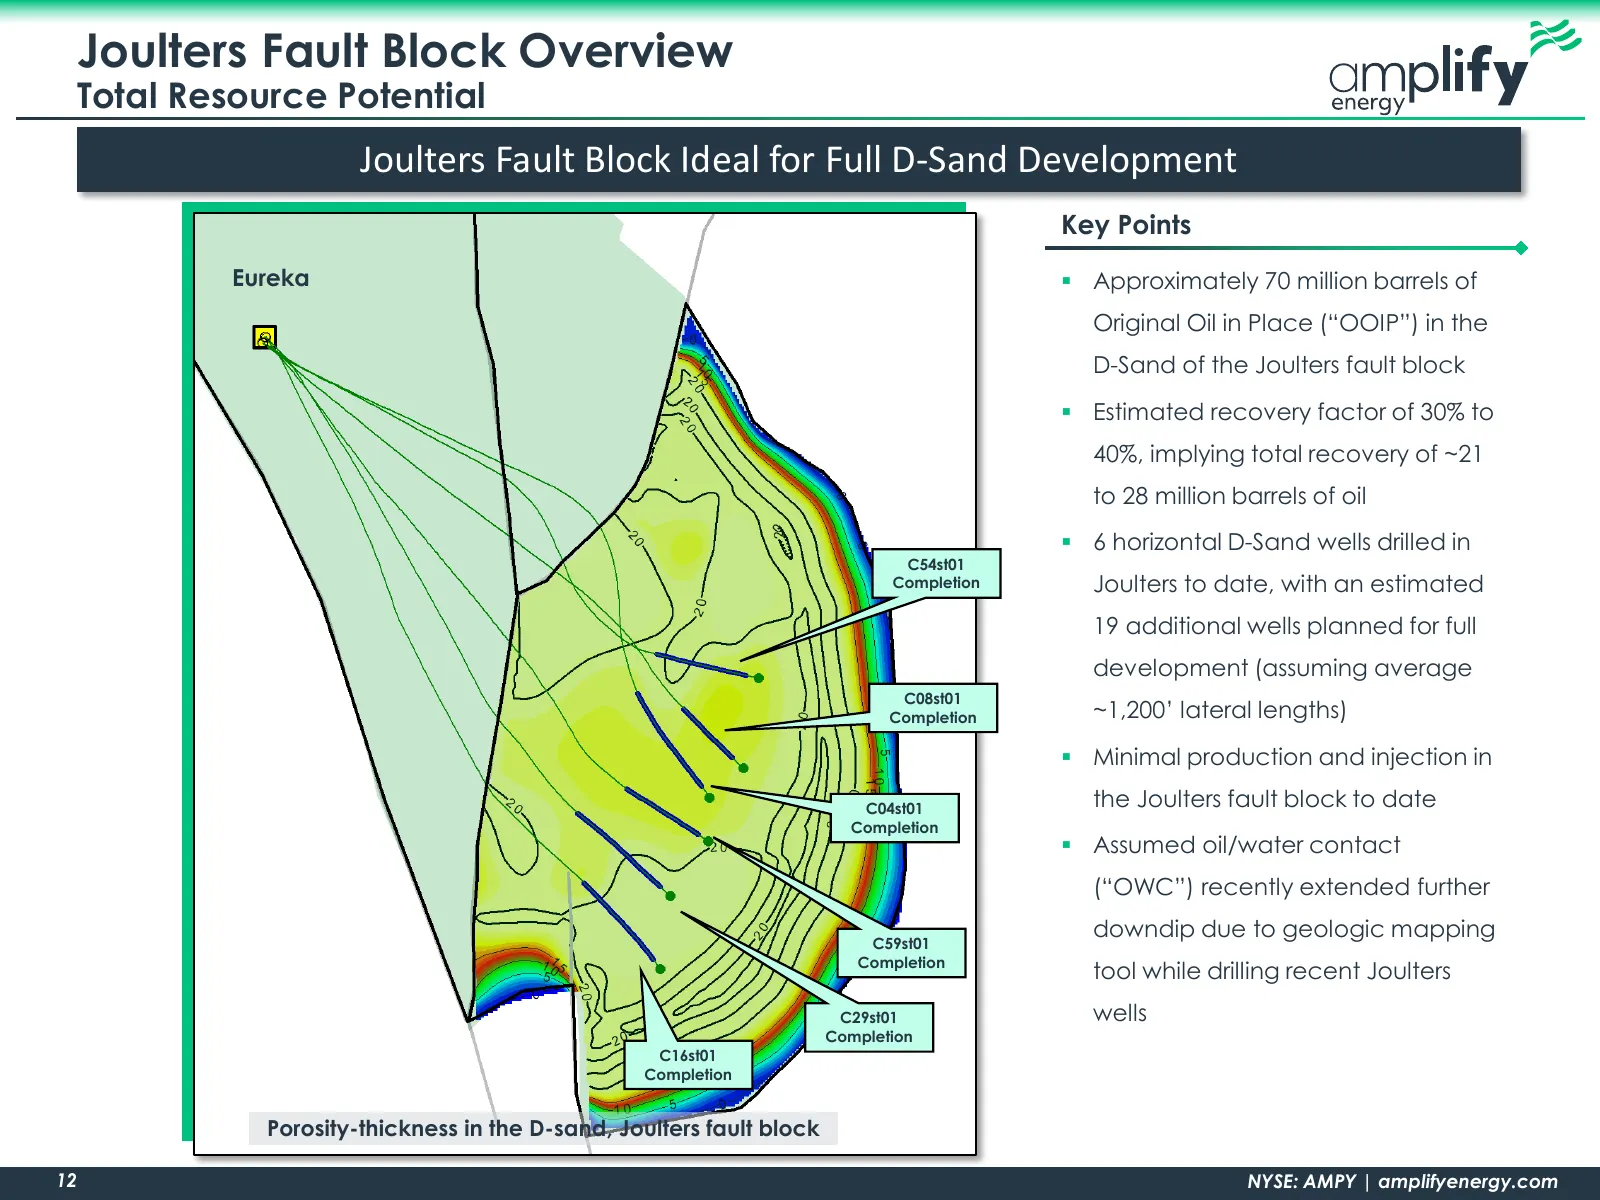
Joulters Fault Block Overview Total Resource Potential Joulters Fault Block Ideal for Full D-Sand Development Key Points Eureka Approximately 70 million barrels of Original Oil in Place (“OOIP”) in the D-Sand of the Joulters fault block Estimated recovery factor of 30% to 40%, implying total rec
Slide 13: Joulters Fault Block Development Results
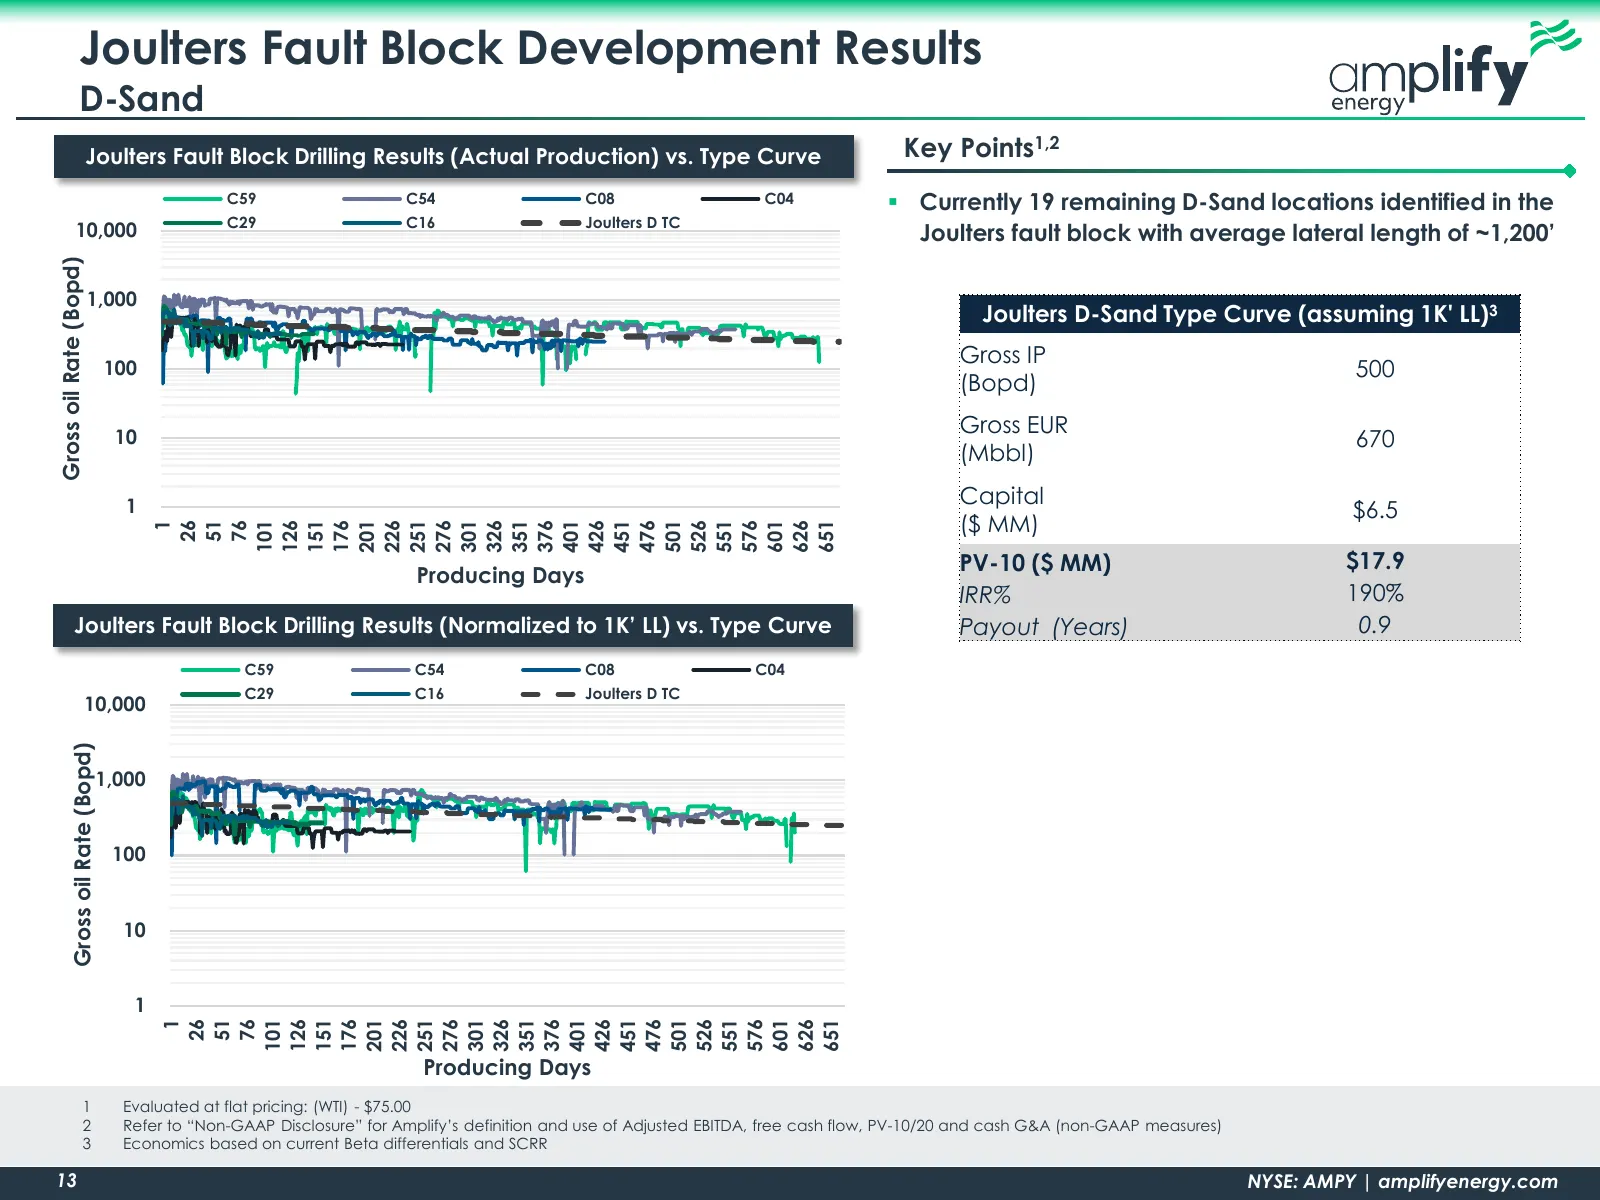
Joulters Fault Block Development Results D-Sand Joulters Fault Block Drilling Results (Actual Production) vs. Type Curve Key Points1,2 C59 C54 C08 C04 Currently 19 remaining D-Sand locations identified in the C29 C16 Joulters D TC 10,000 Joulters fault block with average lateral length of ~1,200’
Slide 14: Main Fault Block Development Results
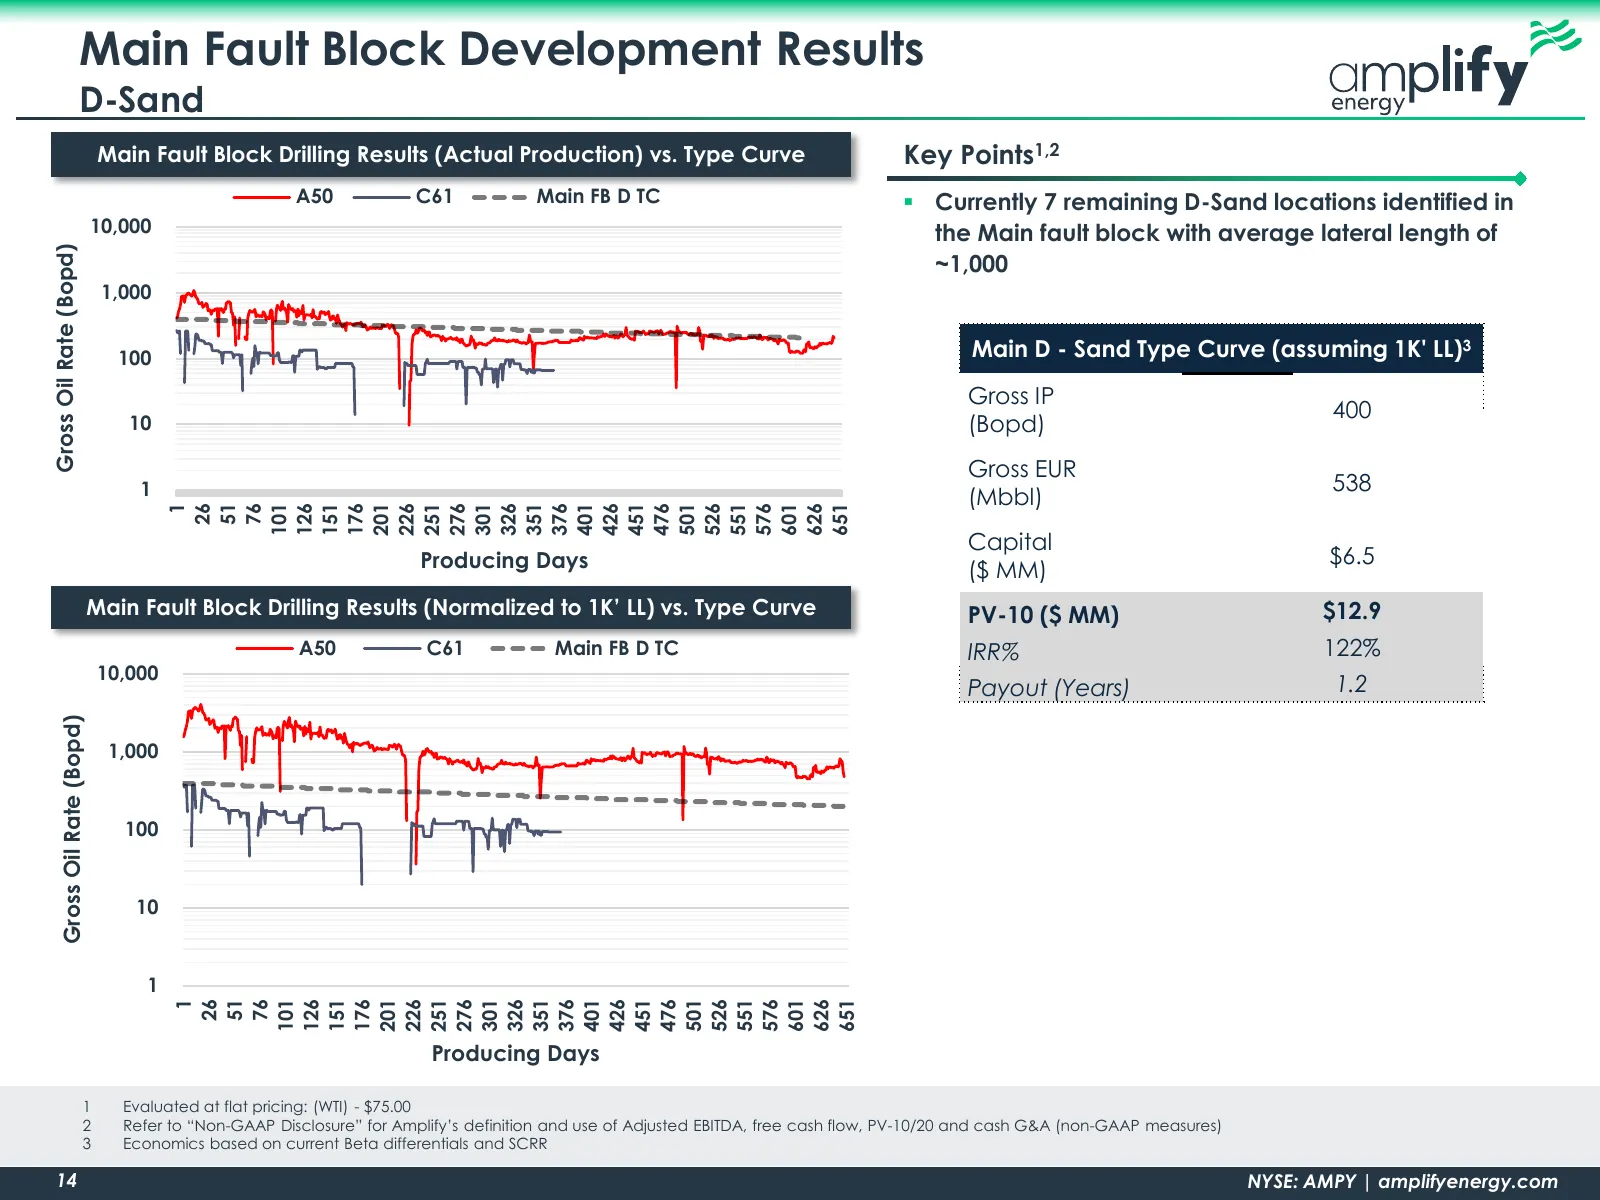
Main Fault Block Development Results D-Sand Main Fault Block Drilling Results (Actual Production) vs. Type Curve Key Points1,2 A50 C61 Main FB D TC Currently 7 remaining D-Sand locations identified in 10,000 the Main fault block with average lateral length of Gross Oil Rate (Bopd) ~1,000 1,000 100
Slide 15: D-Sand Current Development Inventory
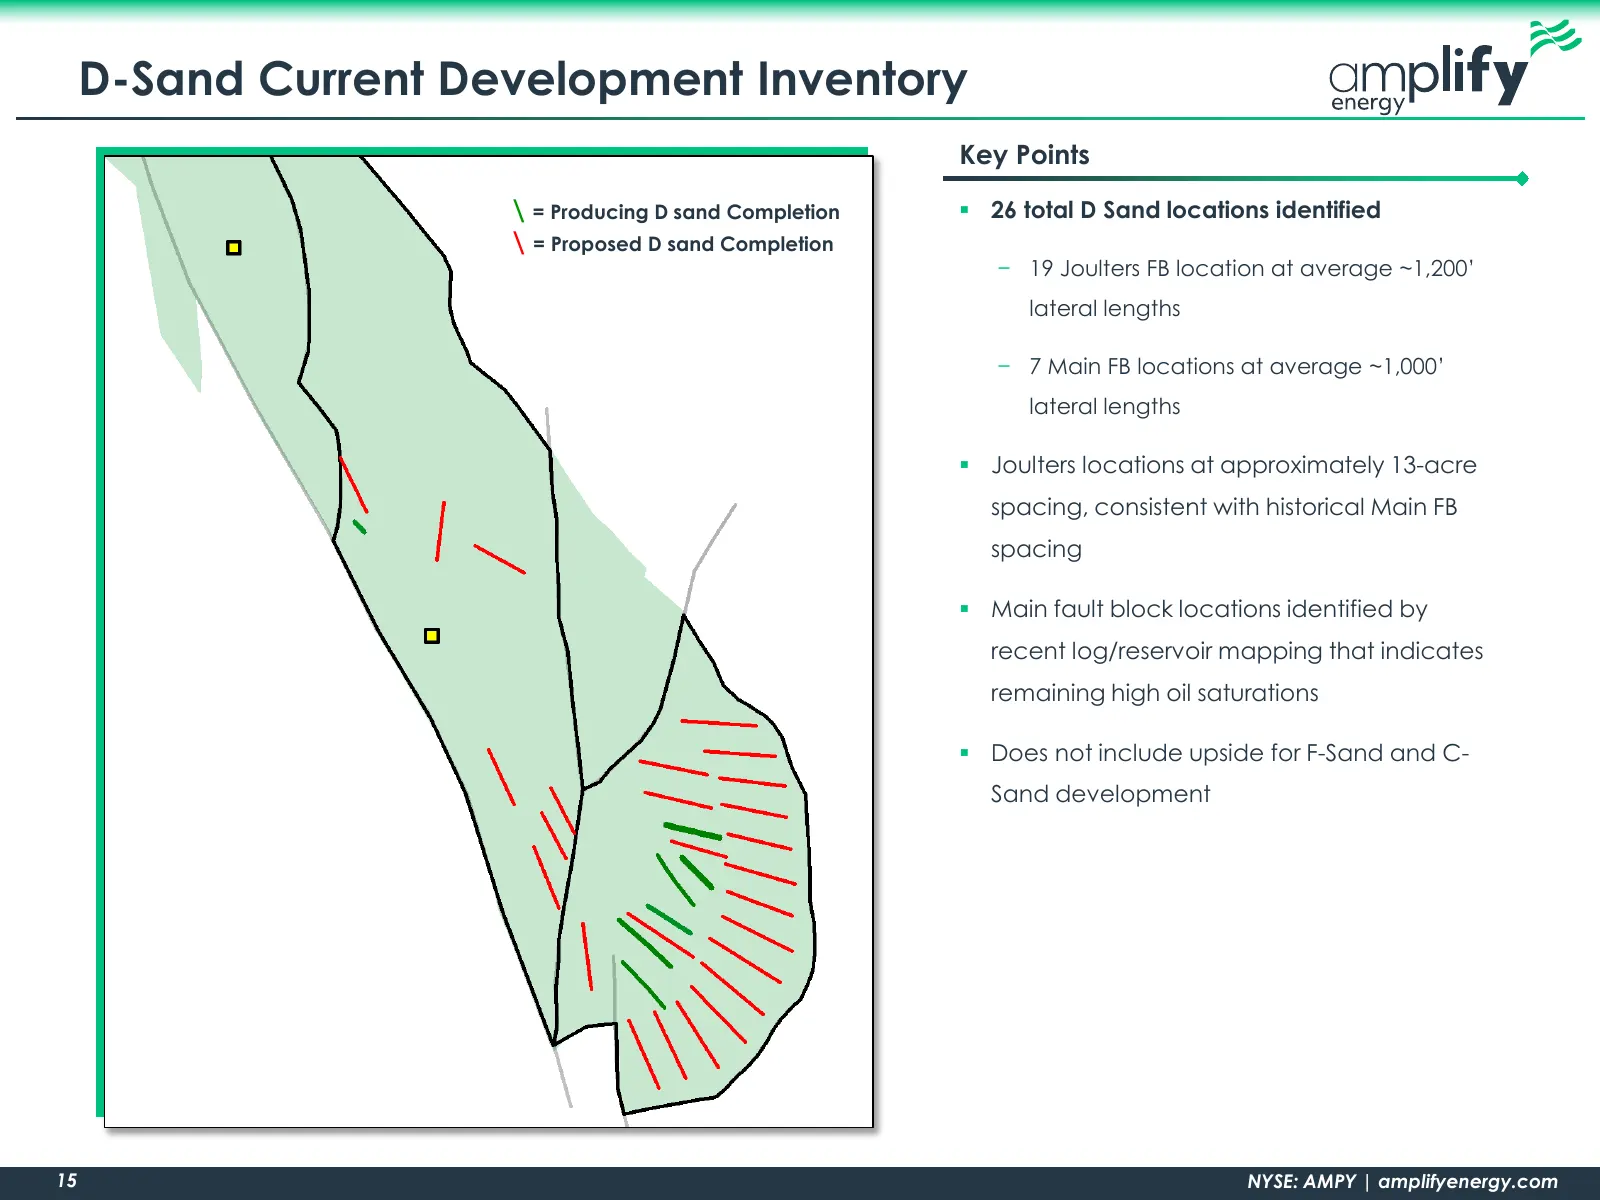
D-Sand Current Development Inventory Key Points \ = Producing D sand Completion 26 total D Sand locations identified \ = Proposed D sand Completion − 19 Joulters FB location at average ~1,200’ lateral lengths − 7 Main FB locations at average ~1,000’ lateral lengths Joulters locations at approxim
Slide 16: Beta Royalty Relief Improvement
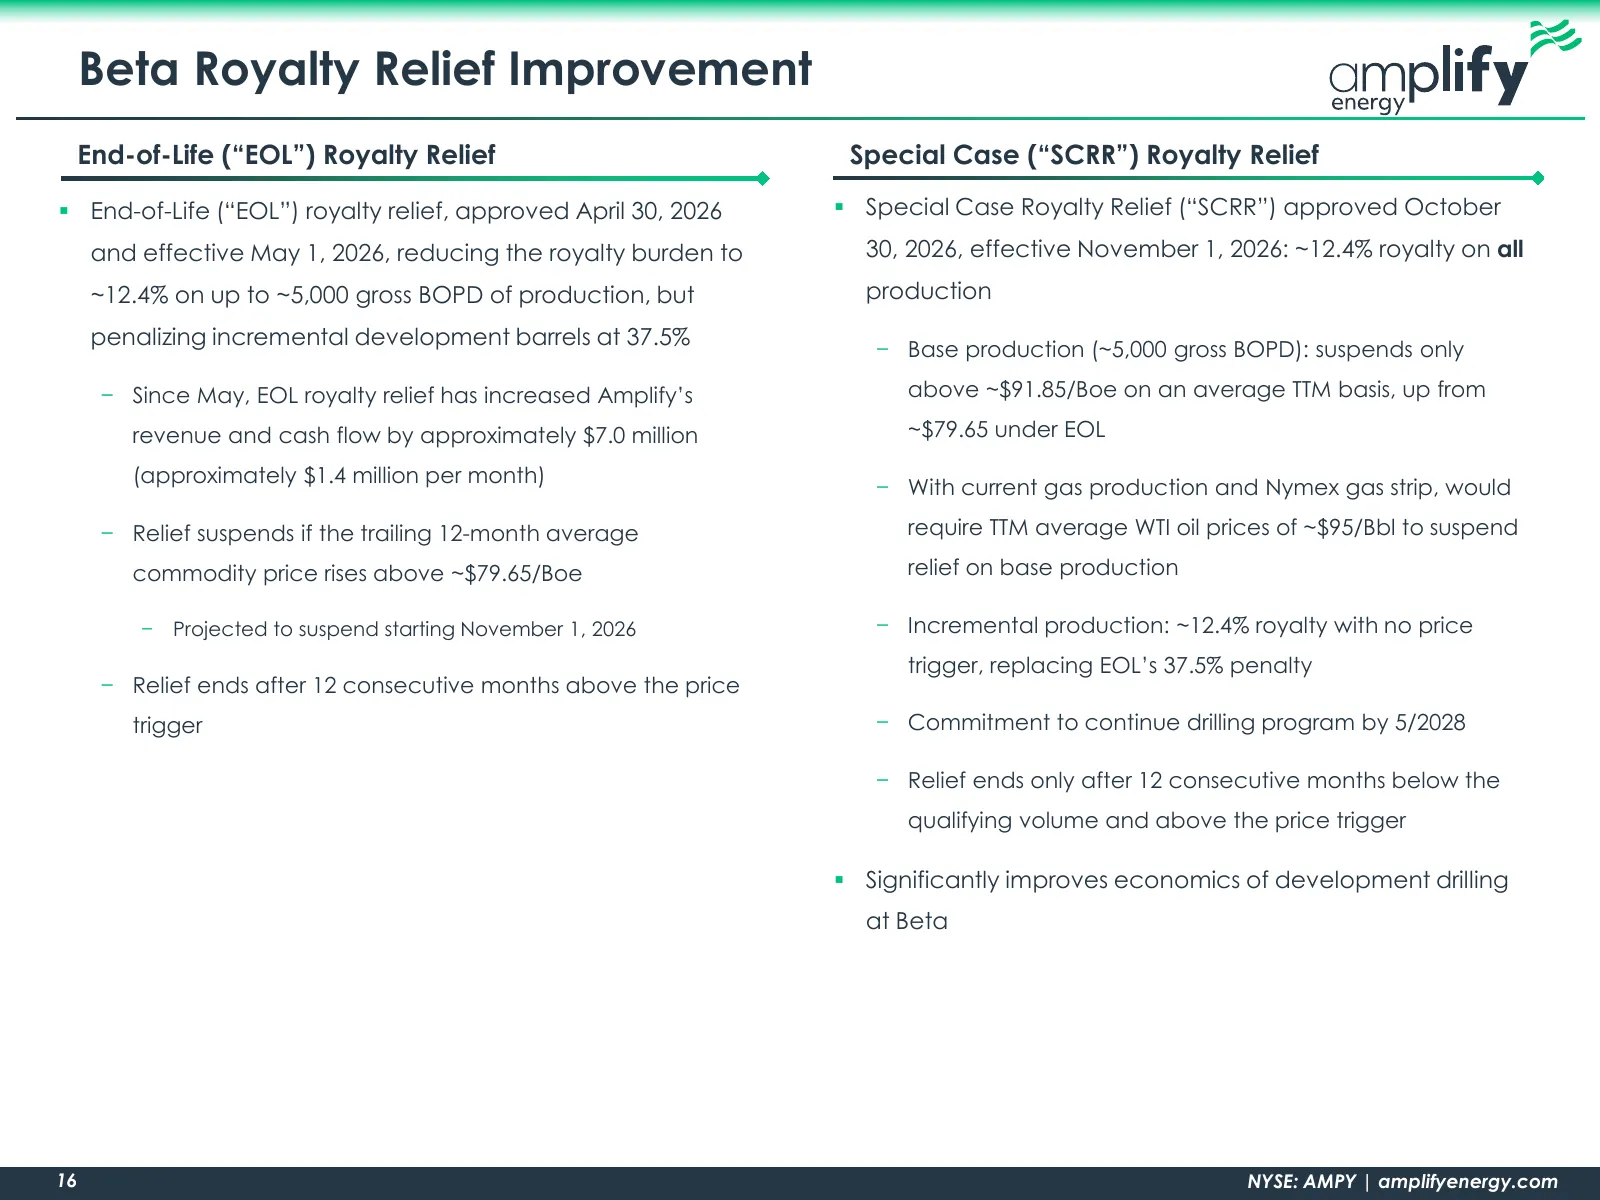
Beta Royalty Relief Improvement End-of-Life (“EOL”) Royalty Relief Special Case (“SCRR”) Royalty Relief End-of-Life (“EOL”) royalty relief, approved April 30, 2026 Special Case Royalty Relief (“SCRR”) approved October and effective May 1, 2026, reducing the royalty burden to 30, 2026, effective
Slide 17: Bairoil Overview
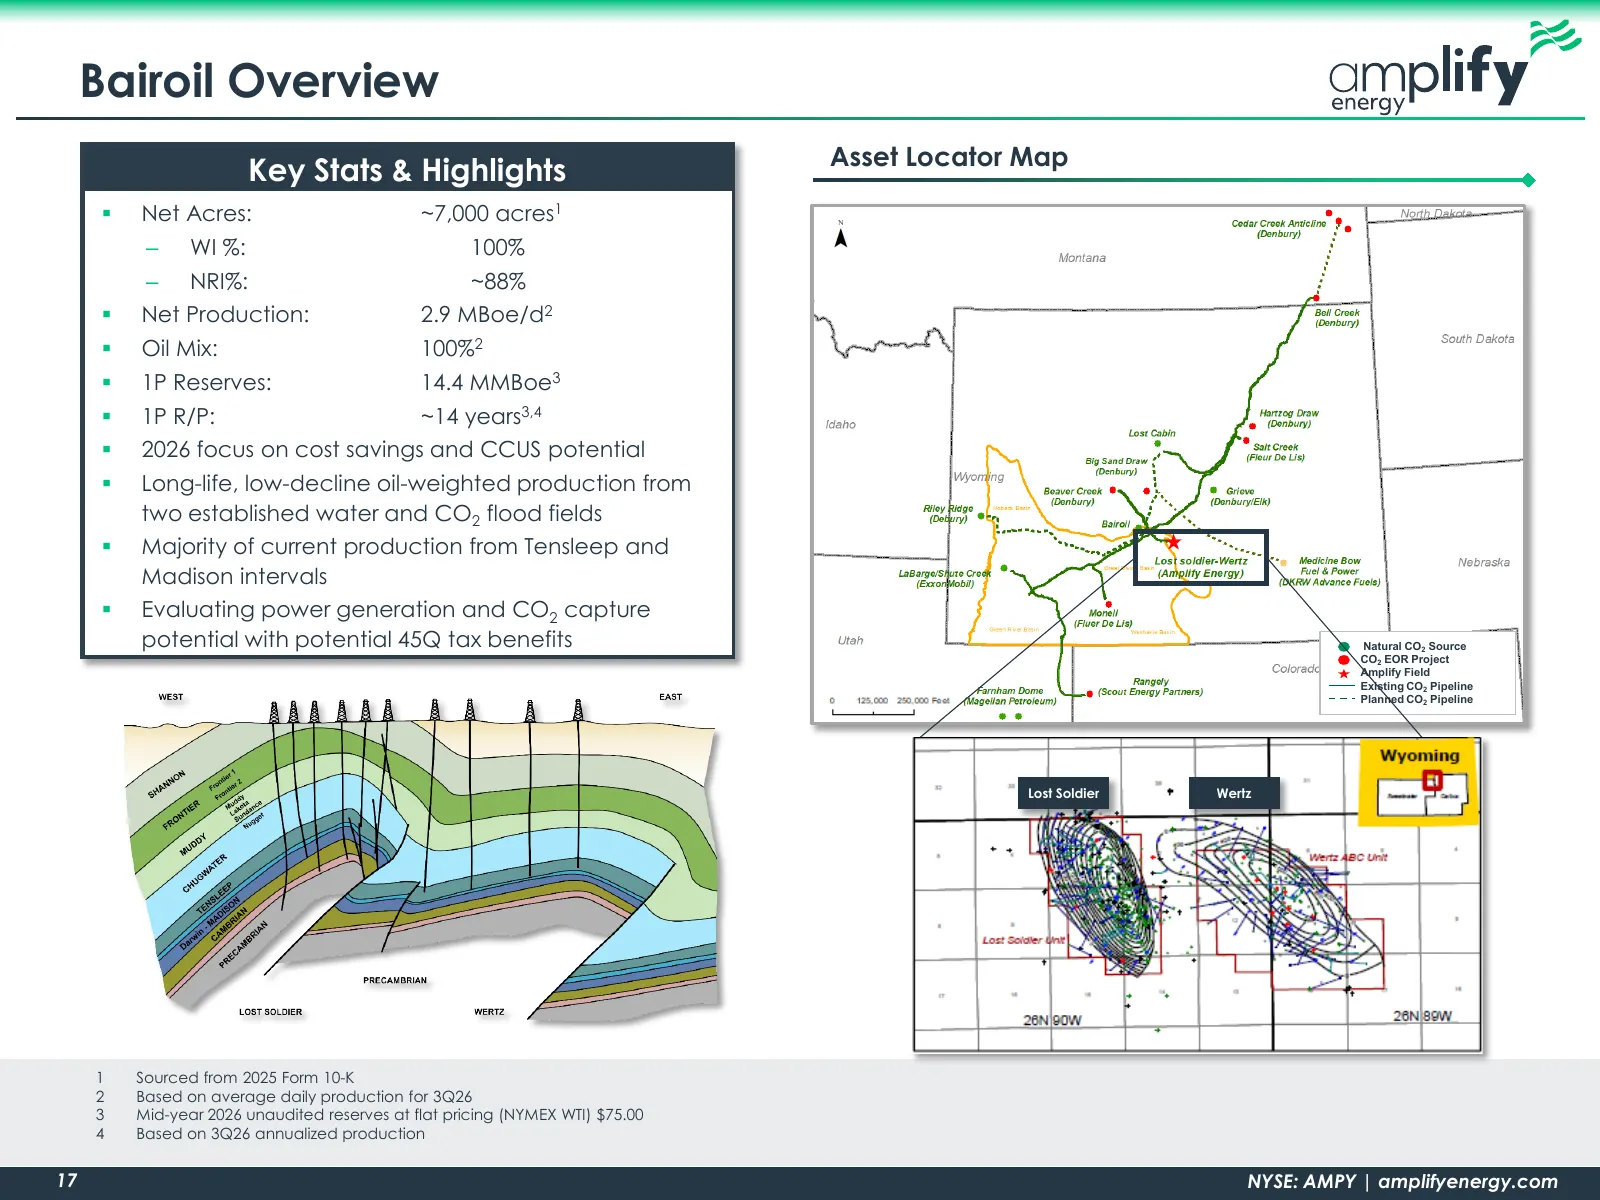
Bairoil Overview Asset Locator Map Key Stats & Highlights Net Acres: ~7,000 acres1 ‒ WI %: 100% ‒ NRI%: ~88% Net Production: 2.9 MBoe/d2 Oil Mix: 100%2 1P Reserves: 14.4 MMBoe3 1P R/P: ~14 years3,4 2026 focus on cost savings and CCUS potential Long-life, low-decline oil-weighted produc
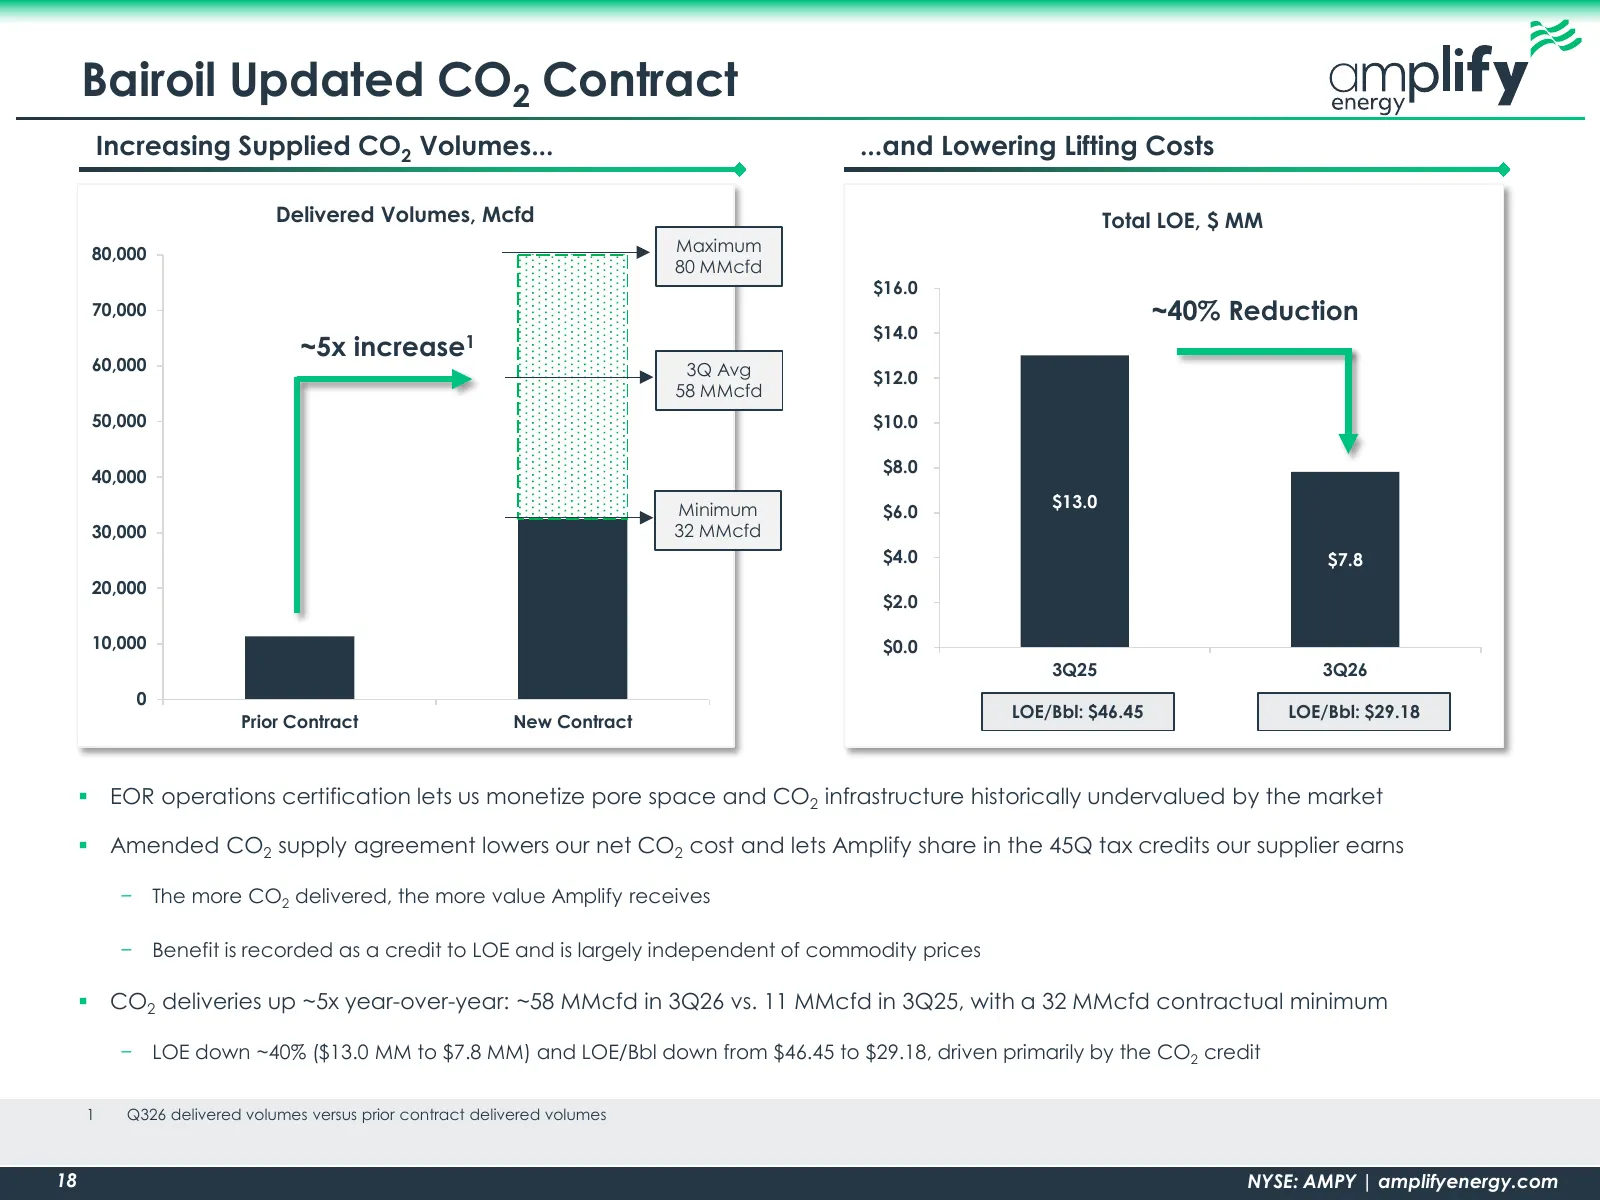
Slide 18: Bairoil Updated CO2 Contract
Bairoil Updated CO2 Contract Increasing Supplied CO2 Volumes... ...and Lowering Lifting Costs Delivered Volumes, Mcfd Total LOE, $ MM 80,000 Maximum 80 MMcfd $16.0 70,000 ~40% Reduction $14.0 ~5x increase1 60,000 3Q Avg $12.0 58 MMcfd 50,000 $10.0 $8.0 40,000 Minimum $13.0 $6.0 30,000 32 MMcfd $4.0
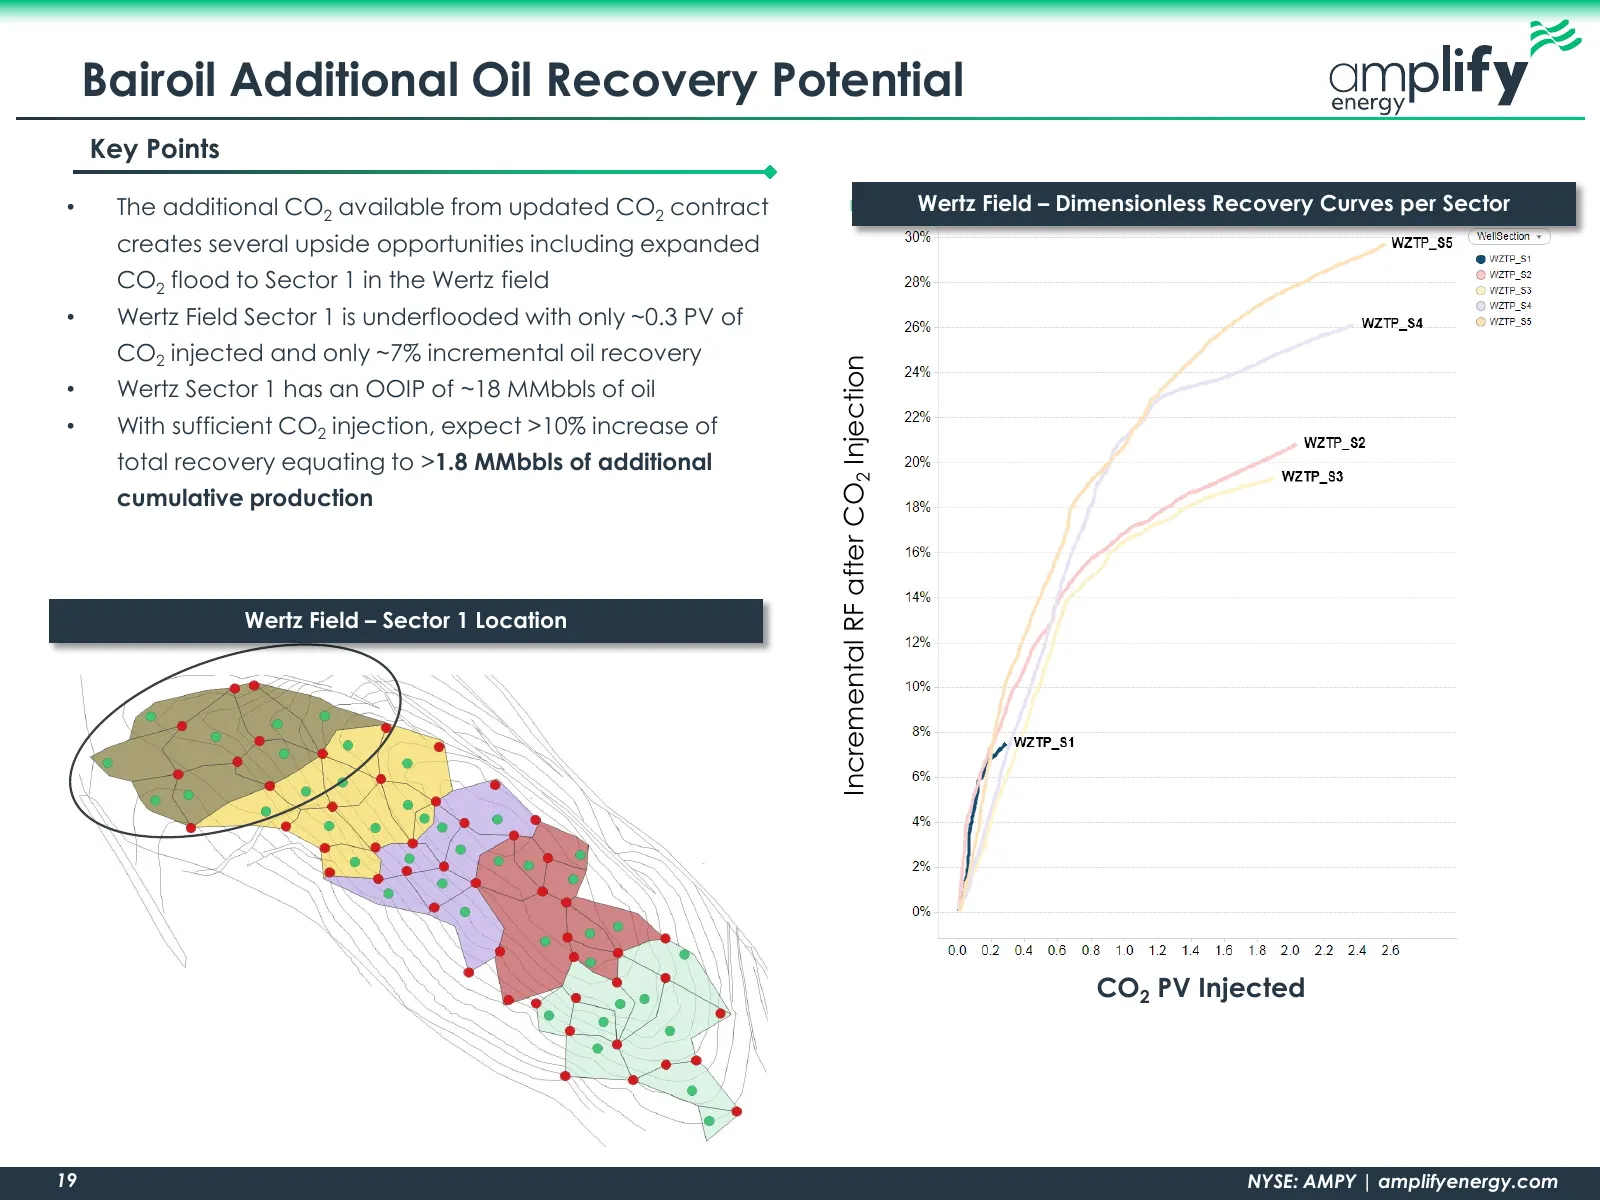
Slide 19: Bairoil Additional Oil Recovery Potential
Bairoil Additional Oil Recovery Potential Key Points • The additional CO2 available from updated CO2 contract Wertz Field – Dimensionless Recovery Curves per Sector creates several upside opportunities including expanded CO2 flood to Sector 1 in the Wertz field • Wertz Field Sector 1 is underflooded
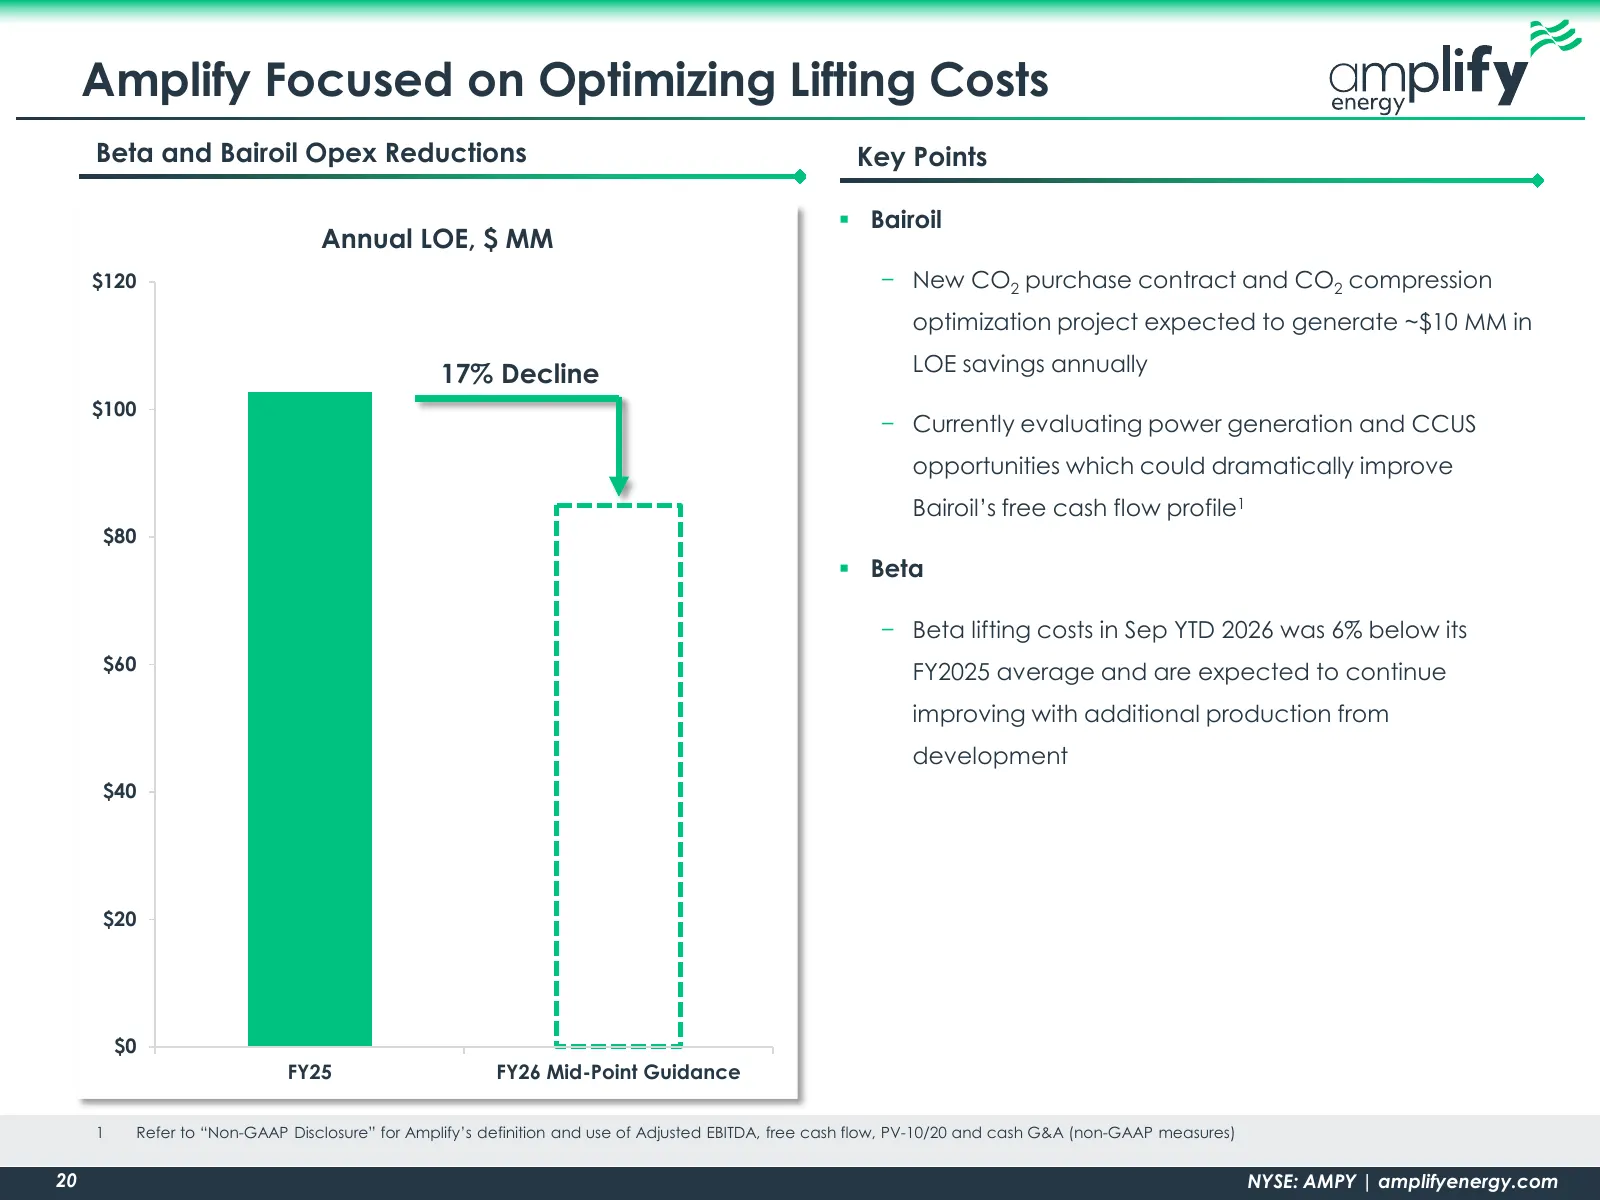
Slide 20: Amplify Focused on Optimizing Lifting Costs
Amplify Focused on Optimizing Lifting Costs Beta and Bairoil Opex Reductions Key Points Bairoil Annual LOE, $ MM $120 − New CO2 purchase contract and CO2 compression optimization project expected to generate ~$10 MM in 17% Decline LOE savings annually $100 − Currently evaluating power generation a
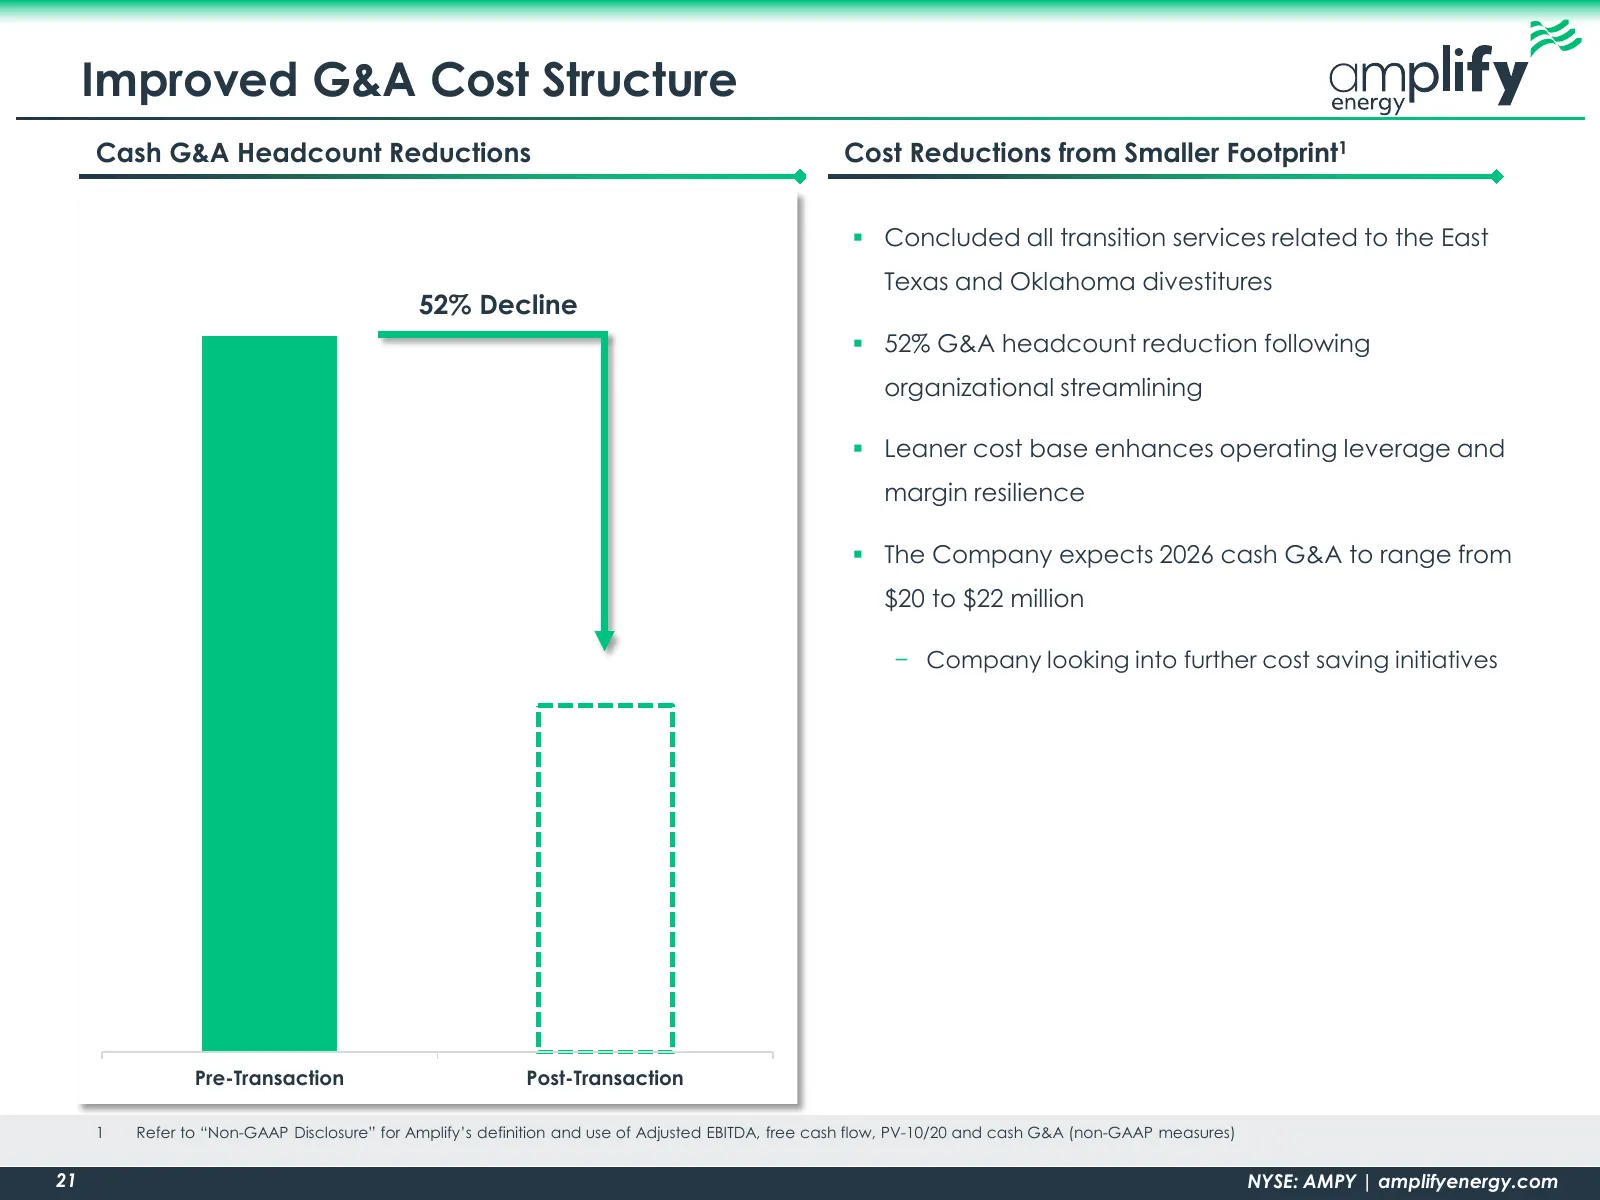
Slide 21: Improved G&A Cost Structure
Improved G&A Cost Structure Cash G&A Headcount Reductions Cost Reductions from Smaller Footprint1 Concluded all transition services related to the East Texas and Oklahoma divestitures 52% Decline 52% G&A headcount reduction following organizational streamlining Leaner cost base enhances operat
Slide 22: Investment Highlights
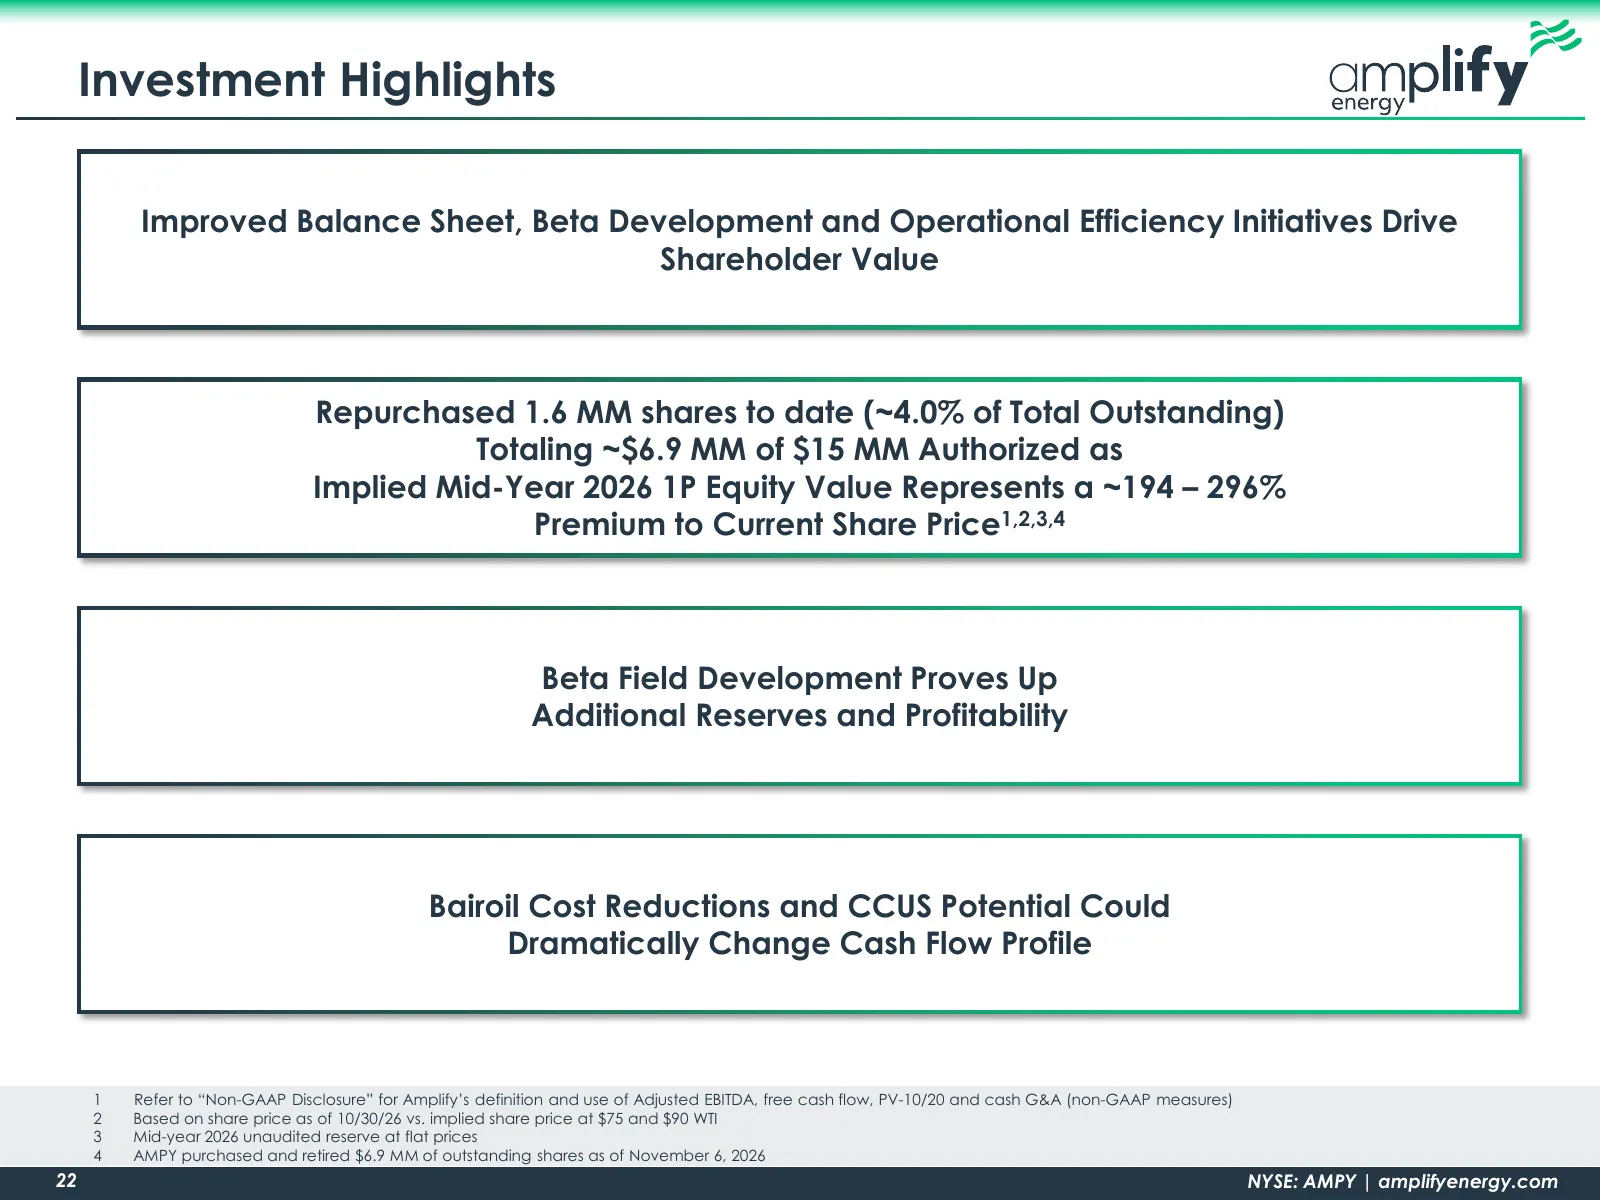
Investment Highlights Improved Balance Sheet, Beta Development and Operational Efficiency Initiatives Drive Shareholder Value Repurchased 1.6 MM shares to date (~4.0% of Total Outstanding) Totaling ~$6.9 MM of $15 MM Authorized as Implied Mid-Year 2026 1P Equity Value Represents a ~194 – 296% Premiu
Slide 23: Appendix
elaa ements —_ acini ae ier : Ps, i mm 7
Slide 24: Amplify Corporate ESG Profile
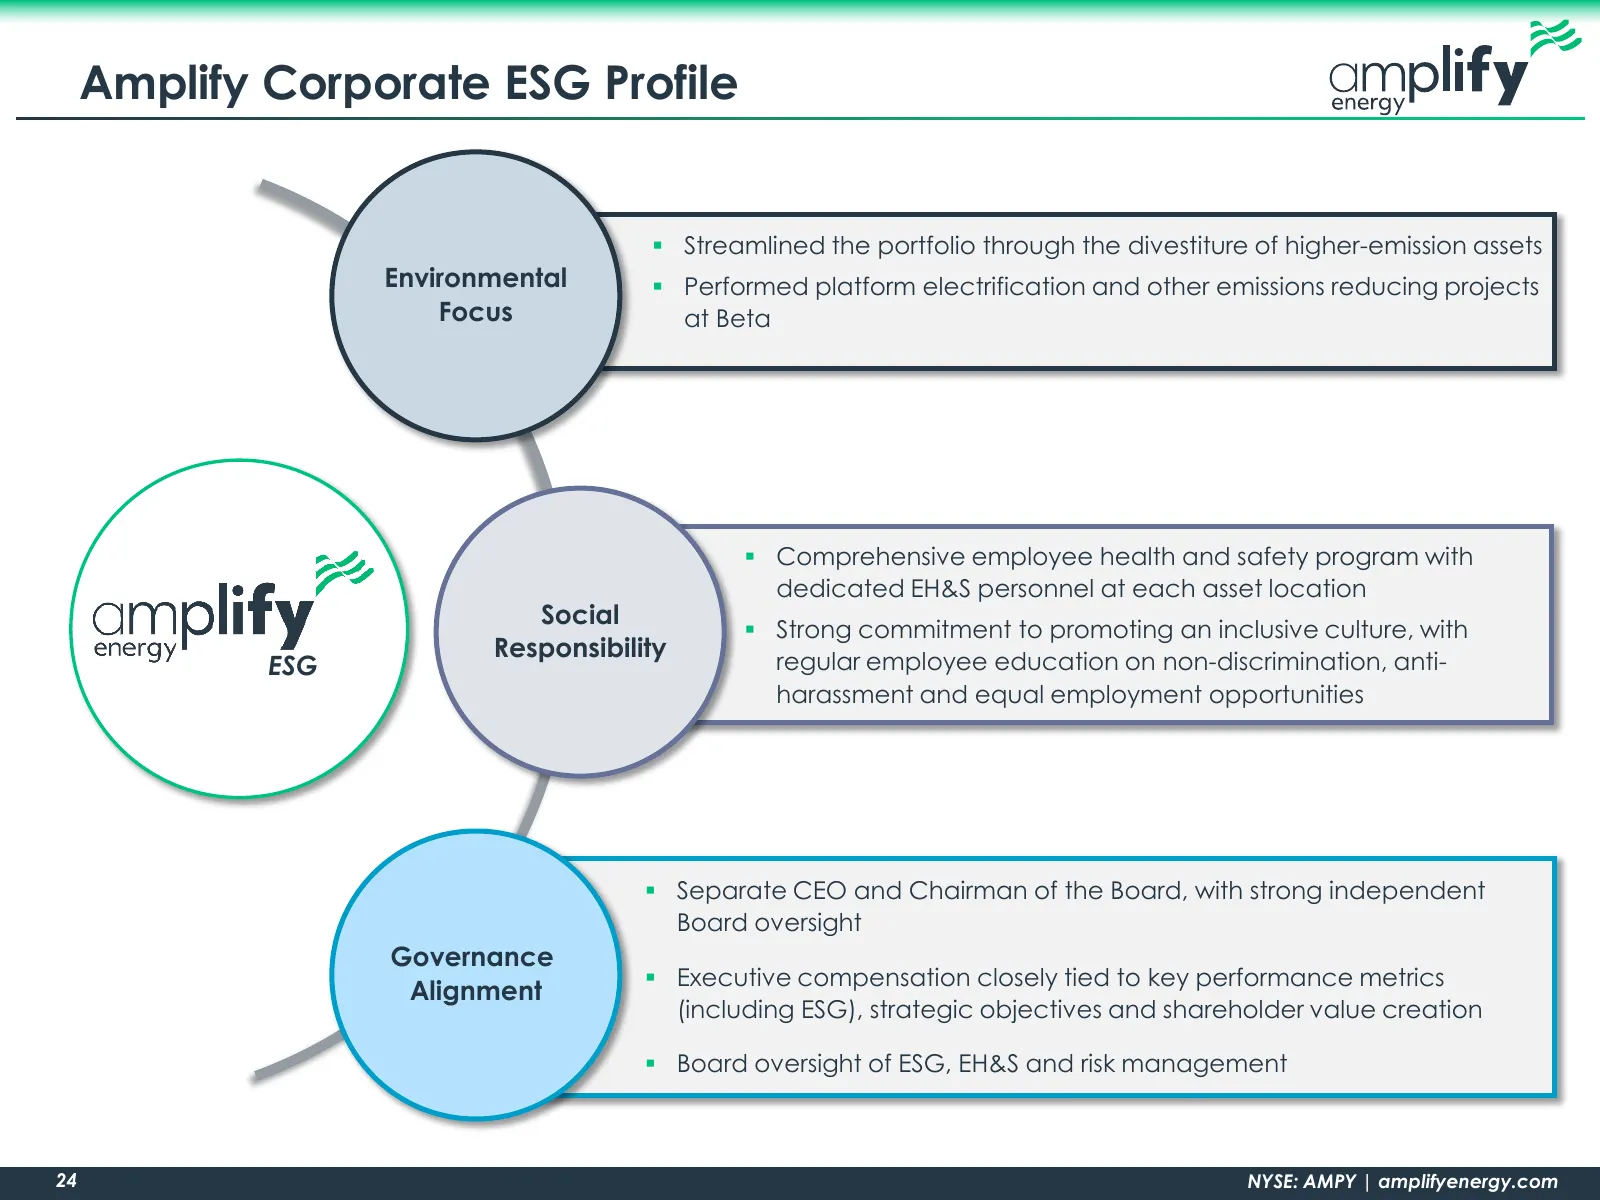
Amplify Corporate ESG Profile Streamlined the portfolio through the divestiture of higher-emission assets Environmental Performed platform electrification and other emissions reducing projects Focus at Beta Comprehensive employee health and safety program with dedicated EH&S personnel at each
Slide 25: 2026 Guidance and Details
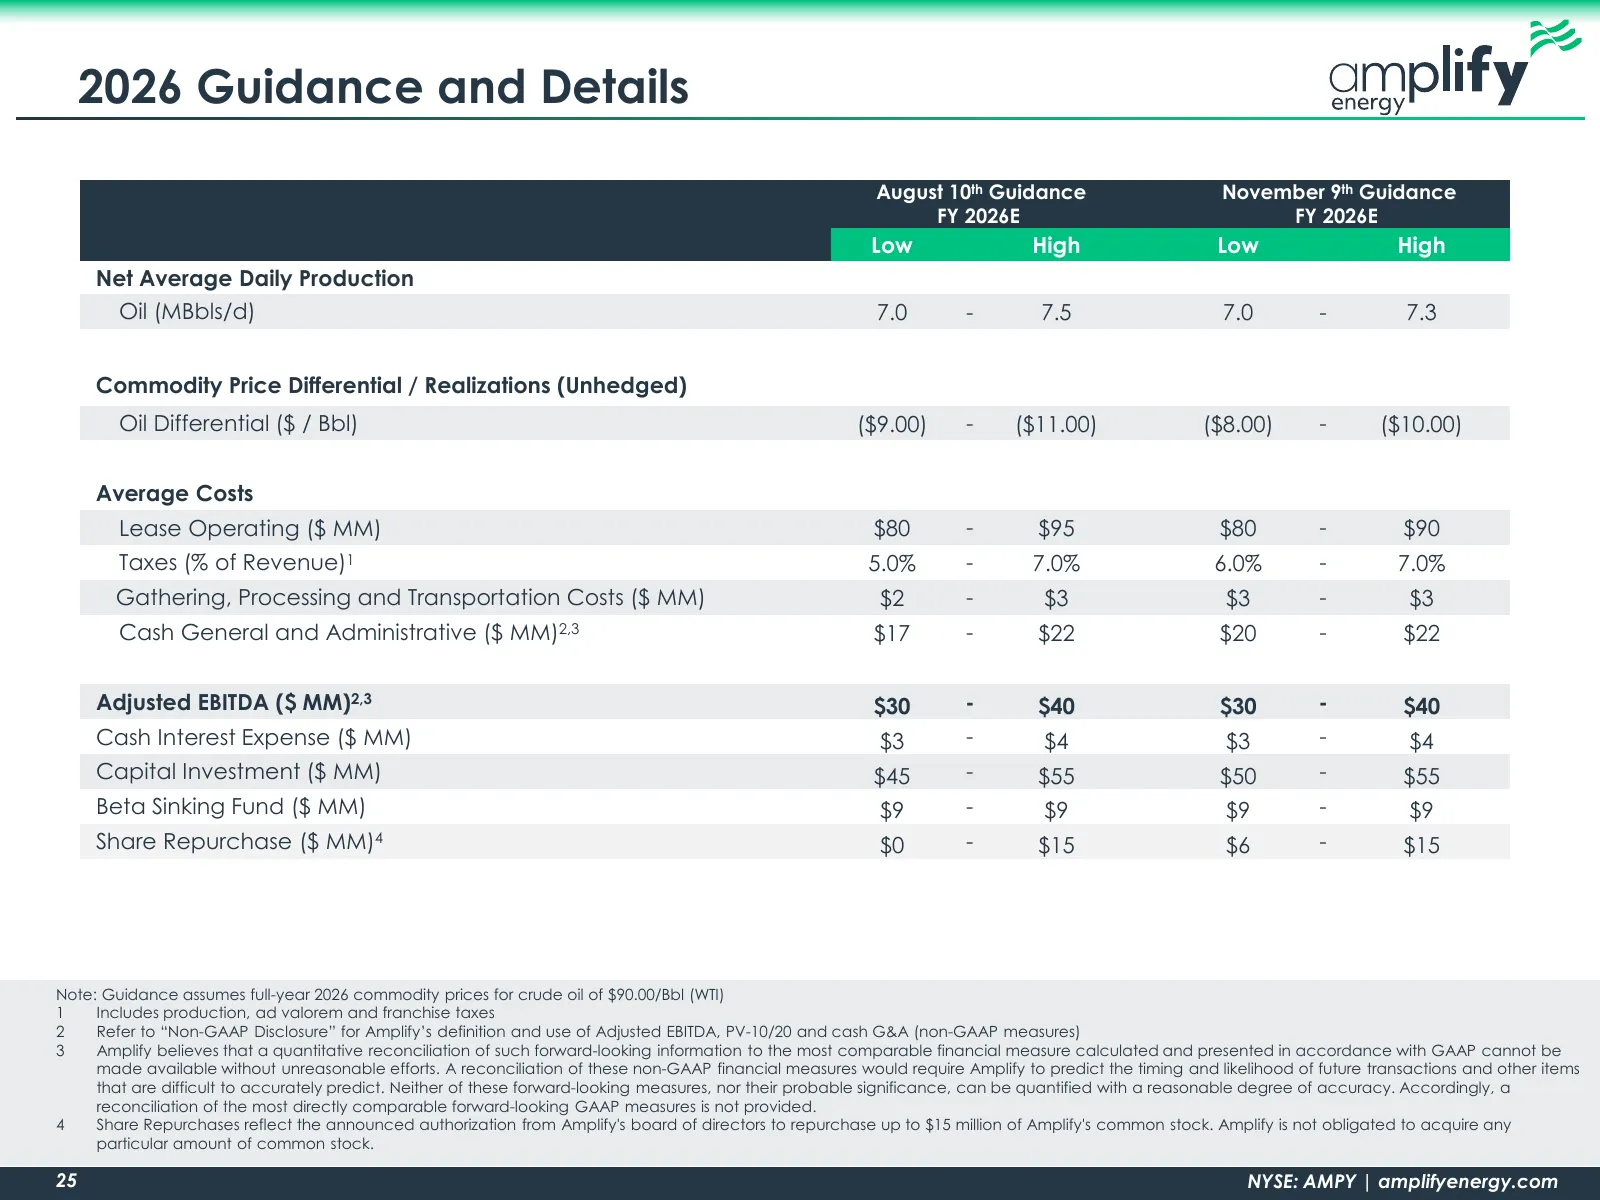
2026 Guidance and Details August 10th Guidance November 9th Guidance FY 2026E FY 2026E Low High Low High Net Average Daily Production Oil (MBbls/d) 7.0 - 7.5 7.0 - 7.3 Commodity Price Differential / Realizations (Unhedged) Oil Differential ($ / Bbl) ($9.00) - ($11.00) ($8.00) - ($10.00) Average Cost
Slide 26: Crude Hedge Detail
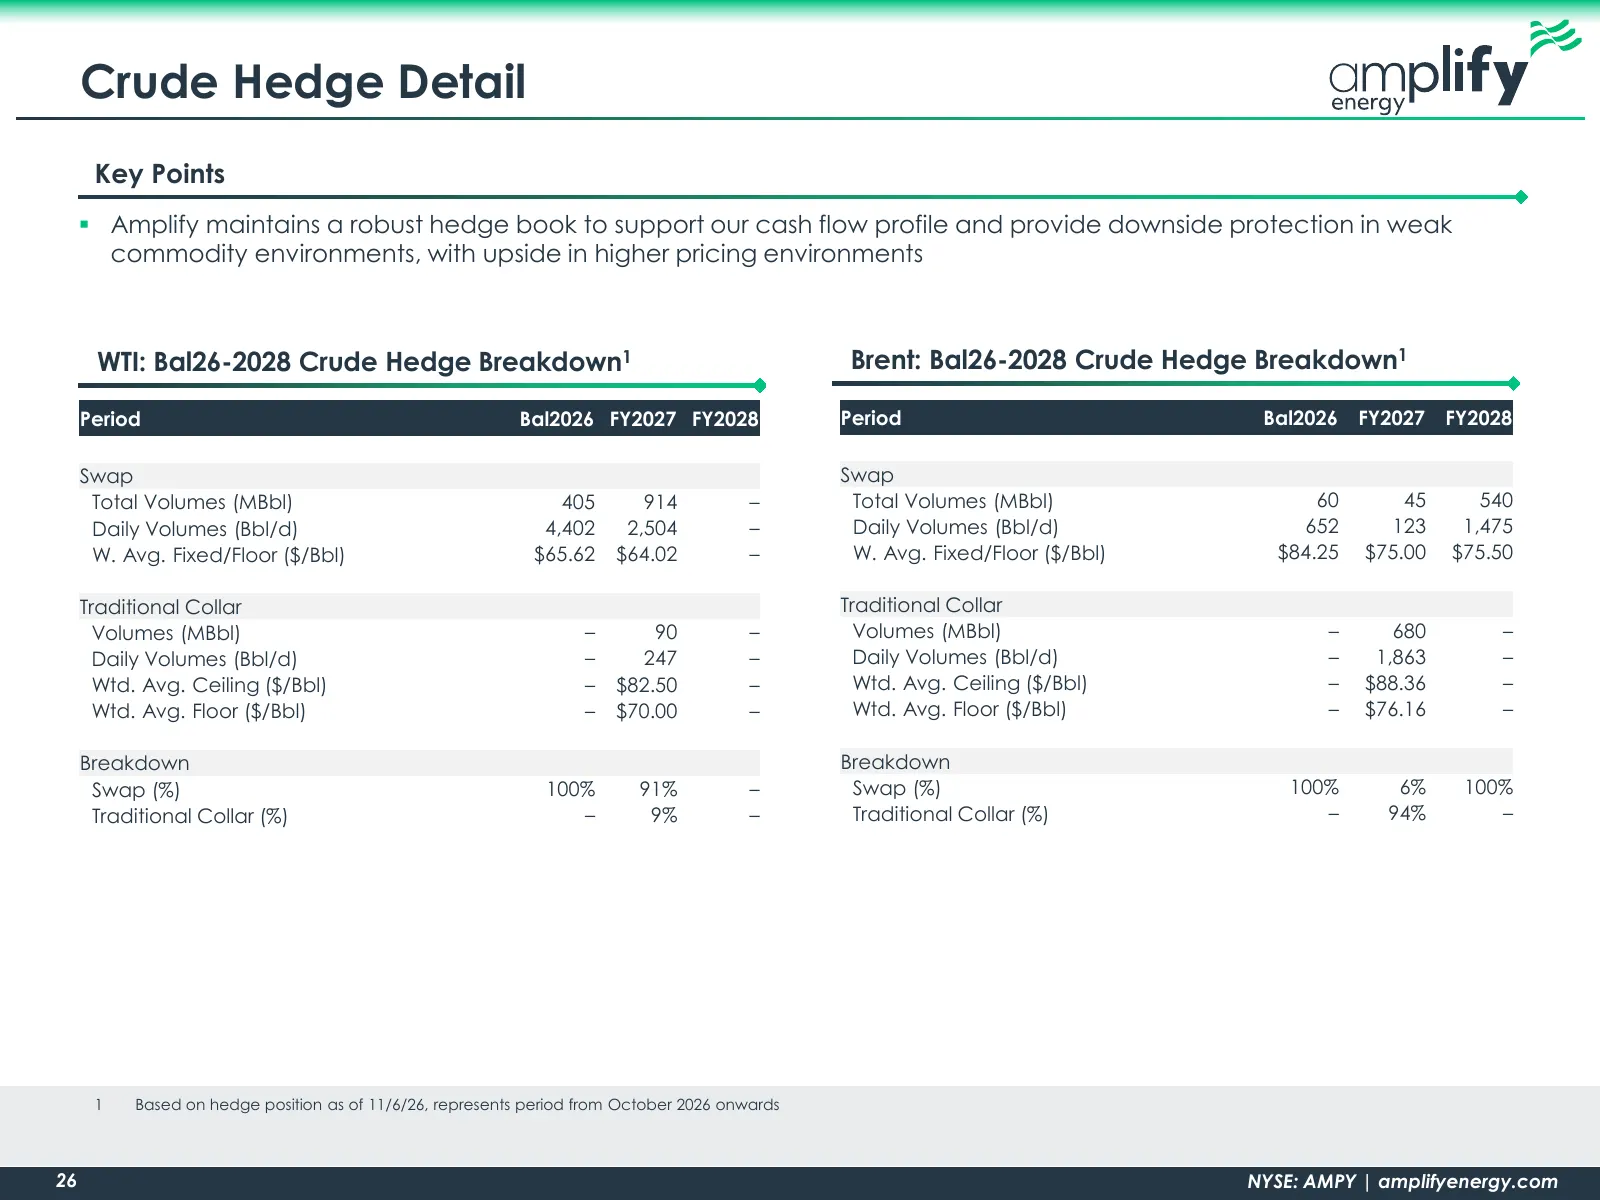
Crude Hedge Detail Key Points Amplify maintains a robust hedge book to support our cash flow profile and provide downside protection in weak commodity environments, with upside in higher pricing environments WTI: Bal26-2028 Crude Hedge Breakdown1 Brent: Bal26-2028 Crude Hedge Breakdown1 Period Bal
Slide 27: Non-GAAP Reconciliations
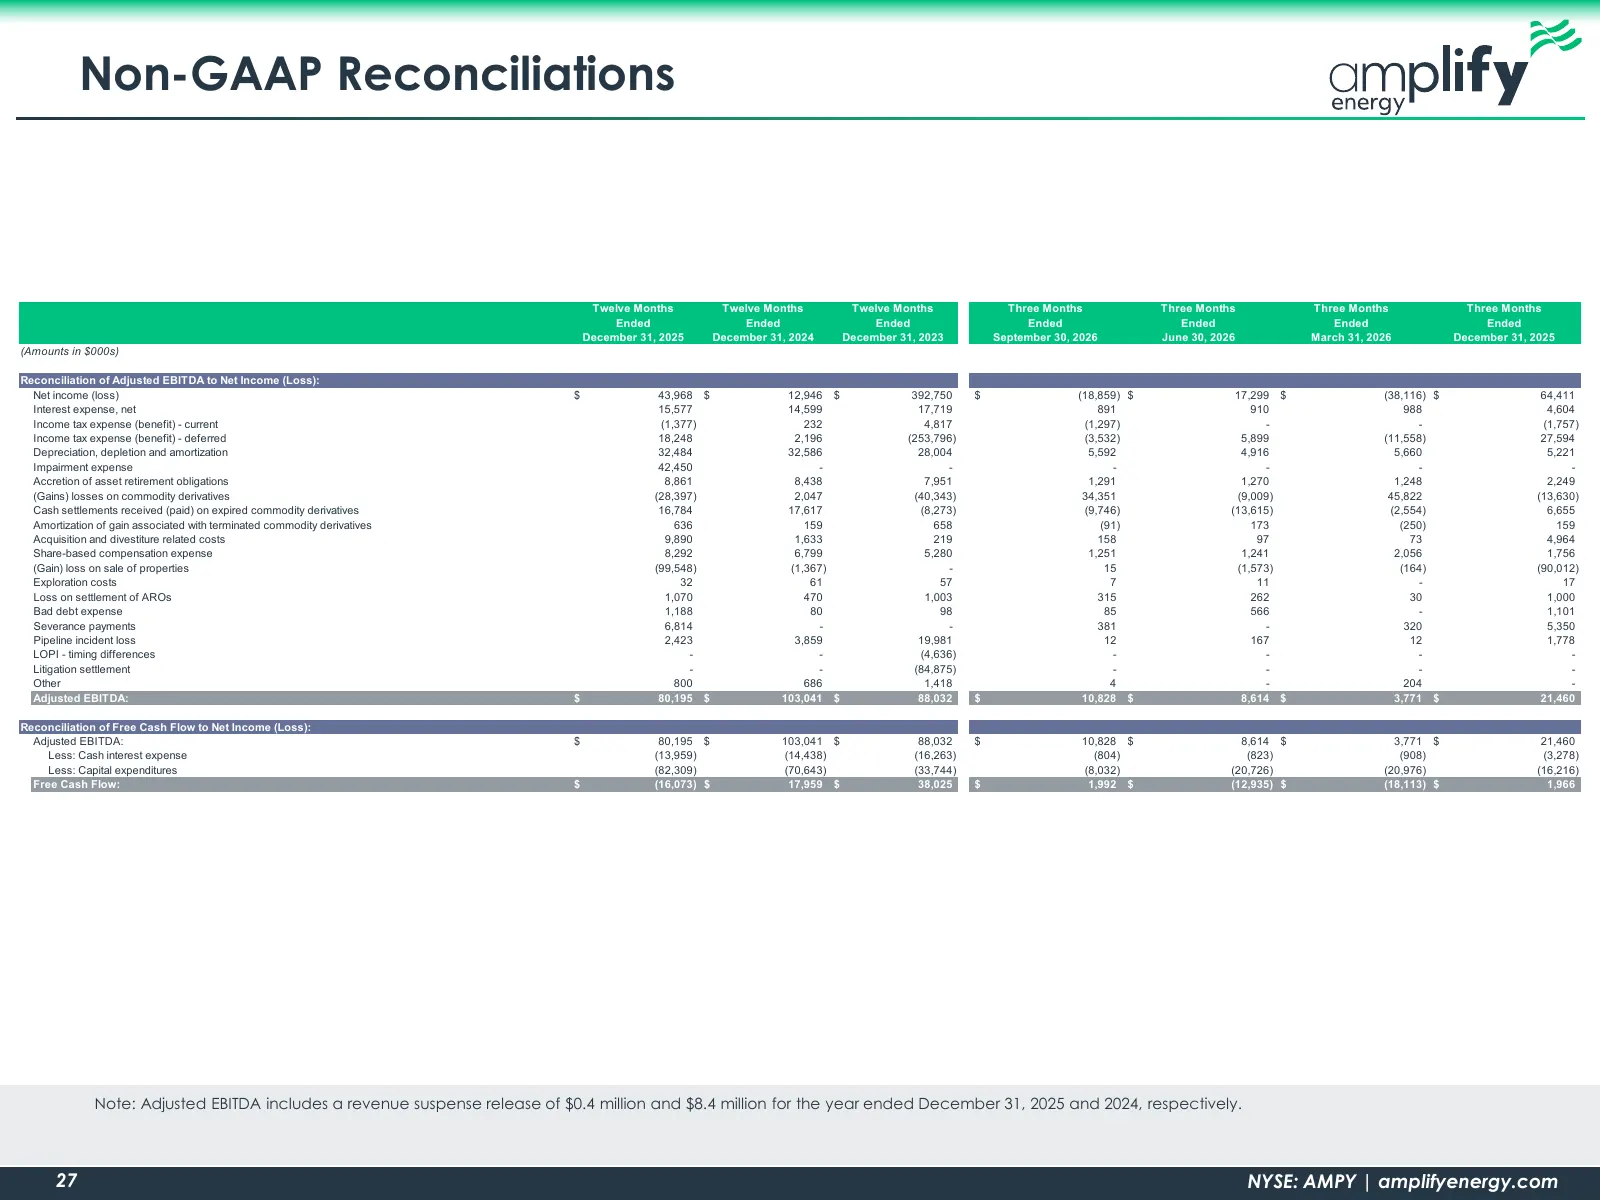
Non-GAAP Reconciliations Twelve Months Twelve Months Twelve Months Three Months Three Months Three Months Three Months Ended Ended Ended Ended Ended Ended Ended December 31, 2025 December 31, 2024 December 31, 2023 September 30, 2026 June 30, 2026 March 31, 2026 December 31, 2025 (Amounts in $000s)
Slide 28: Non-GAAP Reconciliations (Cont'd)
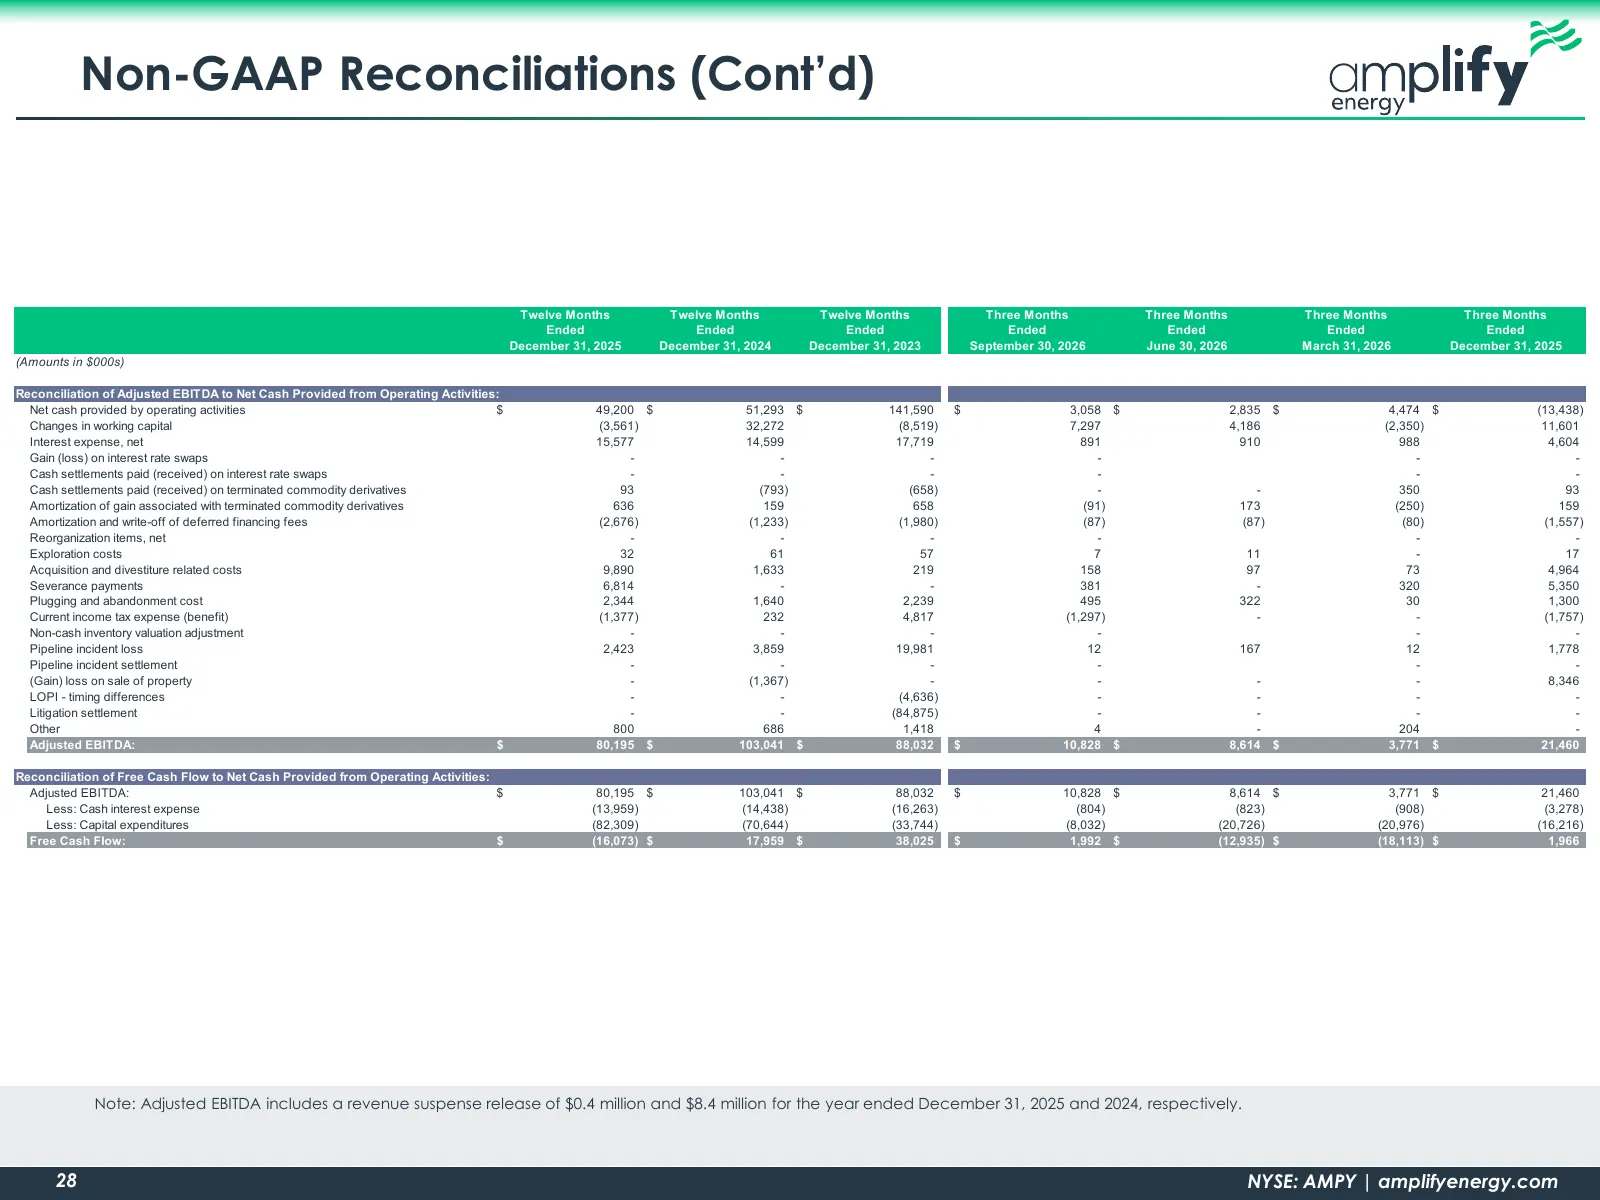
Non-GAAP Reconciliations (Cont’d) Twelve Months Twelve Months Twelve Months Three Months Three Months Three Months Three Months Ended Ended Ended Ended Ended Ended Ended December 31, 2025 December 31, 2024 December 31, 2023 September 30, 2026 June 30, 2026 March 31, 2026 December 31, 2025 (Amounts i
Slide 29: Non-GAAP Reconciliations (Cont'd)
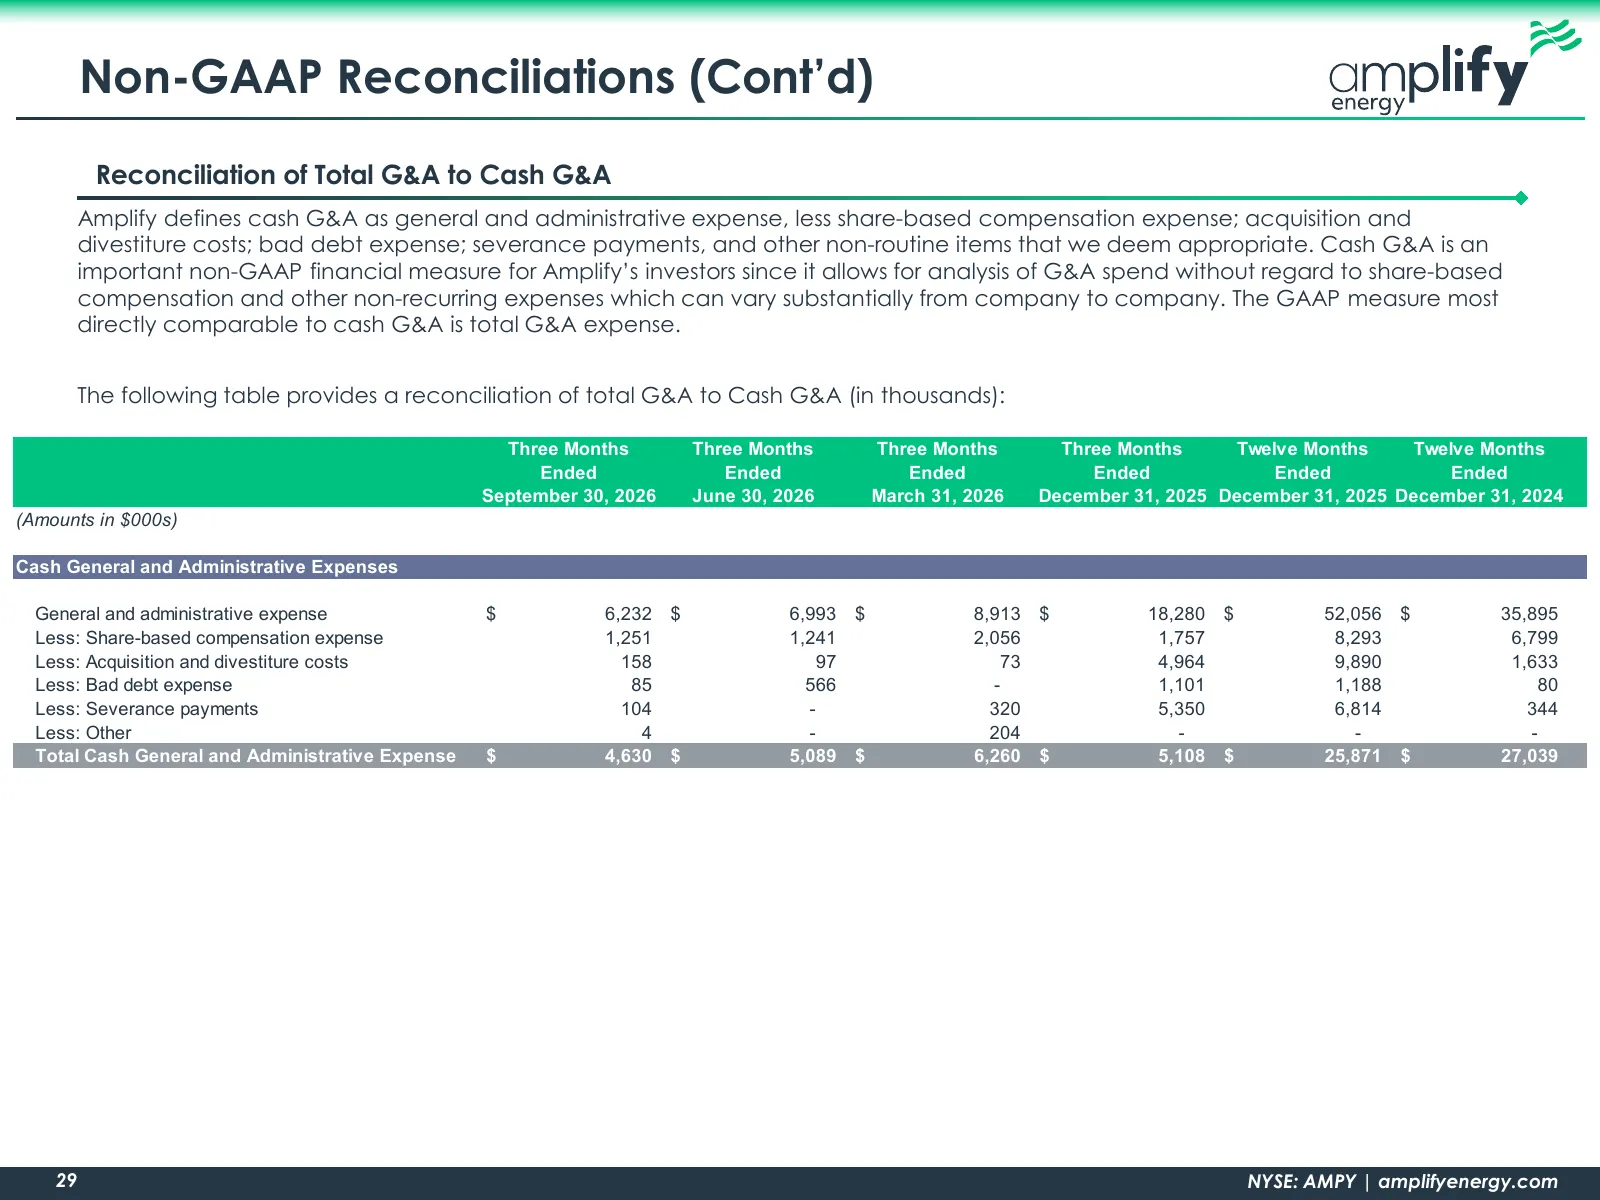
Non-GAAP Reconciliations (Cont’d) Reconciliation of Total G&A to Cash G&A Amplify defines cash G&A as general and administrative expense, less share-based compensation expense; acquisition and divestiture costs; bad debt expense; severance payments, and other non-routine items that we deem appropria
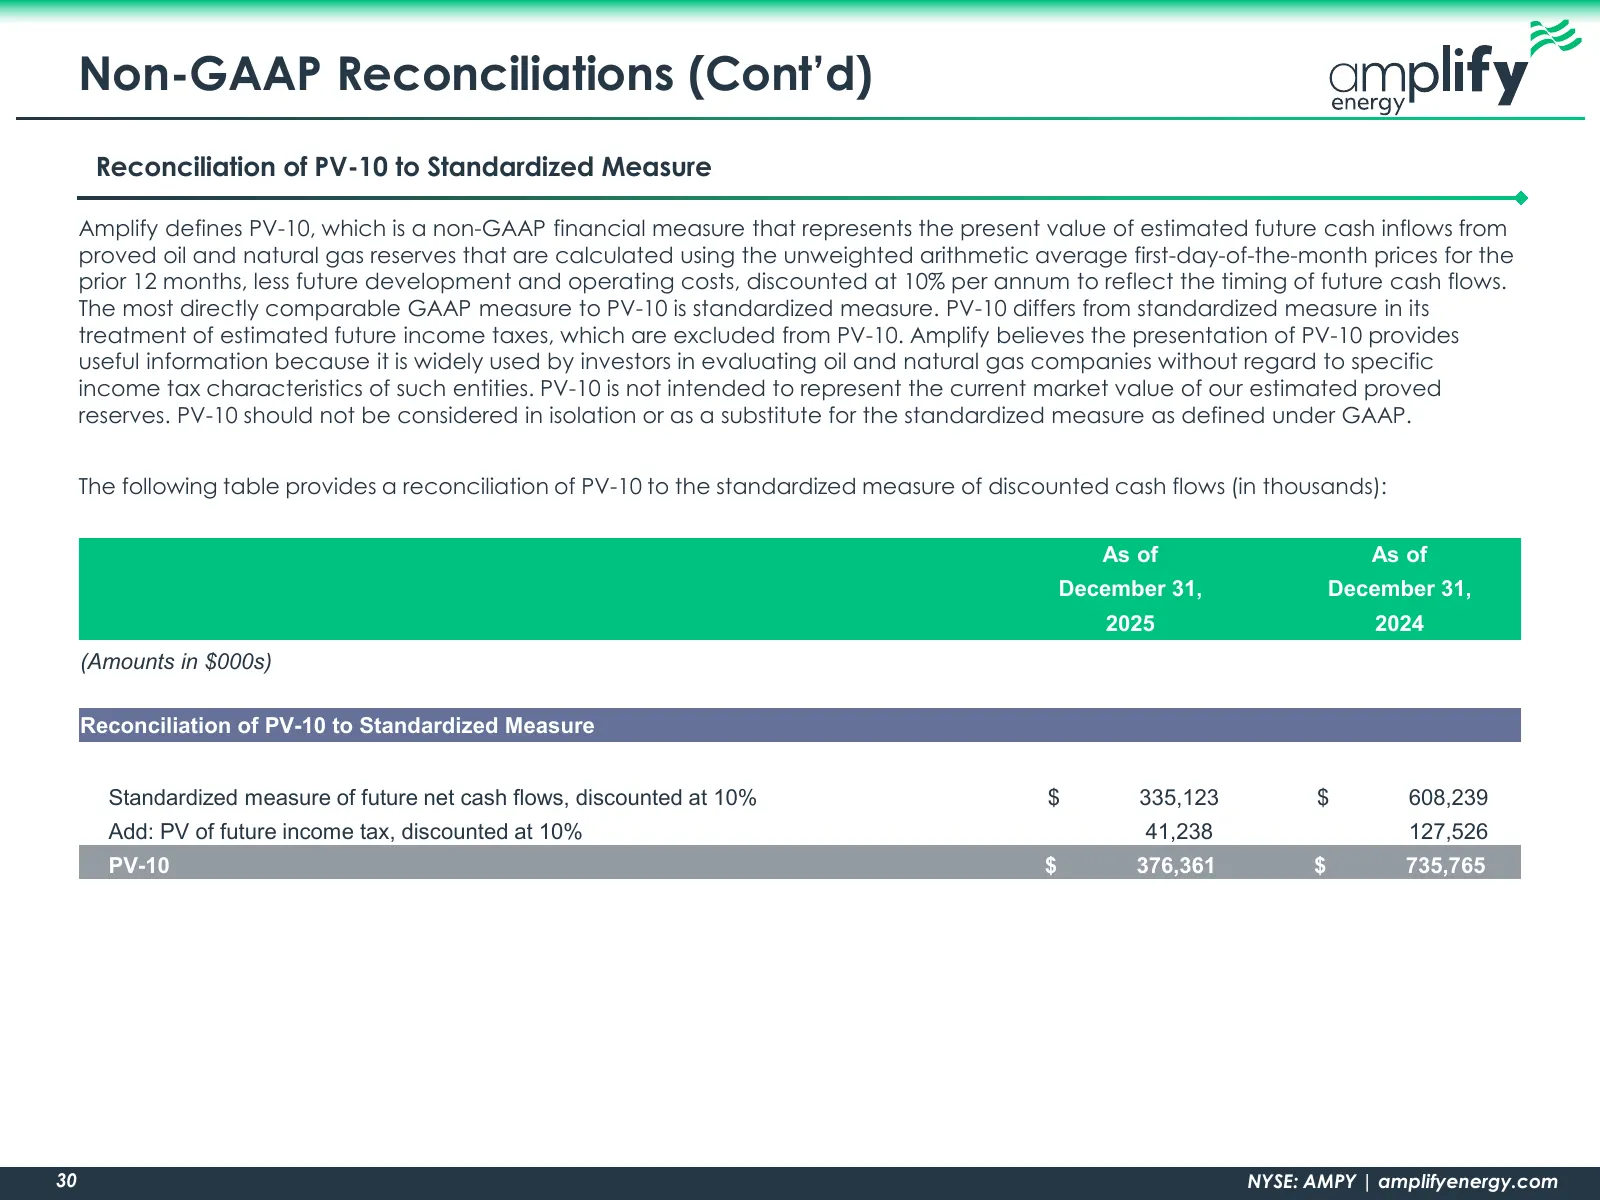
Slide 30: Non-GAAP Reconciliations (Cont'd)
Non-GAAP Reconciliations (Cont’d) Reconciliation of PV-10 to Standardized Measure Amplify defines PV-10, which is a non-GAAP financial measure that represents the present value of estimated future cash inflows from proved oil and natural gas reserves that are calculated using the unweighted arithmet
Slide 31: NYSE: AMPY | amplifyenergy.com
NYSE: AMPY | amplifyenergy.com
Source: company website
More decks from Amplify Energy Corp.
 Q2 2026 Earnings Presentation31 slides · Aug 10, 2026
 Investor Presentation (May 2026)30 slides · May 11, 2026
 Investor Presentation (March 2026)28 slides · Mar 9, 2026
 Investor Presentation (August 2025)28 slides · Aug 6, 2025
 Q1 2025 Earnings Presentation33 slides · May 13, 2025
 Merger or Acquisition (March 2025)16 slides · Mar 25, 2025