Heartland Financial USA — Investor Presentation (August 2021)
38 slides from Heartland Financial USA's investor presentation, Aug 27, 2021
Slide 1: Investor Presentation August 2021
Investor PresentationAugust 2021
Slide 2: Forward-looking statements
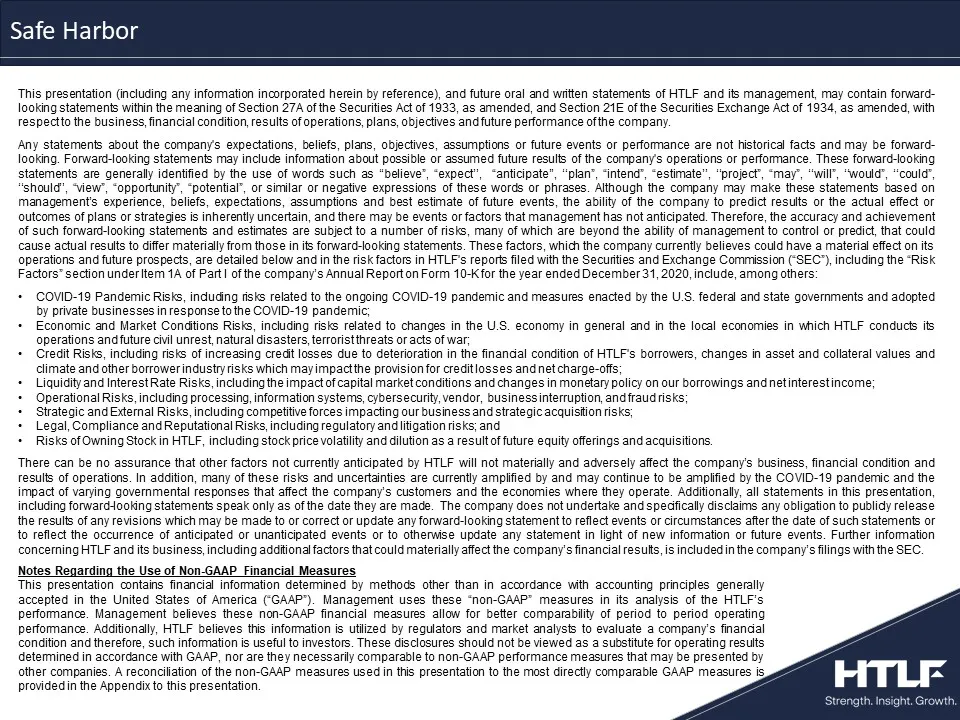
2 This presentation (including any information incorporated herein by reference), and future oral and written statements of HTLF and its management, may contain forward-looking statements within the meaning of Section 27A of the Securities Act of 1933, as amended, and Section 21E of the Securities E
Slide 3: Company Overview – Fiscal 2Q 2021 Financial Highlights
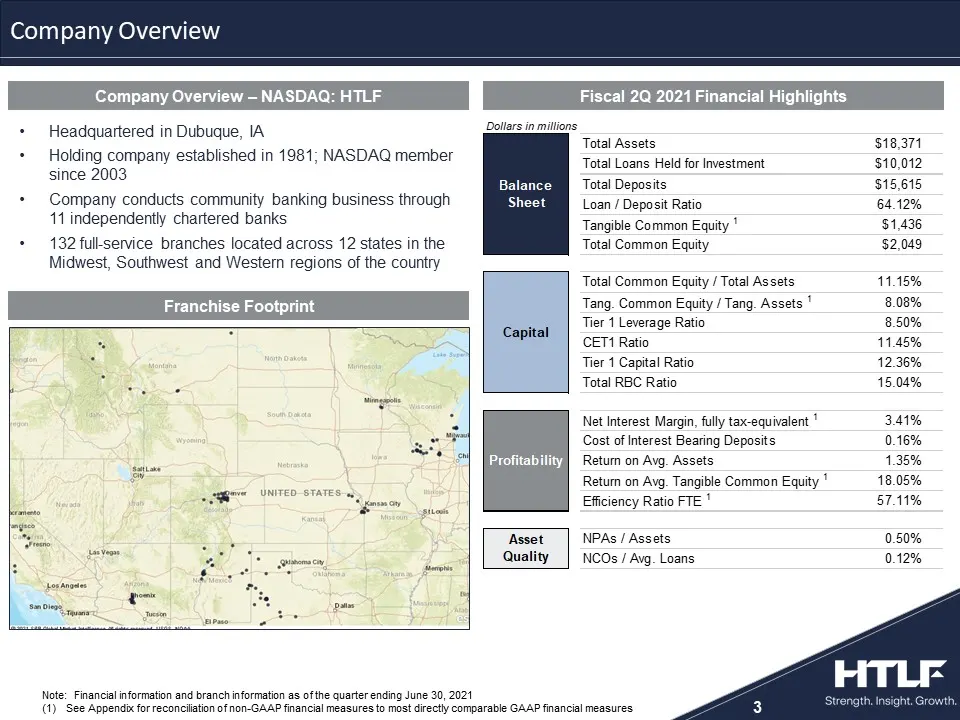
Company Overview 3 Company Overview – NASDAQ: HTLF Fiscal 2Q 2021 Financial Highlights Headquartered in Dubuque, IAHolding company established in 1981; NASDAQ member since 2003Company conducts community banking business through 11 independently chartered banks132 full-service branches located across
Slide 4: Subsidiary Banks by Region
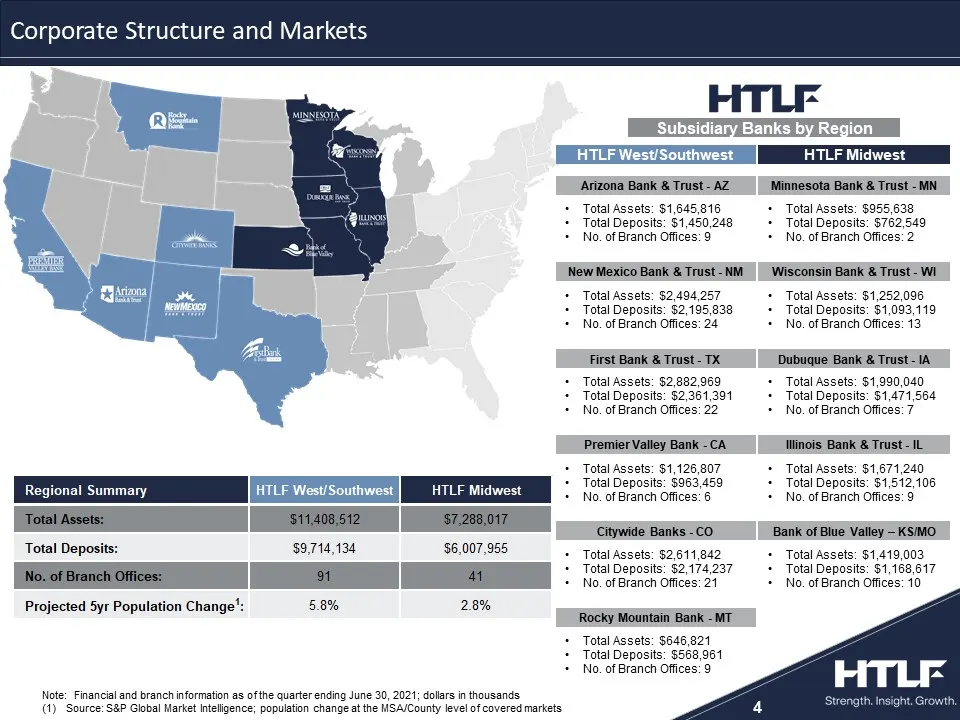
4 Subsidiary Banks by Region Note: Financial and branch information as of the quarter ending June 30, 2021; dollars in thousandsSource: S&P Global Market Intelligence; population change at the MSA/County level of covered markets Bank of Blue Valley – KS/MO Illinois Bank & Trust - IL Minnesota Bank &
Slide 5: Broad footprint enhances profitable growth strategies and diversifies risk
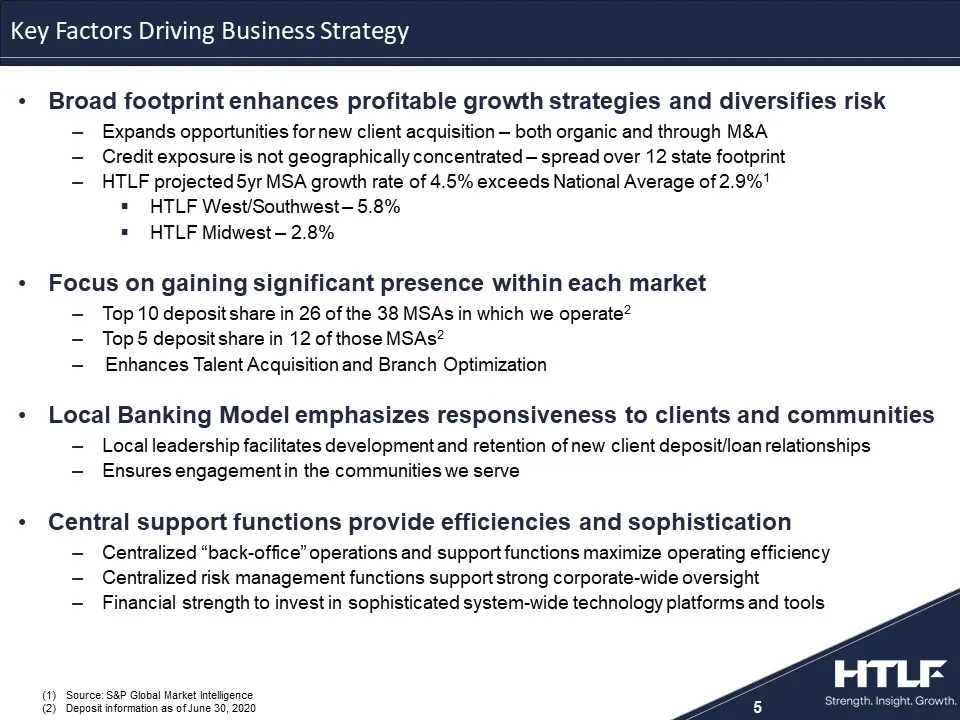
Broad footprint enhances profitable growth strategies and diversifies riskExpands opportunities for new client acquisition – both organic and through M&ACredit exposure is not geographically concentrated – spread over 12 state footprintHTLF projected 5yr MSA growth rate of 4.5% exceeds National Aver
Slide 6: Executive Leadership Team
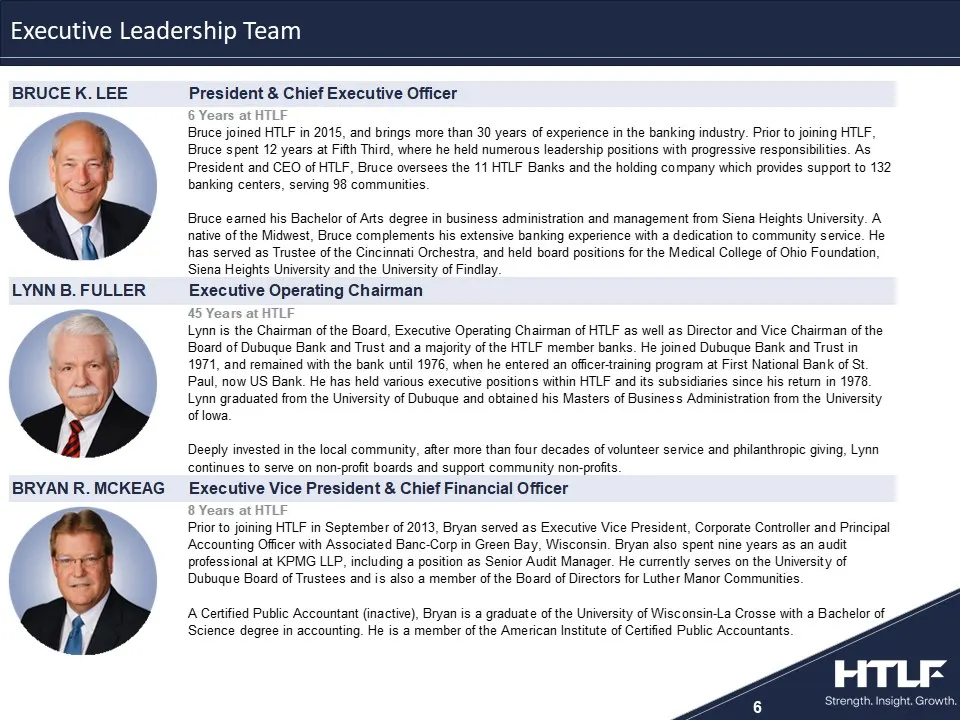
Executive Leadership Team BRUCE K. LEE BRYAN R. MCKEAG President & Chief Executive Officer 6 Years at Bruce joined HTLF in 2015, and brings more than 30 years of experience in the banking industry. Prior to joining HTLF Bruce spent 12 years at Fifth Third, where he held numerous leadership positions
Slide 7: Summary Balance Sheet Items
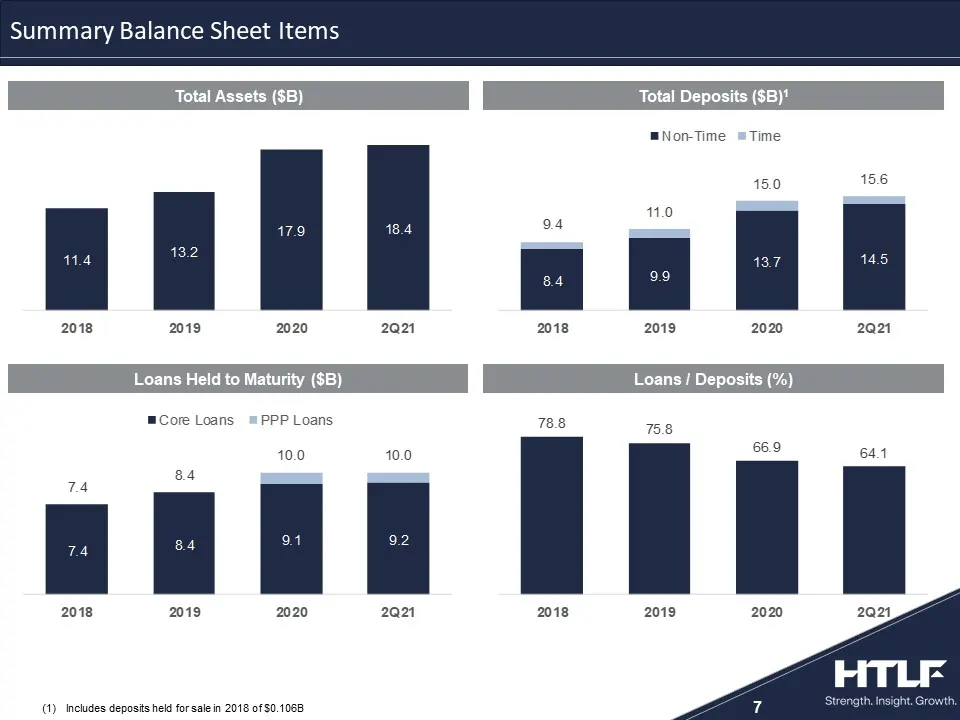
7 Total Assets ($B) Total Deposits ($B)1 Loans Held to Maturity ($B) Loans / Deposits (%) Includes deposits held for sale in 2018 of $0.106B 324268 105140183 167188214 201203205 2108846 223134103 138141143 235236237 1616835 Summary Balance Sheet Items
Slide 8: Summary Profitability Items
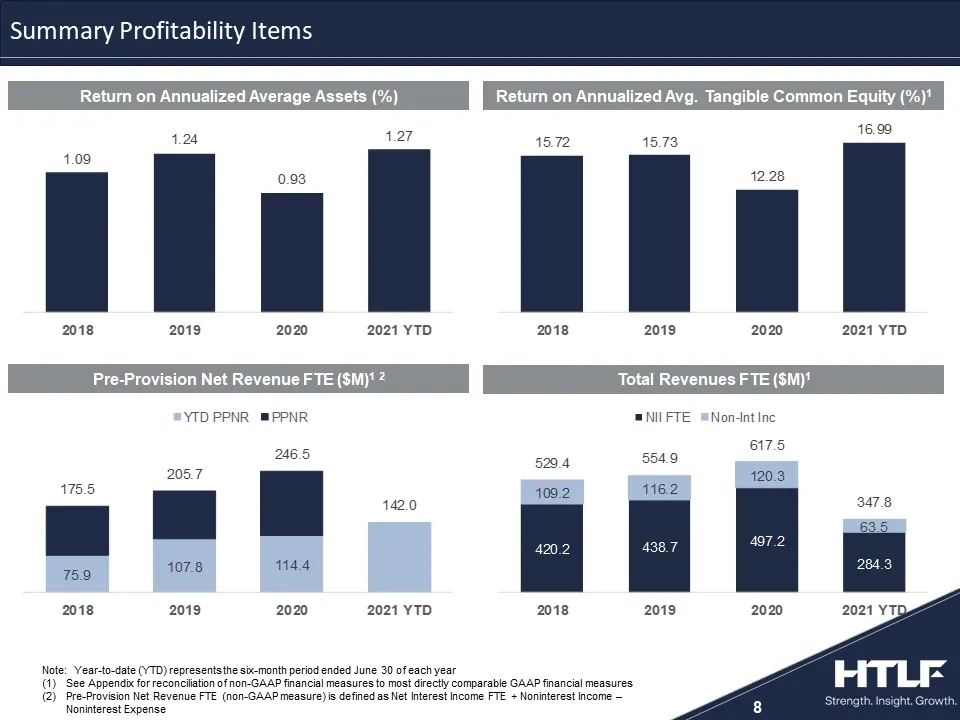
8 Note: Year-to-date (YTD) represents the six-month period ended June 30 of each yearSee Appendix for reconciliation of non-GAAP financial measures to most directly comparable GAAP financial measuresPre-Provision Net Revenue FTE (non-GAAP measure) is defined as Net Interest Income FTE + Noninterest
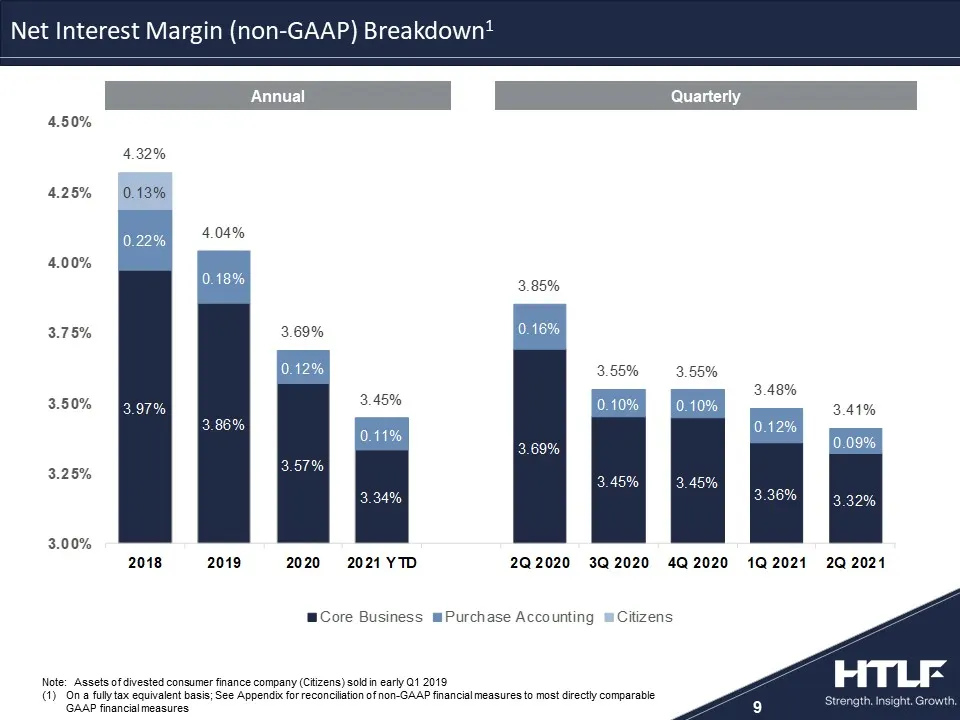
Slide 9: Net Interest Margin Breakdown
9 Note: Assets of divested consumer finance company (Citizens) sold in early Q1 2019On a fully tax equivalent basis; See Appendix for reconciliation of non-GAAP financial measures to most directly comparable GAAP financial measures 324268 105140183 167188214 201203205 2108846 223134103 138141143 235
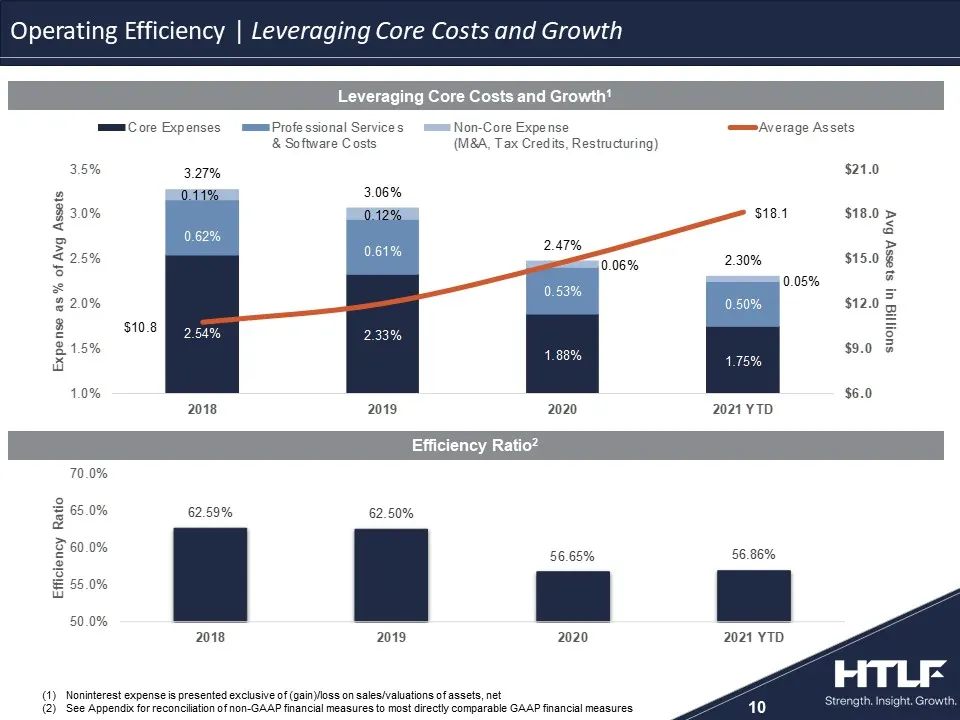
Slide 10: Operating Efficiency | Leveraging Core Costs and Growth
10 324268 105140183 167188214 201203205 2108846 223134103 138141143 235236237 1616835 Leveraging Core Costs and Growth1 Noninterest expense is presented exclusive of (gain)/loss on sales/valuations of assets, netSee Appendix for reconciliation of non-GAAP financial measures to most directly comparab
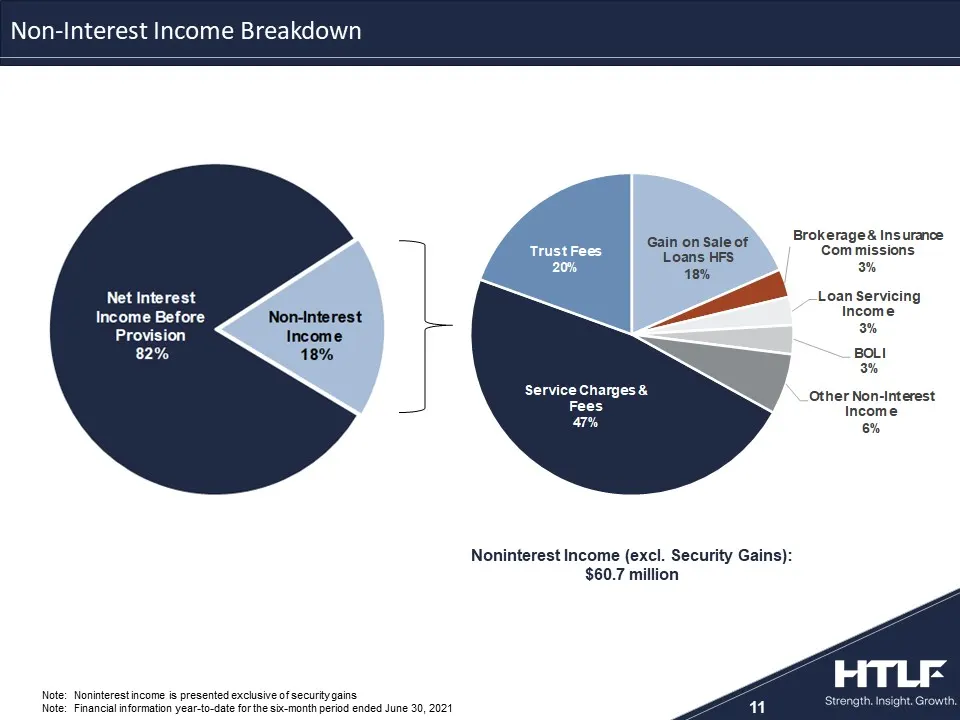
Slide 11: Non-Interest Income Breakdown
11 Note: Noninterest income is presented exclusive of security gainsNote: Financial information year-to-date for the six-month period ended June 30, 2021 324268 105140183 167188214 201203205 2108846 223134103 138141143 235236237 1616835 Non-Interest Income Breakdown Noninterest Income (excl. Securit
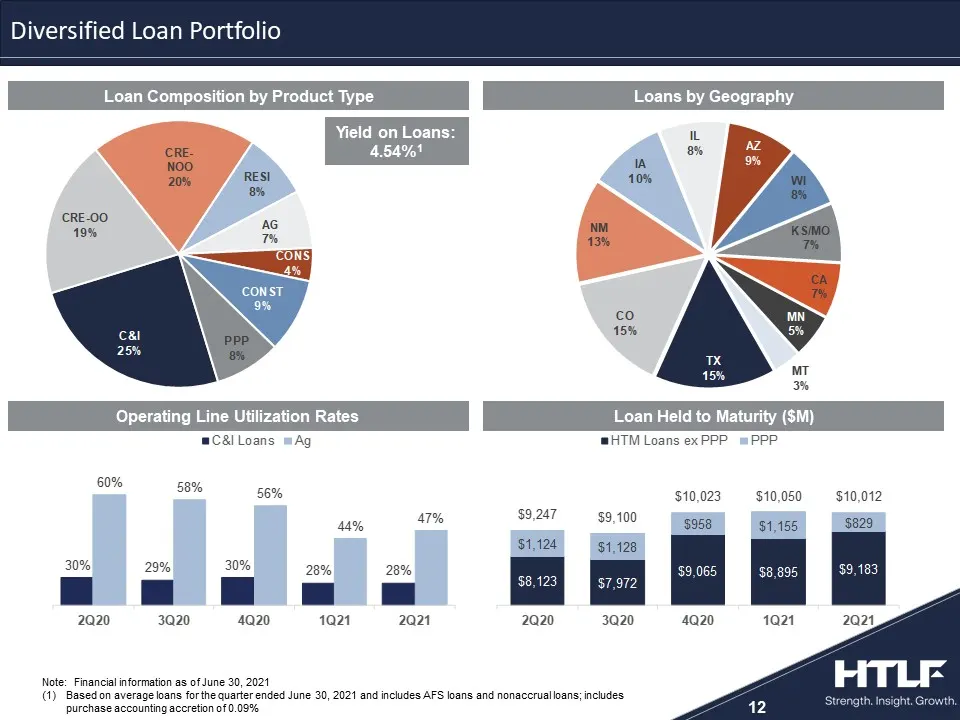
Slide 12: Diversified Loan Portfolio
12 Loan Held to Maturity ($M) Note: Financial information as of June 30, 2021Based on average loans for the quarter ended June 30, 2021 and includes AFS loans and nonaccrual loans; includes purchase accounting accretion of 0.09% Yield on Loans: 4.54%1 324268 105140183 167188214 201203205 2108846 223
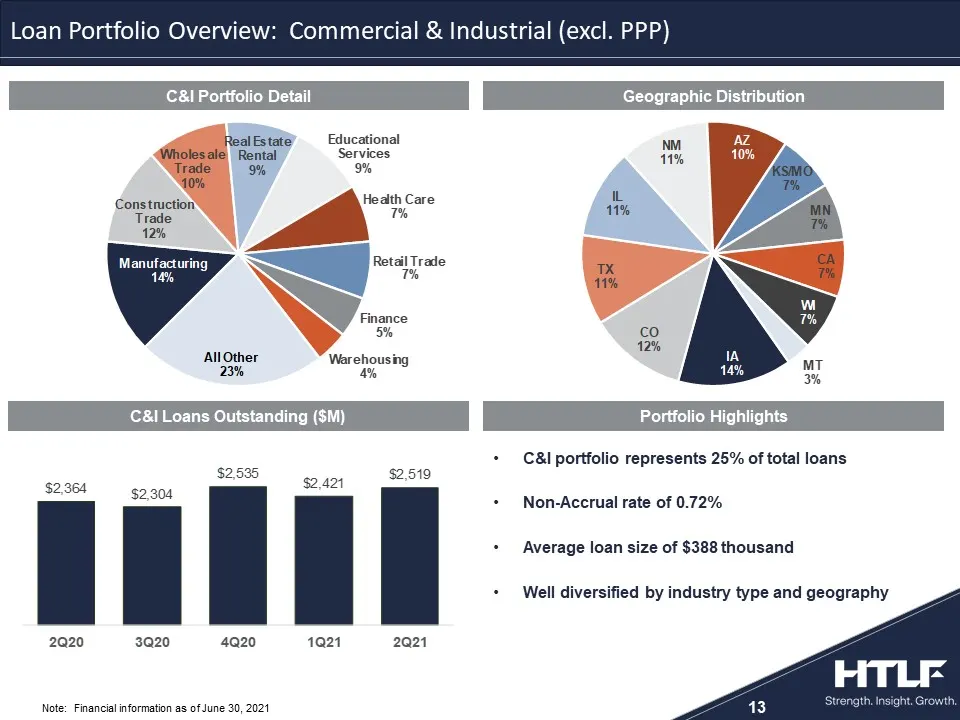
Slide 13: Loan Portfolio Overview: Commercial & Industrial
C&I portfolio represents 25% of total loansNon-Accrual rate of 0.72%Average loan size of $388 thousandWell diversified by industry type and geography 13 Note: Financial information as of June 30, 2021 324268 105140183 167188214 201203205 2108846 223134103 138141143 235236237 1616835 Loan Portfolio O
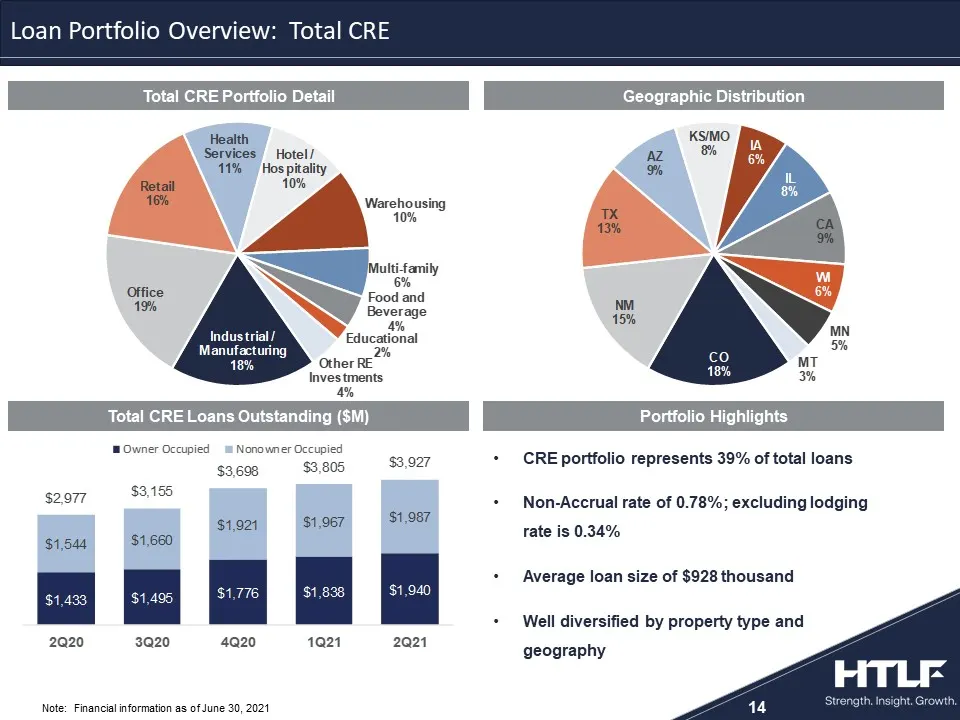
Slide 14: Loan Portfolio Overview: Total CRE
CRE portfolio represents 39% of total loansNon-Accrual rate of 0.78%; excluding lodging rate is 0.34%Average loan size of $928 thousandWell diversified by property type and geography 14 Note: Financial information as of June 30, 2021 324268 105140183 167188214 201203205 2108846 223134103 138141143 2
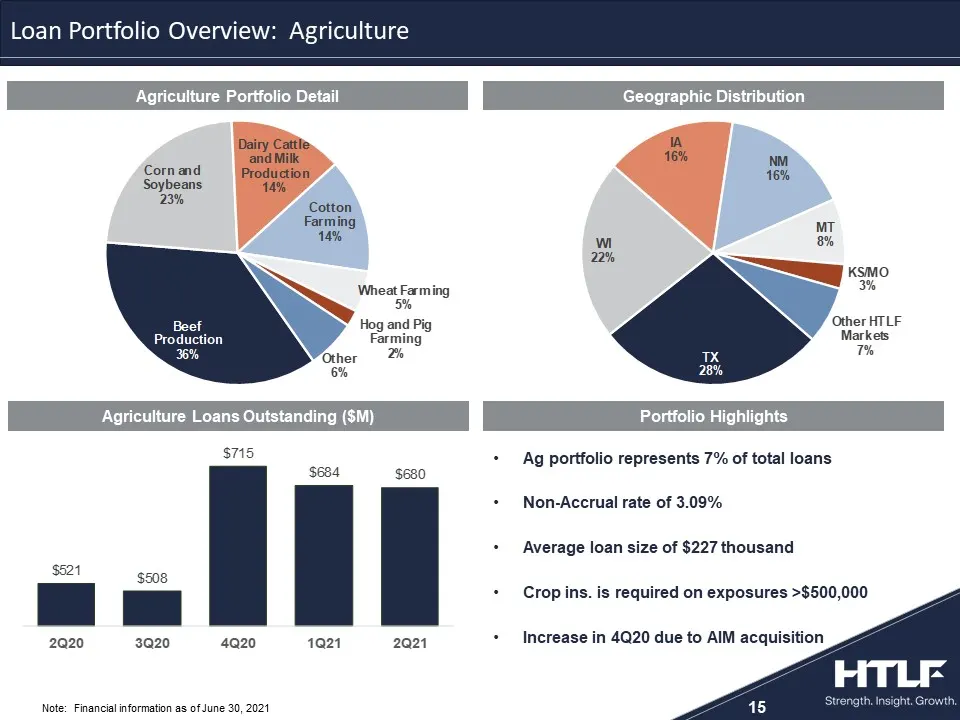
Slide 15: Loan Portfolio Overview: Agriculture
Ag portfolio represents 7% of total loansNon-Accrual rate of 3.09%Average loan size of $227 thousandCrop ins. is required on exposures >$500,000Increase in 4Q20 due to AIM acquisition 15 Note: Financial information as of June 30, 2021 324268 105140183 167188214 201203205 2108846 223134103 138141143
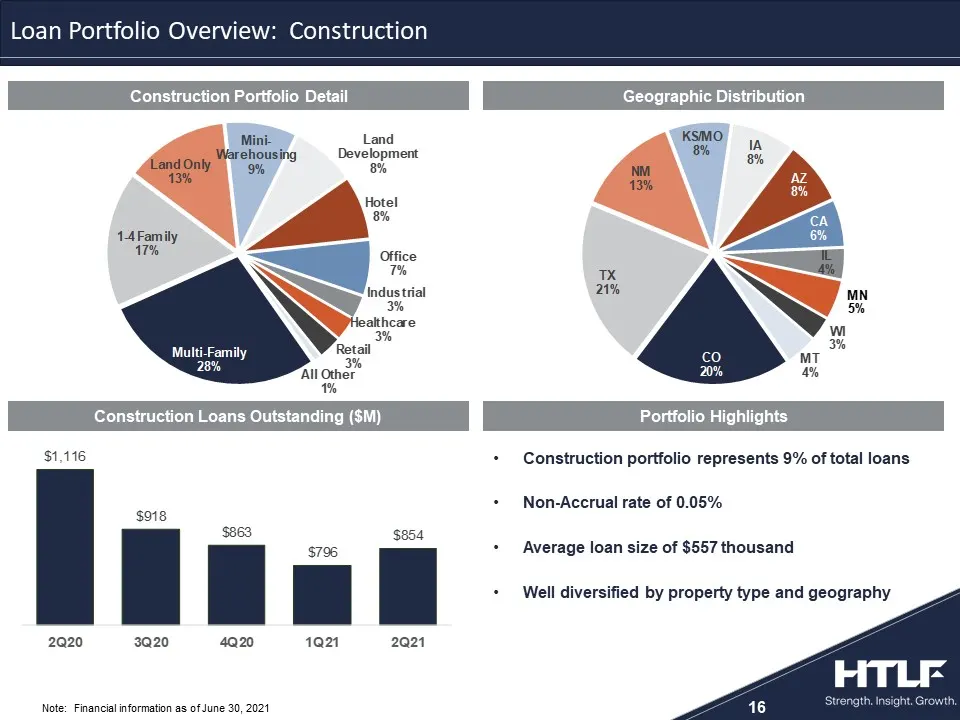
Slide 16: Loan Portfolio Overview: Construction
Construction portfolio represents 9% of total loansNon-Accrual rate of 0.05%Average loan size of $557 thousandWell diversified by property type and geography 16 Note: Financial information as of June 30, 2021 324268 105140183 167188214 201203205 2108846 223134103 138141143 235236237 1616835 Loan Por
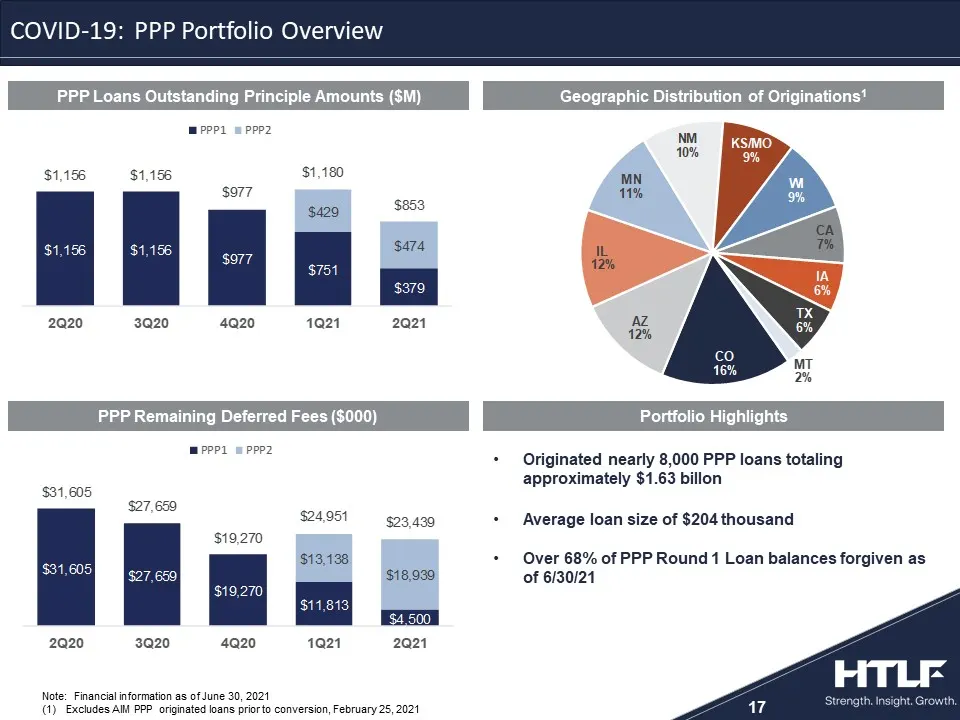
Slide 17: COVID-19: PPP Portfolio Overview
Originated nearly 8,000 PPP loans totaling approximately $1.63 billonAverage loan size of $204 thousandOver 68% of PPP Round 1 Loan balances forgiven as of 6/30/21 17 Note: Financial information as of June 30, 2021Excludes AIM PPP originated loans prior to conversion, February 25, 2021 324268 105140
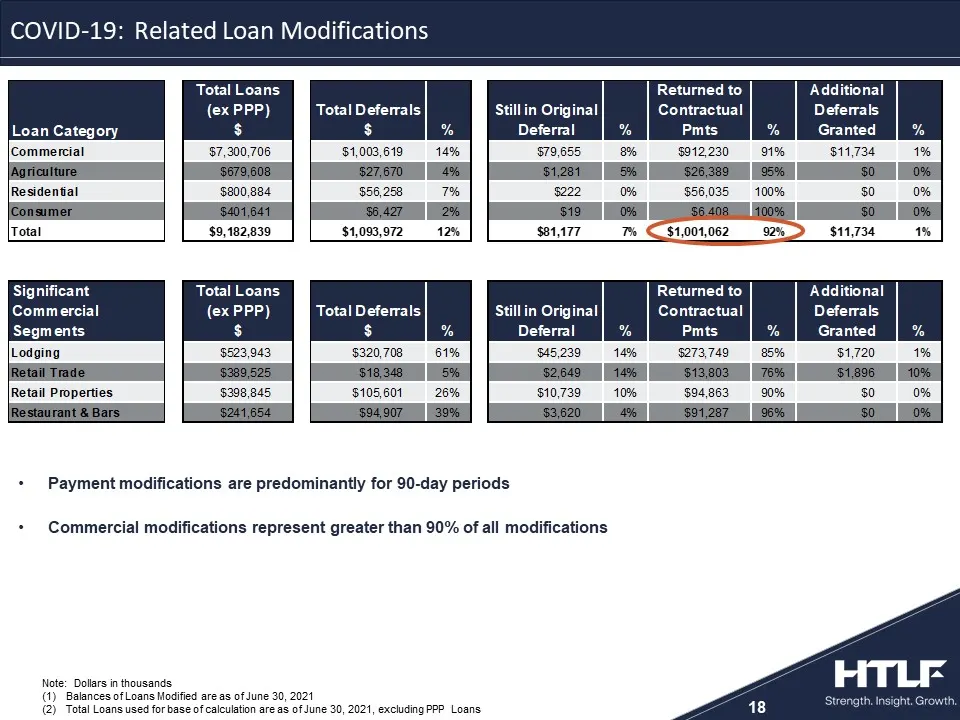
Slide 18: COVID-19: Related Loan Modifications
18 Payment modifications are predominantly for 90-day periodsCommercial modifications represent greater than 90% of all modifications Note: Dollars in thousandsBalances of Loans Modified are as of June 30, 2021Total Loans used for base of calculation are as of June 30, 2021, excluding PPP Loans 3242
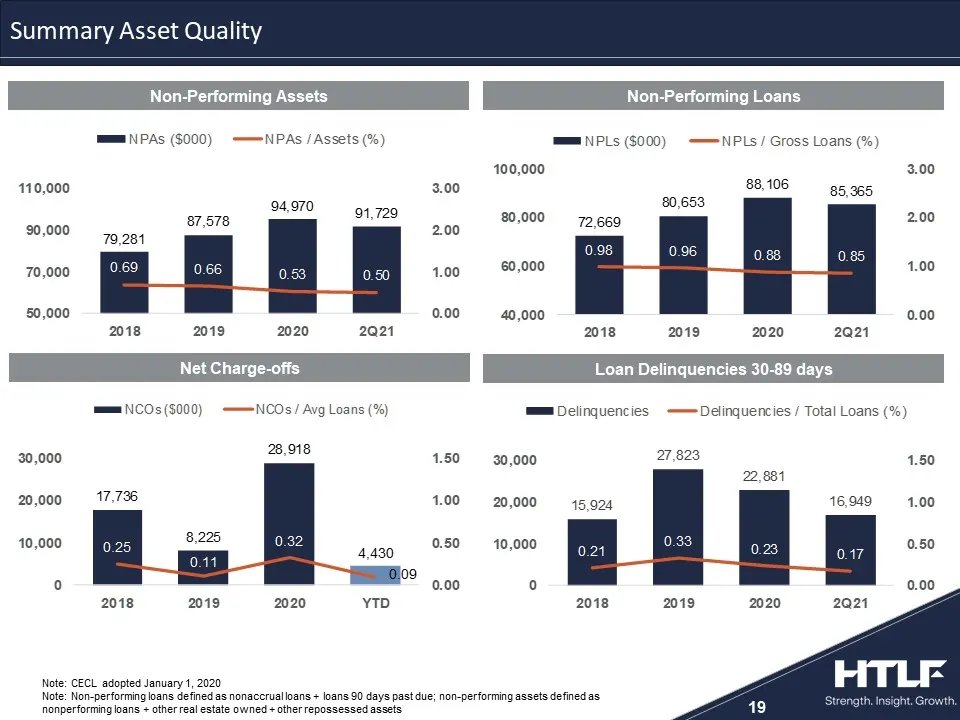
Slide 19: Summary Asset Quality
19 Note: CECL adopted January 1, 2020Note: Non-performing loans defined as nonaccrual loans + loans 90 days past due; non-performing assets defined as nonperforming loans + other real estate owned + other repossessed assets 324268 105140183 167188214 201203205 2108846 223134103 138141143 235236237 1
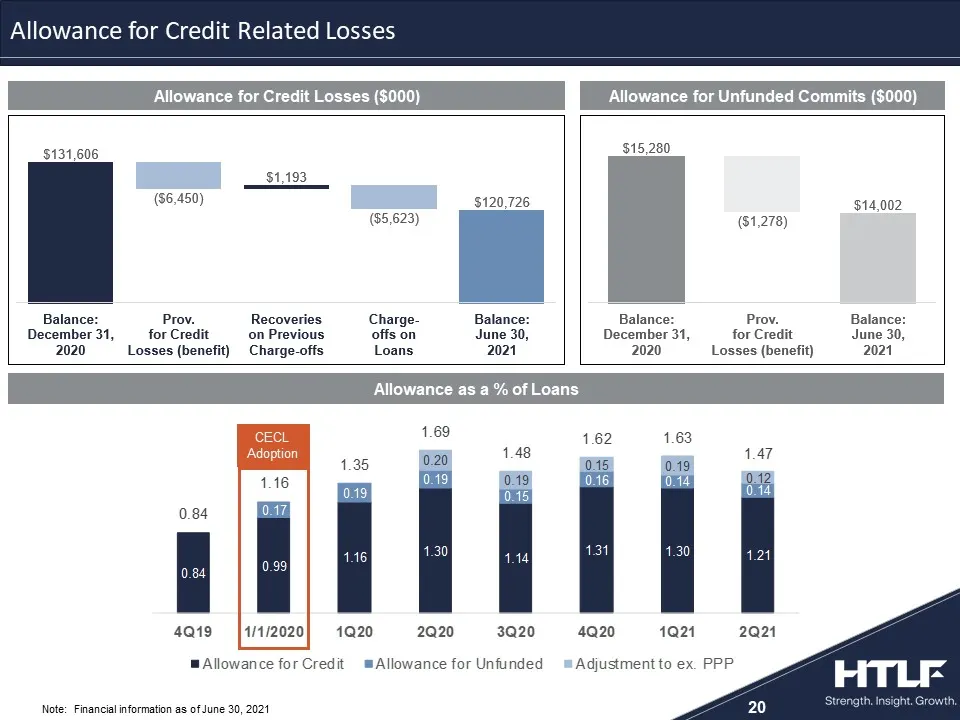
Slide 20: Allowance for Credit Related Losses
Allowance for Credit Losses ($000) Allowance for Unfunded Commits ($000) 20 Note: Financial information as of June 30, 2021 324268 105140183 167188214 201203205 2108846 223134103 138141143 235236237 1616835 CECLAdoption Allowance as a % of Loans Allowance for Credit Related Losses
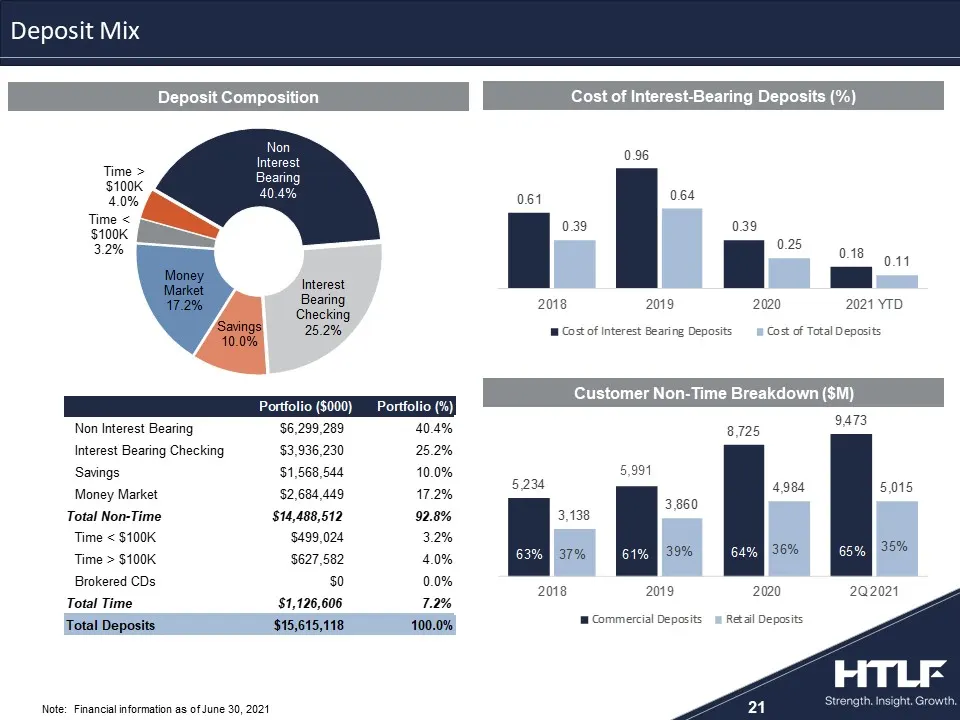
Slide 21: Deposit Composition
Deposit Composition Cost of Interest-Bearing Deposits (%) Customer Non-Time Breakdown ($M) 21 Note: Financial information as of June 30, 2021 324268 105140183 167188214 201203205 2108846 223134103 138141143 235236237 1616835 Deposit Mix 5,991
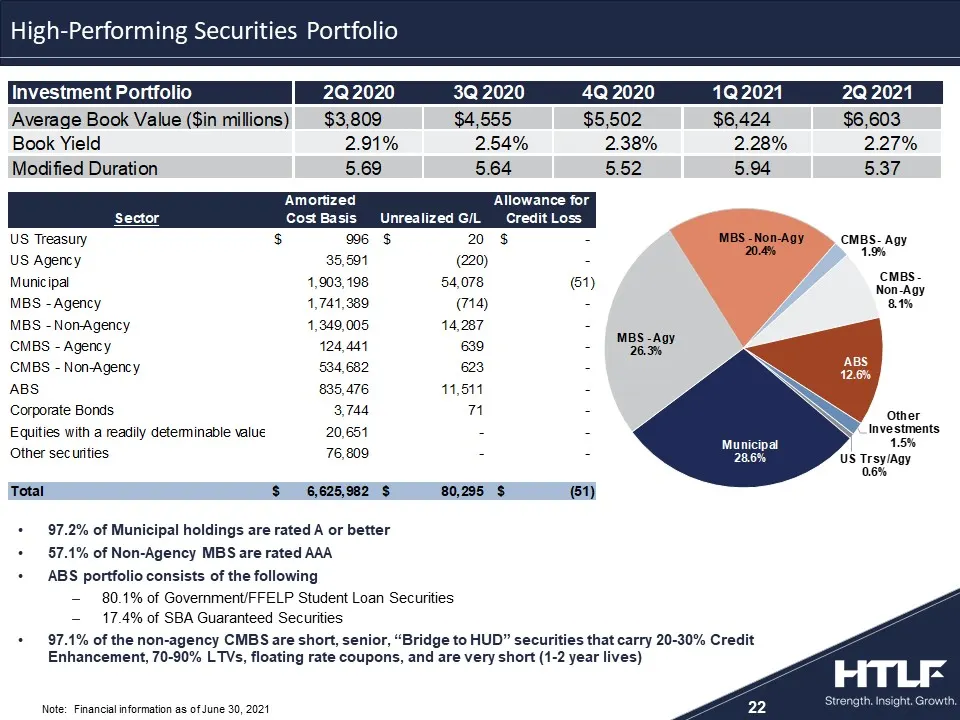
Slide 22: High-Performing Securities Portfolio
22 97.2% of Municipal holdings are rated A or better57.1% of Non-Agency MBS are rated AAAABS portfolio consists of the following80.1% of Government/FFELP Student Loan Securities17.4% of SBA Guaranteed Securities97.1% of the non-agency CMBS are short, senior, “Bridge to HUD” securities that carry 20-
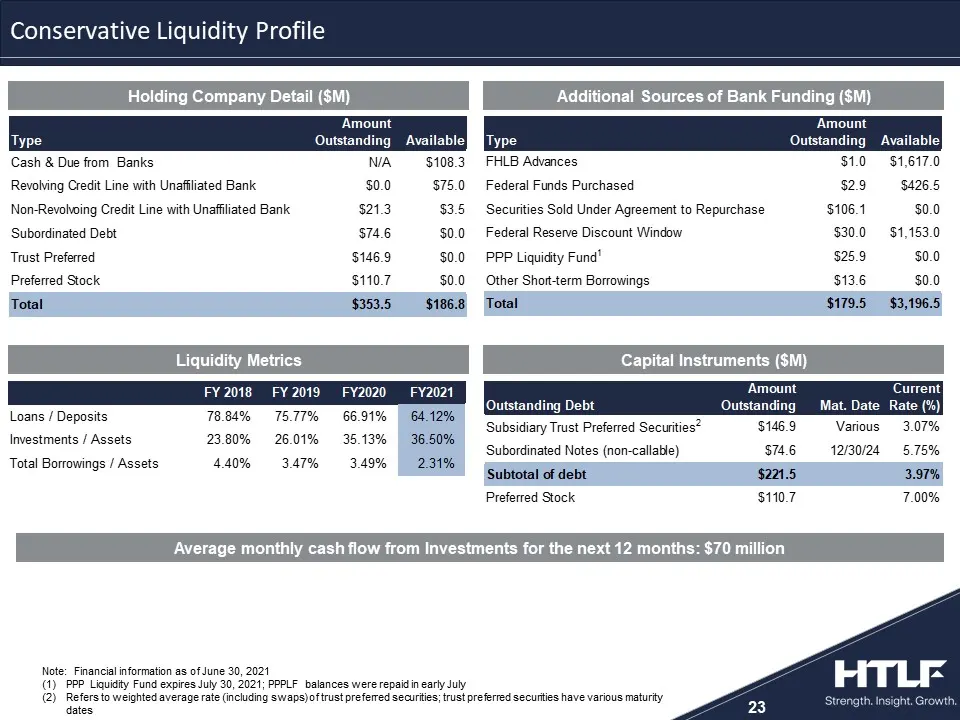
Slide 23: Conservative Liquidity Profile
23 Average monthly cash flow from Investments for the next 12 months: $70 million Capital Instruments ($M) Liquidity Metrics Note: Financial information as of June 30, 2021PPP Liquidity Fund expires July 30, 2021; PPPLF balances were repaid in early JulyRefers to weighted average rate (including swa
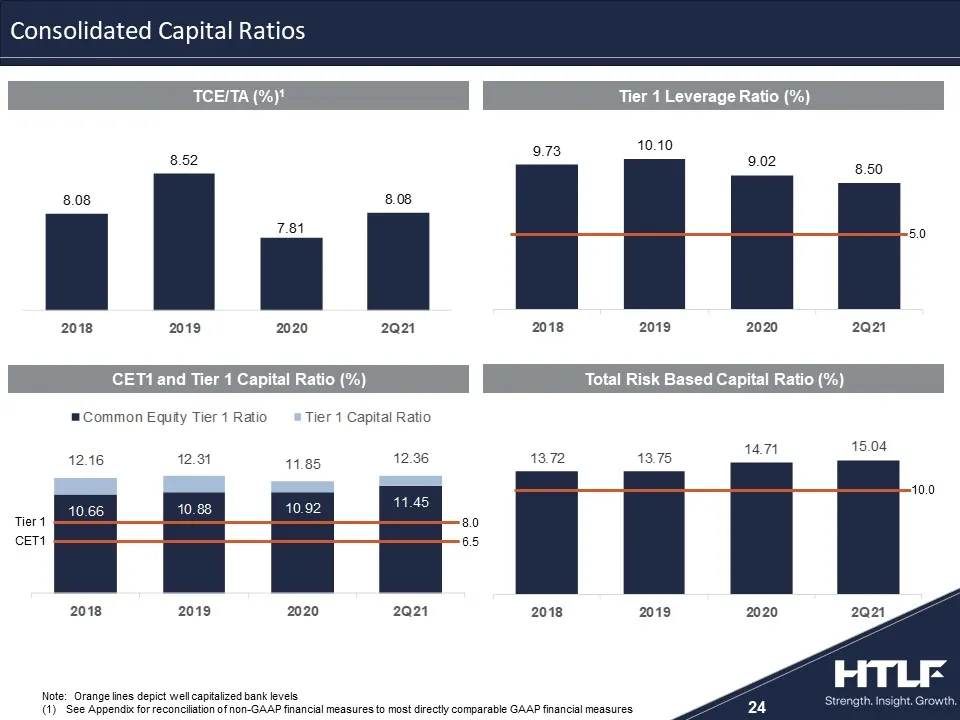
Slide 24: Consolidated Capital Ratios
Total Risk Based Capital Ratio (%) 24 10.0 CET1 and Tier 1 Capital Ratio (%) Tier 1 CET1 8.0 6.5 Note: Orange lines depict well capitalized bank levelsSee Appendix for reconciliation of non-GAAP financial measures to most directly comparable GAAP financial measures 5.0 324268 105140183 167188214 201
Slide 25: Summary
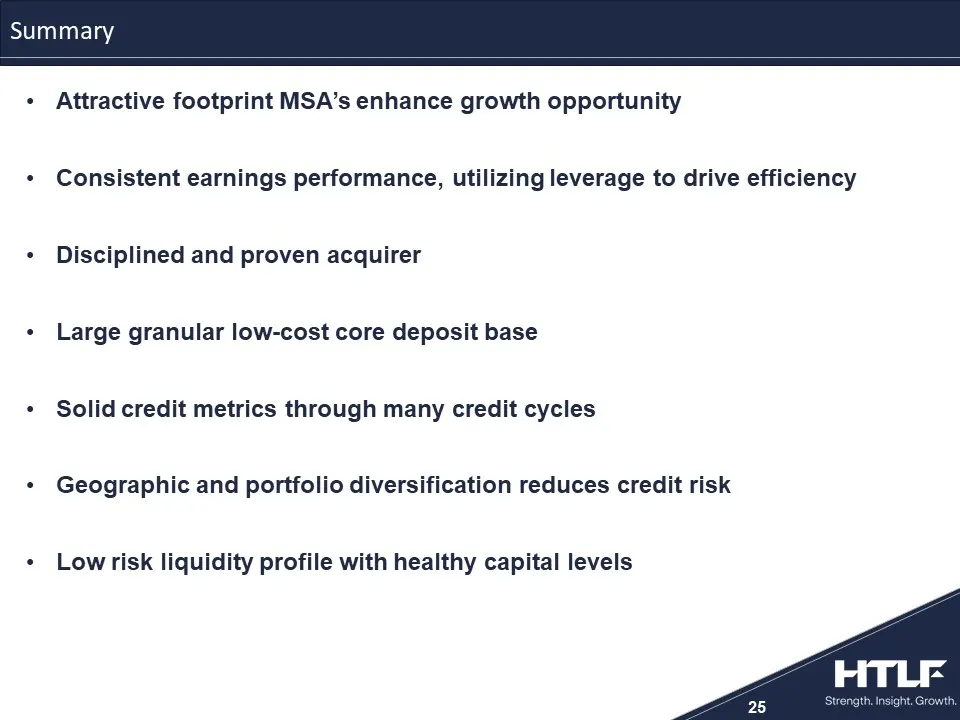
25 Attractive footprint MSA’s enhance growth opportunityConsistent earnings performance, utilizing leverage to drive efficiencyDisciplined and proven acquirerLarge granular low-cost core deposit baseSolid credit metrics through many credit cyclesGeographic and portfolio diversification reduces credi
Slide 26: Appendix
Appendix ...

Slide 27: HTLF Excellence Recognition
27 Note: 2021 Forbes Media LLC, used with permission 324268 105140183 167188214 201203205 2108846 223134103 138141143 235236237 1616835 AMONG THE HIGHEST PURCHASE VOLUME GROWTH FOR VISA® COMMERCIAL CARD ISSUERS2015 | 2016 | 20172018 | 2019 | 2020 Forbes Best Bank in America2013 | 2017 | 2018 2019 |

Slide 28: We See Growth Everywhere
Values and Guiding PrinciplesIntegrity – Always do the right thing. Be honest and open.Accountability – Keep your promises, follow through and follow up. Community – Engage your community and your team. Unlock the potential around you.Excellence – Exceed expectations – every customer, every time. St
Slide 29: Powered by HTLF
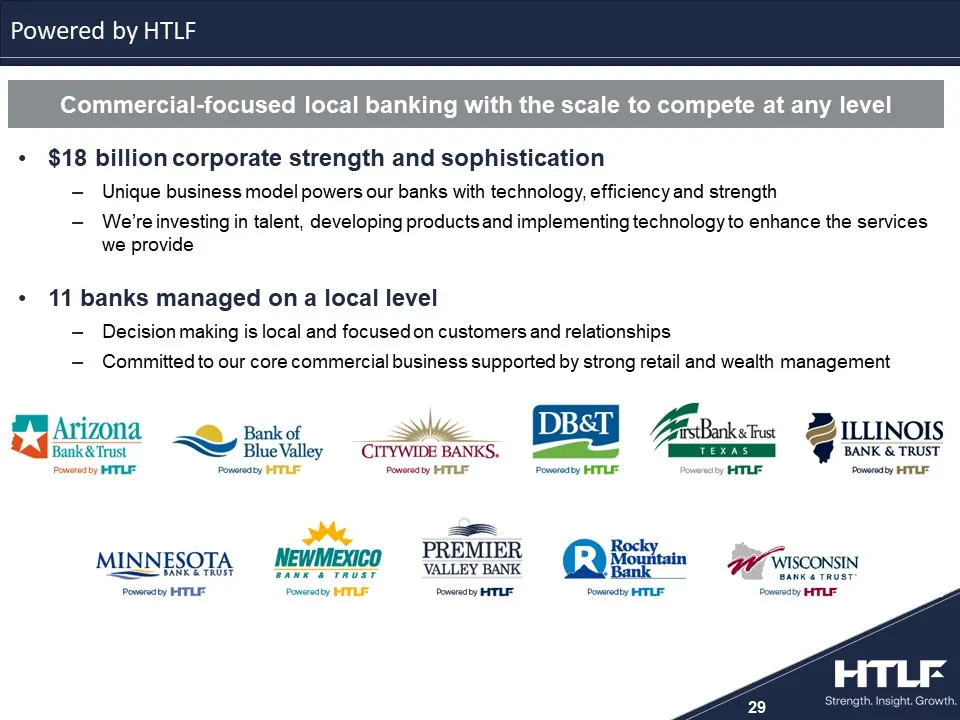
$18 billion corporate strength and sophistication Unique business model powers our banks with technology, efficiency and strengthWe’re investing in talent, developing products and implementing technology to enhance the services we provide11 banks managed on a local levelDecision making is local and
Slide 30: HTLF Interest Rate Risk Management and Sensitivity
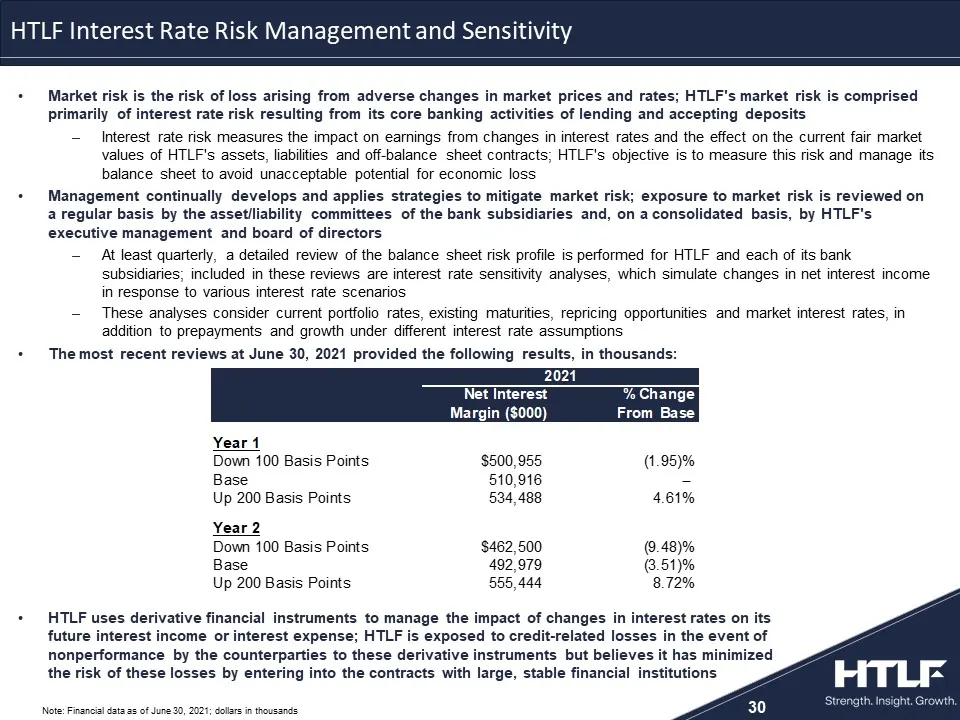
30 324268 105140183 167188214 201203205 2108846 223134103 138141143 235236237 1616835 HTLF Interest Rate Risk Management and Sensitivity Market risk is the risk of loss arising from adverse changes in market prices and rates; HTLF's market risk is comprised primarily of interest rate risk resulting
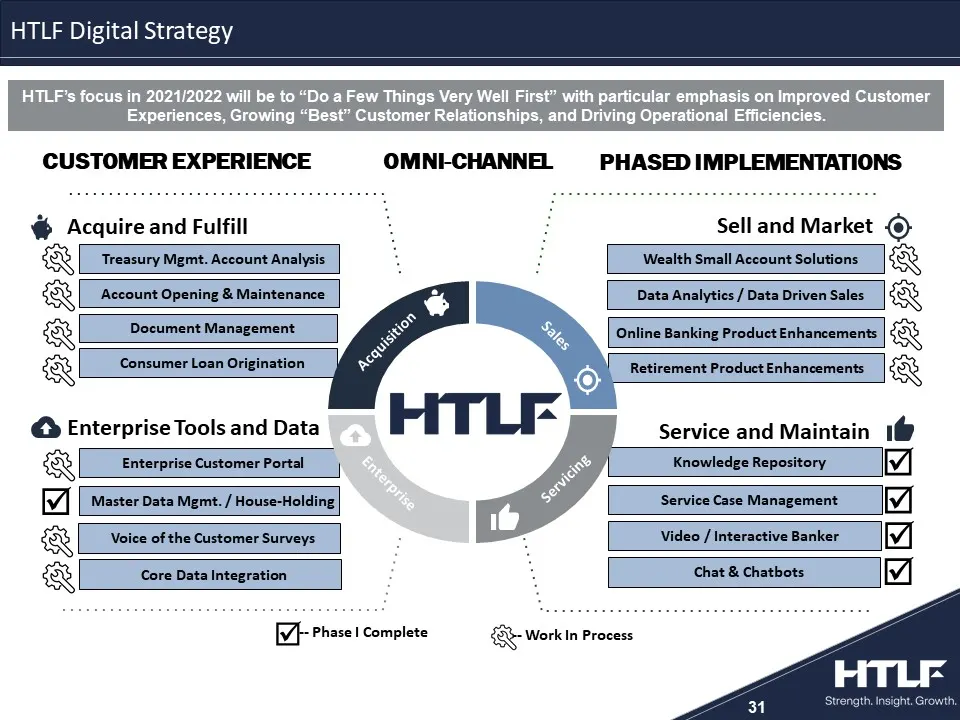
Slide 31: HTLF Digital Strategy
31 324268 105140183 167188214 201203205 2108846 223134103 138141143 235236237 1616835 Retirement Product Enhancements Online Banking Product Enhancements Document Management Consumer Loan Origination Account Opening & Maintenance Enterprise Tools and Data Acquire and Fulfill Sell and Market Service
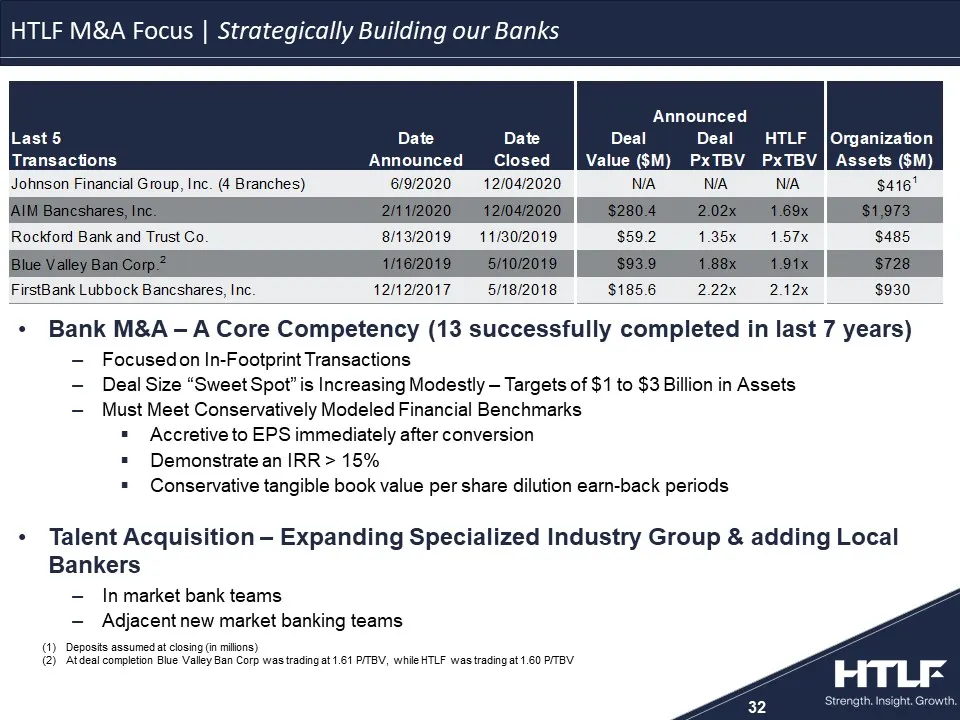
Slide 32: HTLF M&A Focus | Strategically Building our Banks
32 Deposits assumed at closing (in millions)At deal completion Blue Valley Ban Corp was trading at 1.61 P/TBV, while HTLF was trading at 1.60 P/TBV 324268 105140183 167188214 201203205 2108846 223134103 138141143 235236237 1616835 Bank M&A – A Core Competency (13 successfully completed in last 7 yea
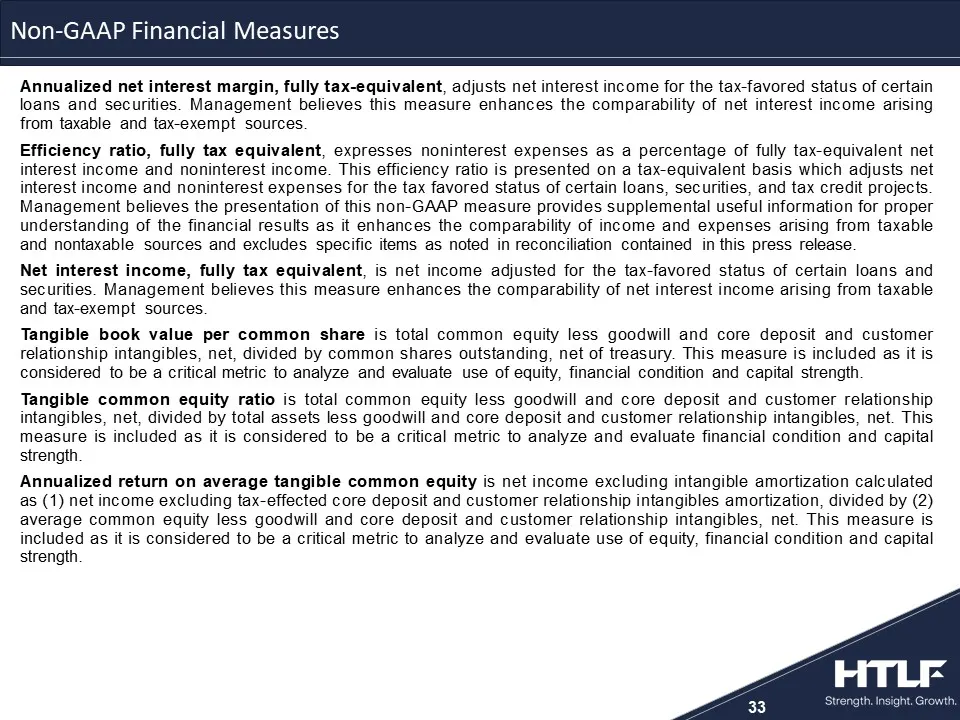
Slide 33: Non-GAAP measure definitions
33 Annualized net interest margin, fully tax-equivalent, adjusts net interest income for the tax-favored status of certain loans and securities. Management believes this measure enhances the comparability of net interest income arising from taxable and tax-exempt sources.Efficiency ratio, fully tax
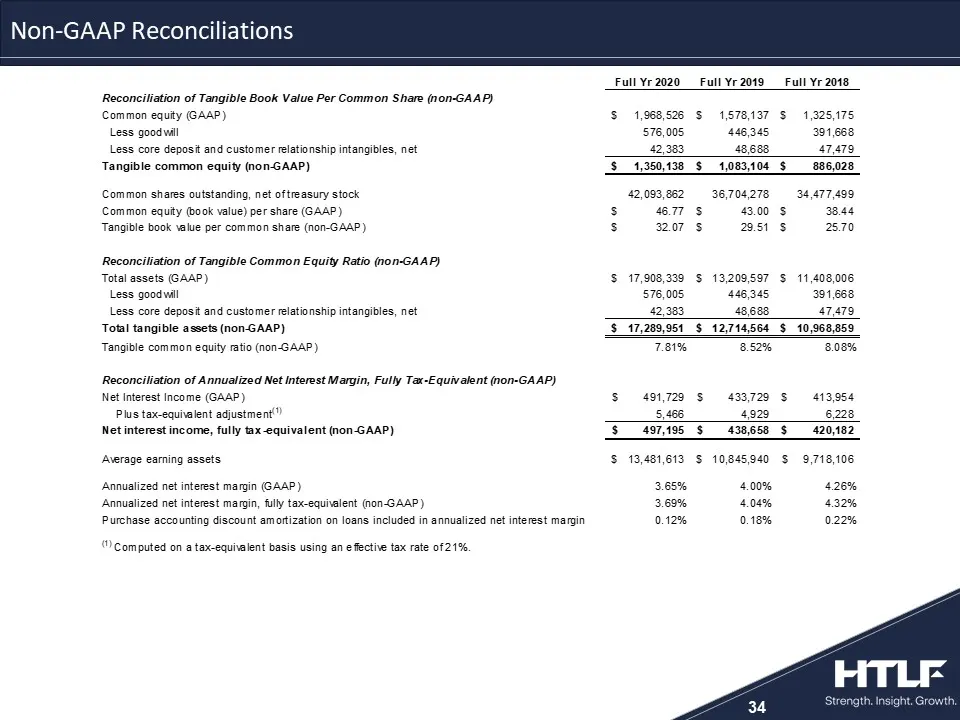
Slide 34: Non-GAAP Reconciliations
34 Non-GAAP Reconciliations
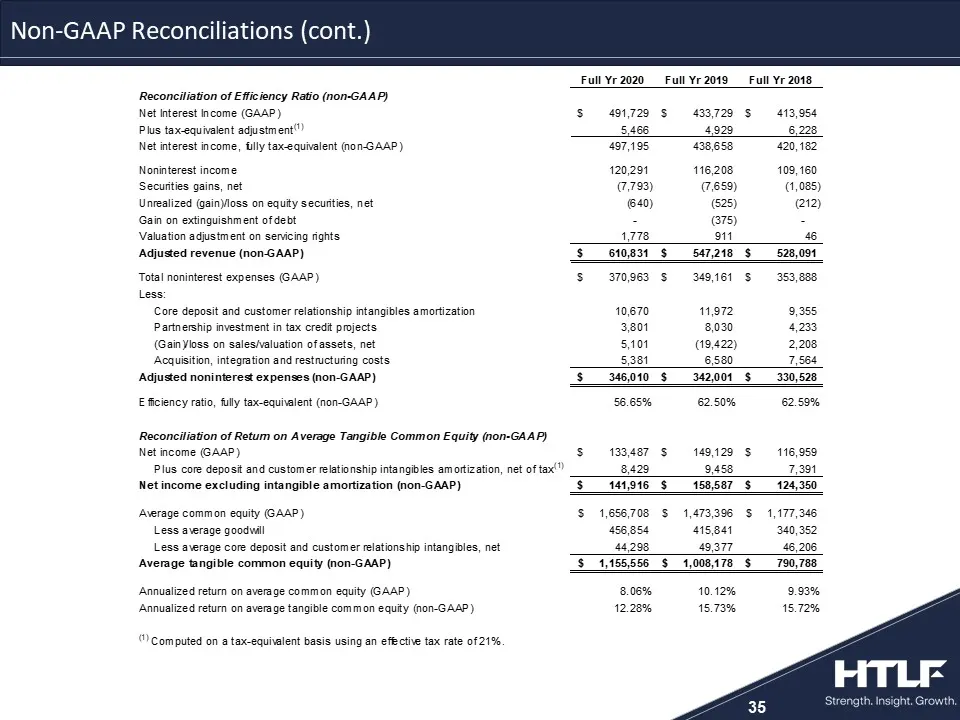
Slide 35: Non-GAAP Reconciliations (cont.)
35 Non-GAAP Reconciliations (cont.)
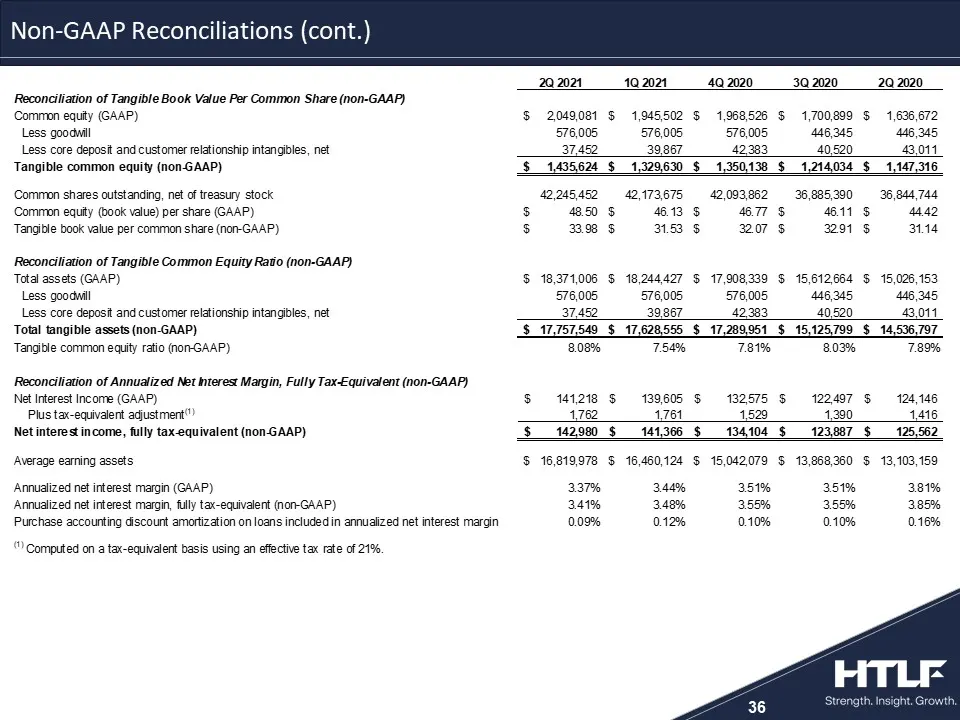
Slide 36: Non-GAAP Reconciliations (cont.)
36 Non-GAAP Reconciliations (cont.)
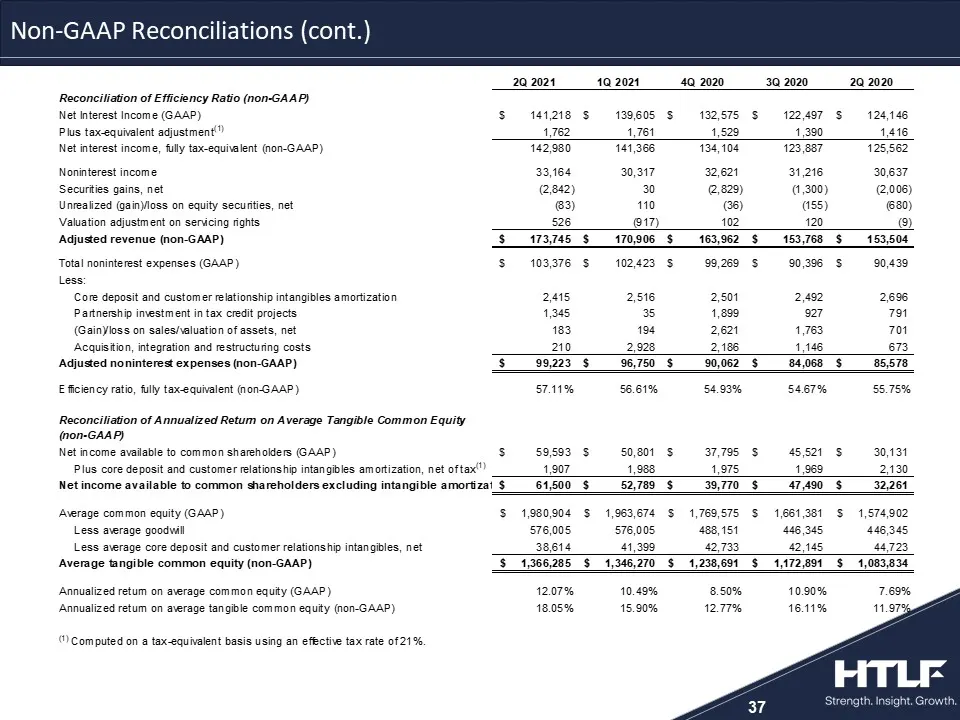
Slide 37: Non-GAAP Reconciliations (cont.)
37 Non-GAAP Reconciliations (cont.)
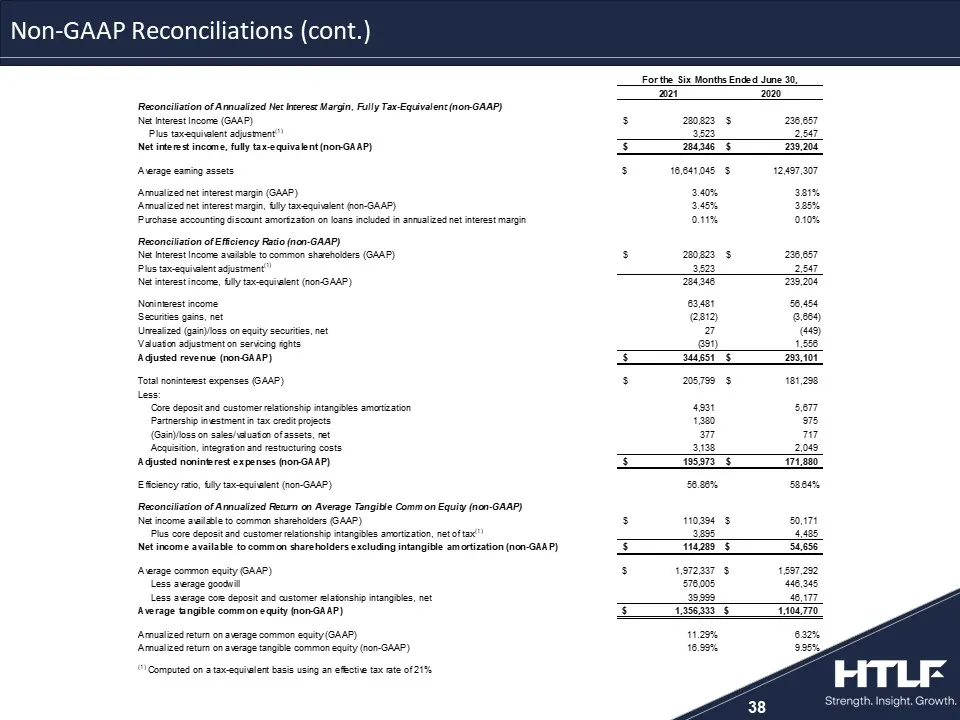
Slide 38: Non-GAAP Reconciliations (cont.)
38 Non-GAAP Reconciliations (cont.)
Source: SEC EDGAR · 8-K filed Aug 27, 2021
More decks from Heartland Financial USA Inc
 Merger or Acquisition (July 2024)6 slides · Jul 31, 2024
 Merger or Acquisition (May 2024)6 slides · May 2, 2024
 Merger or Acquisition (May 2024)27 slides · May 2, 2024
 Q4 2023 Earnings Presentation54 slides · Feb 13, 2024
 Q4 2023 Earnings Presentation35 slides · Jan 29, 2024
 Q3 2023 Earnings Presentation55 slides · Nov 15, 2023