Omni Energy Services — Investor Presentation (June 2008)
22 slides from Omni Energy Services's investor presentation, Jun 9, 2008
Slide 1: Presentation to Morgan Keegan
Presentation to Morgan Keegan June 9, 2008 Exhibit 99.1

Slide 2: Introduction
Introduction OMNI Energy Services Corp. (“OMNI”) is an industry leading, publicly-traded (Nasdaq GM: OMNI) oilfield services company that specializes in providing a broad range of integrated services Headquartered in Carencro, Louisiana Approximately 800 highly qualified employees Operations in the
Slide 3: Company Overview
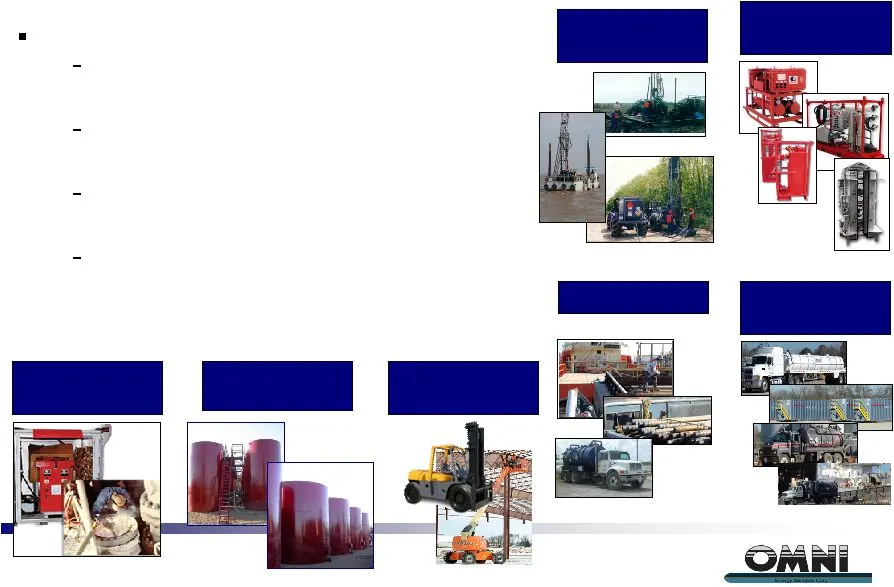
Preheat, Inc. Rig Tools, Inc. Trussco, Inc. Specialized Services Charles Holston, Inc. OMNI Seismic Drilling B.E.G. Liquid Mud Industrial Lift Truck Company Overview OMNI’s focus : Maintaining visibility across E&P cycle; Balancing profitability across businesses; Retaining flexibility to expand int
Slide 4: Strong Brand Name and High Quality Asset Base
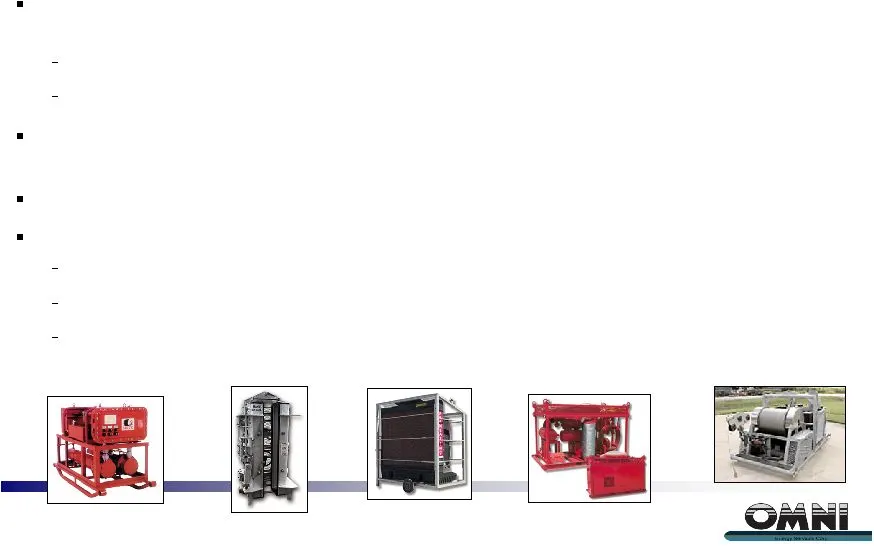
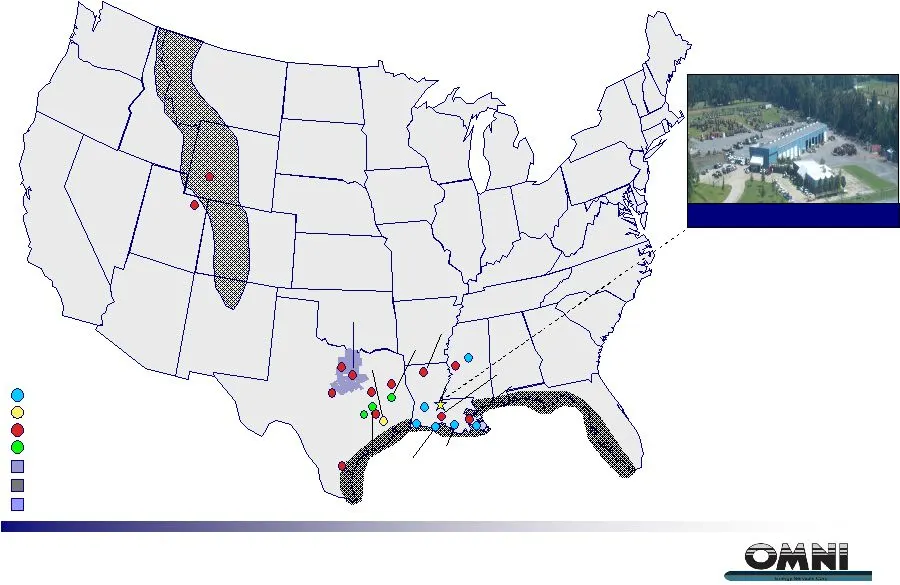
Dominant seismic drilling provider in both the Transition Zone (primarily Louisiana and Texas) and the contiguous Highland areas Approximately 85% of the seismic drilling market share in the Transition Zone Approximately 65% of the seismic drilling market share in the Highland areas Leading player i
Slide 5: Oonini
Oonini

Slide 6: Business Strategy
Business Strategy Expand range of services Maximize synergies of existing business lines Increase focus on organic growth Increase Operating Capabilities Capitalize on increased size Improve margins and liquidity Improved Fiscal Management Dominant market presence Developed customer base Robust mark

Slide 7: Investment Highlights
Investment Highlights Commodity Prices and Sector Fundamentals remain strong Focused on Attractive Geographic Markets Leading Position in Seismic Drilling Market Management Averages 31 Years of Experience Continued Solid Results Strong Operational Cash Flows

Slide 8: Seasoned Management & Experienced Workforce
OMNI is led by a deep bench of oilfield services veterans averaging 31 years in the industry Experienced and dedicated staff with the specialized knowledge capable of delivering the highest level of customer service 100% non-union workforce Seasoned Management & Experienced Workforce 25 years VP and
Slide 9: Commodity prices remain strong
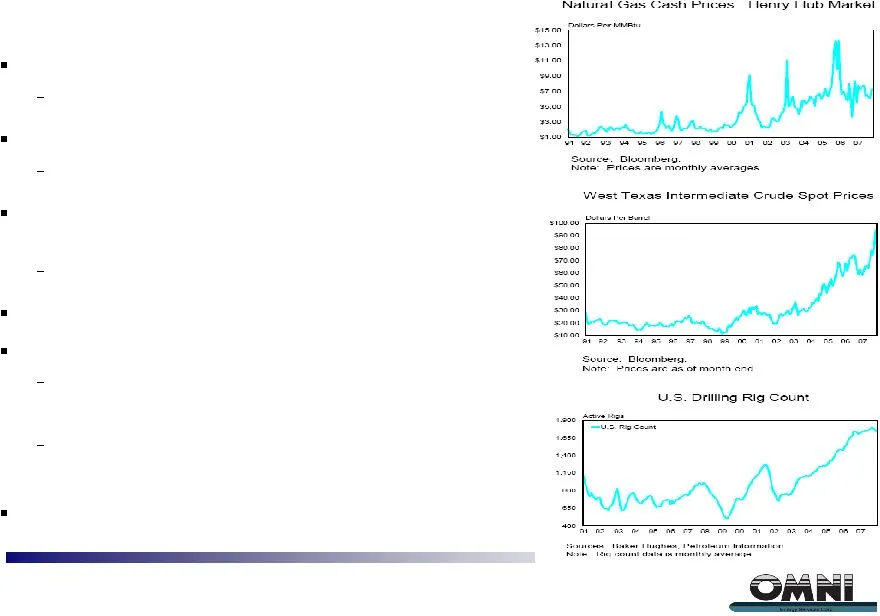
Commodity prices remain strong Capital spending expected to escalate in 2008 First quarter land permit data is strong Drilling activity expected to improve this summer Reduced service company capital investment supporting price stabilization Market forces in line with demand Gas market improving Off
Slide 10: The Future - Land Operations
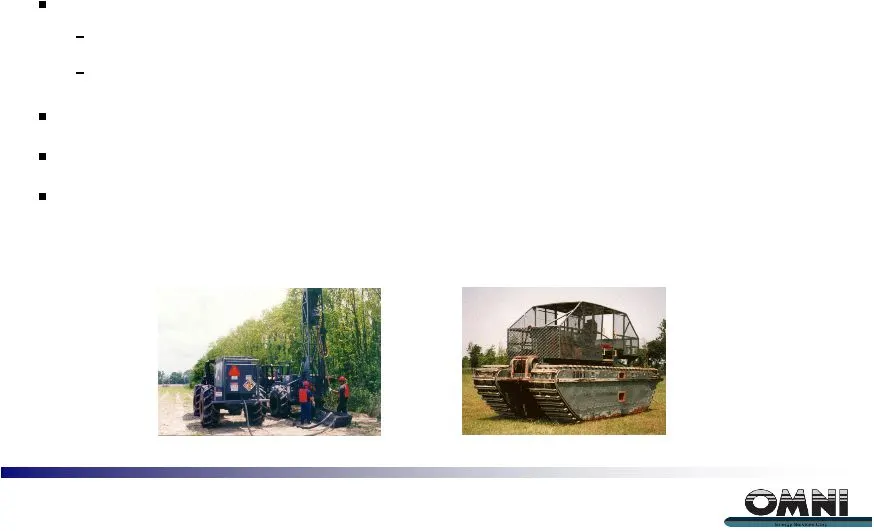
The Future - Land Operations Restructure to improve performance predictability Flatten organization Promote better asset utilization Focus internally on organic initiatives with core client base Enhance our loss control, safety and risk programs Strengthen local management teams

Slide 11: The Future - Land Operations
The Future - Land Operations Implement price increases due to major spending category inflation Organize our land-based business around prolific oil and gas plays Barnett Shale Rocky Mountains East Texas Fayetteville, Arkansas Expand seismic drilling operations into the Rocky Mountains Add two new d
Slide 12: The Future - Offshore Operations
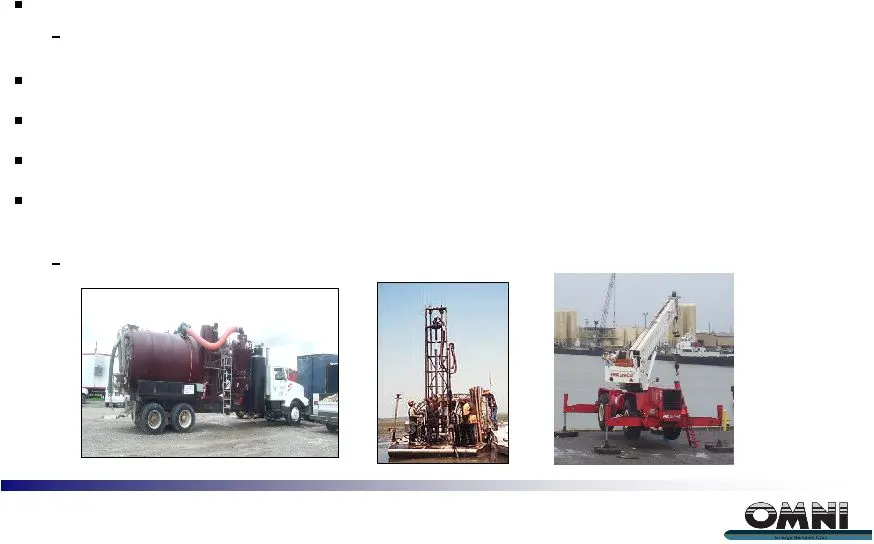
The Future - Offshore Operations Emphasize organic growth initiatives Blue chip customer base with very little multiple service line penetration Strengthen local management teams Increase controls, performance expectations and transparency Expand technology initiatives Strive to become best in class
Slide 13: Extensive Blue-Chip Customer Base
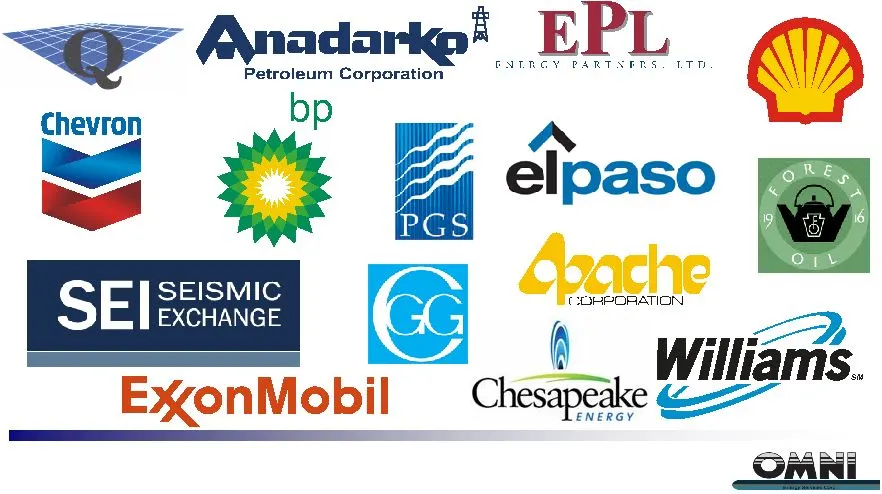
Extensive Blue-Chip Customer Base OMNI has maintained relationships with many of its Blue-Chip customers for over ten years.
Slide 14: OMNI Timeline
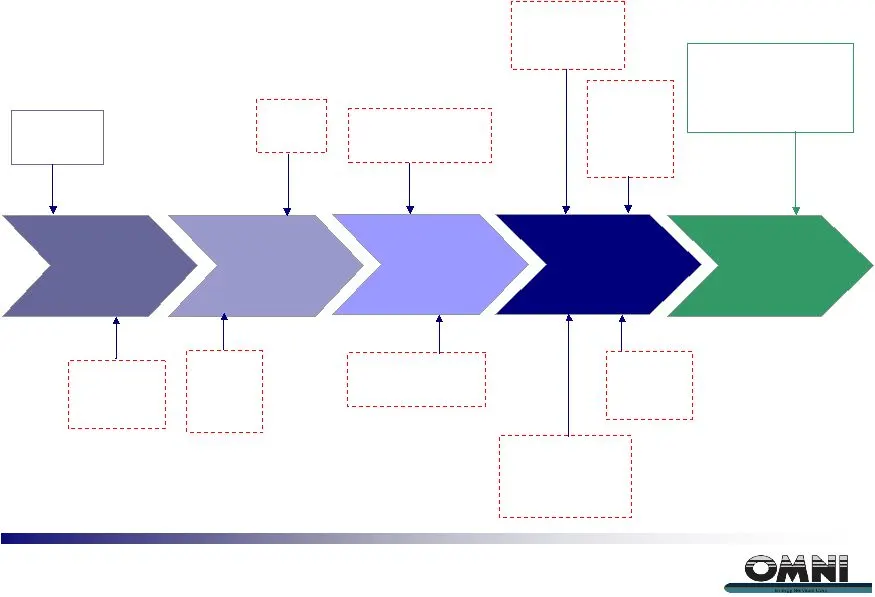
1997 - 2002 2003 - 2004 2005 - 2006 2007-2008 2009 Forward OMNI Timeline 1997: Initial Public Offering 2006: Acquired Preheat and Rig Tools 2007: Acquired Charles Holston (CHI) and certain assets of Cypress Energy 2002: Purchased certain assets of AirJac 2003: Purchased American Helicopters, Inc. (“
Slide 15: Diversified Revenue Base
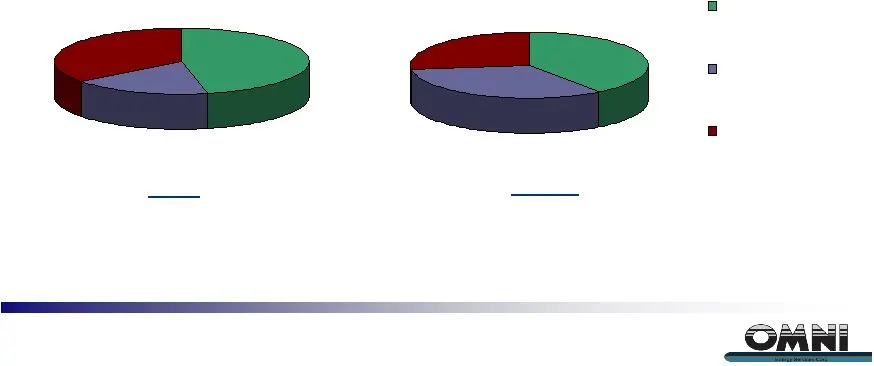
Diversified Revenue Base 2007 Revenue $172 million 2008E Revenue $203 million 40% 33% 27% Seismic Drilling Land Service Offshore Service 46% 18% 36% 2008E
Slide 16: OMNI Energy Financial Highlights – Revenue
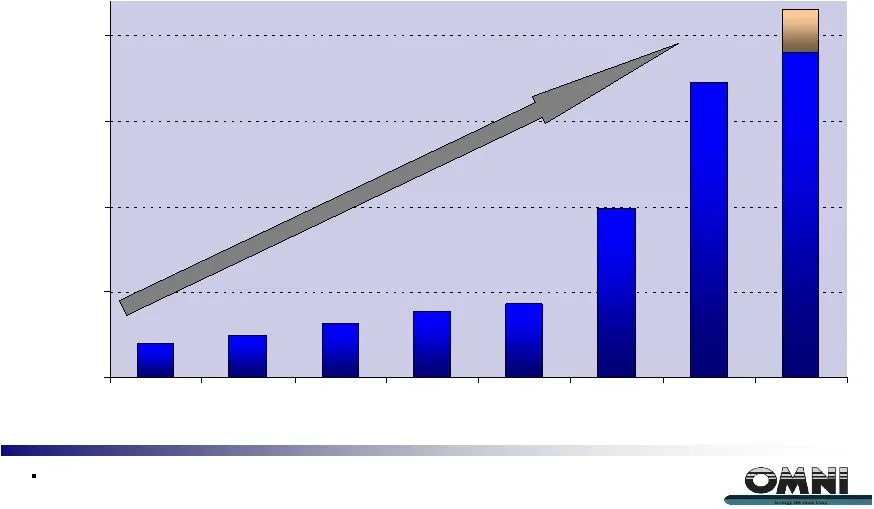
OMNI Energy Financial Highlights – Revenue ( Historical and Projected) Revenue (in thousands) $31,555 $24,592 $19,839 $39,064 $190,000 - $215,000 $98,998 $43,350 $172,479 $0 $50,000 $100,000 $150,000 $200,000 Actual 2001 Actual 2002 Actual 2003 Actual 2004 Actual 2005 Actual 2006 Actual 2007 Project
Slide 17: OMNI Energy Financial Highlights – Adjusted EBITDA
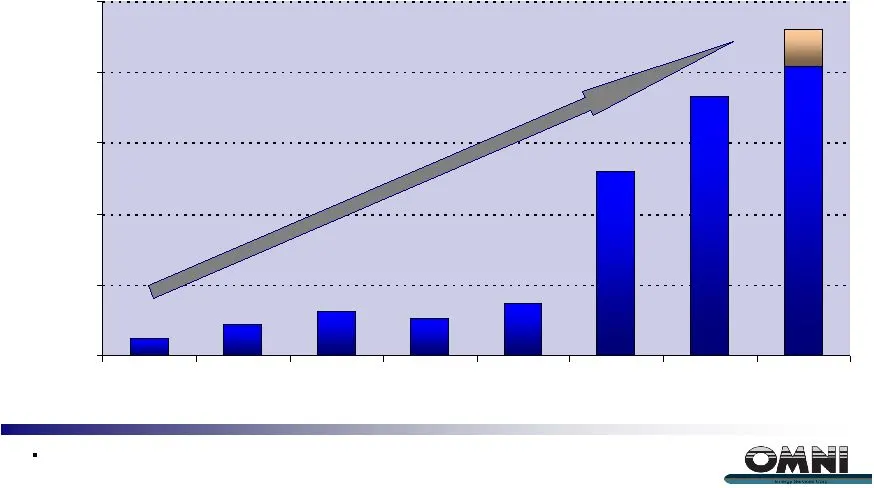
OMNI Energy Financial Highlights – Adjusted EBITDA (Historical and Projected) OMNI information excluding aviation division (1) See page 23 for reconciliation and definition of Adjusted EBITDA Adjusted EBITDA (in thousands) (1) $36,597 $6,251 $41,000 - $46,000 $5,145 $4,228 $2,398 $7,339 $26,009 $0 $
Slide 18: Adjusted EBITDA as % of Revenue
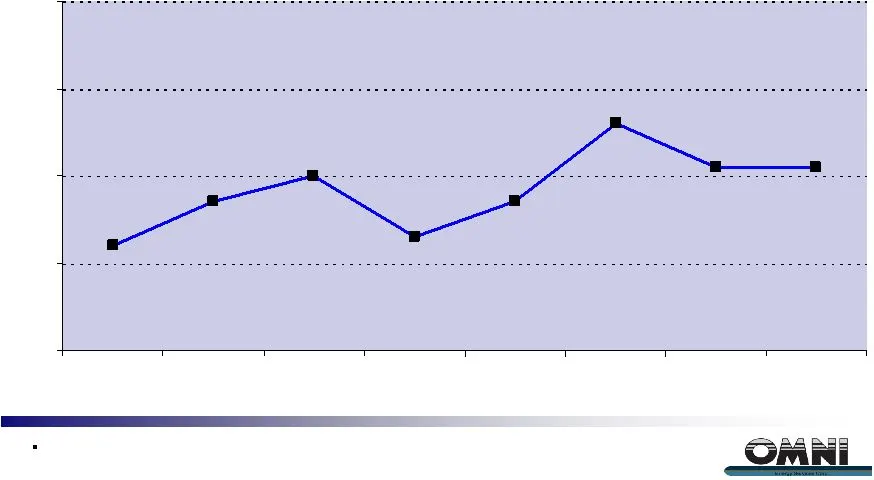
OMNI Energy Financial Highlights – Adjusted EBITDA (1) as % of Revenue (Historical and Projected) 20% 21% 21% 13% 17% 12% 17% 26% 0% 10% 20% 30% 40% Actual 2001 Actual 2002 Actual 2003 Actual 2004 Actual 2005 Actual 2006 Actual 2007 Projected 2008 OMNI information excluding aviation division (1) See
Slide 19: OMNI Energy Financial Highlights – Leverage Ratio
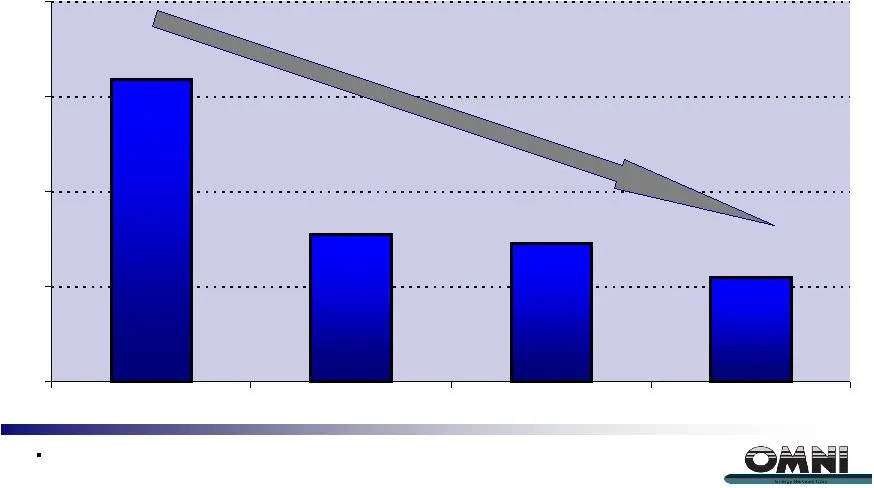
OMNI Energy Financial Highlights – Leverage Ratio OMNI information excluding aviation division (1) See page 23 for reconciliation and definition of Adjusted EBITDA Leverage Ratio (Net debt / Adjusted EBITDA (1) ) 1.45 1.09 1.55 3.17 Actual 2005 Actual 2006 Actual 2007 Projected 2008
Slide 20: Financial Strength
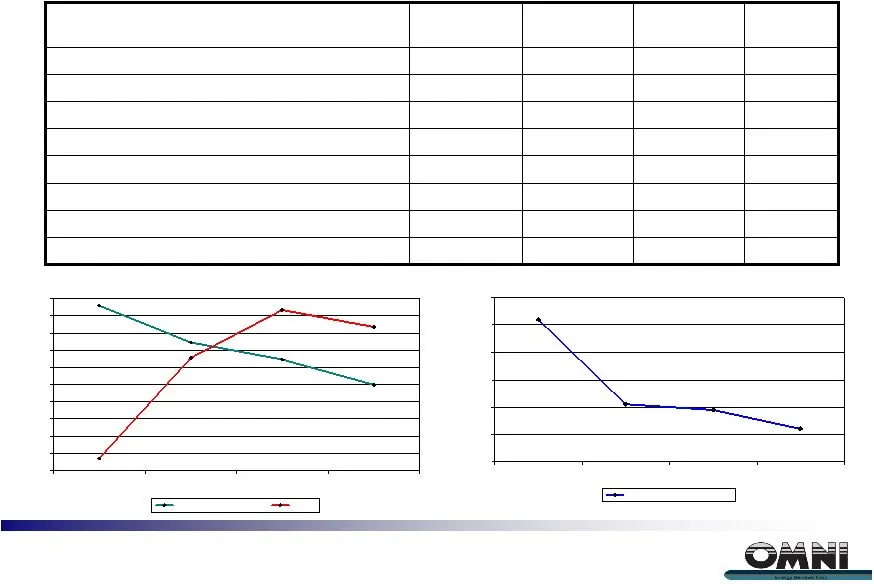
Financial Strength 2008 E Debt/Book Capital Debt Credit Statistics 1.1x 1.45x 1.55x 3.1x Net Debt / LTM Adj. EBITDA (1) 38.5% 47.0% 50.5% 67.7% Net Debt / Net Book Capitalization 45.0% 52.3% 57.3% 67.9% Debt / Book Capitalization $137.1 $126.7 $92.2 $34.6 Total Book Capitalization $75.4 $60.1 $39.4

Slide 21: 2008 Guidance
2008 Guidance Organic growth only; guidance has assumed no additional acquisitions Capital expenditures forecasted at maintenance levels only $ 0.63 $ 0.51 Earnings per share $ 46,000 $ 41,000 Adjusted EBITDA (1) $ 215,000 $ 190,000 Revenue High Range Low Range Projected $ in thousands (1) See page

Slide 22: Adjusted EBITDA definition
OMNI calculates Adjusted EBITDA (adjusted earnings before interest, taxes, depreciation and amortization) as net income excluding income taxes, net interest expense, depreciation and amortization, and adjusted for loss on debt extinguishment and stock-based compensation. Adjusted EBITDA is not calcu
Source: SEC EDGAR · 8-K filed Jun 9, 2008