Omni Energy Services — Roth OC Growth Stock Conference (March 2010)
23 slides from Omni Energy Services's conference presentation, Mar 18, 2010
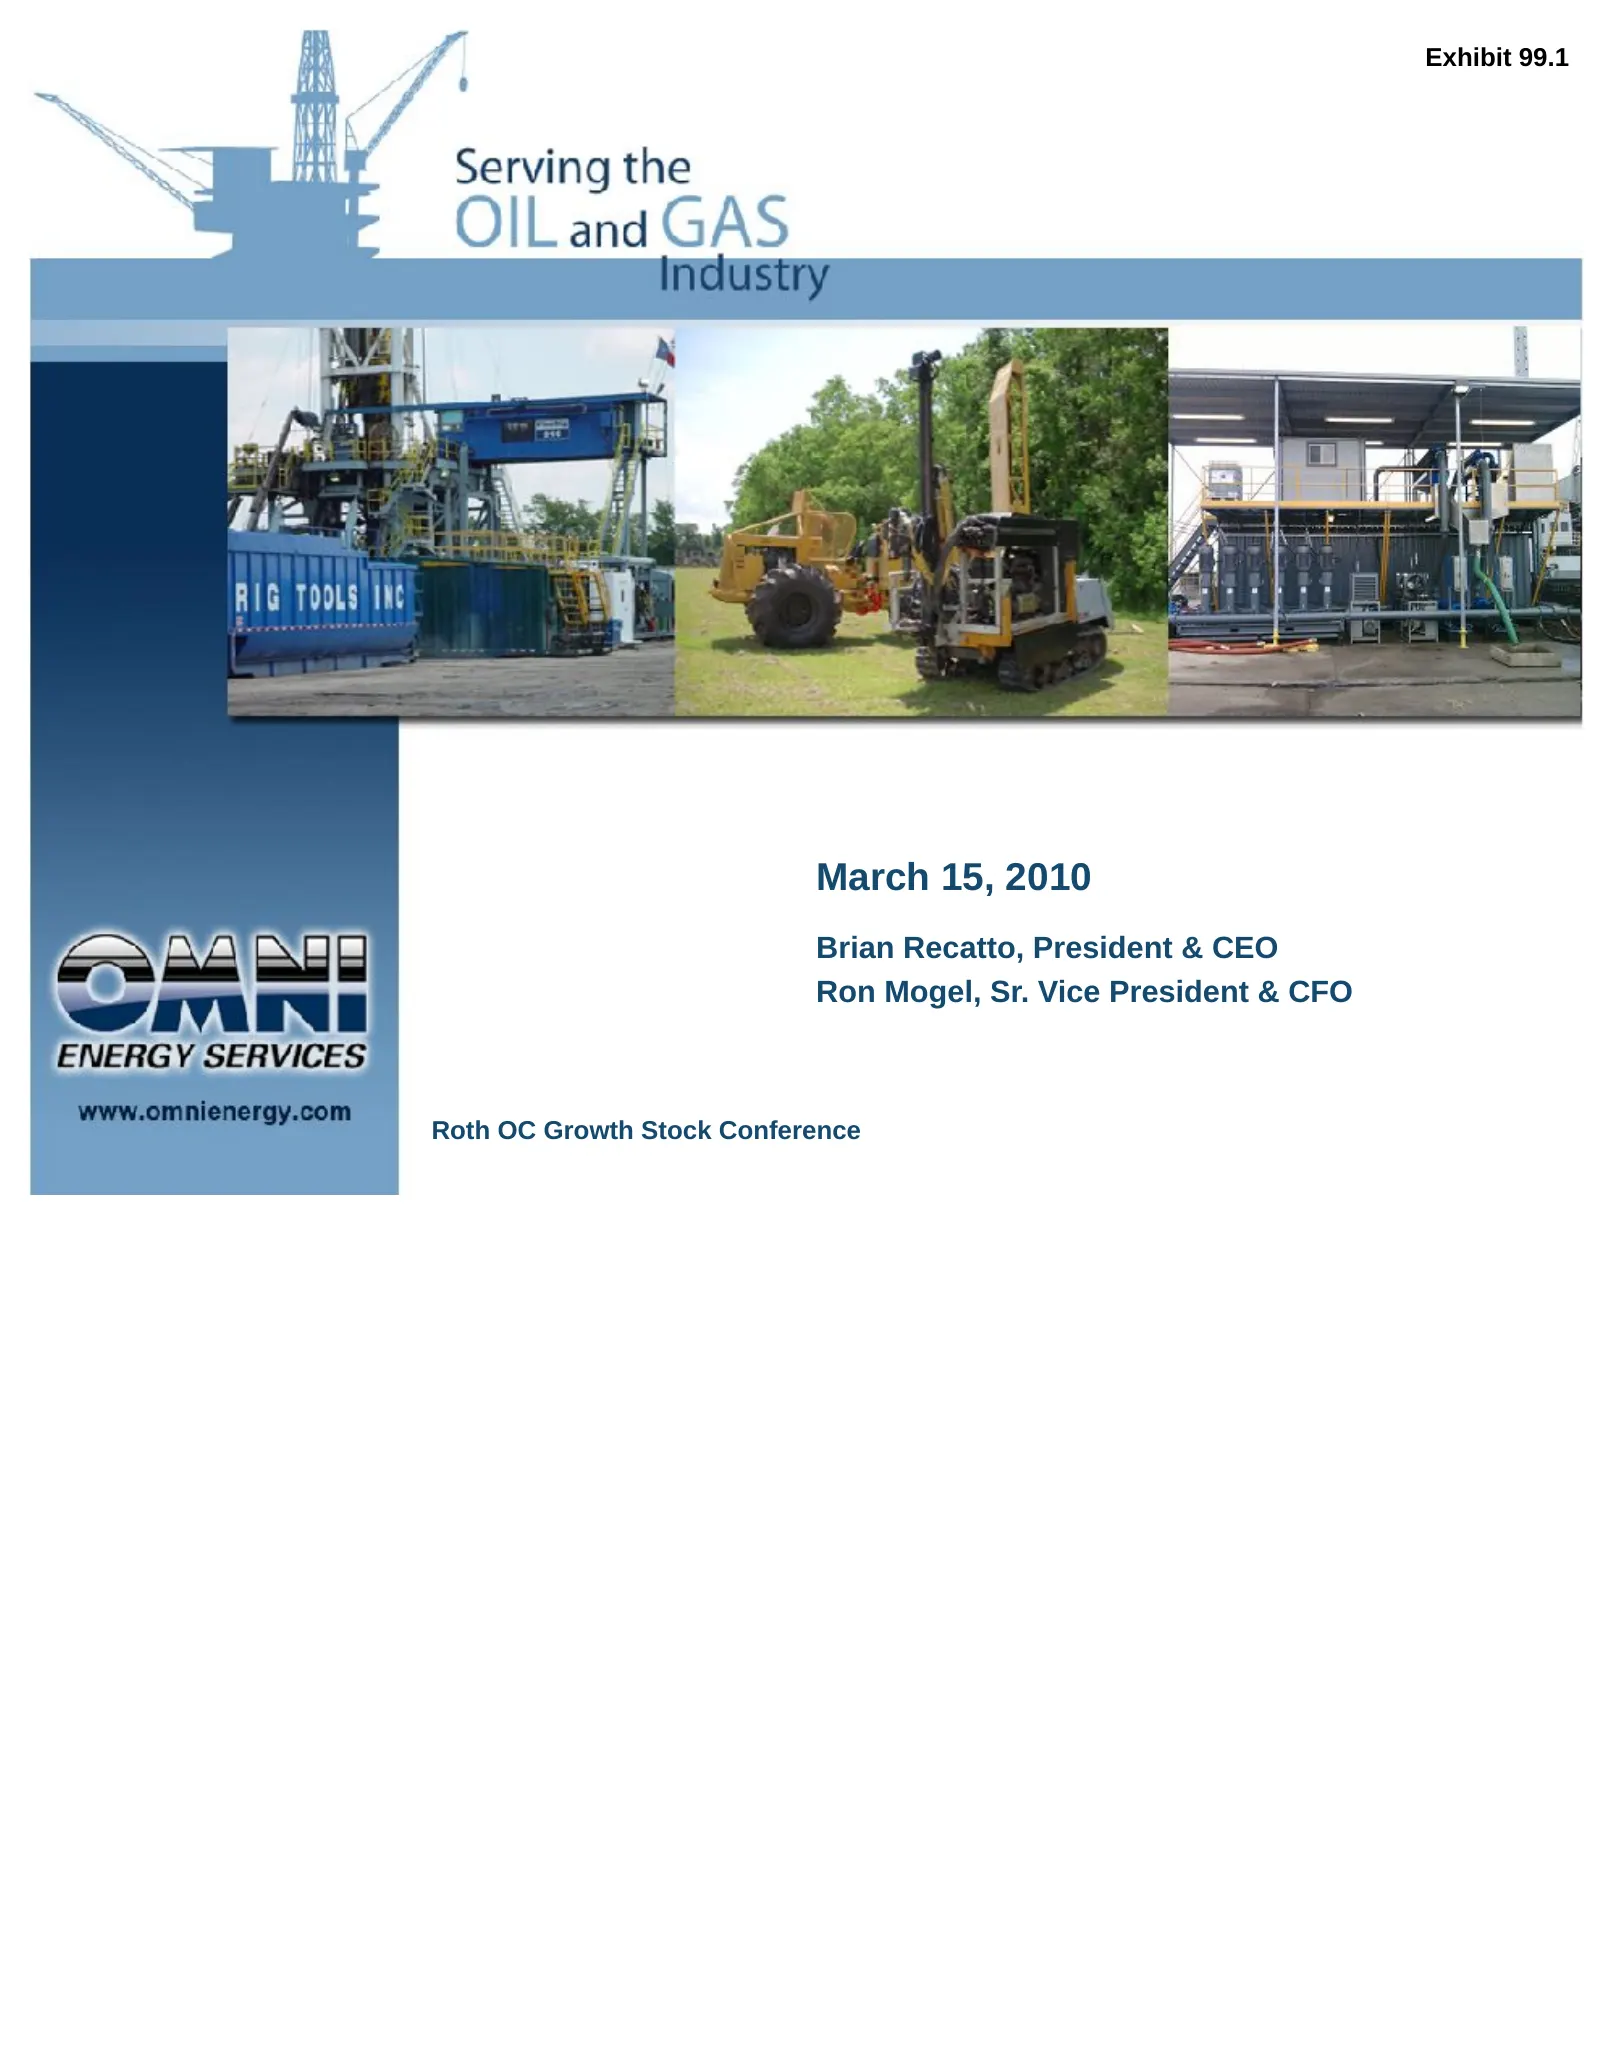
Slide 1: Roth OC Growth Stock Conference
Exhibit 99.1 March 15, 2010 Brian Recatto, President & CEO Ron Mogel, Sr. Vice President & CFO Roth OC Growth Stock Conference
Slide 2: Forward Looking Statements
Forward Looking Statements This Company Overview (“Overview”) has been prepared by management of OMNI Energy Services Corp. This Overview is intended solely for informational purposes. Certain statements in this presentation contain forward-looking statements within the meaning of Section 27A of the
Slide 3: Market Environment
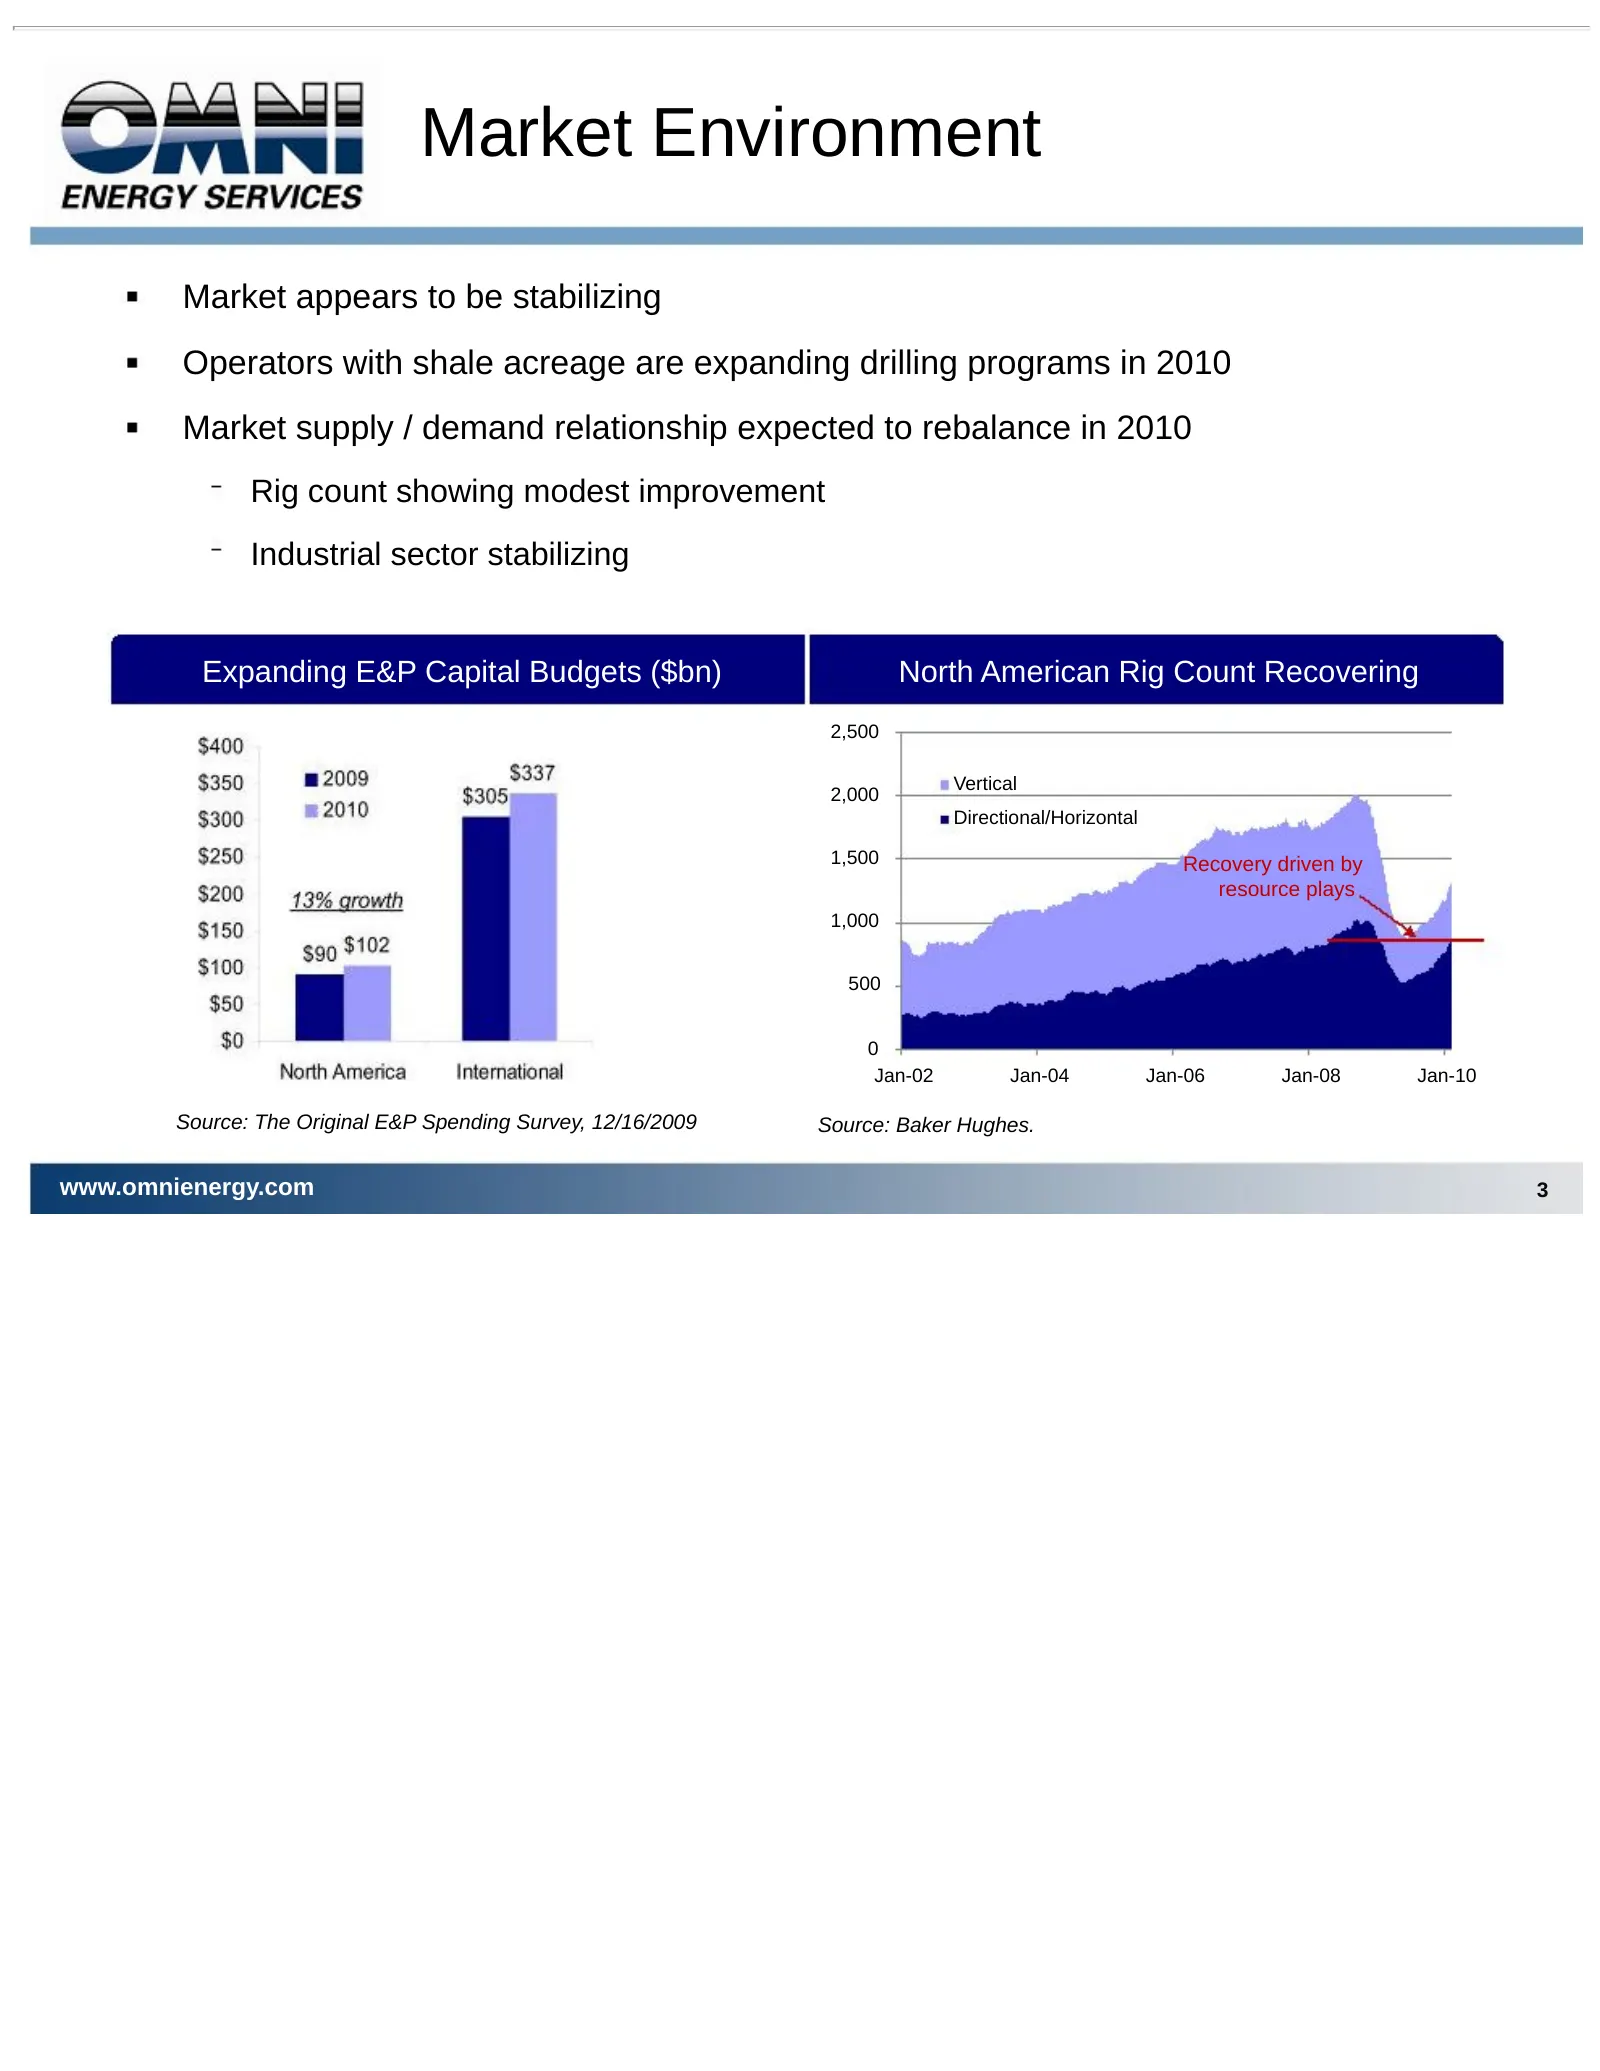
Market Environment Market appears to be stabilizing Operators with shale acreage are expanding drilling programs in 2010 Market supply / demand relationship expected to rebalance in 2010 Rig count showing modest improvement Industrial sector stabilizing Expanding E&P Capital Budgets ($bn) North Amer
Slide 4: Overview of OMNI
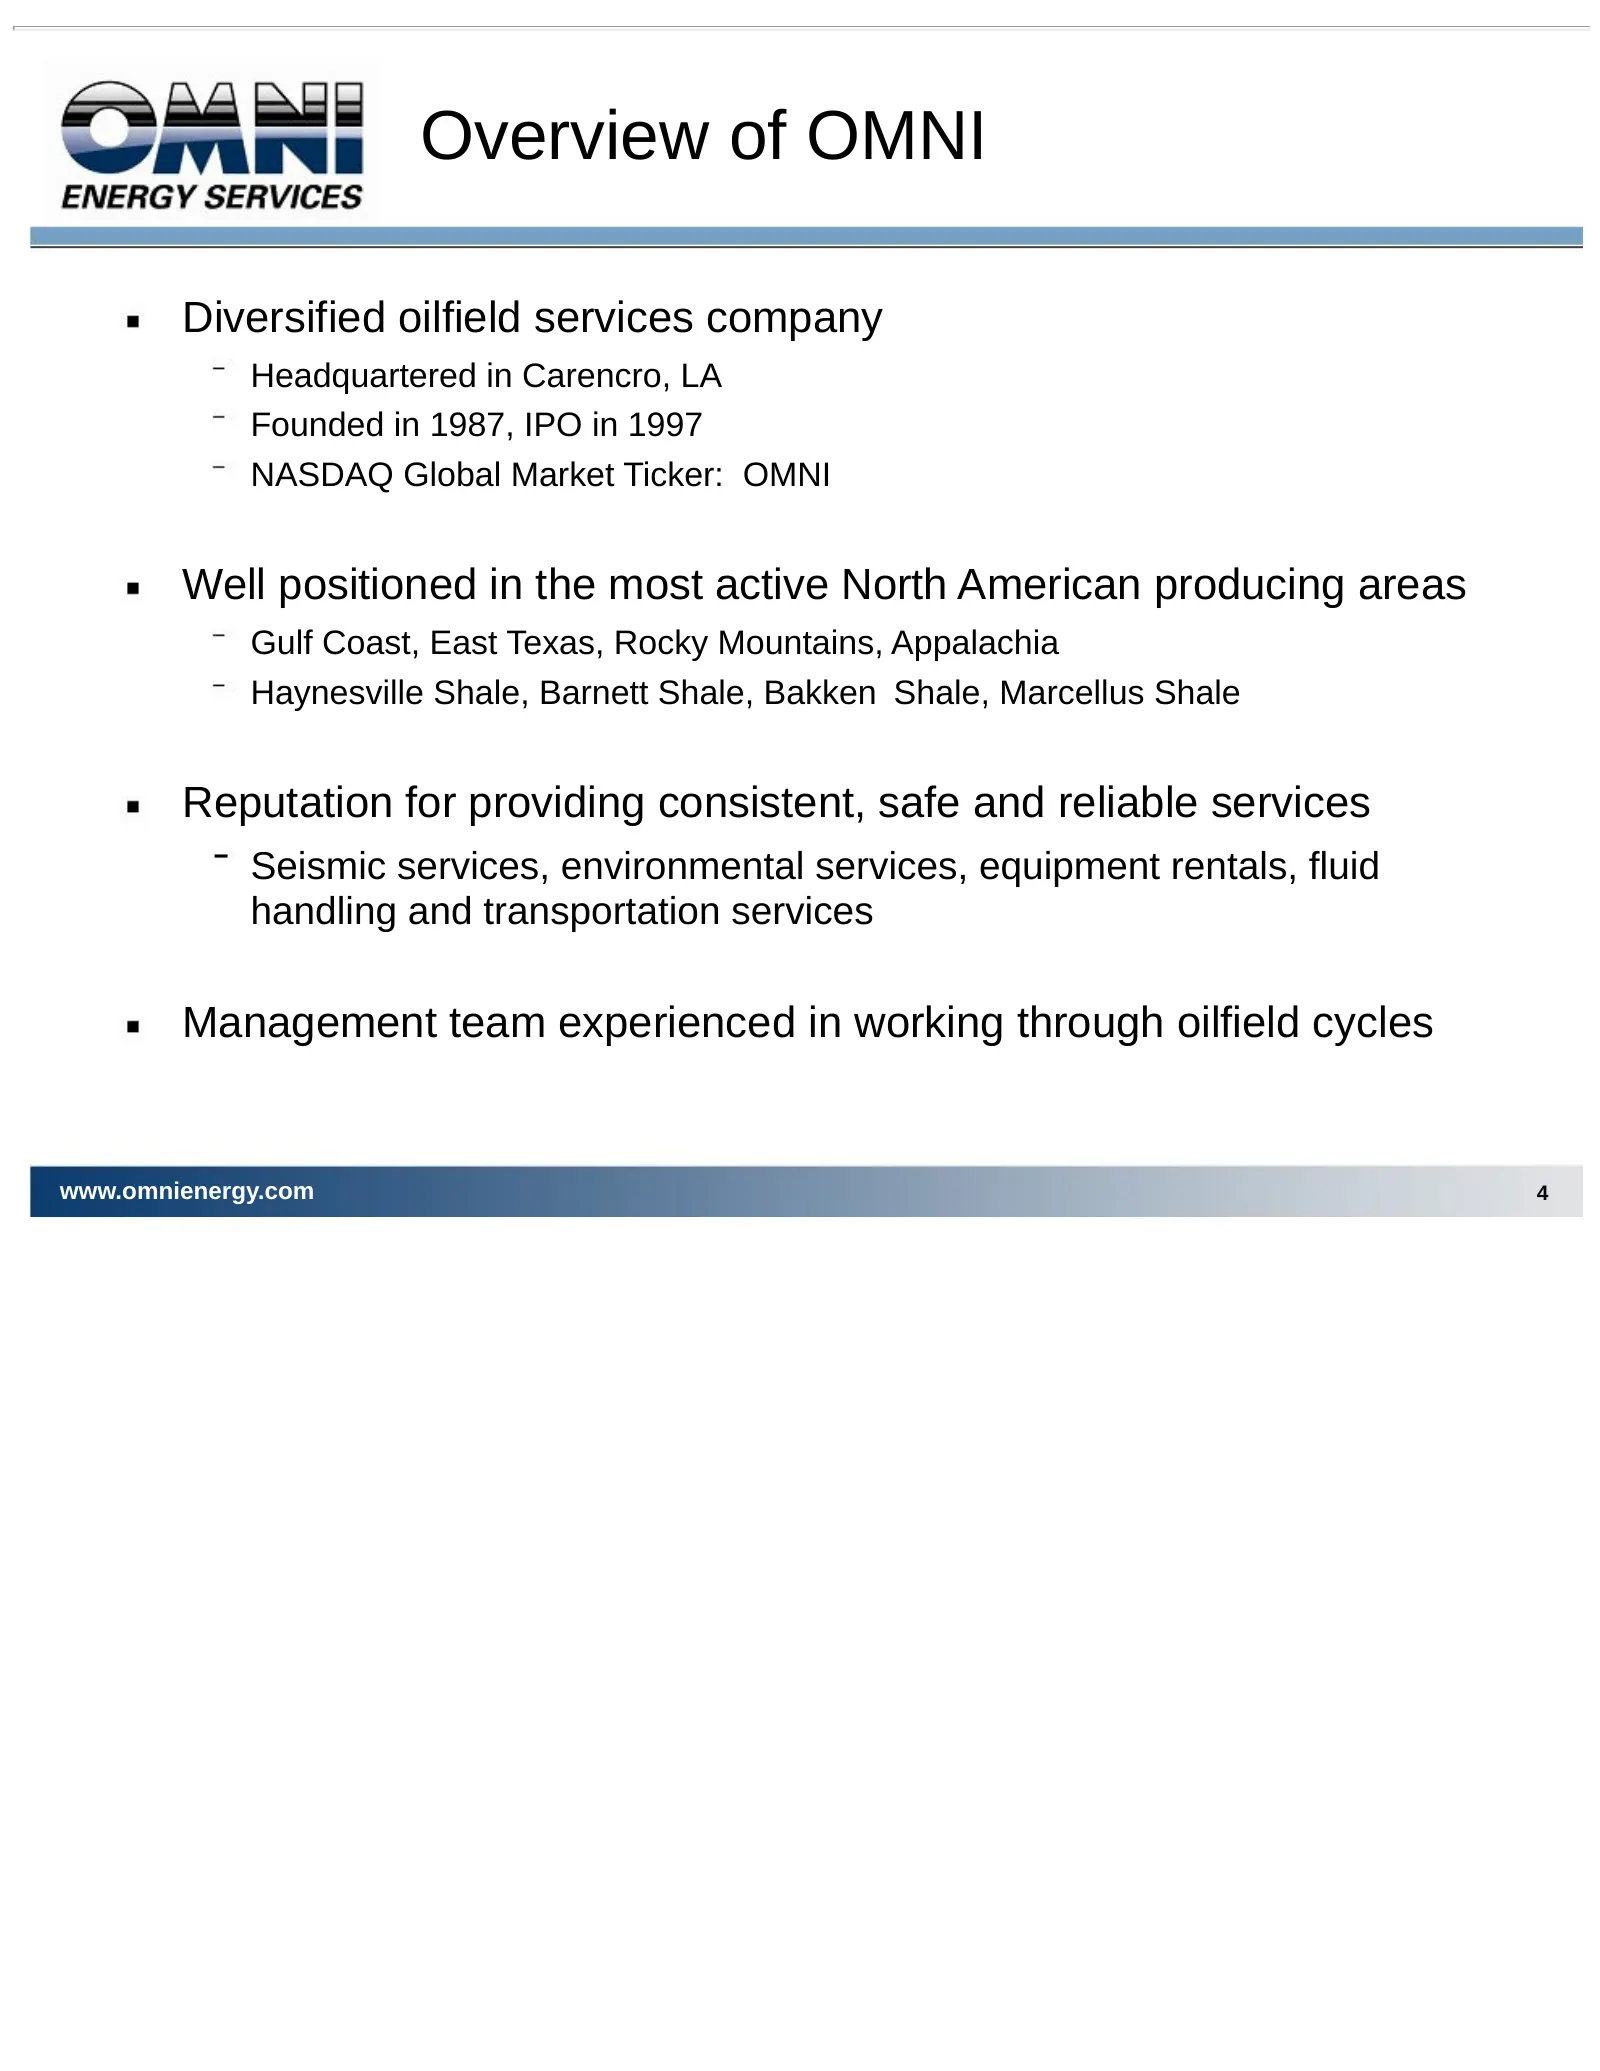
Overview of OMNI Diversified oilfield services company Headquartered in Carencro, LA Founded in 1987, IPO in 1997 NASDAQ Global Market Ticker: OMNI Well positioned in the most active North American producing areas Gulf Coast, East Texas, Rocky Mountains, Appalachia Haynesville Shale, Barnett Shale,
Slide 5: Diversification of Services
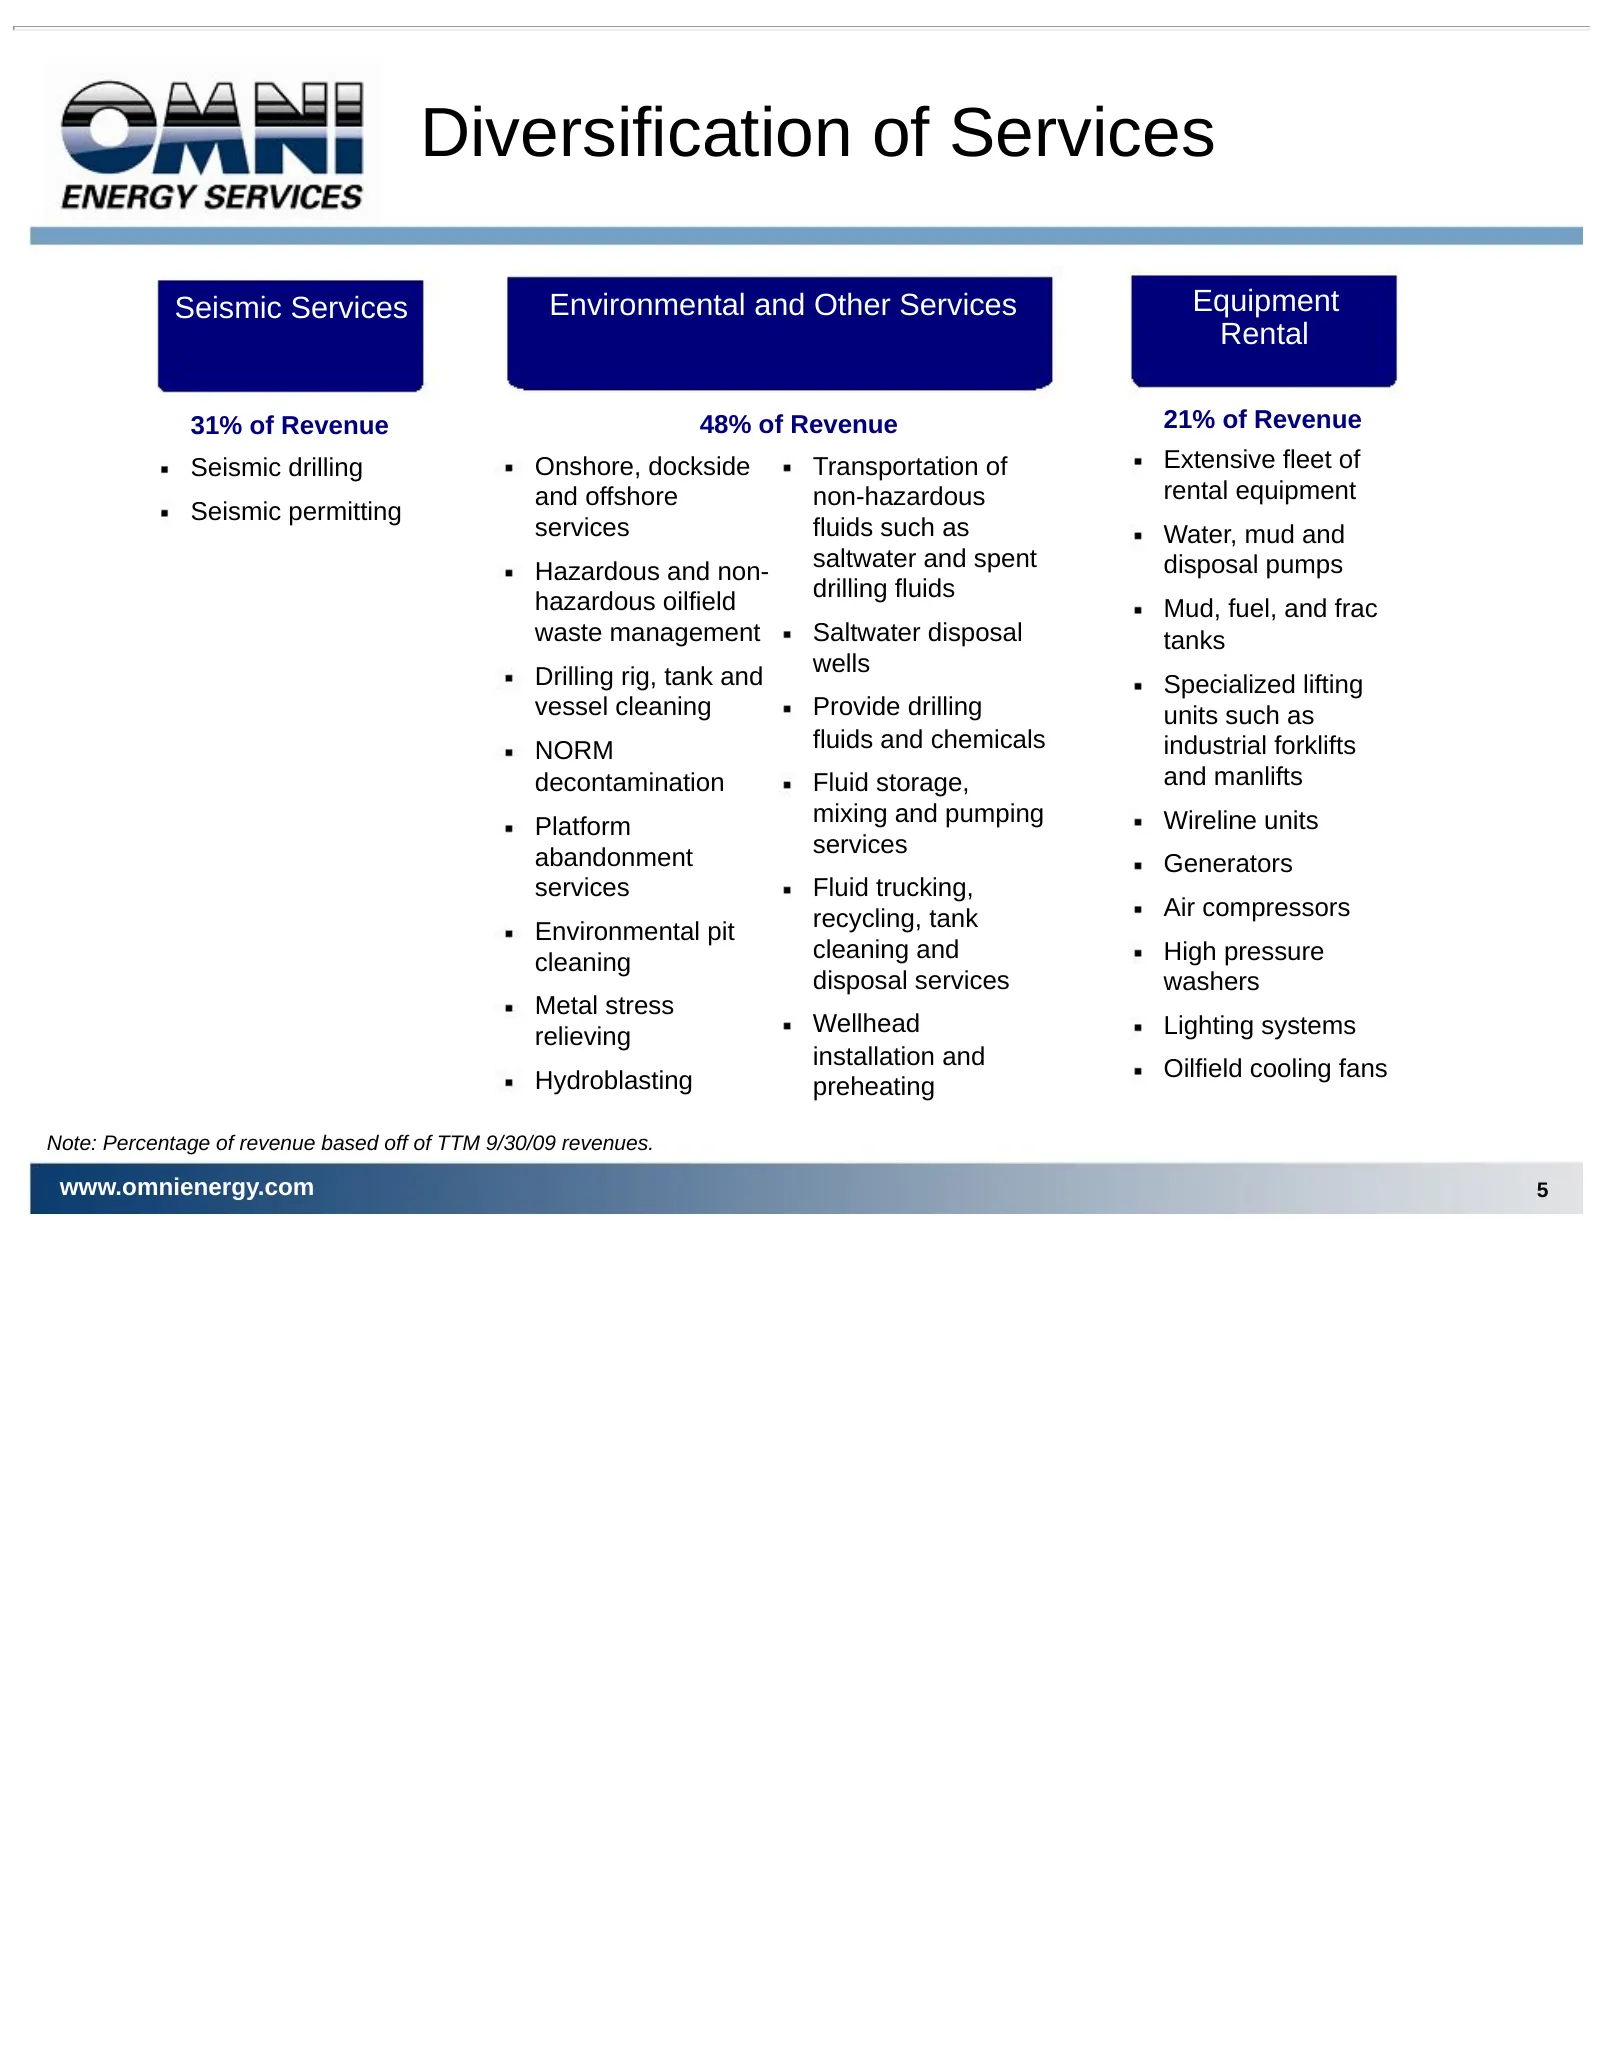
Diversification of Services Seismic Services Environmental and Other Services Equipment Rental 31% of Revenue 48% of Revenue 21% of Revenue Seismic drilling Onshore, dockside Transportation of Extensive fleet of and offshore non-hazardous rental equipment Seismic permitting services fluids such as W
Slide 6: Well Positioned Operations
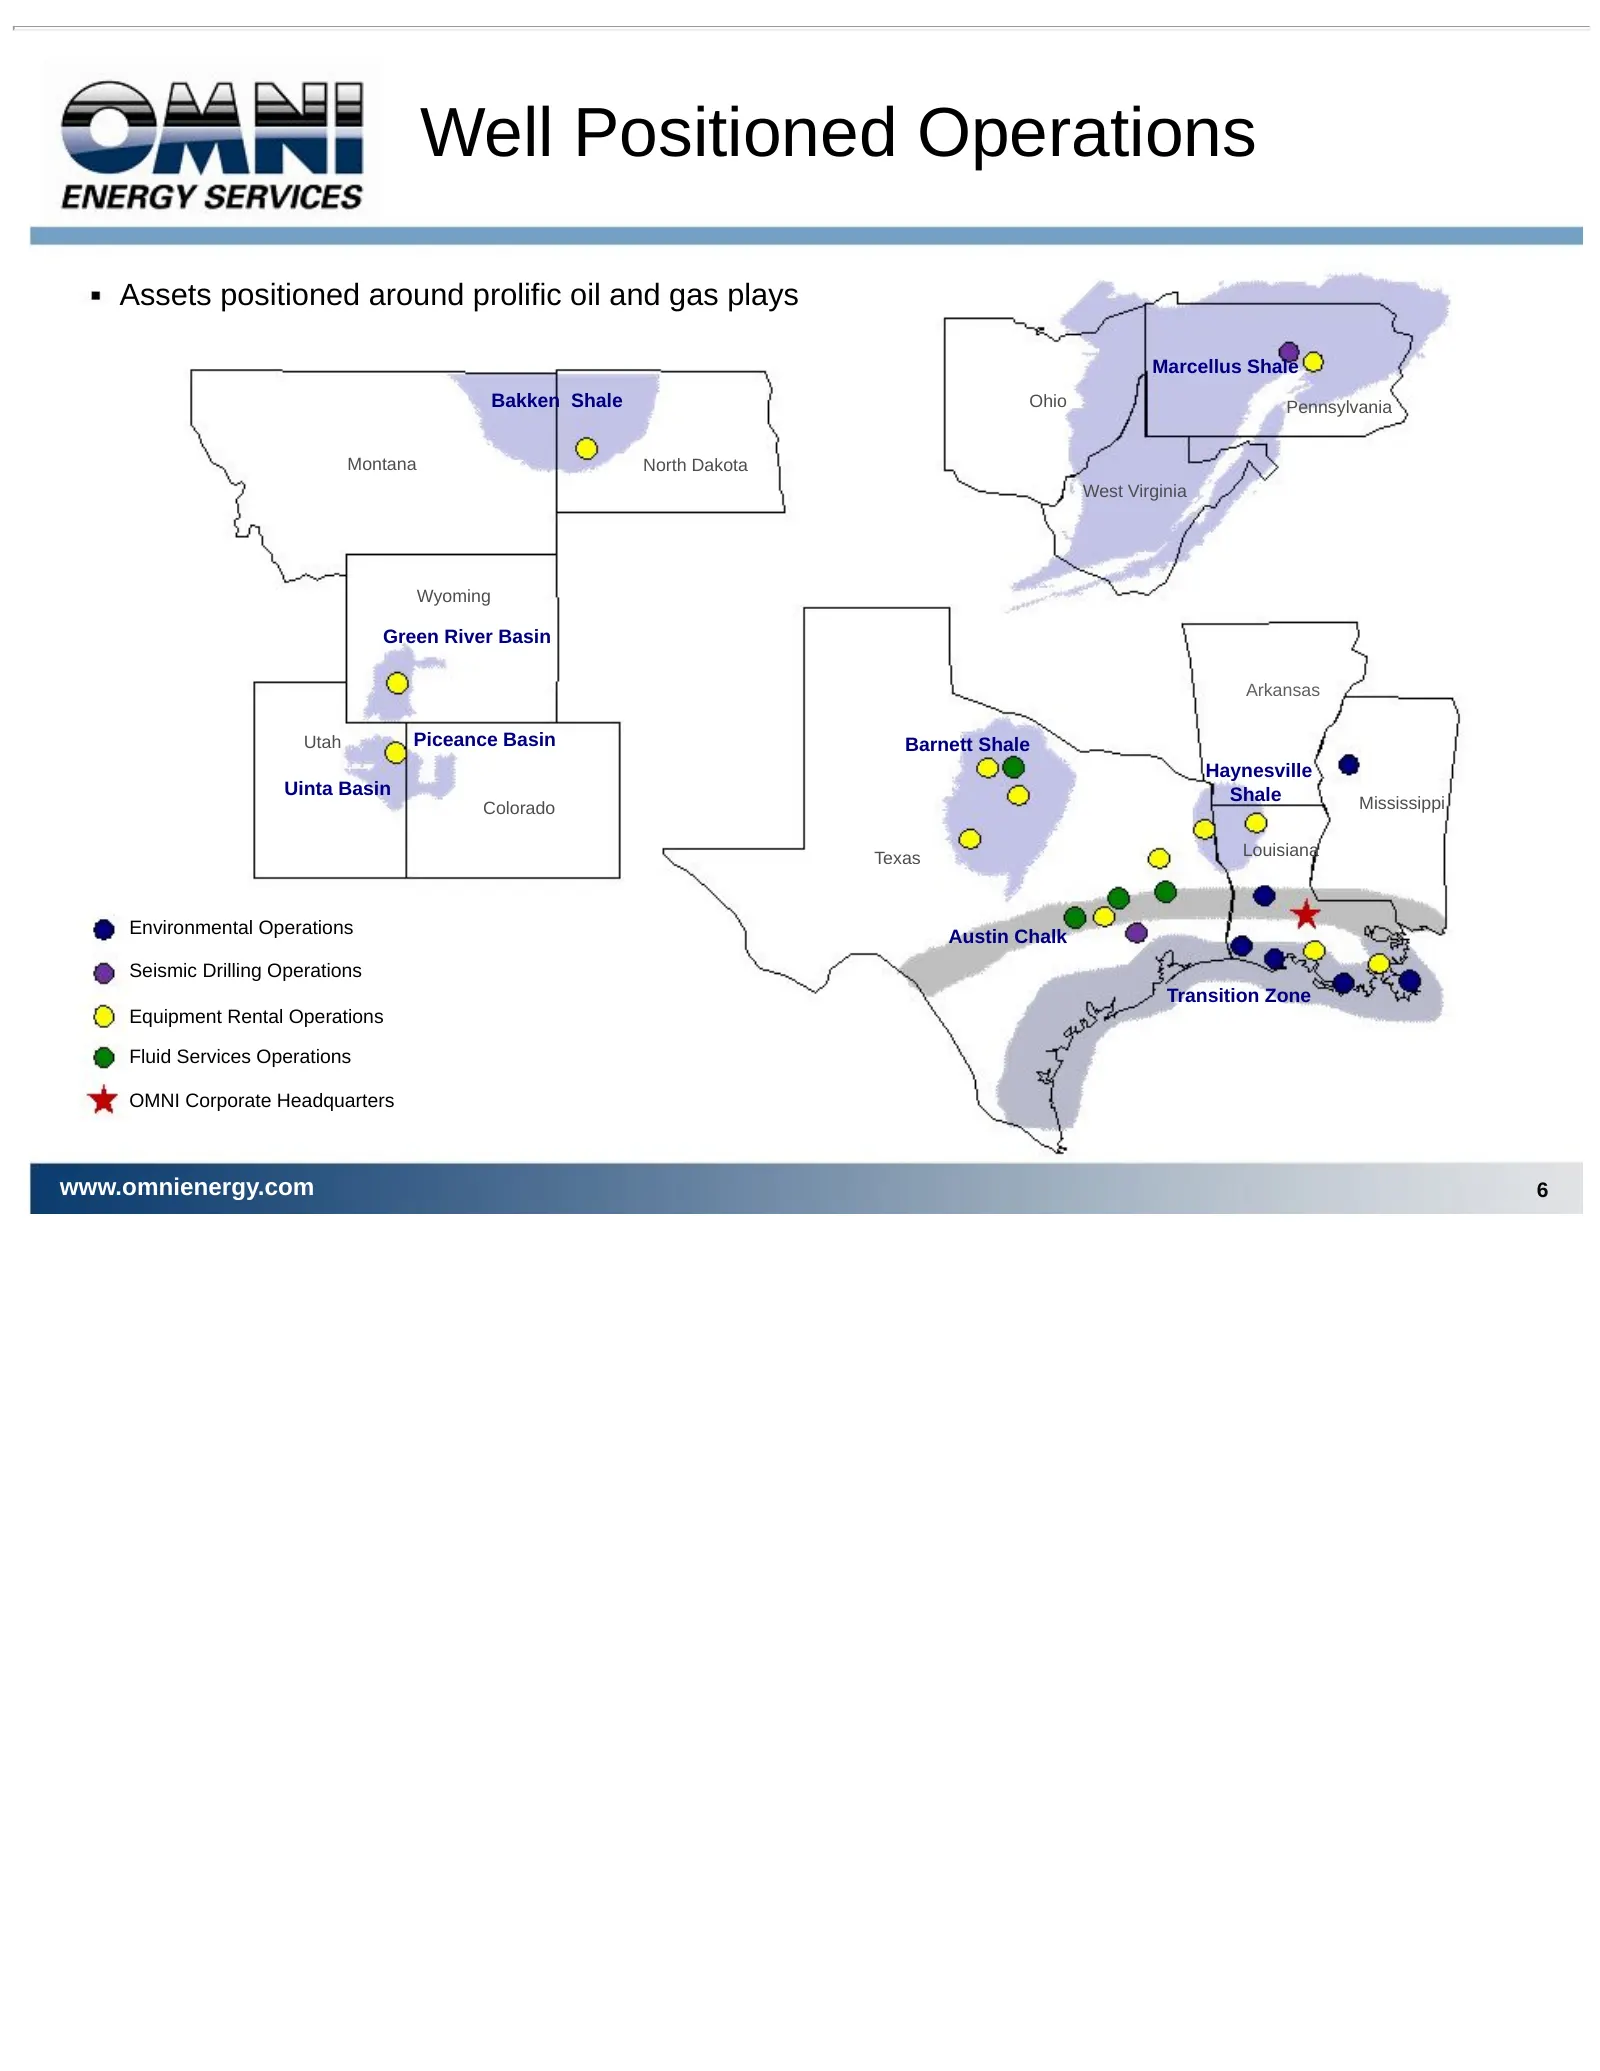
Well Positioned Operations Assets positioned around prolific oil and gas plays Marcellus Shale Bakken Shale Ohio Pennsylvania Montana North Dakota West Virginia Wyoming Green River Basin Arkansas Utah Piceance Basin Barnett Shale Haynesville Uinta Basin Shale Colorado Mississippi Texas Louisiana Env
Slide 7: Blue Chip Customer Base
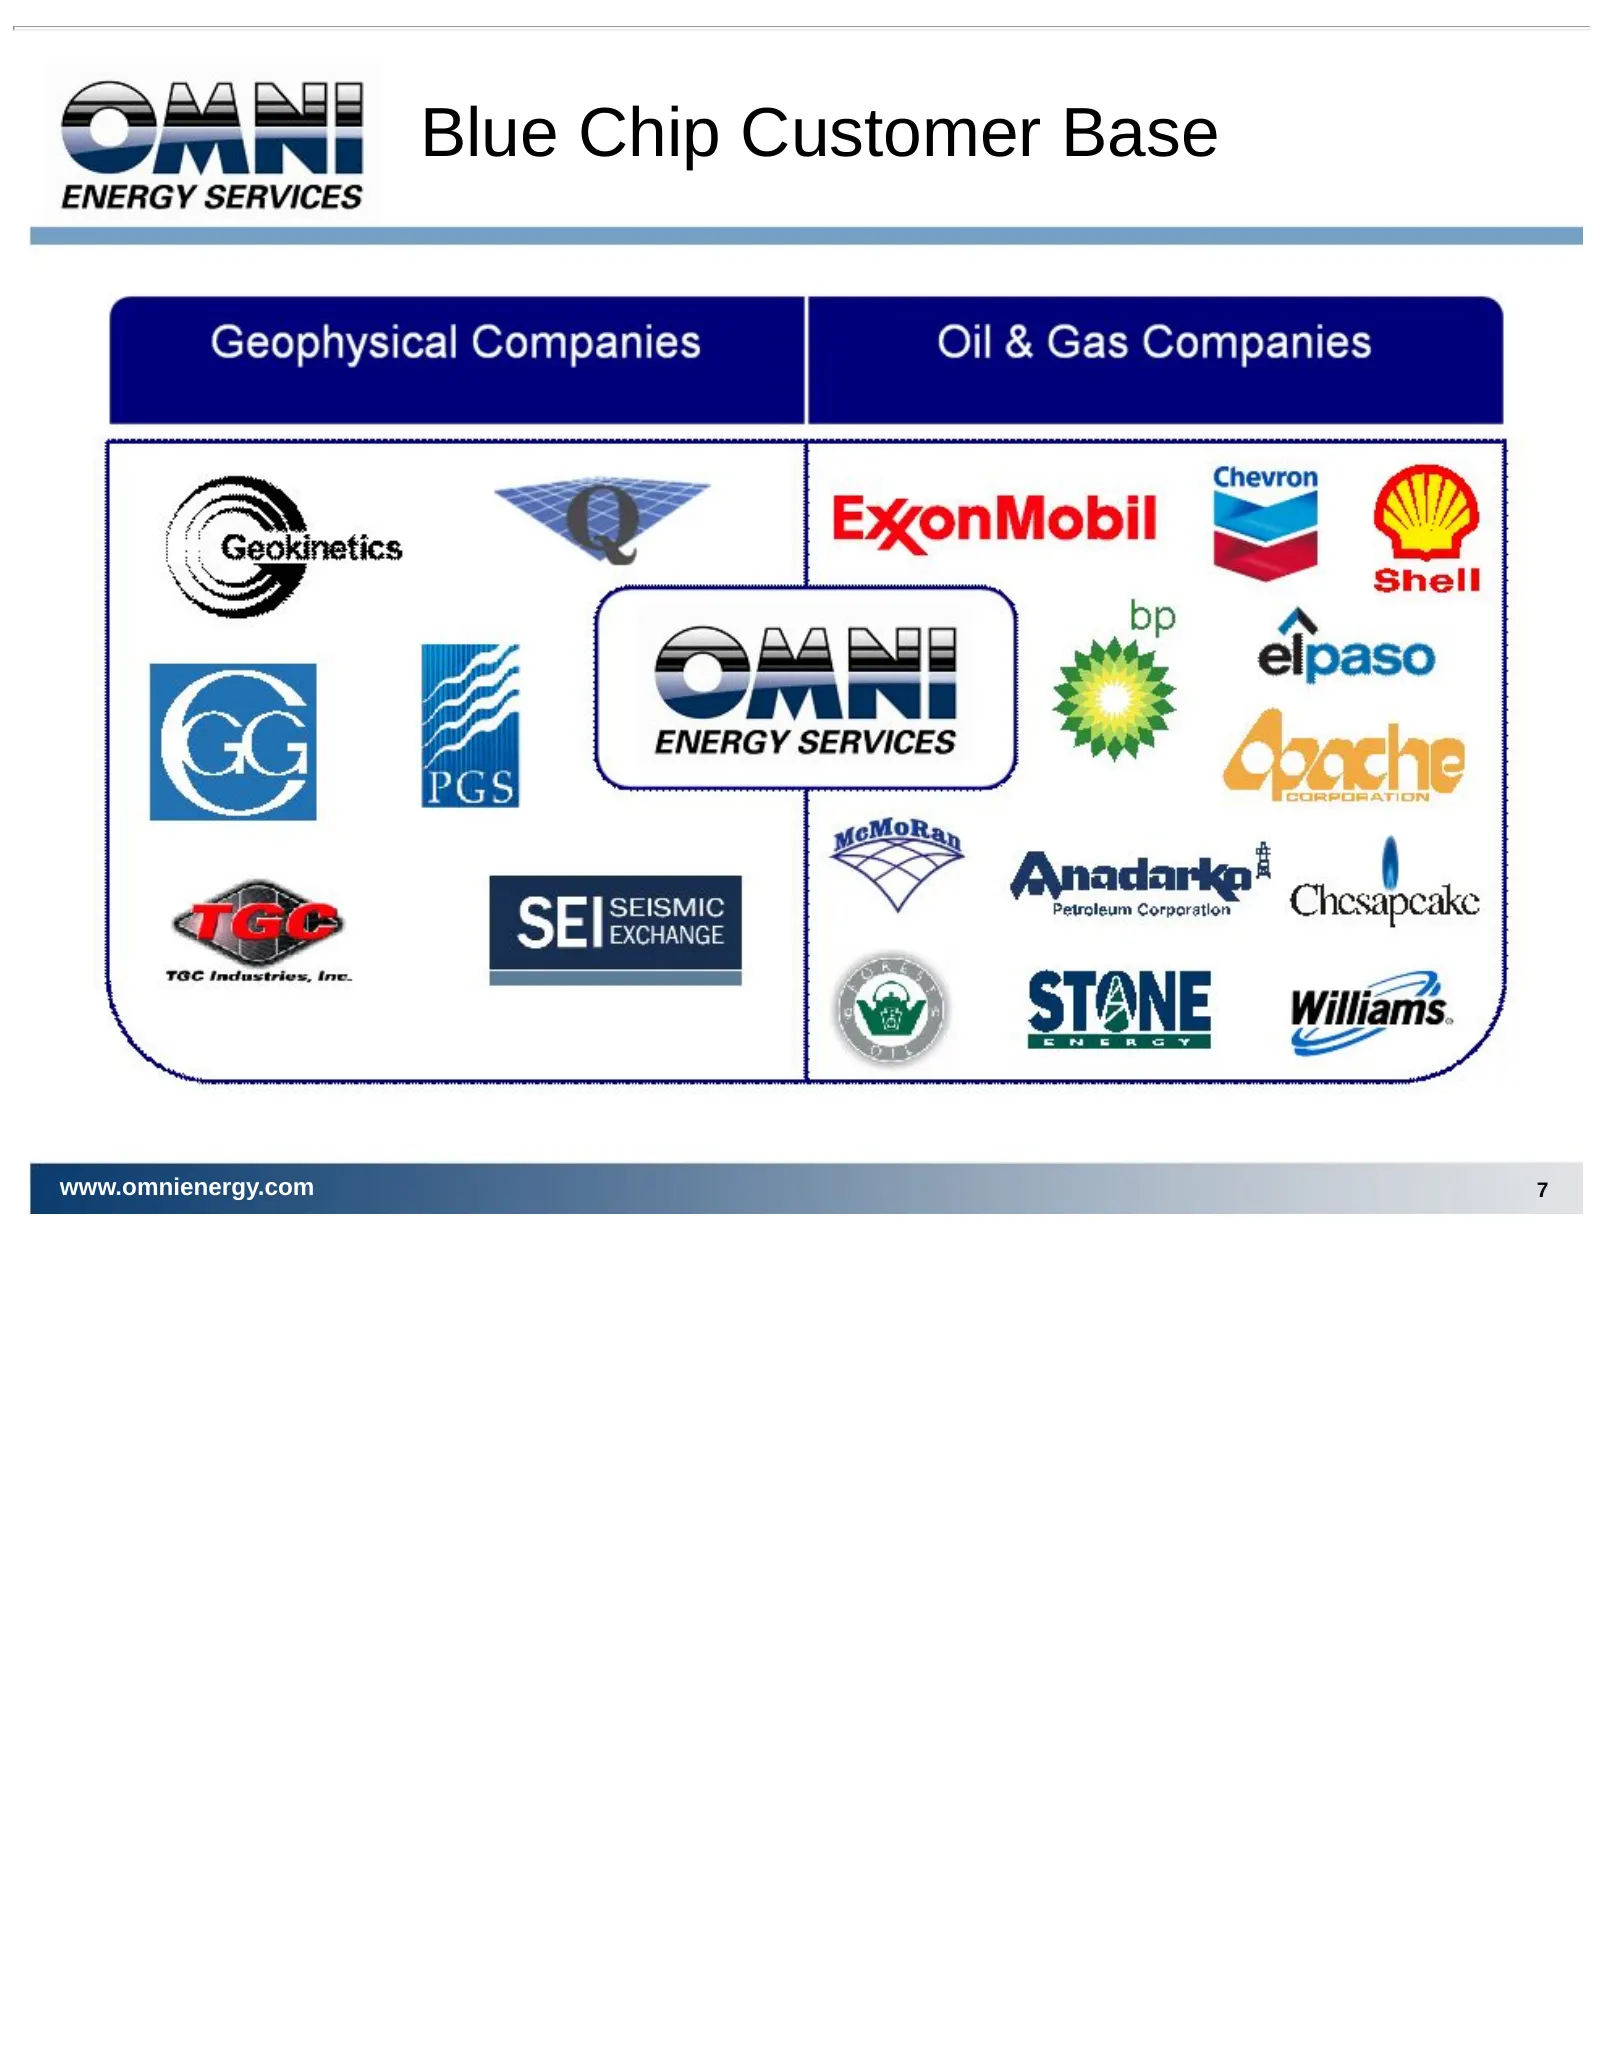
Blue Chip Customer Base www.omnienergy.com 7
Slide 8: Company History
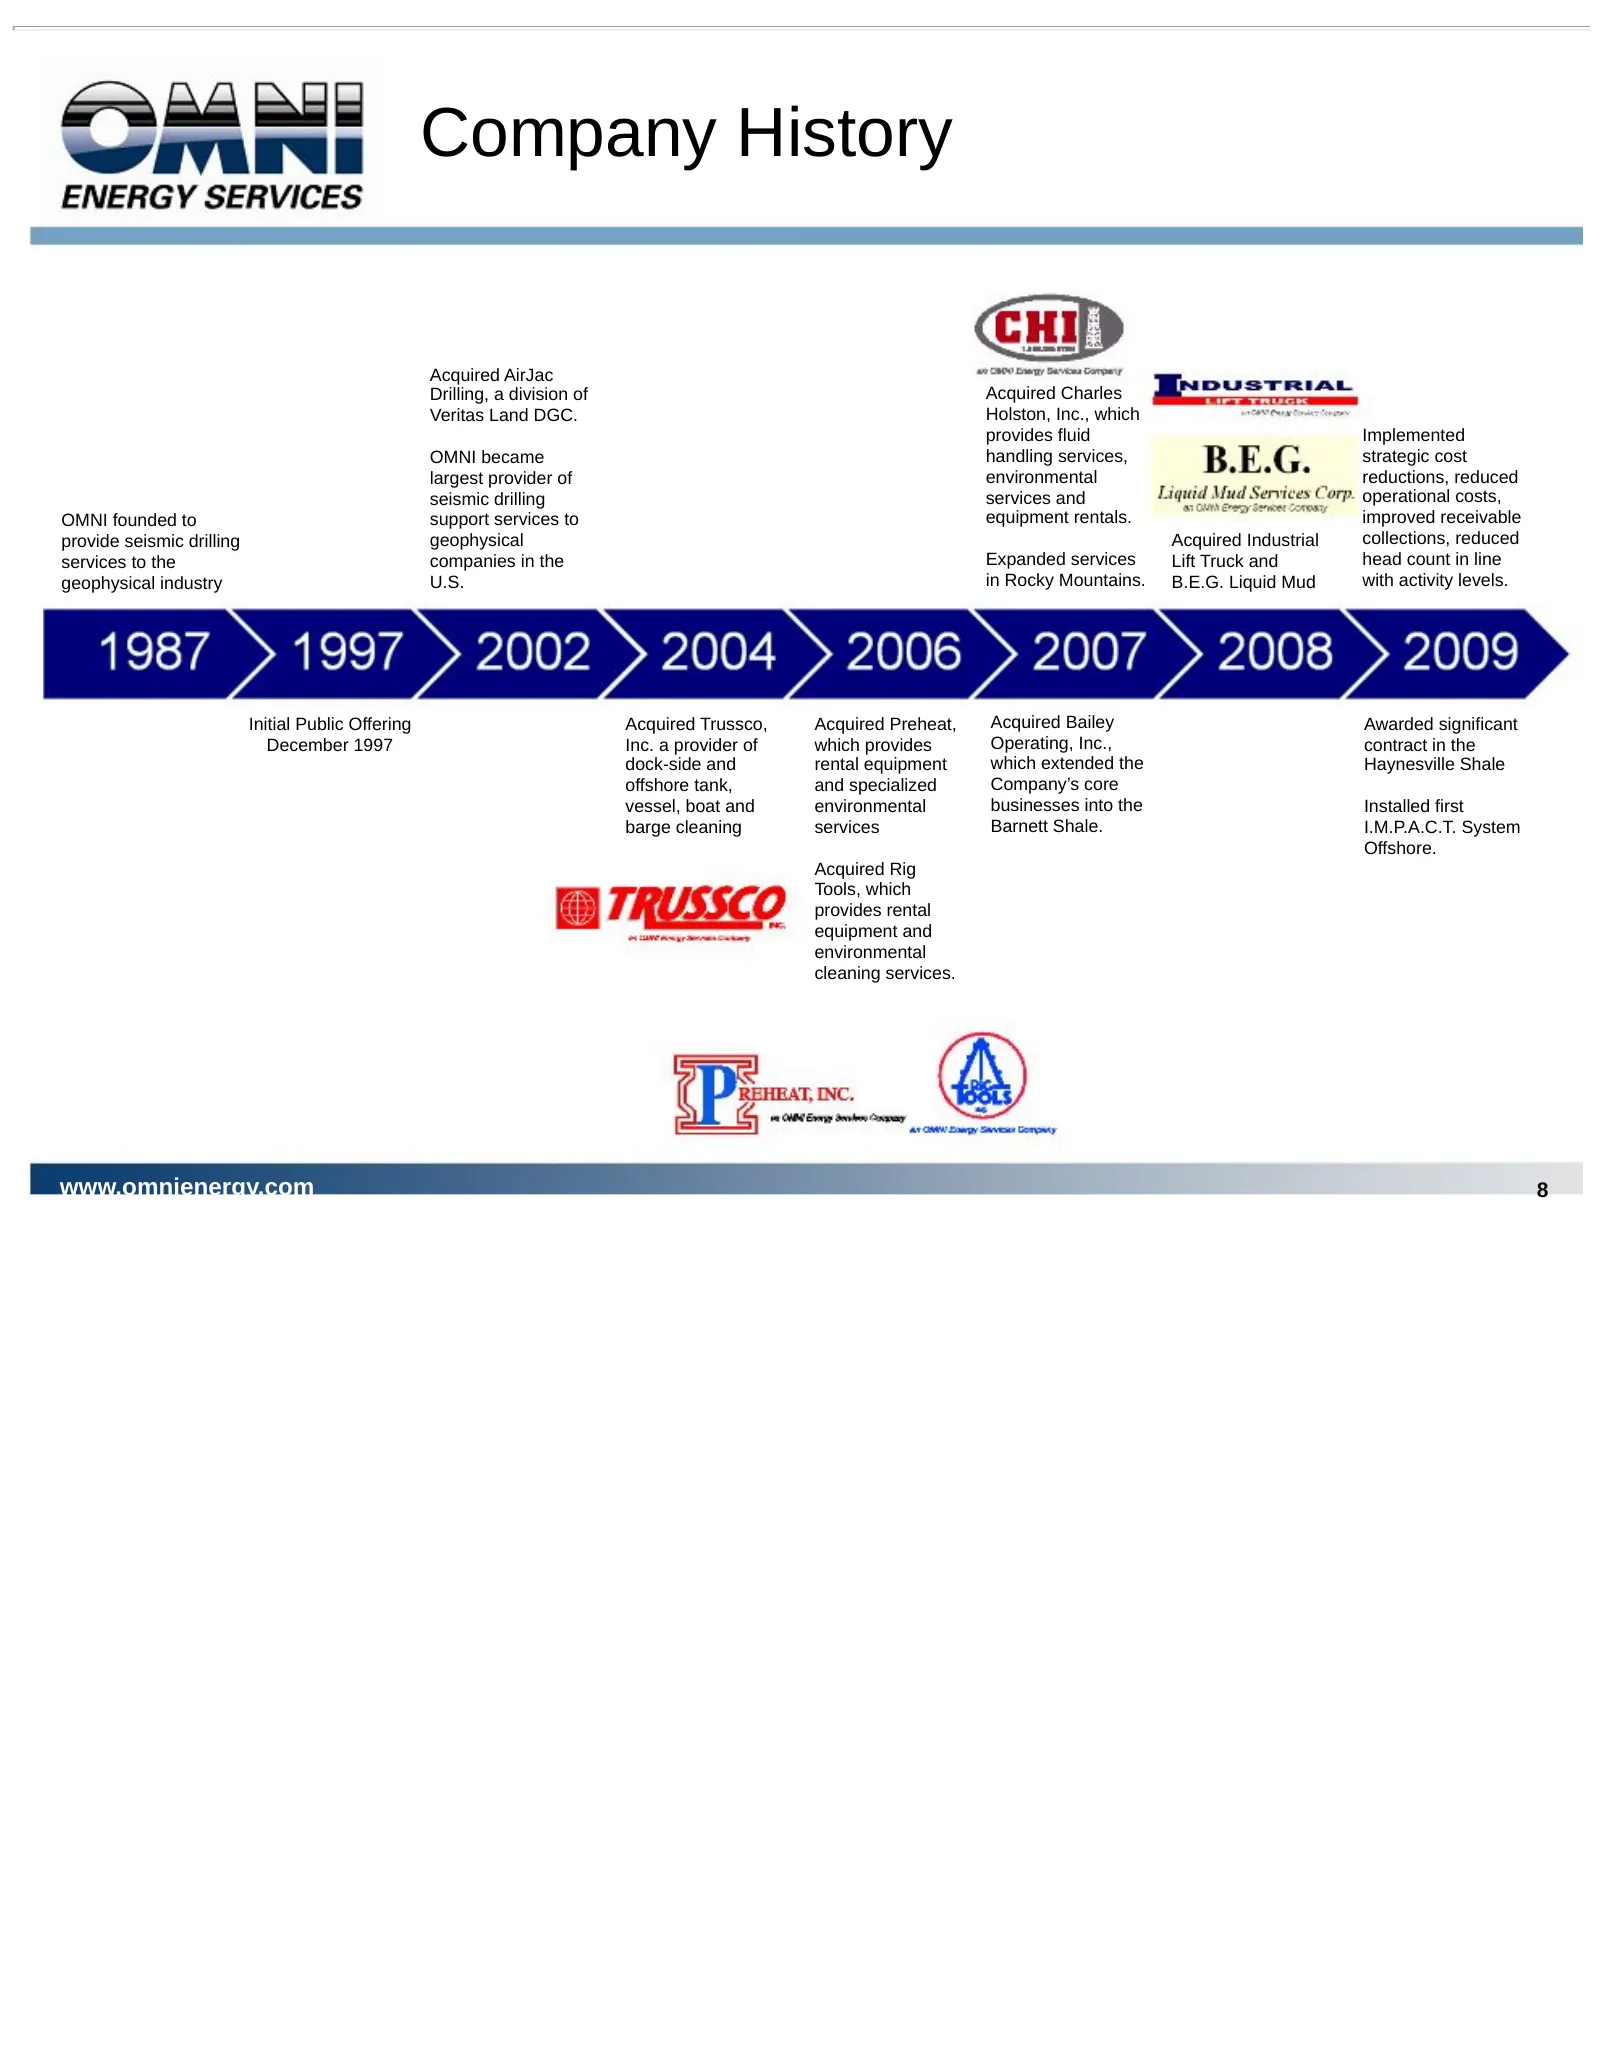
Company History Acquired AirJac Drilling, a division of Acquired Charles Veritas Land DGC. Holston, Inc., which provides fluid Implemented OMNI became handling services, strategic cost largest provider of environmental reductions, reduced seismic drilling services and operational costs, OMNI founded
Slide 9: Seismic Services
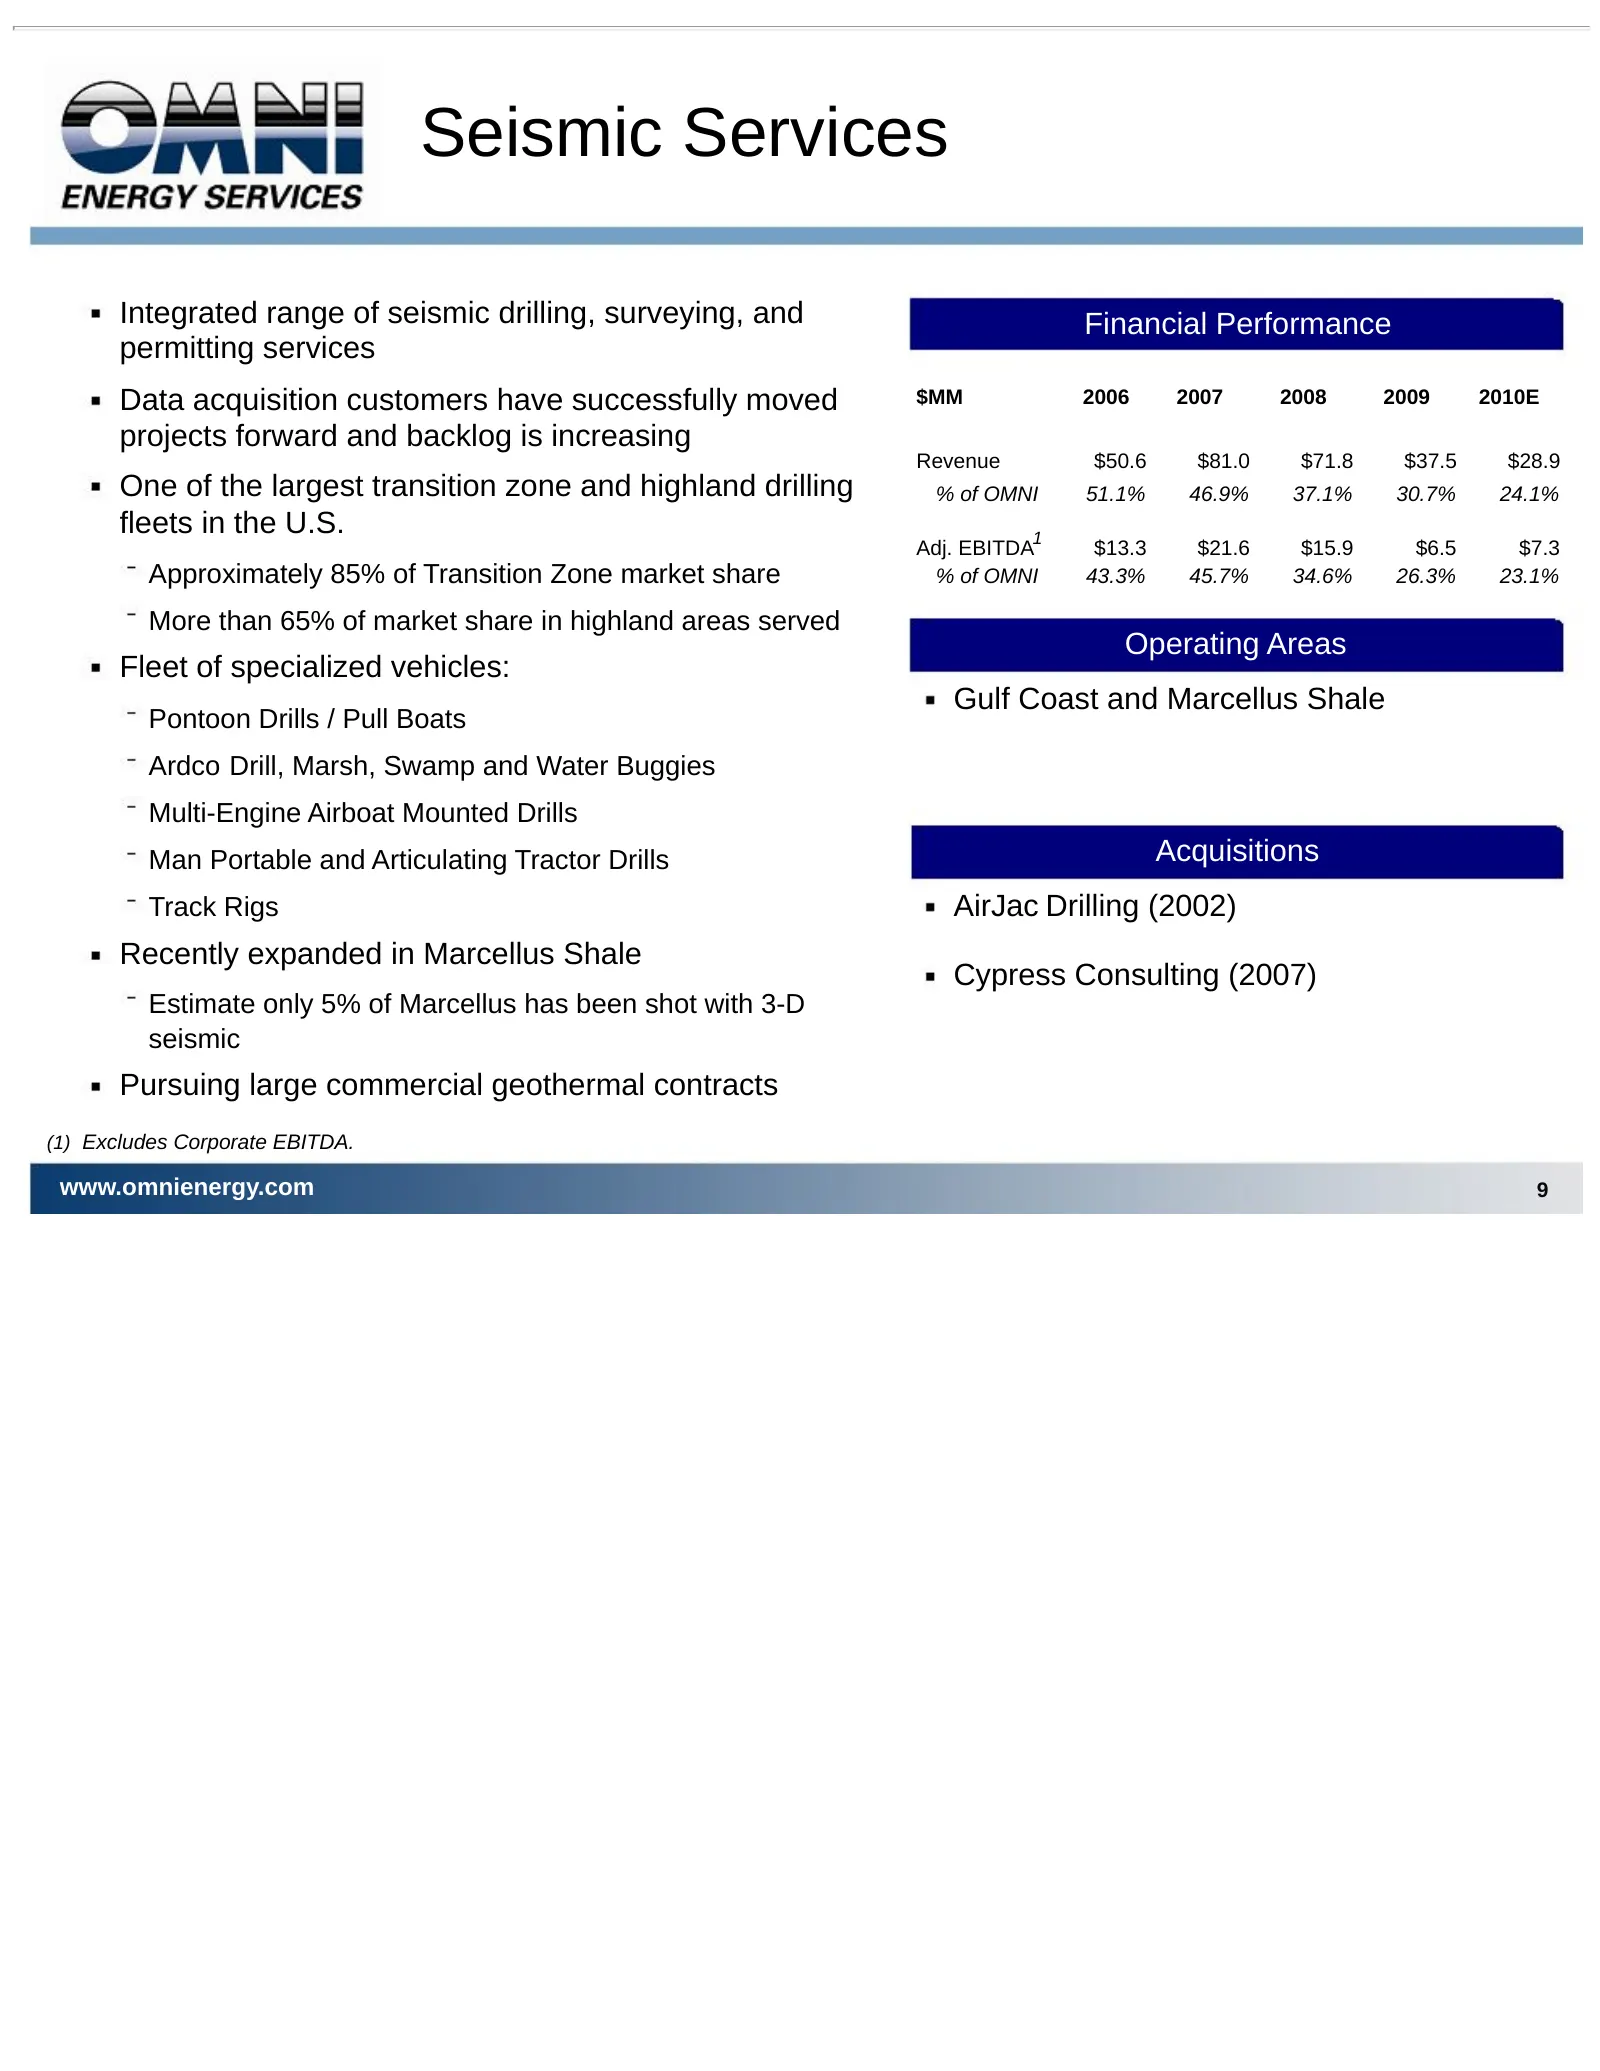
Seismic Services Integrated range of seismic drilling, surveying, and Financial Performance permitting services Data acquisition customers have successfully moved $MM 2006 2007 2008 2009 2010E projects forward and backlog is increasing Revenue $50.6 $81.0 $71.8 $37.5 $28.9 One of the largest transit
Slide 10: Environmental and Other Services
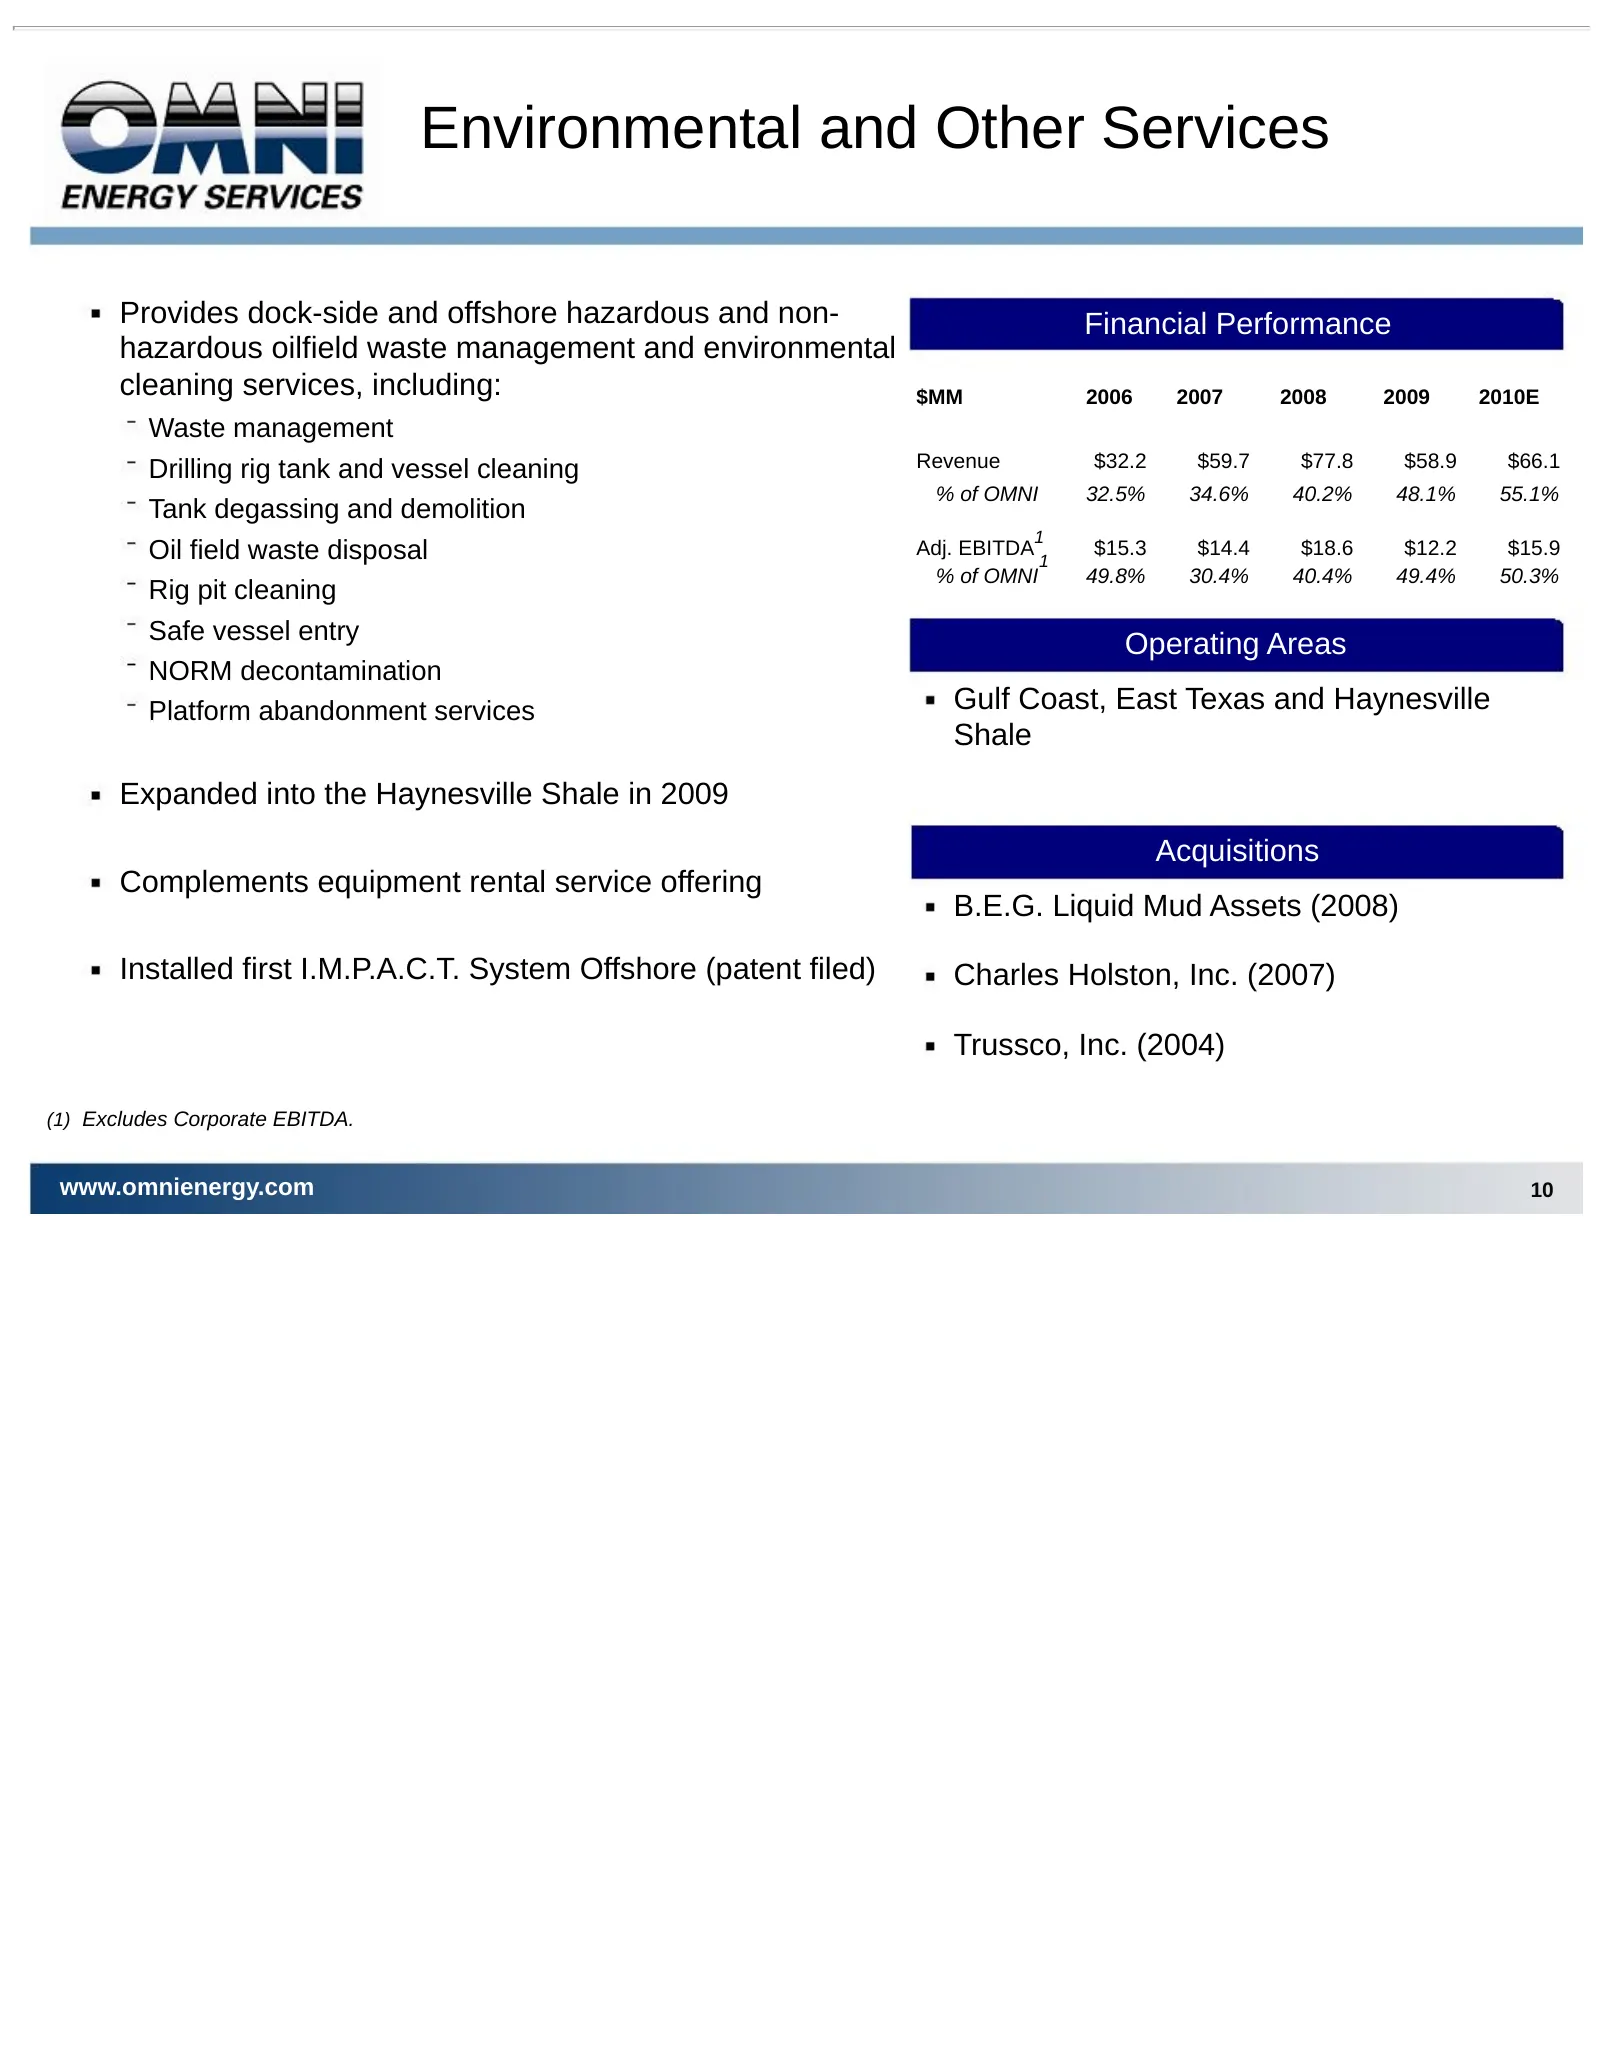
Environmental and Other Services Provides dock-side and offshore hazardous and non- Financial Performance hazardous oilfield waste management and environmental cleaning services, including: $MM 2006 2007 2008 2009 2010E Waste management Drilling rig tank and vessel cleaning Revenue $32.2 $59.7 $77.8
Slide 11: Environmental and Other Services
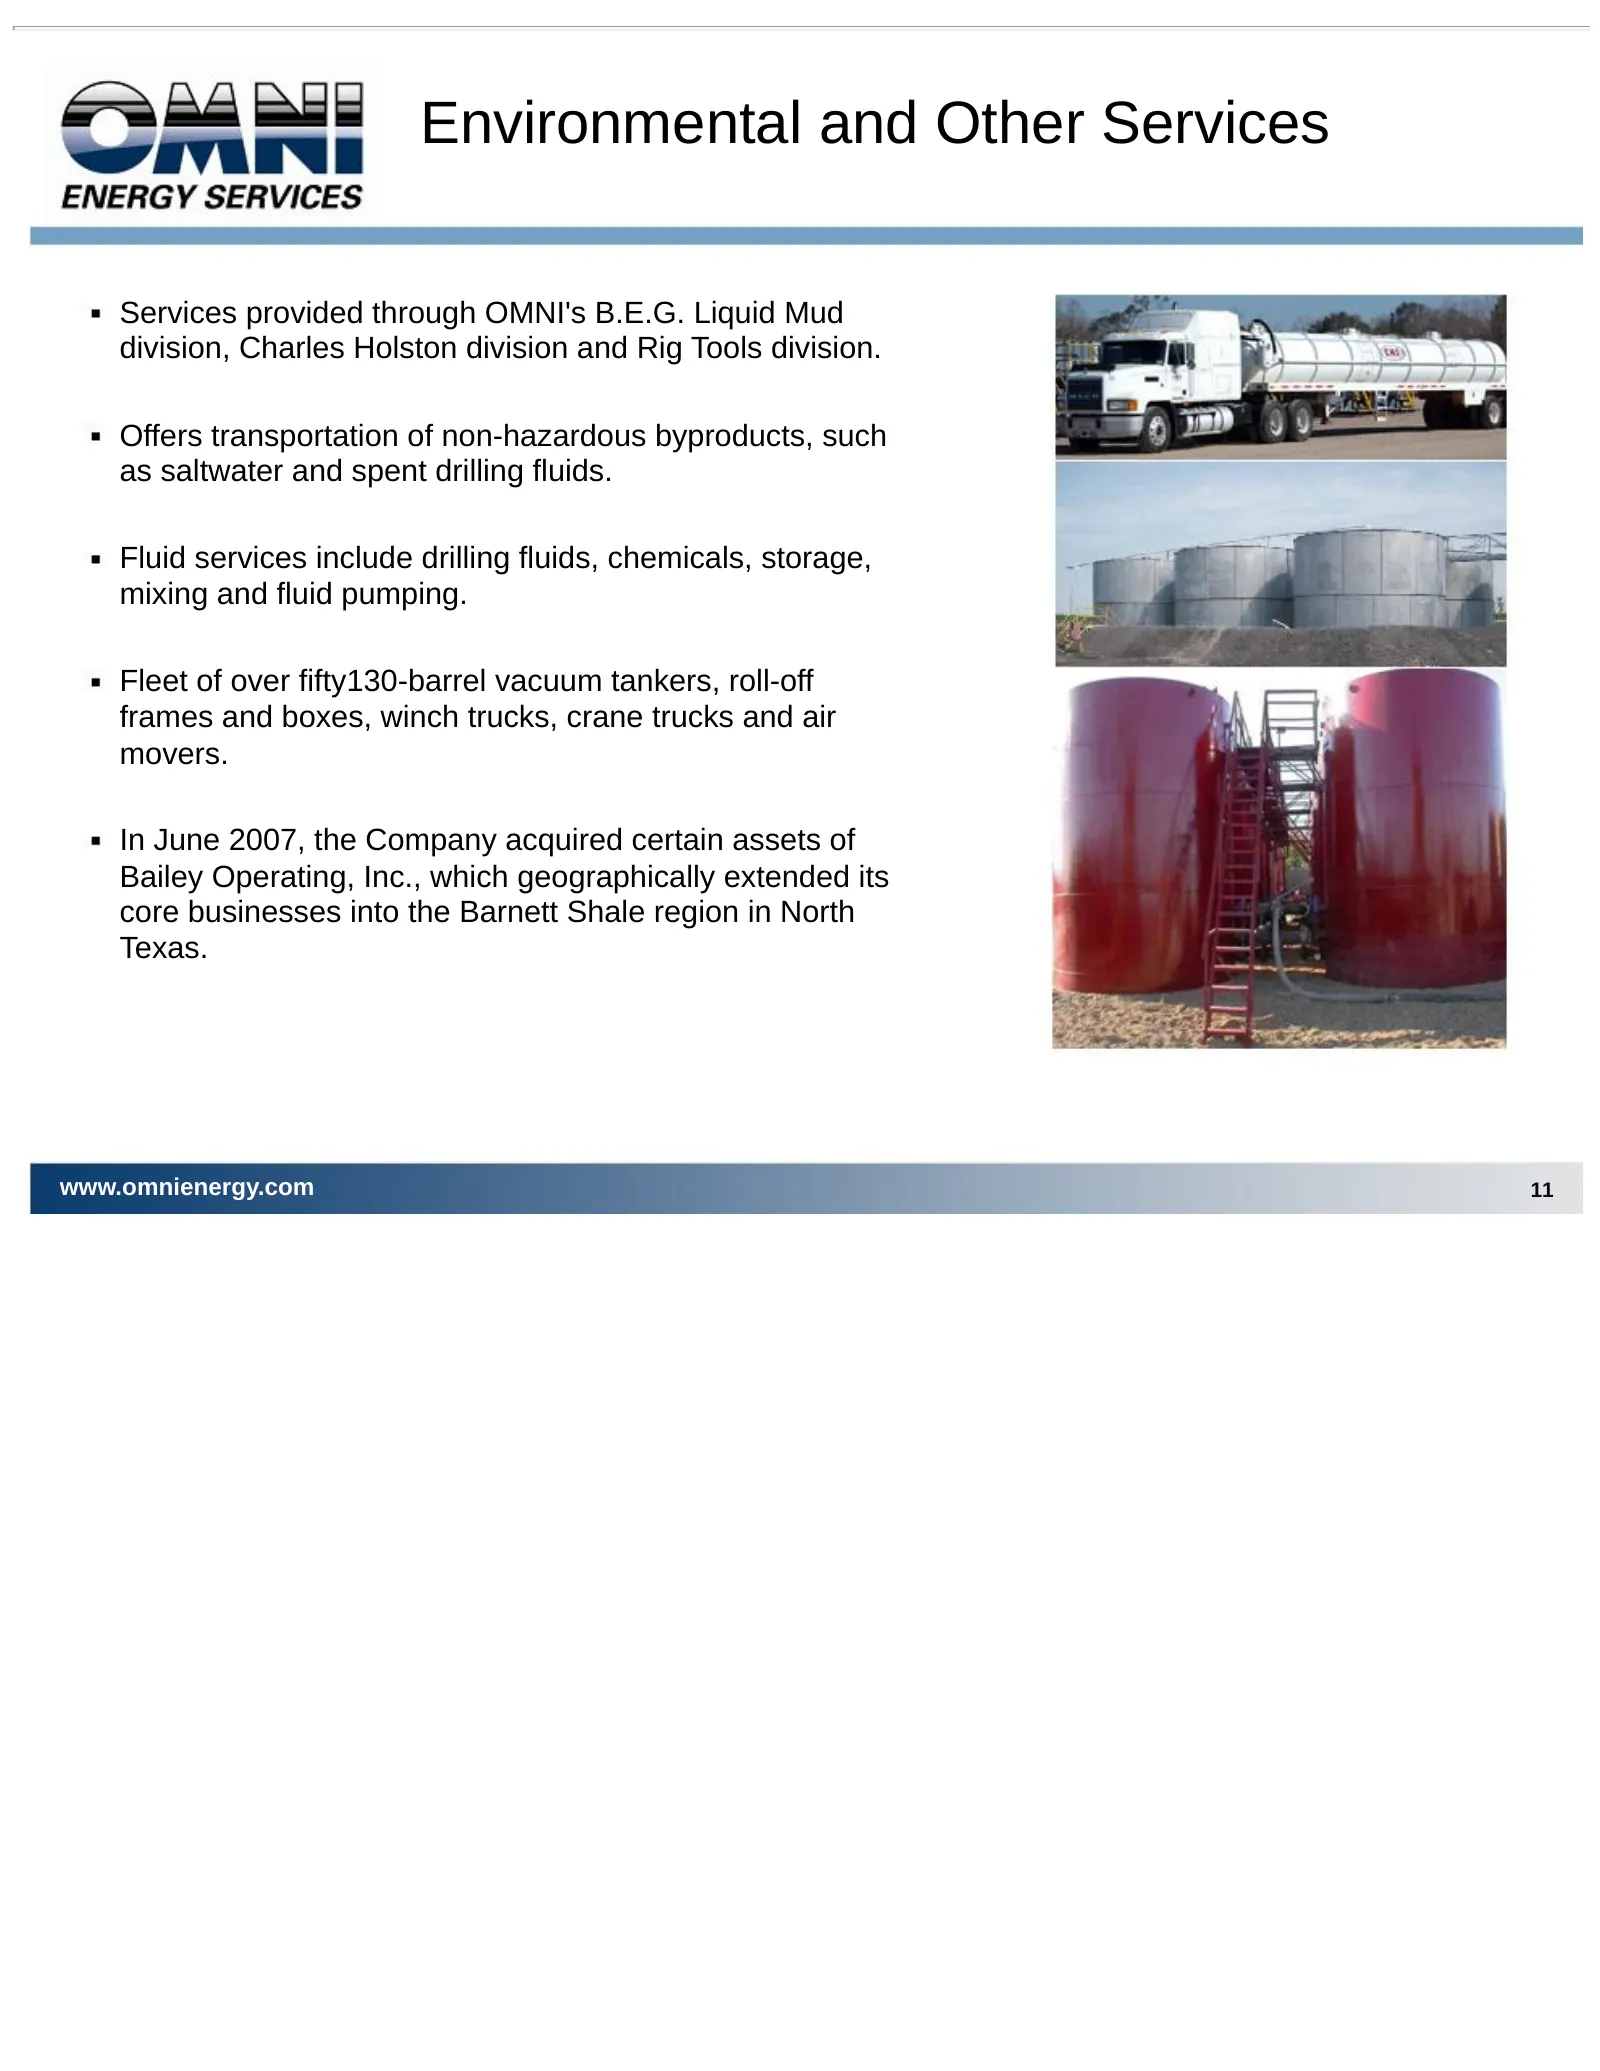
Environmental and Other Services Services provided through OMNI's B.E.G. Liquid Mud division, Charles Holston division and Rig Tools division. Offers transportation of non-hazardous byproducts, such as saltwater and spent drilling fluids. Fluid services include drilling fluids, chemicals, storage, m
Slide 12: Technological Initiatives
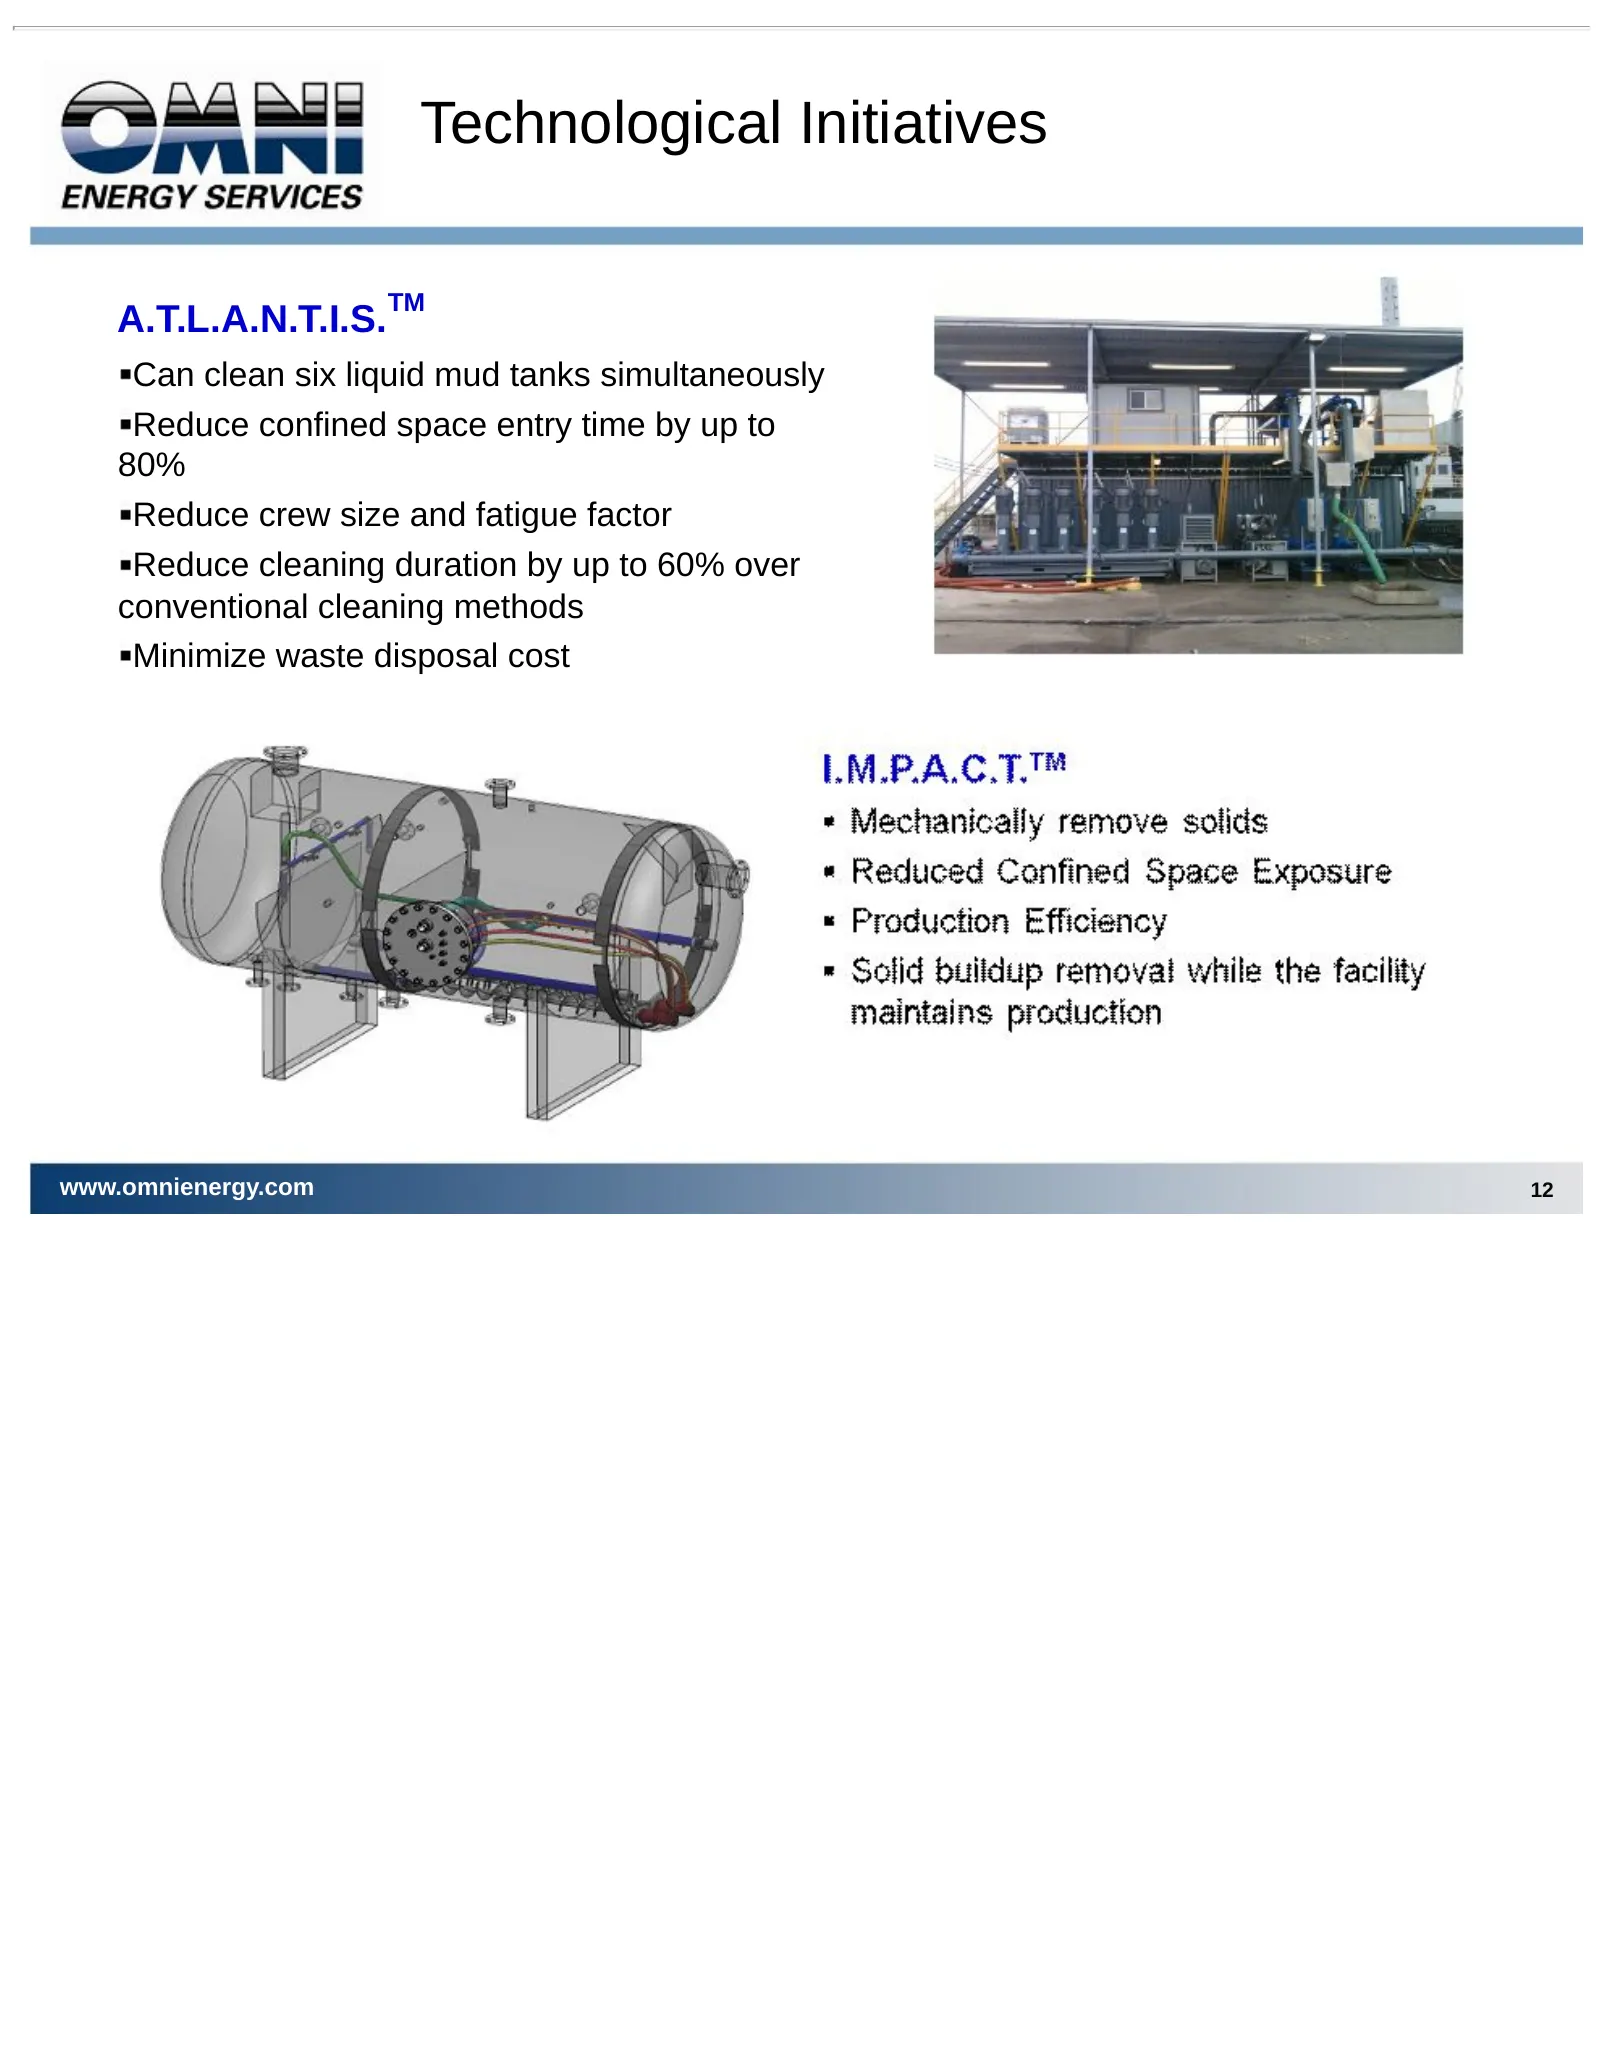
Technological Initiatives TM A.T.L.A.N.T.I.S. Can clean six liquid mud tanks simultaneously Reduce confined space entry time by up to 80% Reduce crew size and fatigue factor Reduce cleaning duration by up to 60% over conventional cleaning methods Minimize waste disposal cost www.omnienergy.com 12
Slide 13: Equipment Rental
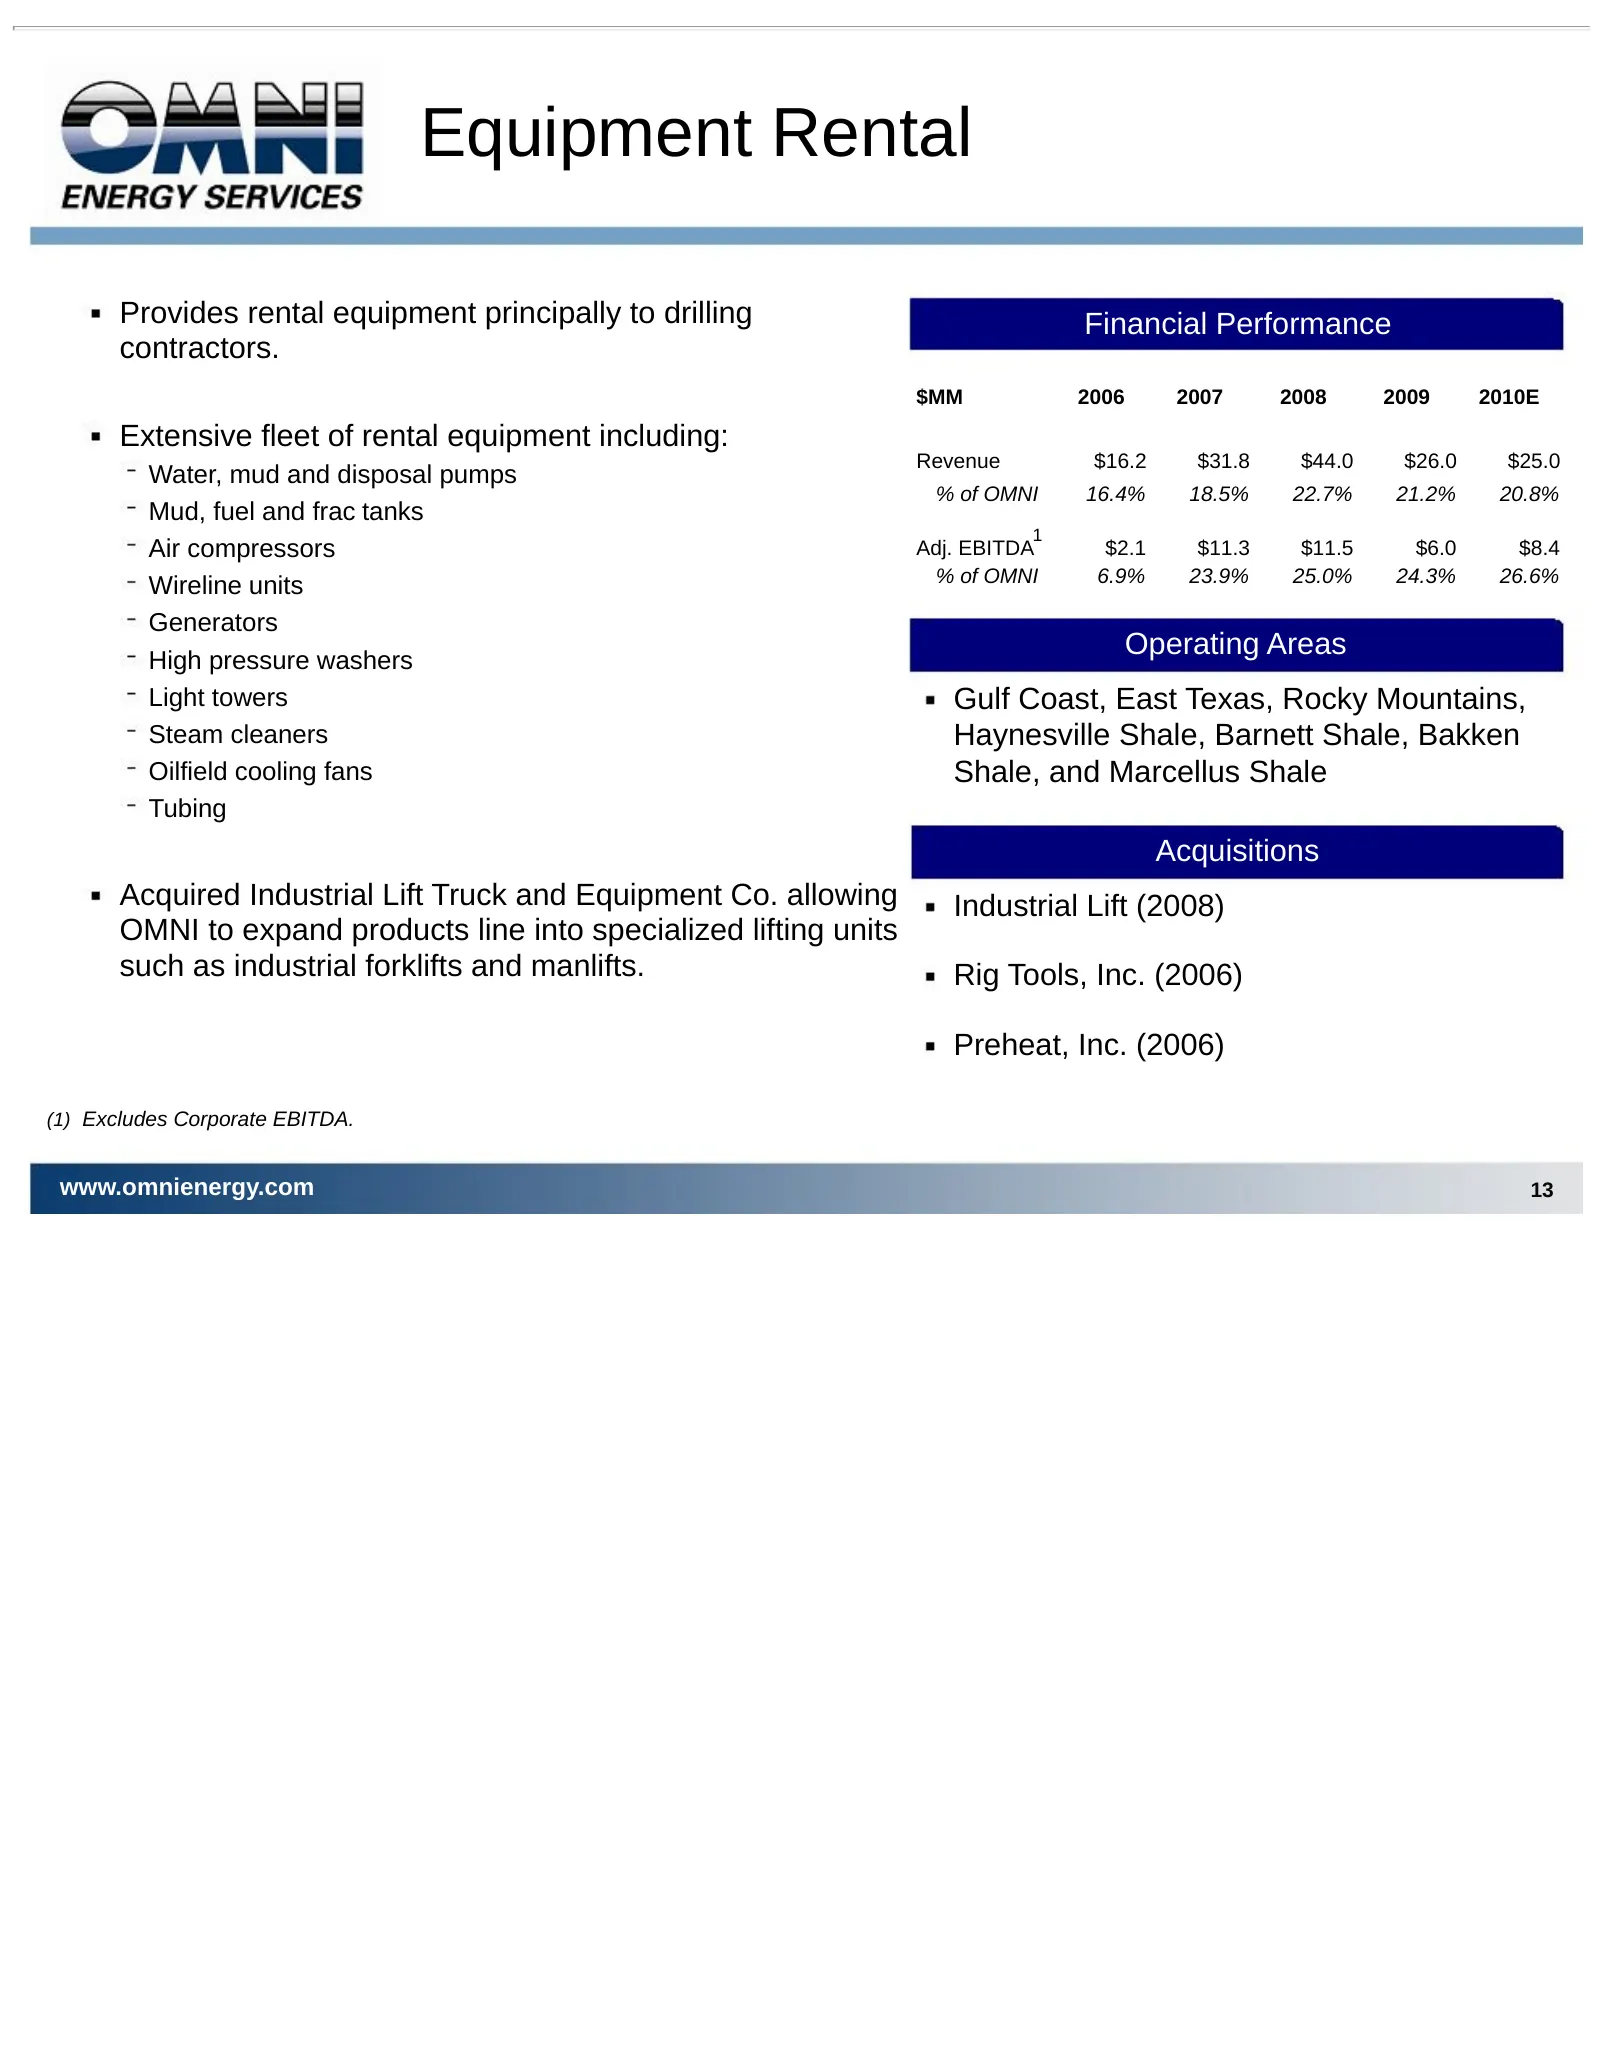
Equipment Rental Provides rental equipment principally to drilling Financial Performance contractors. $MM 2006 2007 2008 2009 2010E Extensive fleet of rental equipment including: Revenue $16.2 $31.8 $44.0 $26.0 $25.0 Water, mud and disposal pumps % of OMNI 16.4% 18.5% 22.7% 21.2% 20.8% Mud, fuel and
Slide 14: Investment Highlights
Investment Highlights Services for both oil and gas plays provide diversified cash flows Seismic, environmental, fluid handling, and equipment rental services Cash flow positive operations throughout oilfield cycles Regional leadership in seismic services provides access to all new transition zone p
Slide 15: Financial Review
Financial Review www.omnienergy.com 15
Slide 16: Financial Highlights
Financial Highlights Solid operating cash flow Managing cost structure: Headcount management – “Rightsizing” Improved safety program / claims management Facility consolidations Increased review of discretionary spending Capital expenditures modified to coincide with current activity levels www.omnie
Slide 17: Summary Income Statement
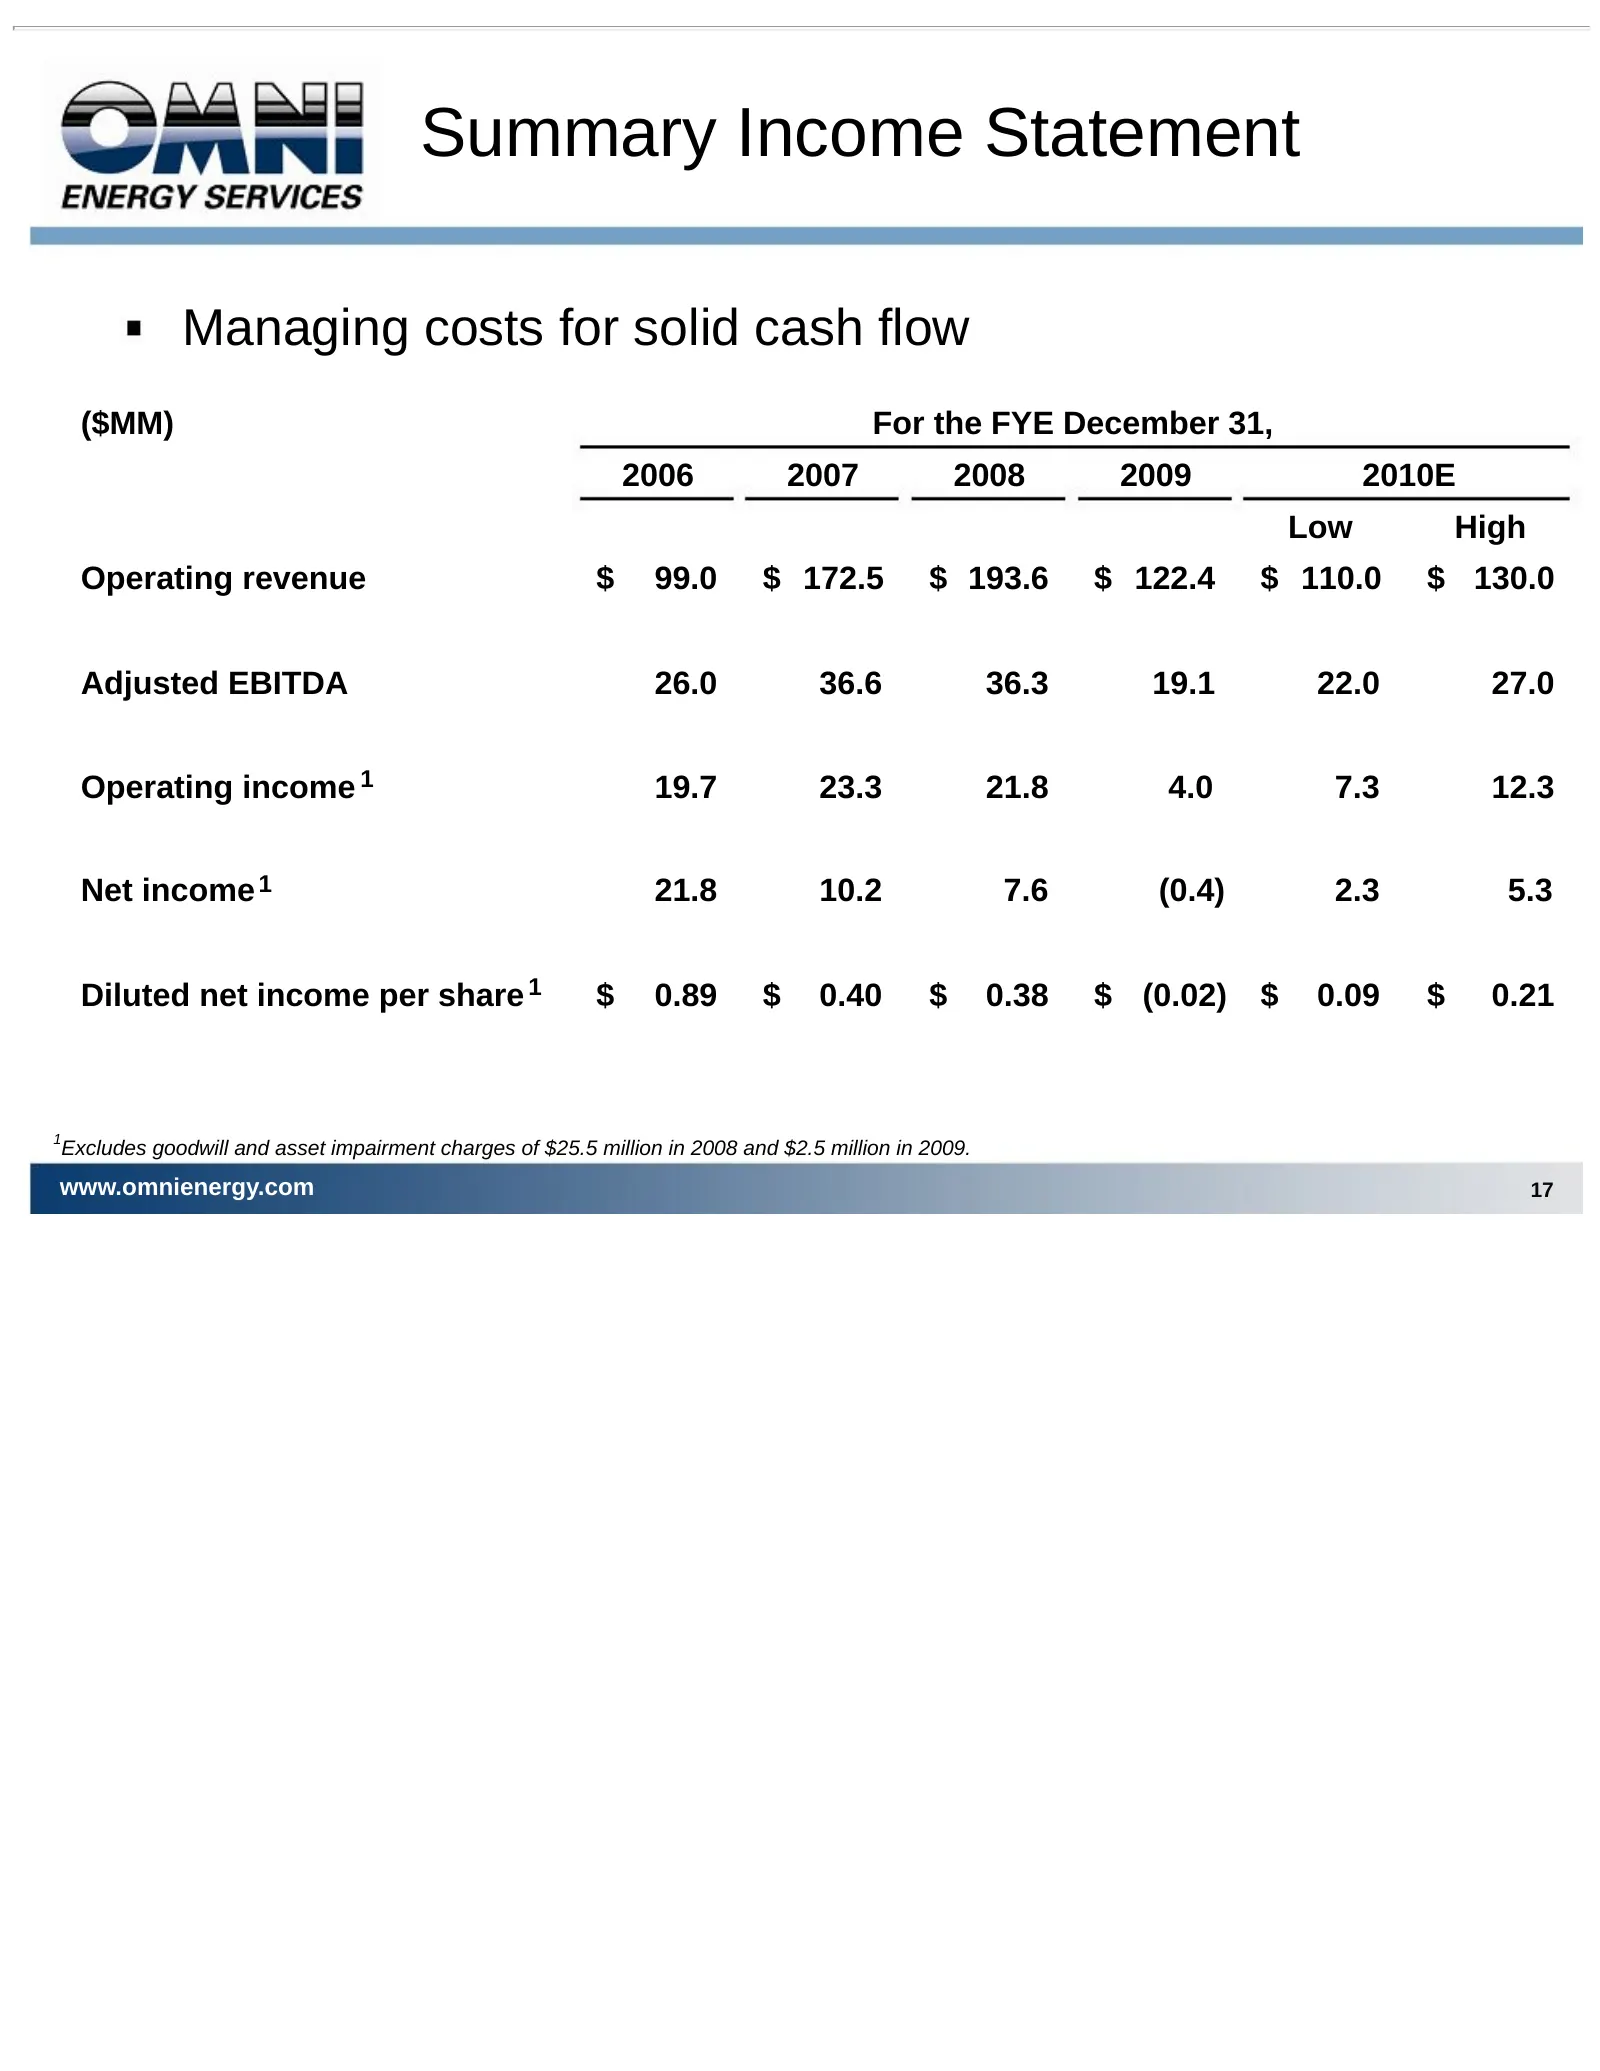
Summary Income Statement Managing costs for solid cash flow ($MM) For the FYE December 31, 2006 2007 2008 2009 2010E Low High Operating revenue $ 99.0 $ 172.5 $ 193.6 $ 122.4 $ 110.0 $ 130.0 Adjusted EBITDA 26.0 36.6 36.3 19.1 22.0 27.0 Operating income 1 19.7 23.3 21.8 4.0 7.3 12.3 Net income 1 21.
Slide 18: Financial Strength
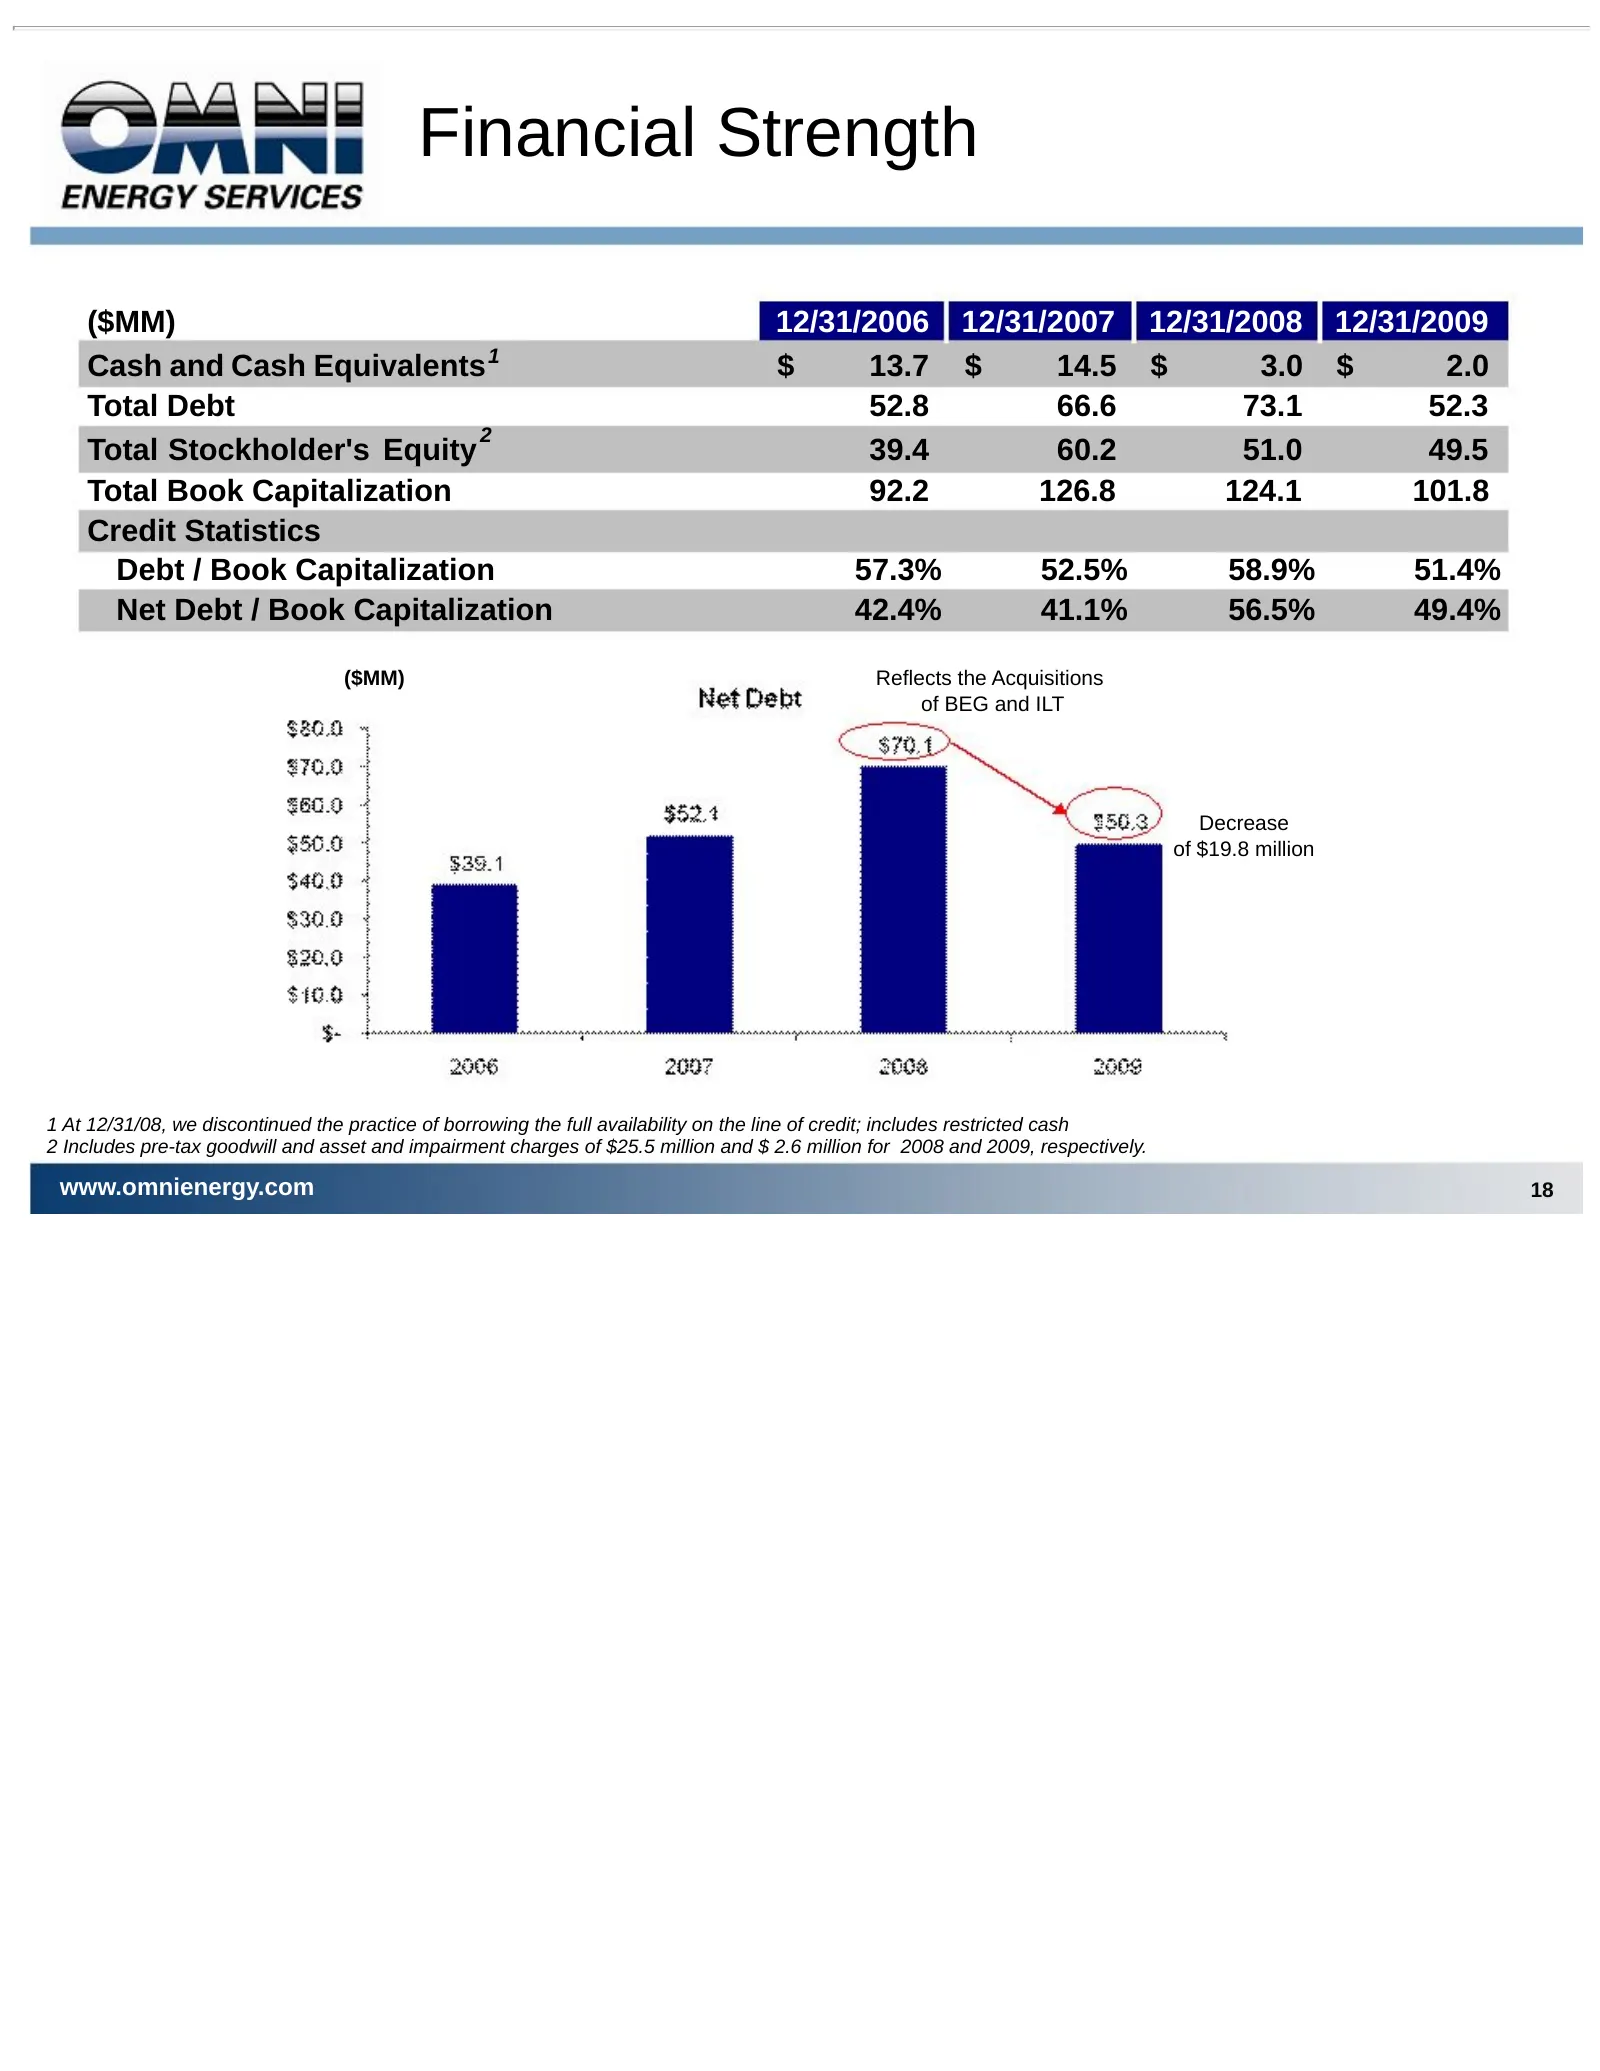
Financial Strength ($MM) 12/31/2006 12/31/2007 12/31/2008 12/31/2009 Cash and Cash Equivalents 1 $ 13.7 $ 14.5 $ 3.0 $ 2.0 Total Debt 52.8 66.6 73.1 52.3 2 Total Stockholder's Equity 39.4 60.2 51.0 49.5 Total Book Capitalization 92.2 126.8 124.1 101.8 Credit Statistics Debt / Book Capitalization 57.
Slide 19: 2010 Guidance
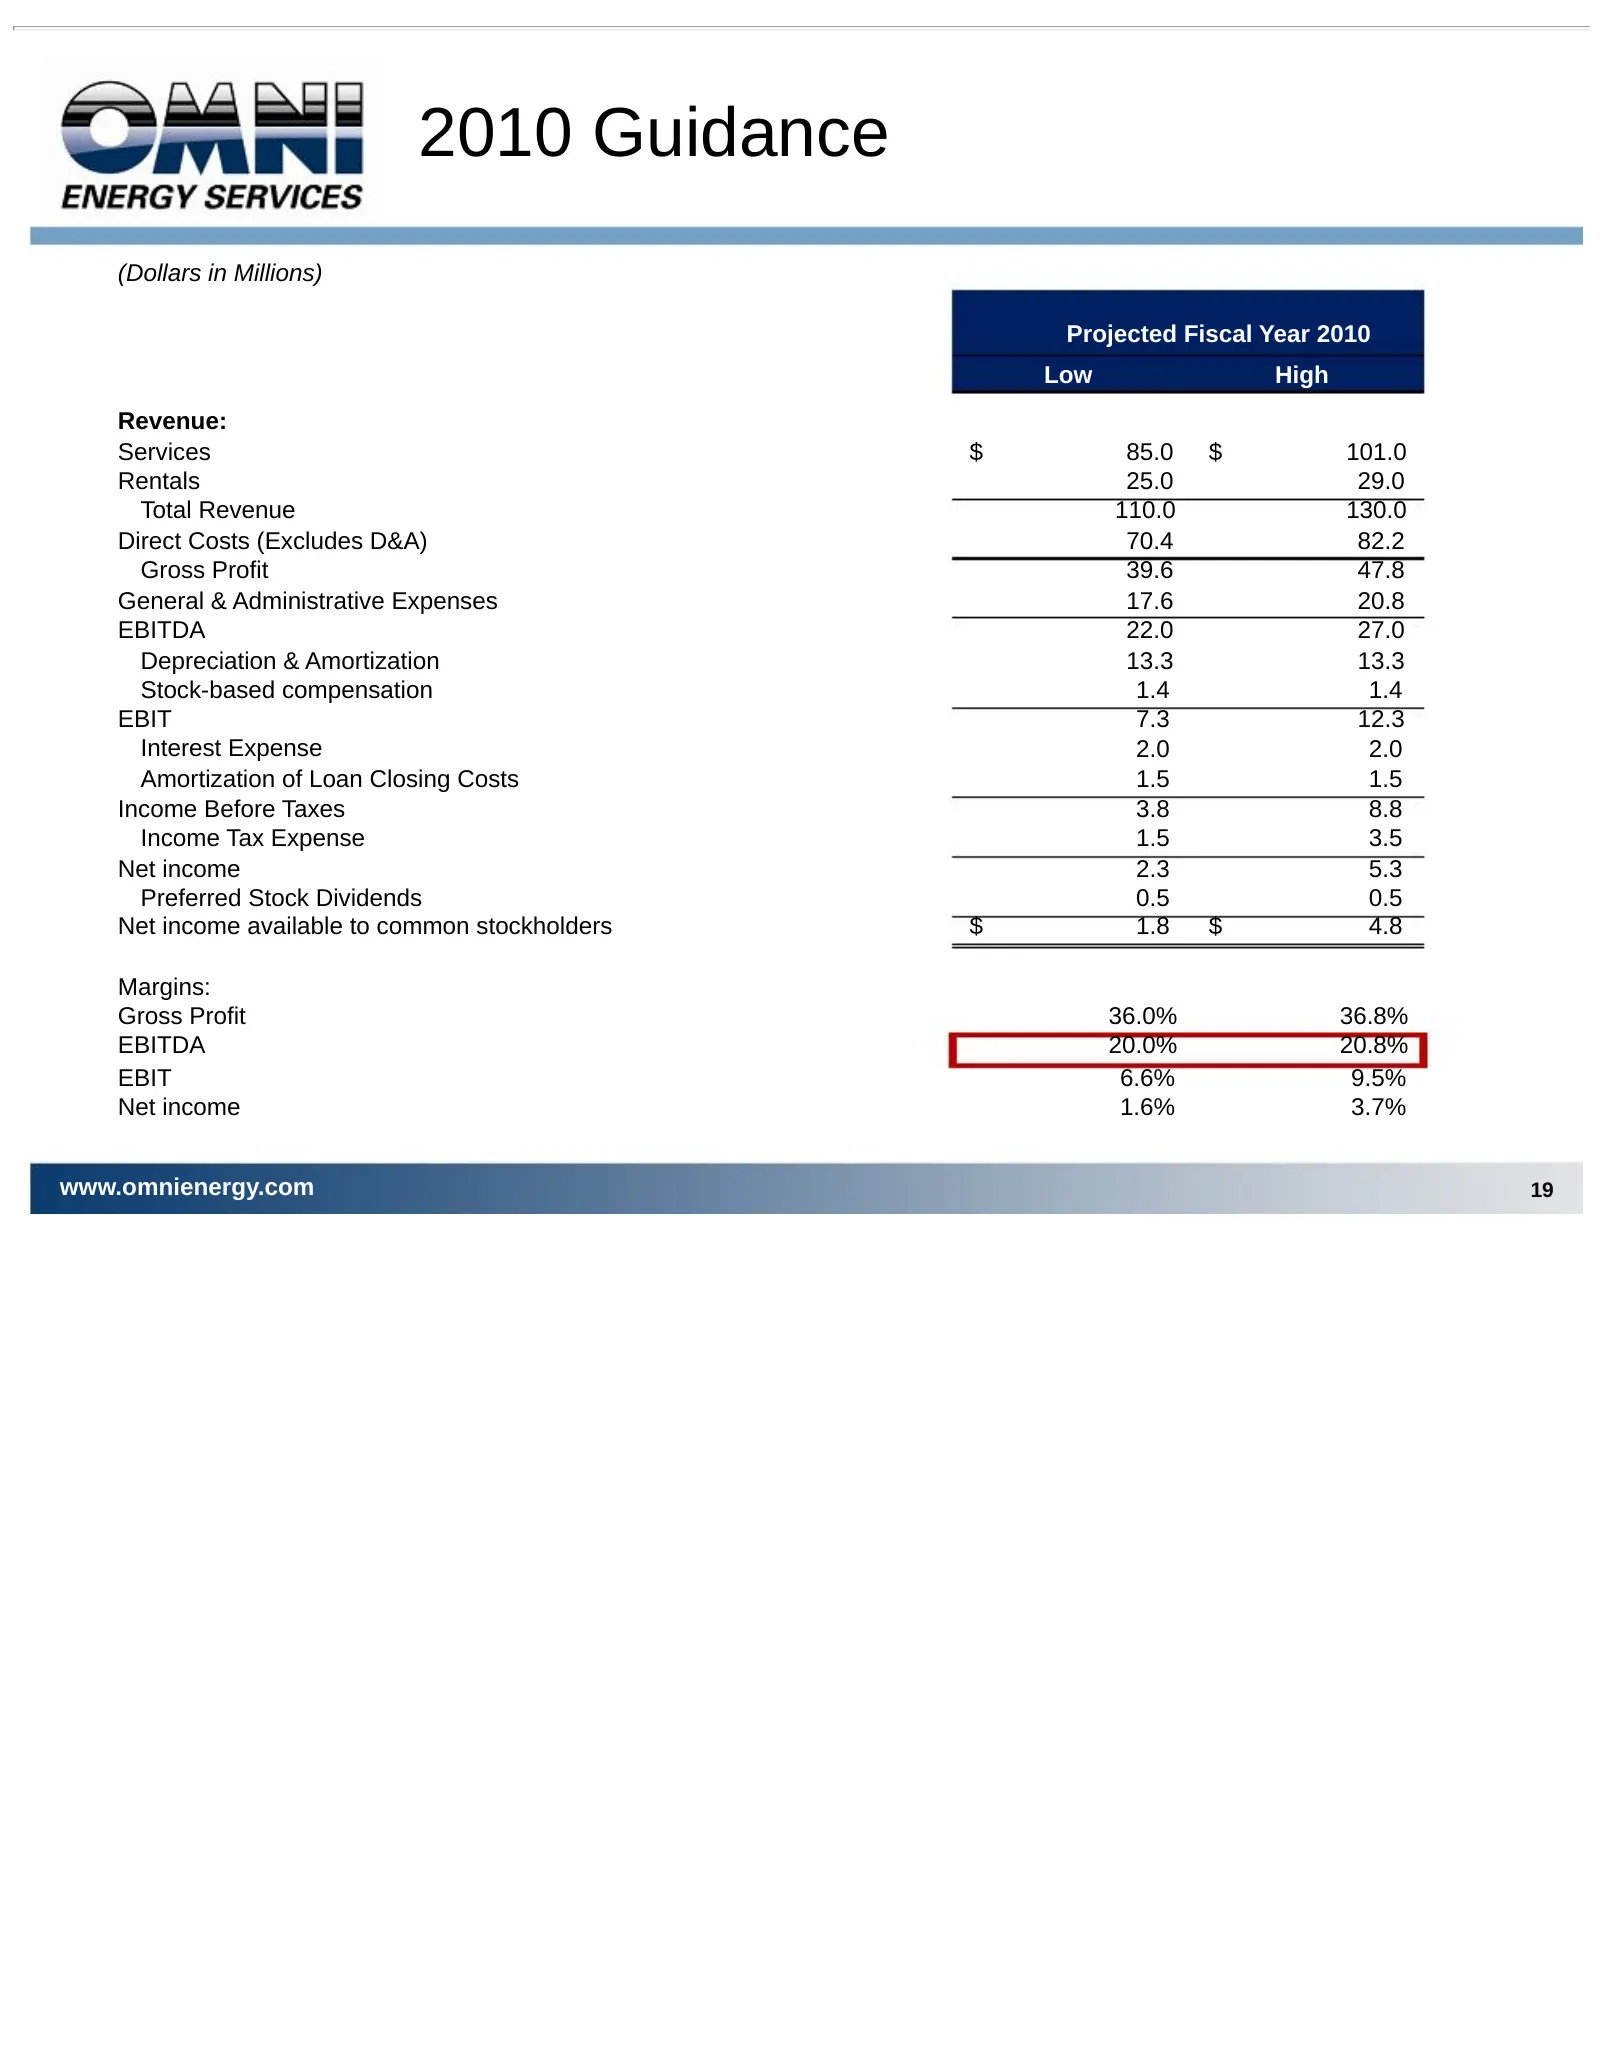
2010 Guidance (Dollars in Millions) Projected Fiscal Year 2010 Low High Revenue: Services $ 85.0 $ 101.0 Rentals 25.0 29.0 Total Revenue 110.0 130.0 Direct Costs (Excludes D&A) 70.4 82.2 Gross Profit 39.6 47.8 General & Administrative Expenses 17.6 20.8 EBITDA 22.0 27.0 Depreciation & Amortization 1
Slide 20: Conclusion
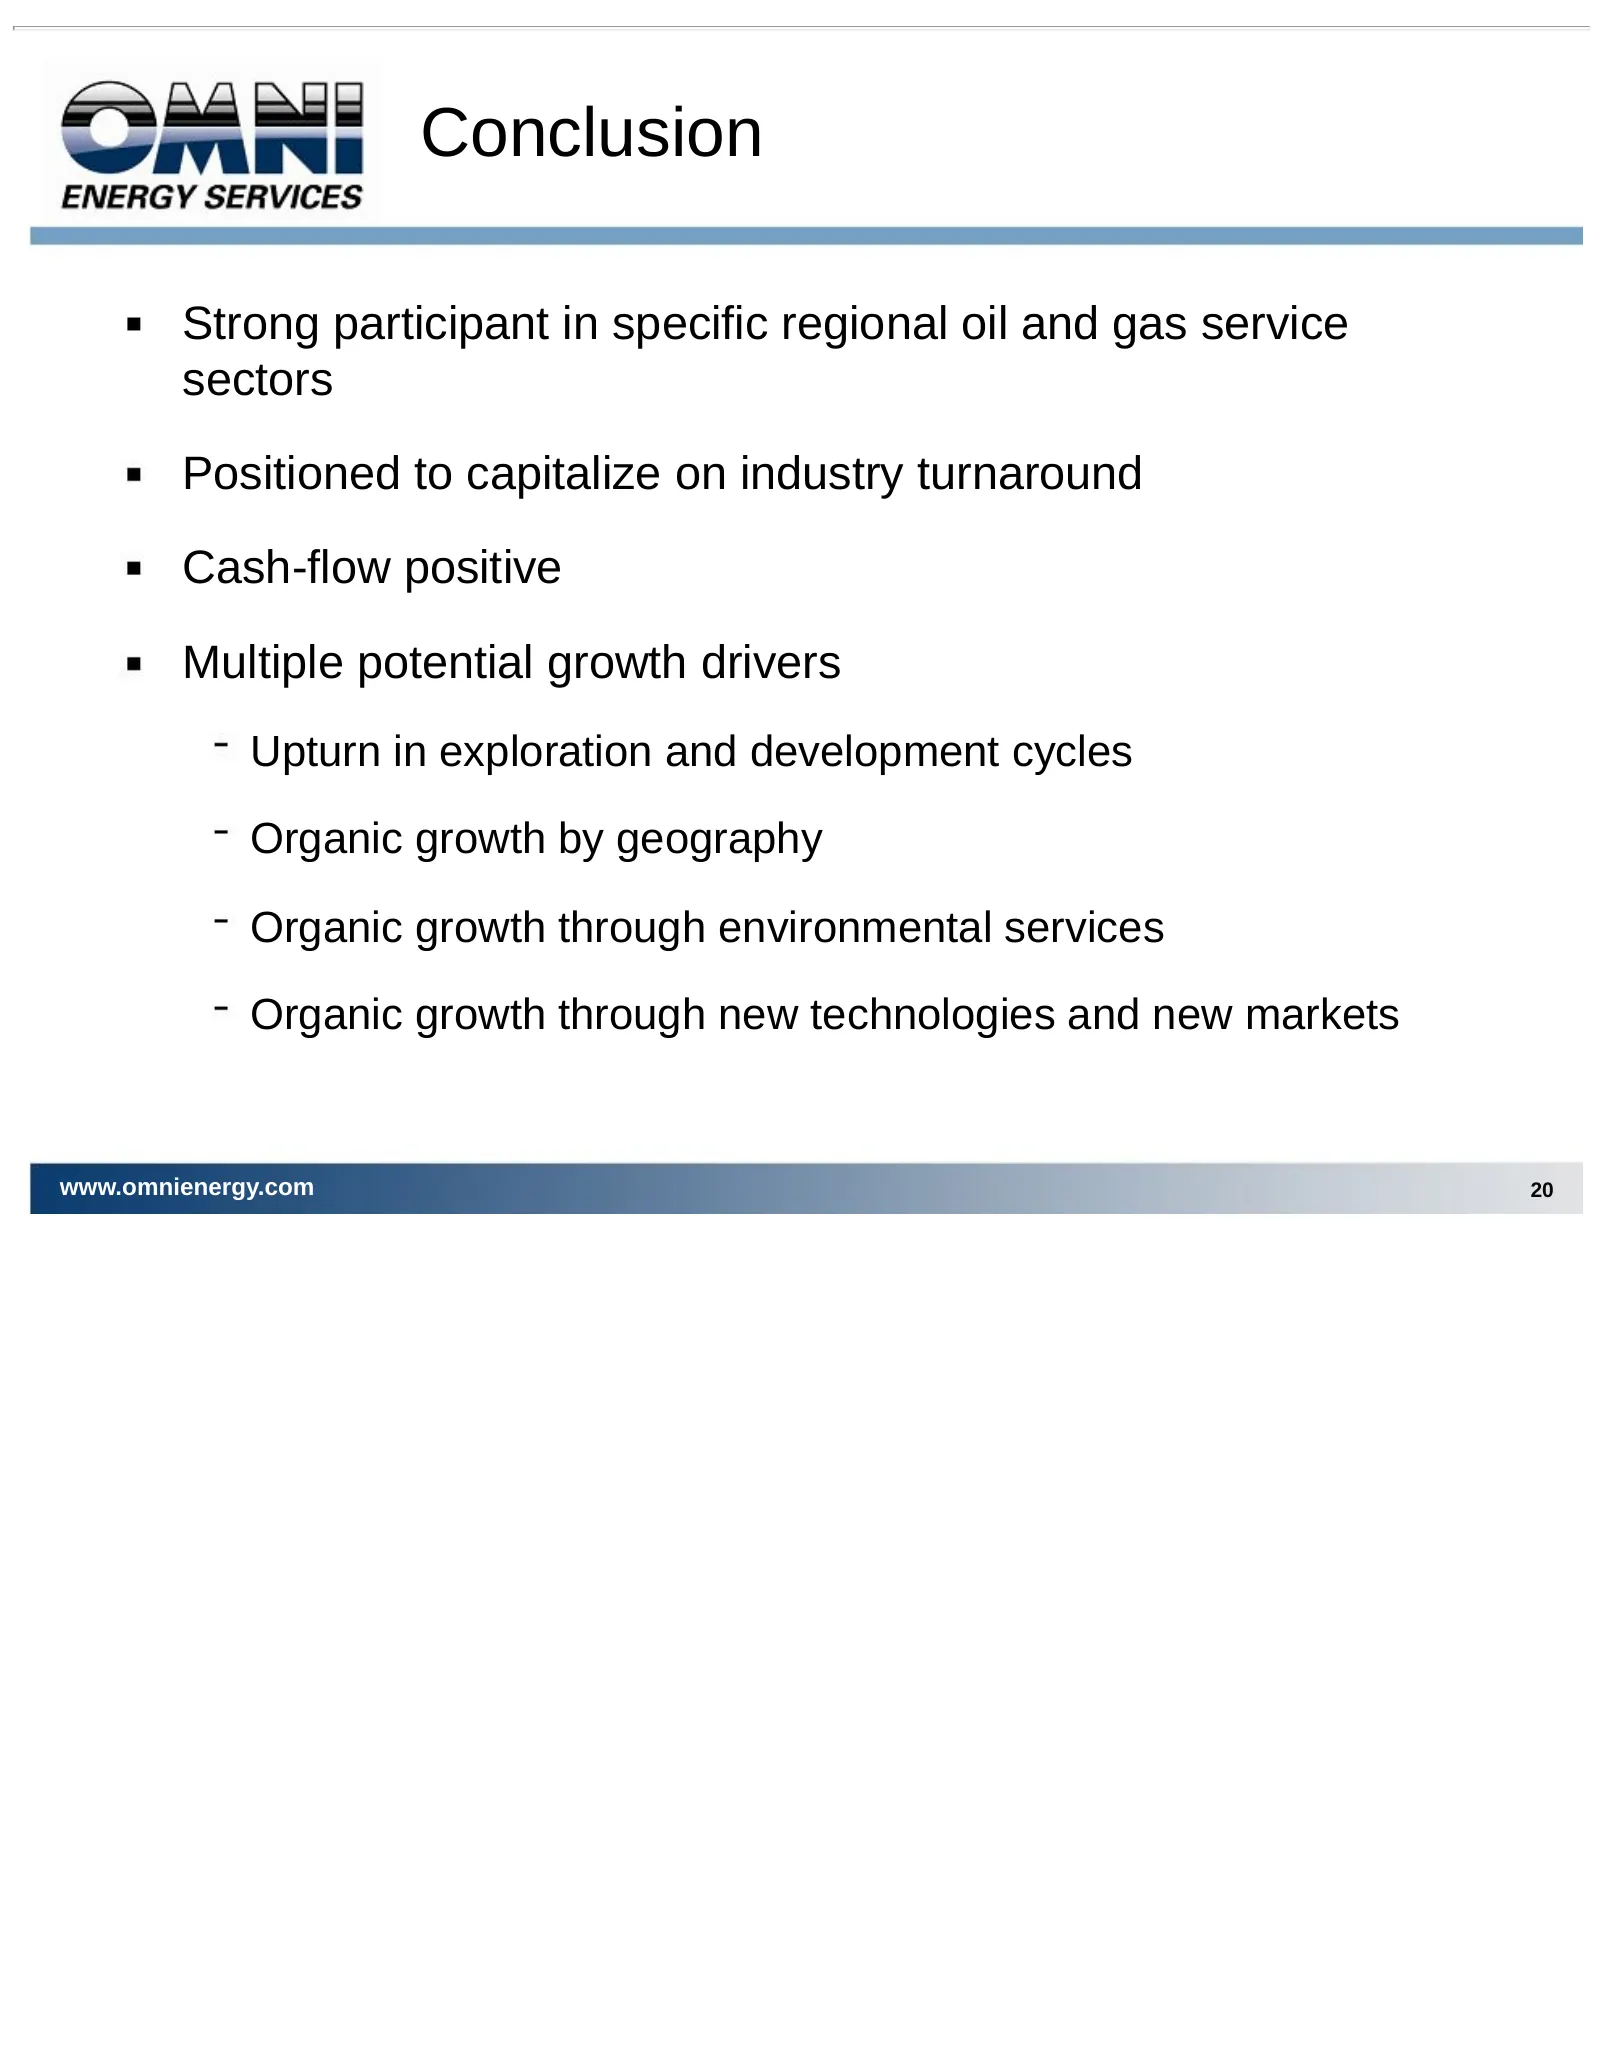
Conclusion Strong participant in specific regional oil and gas service sectors Positioned to capitalize on industry turnaround Cash-flow positive Multiple potential growth drivers Upturn in exploration and development cycles Organic growth by geography Organic growth through environmental services O
Slide 21: Adjusted EBITDA
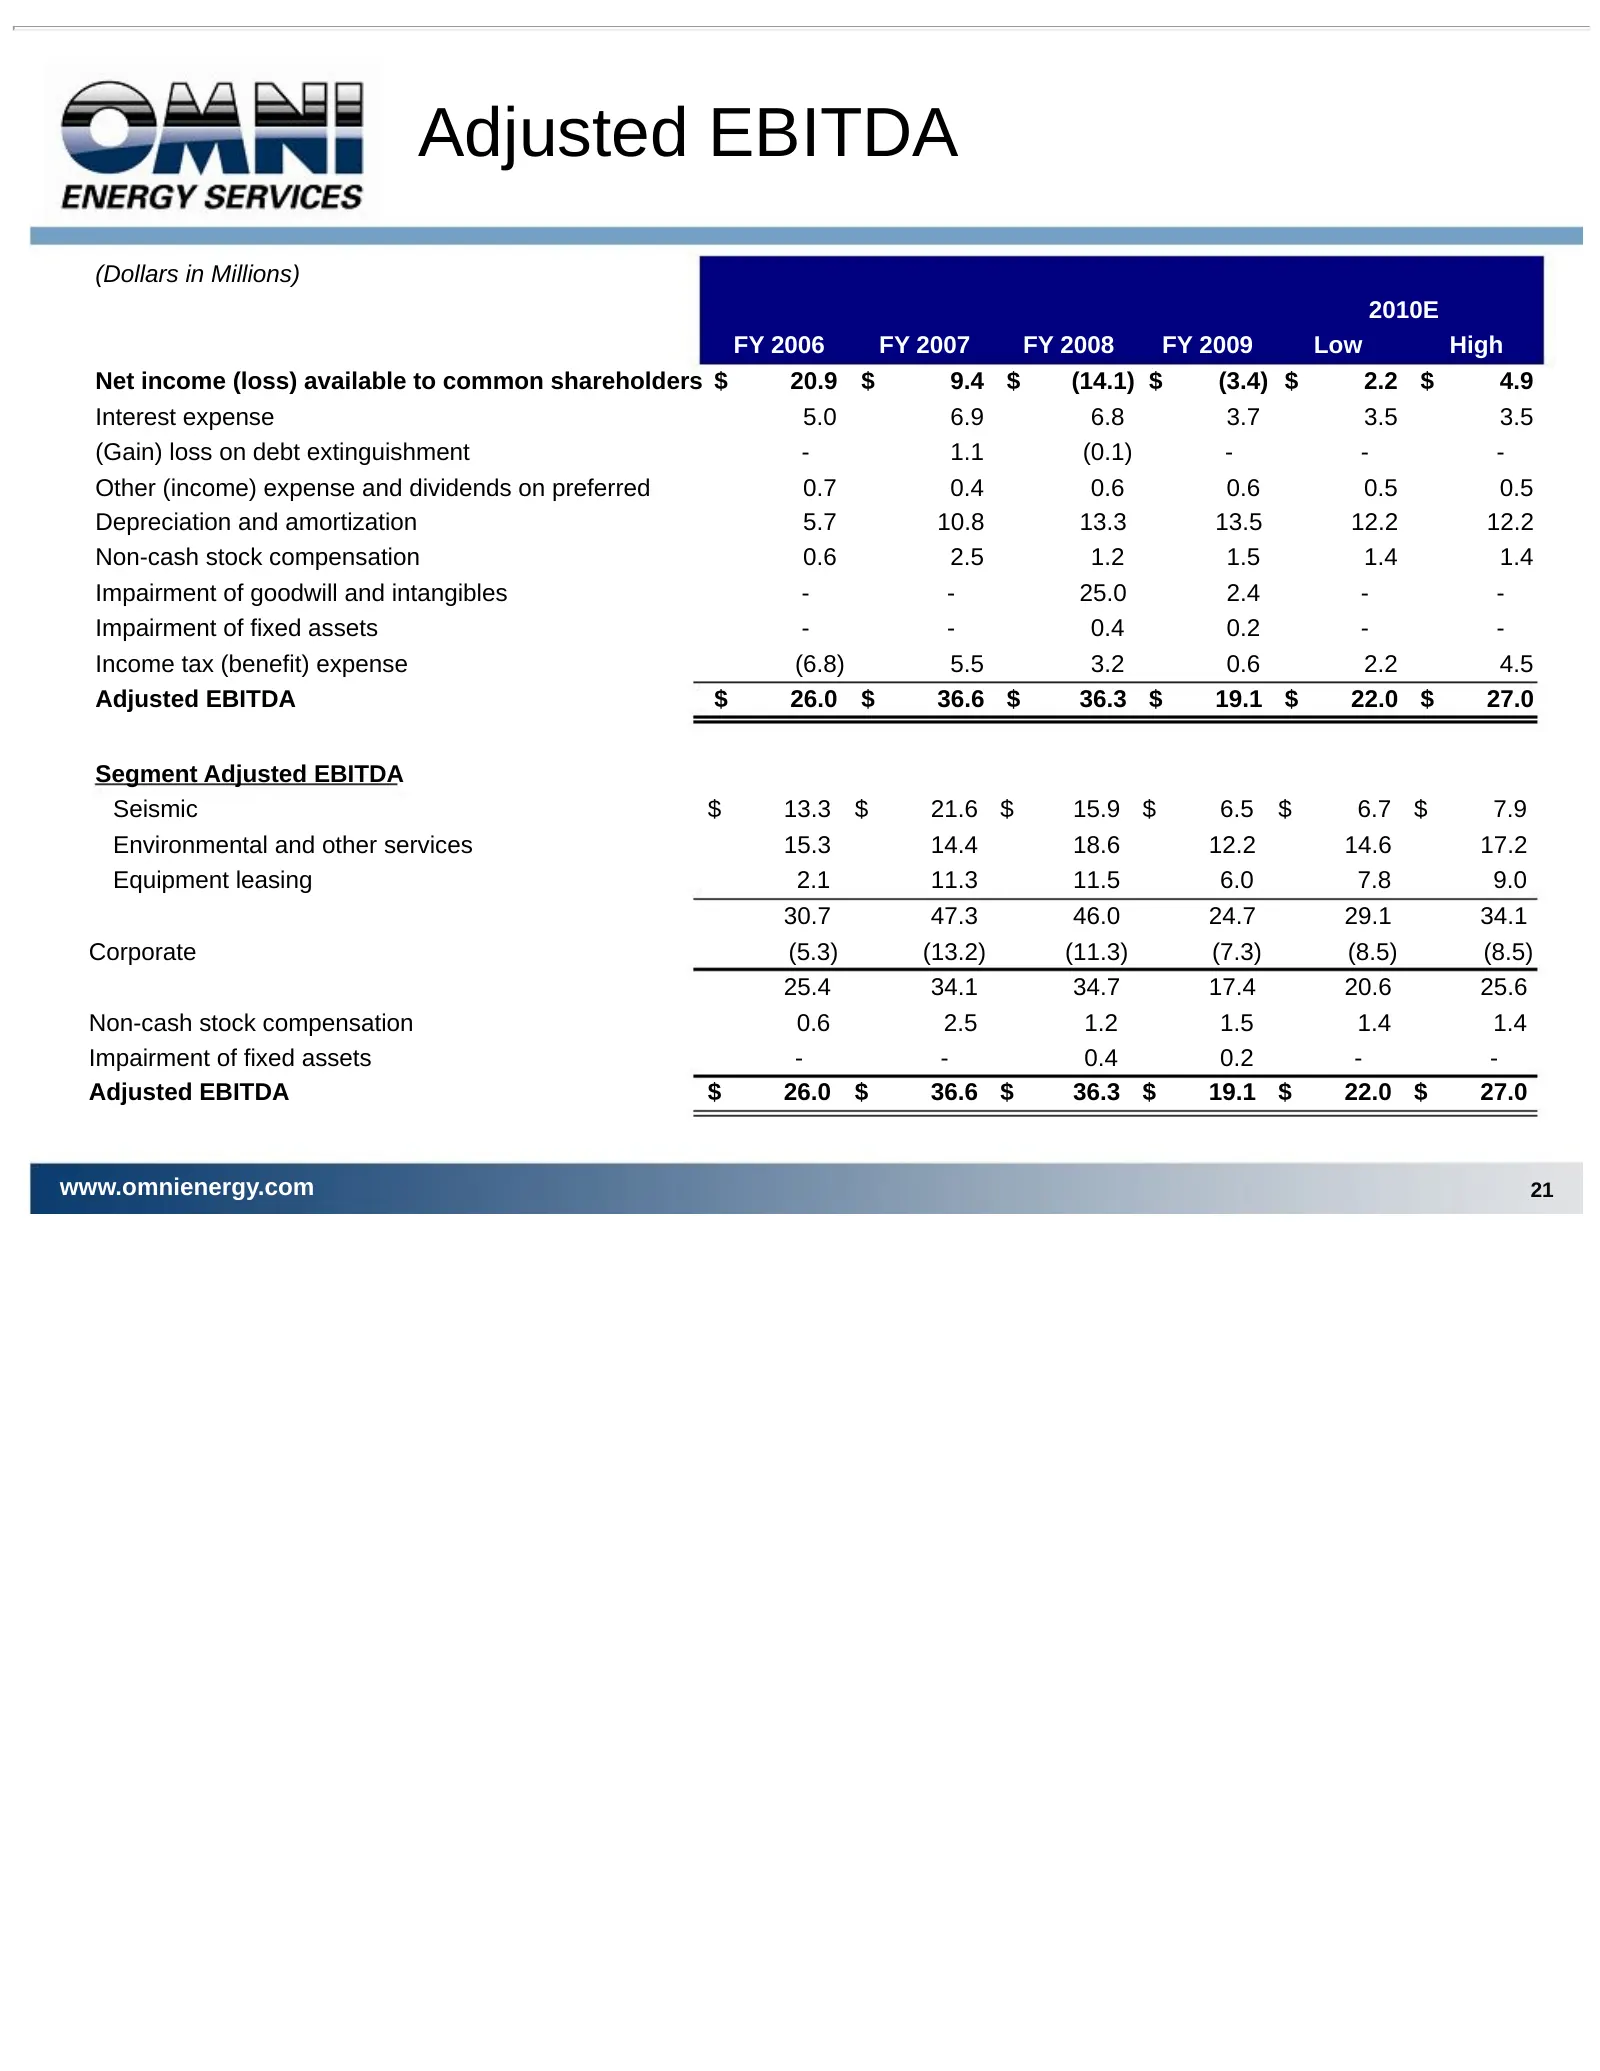
Adjusted EBITDA (Dollars in Millions) 2010E FY 2006 FY 2007 FY 2008 FY 2009 Low High Net income (loss) available to common shareholders $ 20.9 $ 9.4 $ (14.1) $ (3.4) $ 2.2 $ 4.9 Interest expense 5.0 6.9 6.8 3.7 3.5 3.5 (Gain) loss on debt extinguishment - 1.1 (0.1) - - - Other (income) expense and d
Slide 22: Adjusted EBITDA Rationale
Adjusted EBITDA Rationale EBITDA consists of earnings (net income or loss) before interest expense, provision for income taxes, depreciation and amortization and impairments. Adjusted EBITDA includes other income (expense), non-cash stock-based compensation and gain or loss on debt extinguishment be
Slide 23: Roth OC Growth Stock Conference
March 15, 2010 Brian Recatto, President & CEO Ron Mogel, Sr. Vice President & CFO Roth OC Growth Stock Conference
Source: SEC EDGAR · 8-K/A filed Mar 18, 2010