Synovus Financial — Investor Day (February 2022)
120 slides from Synovus Financial's investor day presentation, Feb 8, 2022
Slide 1: Welcome to Inspired Banking: Synovus Investor Day 2022
©2022 Synovus. All Rights Reserved. 1 Welcome to Inspired Banking Synovus Investor Day 2022 February 8, 2022 Exhibit 99.1
Slide 2: Forward-looking statements
©2022 Synovus. All Rights Reserved. 2 This slide presentation and certain of our other filings with the Securities and Exchange Commission contain statements that constitute "forward-looking statements" within the meaning of, and subject to the protections of, Section 27A of the Securities Act of 19
Slide 3: Company Overview & Strategy
©2022 Synovus. All Rights Reserved. 3 Company Overview & Strategy Kevin Blair President and Chief Executive Officer
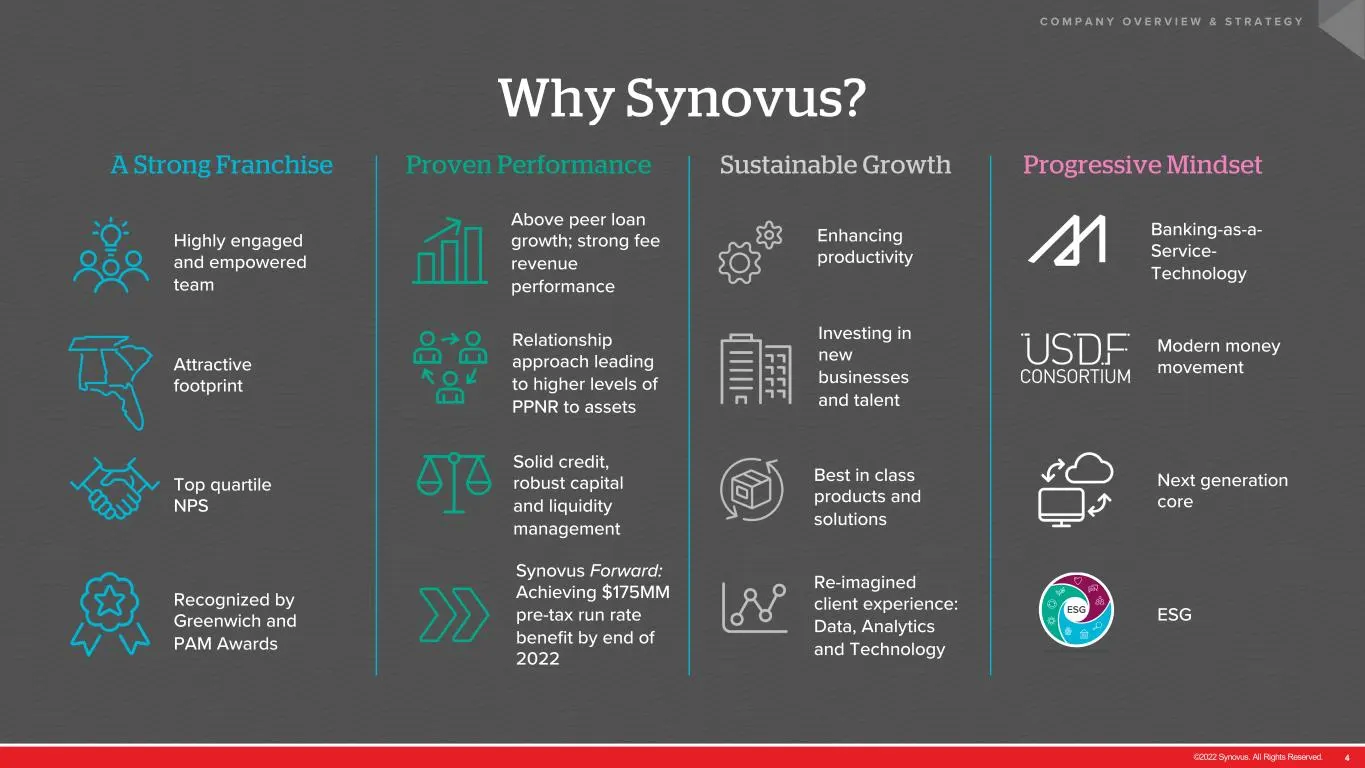
Slide 4: Why Synovus?
©2022 Synovus. All Rights Reserved. 4 Why Synovus? C O M P A N Y O V E R V I E W & S T R A T E G Y A Strong Franchise Proven Performance Sustainable Growth Progressive Mindset Banking-as-a- Service- Technology Solid credit, robust capital and liquidity management Highly engaged and empowered team At
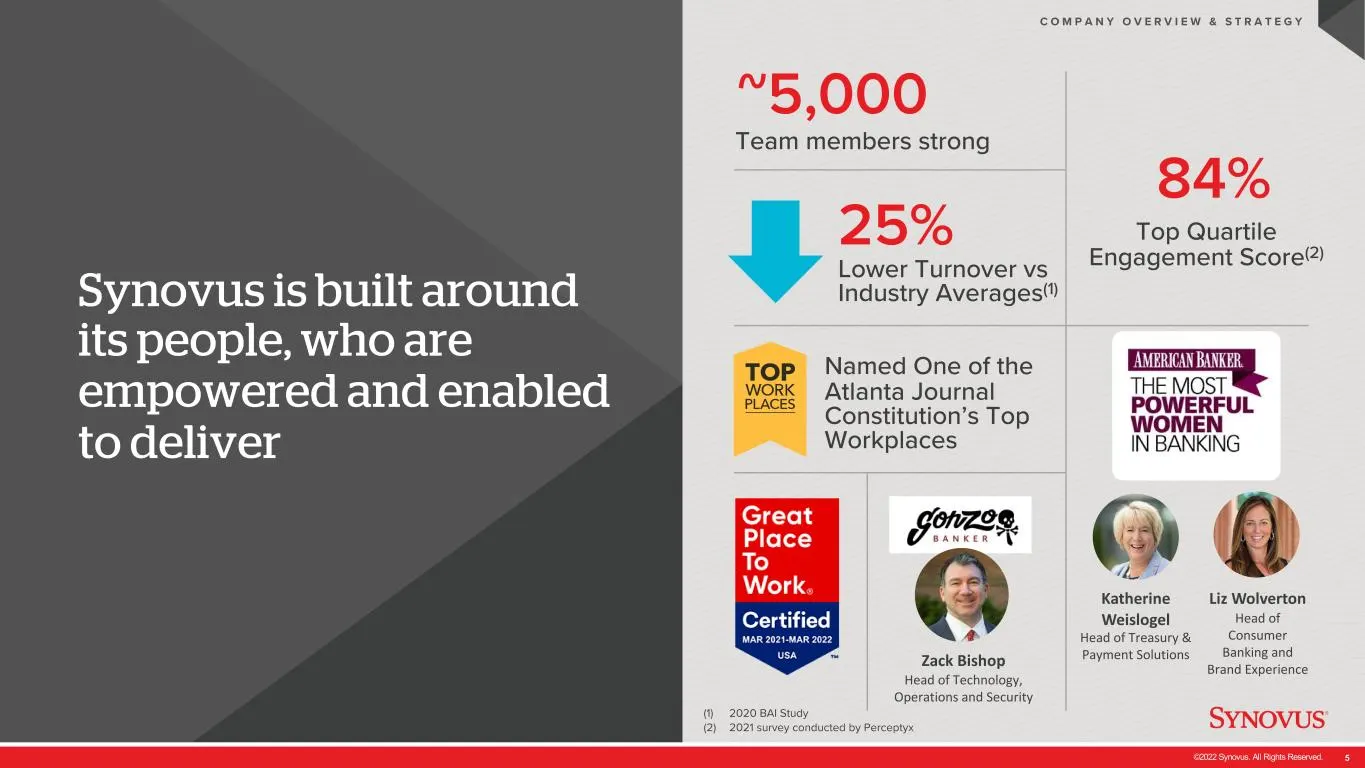
Slide 5: Synovus is built around its people
©2022 Synovus. All Rights Reserved. 5 Synovus is built around its people, who are empowered and enabled to deliver C O M P A N Y O V E R V I E W & S T R A T E G Y (1) 2020 BAI Study (2) 2021 survey conducted by Perceptyx ~5,000 Team members strong Katherine Weislogel Head of Treasury & Payment Solut
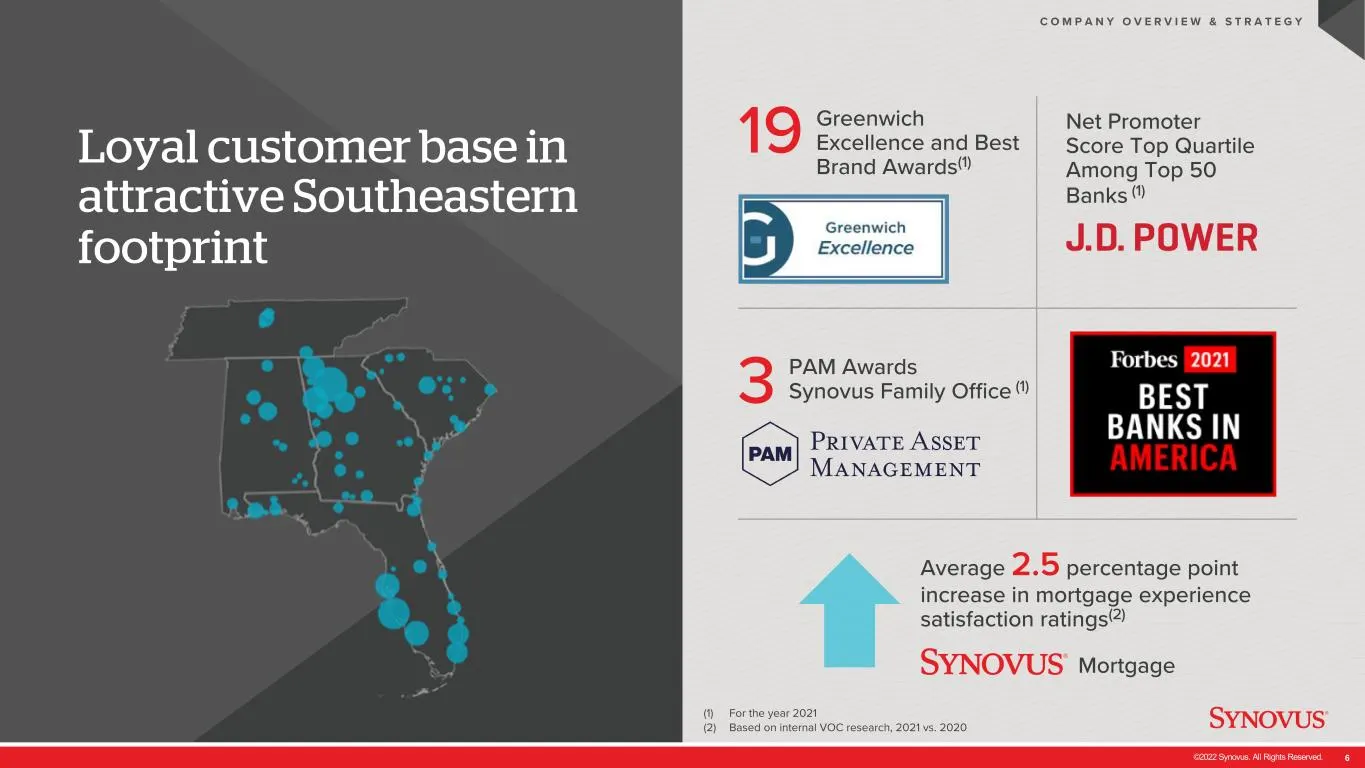
Slide 6: Loyal customer base in attractive Southeastern footprint
©2022 Synovus. All Rights Reserved. 6 Loyal customer base in attractive Southeastern footprint C O M P A N Y O V E R V I E W & S T R A T E G Y (1) For the year 2021 (2) Based on internal VOC research, 2021 vs. 2020 Net Promoter Score Top Quartile Among Top 50 Banks (1) 19 Greenwich Excellence and Be
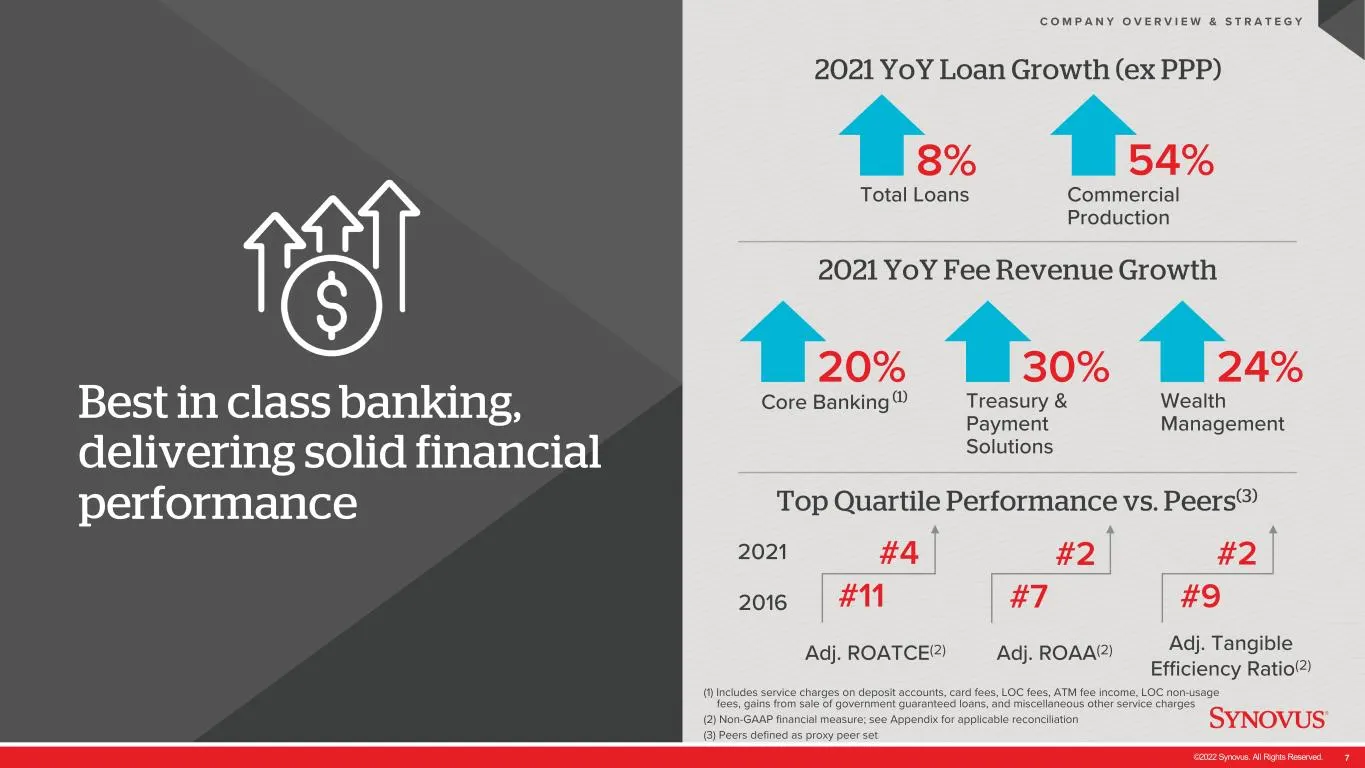
Slide 7: Best in class banking, delivering solid financial performance
©2022 Synovus. All Rights Reserved. 7 Best in class banking, delivering solid financial performance C O M P A N Y O V E R V I E W & S T R A T E G Y (1) Includes service charges on deposit accounts, card fees, LOC fees, ATM fee income, LOC non-usage fees, gains from sale of government guaranteed loan
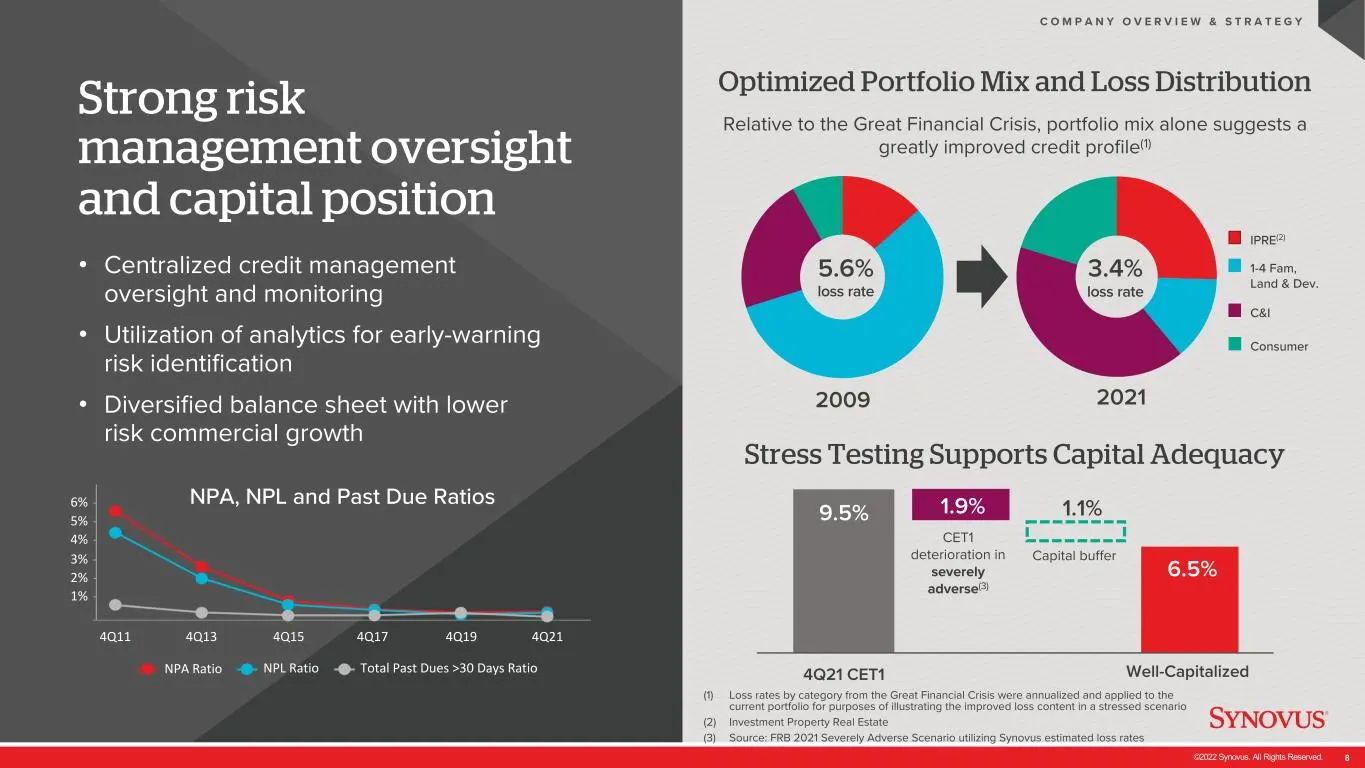
Slide 8: Strong risk management oversight and capital position
©2022 Synovus. All Rights Reserved. 8 Strong risk management oversight and capital position • Centralized credit management oversight and monitoring • Utilization of analytics for early-warning risk identification • Diversified balance sheet with lower risk commercial growth C O M P A N Y O V E R V
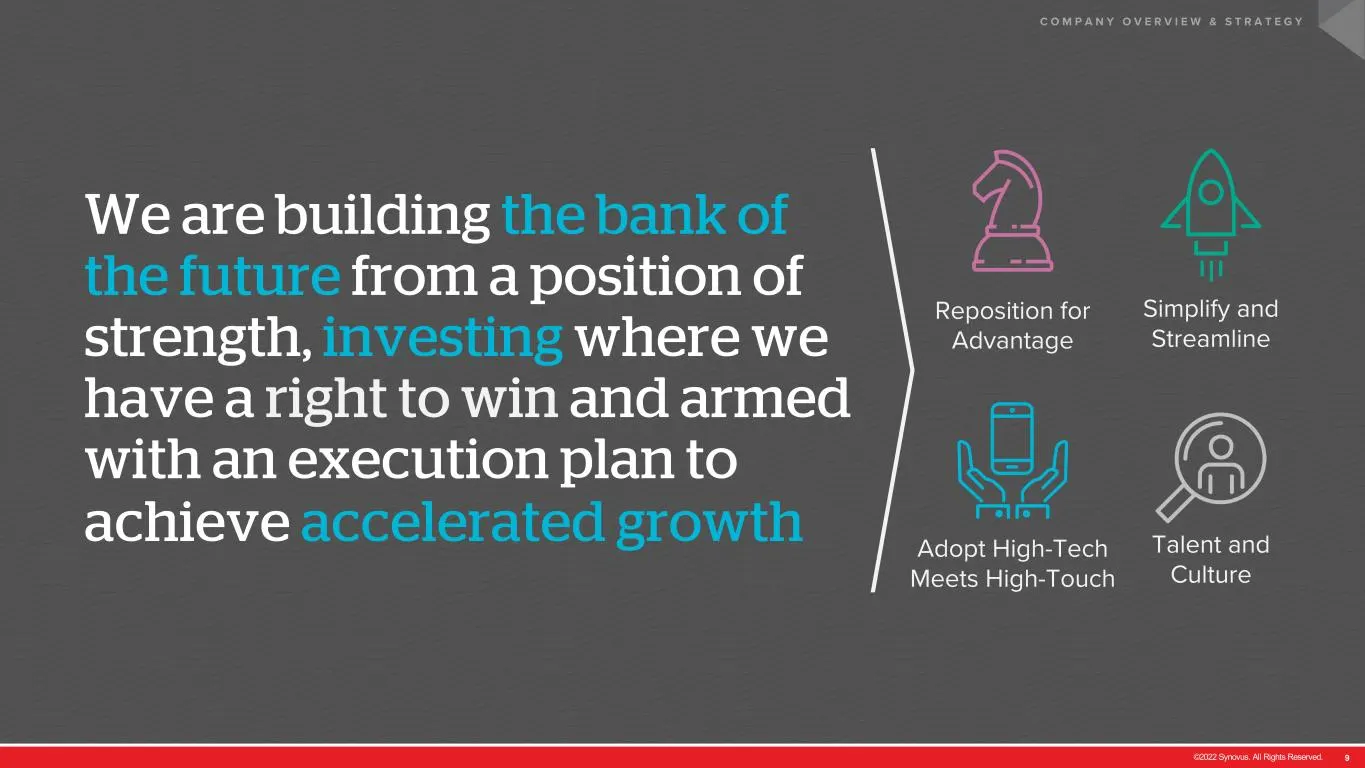
Slide 9: Building the bank of the future from a position of strength
©2022 Synovus. All Rights Reserved. 9 C O M P A N Y O V E R V I E W & S T R A T E G Y We are building the bank of the future from a position of strength, investing where we have a right to win and armed with an execution plan to achieve accelerated growth Reposition for Advantage Simplify and Stream
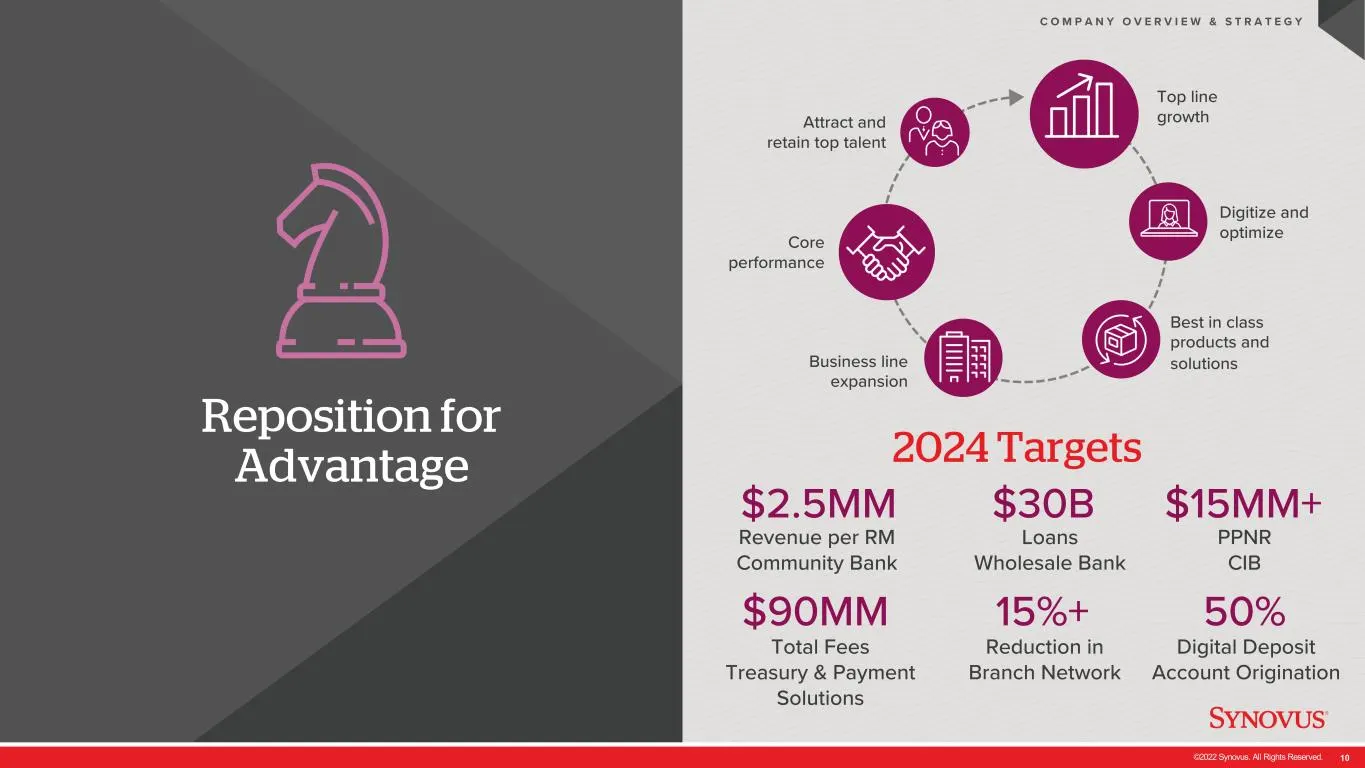
Slide 10: Reposition for Advantage
©2022 Synovus. All Rights Reserved. 10 Reposition for Advantage C O M P A N Y O V E R V I E W & S T R A T E G Y $30B Loans Wholesale Bank $2.5MM Revenue per RM Community Bank $15MM+ PPNR CIB Total Fees Treasury & Payment Solutions $90MM 50% Digital Deposit Account Origination 15%+ Reduction in Branc
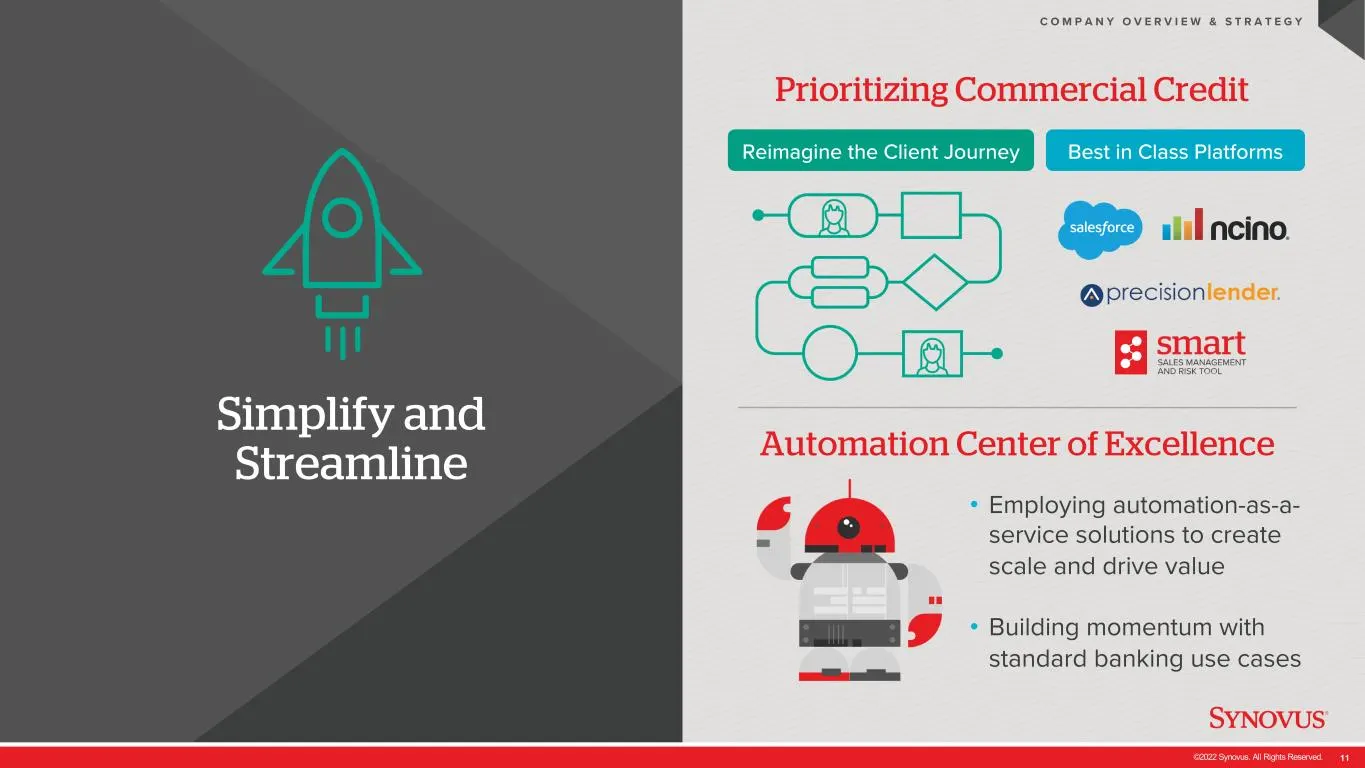
Slide 11: Simplify and Streamline
©2022 Synovus. All Rights Reserved. 11 Simplify and Streamline C O M P A N Y O V E R V I E W & S T R A T E G Y • Employing automation-as-a- service solutions to create scale and drive value • Building momentum with standard banking use cases Prioritizing Commercial Credit Automation Center of Excell
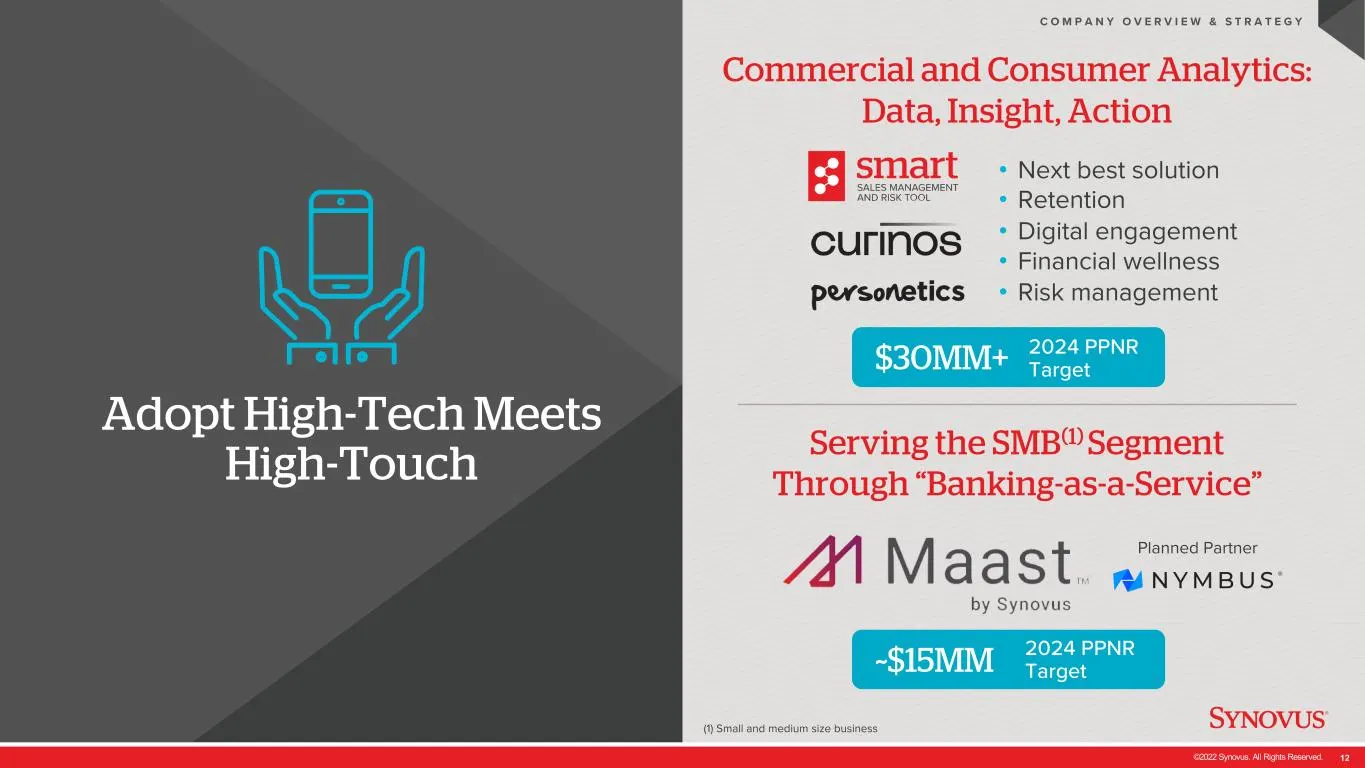
Slide 12: Adopt High-Tech Meets High-Touch
©2022 Synovus. All Rights Reserved. 12 Adopt High-Tech Meets High-Touch C O M P A N Y O V E R V I E W & S T R A T E G Y (1) Small and medium size business • Next best solution • Retention • Digital engagement • Financial wellness • Risk management $30MM+ 2024 PPNR Target Planned Partner Commercial a
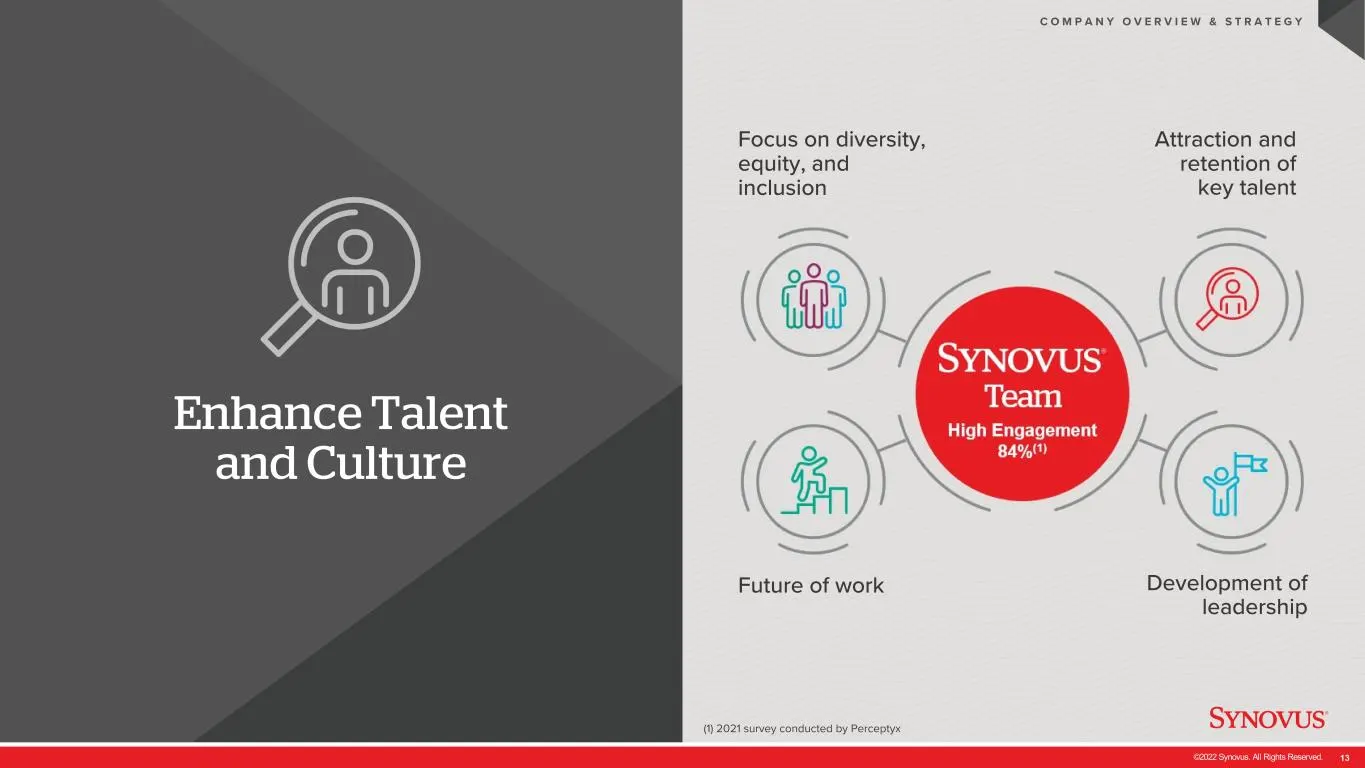
Slide 13: Enhance Talent and Culture
©2022 Synovus. All Rights Reserved. 13 Enhance Talent and Culture C O M P A N Y O V E R V I E W & S T R A T E G Y (1) 2021 survey conducted by Perceptyx Attraction and retention of key talent Development of leadership Focus on diversity, equity, and inclusion Future of work
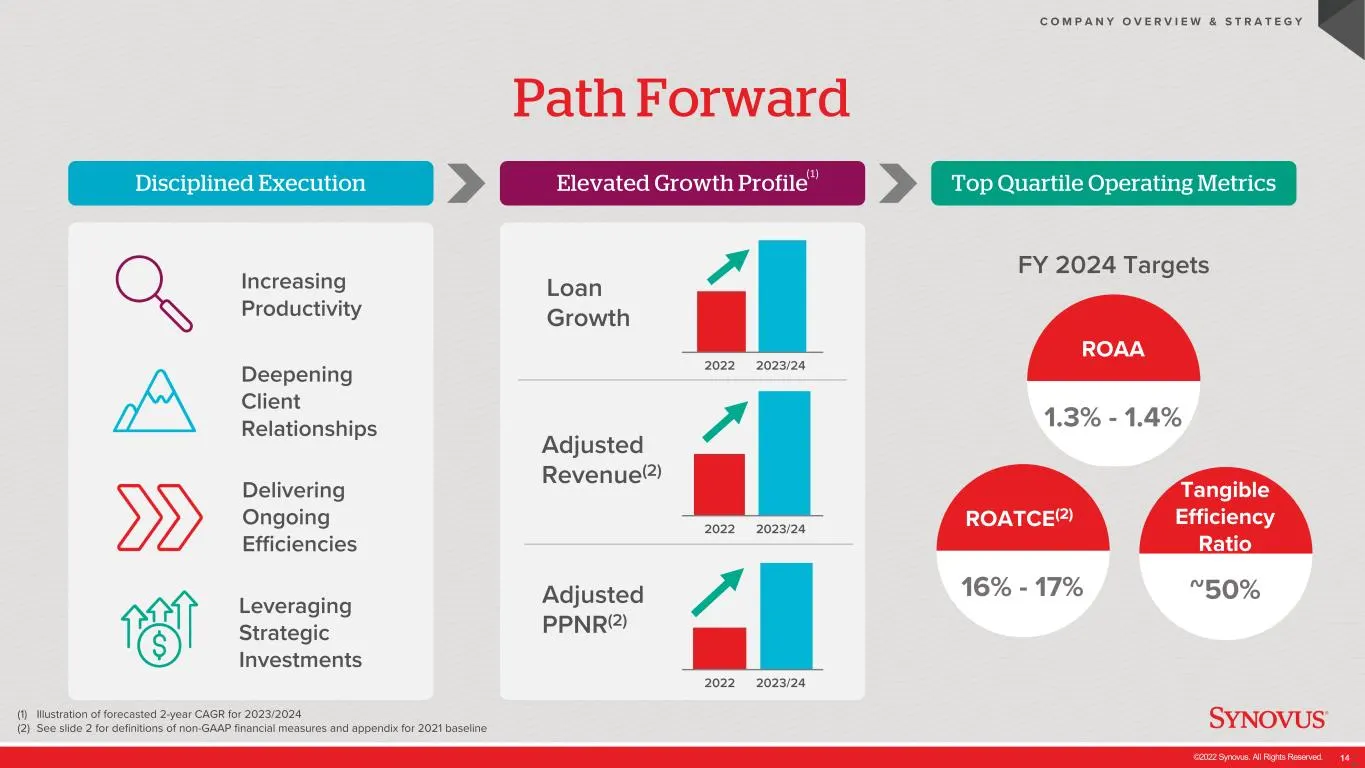
Slide 14: FY 2024 Targets and Path Forward
©2022 Synovus. All Rights Reserved. 14 Disciplined Execution Elevated Growth Profile Top Quartile Operating Metrics Path Forward C O M P A N Y O V E R V I E W & S T R A T E G Y FY 2024 Targets Increasing Productivity Deepening Client Relationships Leveraging Strategic Investments Delivering Ongoing
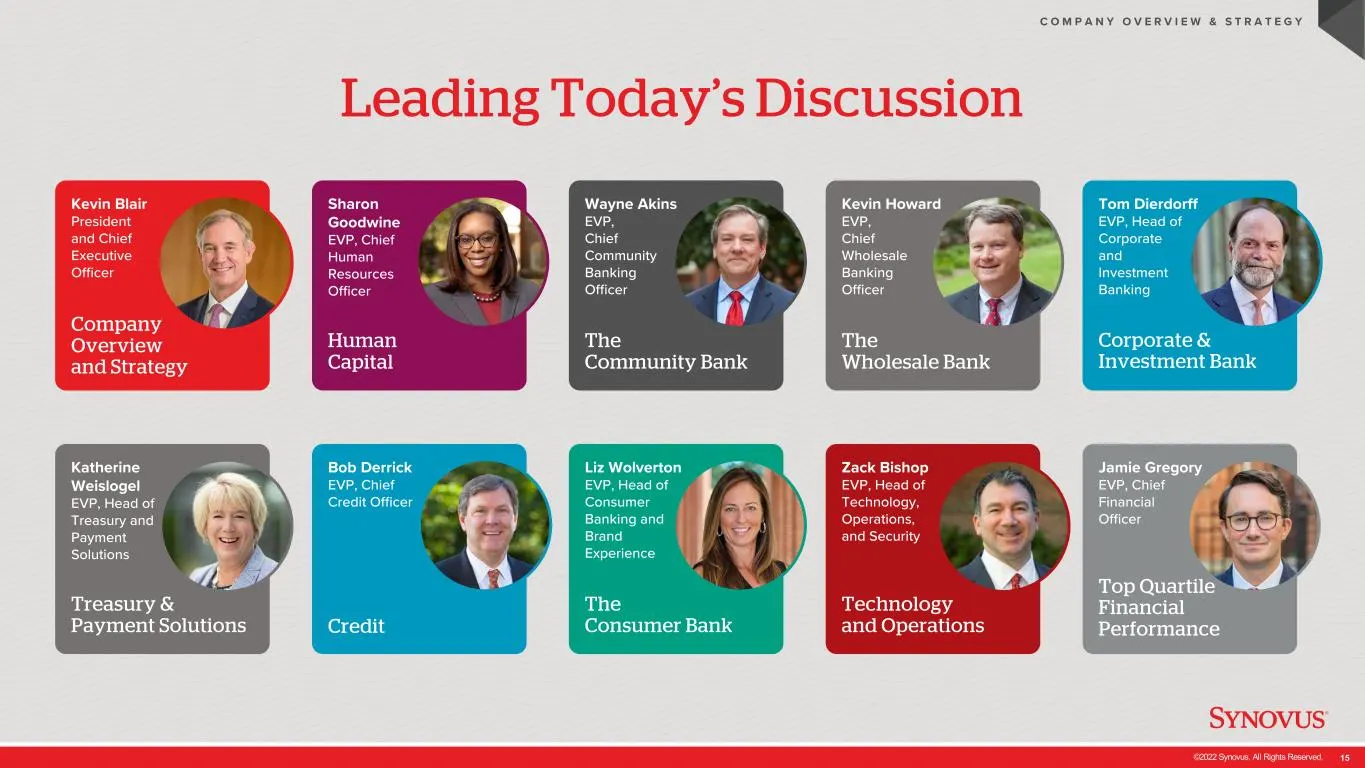
Slide 15: Leading Today's Discussion
©2022 Synovus. All Rights Reserved. 15 Company Overview and Strategy Kevin Blair President and Chief Executive Officer Human Capital Sharon Goodwine EVP, Chief Human Resources Officer The Community Bank Wayne Akins EVP, Chief Community Banking Officer The Wholesale Bank Kevin Howard EVP, Chief Whole
Slide 16: C O M P A N Y O V E R V I E
©2022 Synovus. All Rights Reserved. 16 C O M P A N Y O V E R V I E W & S T R A T E G Y

Slide 17: Human Capital
©2022 Synovus. All Rights Reserved. 17 Human Capital Sharon Goodwine EVP, Chief Human Resources Officer
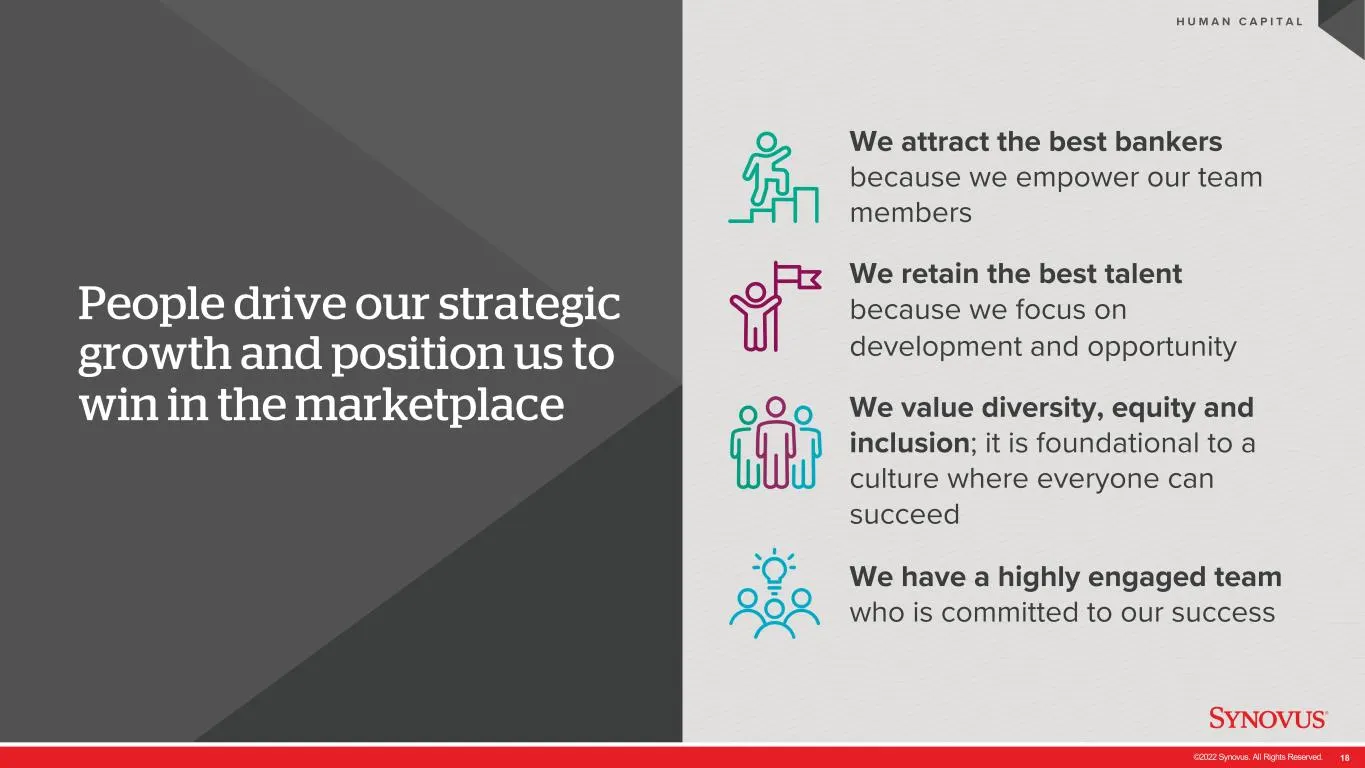
Slide 18: People drive our strategic growth
©2022 Synovus. All Rights Reserved. 18 People drive our strategic growth and position us to win in the marketplace H U M A N C A P I T A L We attract the best bankers because we empower our team members We retain the best talent because we focus on development and opportunity We value diversity, equ
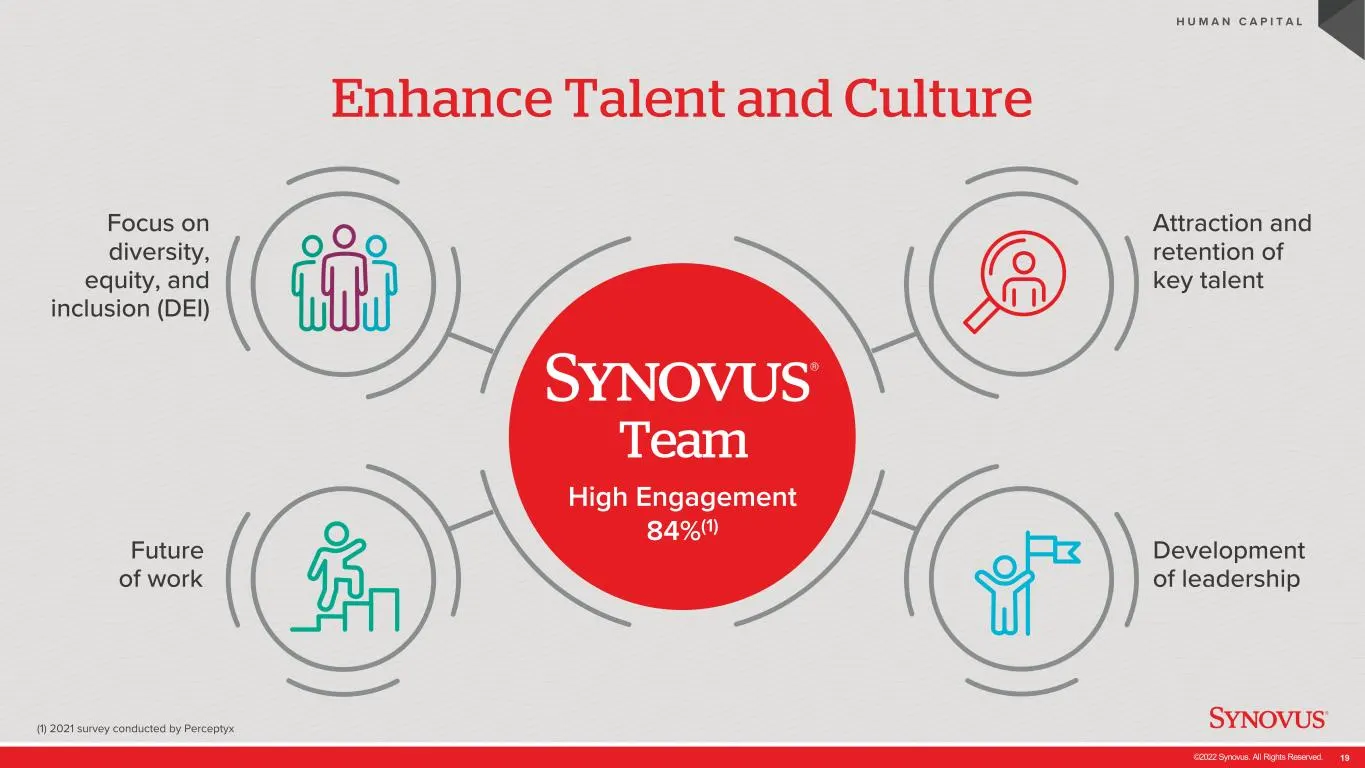
Slide 19: Enhance Talent and Culture
©2022 Synovus. All Rights Reserved. 19 Enhance Talent and Culture (1) 2021 survey conducted by Perceptyx H U M A N C A P I T A L Attraction and retention of key talent Development of leadership Focus on diversity, equity, and inclusion (DEI) Team High Engagement 84%(1) Future of work
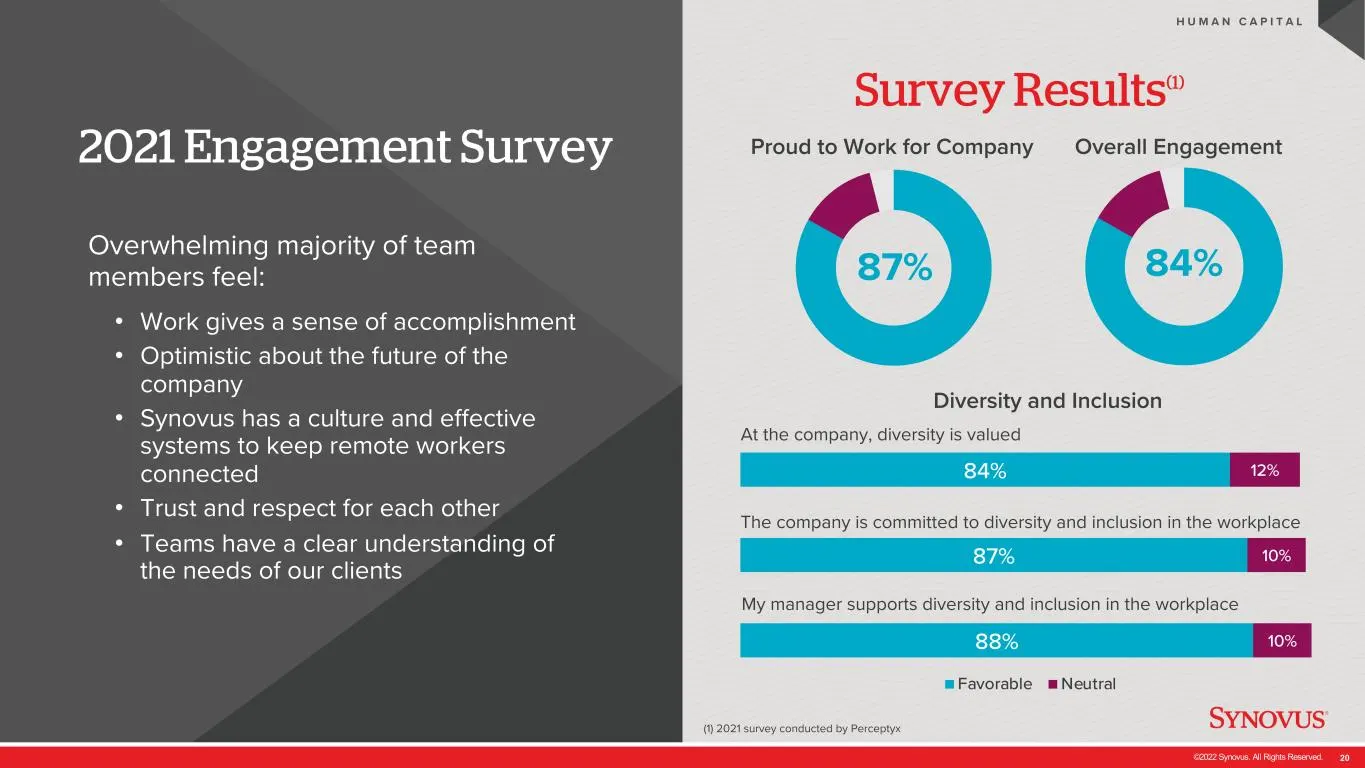
Slide 20: 2021 Engagement Survey
©2022 Synovus. All Rights Reserved. 20 88% 87% 84% 10% 10% 12% Favorable Neutral 2021 Engagement Survey Overwhelming majority of team members feel: • Work gives a sense of accomplishment • Optimistic about the future of the company • Synovus has a culture and effective systems to keep remote workers
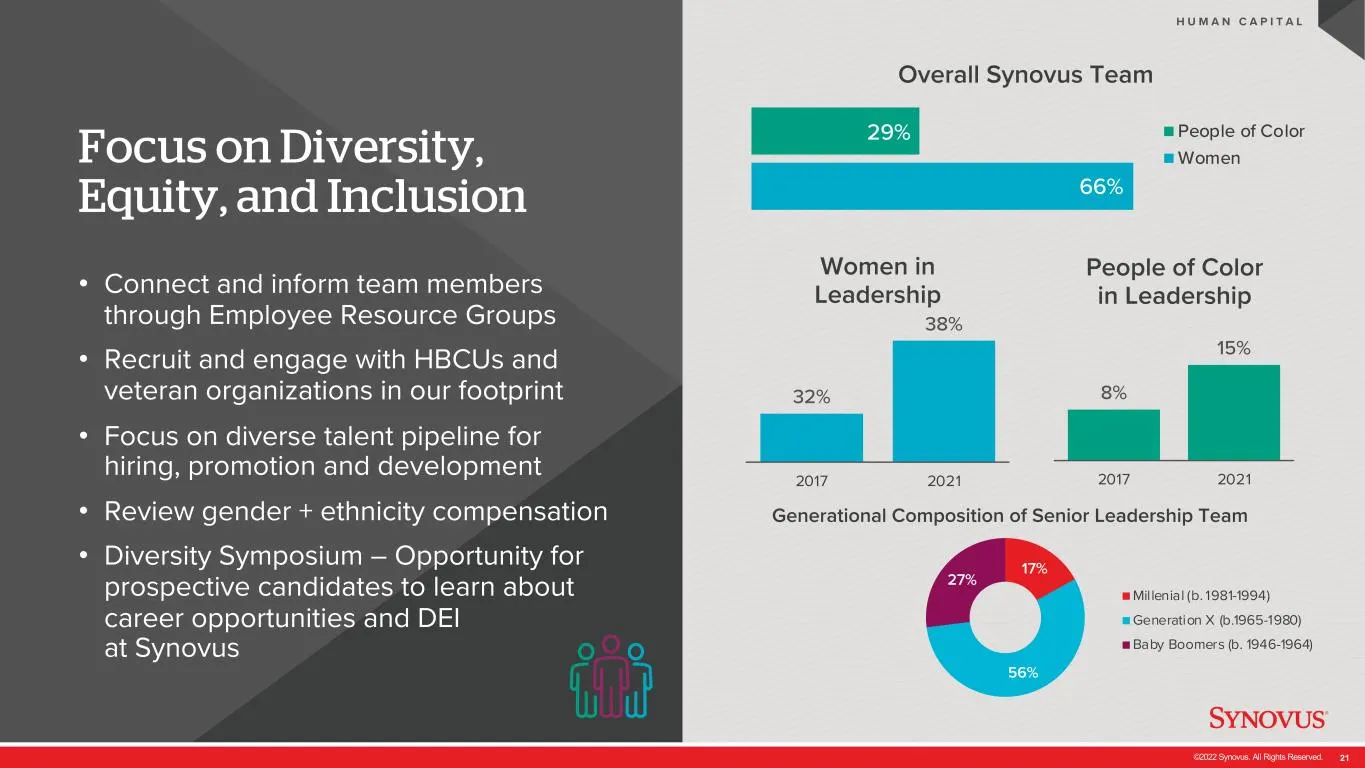
Slide 21: Focus on Diversity, Equity, and Inclusion
©2022 Synovus. All Rights Reserved. 21 Focus on Diversity, Equity, and Inclusion • Connect and inform team members through Employee Resource Groups • Recruit and engage with HBCUs and veteran organizations in our footprint • Focus on diverse talent pipeline for hiring, promotion and development • Re
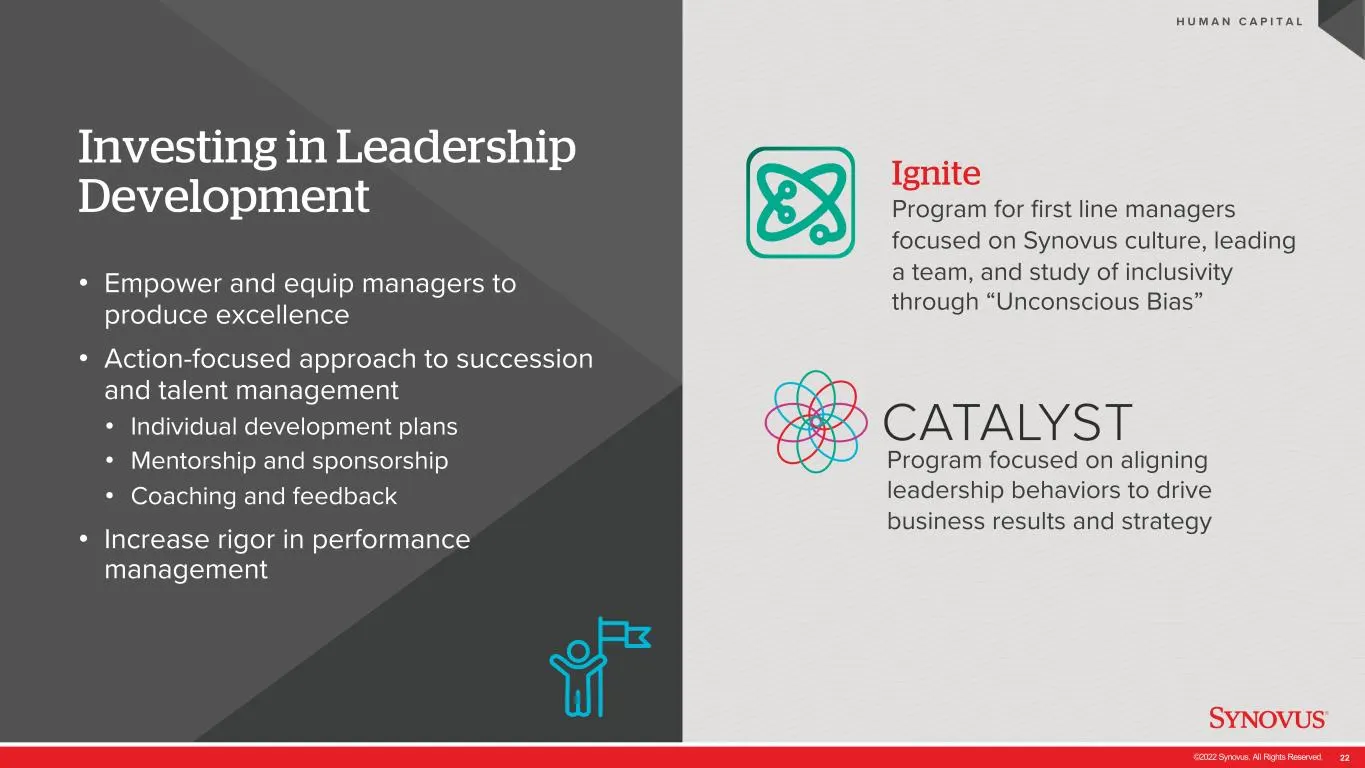
Slide 22: Investing in Leadership Development
©2022 Synovus. All Rights Reserved. 22 Investing in Leadership Development • Empower and equip managers to produce excellence • Action-focused approach to succession and talent management • Individual development plans • Mentorship and sponsorship • Coaching and feedback • Increase rigor in performa
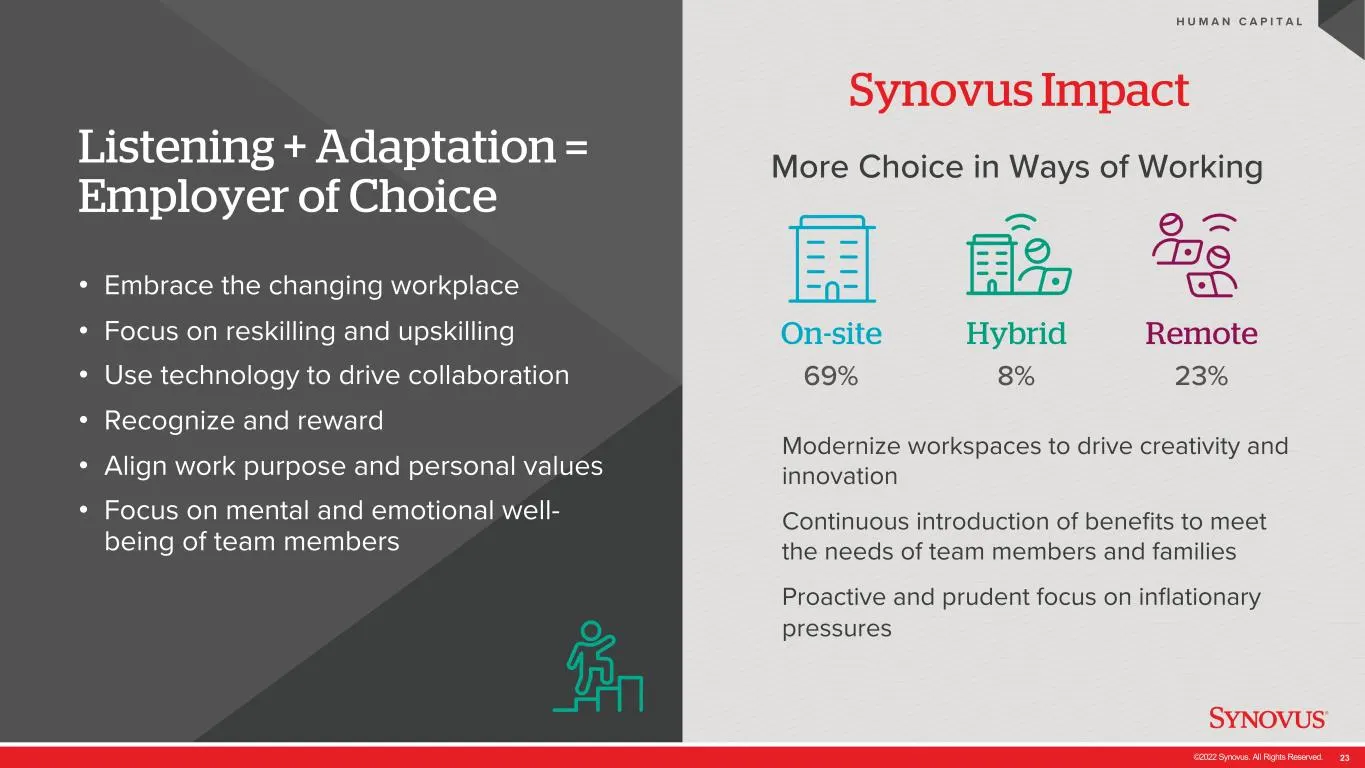
Slide 23: Listening + Adaptation = Employer of Choice
©2022 Synovus. All Rights Reserved. 23 Listening + Adaptation = Employer of Choice • Embrace the changing workplace • Focus on reskilling and upskilling • Use technology to drive collaboration • Recognize and reward • Align work purpose and personal values • Focus on mental and emotional well- being
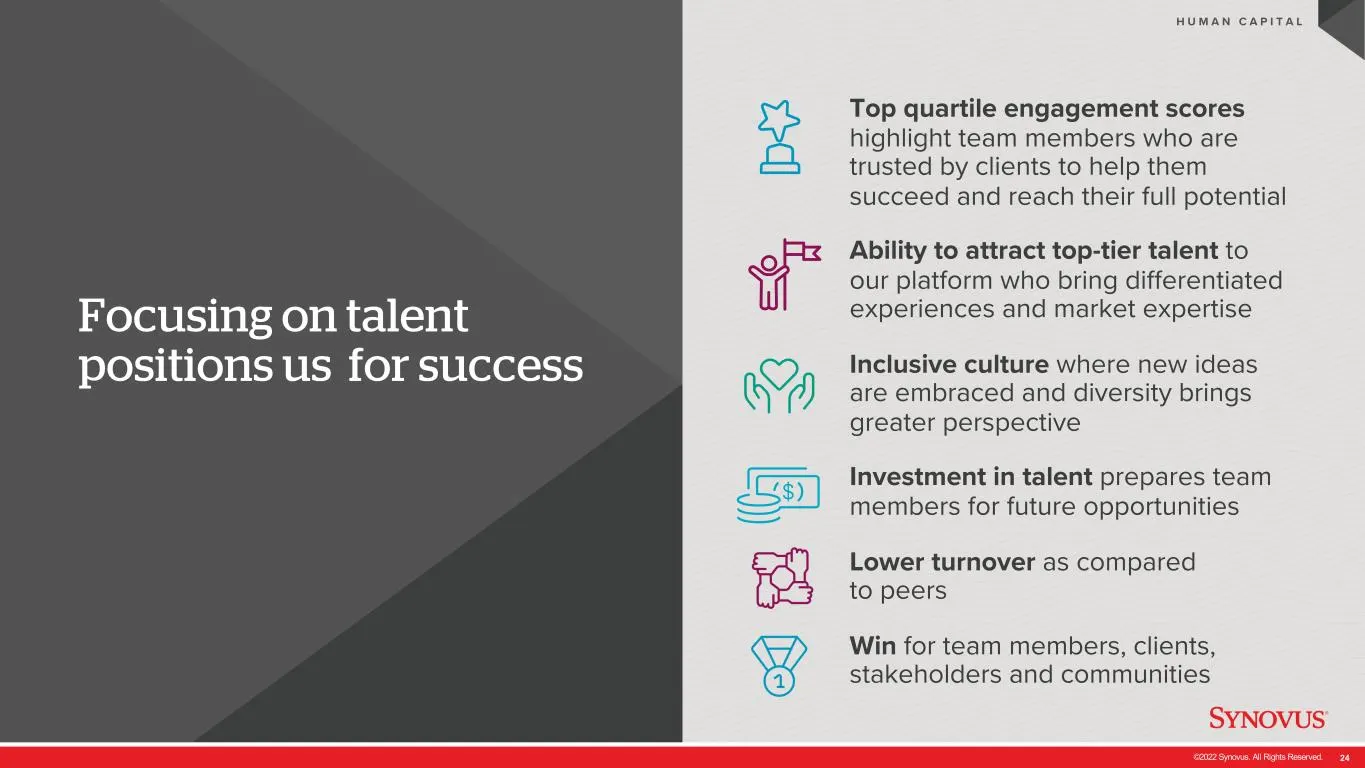
Slide 24: Focusing on talent positions us for success
©2022 Synovus. All Rights Reserved. 24 Focusing on talent positions us for success H U M A N C A P I T A L Top quartile engagement scores highlight team members who are trusted by clients to help them succeed and reach their full potential Ability to attract top-tier talent to our platform who bring
Slide 25: The Community Bank
©2022 Synovus. All Rights Reserved. 25 The Community Bank Wayne Akins EVP, Chief Community Banking Officer
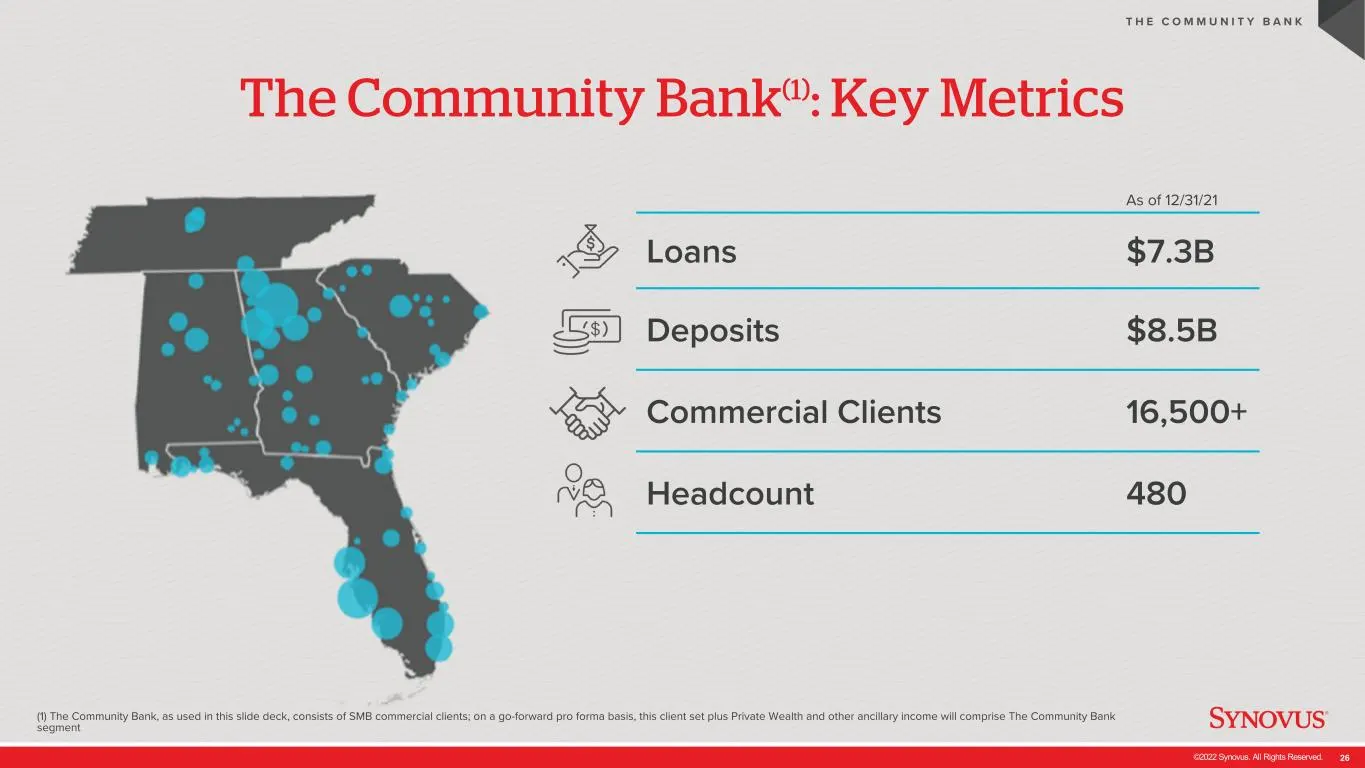
Slide 26: The Community Bank: Key Metrics
©2022 Synovus. All Rights Reserved. 26 The Community Bank(1): Key Metrics (1) The Community Bank, as used in this slide deck, consists of SMB commercial clients; on a go-forward pro forma basis, this client set plus Private Wealth and other ancillary income will comprise The Community Bank segment T
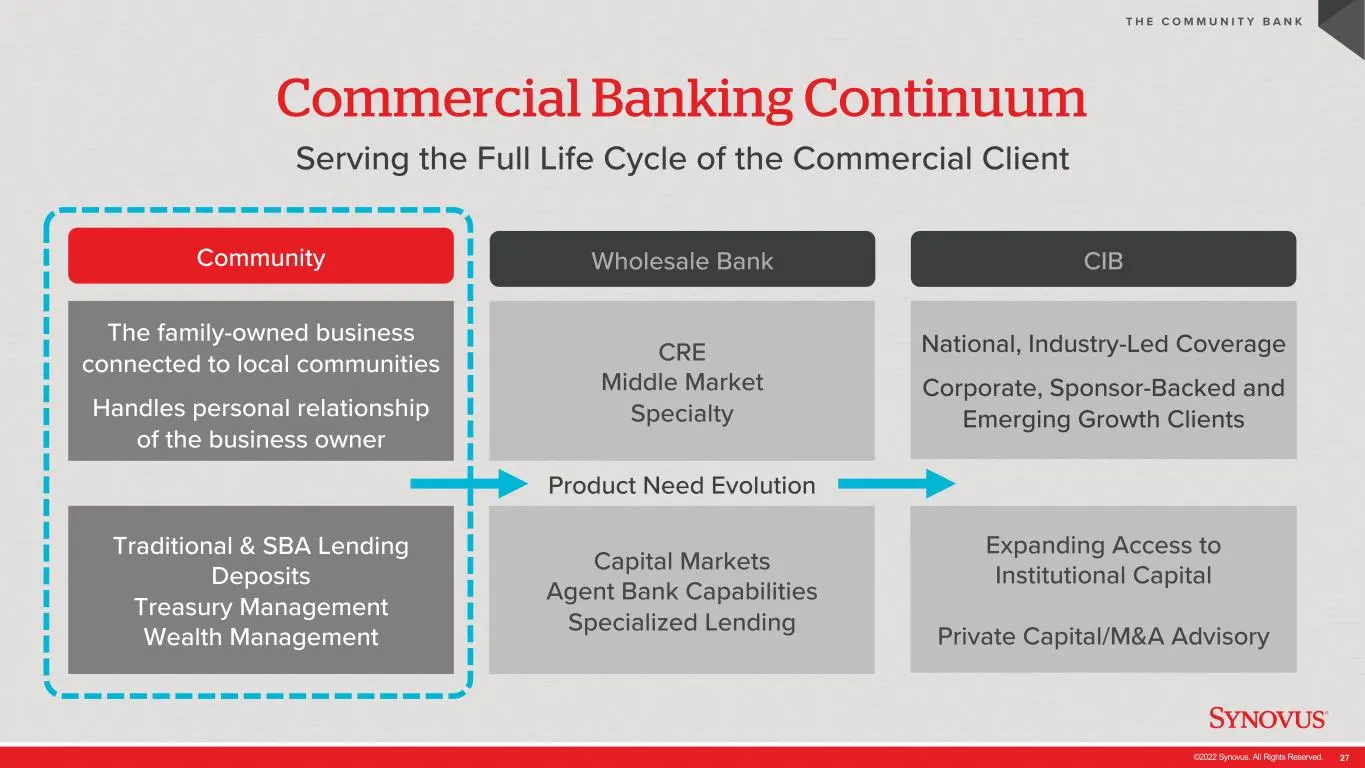
Slide 27: Commercial Banking Continuum
©2022 Synovus. All Rights Reserved. 27 Commercial Banking Continuum Serving the Full Life Cycle of the Commercial Client T H E C O M M U N I T Y B A N K Community The family-owned business connected to local communities Handles personal relationship of the business owner Traditional & SBA Lending De
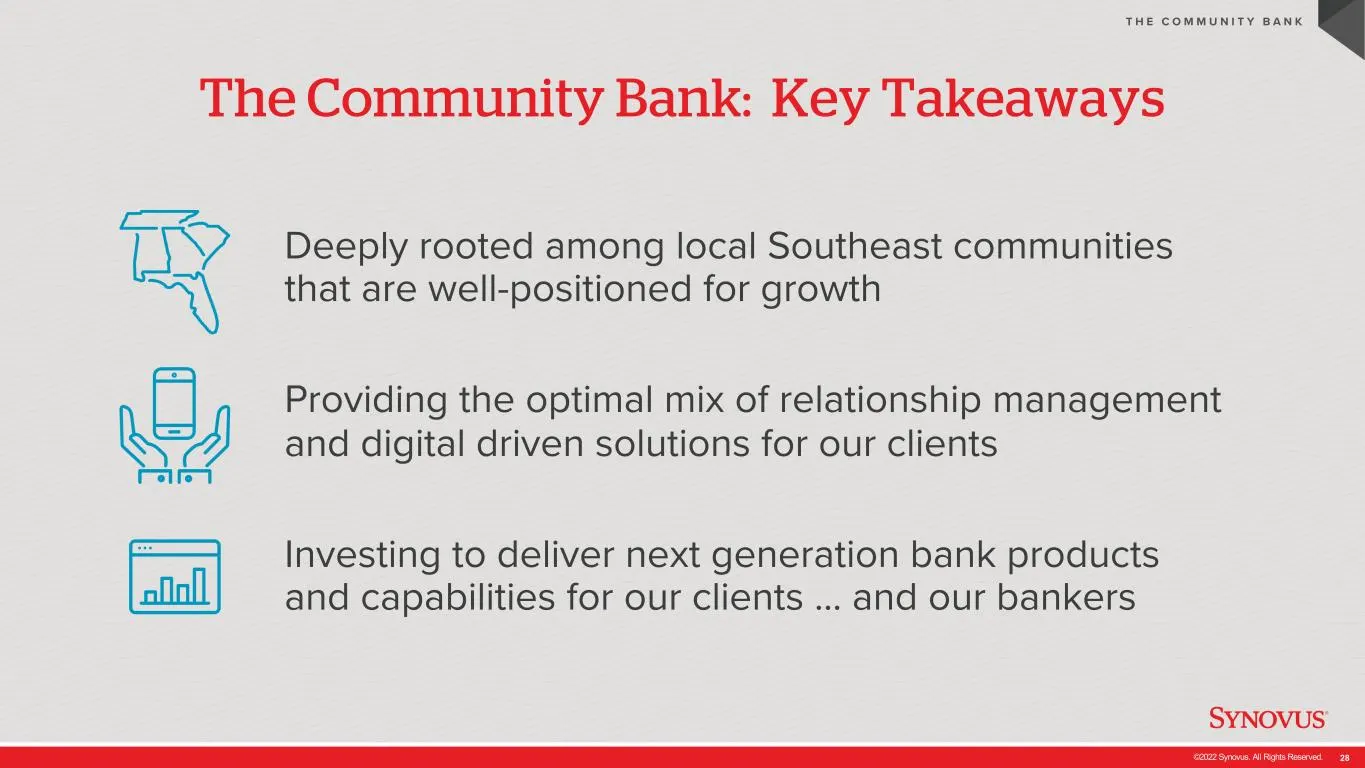
Slide 28: The Community Bank: Key Takeaways
©2022 Synovus. All Rights Reserved. 28 The Community Bank: Key Takeaways Deeply rooted among local Southeast communities that are well-positioned for growth Providing the optimal mix of relationship management and digital driven solutions for our clients Investing to deliver next generation bank pro
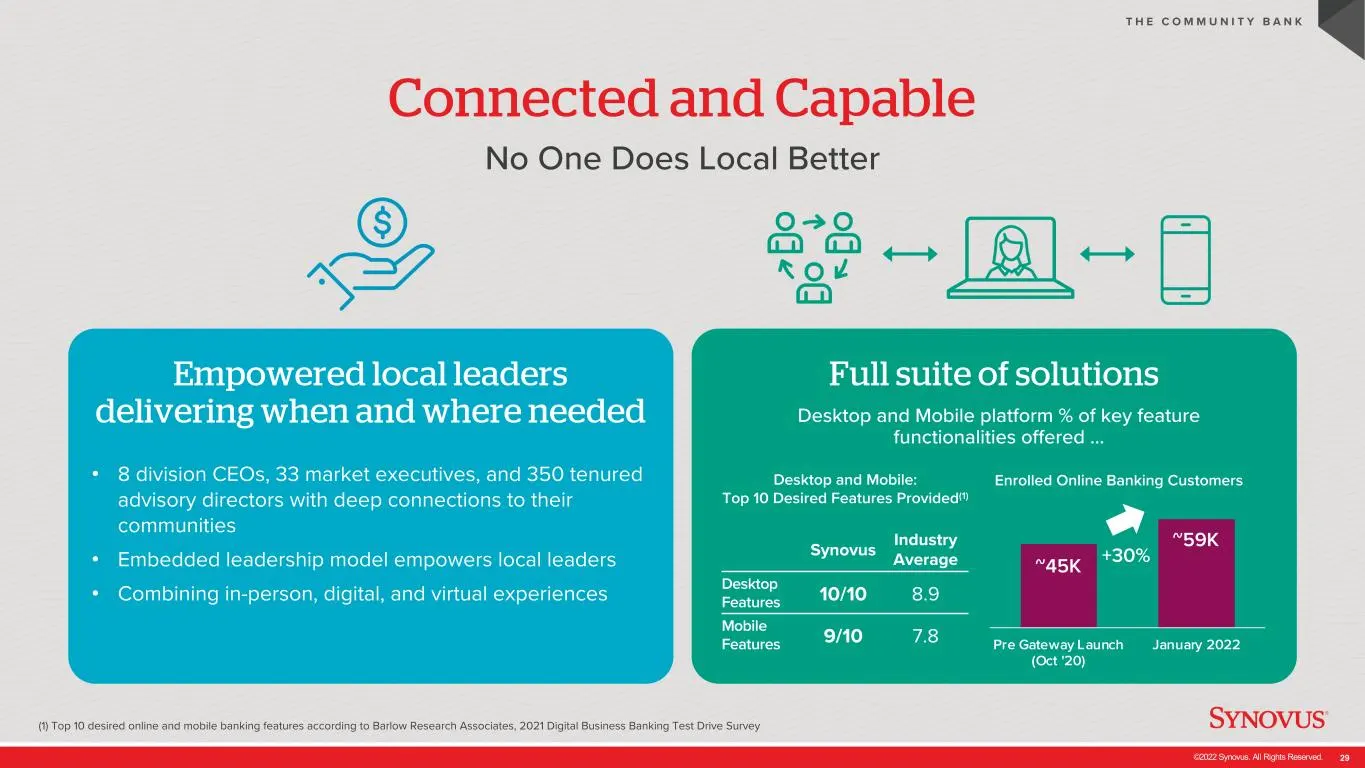
Slide 29: Connected and Capable
©2022 Synovus. All Rights Reserved. 29 Connected and Capable (1) Top 10 desired online and mobile banking features according to Barlow Research Associates, 2021 Digital Business Banking Test Drive Survey No One Does Local Better T H E C O M M U N I T Y B A N K Empowered local leaders delivering when
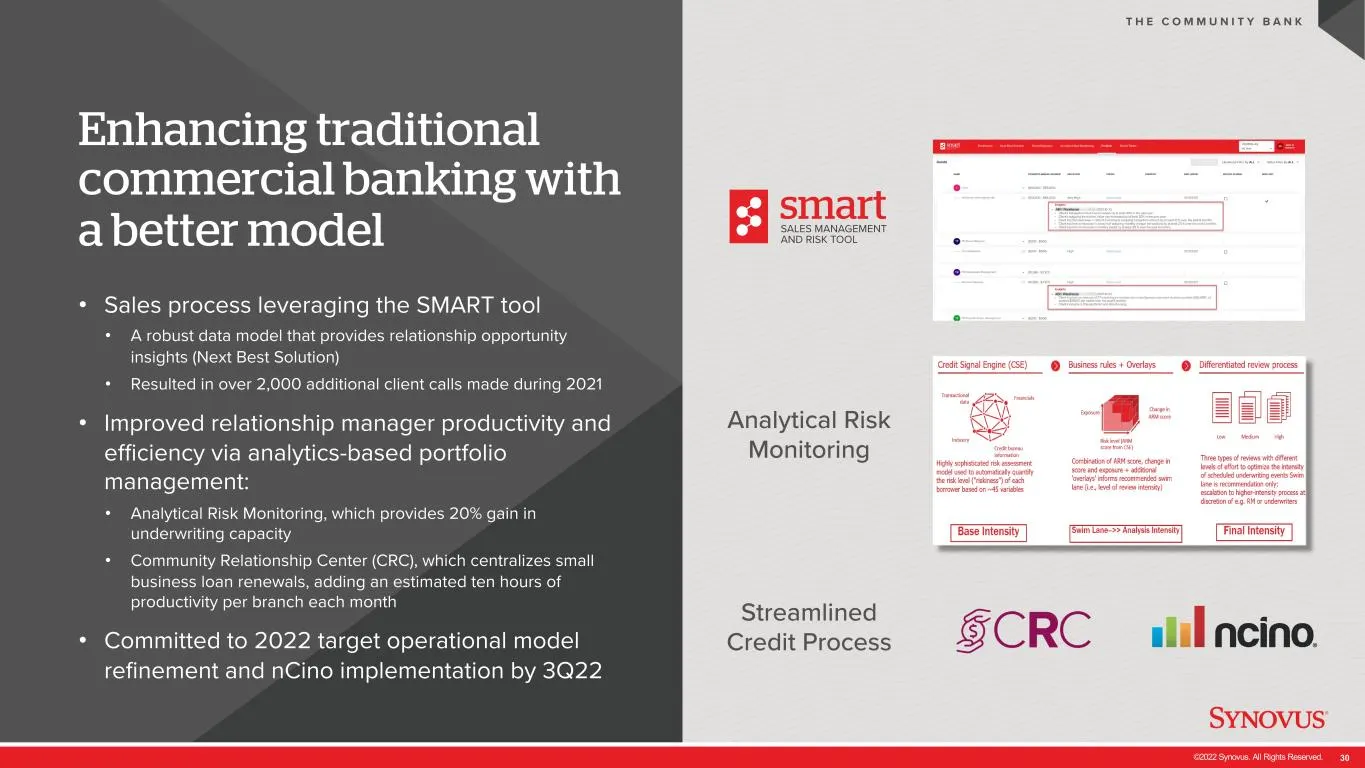
Slide 30: Enhancing traditional commercial banking with a better model
©2022 Synovus. All Rights Reserved. 30 Enhancing traditional commercial banking with a better model • Sales process leveraging the SMART tool • A robust data model that provides relationship opportunity insights (Next Best Solution) • Resulted in over 2,000 additional client calls made during 2021 •
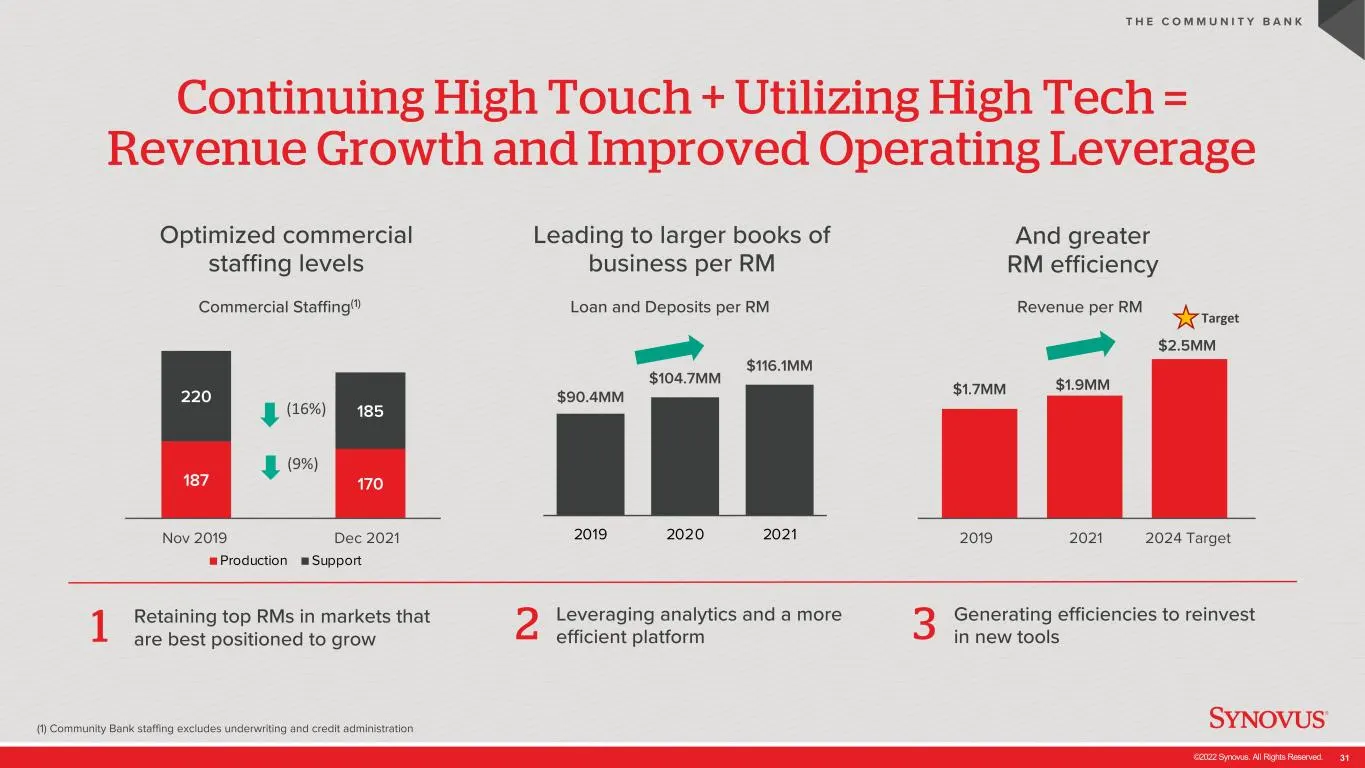
Slide 31: High Touch + High Tech = Revenue Growth and Operating Leverage
©2022 Synovus. All Rights Reserved. 31 Continuing High Touch + Utilizing High Tech = Revenue Growth and Improved Operating Leverage (1) Community Bank staffing excludes underwriting and credit administration T H E C O M M U N I T Y B A N K 187 170 220 185 Production Support Optimized commercial staf
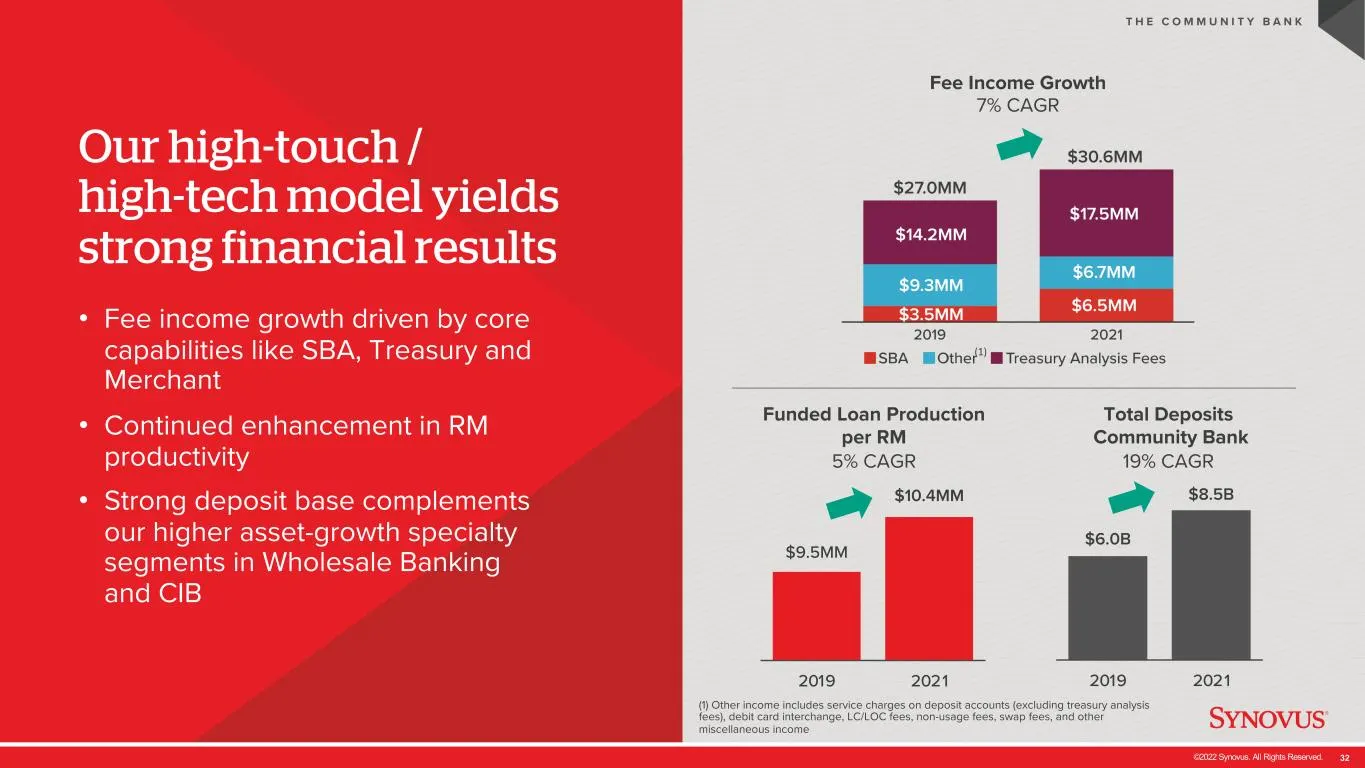
Slide 32: Our high-touch / high-tech model yields strong financial results
©2022 Synovus. All Rights Reserved. 32 Our high-touch / high-tech model yields strong financial results • Fee income growth driven by core capabilities like SBA, Treasury and Merchant • Continued enhancement in RM productivity • Strong deposit base complements our higher asset-growth specialty segme
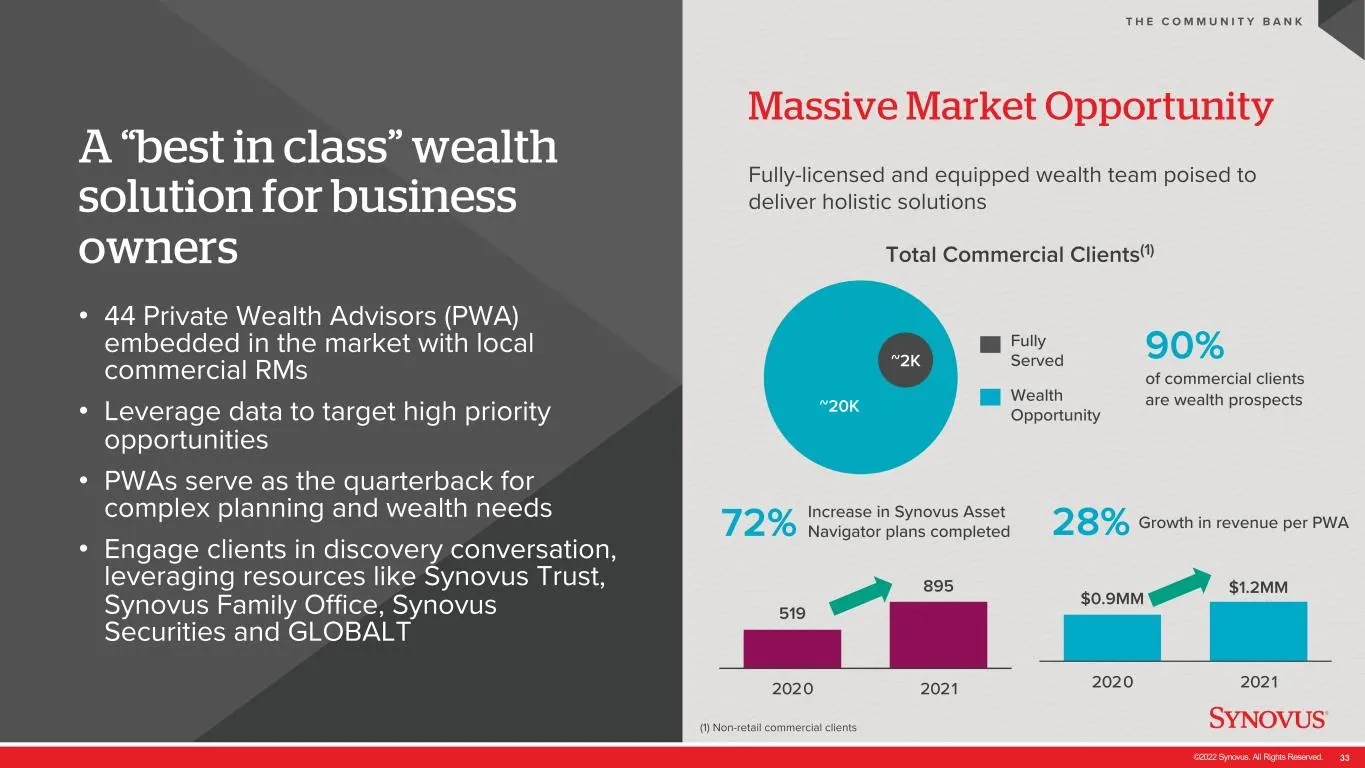
Slide 33: A best in class wealth solution for business owners
©2022 Synovus. All Rights Reserved. 33 A “best in class” wealth solution for business owners • 44 Private Wealth Advisors (PWA) embedded in the market with local commercial RMs • Leverage data to target high priority opportunities • PWAs serve as the quarterback for complex planning and wealth needs
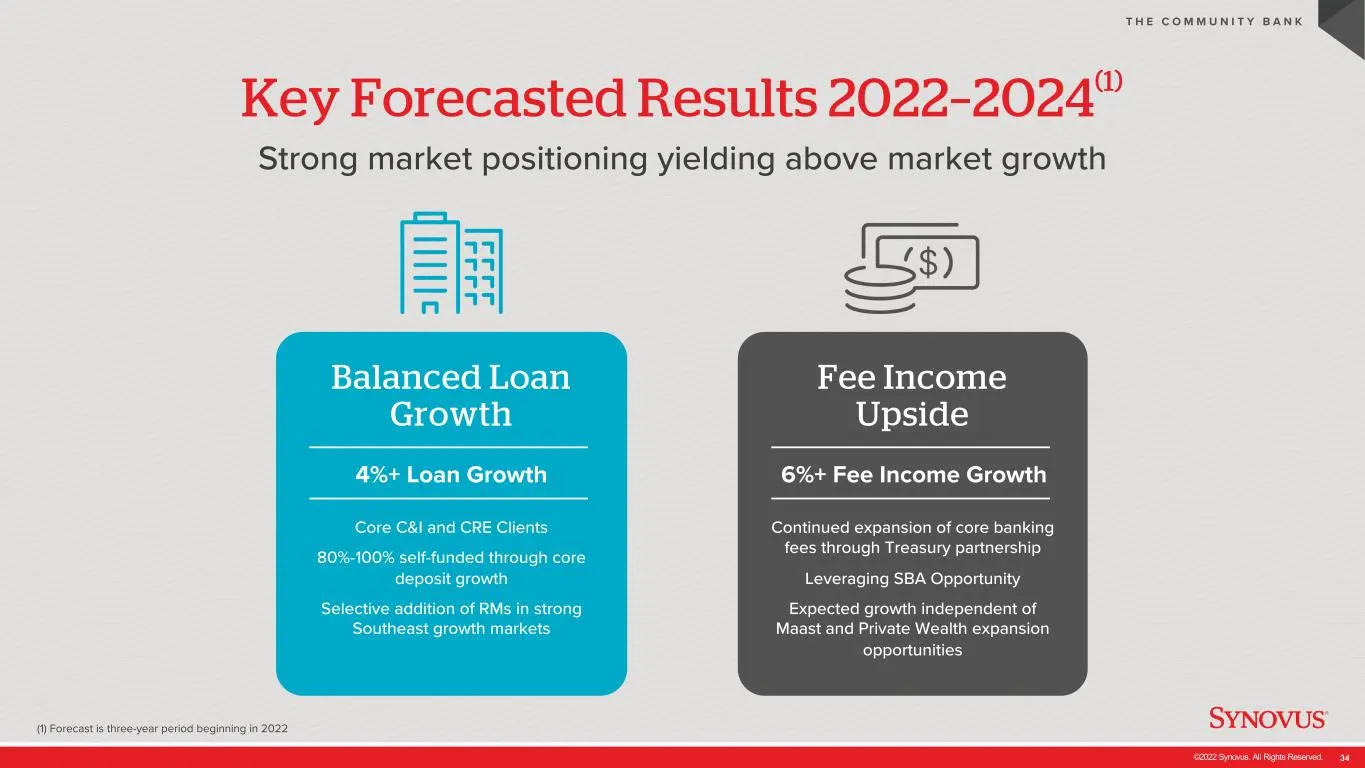
Slide 34: Key Forecasted Results 2022–2024
©2022 Synovus. All Rights Reserved. 34 Key Forecasted Results 2022–2024(1) (1) Forecast is three-year period beginning in 2022 Strong market positioning yielding above market growth T H E C O M M U N I T Y B A N K Balanced Loan Growth Fee Income Upside Core C&I and CRE Clients 80%-100% self-funded t
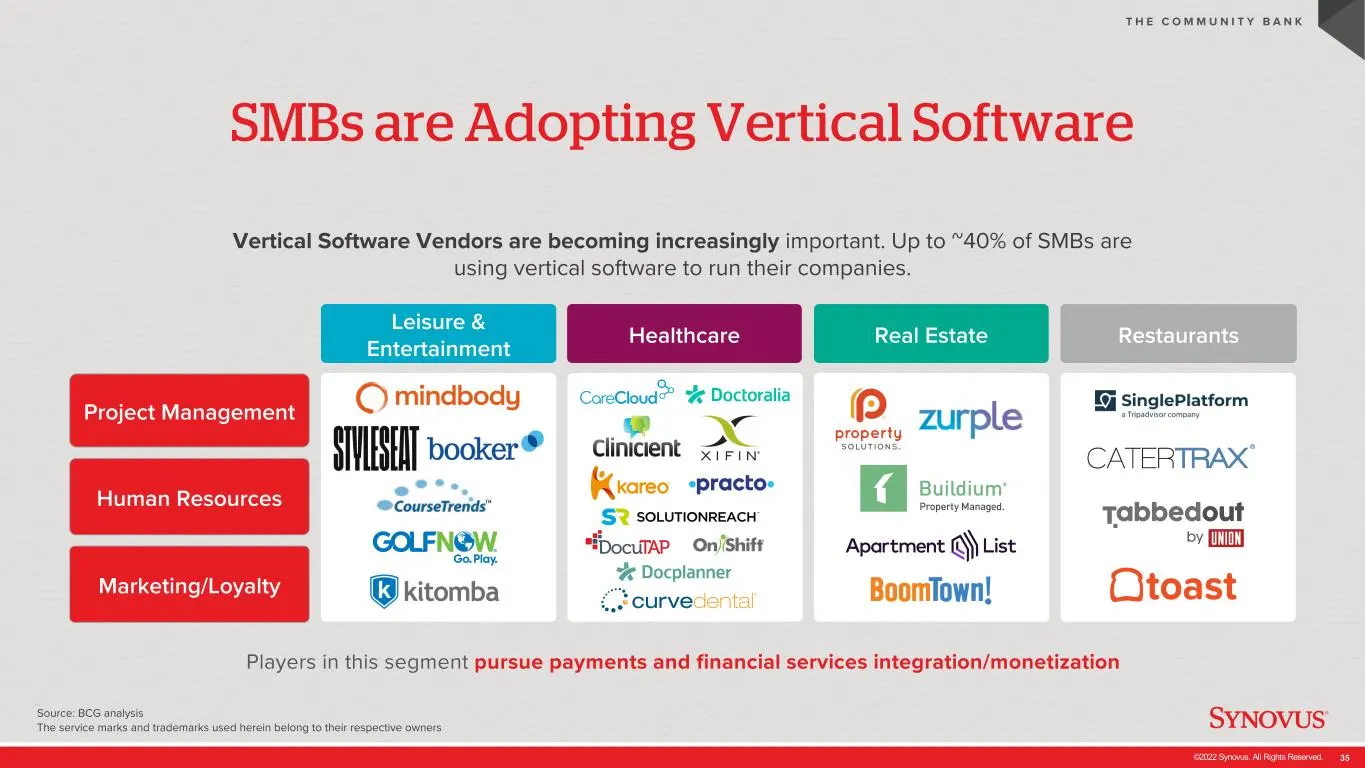
Slide 35: SMBs are Adopting Vertical Software
©2022 Synovus. All Rights Reserved. 35 SMBs are Adopting Vertical Software Source: BCG analysis The service marks and trademarks used herein belong to their respective owners T H E C O M M U N I T Y B A N K Vertical Software Vendors are becoming increasingly important. Up to ~40% of SMBs are using v
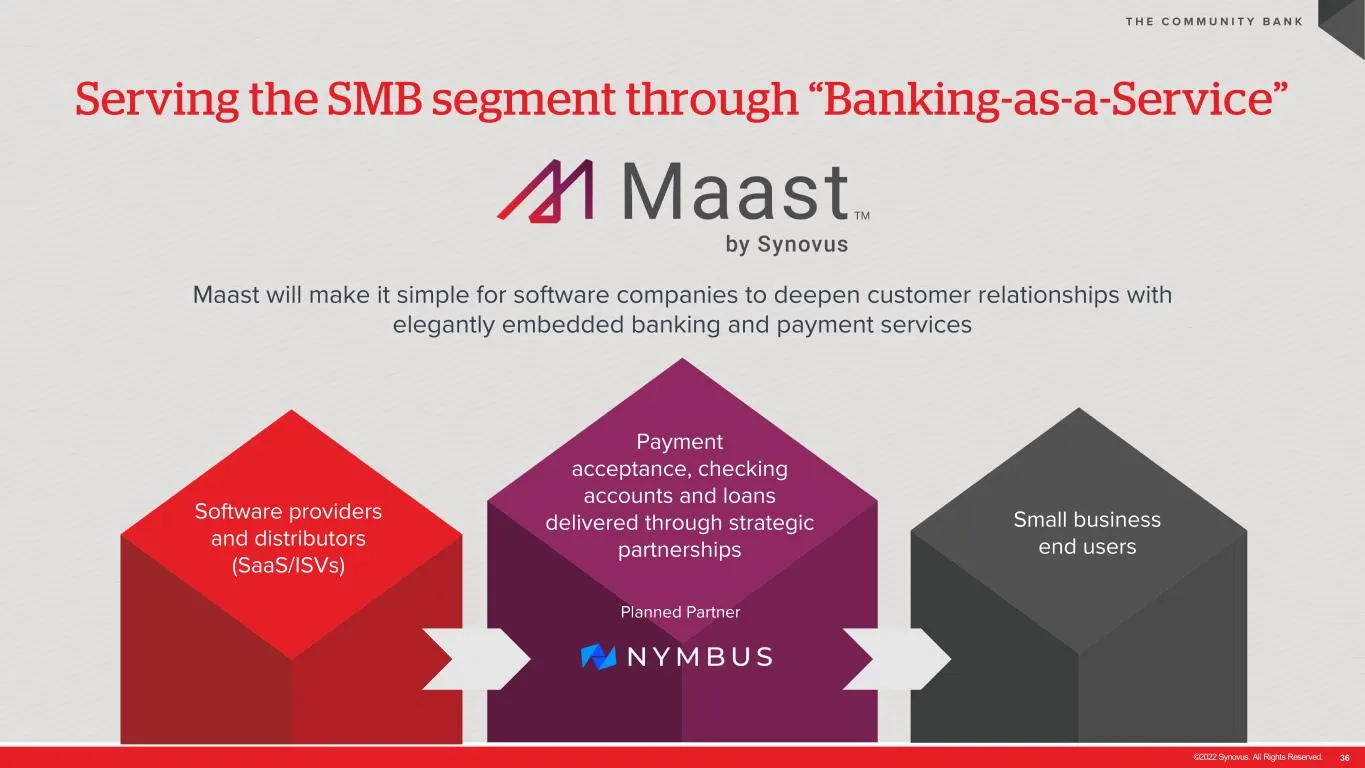
Slide 36: Serving the SMB segment through Banking-as-a-Service
©2022 Synovus. All Rights Reserved. 36 Serving the SMB segment through “Banking-as-a-Service” T H E C O M M U N I T Y B A N K Maast will make it simple for software companies to deepen customer relationships with elegantly embedded banking and payment services Payment acceptance, checking accounts a
Slide 37: The Wholesale Bank
©2022 Synovus. All Rights Reserved. 37 The Wholesale Bank Kevin Howard EVP, Chief Wholesale Banking Officer
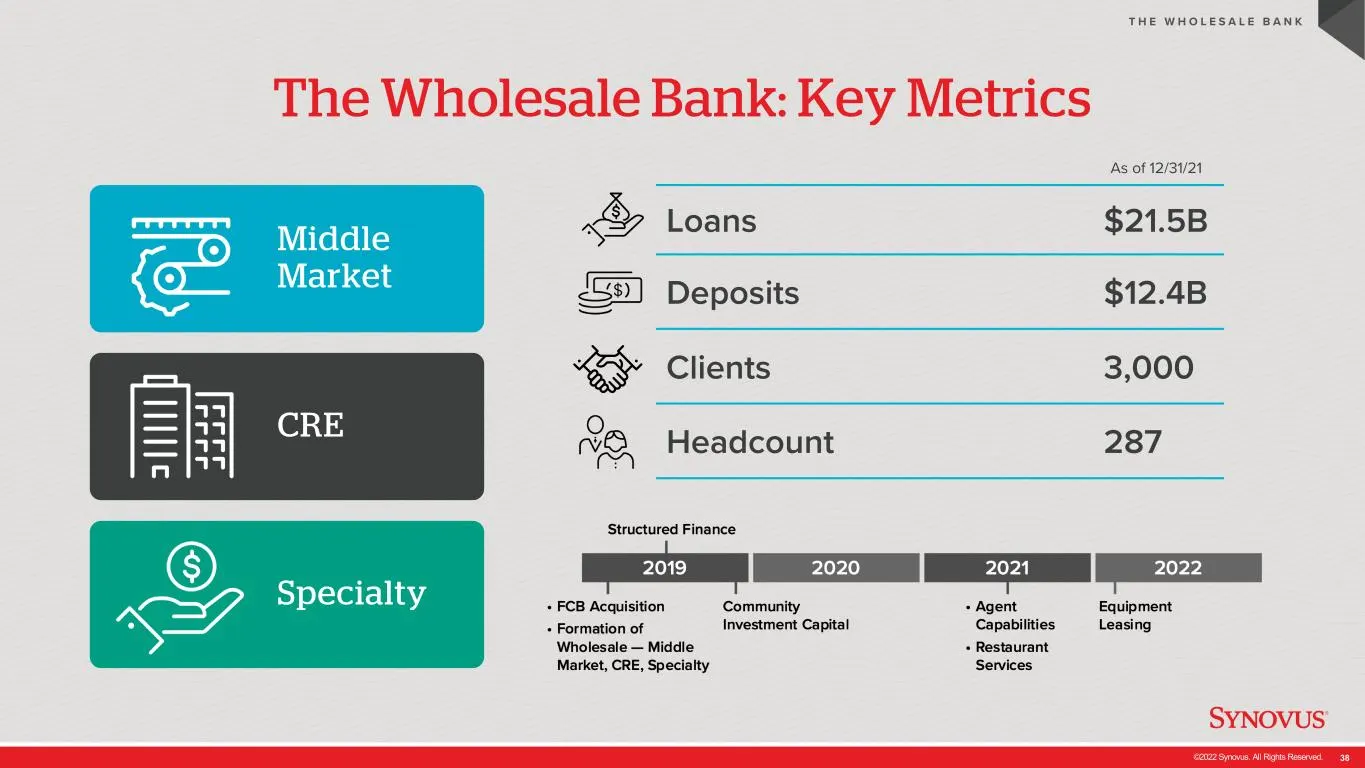
Slide 38: The Wholesale Bank: Key Metrics
©2022 Synovus. All Rights Reserved. 38 The Wholesale Bank: Key Metrics T H E W H O L E S A L E B A N K Loans $21.5B Deposits $12.4B Clients 3,000 Headcount 287 Middle Market CRE Specialty As of 12/31/21
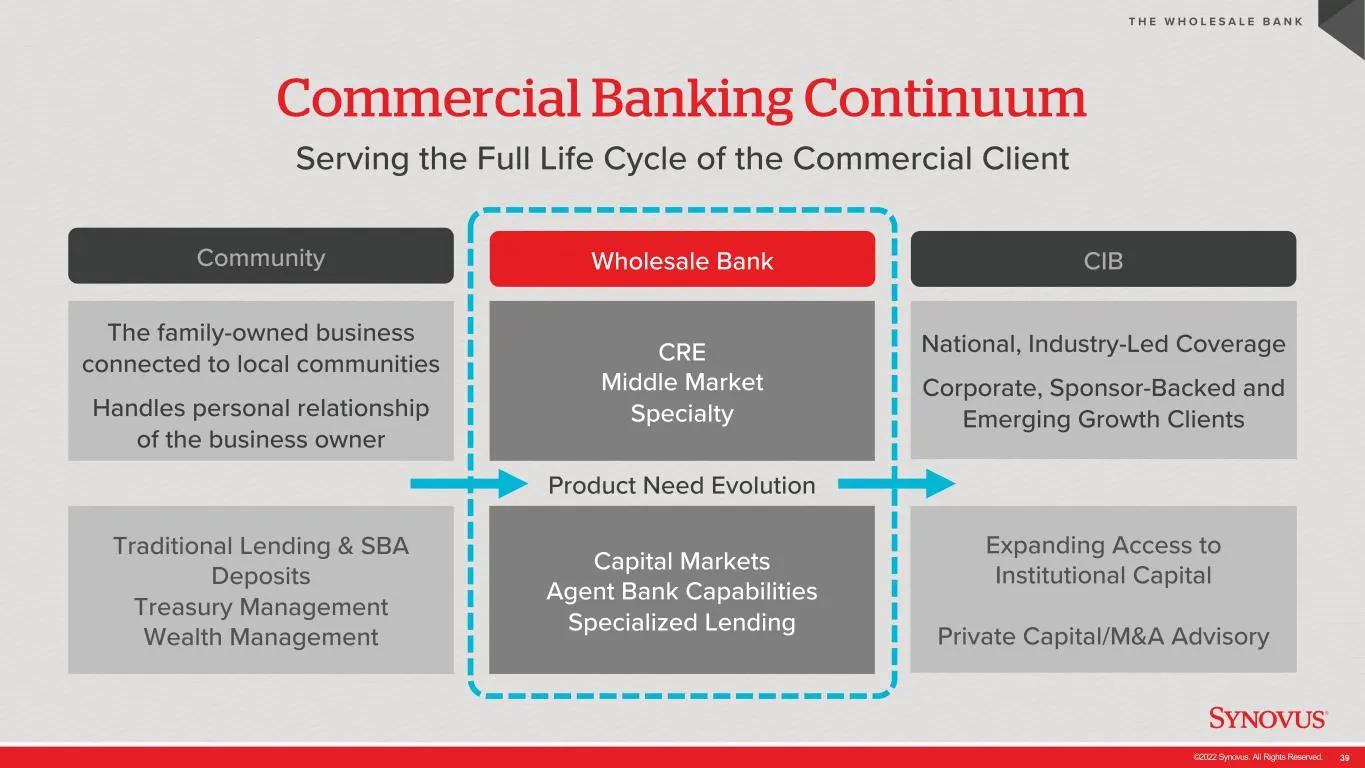
Slide 39: Commercial Banking Continuum
©2022 Synovus. All Rights Reserved. 39 Commercial Banking Continuum Serving the Full Life Cycle of the Commercial Client T H E W H O L E S A L E B A N K Community CRE Middle Market Specialty Capital Markets Agent Bank Capabilities Specialized Lending Wholesale Bank CIB Product Need Evolution The fam
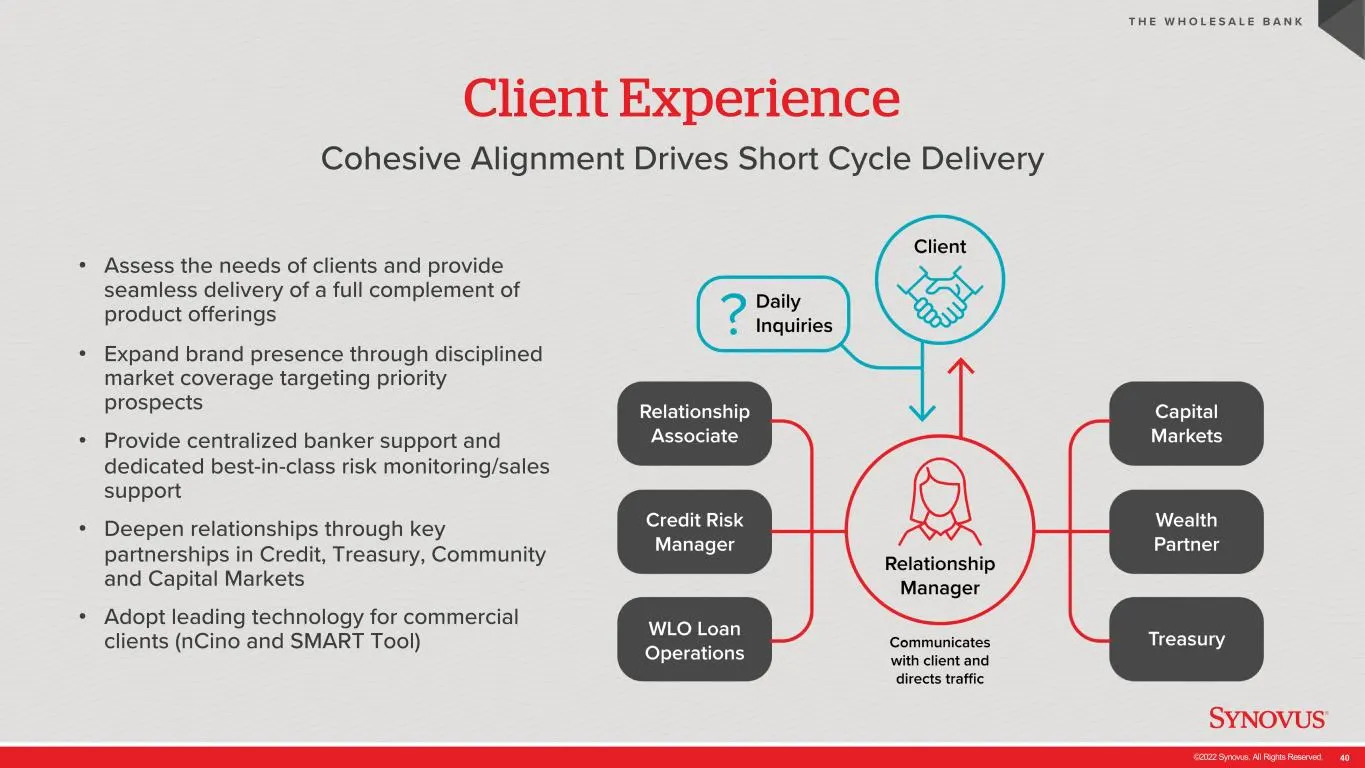
Slide 40: Client Experience: Cohesive Alignment Drives Short Cycle Delivery
©2022 Synovus. All Rights Reserved. 40 Client Experience Cohesive Alignment Drives Short Cycle Delivery T H E W H O L E S A L E B A N K • Assess the needs of clients and provide seamless delivery of a full complement of product offerings • Expand brand presence through disciplined market coverage ta
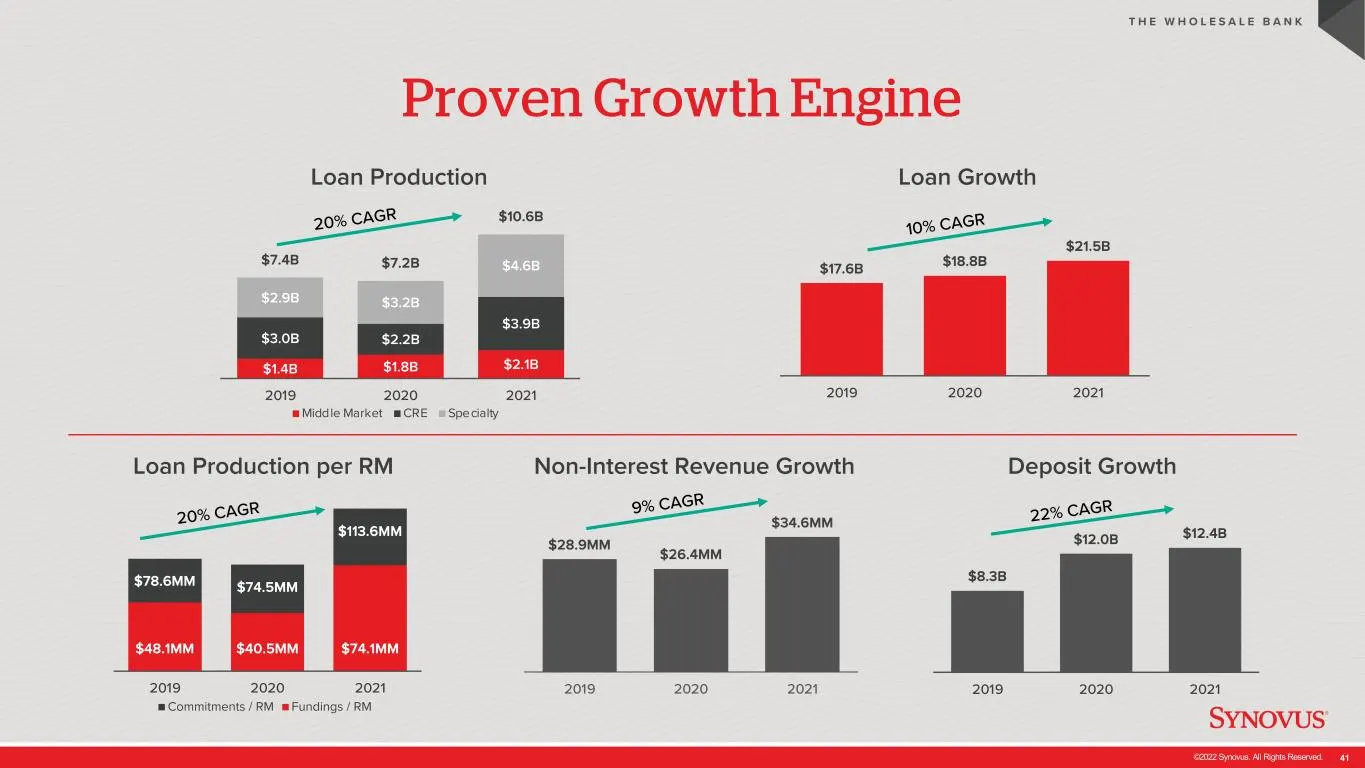
Slide 41: Proven Growth Engine
©2022 Synovus. All Rights Reserved. 41 $28.9MM $26.4MM $34.6MM 2019 2020 2021 Proven Growth Engine T H E W H O L E S A L E B A N K $1.4B $1.8B $2.1B $3.0B $2.2B $3.9B $2.9B $3.2B $4.6B$7.4B $7.2B $10.6B 2019 2020 2021 Middle Market CRE Specialty $78.6MM $74.5MM $113.6MM $48.1MM $40.5MM $74.1MM 2019
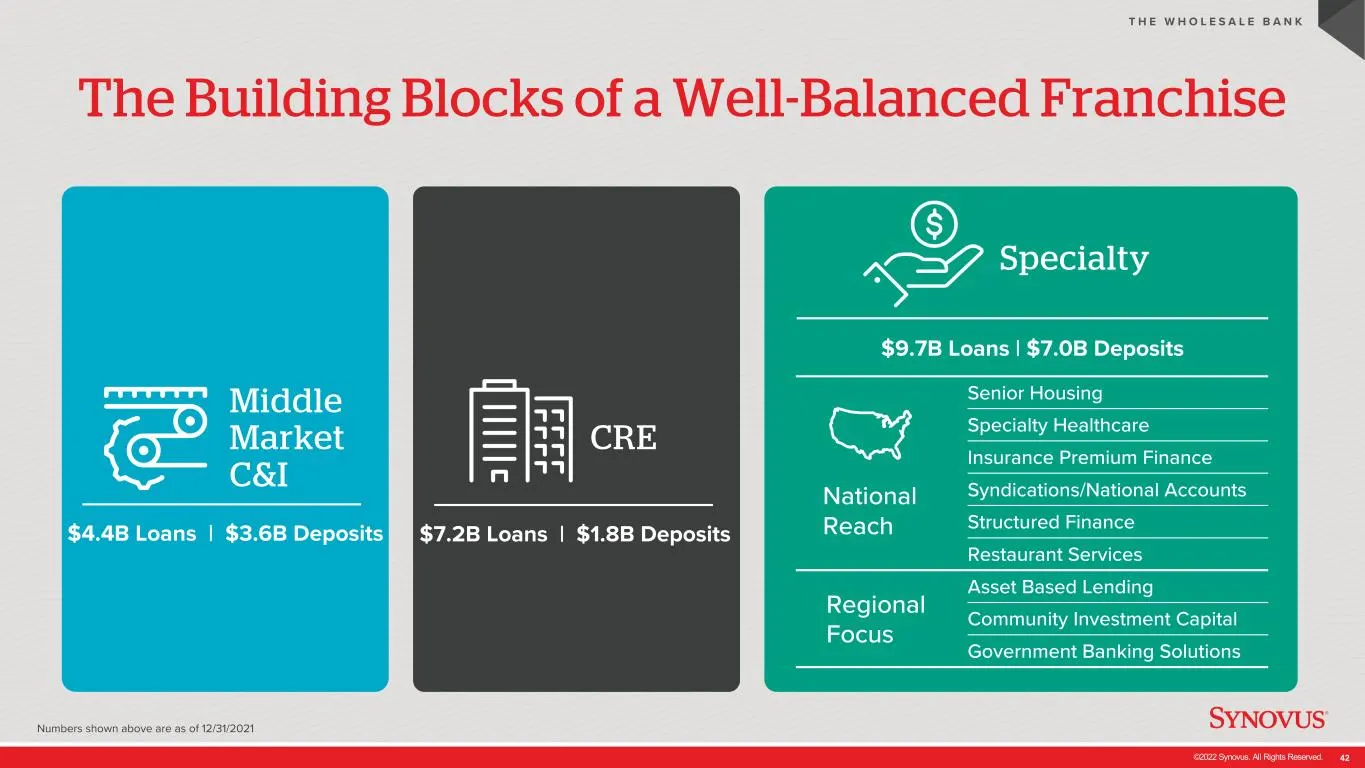
Slide 42: Building Blocks of a Well-Balanced Franchise
©2022 Synovus. All Rights Reserved. 42 Specialty Senior Housing Specialty Healthcare Insurance Premium Finance Syndications/National Accounts Structured Finance Restaurant Services Asset Based Lending Community Investment Capital Government Banking Solutions The Building Blocks of a Well-Balanced Fr
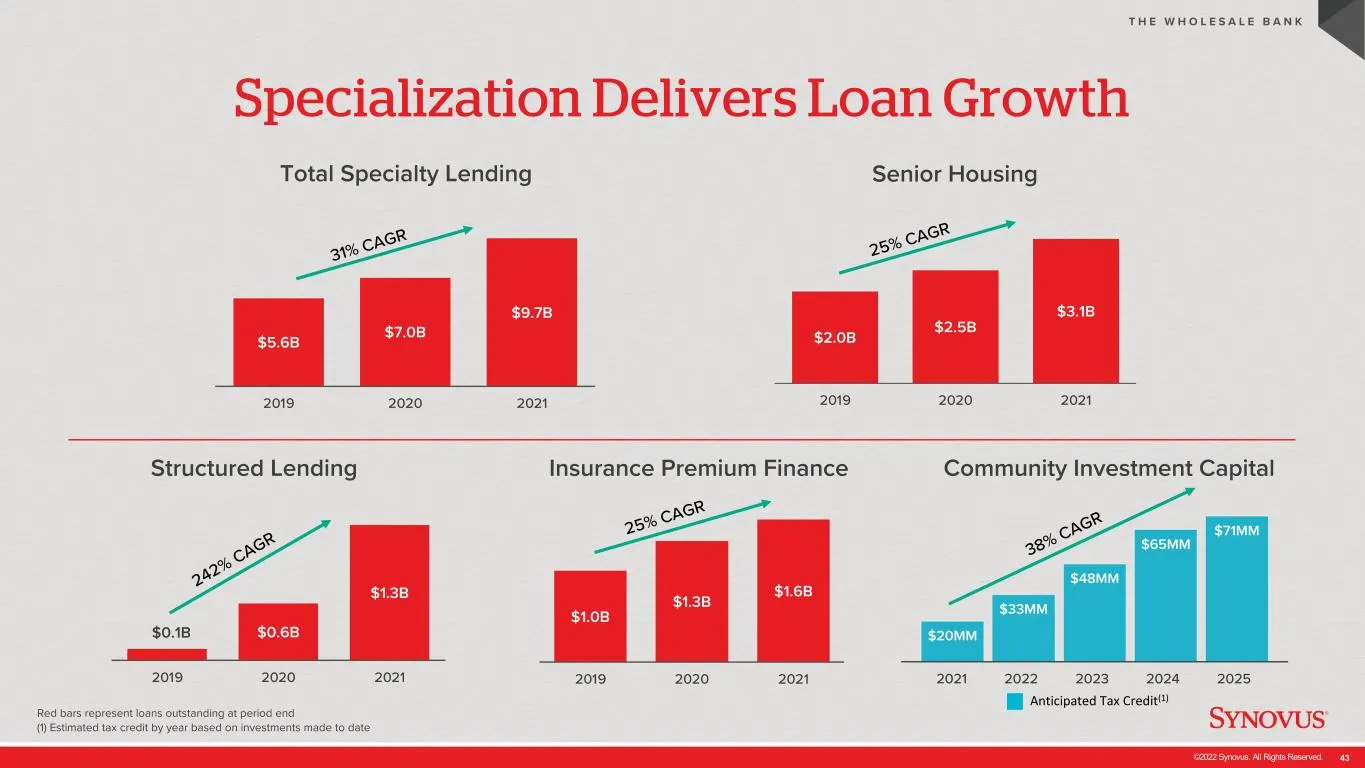
Slide 43: Specialization Delivers Loan Growth
©2022 Synovus. All Rights Reserved. 43 Specialization Delivers Loan Growth Red bars represent loans outstanding at period end (1) Estimated tax credit by year based on investments made to date T H E W H O L E S A L E B A N K $5.6B $7.0B $9.7B 2019 2020 2021 $2.0B $2.5B $3.1B 2019 2020 2021 $0.1B $0.
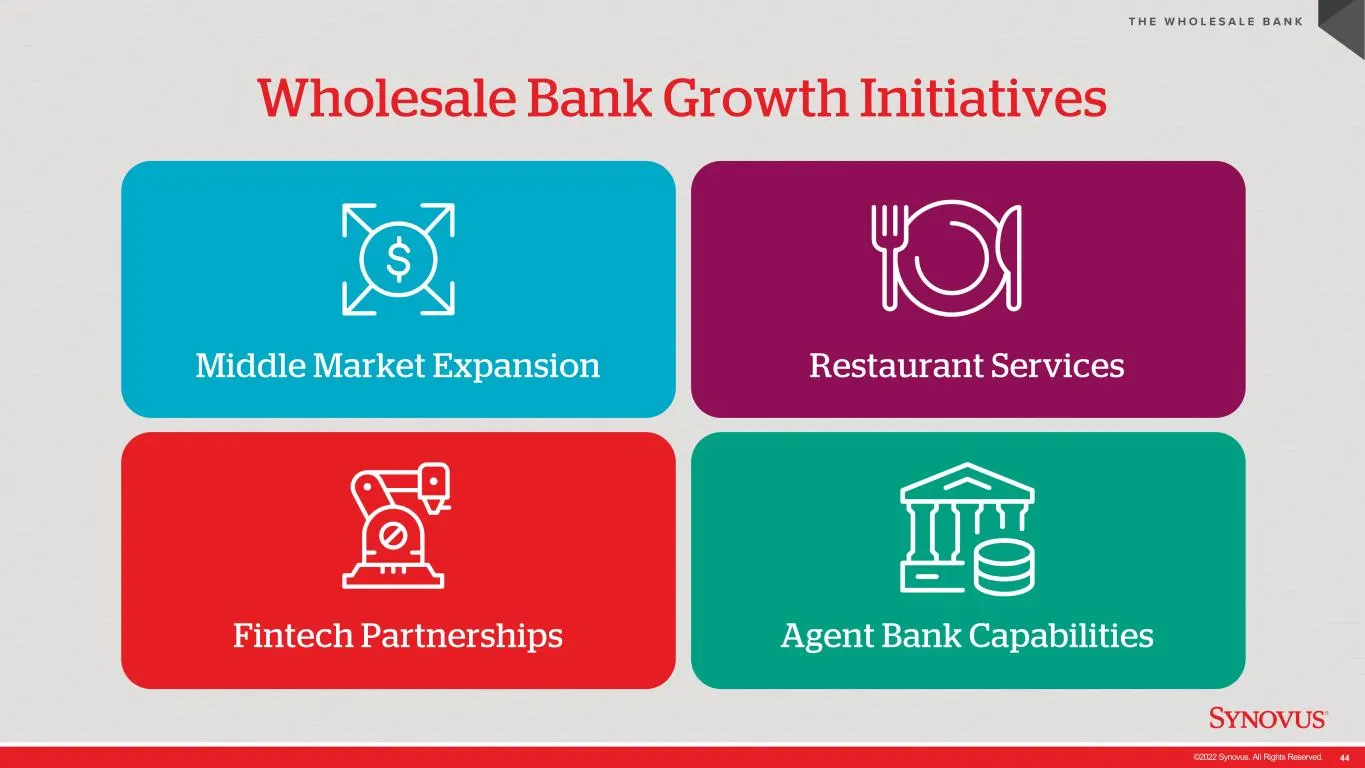
Slide 44: Wholesale Bank Growth Initiatives
©2022 Synovus. All Rights Reserved. 44 Wholesale Bank Growth Initiatives T H E W H O L E S A L E B A N K Middle Market Expansion Restaurant Services Agent Bank CapabilitiesFintech Partnerships
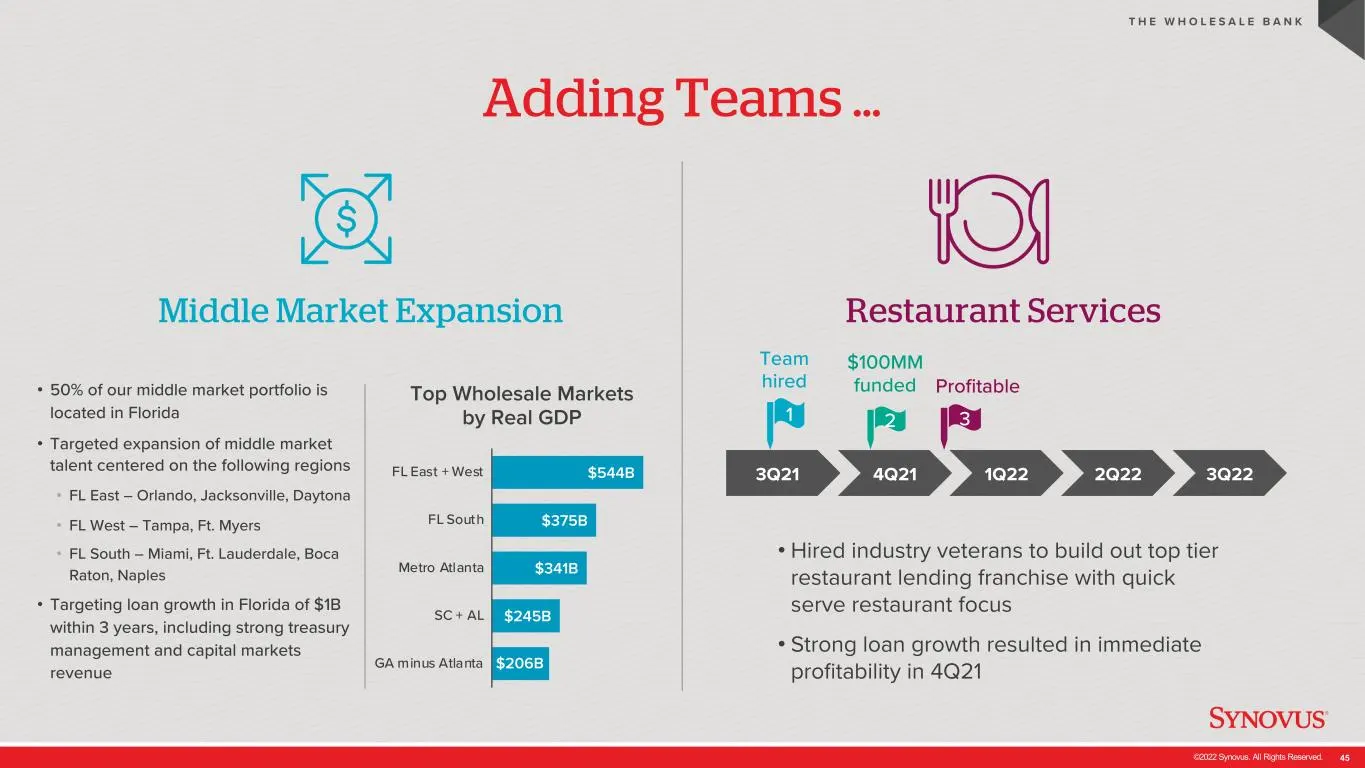
Slide 45: Adding Teams
©2022 Synovus. All Rights Reserved. 45 Adding Teams … T H E W H O L E S A L E B A N K Middle Market Expansion Restaurant Services • 50% of our middle market portfolio is located in Florida • Targeted expansion of middle market talent centered on the following regions • FL East – Orlando, Jacksonvill
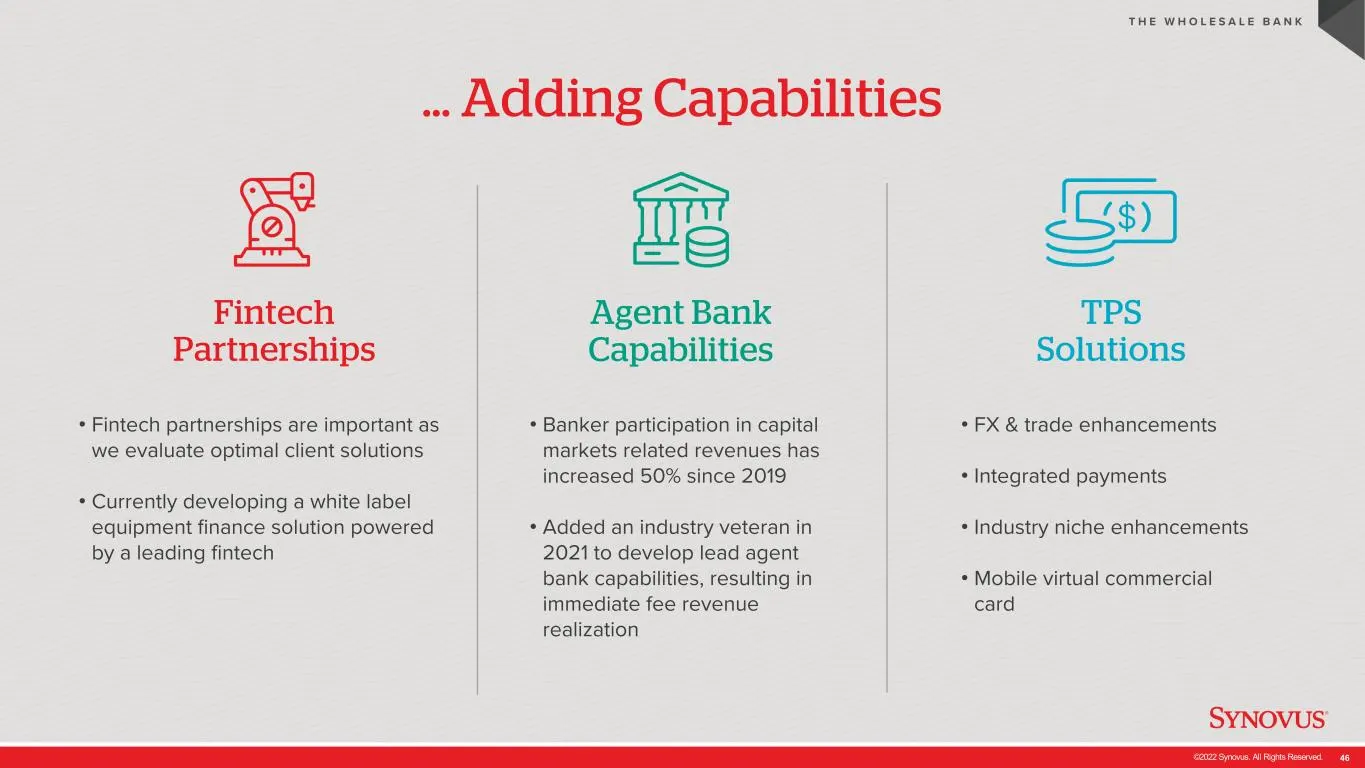
Slide 46: Adding Capabilities
©2022 Synovus. All Rights Reserved. 46 … Adding Capabilities T H E W H O L E S A L E B A N K • Fintech partnerships are important as we evaluate optimal client solutions • Currently developing a white label equipment finance solution powered by a leading fintech • FX & trade enhancements • Integrate
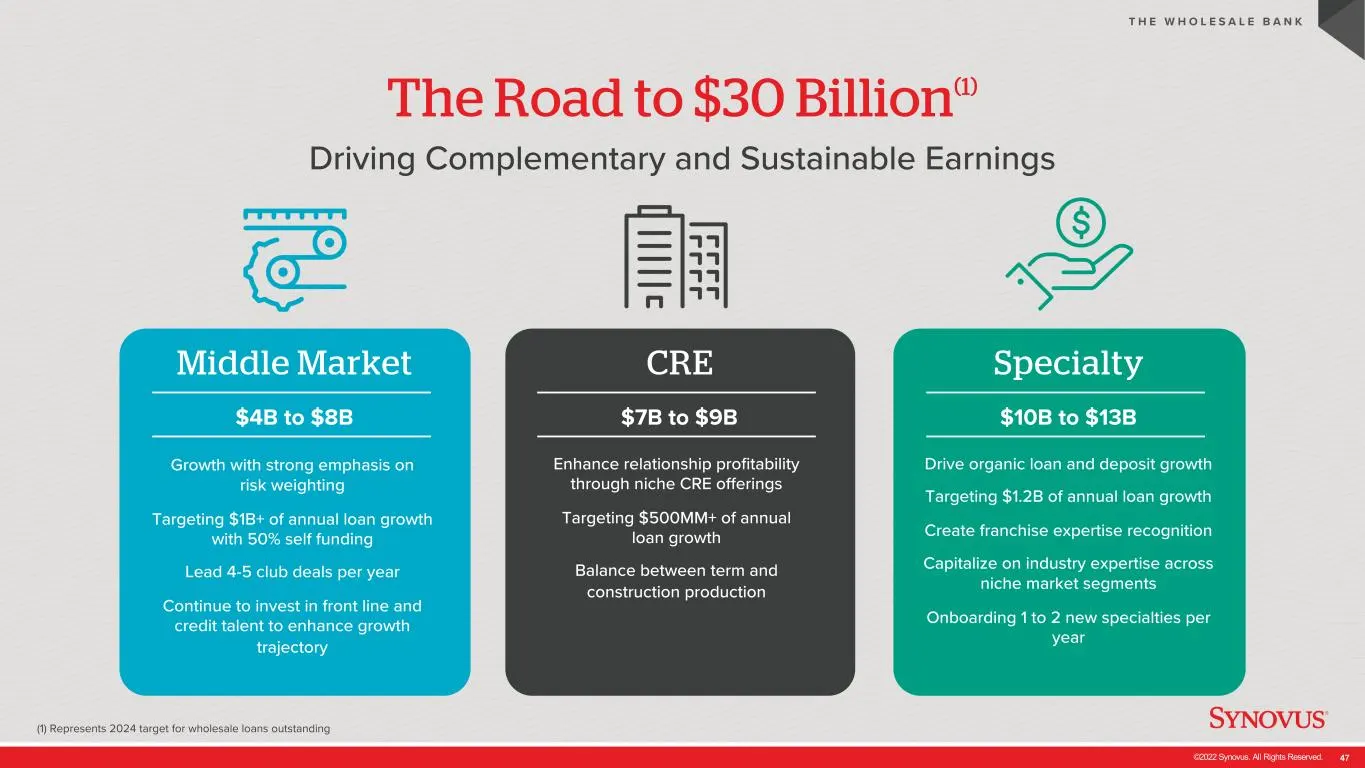
Slide 47: The Road to $30 Billion
©2022 Synovus. All Rights Reserved. 47 The Road to $30 Billion(1) (1) Represents 2024 target for wholesale loans outstanding Driving Complementary and Sustainable Earnings T H E W H O L E S A L E B A N K Middle Market CRE Specialty $4B to $8B Growth with strong emphasis on risk weighting Targeting $
Slide 48: Corporate & Investment Bank
©2022 Synovus. All Rights Reserved. 48 Corporate & Investment Bank Tom Dierdorff EVP, Head of Corporate & Investment Banking
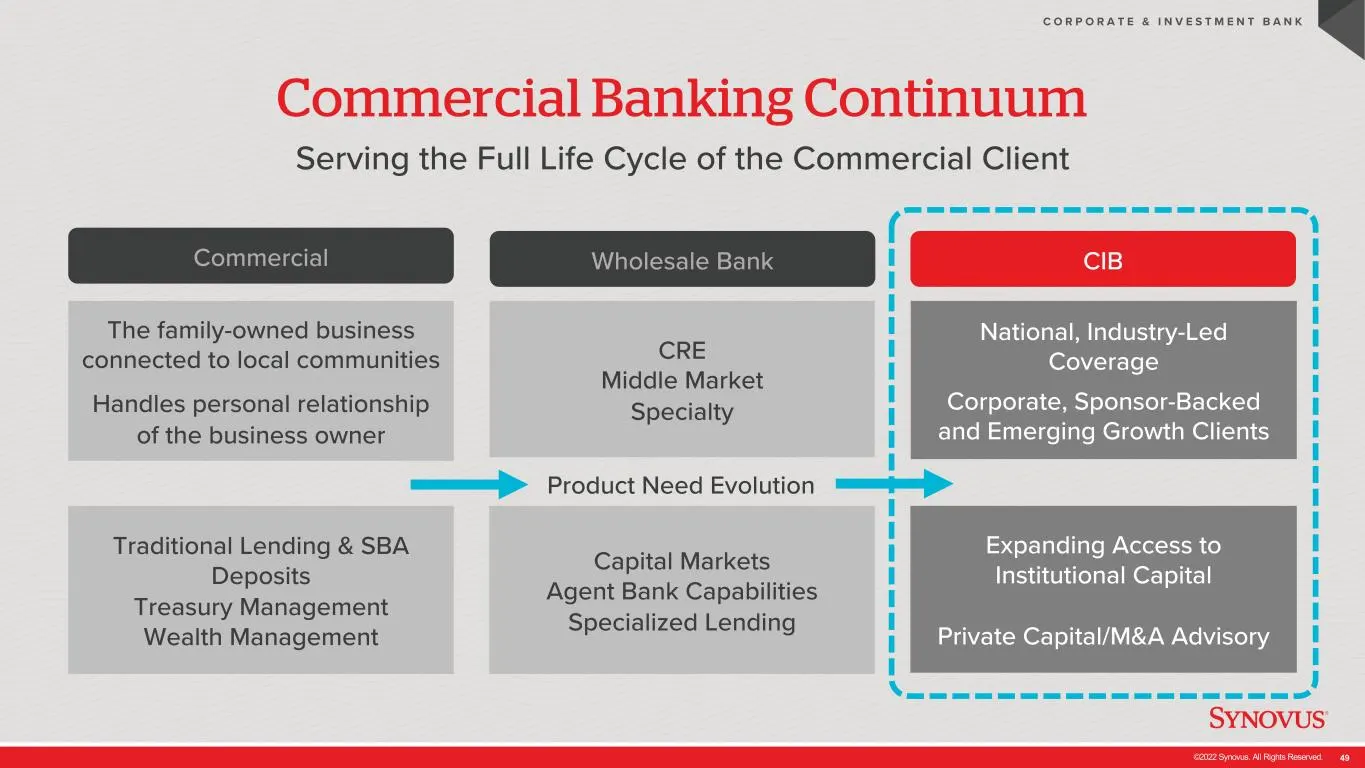
Slide 49: Commercial Banking Continuum
©2022 Synovus. All Rights Reserved. 49 Commercial Banking Continuum Serving the Full Life Cycle of the Commercial Client C O R P O R A T E & I N V E S T M E N T B A N K Commercial The family-owned business connected to local communities Handles personal relationship of the business owner CRE Middle
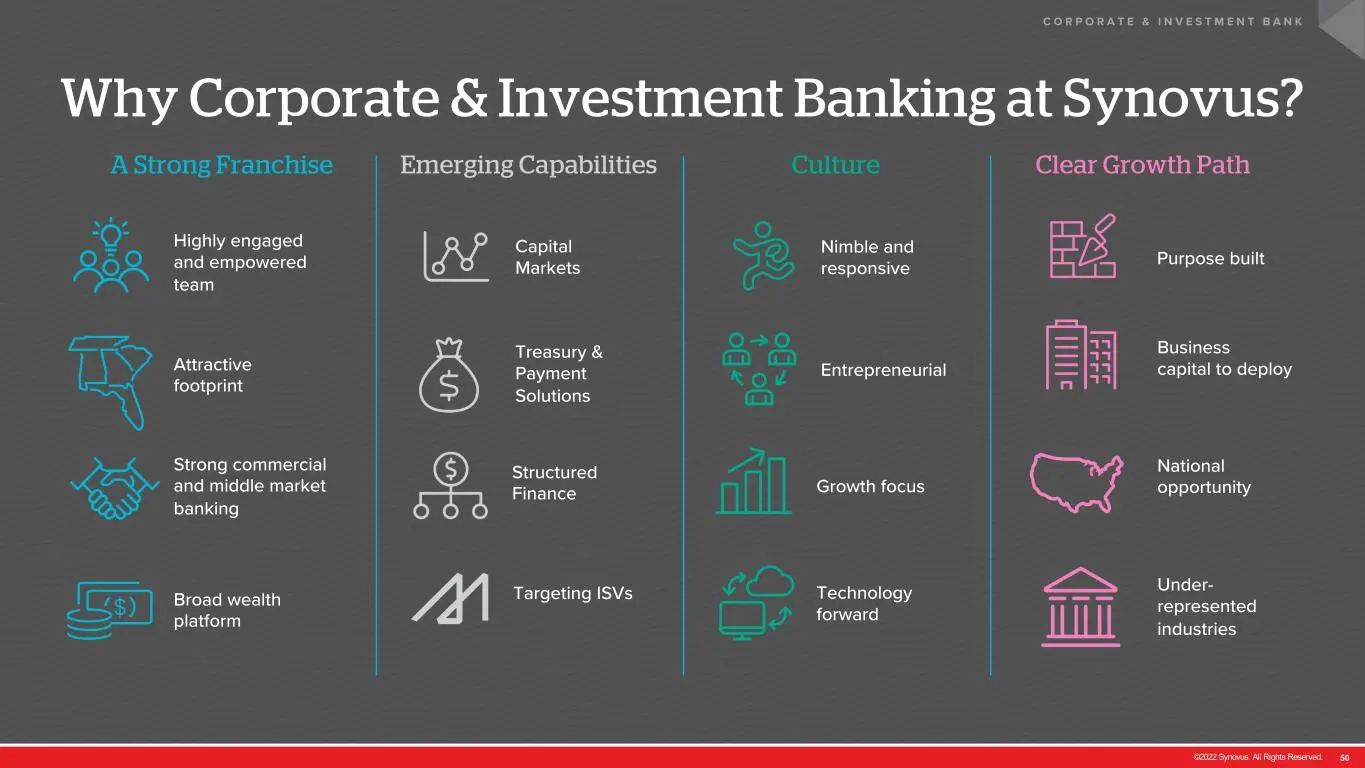
Slide 50: Why Corporate & Investment Banking at Synovus?
©2022 Synovus. All Rights Reserved. 50 Why Corporate & Investment Banking at Synovus? C O R P O R A T E & I N V E S T M E N T B A N K A Strong Franchise Emerging Capabilities Culture Clear Growth Path Purpose built Targeting ISVs Highly engaged and empowered team Attractive footprint Strong commerci
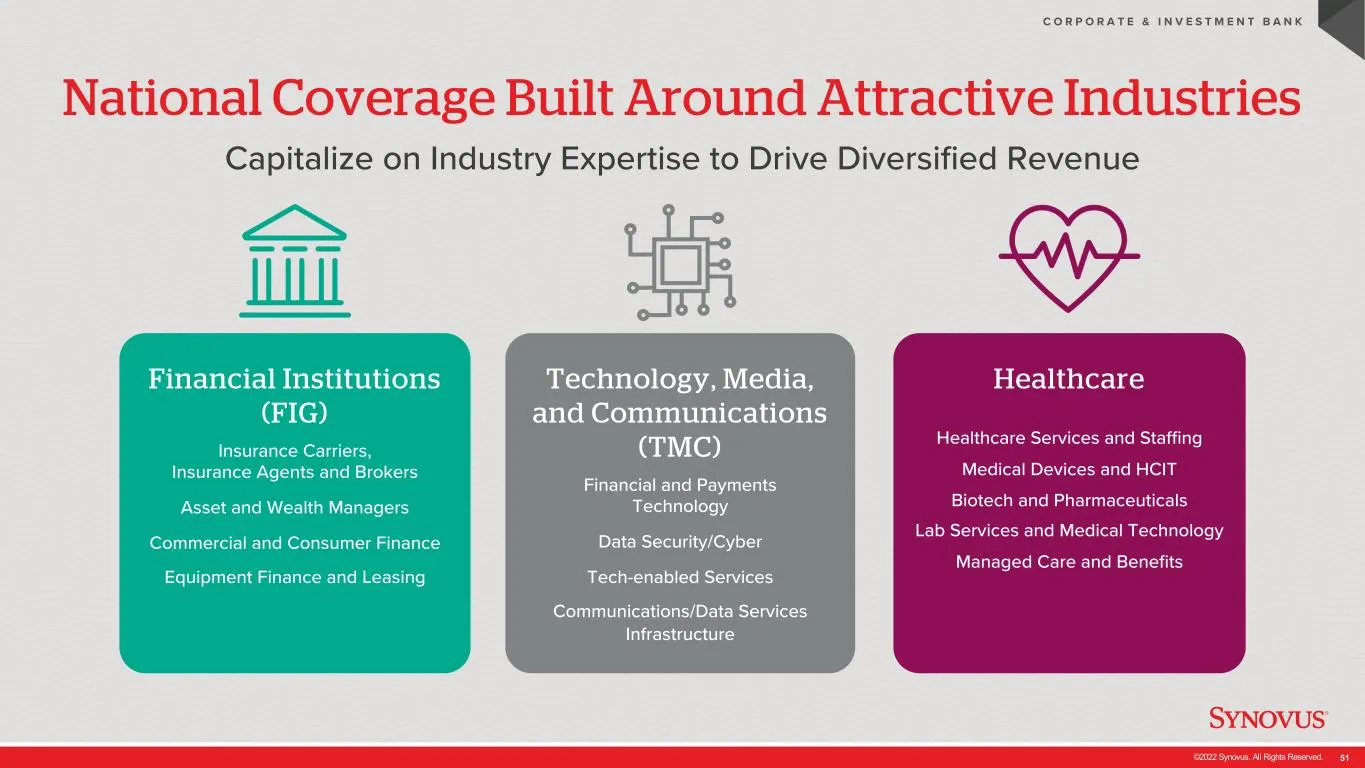
Slide 51: National Coverage Built Around Attractive Industries
©2022 Synovus. All Rights Reserved. 51 National Coverage Built Around Attractive Industries Capitalize on Industry Expertise to Drive Diversified Revenue C O R P O R A T E & I N V E S T M E N T B A N K Financial Institutions (FIG) Insurance Carriers, Insurance Agents and Brokers Asset and Wealth Man
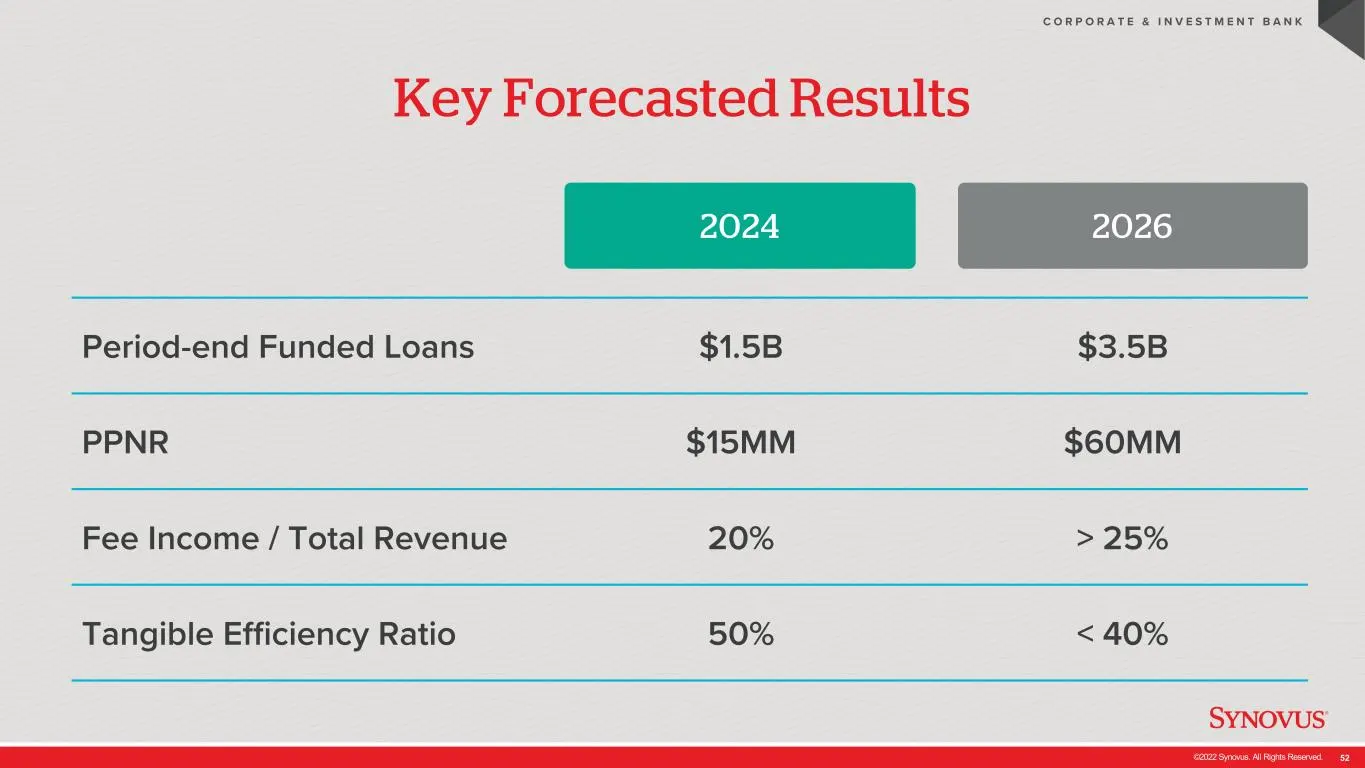
Slide 52: Key Forecasted Results
©2022 Synovus. All Rights Reserved. 52 Key Forecasted Results C O R P O R A T E & I N V E S T M E N T B A N K Period-end Funded Loans $1.5B $3.5B PPNR $15MM $60MM Fee Income / Total Revenue 20% > 25% Tangible Efficiency Ratio 50% < 40% 2024 2026
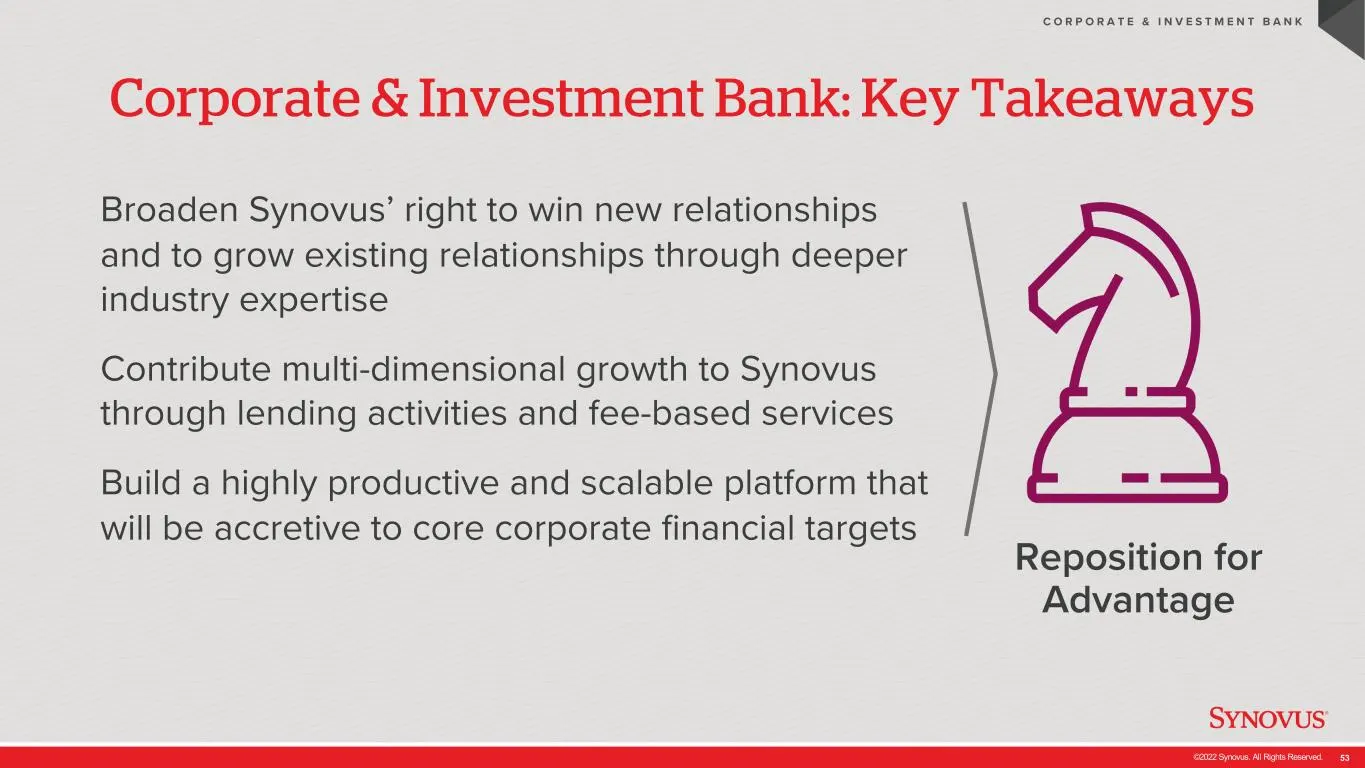
Slide 53: Corporate & Investment Bank: Key Takeaways
©2022 Synovus. All Rights Reserved. 53 Corporate & Investment Bank: Key Takeaways Broaden Synovus’ right to win new relationships and to grow existing relationships through deeper industry expertise Contribute multi-dimensional growth to Synovus through lending activities and fee-based services Buil
Slide 54: Treasury & Payment Solutions
©2022 Synovus. All Rights Reserved. 54 Treasury & Payment Solutions Katherine Weislogel EVP, Head of Treasury & Payment Solutions
Slide 55: Treasury & Payment Solutions: Key Metrics
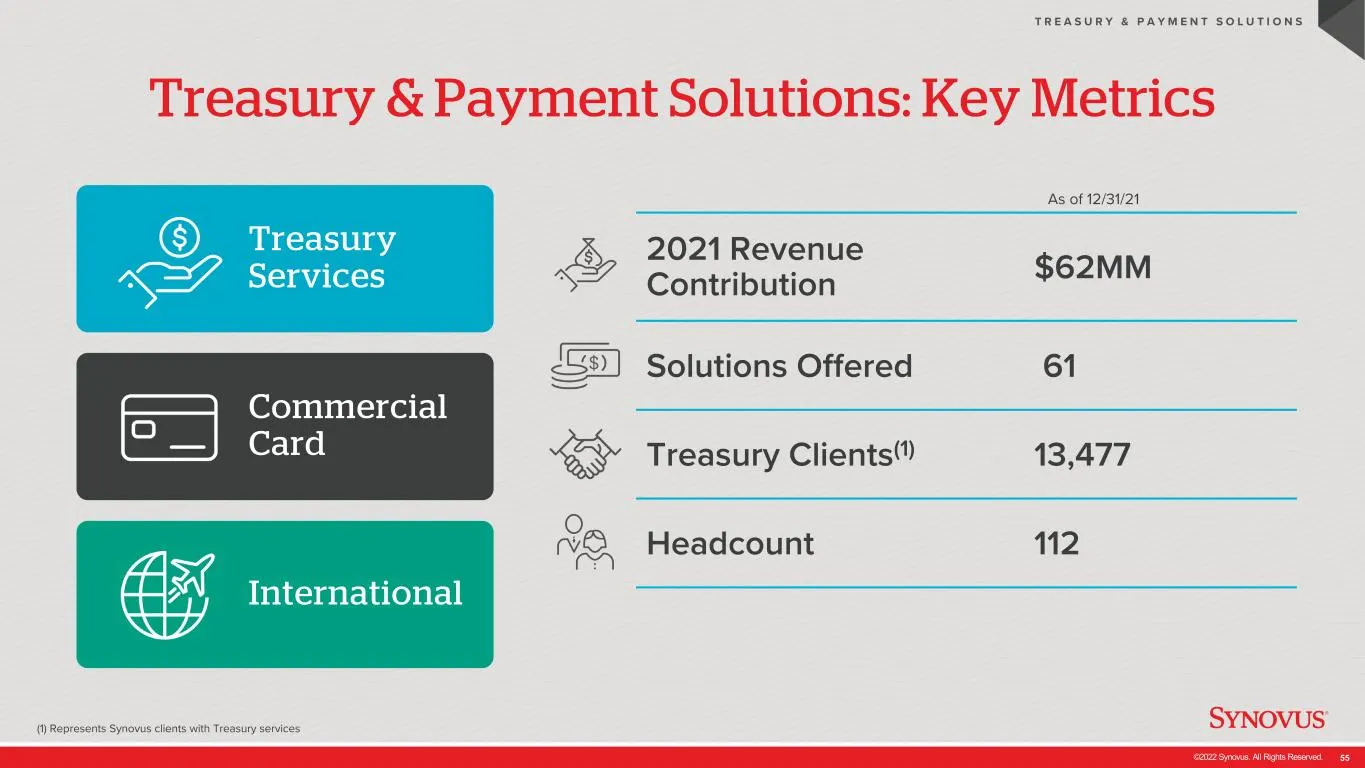
©2022 Synovus. All Rights Reserved. 55 Treasury & Payment Solutions: Key Metrics (1) Represents Synovus clients with Treasury services T R E A S U R Y & P A Y M E N T S O L U T I O N S 2021 Revenue Contribution $62MM Solutions Offered 61 Treasury Clients(1) 13,477 Headcount 112 As of 12/31/21 Treasu
Slide 56: TPS – Driving Value By Delivering Results
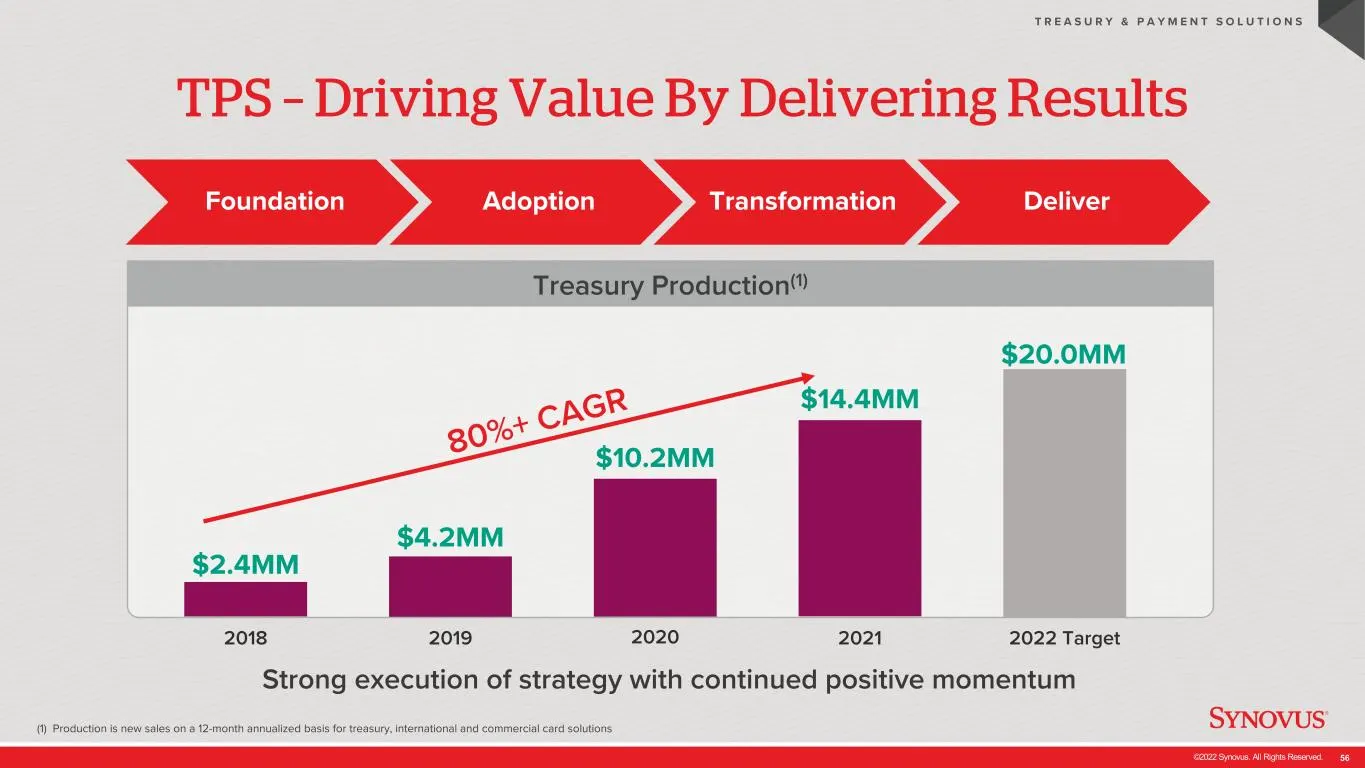
©2022 Synovus. All Rights Reserved. 56 TPS – Driving Value By Delivering Results (1) Production is new sales on a 12-month annualized basis for treasury, international and commercial card solutions T R E A S U R Y & P A Y M E N T S O L U T I O N S $2.4MM $4.2MM $14.4MM Treasury Production(1) $10.2MM
Slide 57: What's Beneath The Surface
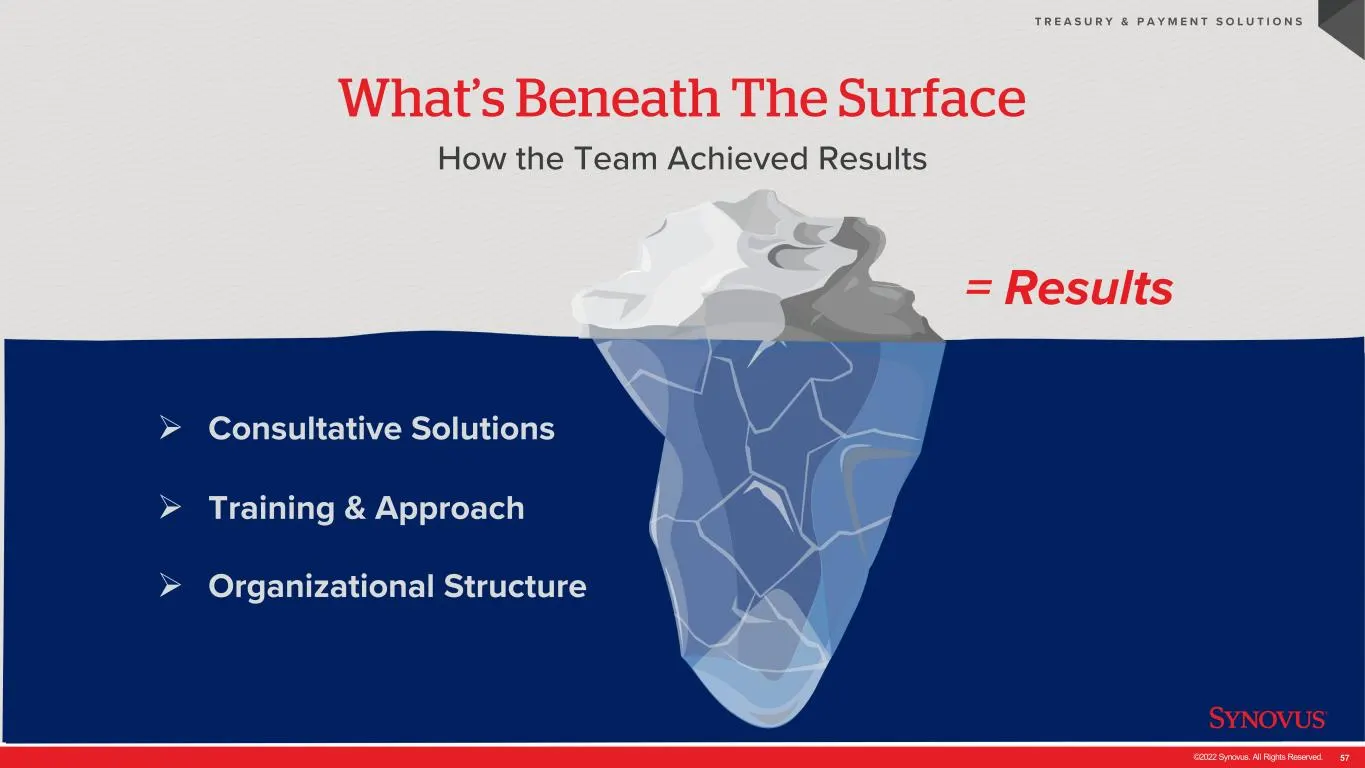
©2022 Synovus. All Rights Reserved. 57 What’s Beneath The Surface How the Team Achieved Results T R E A S U R Y & P A Y M E N T S O L U T I O N S Ø Consultative Solutions Ø Training & Approach Ø Organizational Structure = Results
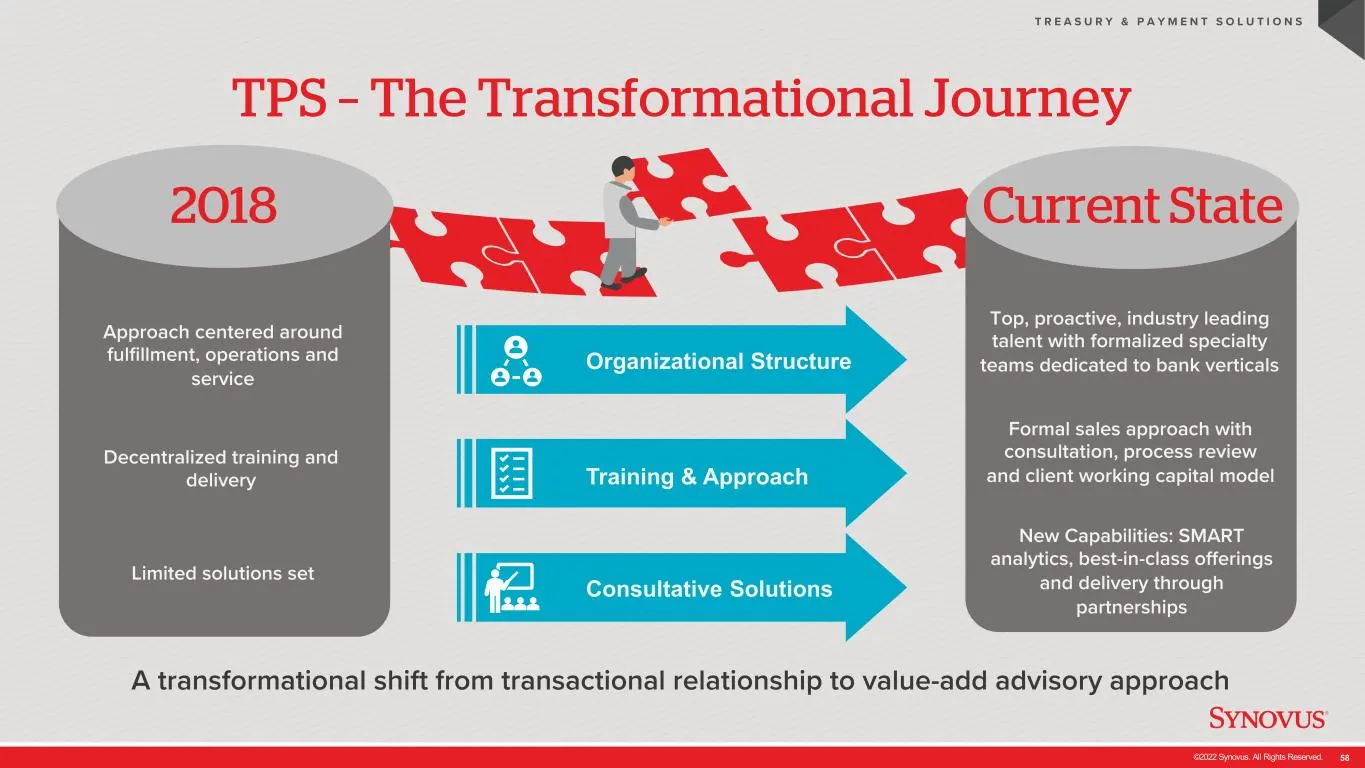
Slide 58: TPS – The Transformational Journey
©2022 Synovus. All Rights Reserved. 58 2018 Current State TPS – The Transformational Journey T R E A S U R Y & P A Y M E N T S O L U T I O N S New Capabilities: SMART analytics, best-in-class offerings and delivery through partnerships Formal sales approach with consultation, process review and clie
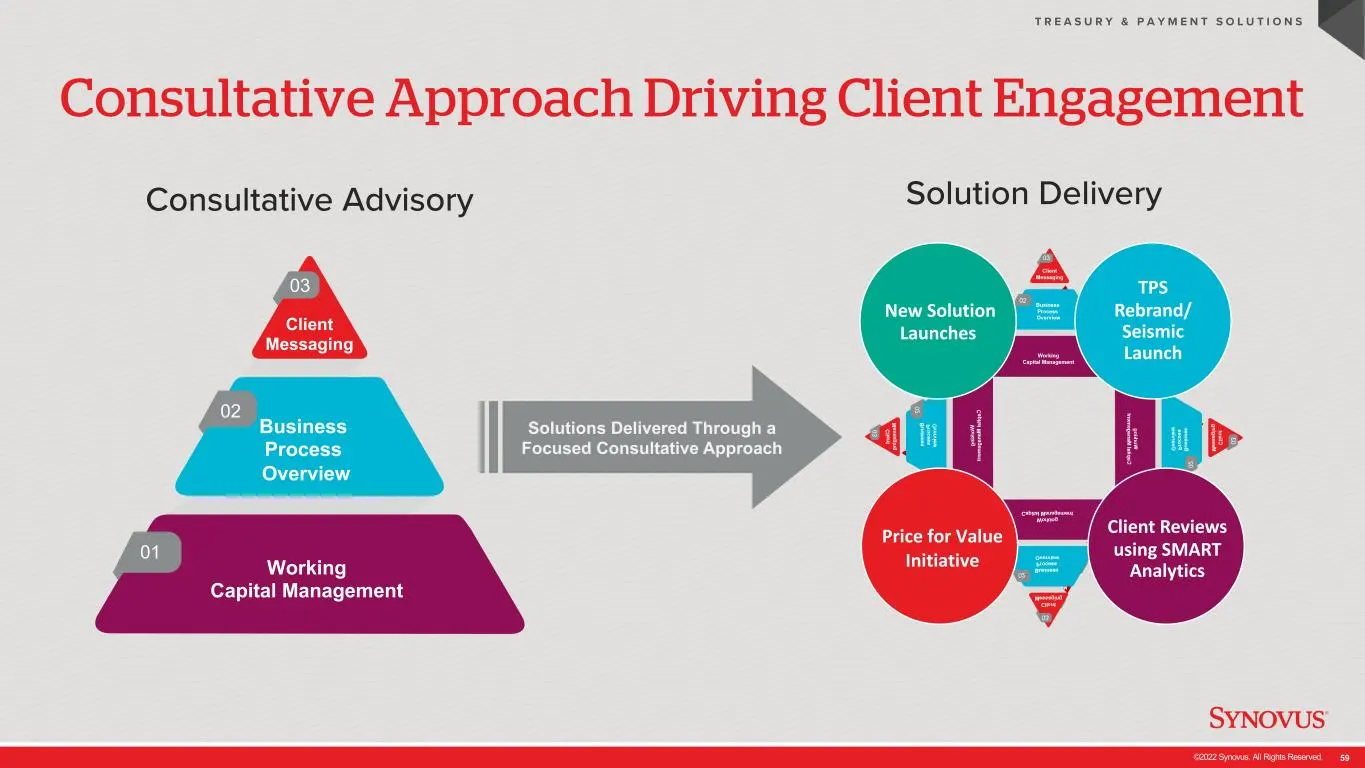
Slide 59: Consultative Approach Driving Client Engagement
©2022 Synovus. All Rights Reserved. 59 Consultative Approach Driving Client Engagement T R E A S U R Y & P A Y M E N T S O L U T I O N S Consultative Advisory Solution Delivery 01 02 03 Client Messaging Business Process Overview Working Capital Management Solutions Delivered Through a Focused Consul
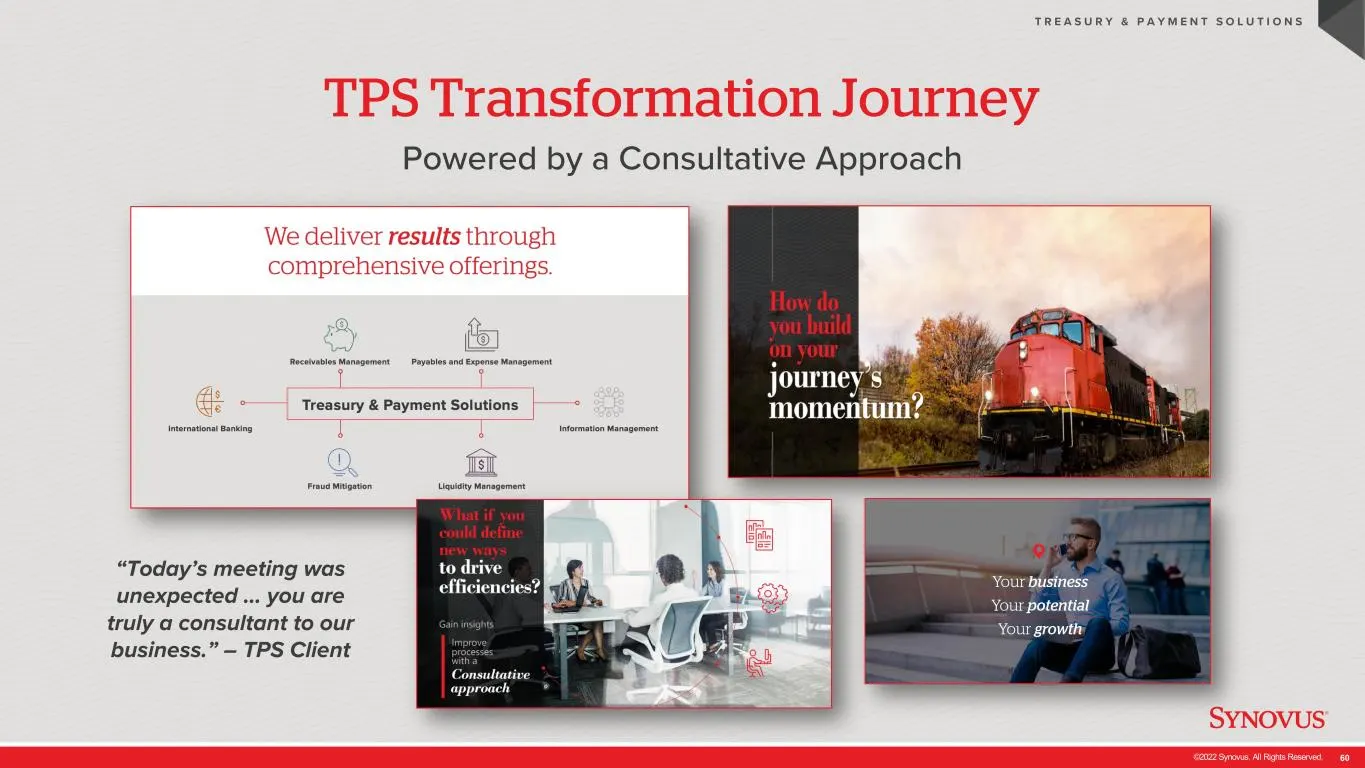
Slide 60: TPS Transformation Journey Powered by a Consultative Approach
©2022 Synovus. All Rights Reserved. 60 TPS Transformation Journey Powered by a Consultative Approach T R E A S U R Y & P A Y M E N T S O L U T I O N S “Today’s meeting was unexpected … you are truly a consultant to our business.” – TPS Client
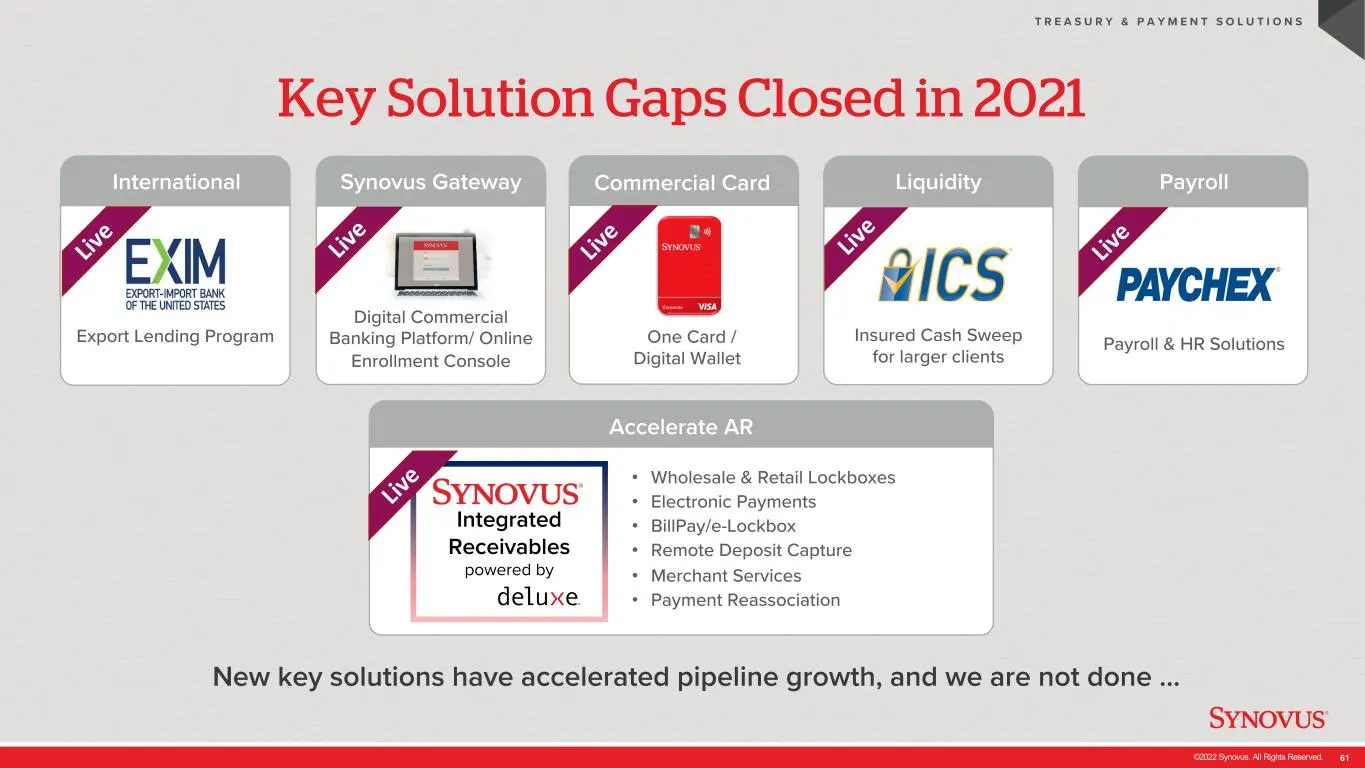
Slide 61: Key Solution Gaps Closed in 2021
©2022 Synovus. All Rights Reserved. 61 Liv e Liv e Key Solution Gaps Closed in 2021 T R E A S U R Y & P A Y M E N T S O L U T I O N S Insured Cash Sweep for larger clients Digital Commercial Banking Platform/ Online Enrollment Console Synovus Gateway Export Lending Program International One Card / D
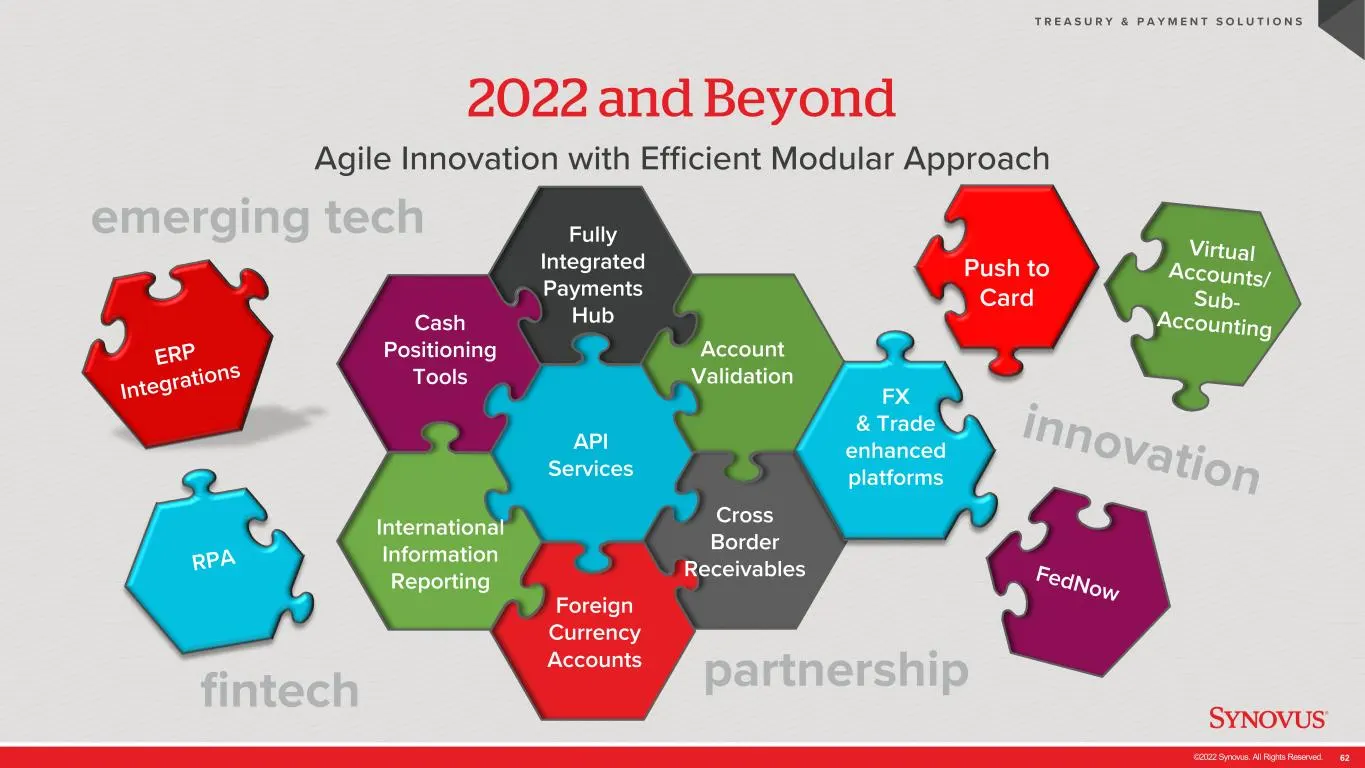
Slide 62: 2022 and Beyond
©2022 Synovus. All Rights Reserved. 62 2022 and Beyond Agile Innovation with Efficient Modular Approach T R E A S U R Y & P A Y M E N T S O L U T I O N S API Services Foreign Currency Accounts International Information Reporting Cash Positioning Tools Cross Border Receivables Fully Integrated Paymen
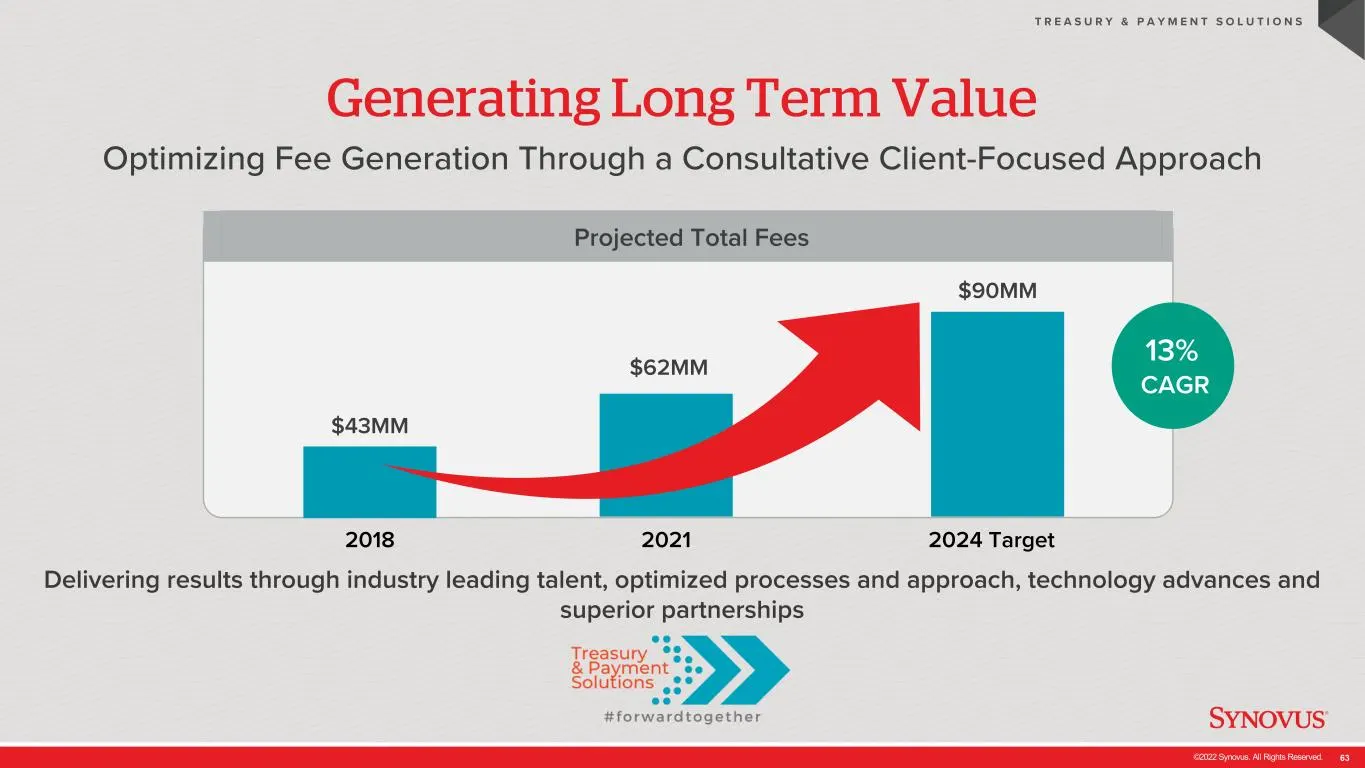
Slide 63: Generating Long Term Value
©2022 Synovus. All Rights Reserved. 63 Generating Long Term Value Optimizing Fee Generation Through a Consultative Client-Focused Approach T R E A S U R Y & P A Y M E N T S O L U T I O N S $43MM Delivering results through industry leading talent, optimized processes and approach, technology advances
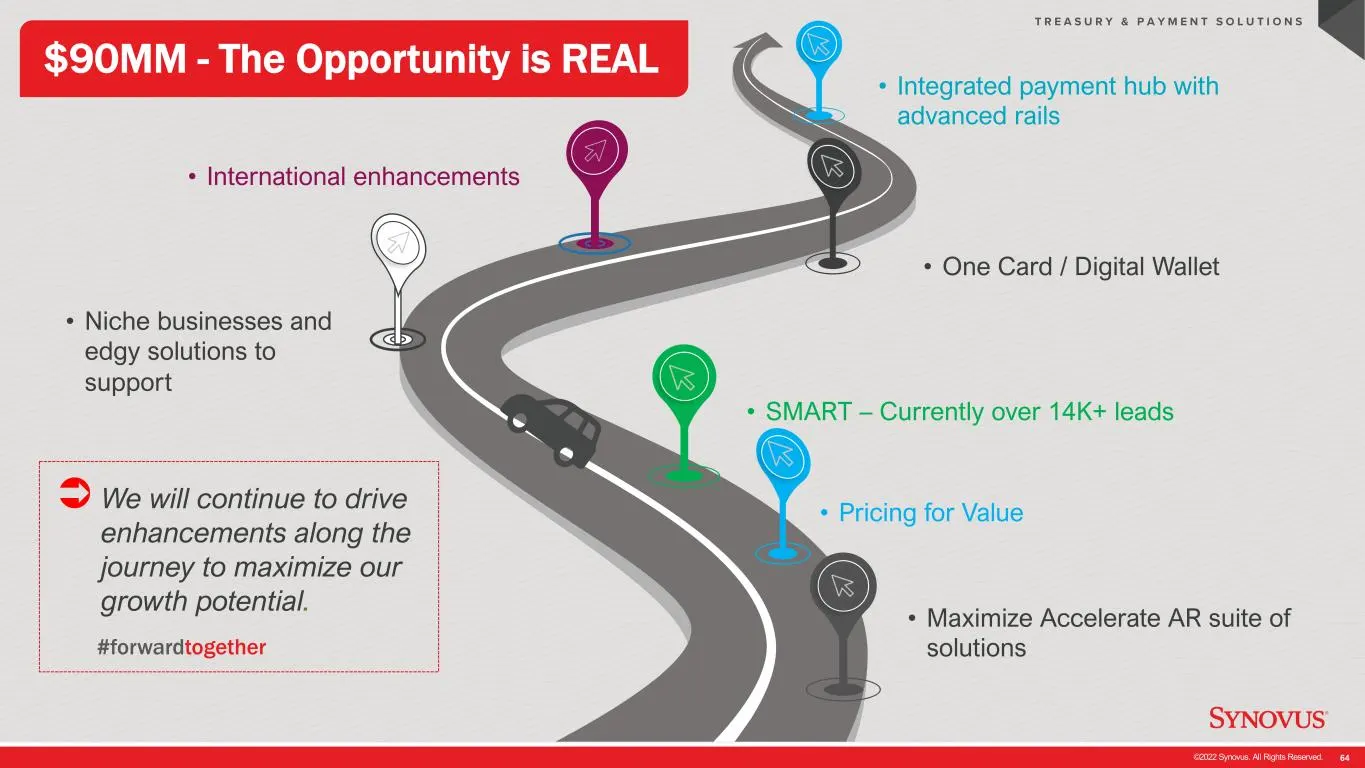
Slide 64: $90MM - The Opportunity is REAL
©2022 Synovus. All Rights Reserved. 64 T R E A S U R Y & P A Y M E N T S O L U T I O N S $90MM - The Opportunity is REAL Ü We will continue to drive enhancements along the journey to maximize our growth potential. • Maximize Accelerate AR suite of solutions • SMART – Currently over 14K+ leads • Inte

Slide 65: Credit
©2022 Synovus. All Rights Reserved. 65 Credit Bob Derrick EVP, Chief Credit Officer
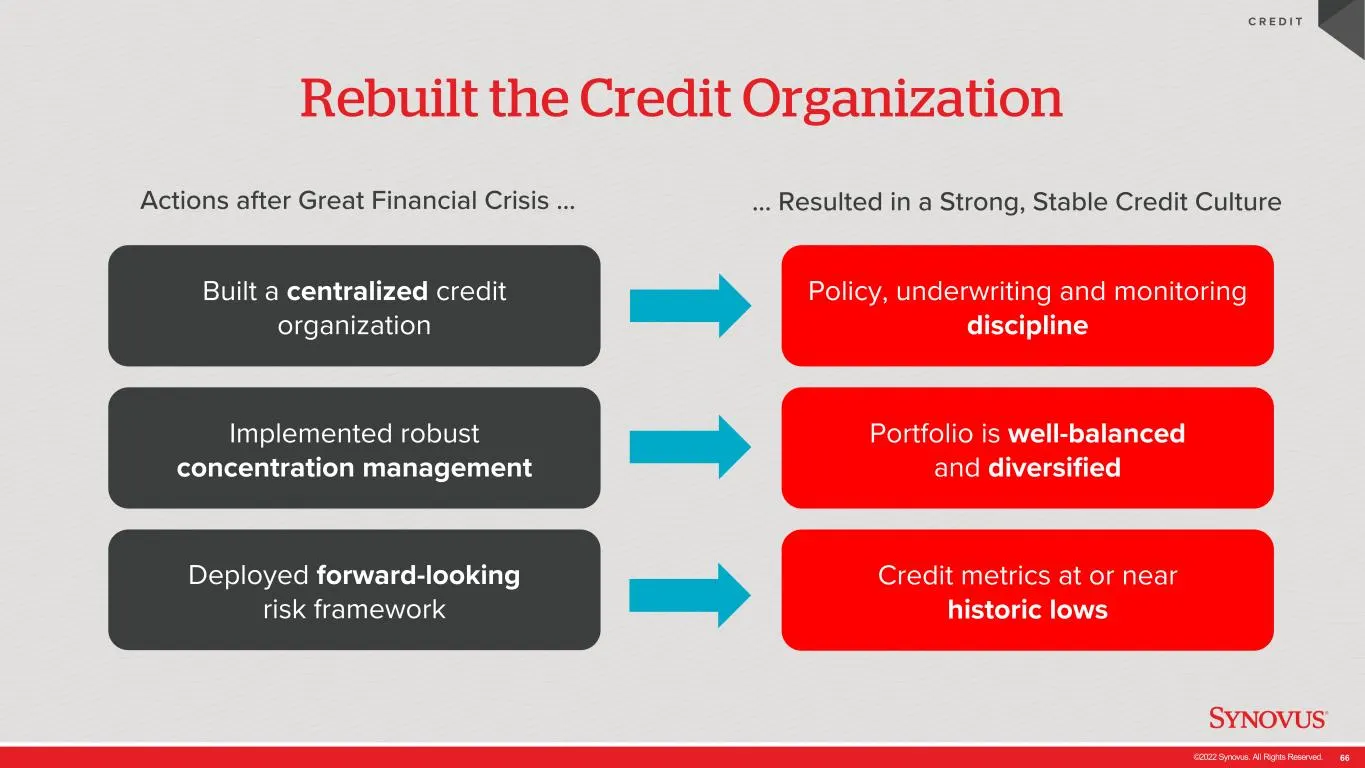
Slide 66: Rebuilt the Credit Organization
©2022 Synovus. All Rights Reserved. 66 Rebuilt the Credit Organization C R E D I T Actions after Great Financial Crisis … Deployed forward-looking risk framework Built a centralized credit organization Implemented robust concentration management … Resulted in a Strong, Stable Credit Culture Credit m
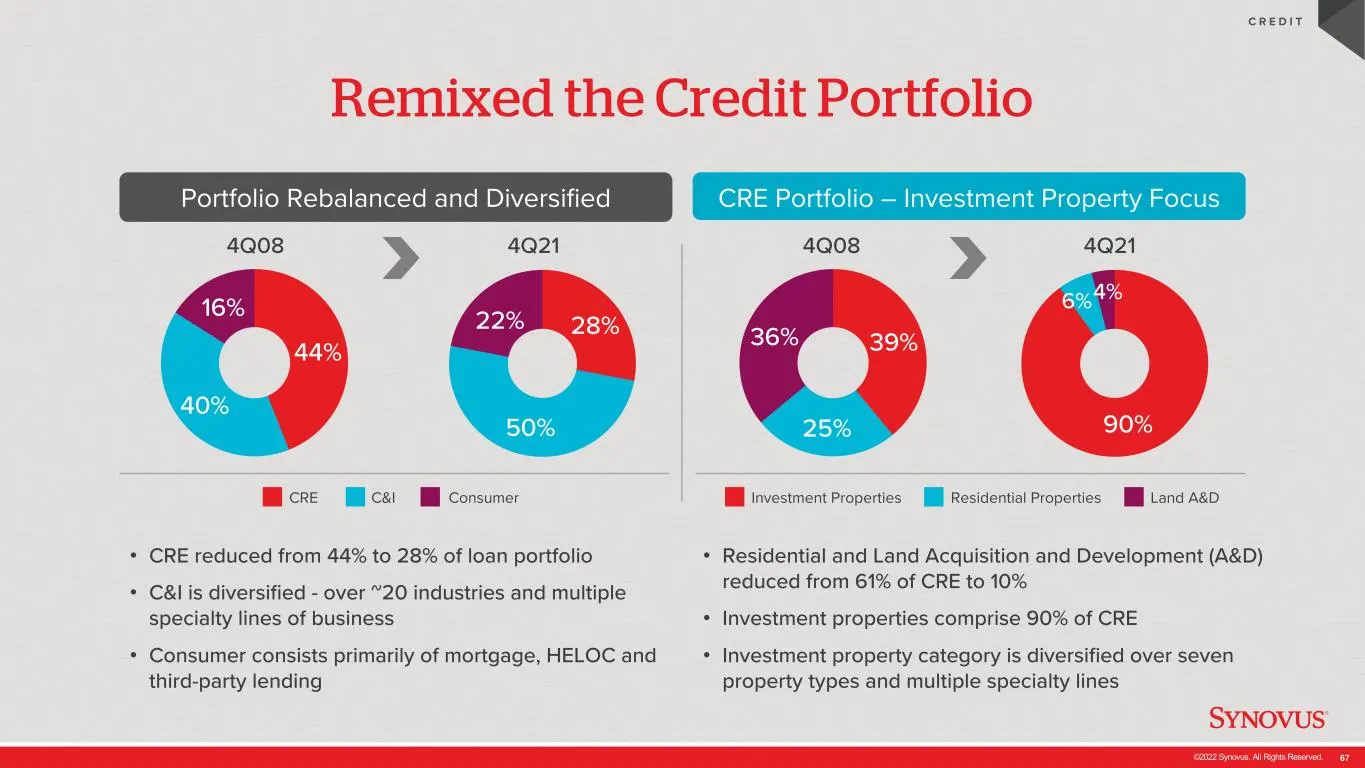
Slide 67: Remixed the Credit Portfolio
©2022 Synovus. All Rights Reserved. 67 4Q08 4Q21 4Q08 4Q21 Remixed the Credit Portfolio C R E D I T 44% 40% 16% 28% 50% 22% Portfolio Rebalanced and Diversified CRE Portfolio – Investment Property Focus • CRE reduced from 44% to 28% of loan portfolio • C&I is diversified - over ~20 industries and mu
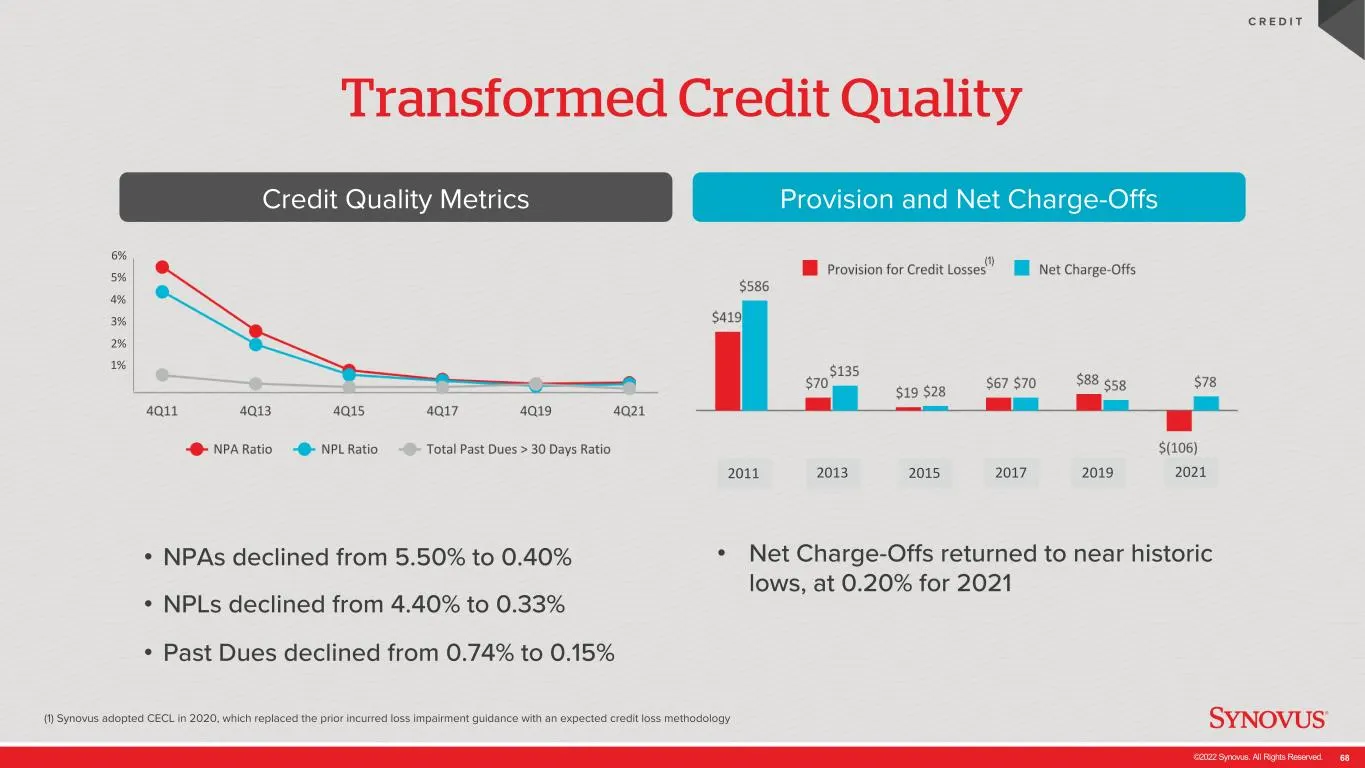
Slide 68: Transformed Credit Quality
©2022 Synovus. All Rights Reserved. 68 Transformed Credit Quality C R E D I T Credit Quality Metrics • NPAs declined from 5.50% to 0.40% • NPLs declined from 4.40% to 0.33% • Past Dues declined from 0.74% to 0.15% • Net Charge-Offs returned to near historic lows, at 0.20% for 2021 Provision and Net
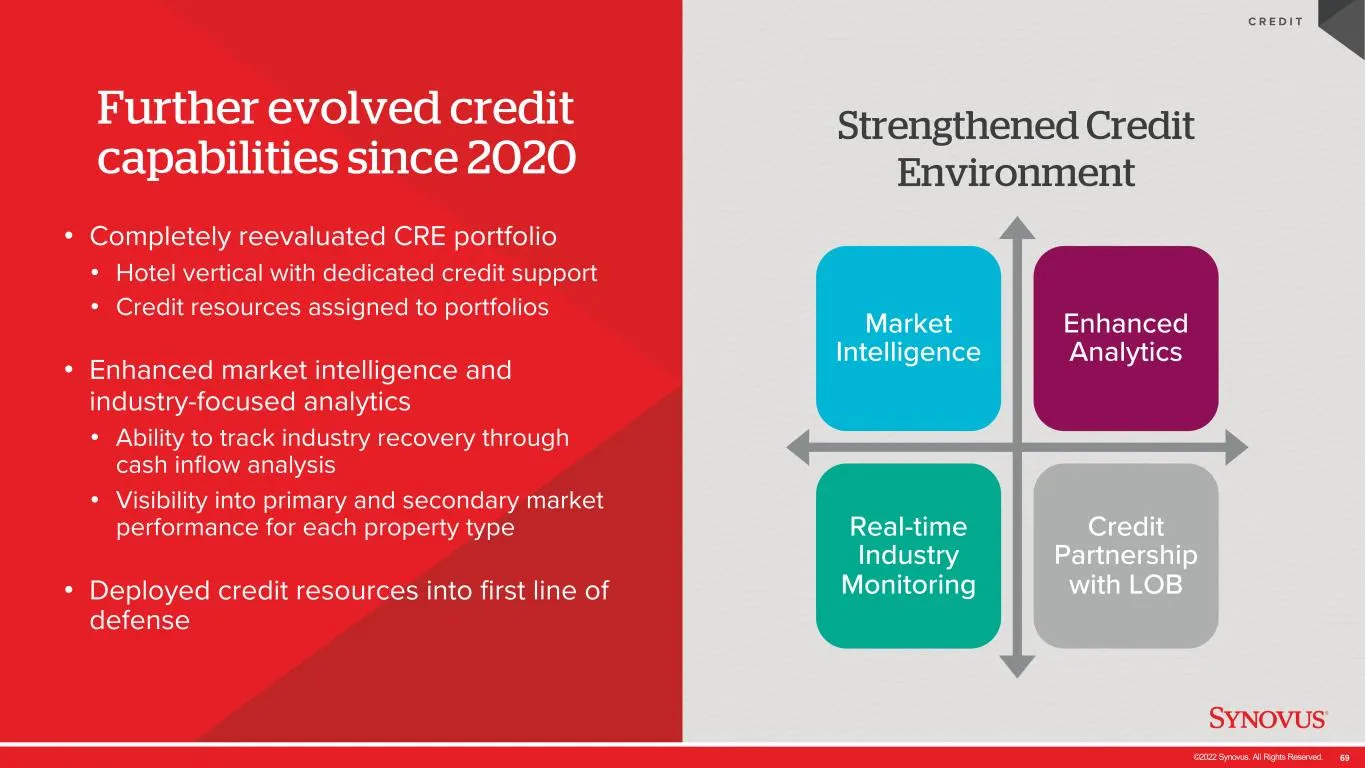
Slide 69: Further evolved credit capabilities since 2020
©2022 Synovus. All Rights Reserved. 69 Further evolved credit capabilities since 2020 • Completely reevaluated CRE portfolio • Hotel vertical with dedicated credit support • Credit resources assigned to portfolios • Enhanced market intelligence and industry-focused analytics • Ability to track indus
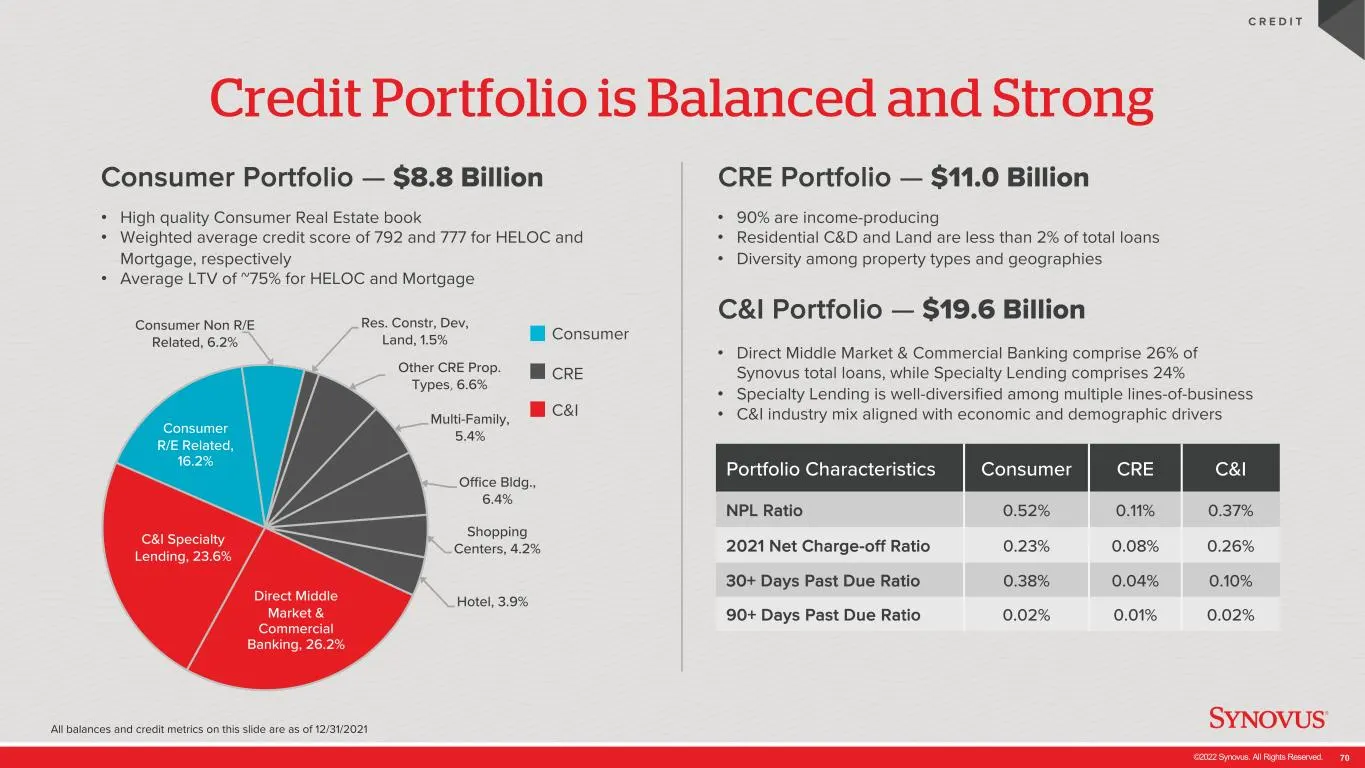
Slide 70: Credit Portfolio is Balanced and Strong
©2022 Synovus. All Rights Reserved. 70 • High quality Consumer Real Estate book • Weighted average credit score of 792 and 777 for HELOC and Mortgage, respectively • Average LTV of ~75% for HELOC and Mortgage CRE Portfolio — $11.0 Billion Portfolio Characteristics Consumer CRE C&I NPL Ratio 0.52% 0.
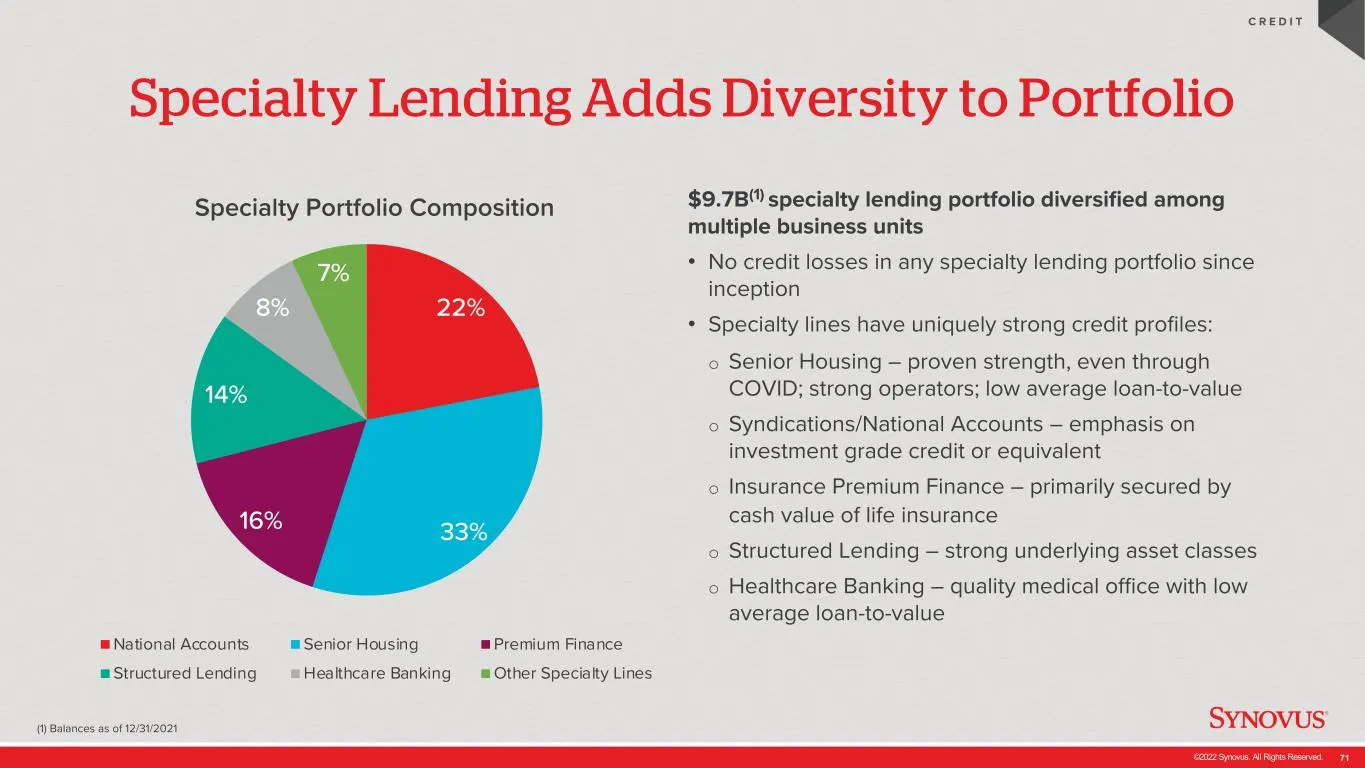
Slide 71: Specialty Lending Adds Diversity to Portfolio
©2022 Synovus. All Rights Reserved. 71 Specialty Lending Adds Diversity to Portfolio (1) Balances as of 12/31/2021 C R E D I T Specialty Portfolio Composition $9.7B(1) specialty lending portfolio diversified among multiple business units • No credit losses in any specialty lending portfolio since in
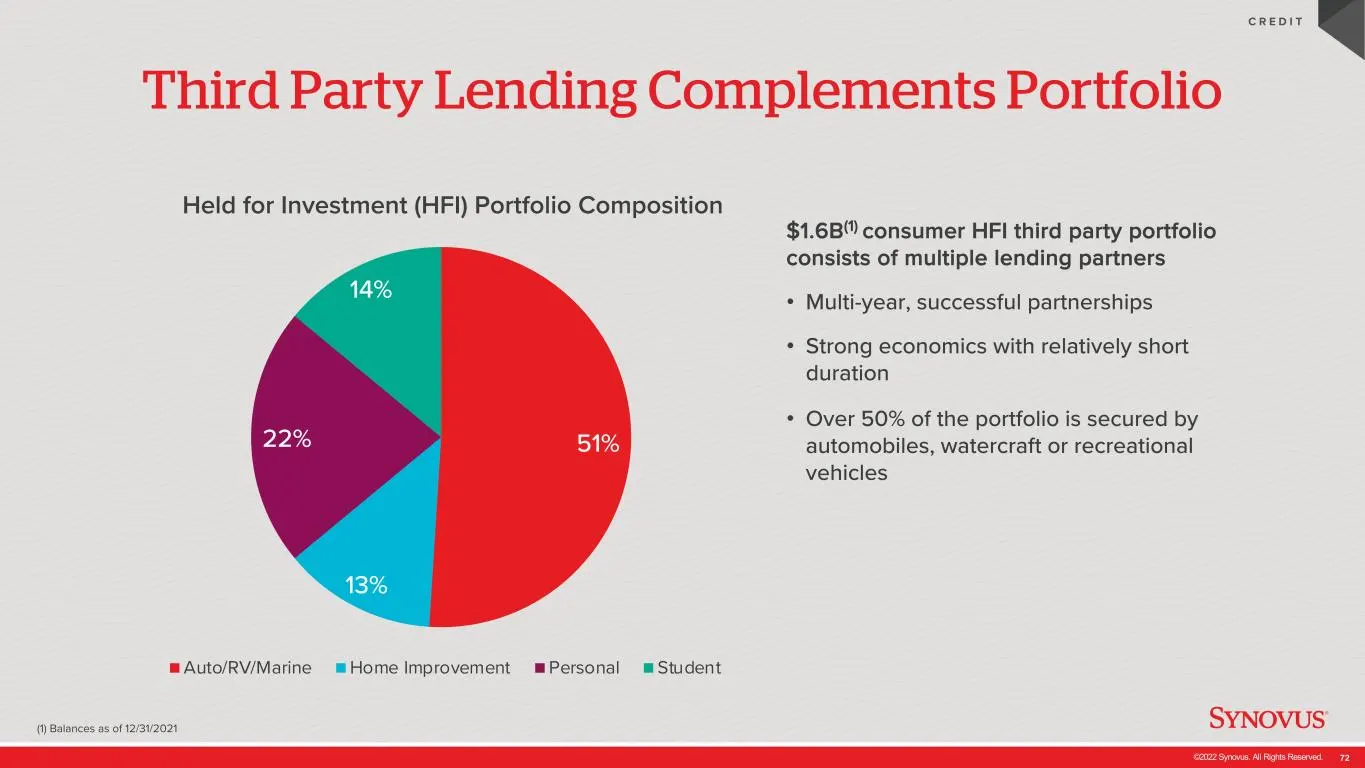
Slide 72: Third Party Lending Complements Portfolio
©2022 Synovus. All Rights Reserved. 72 C R E D I T Third Party Lending Complements Portfolio $1.6B(1) consumer HFI third party portfolio consists of multiple lending partners • Multi-year, successful partnerships • Strong economics with relatively short duration • Over 50% of the portfolio is secure
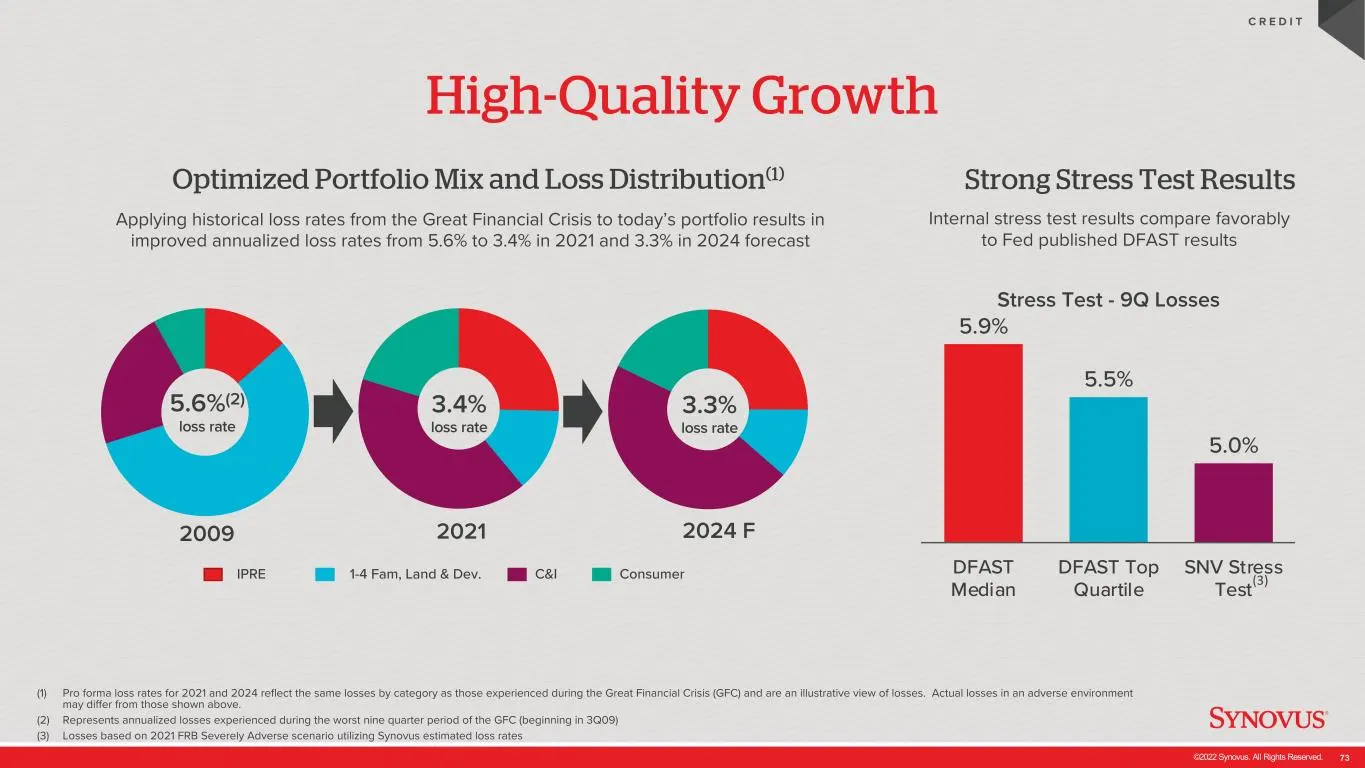
Slide 73: Optimized Portfolio Mix and Loss Distribution
©2022 Synovus. All Rights Reserved. 73 (1) Pro forma loss rates for 2021 and 2024 reflect the same losses by category as those experienced during the Great Financial Crisis (GFC) and are an illustrative view of losses. Actual losses in an adverse environment may differ from those shown above. (2) Re
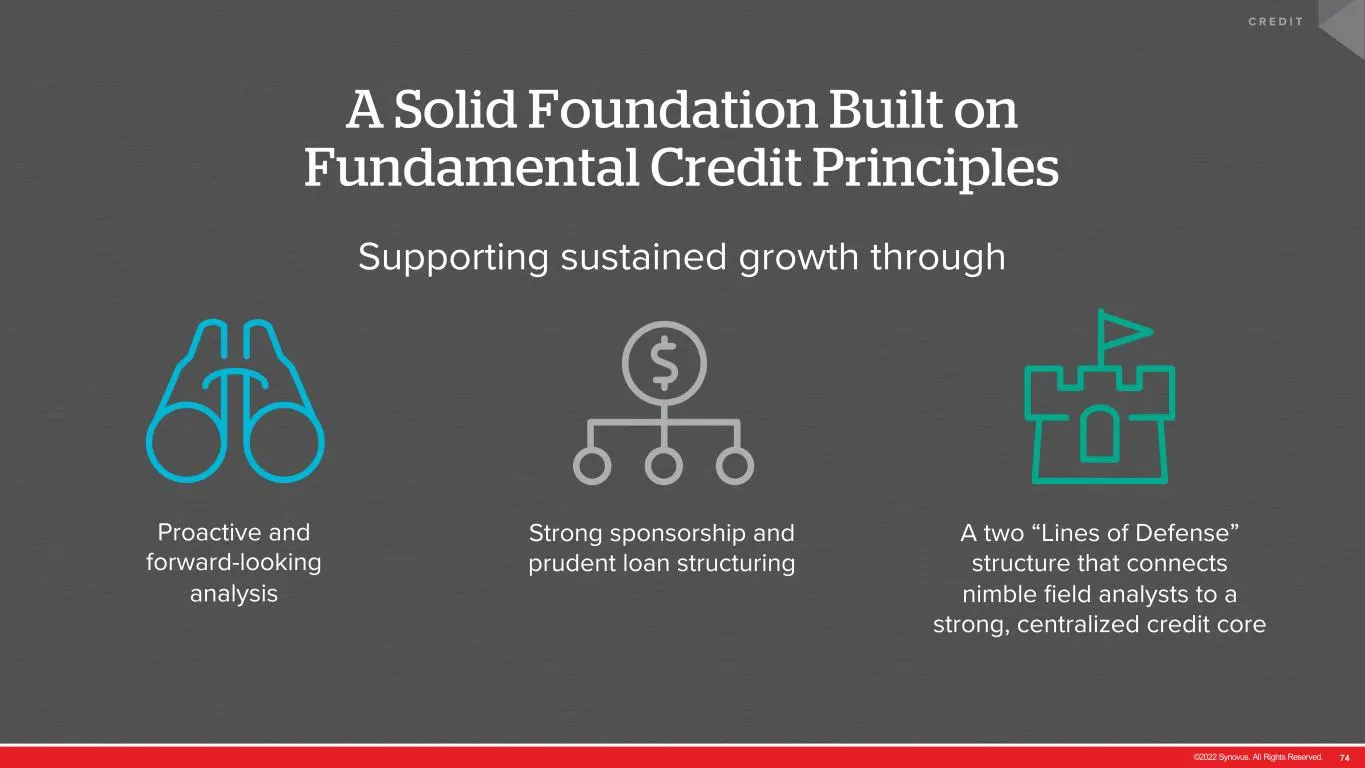
Slide 74: A Solid Foundation Built on Fundamental Credit Principles
©2022 Synovus. All Rights Reserved. 74 A Solid Foundation Built on Fundamental Credit Principles Supporting sustained growth through C R E D I T Proactive and forward-looking analysis A two “Lines of Defense” structure that connects nimble field analysts to a strong, centralized credit core Strong s
Slide 75: The Consumer Bank
©2022 Synovus. All Rights Reserved. 75 The Consumer Bank Liz Wolverton EVP, Head of Consumer Banking and Brand Experience
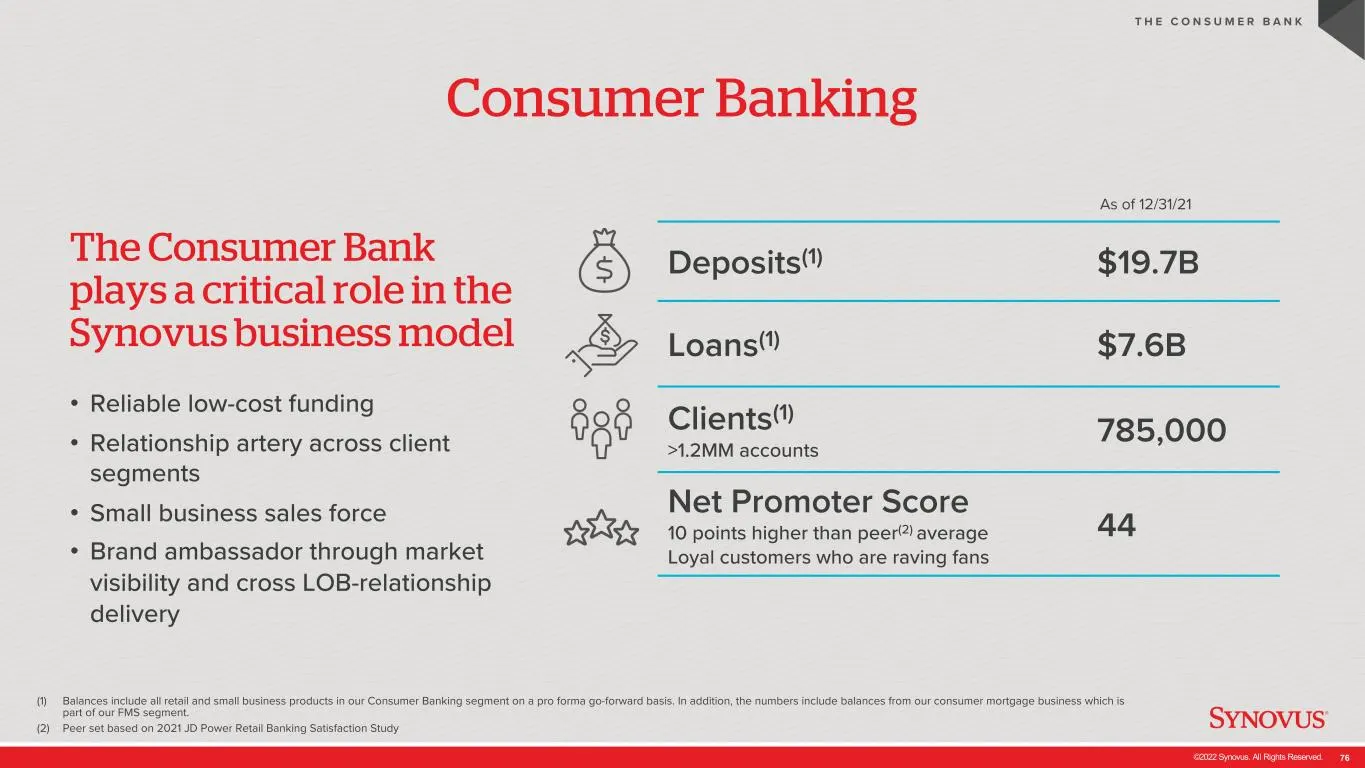
Slide 76: Consumer Banking
©2022 Synovus. All Rights Reserved. 76 Consumer Banking (1) Balances include all retail and small business products in our Consumer Banking segment on a pro forma go-forward basis. In addition, the numbers include balances from our consumer mortgage business which is part of our FMS segment. (2) Pee
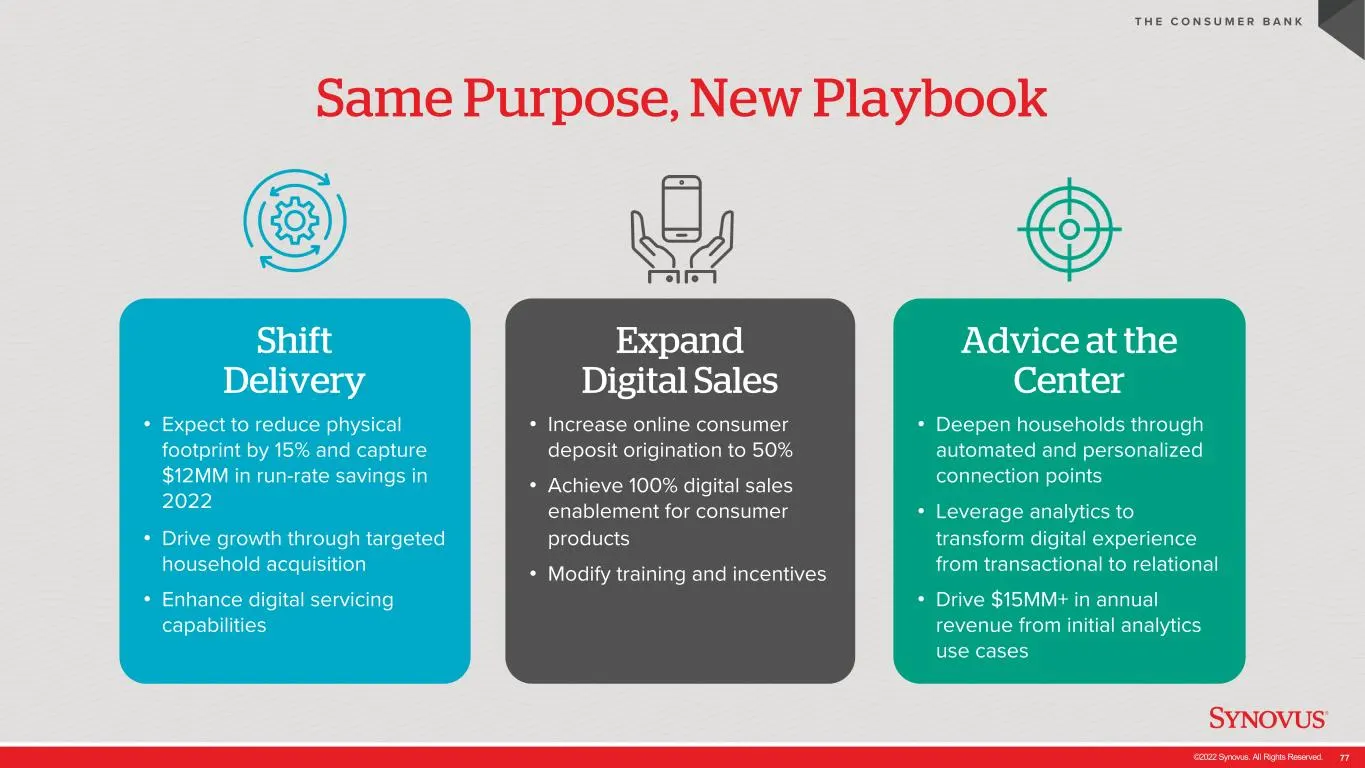
Slide 77: Same Purpose, New Playbook
©2022 Synovus. All Rights Reserved. 77 Same Purpose, New Playbook T H E C O N S U M E R B A N K Shift Delivery • Expect to reduce physical footprint by 15% and capture $12MM in run-rate savings in 2022 • Drive growth through targeted household acquisition • Enhance digital servicing capabilities Exp
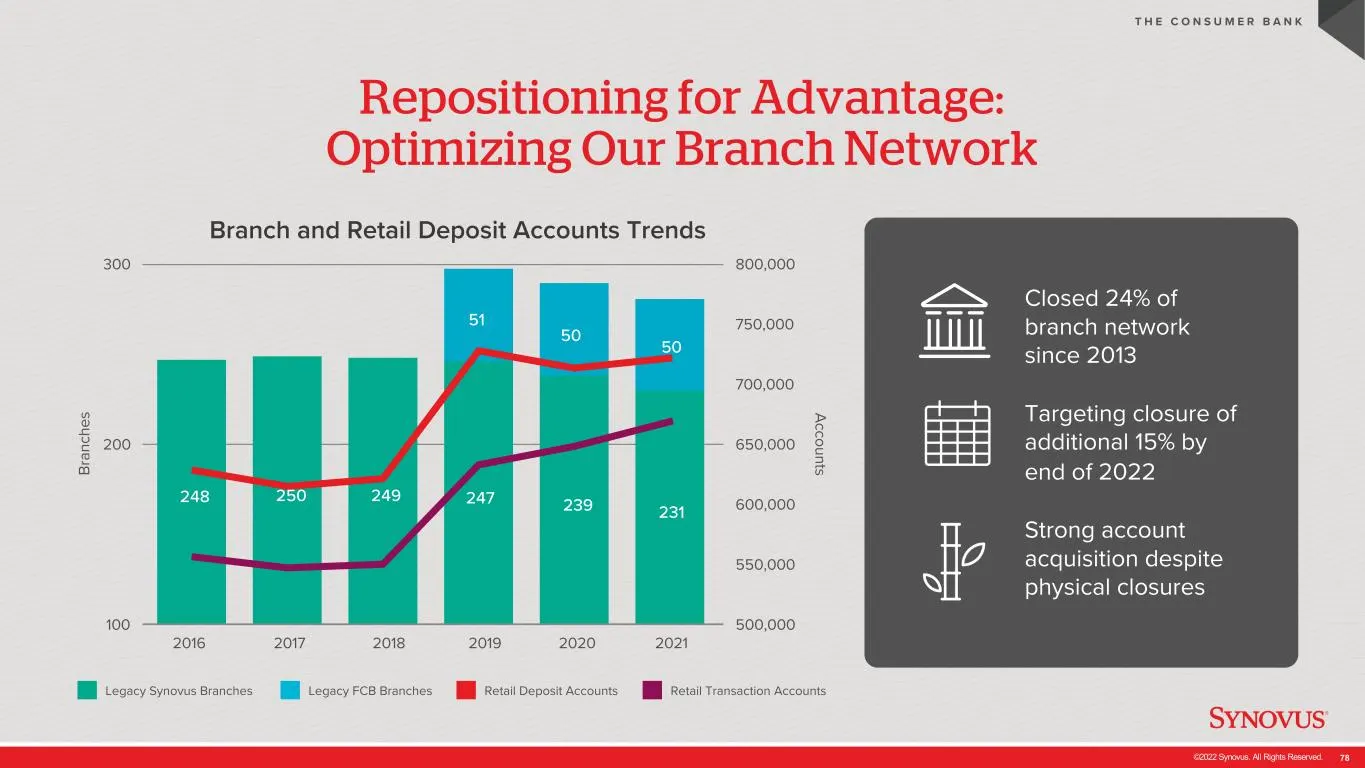
Slide 78: Optimizing Our Branch Network
©2022 Synovus. All Rights Reserved. 78 Repositioning for Advantage: Optimizing Our Branch Network T H E C O N S U M E R B A N K 2016 2017 2018 2019 2020 2021 800,000 750,000 700,000 650,000 600,000 550,000 500,000 Branch and Retail Deposit Accounts Trends 300 200 100 Legacy Synovus Branches Legacy F
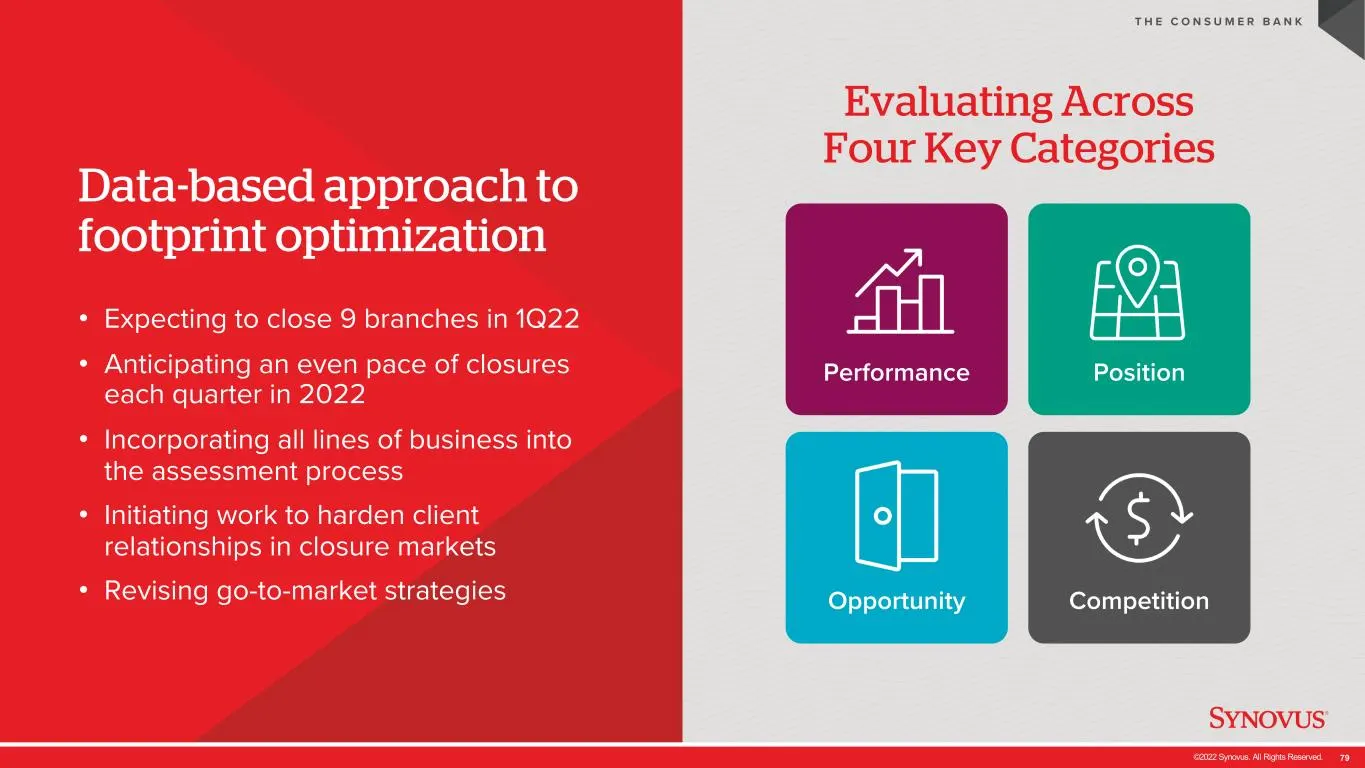
Slide 79: Data-based approach to footprint optimization
©2022 Synovus. All Rights Reserved. 79 Data-based approach to footprint optimization • Expecting to close 9 branches in 1Q22 • Anticipating an even pace of closures each quarter in 2022 • Incorporating all lines of business into the assessment process • Initiating work to harden client relationships
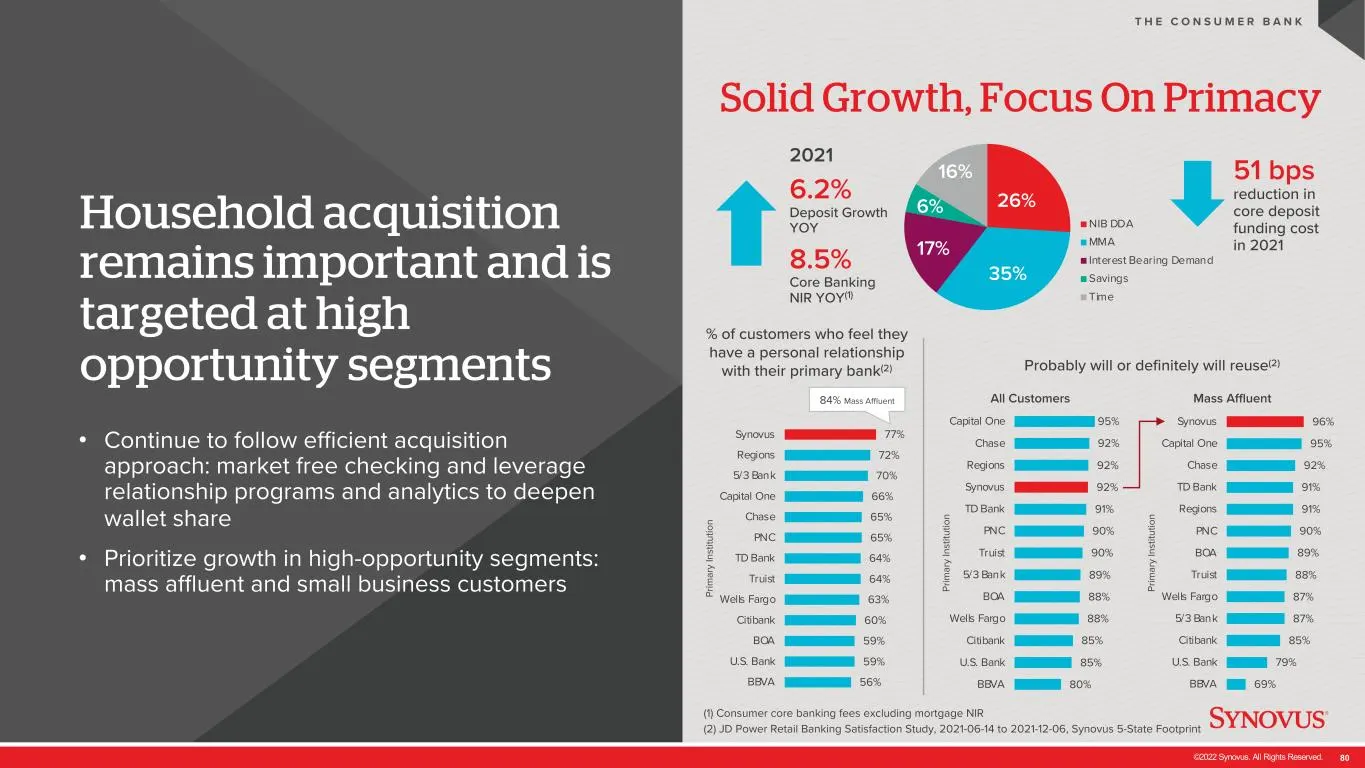
Slide 80: Solid Growth, Focus On Primacy
©2022 Synovus. All Rights Reserved. 80 69% 79% 85% 87% 87% 88% 89% 90% 91% 91% 92% 95% 96% BBVA U.S. Bank Citibank 5/3 Bank Wells Fargo Truist BOA PNC Regions TD Bank Chase Capital One Synovus Pr im ar y In st itu tio n Household acquisition remains important and is targeted at high opportunity segm
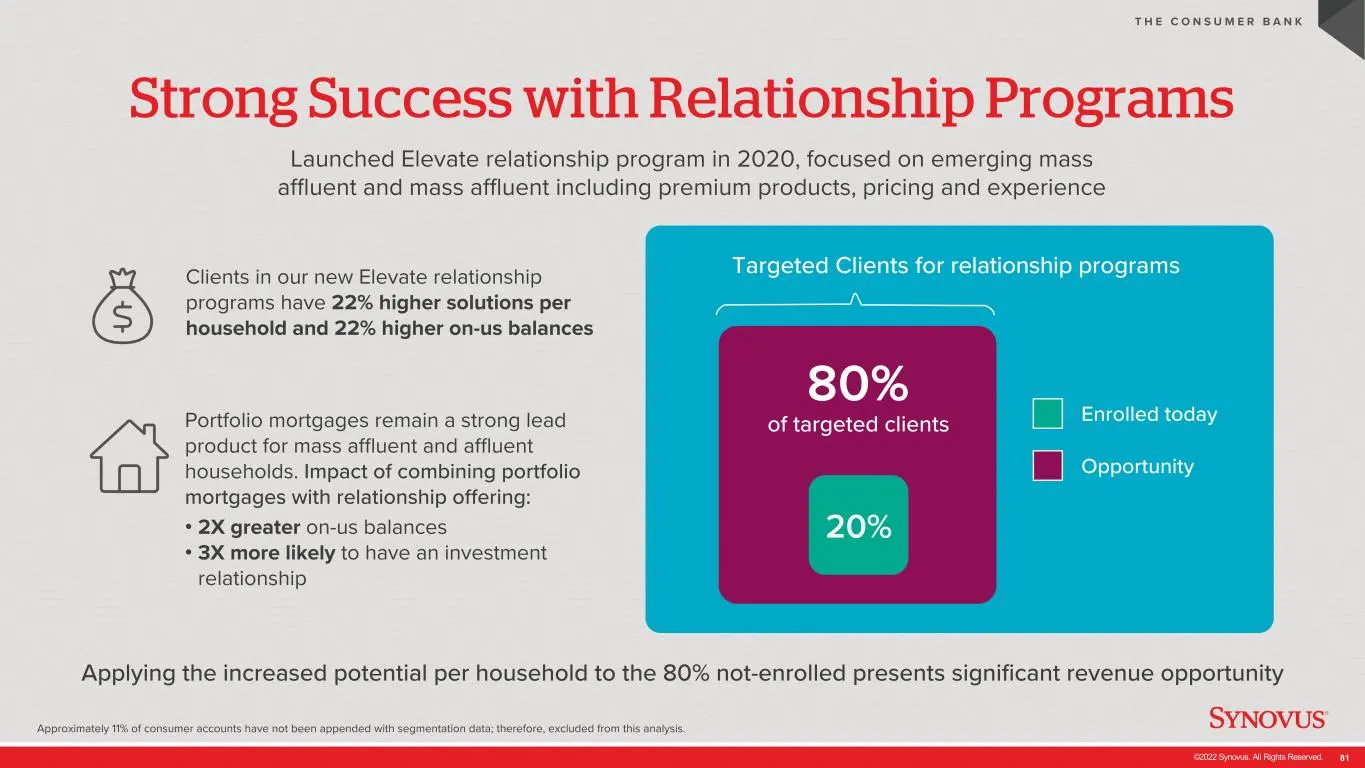
Slide 81: Strong Success with Relationship Programs
©2022 Synovus. All Rights Reserved. 81 20% 80% of targeted clients Strong Success with Relationship Programs Approximately 11% of consumer accounts have not been appended with segmentation data; therefore, excluded from this analysis. T H E C O N S U M E R B A N K Applying the increased potential pe
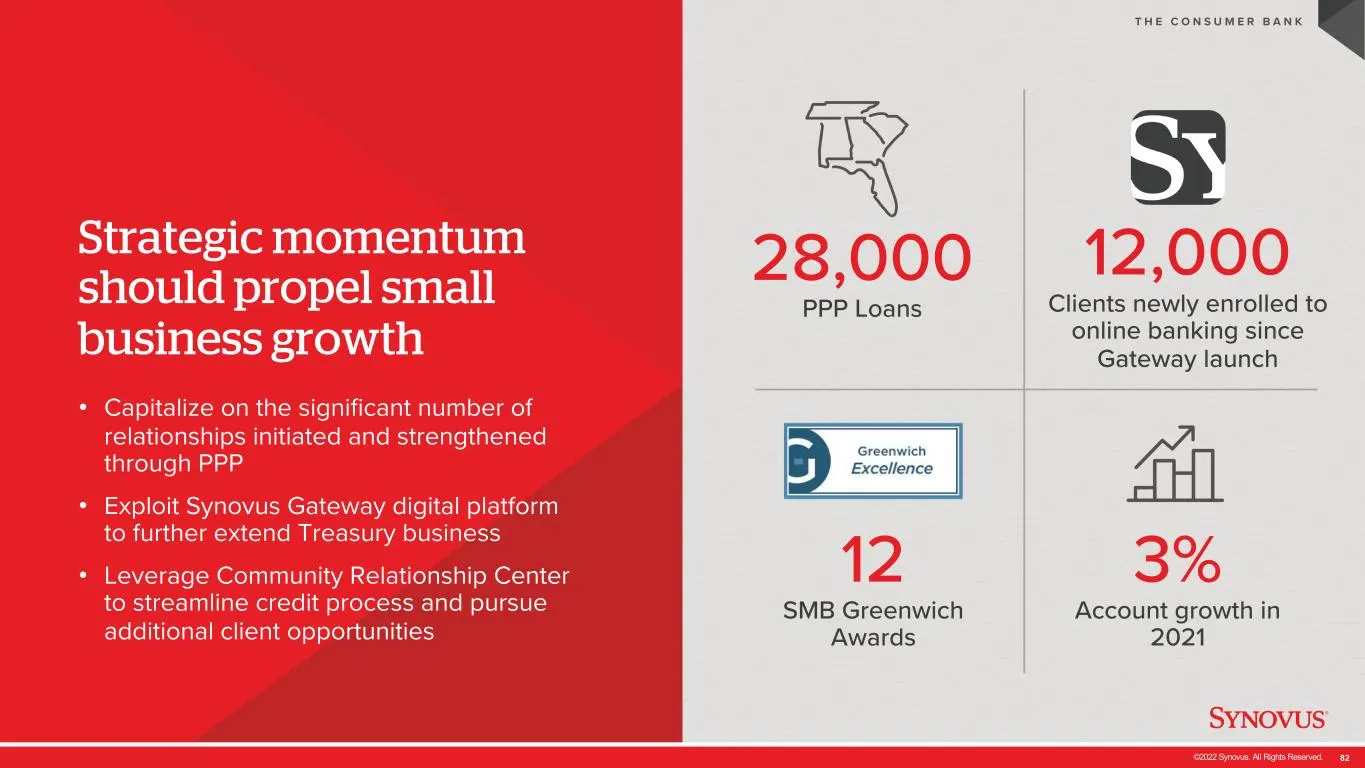
Slide 82: Strategic momentum should propel small business growth
©2022 Synovus. All Rights Reserved. 82 Strategic momentum should propel small business growth • Capitalize on the significant number of relationships initiated and strengthened through PPP • Exploit Synovus Gateway digital platform to further extend Treasury business • Leverage Community Relationshi
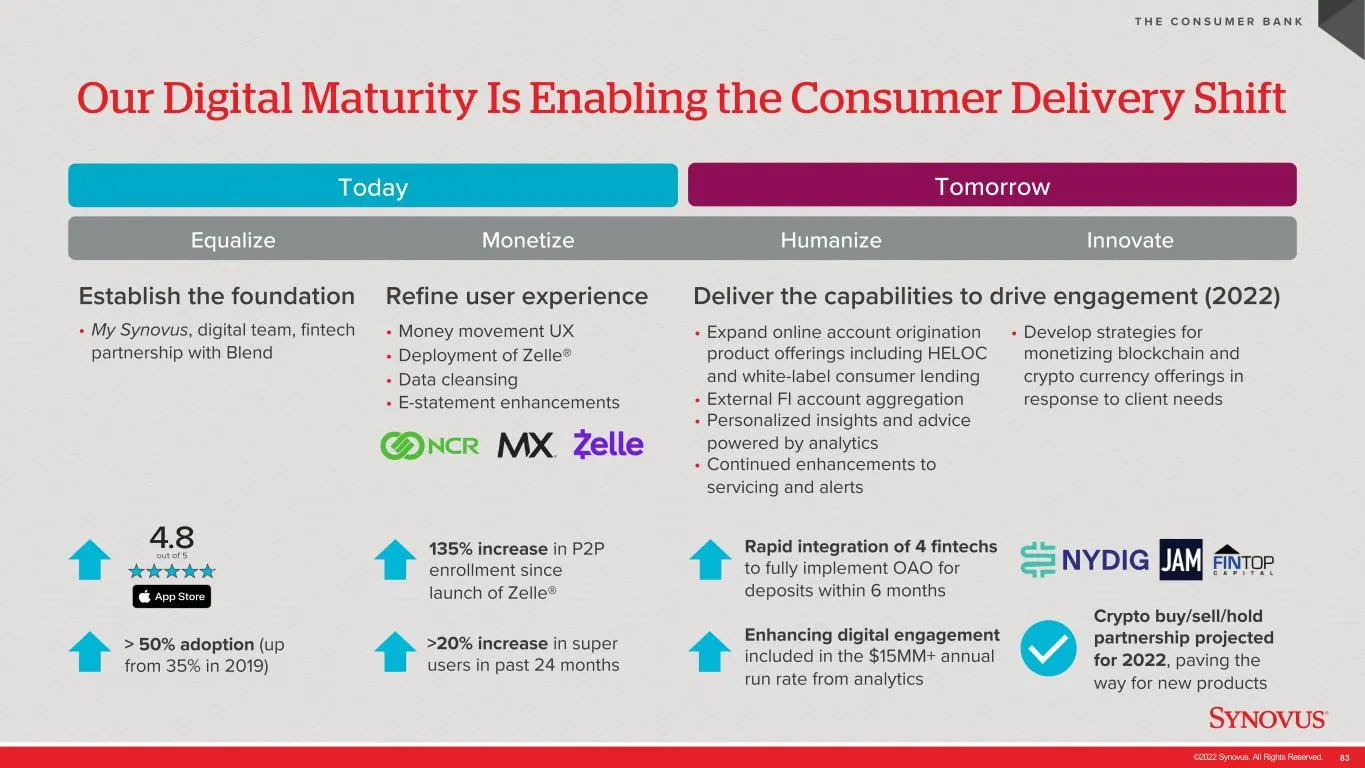
Slide 83: Our Digital Maturity Is Enabling the Consumer Delivery Shift
©2022 Synovus. All Rights Reserved. 83 Our Digital Maturity Is Enabling the Consumer Delivery Shift T H E C O N S U M E R B A N K Today Tomorrow Equalize Monetize Humanize Innovate Establish the foundation • My Synovus, digital team, fintech partnership with Blend Refine user experience • Money move
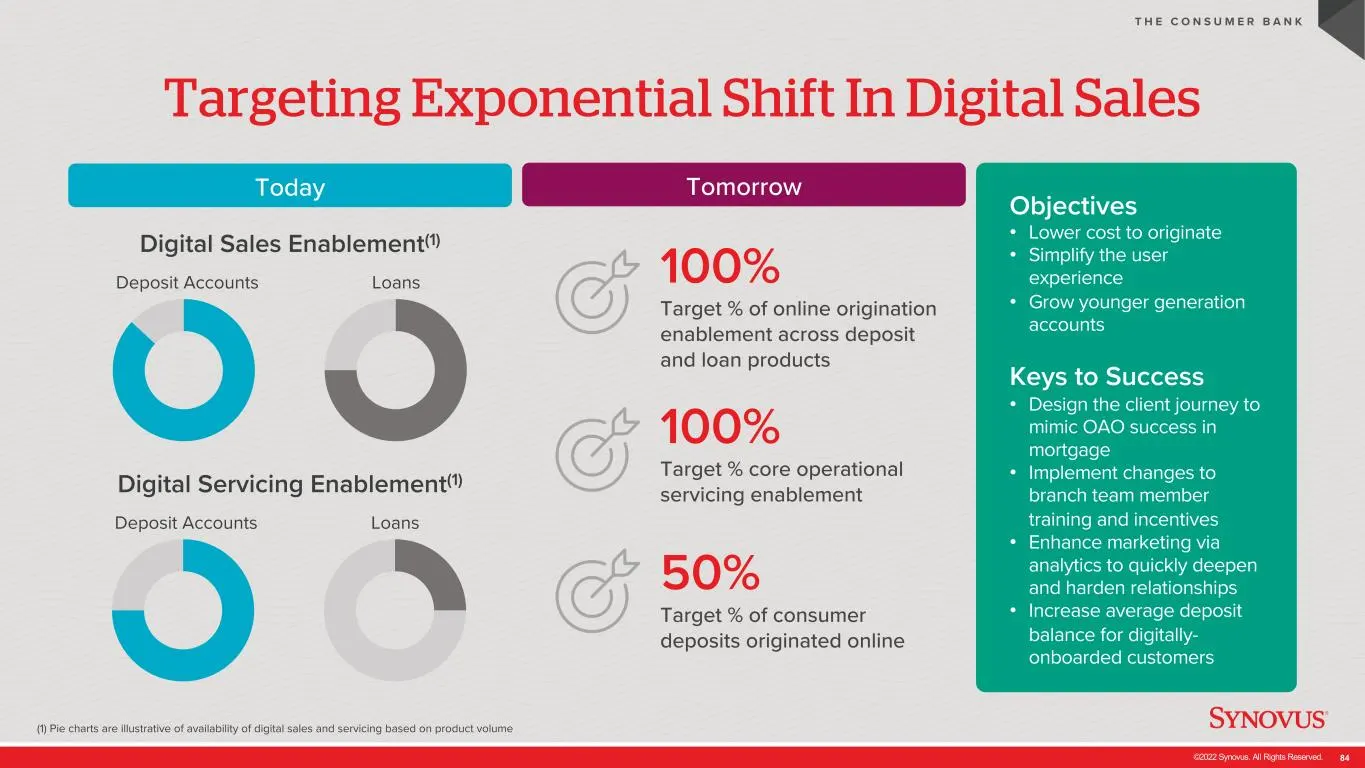
Slide 84: Targeting Exponential Shift In Digital Sales
©2022 Synovus. All Rights Reserved. 84 Targeting Exponential Shift In Digital Sales (1) Pie charts are illustrative of availability of digital sales and servicing based on product volume T H E C O N S U M E R B A N K 50% Target % of consumer deposits originated online Digital Sales Enablement(1) 100
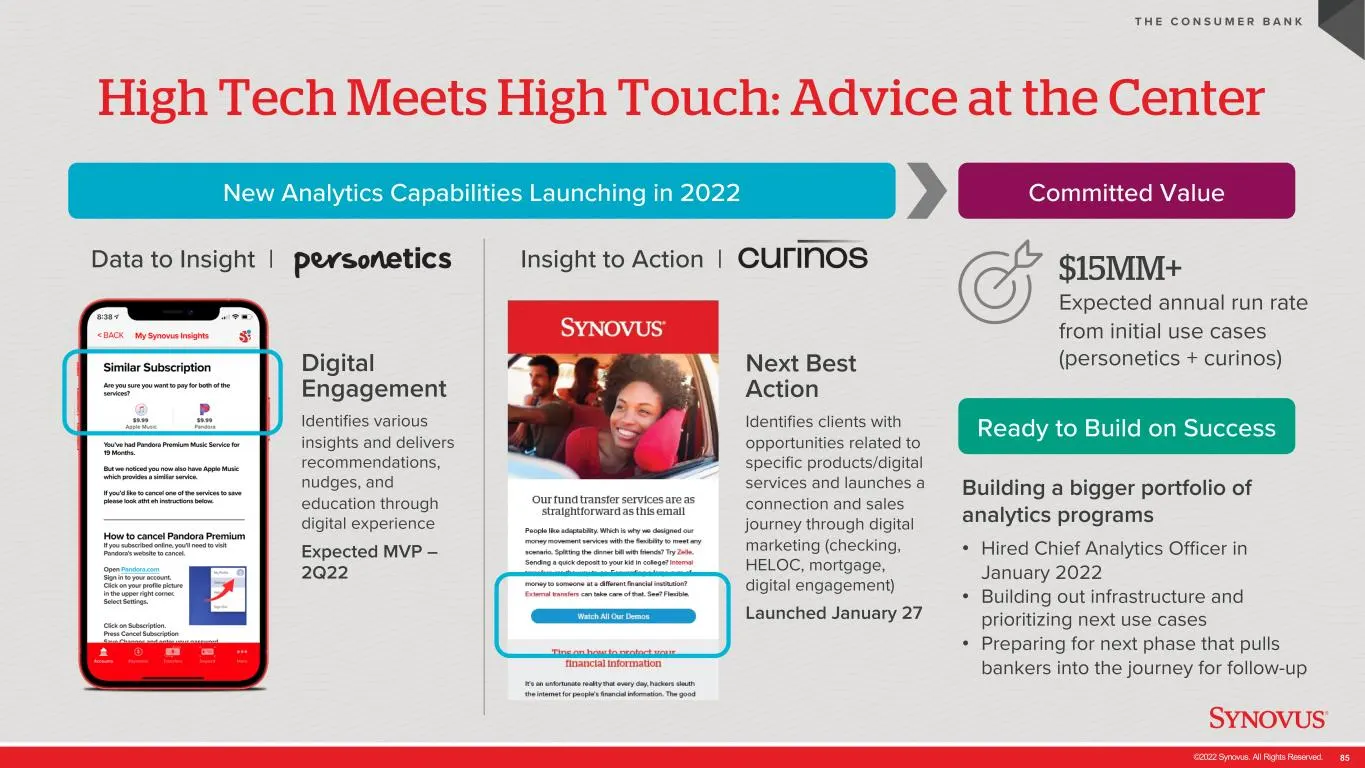
Slide 85: High Tech Meets High Touch: Advice at the Center
©2022 Synovus. All Rights Reserved. 85 High Tech Meets High Touch: Advice at the Center T H E C O N S U M E R B A N K $15MM+ Expected annual run rate from initial use cases (personetics + curinos) Building a bigger portfolio of analytics programs • Hired Chief Analytics Officer in January 2022 • Bui
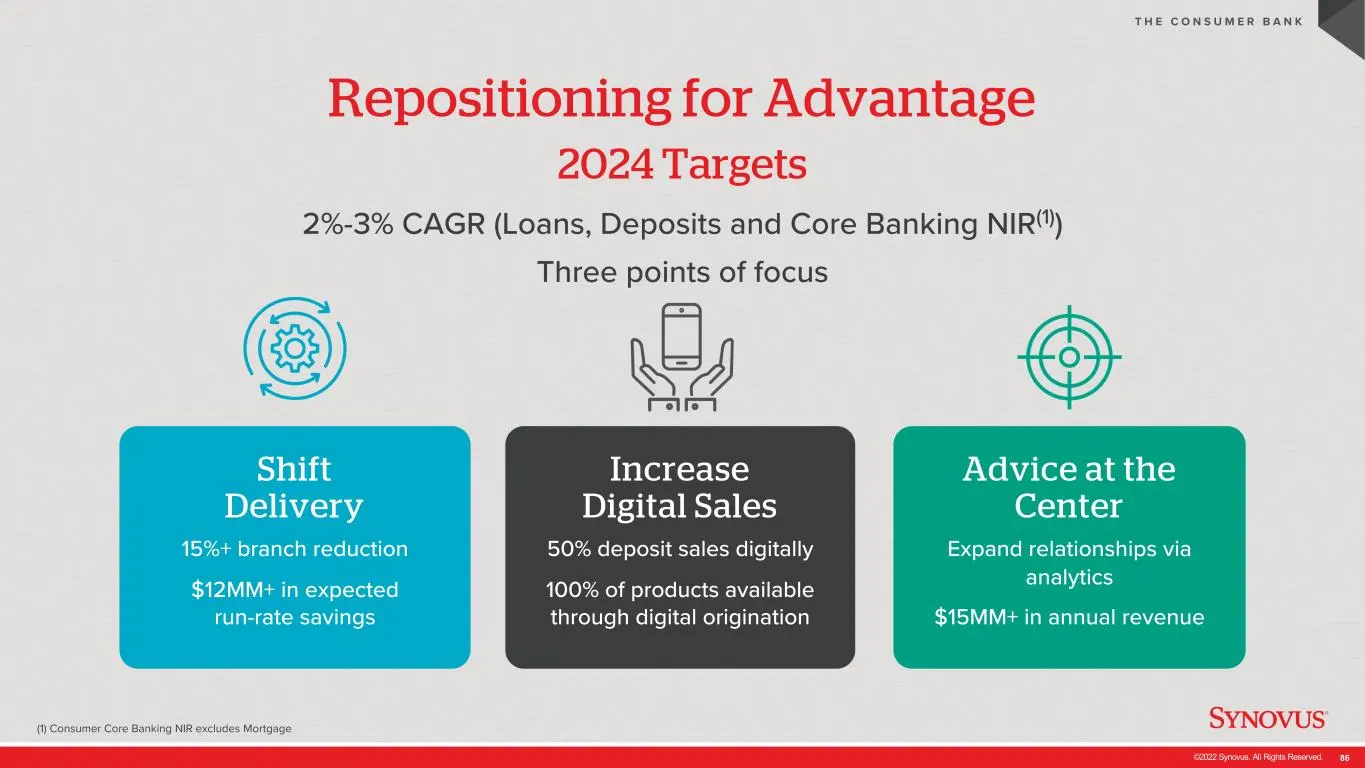
Slide 86: Repositioning for Advantage
©2022 Synovus. All Rights Reserved. 86 Repositioning for Advantage (1) Consumer Core Banking NIR excludes Mortgage T H E C O N S U M E R B A N K Shift Delivery 15%+ branch reduction $12MM+ in expected run-rate savings Increase Digital Sales 50% deposit sales digitally 100% of products available thro
Slide 87: Technology and Operations
©2022 Synovus. All Rights Reserved. 87 Technology and Operations Zack Bishop EVP, Head of Technology, Operations, and Security
Slide 88: Technology and Operations
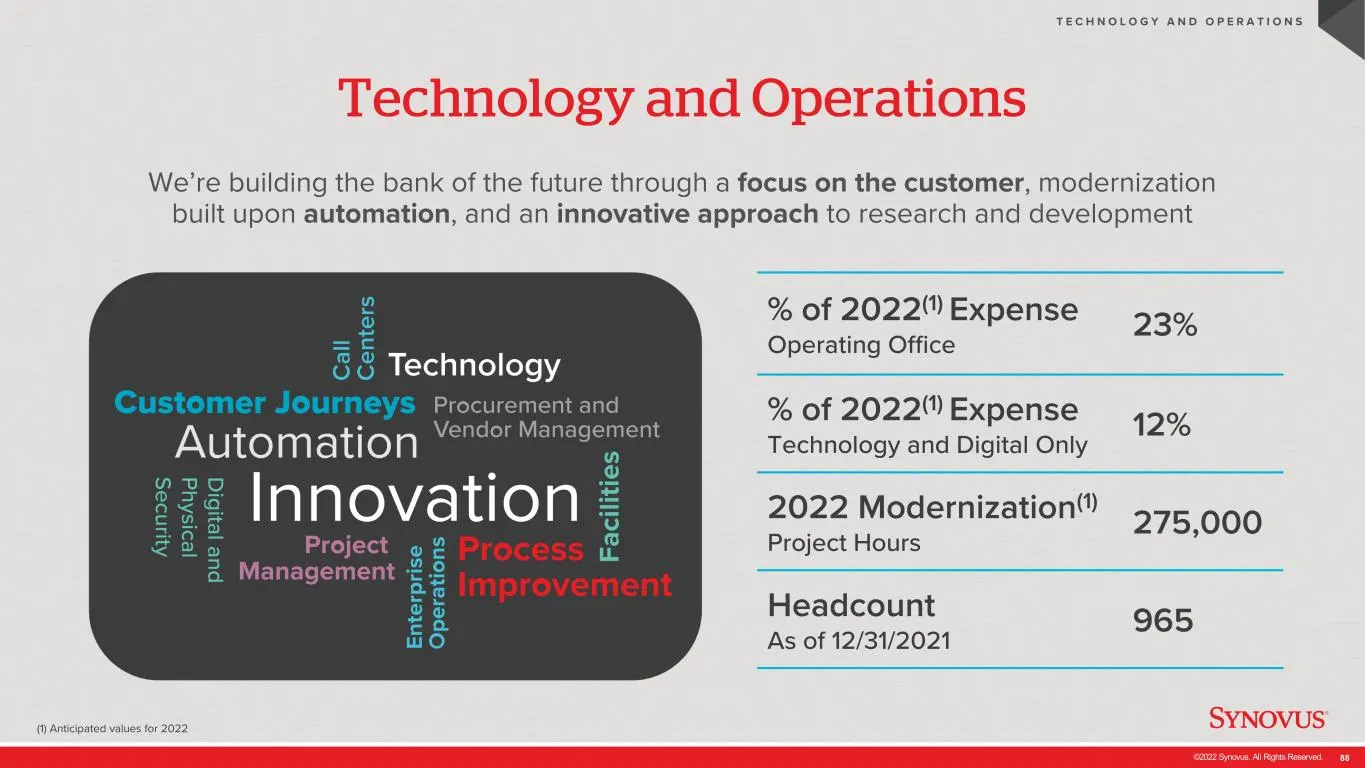
©2022 Synovus. All Rights Reserved. 88 Technology and Operations (1) Anticipated values for 2022 T E C H N O L O G Y A N D O P E R A T I O N S % of 2022(1) Expense Operating Office 23% % of 2022(1) Expense Technology and Digital Only 12% 2022 Modernization(1) Project Hours 275,000 Headcount As of 12
Slide 89: Building the Bank of the Future
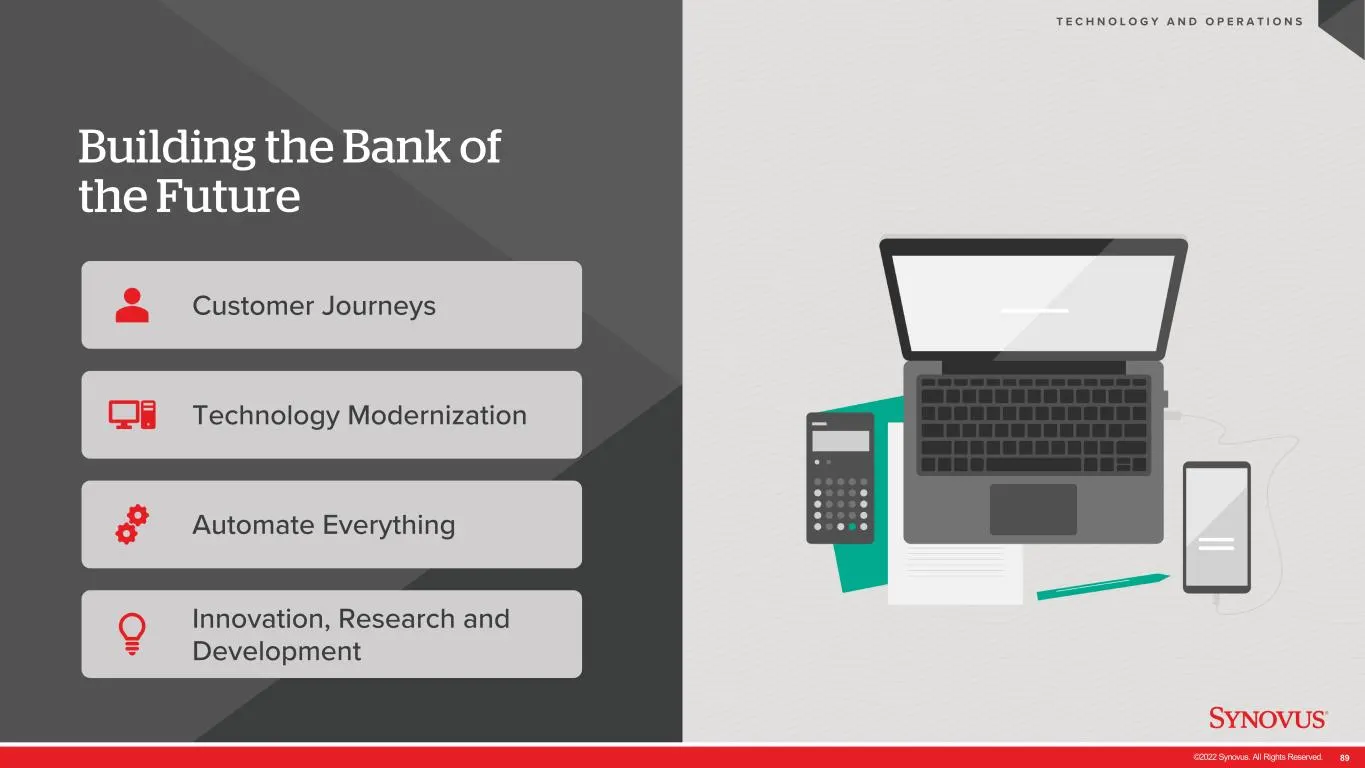
©2022 Synovus. All Rights Reserved. 89 Building the Bank of the Future Customer Journeys Technology Modernization Automate Everything Innovation, Research and Development T E C H N O L O G Y A N D O P E R A T I O N S
Slide 90: Customer Journeys
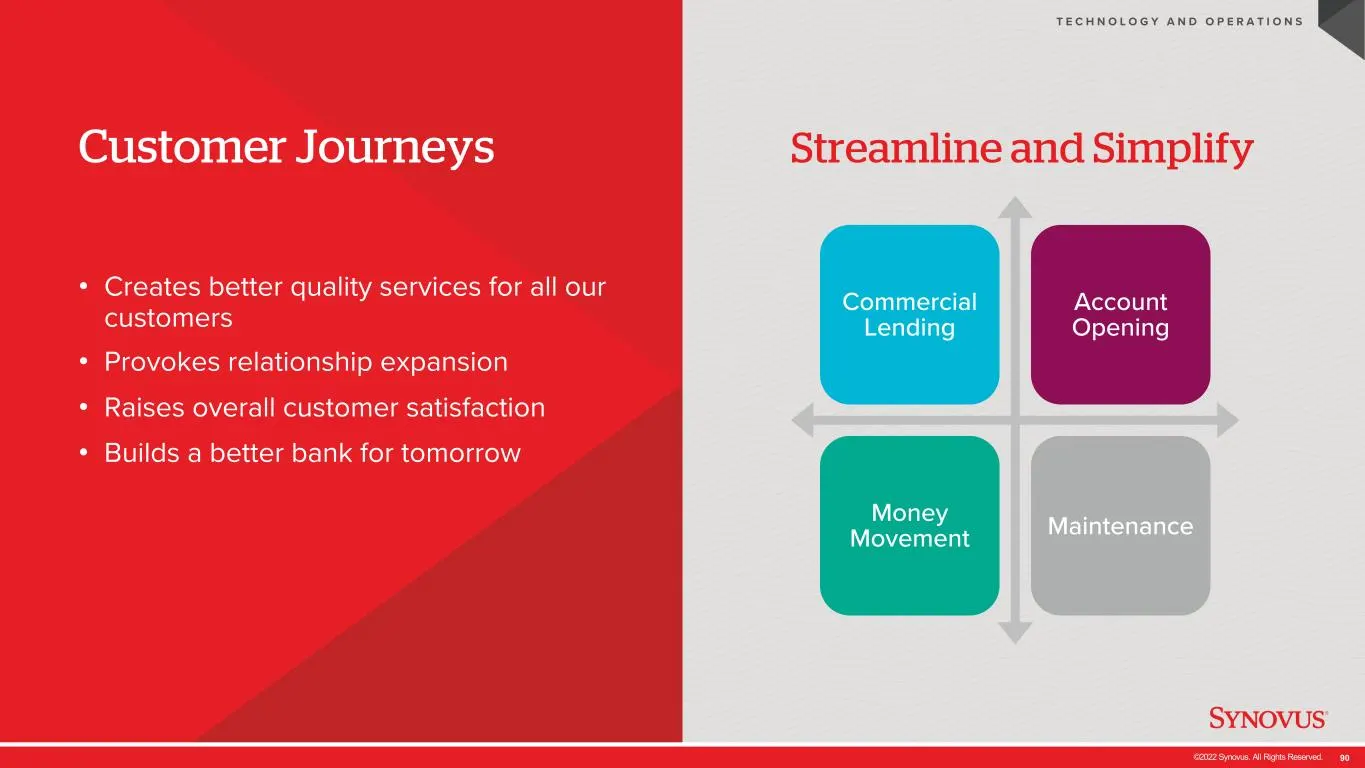
©2022 Synovus. All Rights Reserved. 90 Customer Journeys • Creates better quality services for all our customers • Provokes relationship expansion • Raises overall customer satisfaction • Builds a better bank for tomorrow T E C H N O L O G Y A N D O P E R A T I O N S Streamline and Simplify Commerci
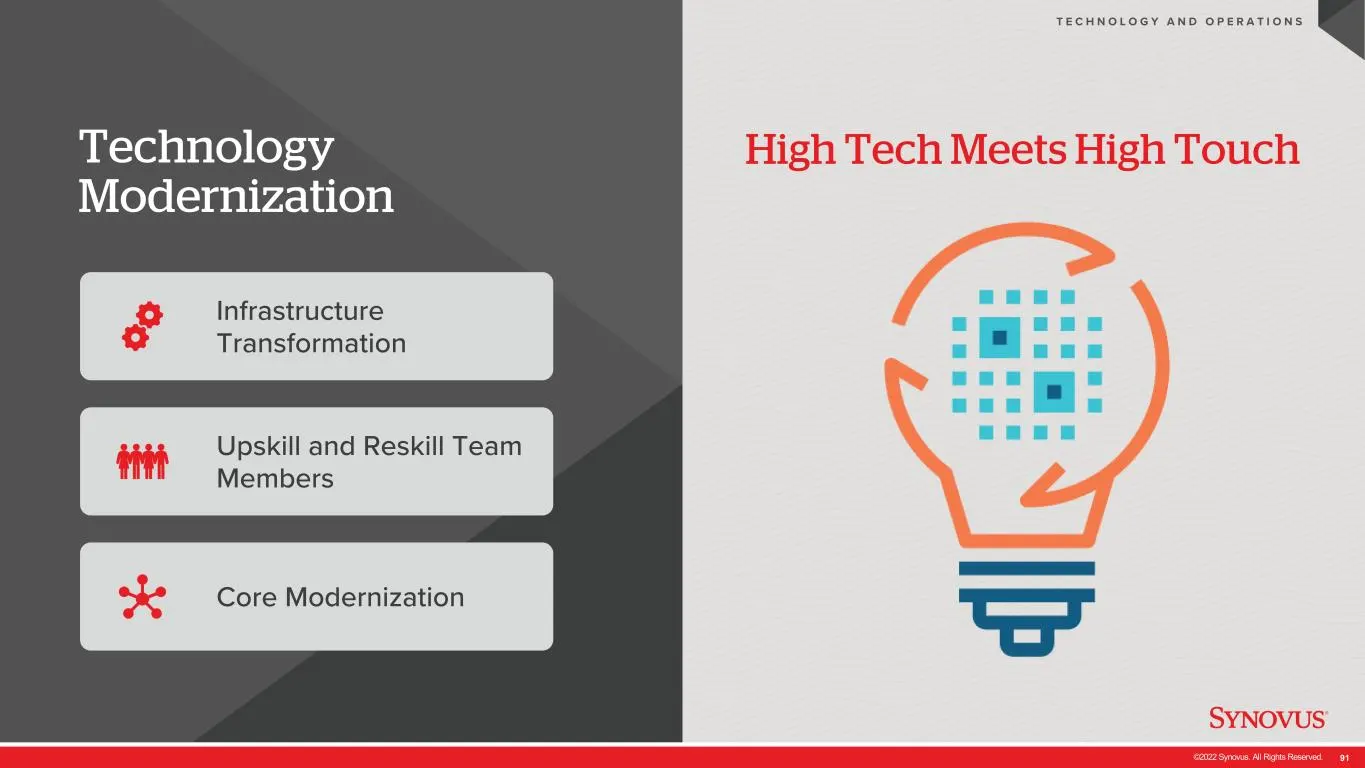
Slide 91: Technology Modernization
©2022 Synovus. All Rights Reserved. 91 Technology Modernization Infrastructure Transformation Upskill and Reskill Team Members Core Modernization T E C H N O L O G Y A N D O P E R A T I O N S High Tech Meets High Touch
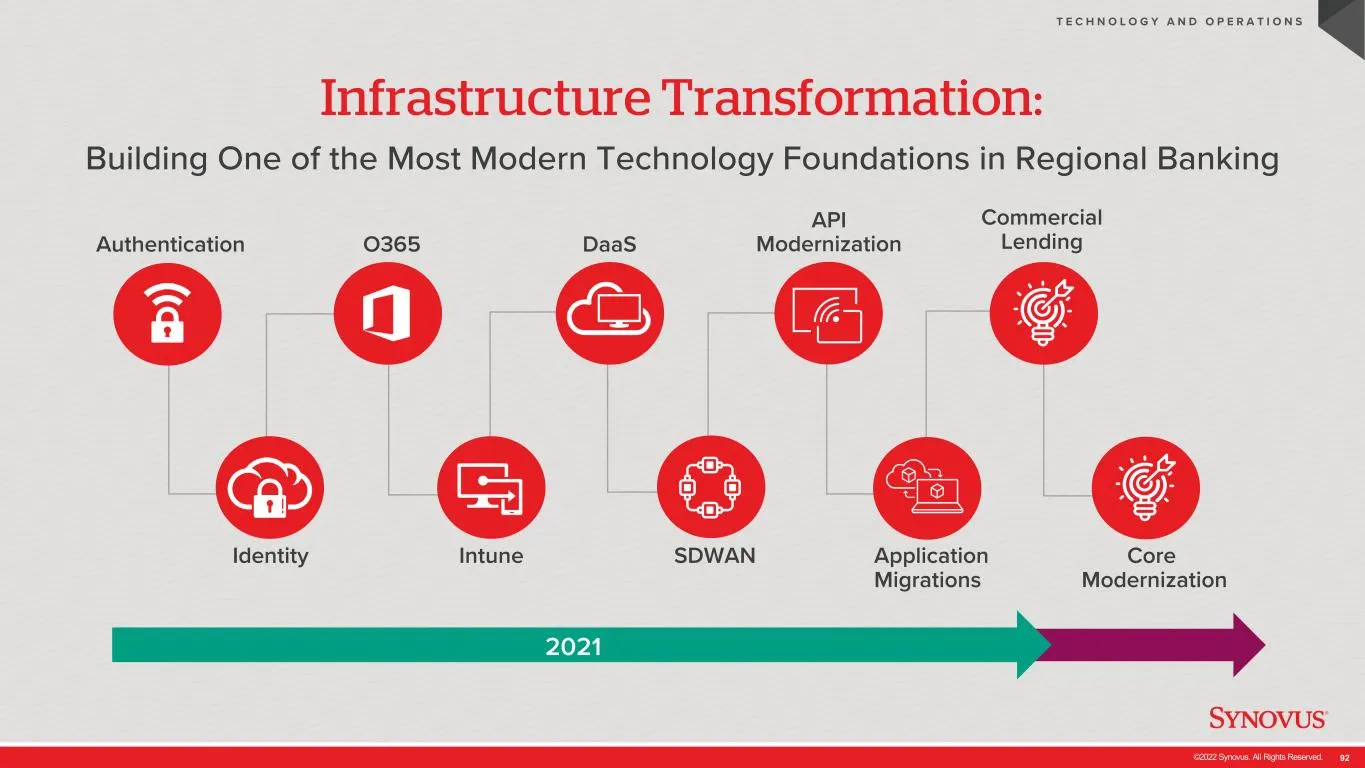
Slide 92: Infrastructure Transformation
©2022 Synovus. All Rights Reserved. 92 Infrastructure Transformation: Building One of the Most Modern Technology Foundations in Regional Banking T E C H N O L O G Y A N D O P E R A T I O N S Authentication Identity DaaSO365 Intune SDWAN Application Migrations Commercial Lending API Modernization 202
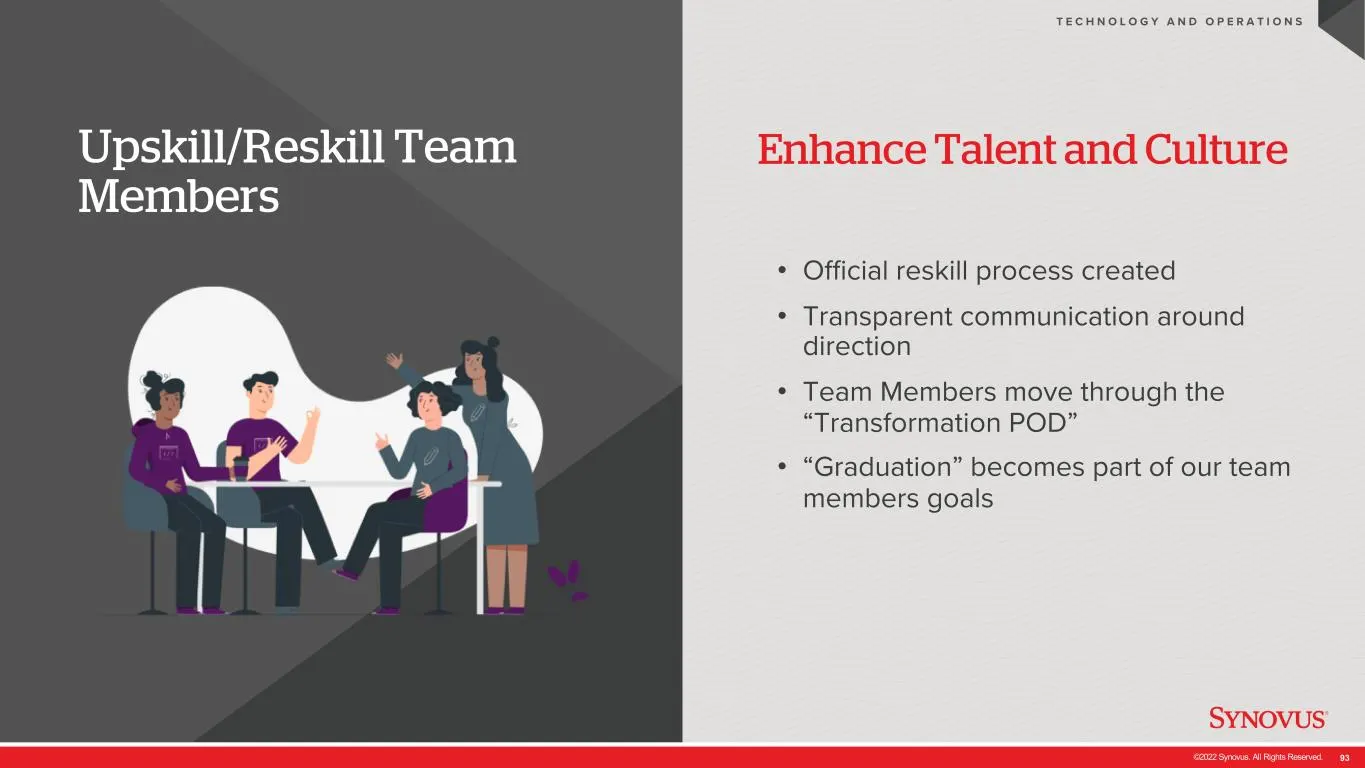
Slide 93: Upskill/Reskill Team Members
©2022 Synovus. All Rights Reserved. 93 Upskill/Reskill Team Members • Official reskill process created • Transparent communication around direction • Team Members move through the “Transformation POD” • “Graduation” becomes part of our team members goals T E C H N O L O G Y A N D O P E R A T I O N S
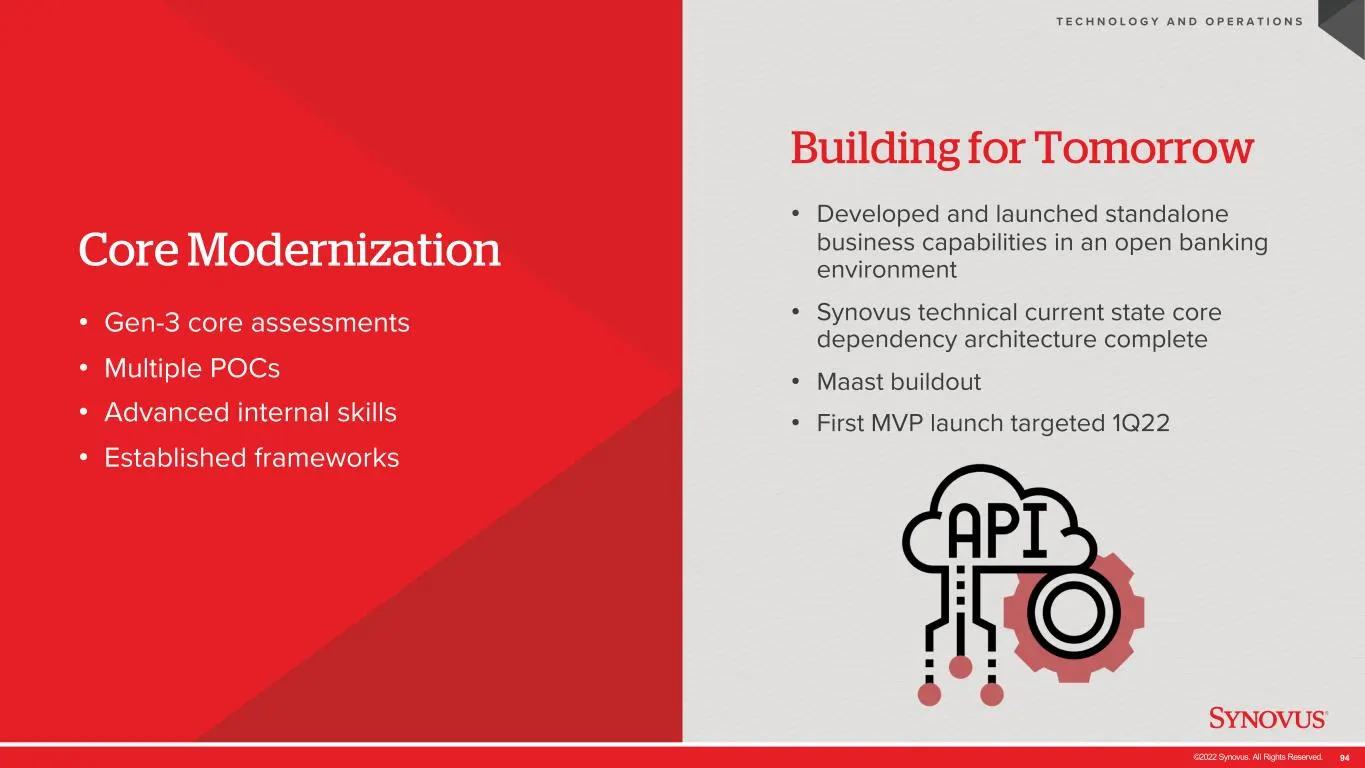
Slide 94: Core Modernization
©2022 Synovus. All Rights Reserved. 94 Core Modernization • Gen-3 core assessments • Multiple POCs • Advanced internal skills • Established frameworks T E C H N O L O G Y A N D O P E R A T I O N S • Developed and launched standalone business capabilities in an open banking environment • Synovus tech
Slide 95: Automate Everything!
©2022 Synovus. All Rights Reserved. 95 Automate Everything! • Intelligent automation • Flexibility meets capability • Automation-as-a-Service • Center of excellence T E C H N O L O G Y A N D O P E R A T I O N S Efficiency and Quality “Automation is a primary focus for us in 2022, but it’s not just a
Slide 96: Tech Investment History
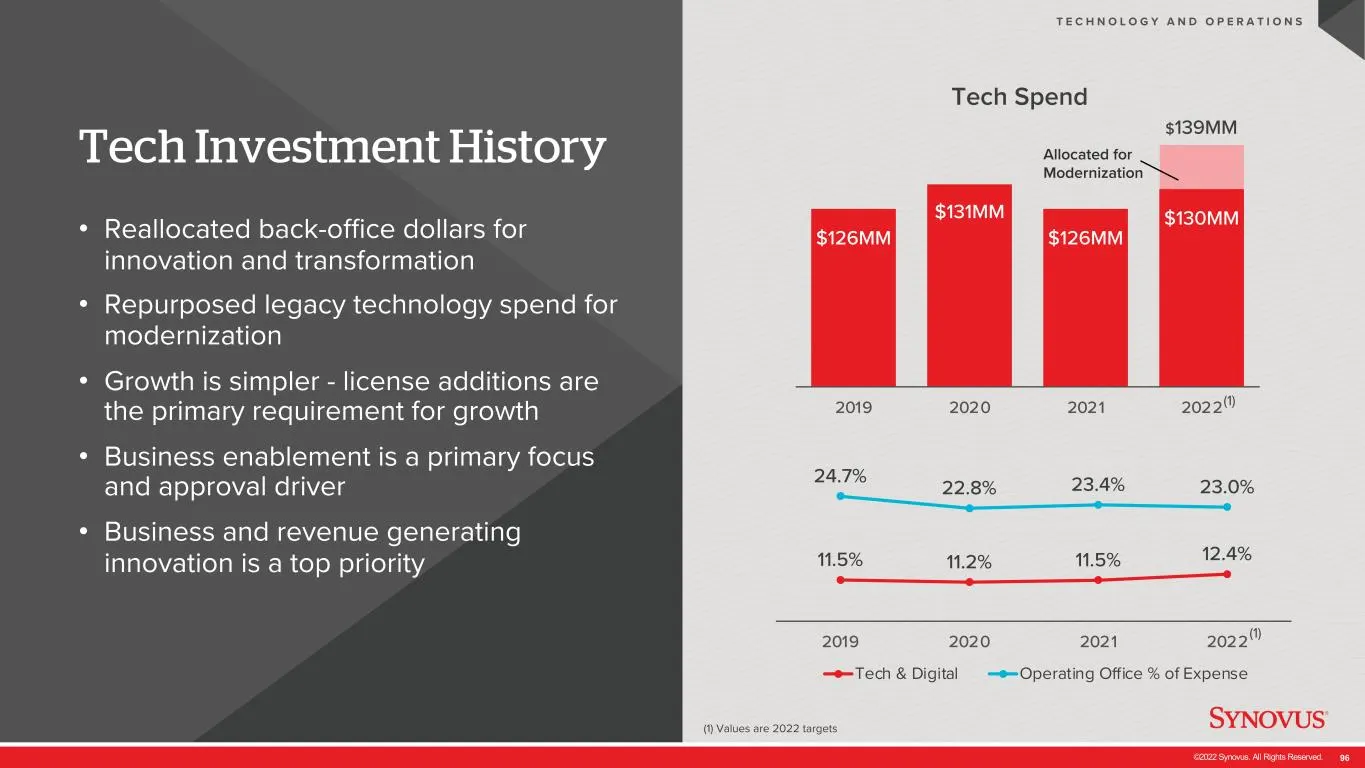
©2022 Synovus. All Rights Reserved. 96 $126MM $131MM $126MM $130MM 2019 2020 2021 2022 Allocated for Modernization Tech Investment History • Reallocated back-office dollars for innovation and transformation • Repurposed legacy technology spend for modernization • Growth is simpler - license addition
Slide 97: Innovation, Research and Development
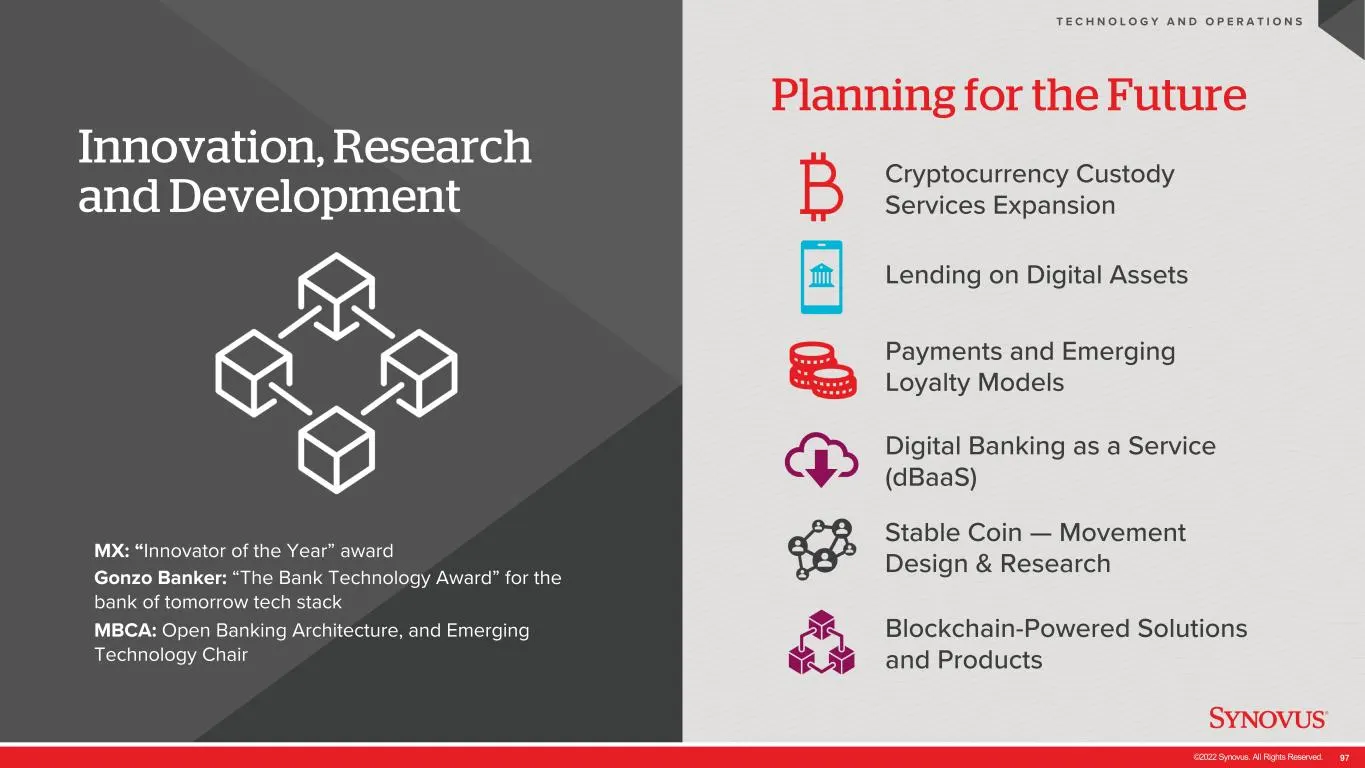
©2022 Synovus. All Rights Reserved. 97 Innovation, Research and Development T E C H N O L O G Y A N D O P E R A T I O N S Cryptocurrency Custody Services Expansion Lending on Digital Assets Digital Banking as a Service (dBaaS) Blockchain-Powered Solutions and Products Payments and Emerging Loyalty M
Slide 98: Top Quartile Financial Performance
©2022 Synovus. All Rights Reserved. 98 Top Quartile Financial Performance Jamie Gregory EVP, Chief Financial Officer
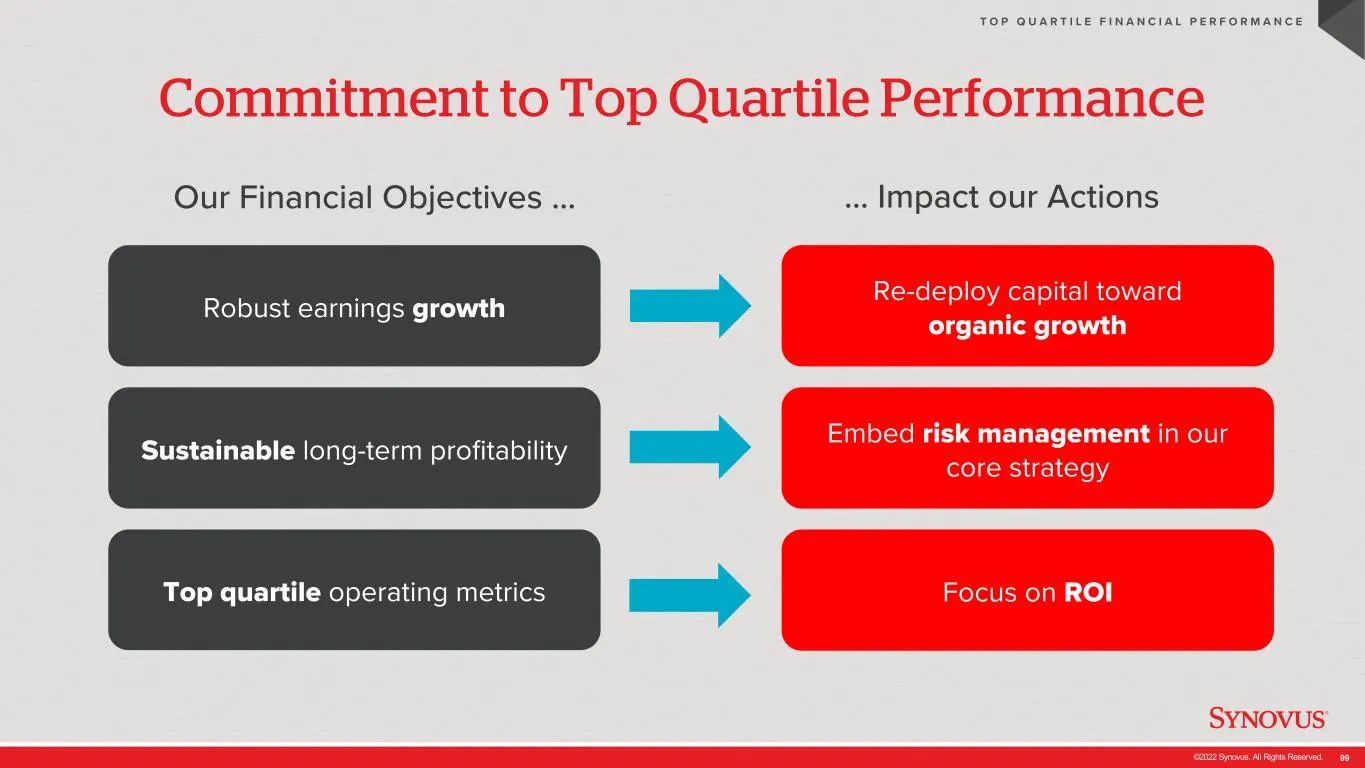
Slide 99: Commitment to Top Quartile Performance
©2022 Synovus. All Rights Reserved. 99 Commitment to Top Quartile Performance T O P Q U A R T I L E F I N A N C I A L P E R F O R M A N C E Our Financial Objectives … Top quartile operating metrics Robust earnings growth Sustainable long-term profitability … Impact our Actions Focus on ROI Embed ris
Slide 100: Robust Earnings Growth
©2022 Synovus. All Rights Reserved. 100 Robust Earnings Growth T O P Q U A R T I L E F I N A N C I A L P E R F O R M A N C E
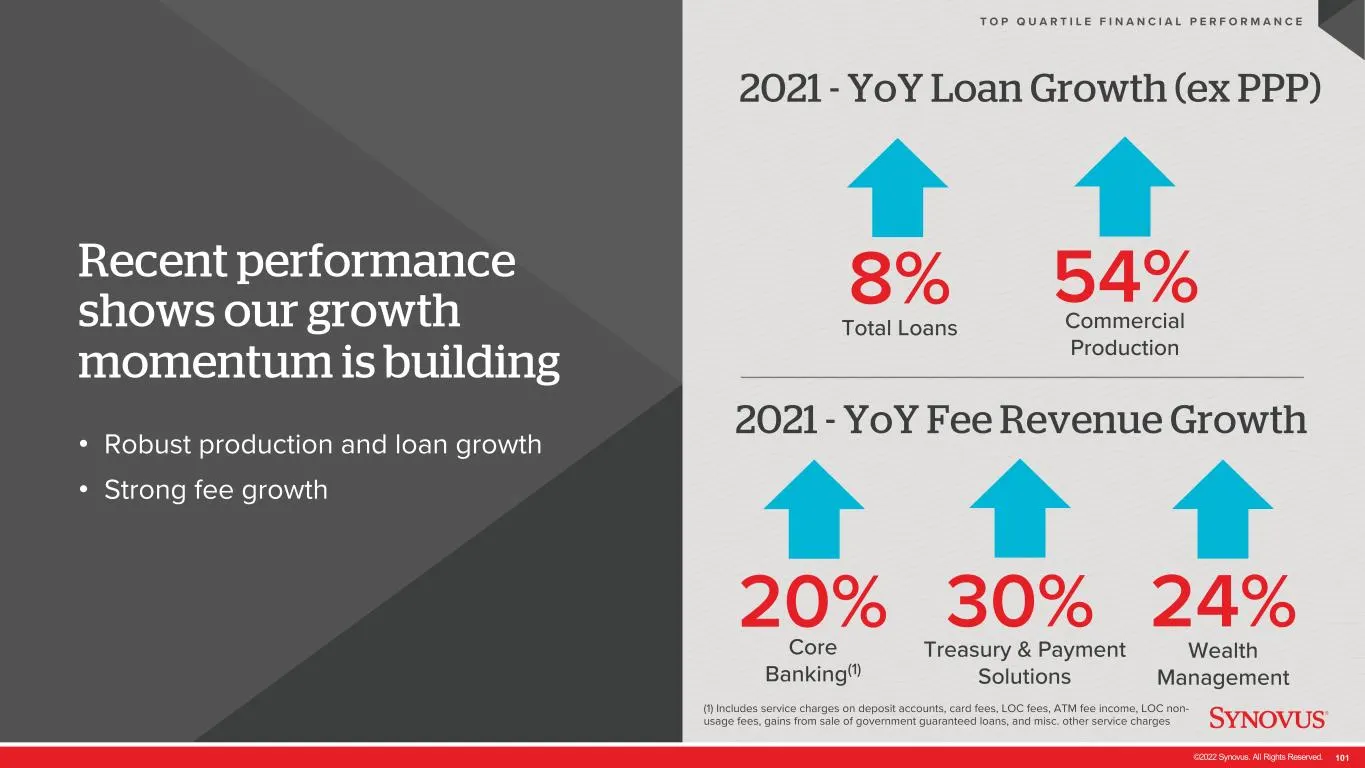
Slide 101: Recent performance shows our growth momentum is building
©2022 Synovus. All Rights Reserved. 101 Recent performance shows our growth momentum is building • Robust production and loan growth • Strong fee growth T O P Q U A R T I L E F I N A N C I A L P E R F O R M A N C E (1) Includes service charges on deposit accounts, card fees, LOC fees, ATM fee income
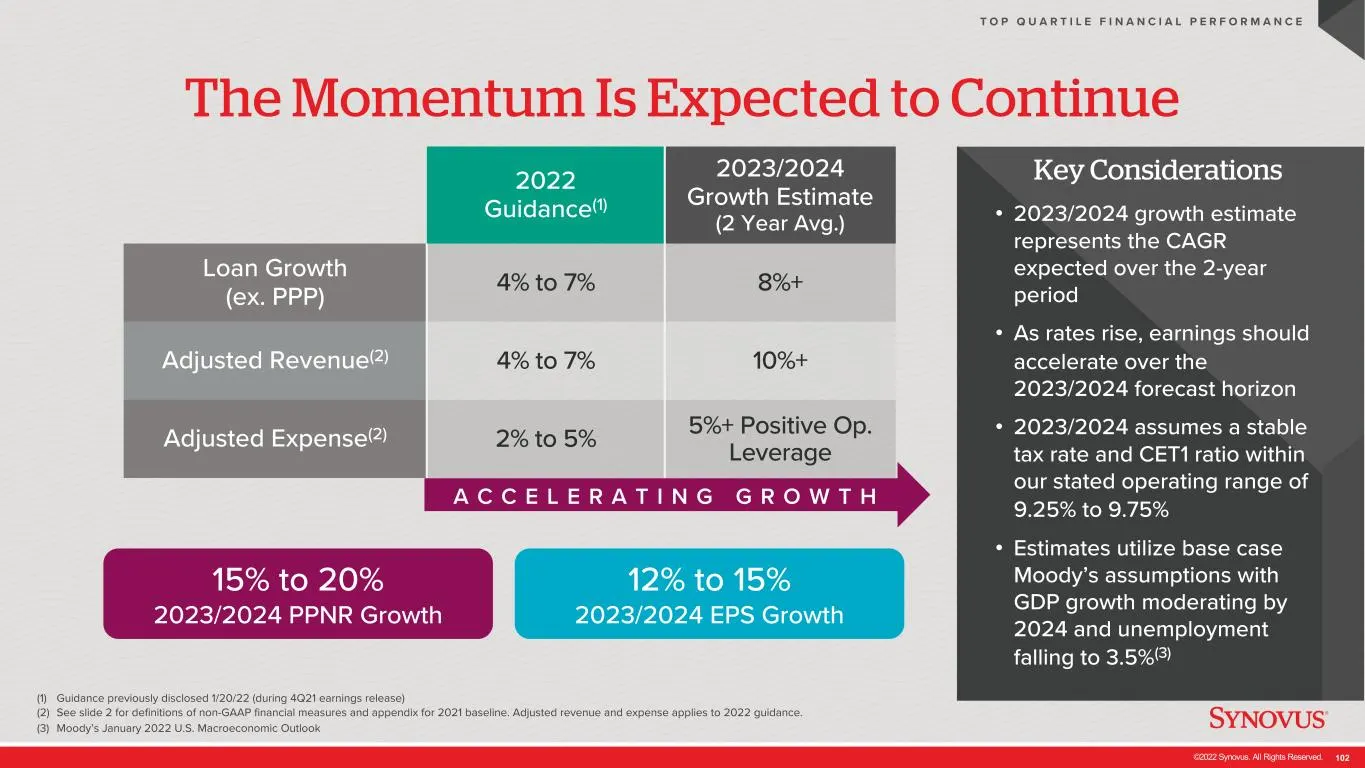
Slide 102: The Momentum Is Expected to Continue
©2022 Synovus. All Rights Reserved. 102 The Momentum Is Expected to Continue (1) Guidance previously disclosed 1/20/22 (during 4Q21 earnings release) (2) See slide 2 for definitions of non-GAAP financial measures and appendix for 2021 baseline. Adjusted revenue and expense applies to 2022 guidance.
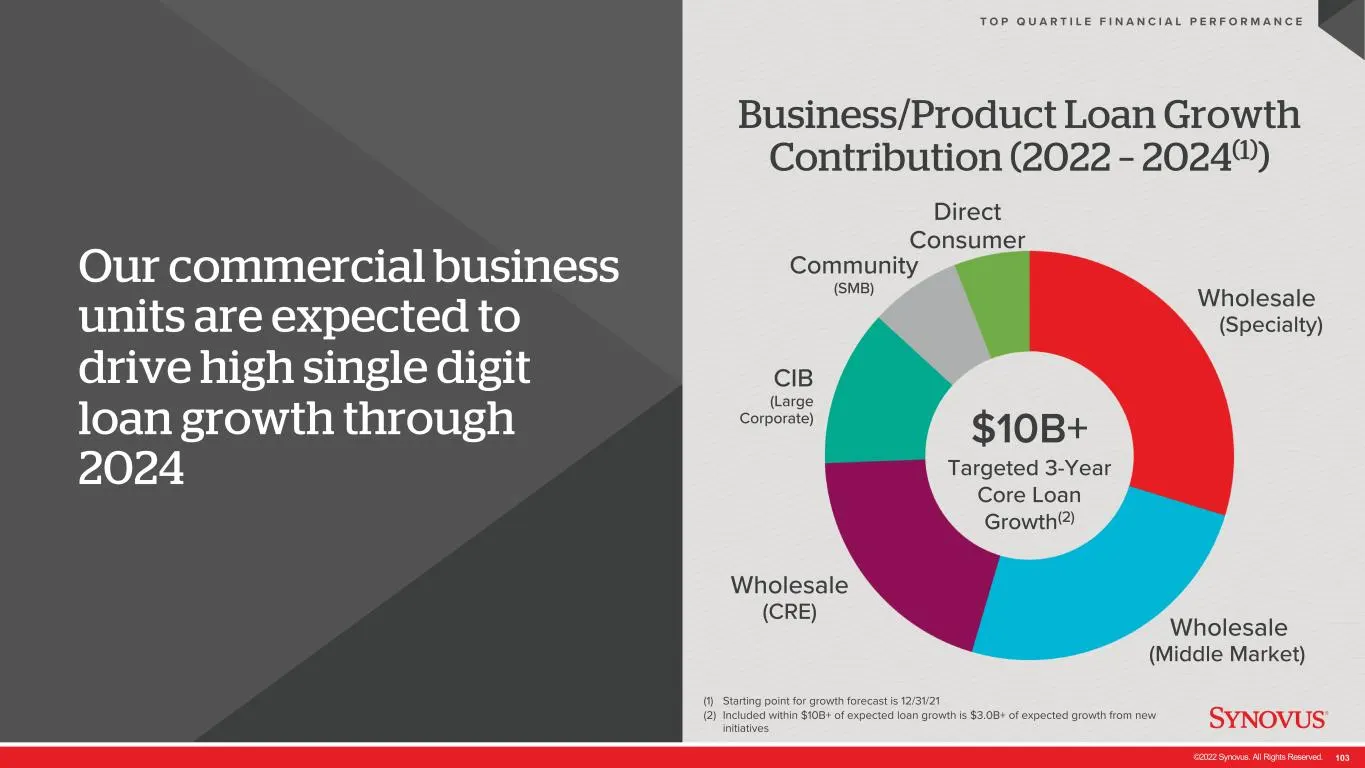
Slide 103: Commercial business units expected to drive high single digit loan growth
©2022 Synovus. All Rights Reserved. 103 Our commercial business units are expected to drive high single digit loan growth through 2024 T O P Q U A R T I L E F I N A N C I A L P E R F O R M A N C E (1) Starting point for growth forecast is 12/31/21 (2) Included within $10B+ of expected loan growth is
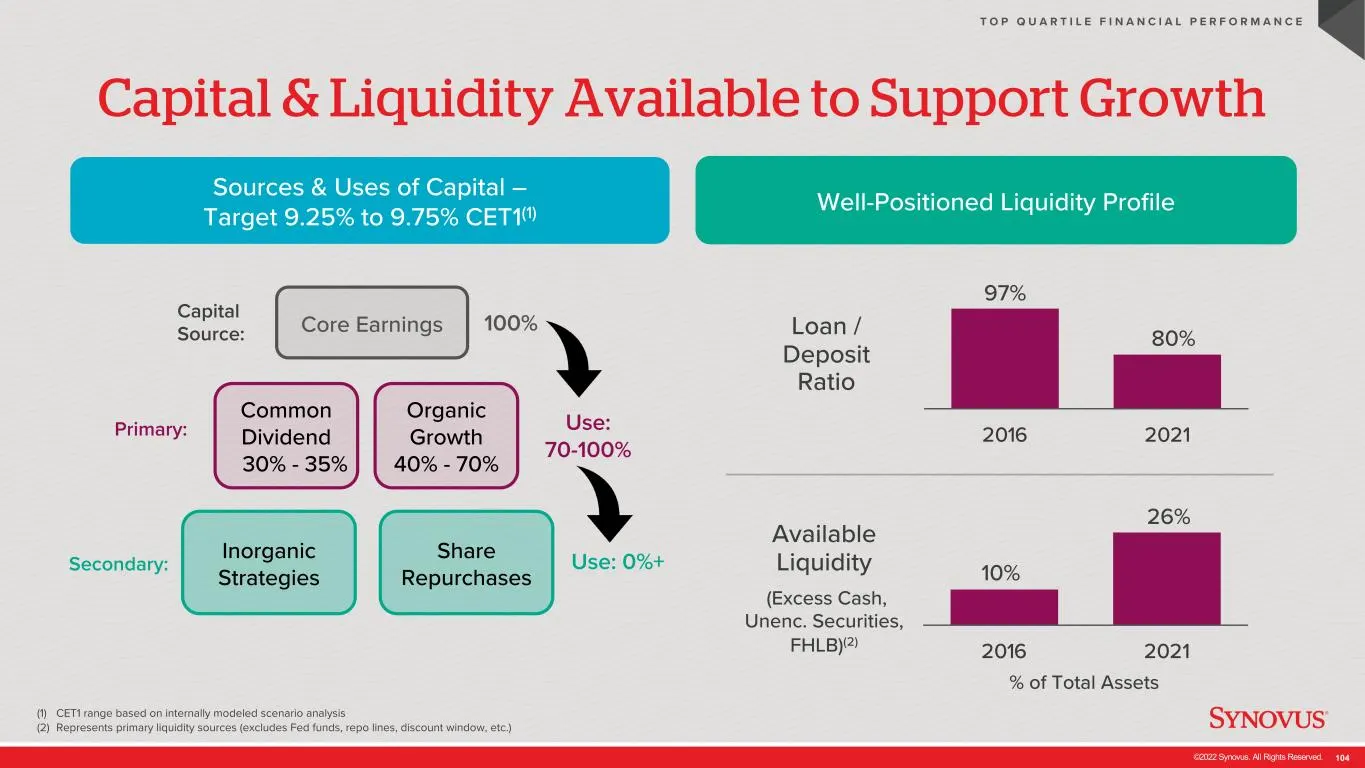
Slide 104: Capital & Liquidity Available to Support Growth
©2022 Synovus. All Rights Reserved. 104 97% 80% 2016 2021 Capital & Liquidity Available to Support Growth (1) CET1 range based on internally modeled scenario analysis (2) Represents primary liquidity sources (excludes Fed funds, repo lines, discount window, etc.) T O P Q U A R T I L E F I N A N C I
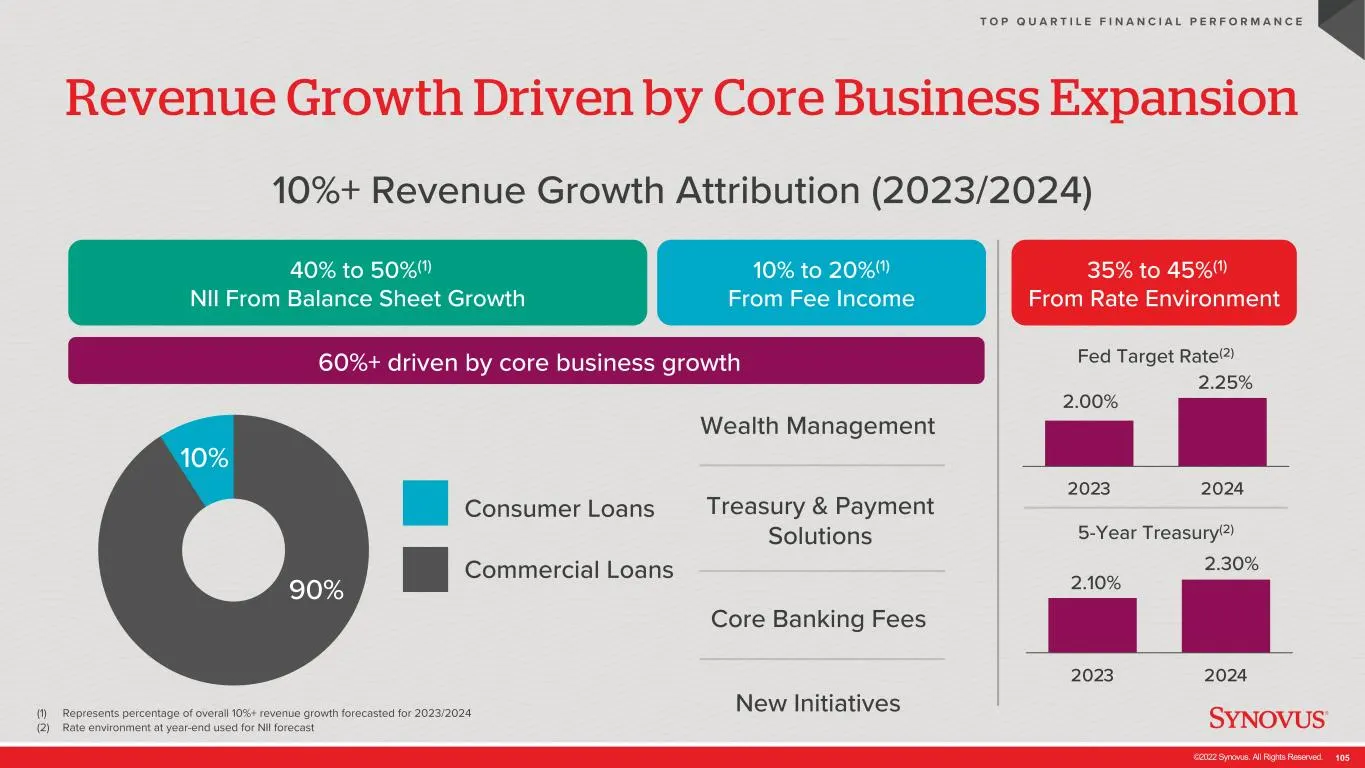
Slide 105: Revenue Growth Driven by Core Business Expansion
©2022 Synovus. All Rights Reserved. 105 2.00% 2.25% 2023 2024 Revenue Growth Driven by Core Business Expansion (1) Represents percentage of overall 10%+ revenue growth forecasted for 2023/2024 (2) Rate environment at year-end used for NII forecast T O P Q U A R T I L E F I N A N C I A L P E R F O R
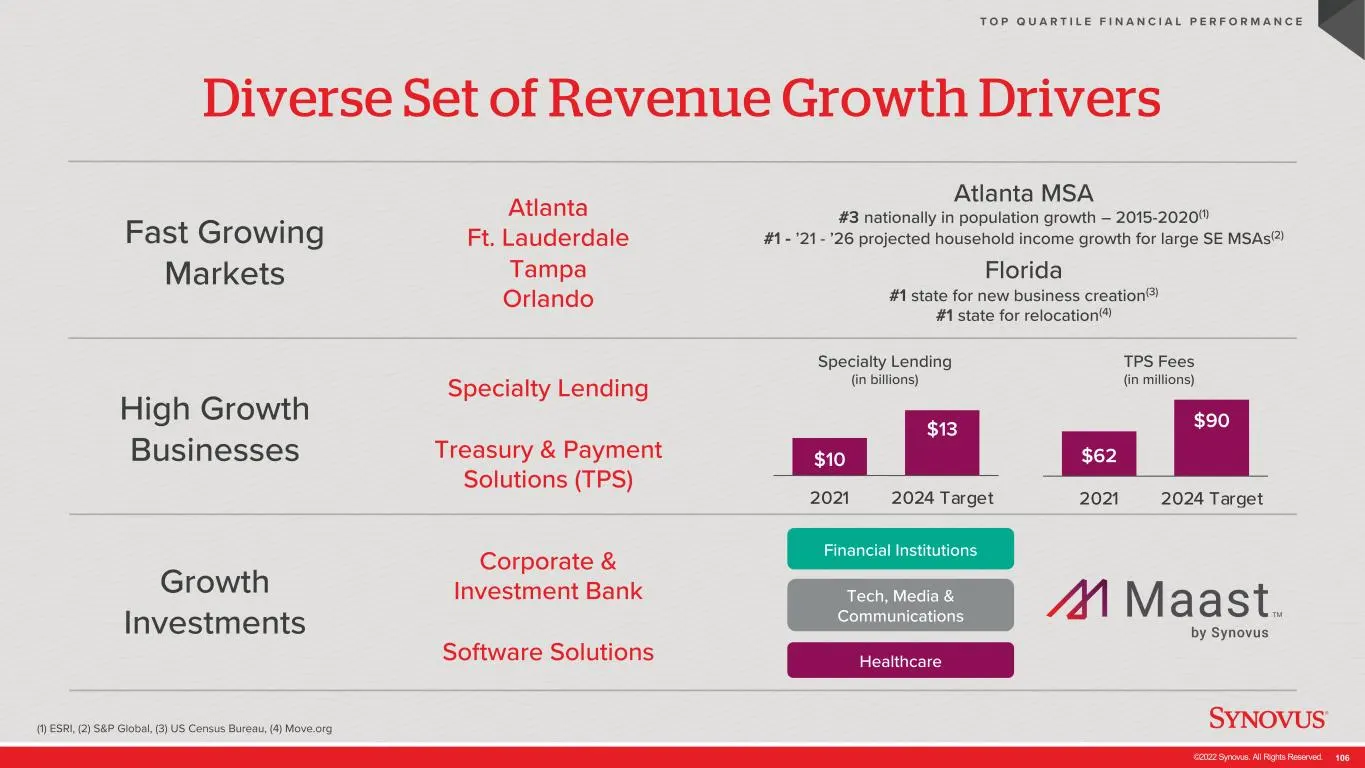
Slide 106: Diverse Set of Revenue Growth Drivers
©2022 Synovus. All Rights Reserved. 106 Diverse Set of Revenue Growth Drivers T O P Q U A R T I L E F I N A N C I A L P E R F O R M A N C E Fast Growing Markets Growth Investments High Growth Businesses Atlanta Ft. Lauderdale Tampa Orlando Corporate & Investment Bank Software Solutions Specialty Len
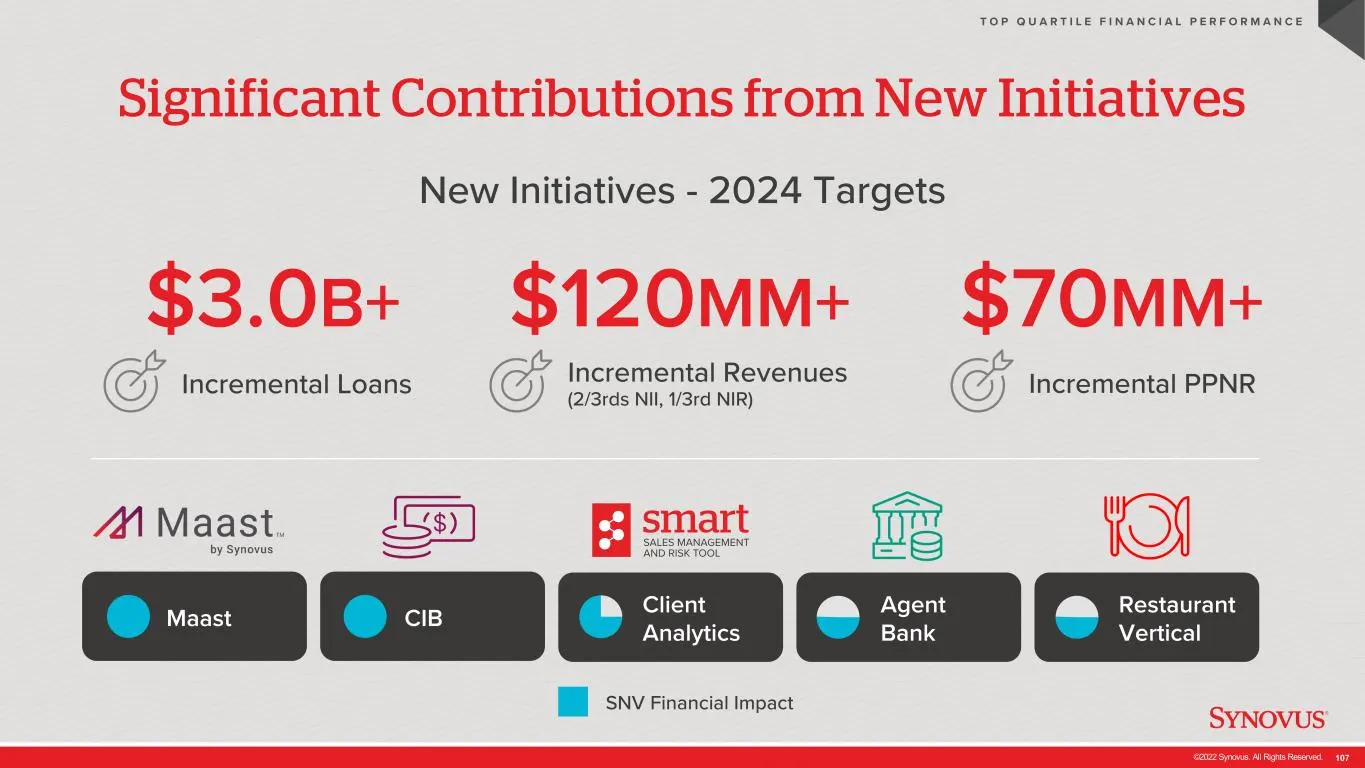
Slide 107: CIB Significant Contributions from New Initiatives
©2022 Synovus. All Rights Reserved. 107 CIB Significant Contributions from New Initiatives T O P Q U A R T I L E F I N A N C I A L P E R F O R M A N C E Maast Agent Bank Restaurant Vertical Client Analytics $3.0B+ Incremental Loans New Initiatives - 2024 Targets Incremental Revenues (2/3rds NII, 1/3
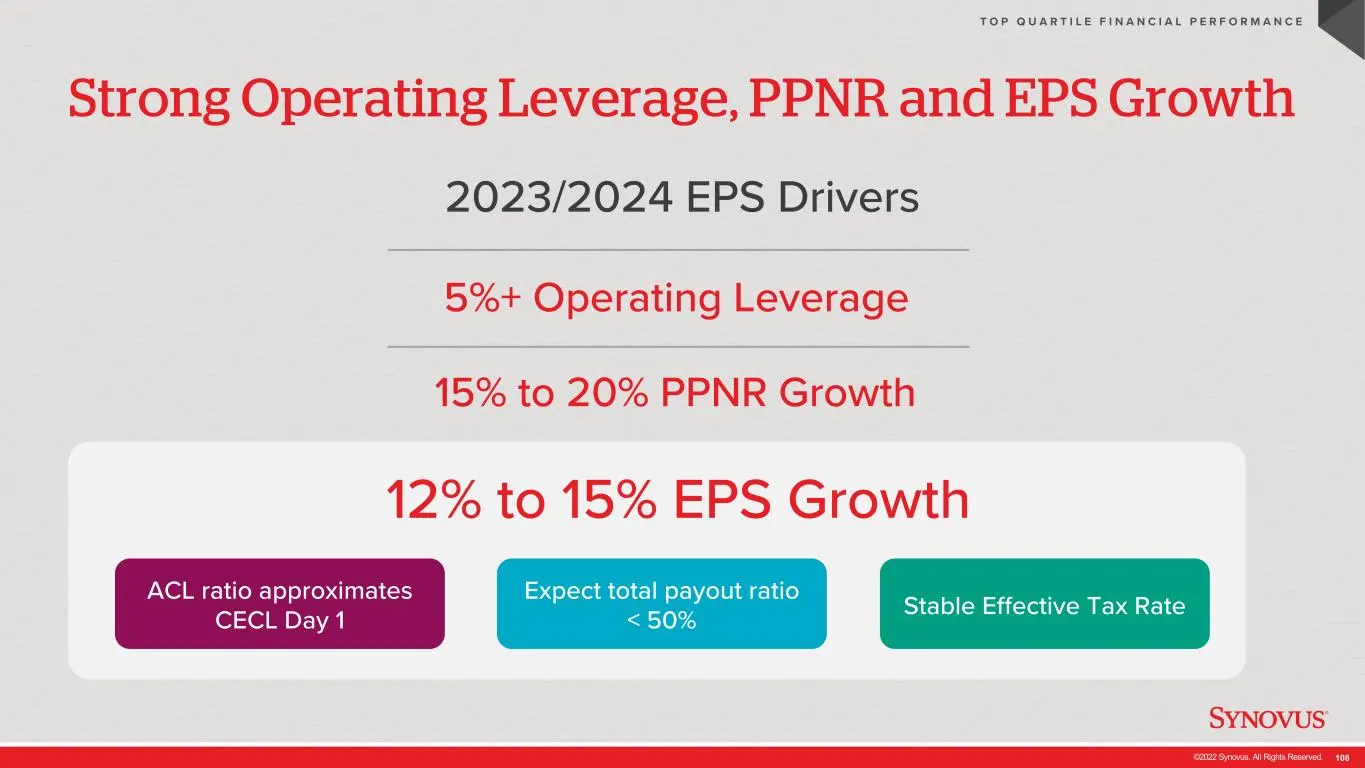
Slide 108: Strong Operating Leverage, PPNR and EPS Growth
©2022 Synovus. All Rights Reserved. 108 Strong Operating Leverage, PPNR and EPS Growth T O P Q U A R T I L E F I N A N C I A L P E R F O R M A N C E 5%+ Operating Leverage 15% to 20% PPNR Growth 12% to 15% EPS Growth ACL ratio approximates CECL Day 1 Expect total payout ratio < 50% Stable Effective
Slide 109: Sustainable Long-Term Profitability
©2022 Synovus. All Rights Reserved. 109 Sustainable Long-Term Profitability T O P Q U A R T I L E F I N A N C I A L P E R F O R M A N C E
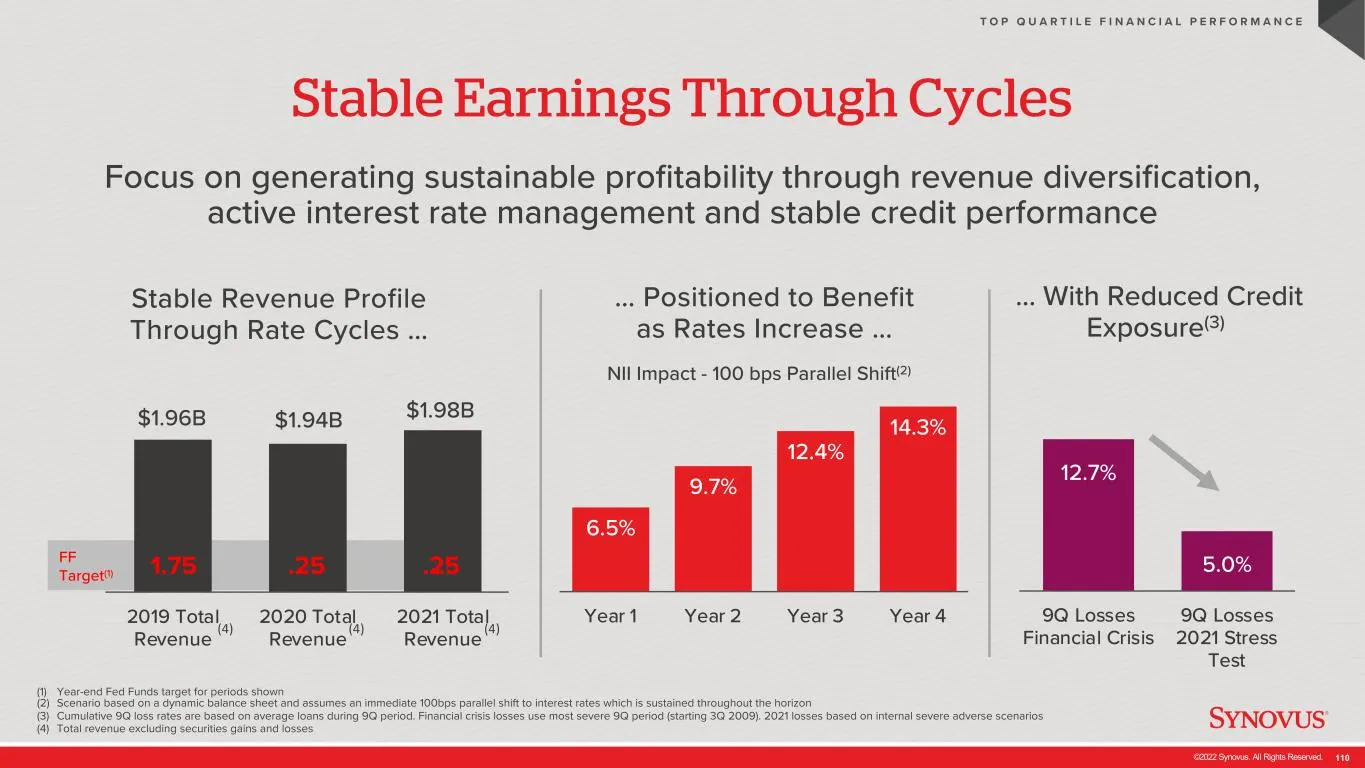
Slide 110: Stable Earnings Through Cycles
©2022 Synovus. All Rights Reserved. 110 Stable Earnings Through Cycles (1) Year-end Fed Funds target for periods shown (2) Scenario based on a dynamic balance sheet and assumes an immediate 100bps parallel shift to interest rates which is sustained throughout the horizon (3) Cumulative 9Q loss rates
Slide 111: Top Quartile Operating Metrics
©2022 Synovus. All Rights Reserved. 111 Top Quartile Operating Metrics T O P Q U A R T I L E F I N A N C I A L P E R F O R M A N C E
Slide 112: Our Segment Strategies Drive Performance
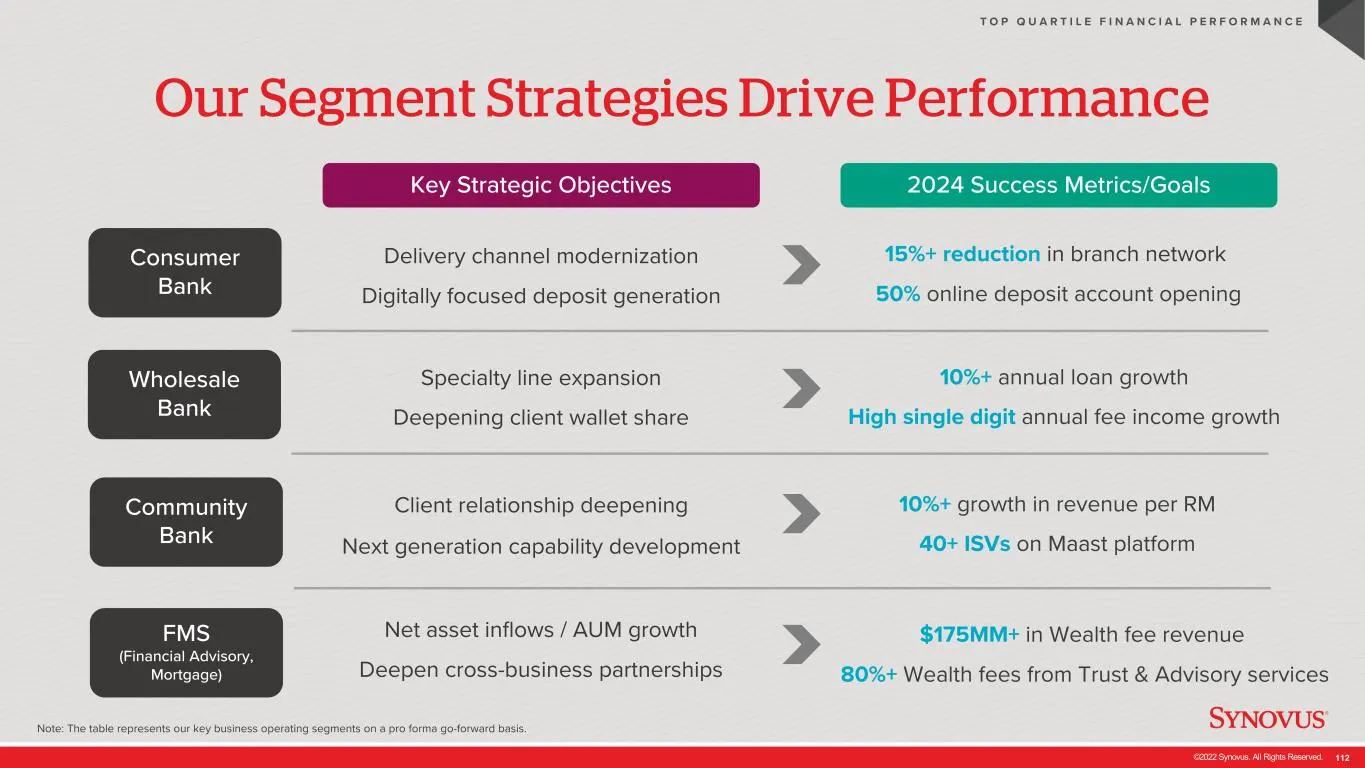
©2022 Synovus. All Rights Reserved. 112 Our Segment Strategies Drive Performance T O P Q U A R T I L E F I N A N C I A L P E R F O R M A N C E Key Strategic Objectives 2024 Success Metrics/Goals Delivery channel modernization Digitally focused deposit generation Consumer Bank 15%+ reduction in branc
Slide 113: Continuous Focus on Top Quartile Operating Metrics
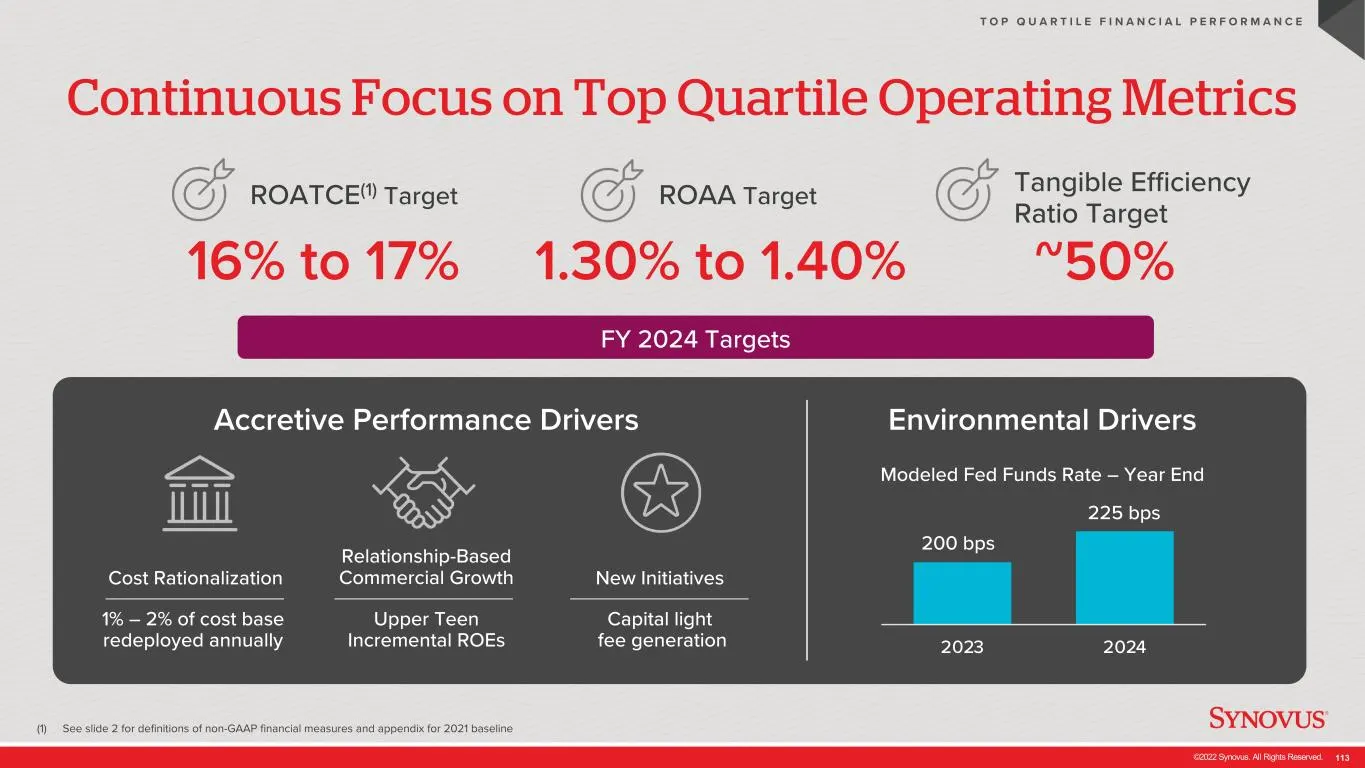
©2022 Synovus. All Rights Reserved. 113 Continuous Focus on Top Quartile Operating Metrics (1) See slide 2 for definitions of non-GAAP financial measures and appendix for 2021 baseline T O P Q U A R T I L E F I N A N C I A L P E R F O R M A N C E Accretive Performance Drivers Environmental Drivers 2
Slide 114: Improving Performance Drives Strong Shareholder Returns
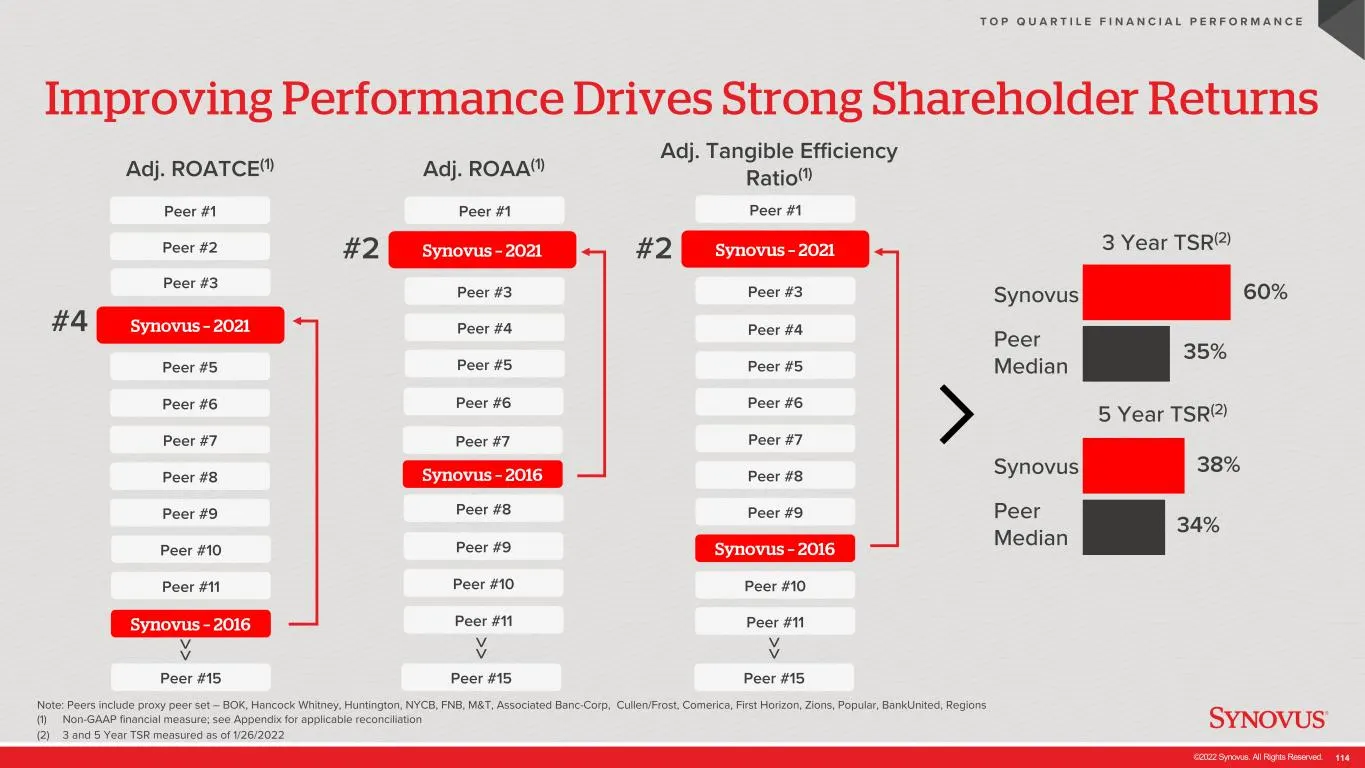
©2022 Synovus. All Rights Reserved. 114 Synovus – 2016 Improving Performance Drives Strong Shareholder Returns Note: Peers include proxy peer set – BOK, Hancock Whitney, Huntington, NYCB, FNB, M&T, Associated Banc-Corp, Cullen/Frost, Comerica, First Horizon, Zions, Popular, BankUnited, Regions (1) N
Slide 115: Resulting in top quartile performance
©2022 Synovus. All Rights Reserved. 115 T O P Q U A R T I L E F I N A N C I A L P E R F O R M A N C E … Resulting in top quartile performance Poised to continue robust growth … …While maintaining earnings stability…

Slide 116: Appendix
©2022 Synovus. All Rights Reserved. 116 Appendix
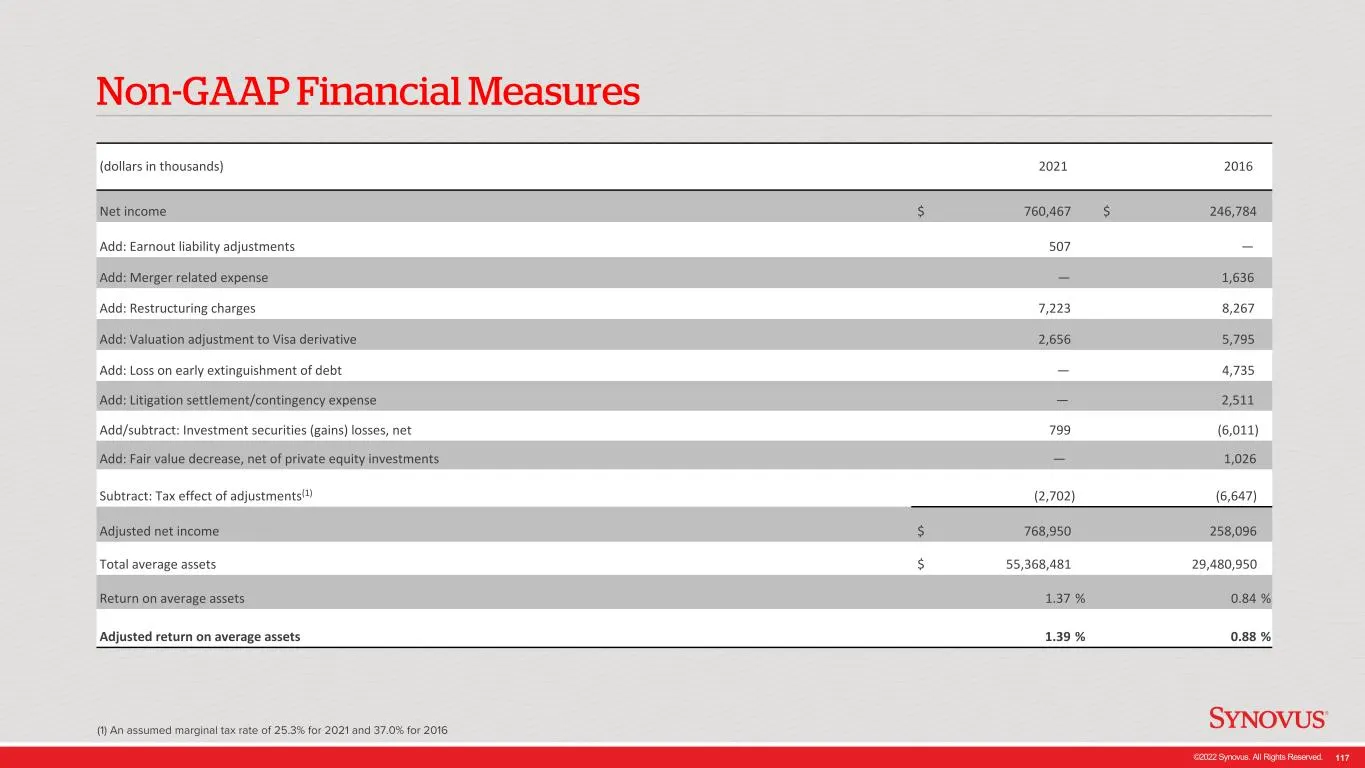
Slide 117: Non-GAAP Financial Measures
©2022 Synovus. All Rights Reserved. 117 (dollars in thousands) 2021 2016 Net income $ 760,467 $ 246,784 Add: Earnout liability adjustments 507 — Add: Merger related expense — 1,636 Add: Restructuring charges 7,223 8,267 Add: Valuation adjustment to Visa derivative 2,656 5,795 Add: Loss on early exti
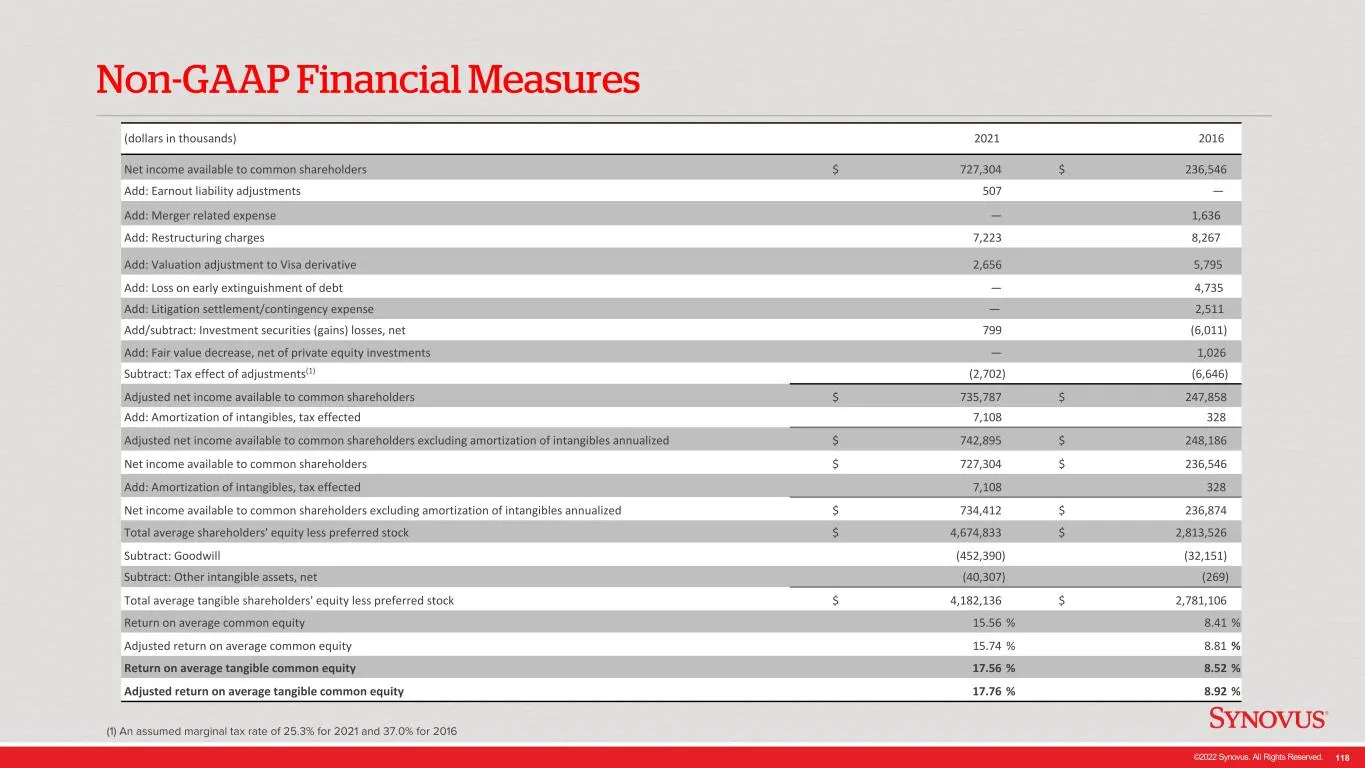
Slide 118: Non-GAAP Financial Measures
©2022 Synovus. All Rights Reserved. 118 (dollars in thousands) 2021 2016 Net income available to common shareholders $ 727,304 $ 236,546 Add: Earnout liability adjustments 507 — Add: Merger related expense — 1,636 Add: Restructuring charges 7,223 8,267 Add: Valuation adjustment to Visa derivative 2,
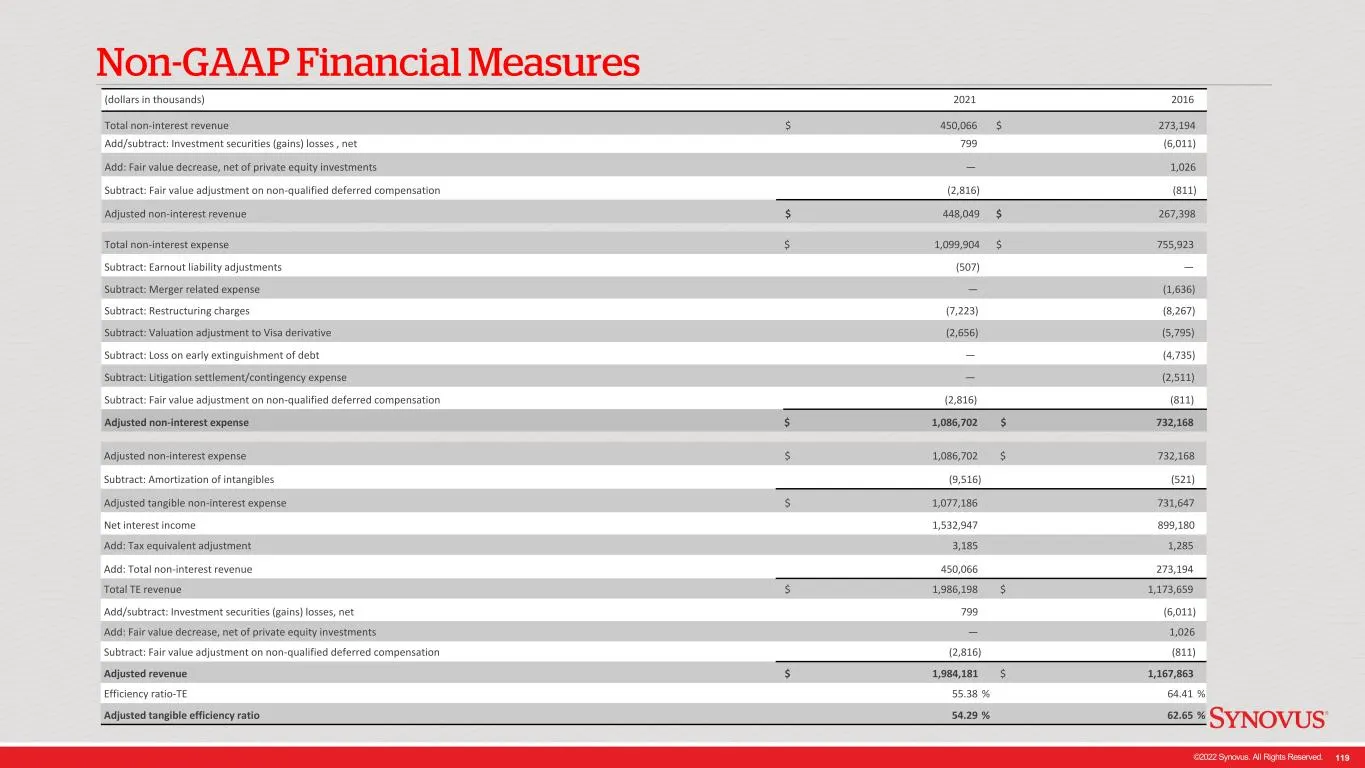
Slide 119: Non-GAAP Financial Measures
©2022 Synovus. All Rights Reserved. 119 (dollars in thousands) 2021 2016 Total non-interest revenue $ 450,066 $ 273,194 Add/subtract: Investment securities (gains) losses , net 799 (6,011) Add: Fair value decrease, net of private equity investments — 1,026 Subtract: Fair value adjustment on non-qual
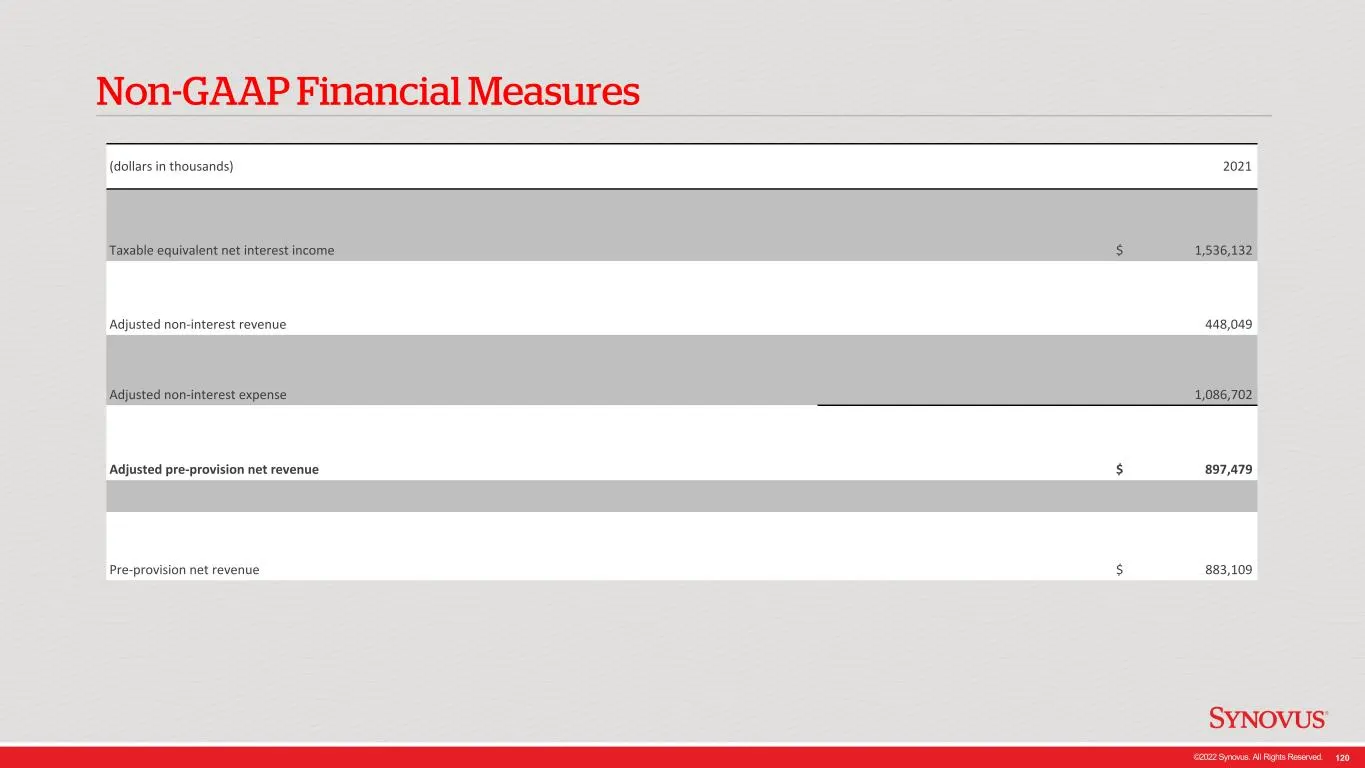
Slide 120: Non-GAAP Financial Measures
©2022 Synovus. All Rights Reserved. 120 (dollars in thousands) 2021 Taxable equivalent net interest income $ 1,536,132 Adjusted non-interest revenue 448,049 Adjusted non-interest expense 1,086,702 Adjusted pre-provision net revenue $ 897,479 Pre-provision net revenue $ 883,109 Non-GAAP Financial Mea
Source: SEC EDGAR · 8-K filed Feb 8, 2022
More decks from Synovus Financial Corp
 Goldman Sachs 2025 Financial Services Conference15 slides · Dec 8, 2025
 Debt Investor Presentation (December 2025)9 slides · Dec 1, 2025
 Merger or Acquisition (November 2025)5 slides · Nov 26, 2025
 Merger or Acquisition (November 2025)6 slides · Nov 6, 2025
 Q3 2025 Earnings Presentation47 slides · Oct 16, 2025
 Merger or Acquisition (August 2025)27 slides · Aug 28, 2025