Synovus Financial — Goldman Sachs 2025 Financial Services Conference
15 slides from Synovus Financial's conference presentation, Dec 8, 2025
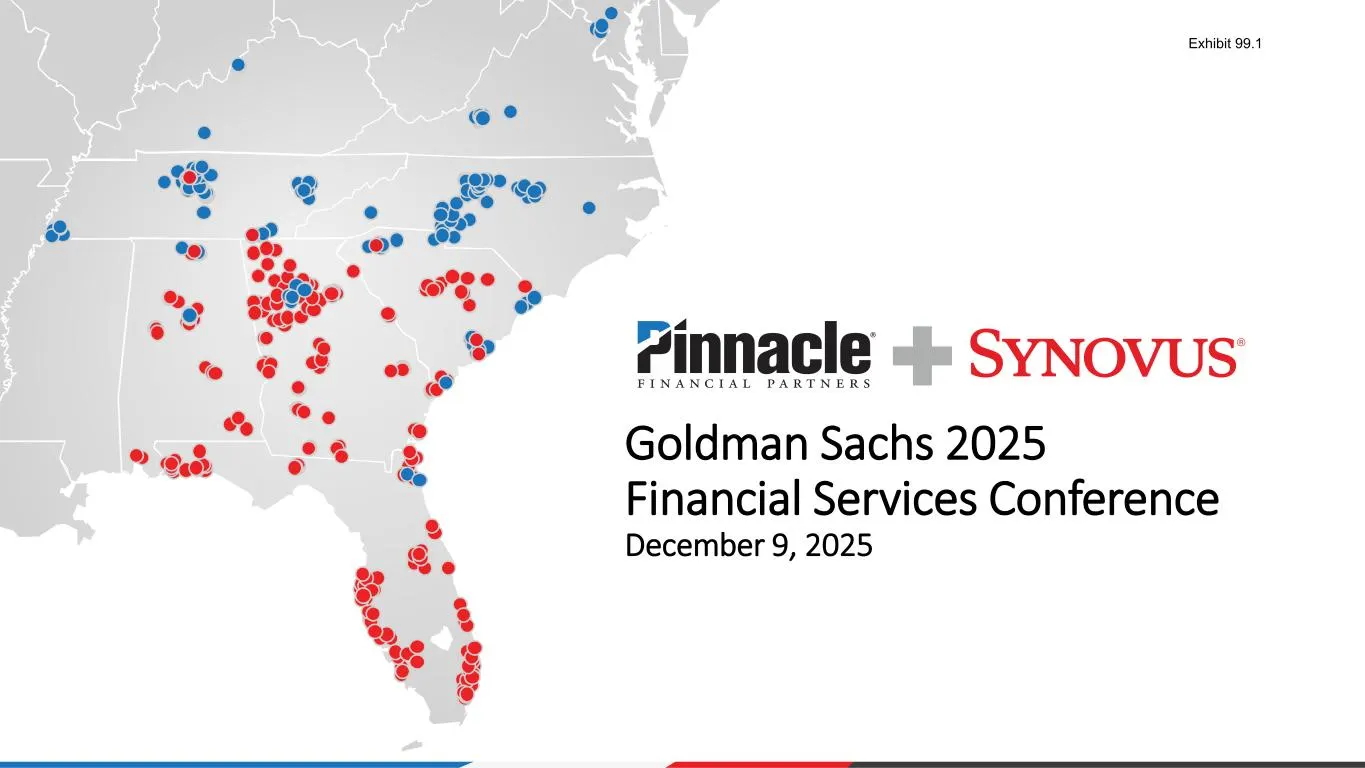
Slide 1: Goldman Sachs 2025 Financial Services Conference
Goldman Sachs 2025 Financial Services Conference December 9, 2025 Exhibit 99.1
Slide 2: Forward-looking statements
2 This communication contains statements that constitute “forward-looking statements” within the meaning of, and subject to the protections of, Section 27A of the Securities Act of 1933, as amended, and Section 21E of the Securities Exchange Act of 1934, as amended. All statements other than stateme
Slide 3: Non-GAAP financial measures
3 This slide presentation contains certain non-GAAP financial measures determined by methods other than in accordance with generally accepted accounting principles. Such non-GAAP financial measures include the following: adjusted revenue taxable equivalent (TE) and adjusted non-interest expense. The
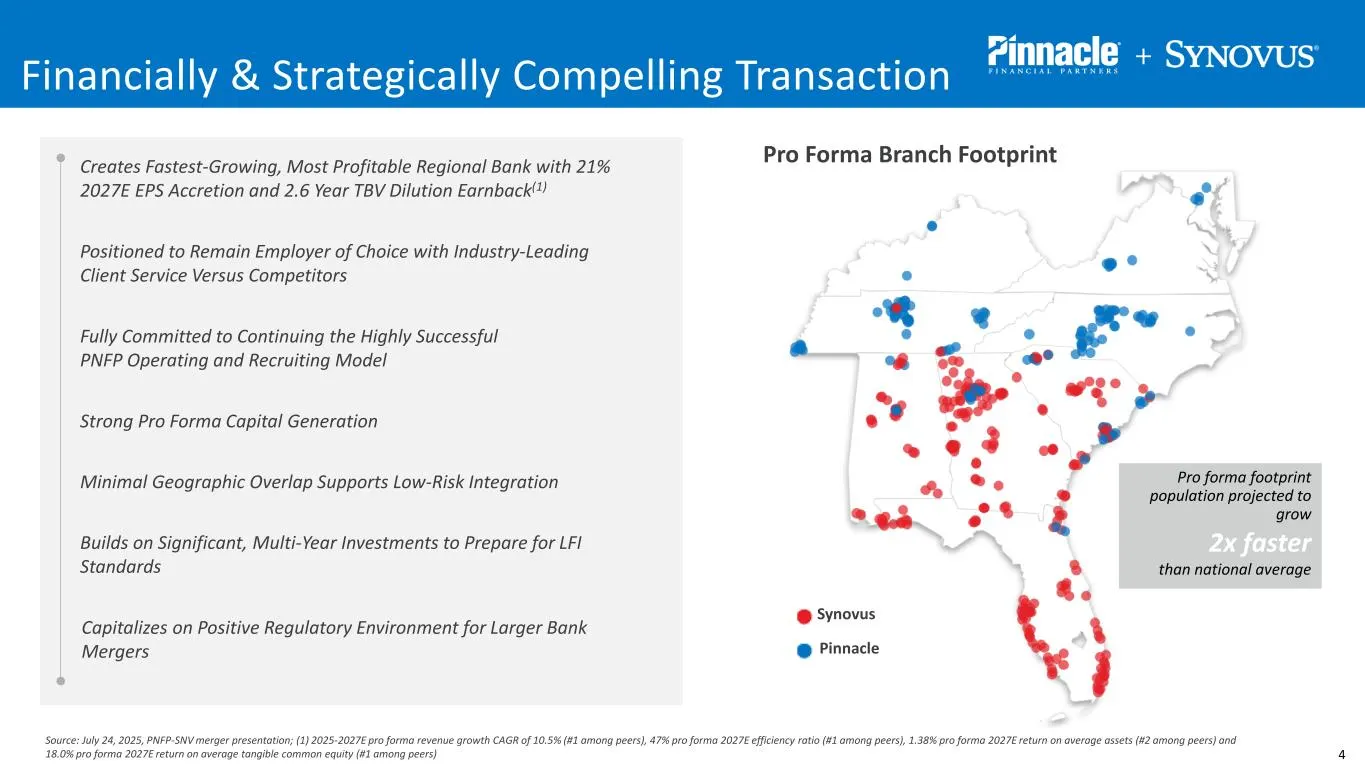
Slide 4: Pro Forma Branch Footprint
4 Pro Forma Branch Footprint Synovus Pro forma footprint population projected to grow 2x faster than national average Source: July 24, 2025, PNFP-SNV merger presentation; (1) 2025-2027E pro forma revenue growth CAGR of 10.5% (#1 among peers), 47% pro forma 2027E efficiency ratio (#1 among peers), 1.
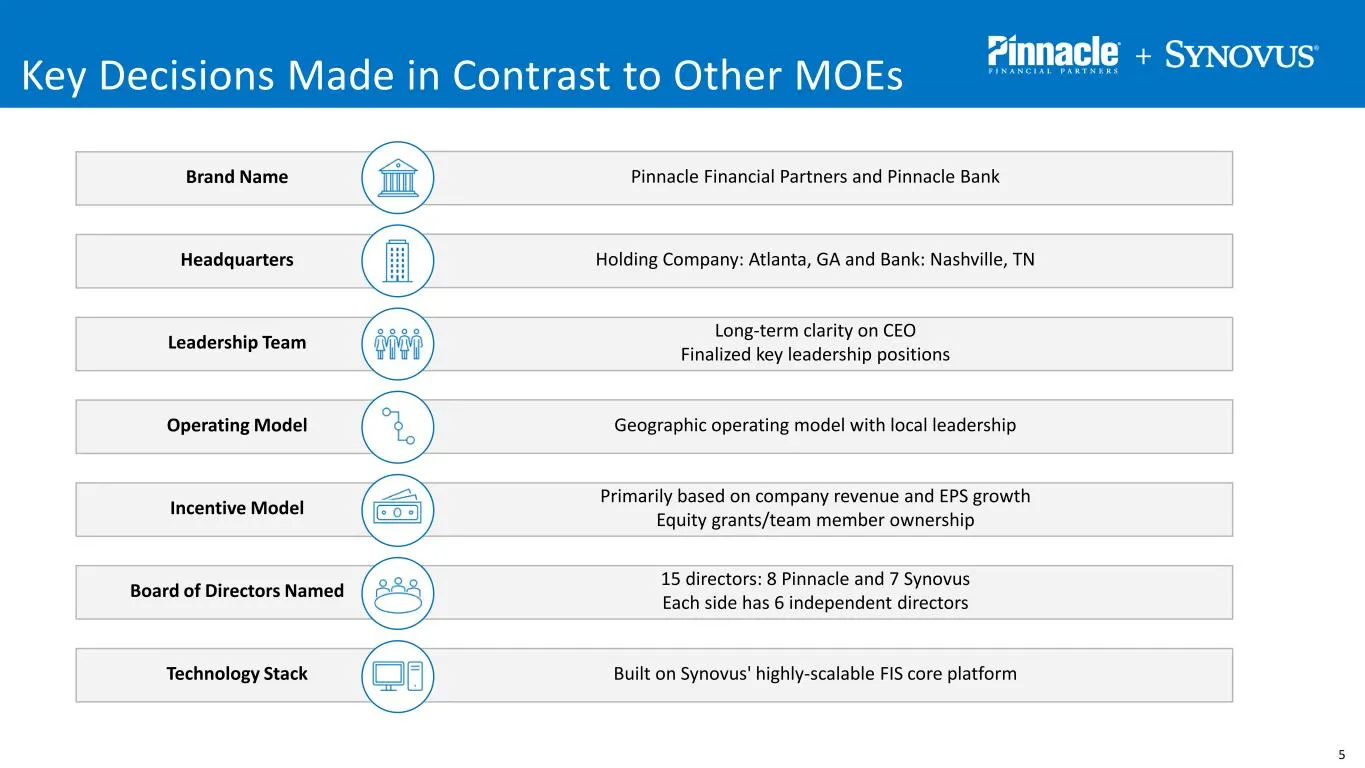
Slide 5: Key Decisions Made in Contrast to Other MOEs
5 Brand Name Headquarters Leadership Team Operating Model Incentive Model Board of Directors Named Technology Stack Pinnacle Financial Partners and Pinnacle Bank Built on Synovus' highly-scalable FIS core platform Primarily based on company revenue and EPS growth Equity grants/team member ownership
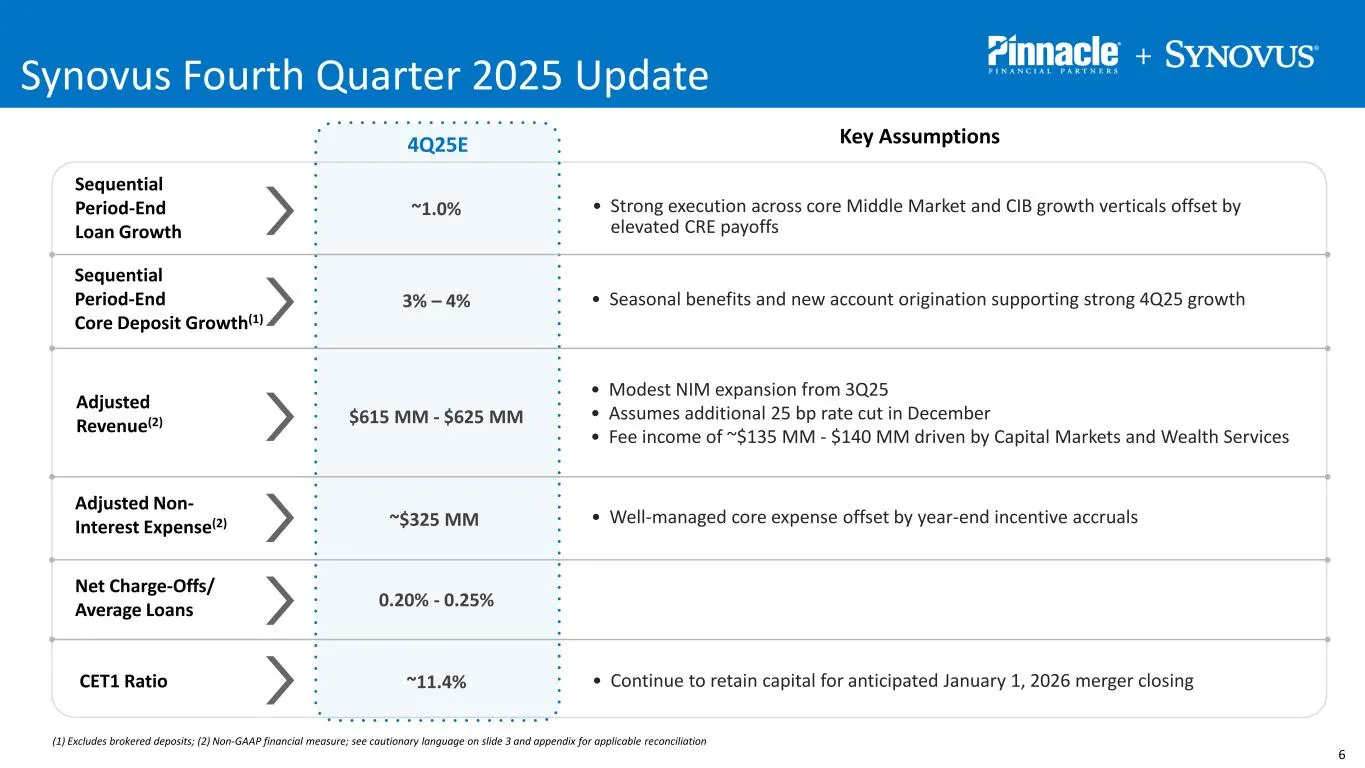
Slide 6: Synovus Fourth Quarter 2025 Update
6 Key Assumptions Sequential Period-End Loan Growth Sequential Period-End Core Deposit Growth(1) Adjusted Revenue(2) Adjusted Non- Interest Expense(2) CET1 Ratio Net Charge-Offs/ Average Loans • Well-managed core expense offset by year-end incentive accruals $615 MM - $625 MM ~$325 MM 0.20% - 0.25%
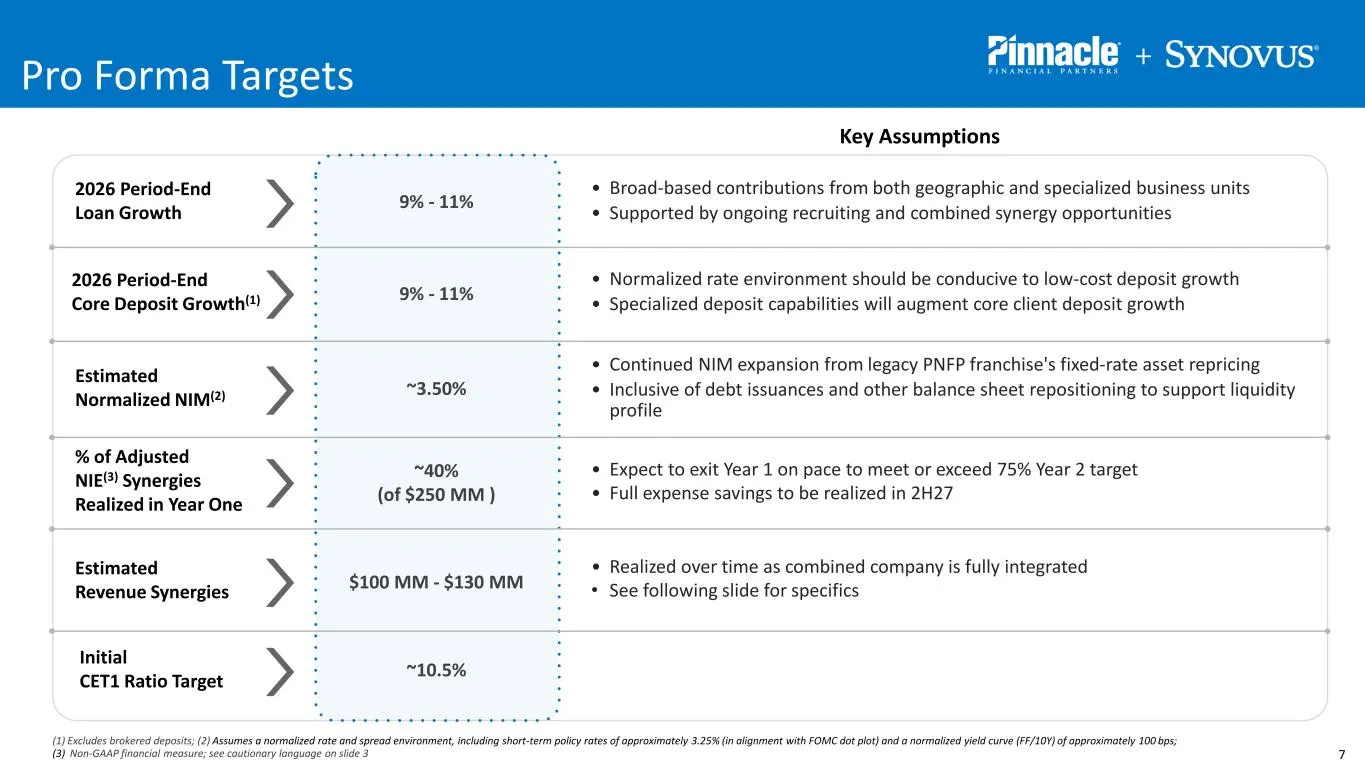
Slide 7: 2026 Key Assumptions and Pro Forma Targets
7 Key Assumptions 2026 Period-End Loan Growth 2026 Period-End Core Deposit Growth(1) Estimated Normalized NIM(2) % of Adjusted NIE(3) Synergies Realized in Year One Initial CET1 Ratio Target Estimated Revenue Synergies • Normalized rate environment should be conducive to low-cost deposit growth • Sp
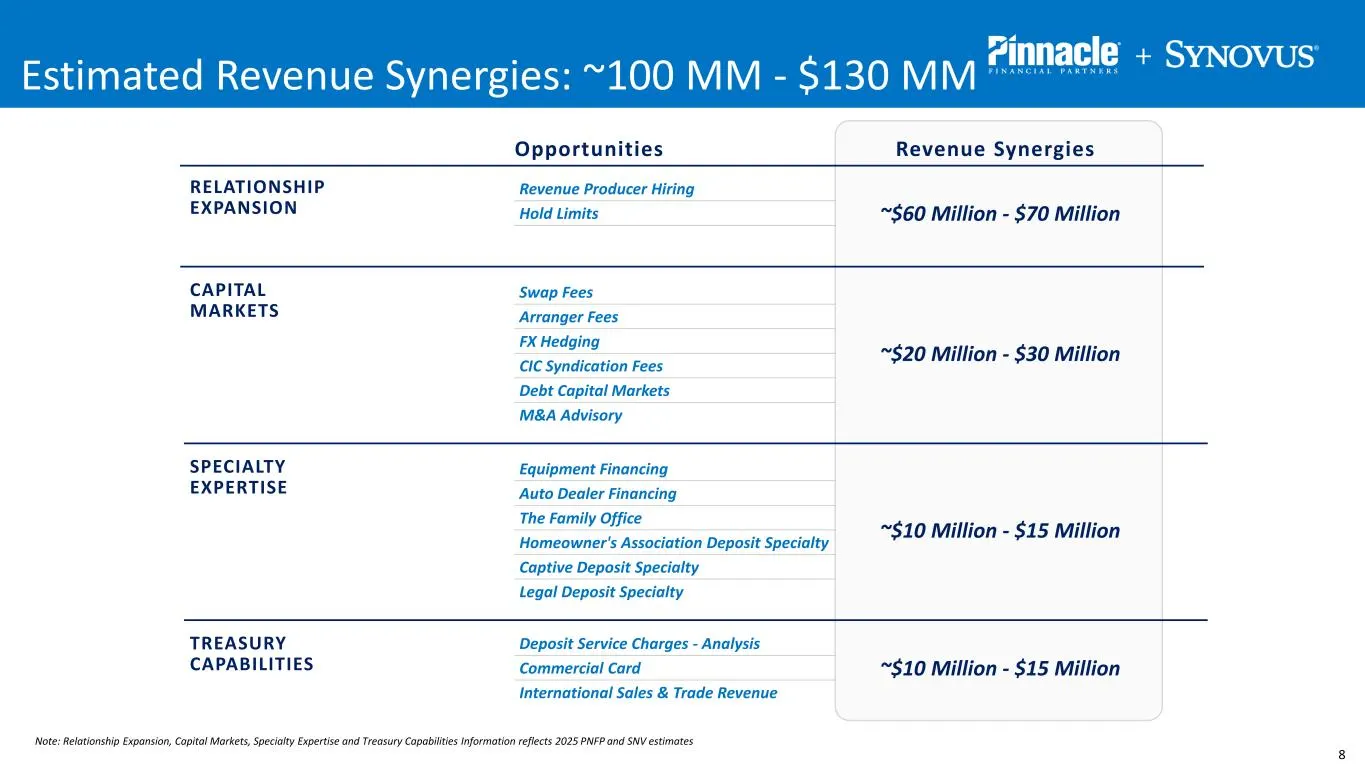
Slide 8: Revenue Synergies Opportunities
8 RELATIONSHIP EXPANSION CAPITAL MARKETS SPECIALTY EXPERTISE TREASURY CAPABILITIES Opportunities Revenue Synergies Estimated Revenue Synergies: ~100 MM - $130 MM Revenue Producer Hiring ~$60 Million - $70 MillionHold Limits Swap Fees ~$20 Million - $30 Million Arranger Fees FX Hedging CIC Syndicatio
Slide 9: NIM Run-Rate Net Interest Margin
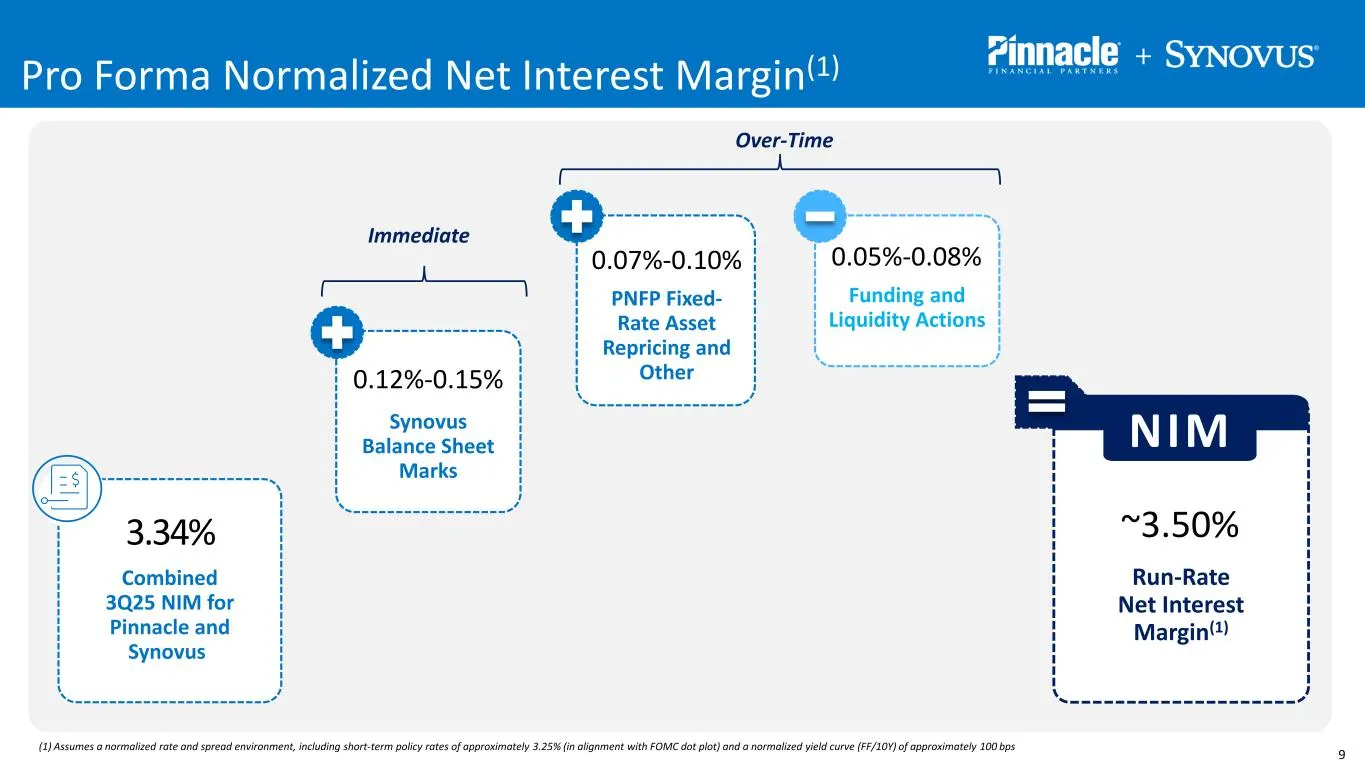
9 NIM Run-Rate Net Interest Margin(1) ~3.50%3.34% Combined 3Q25 NIM for Pinnacle and Synovus Synovus Balance Sheet Marks 0.12%-0.15% 0.05%-0.08% Funding and Liquidity Actions PNFP Fixed- Rate Asset Repricing and Other 0.07%-0.10% Pro Forma Normalized Net Interest Margin(1) (1) Assumes a normalized r
Slide 10: Revenue Producer Hiring Targets
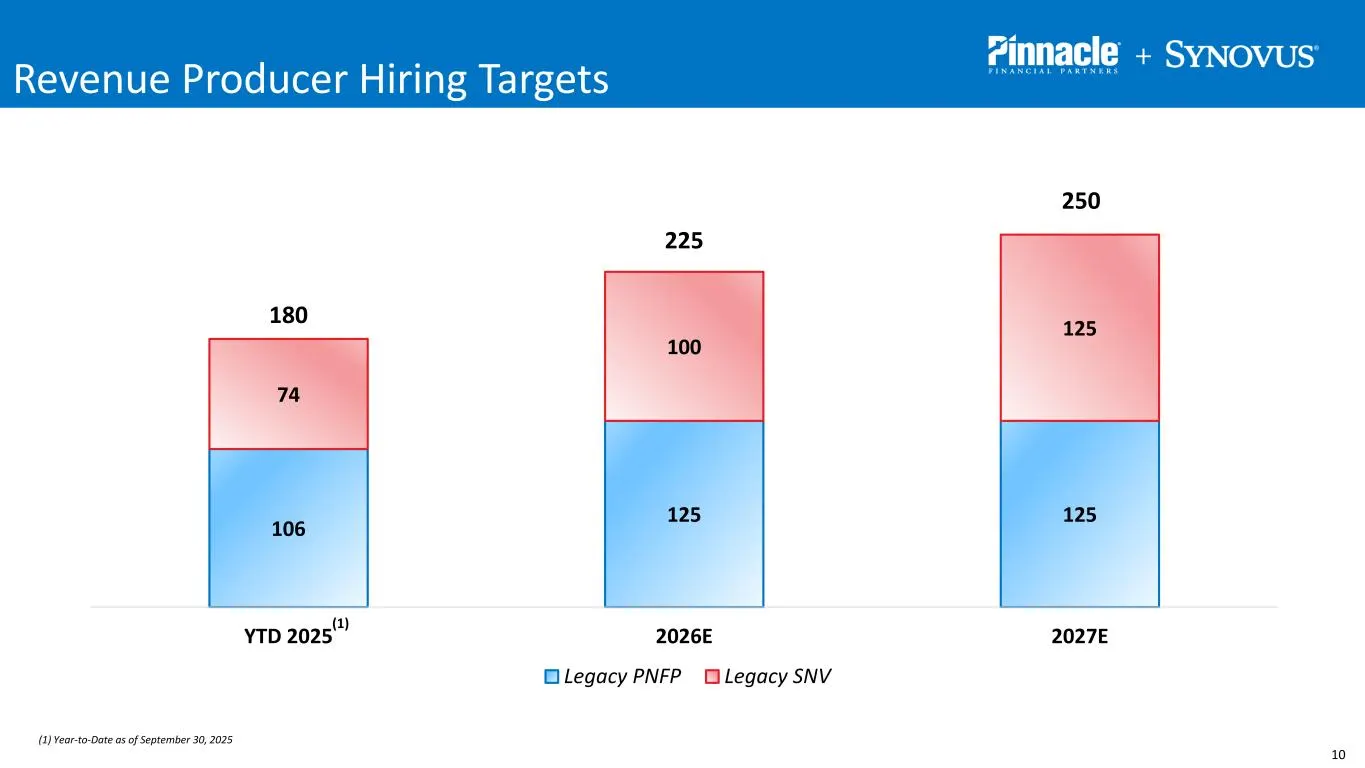
10 Revenue Producer Hiring Targets 106 125 125 74 100 125 YTD 2025 2026E 2027E Legacy PNFP Legacy SNV 225 250 180 (1) (1) Year-to-Date as of September 30, 2025
Slide 11: Pinnacle + Synovus Merger Timeline
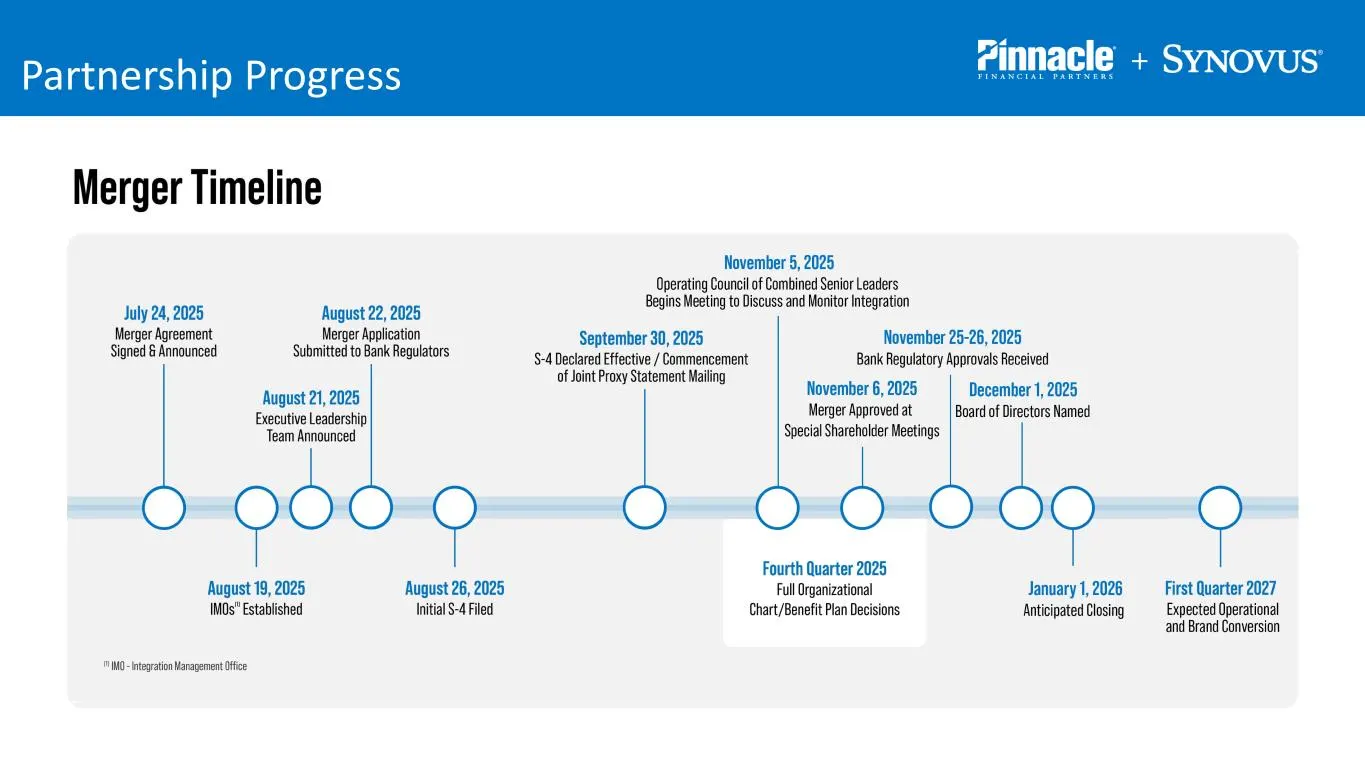
Pinnacle + SYNovuS Partnership Progress Broke Merger Timeline November 5, 2025 Operating Council of Combined Senior Leaders Begins Meeting to Discuss and Monitor Integration July 24, 2025 August 22, 2025 Merger Agreement Merger Application September 30, 2025 November 25-26, 2025 Signed & Announced S
Slide 12: Board of Directors Recently Announced
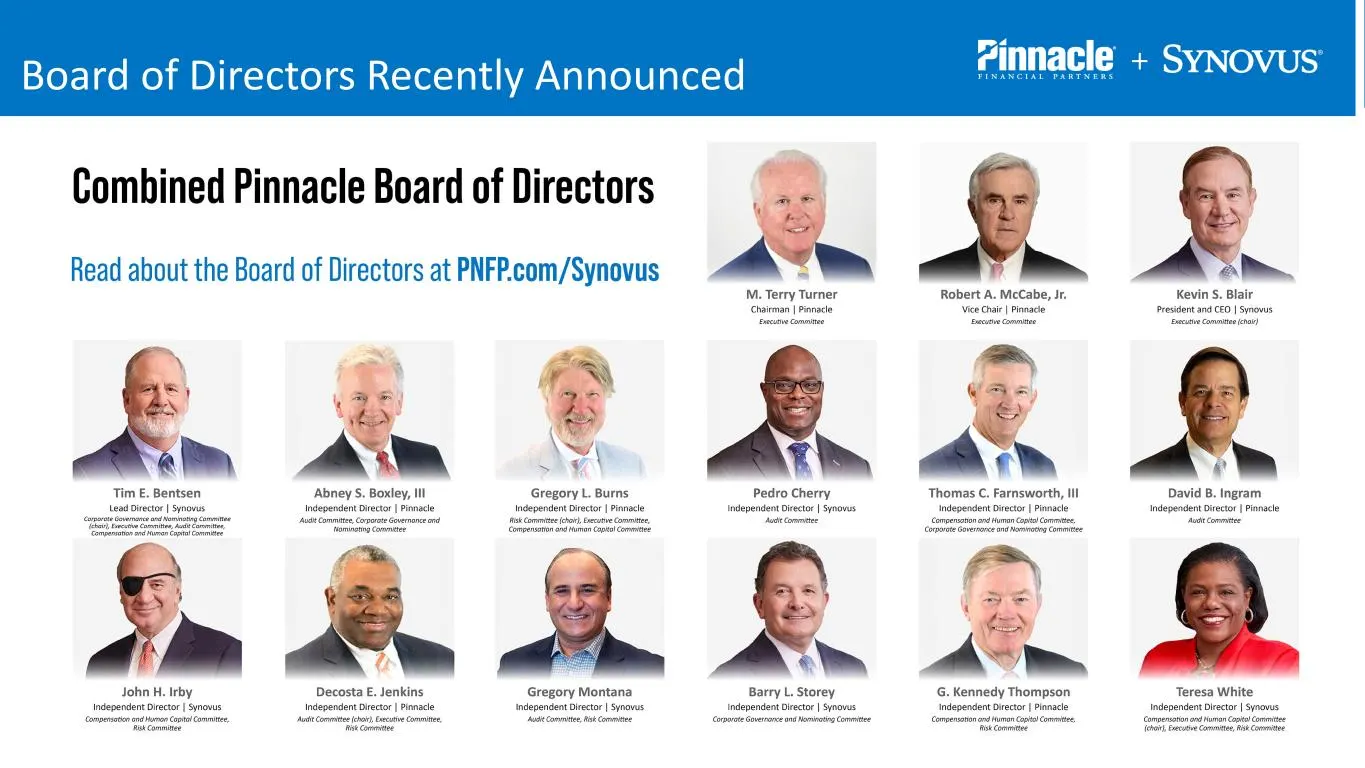
12 Board of Directors Recently Announced

Slide 13: Appendix
13 Appendix
Slide 14: Synovus NDFI Portfolio
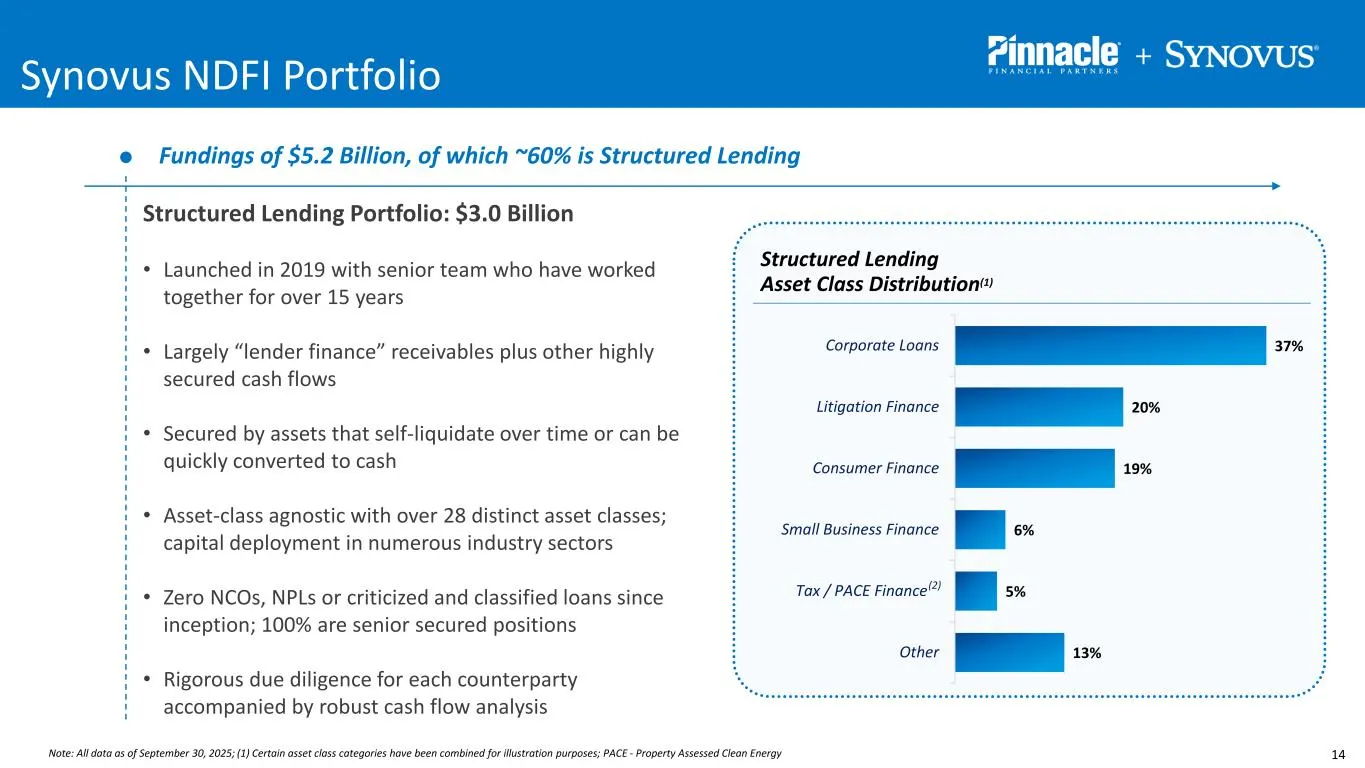
14 37% 20% 19% 6% 5% 13% Corporate Loans Litigation Finance Consumer Finance Small Business Finance Tax / PACE Finance Other Structured Lending Asset Class Distribution(1) Fundings of $5.2 Billion, of which ~60% is Structured Lending Structured Lending Portfolio: $3.0 Billion • Launched in 2019 with
Slide 15: Synovus Non-GAAP Financial Measures
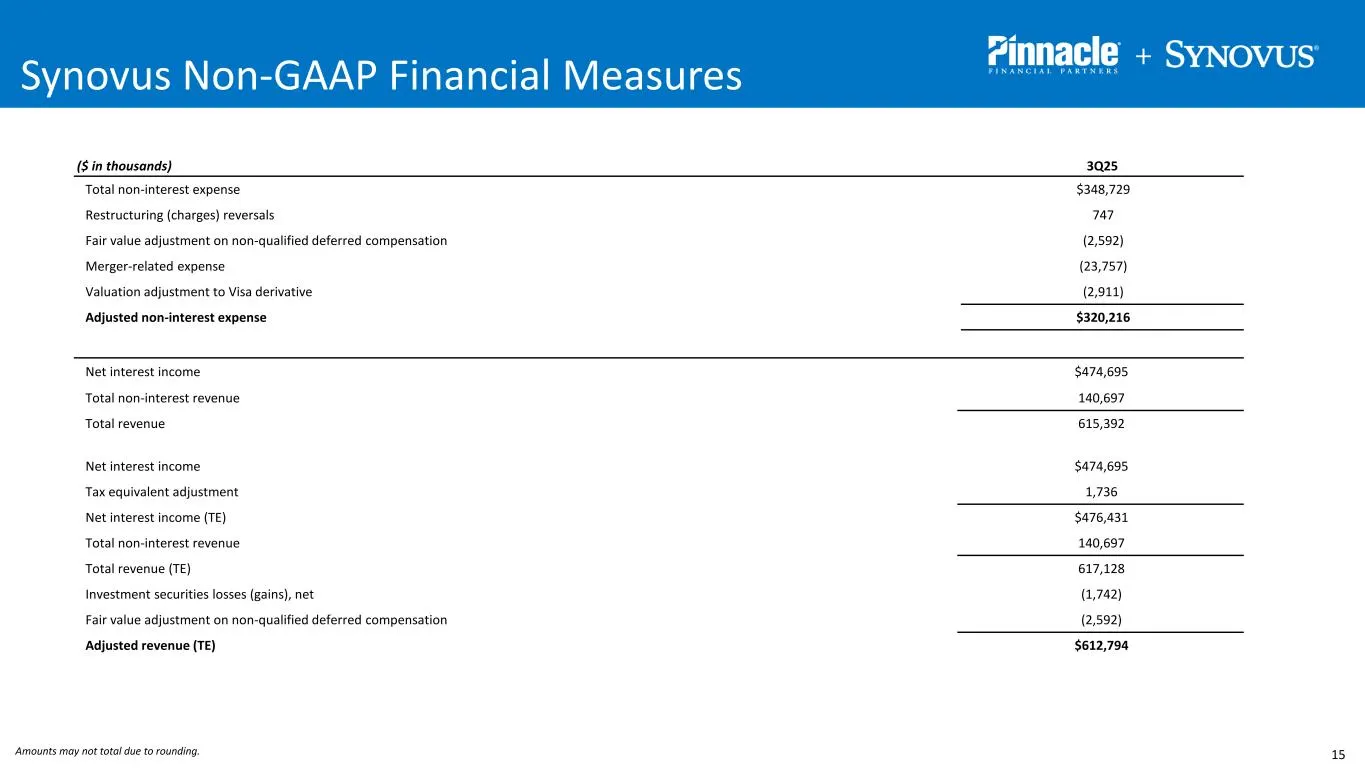
15 Synovus Non-GAAP Financial Measures Amounts may not total due to rounding. ($ in thousands) 3Q25 Total non-interest expense $348,729 Restructuring (charges) reversals 747 Fair value adjustment on non-qualified deferred compensation (2,592) Merger-related expense (23,757) Valuation adjustment to V
Source: SEC EDGAR · 8-K filed Dec 8, 2025
More decks from Synovus Financial Corp
 Debt Investor Presentation (December 2025)9 slides · Dec 1, 2025
 Merger or Acquisition (November 2025)5 slides · Nov 26, 2025
 Merger or Acquisition (November 2025)6 slides · Nov 6, 2025
 Q3 2025 Earnings Presentation47 slides · Oct 16, 2025
 Merger or Acquisition (August 2025)27 slides · Aug 28, 2025
 Merger or Acquisition (July 2025)33 slides · Jul 24, 2025