Cirrus Logic, Inc. · NASDAQ:CRUS
Cirrus Logic — Investor Presentation (February 2018)
22 slides from Cirrus Logic's investor presentation, Feb 5, 2018
Slide 1: Investor Presentation
Investor Presentation As of February 5, 2018 Advanced Signal Processing Products
Slide 2: Safe Harbor Statement
Safe Harbor Statement Except for historical information contained herein, the matters set forth in this presentation contain forward-looking statements, including industry market projections; our revenue growth opportunities; our forecasted revenue, gross margin and R&D and SG&A expenses; and our es
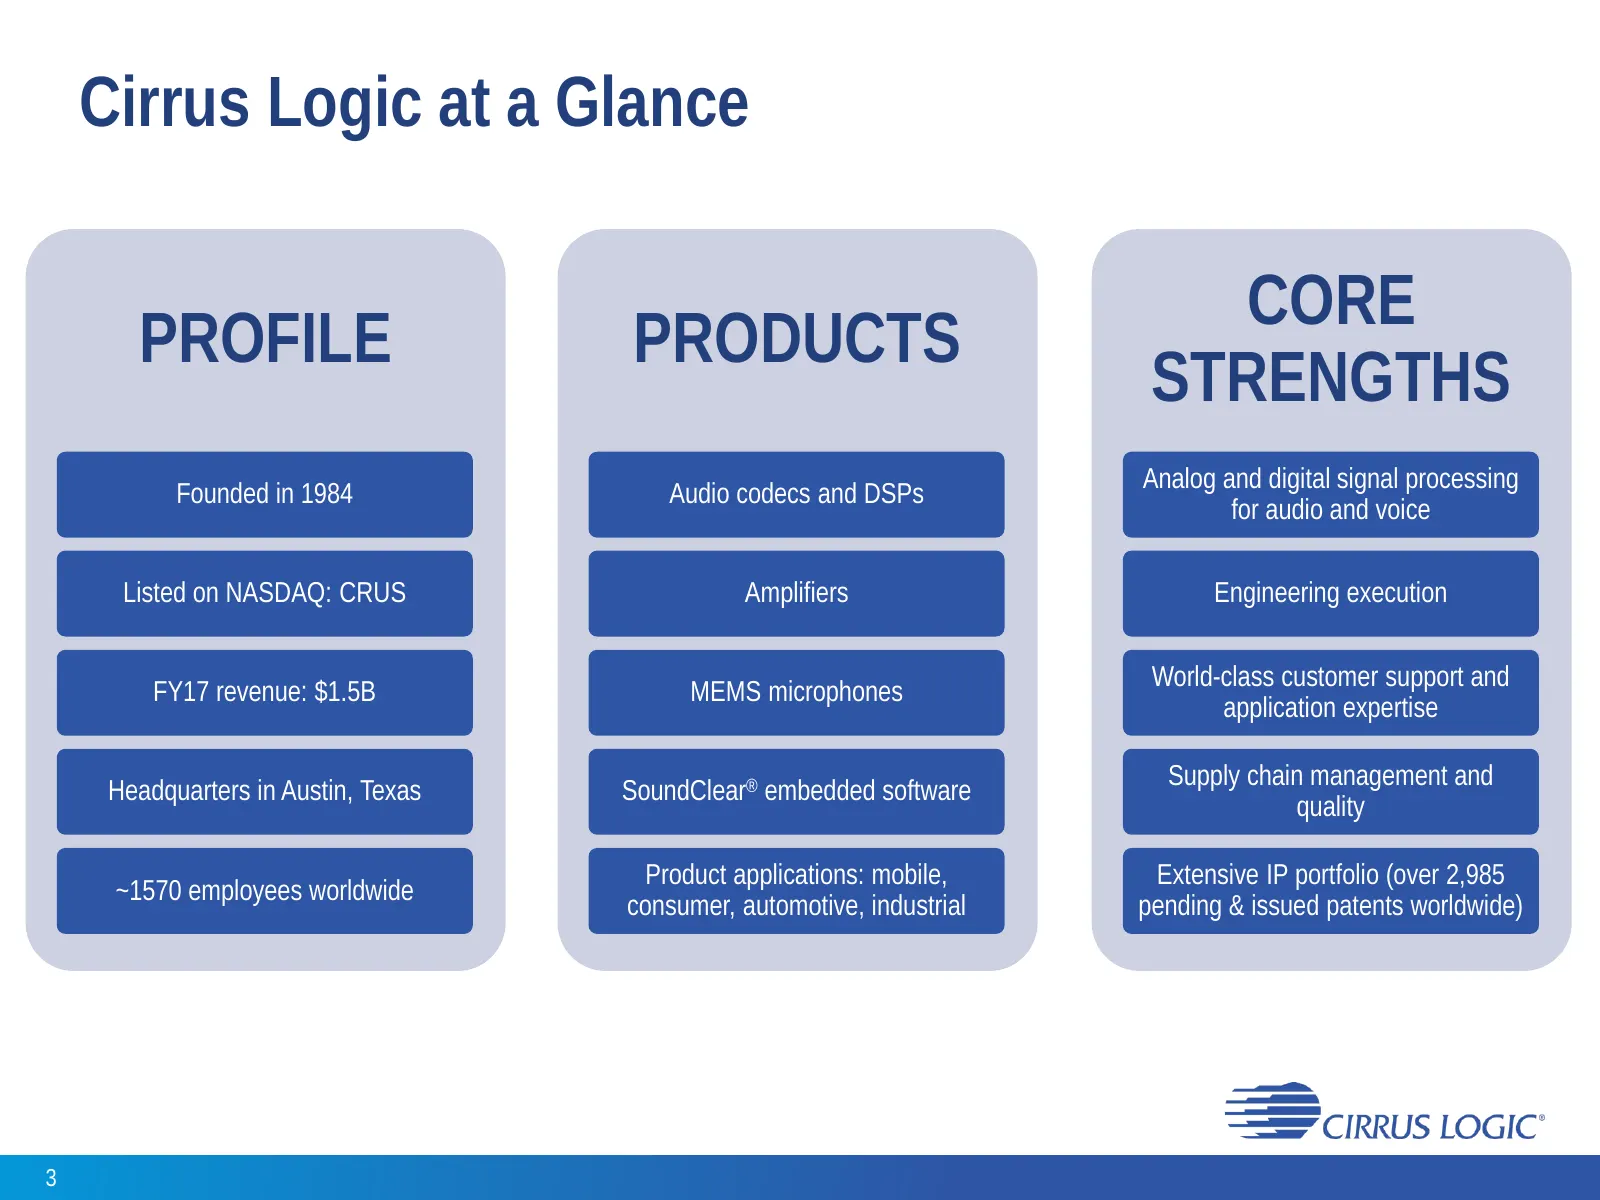
Slide 3: Cirrus Logic at a Glance
Cirrus Logic at a Glance CORE PROFILE PRODUCTS STRENGTHS Analog and digital signal processing Founded in 1984 Audio codecs and DSPs for audio and voice Listed on NASDAQ: CRUS Amplifiers Engineering execution World-class customer support and FY17 revenue: $1.5B MEMS microphones application expertise
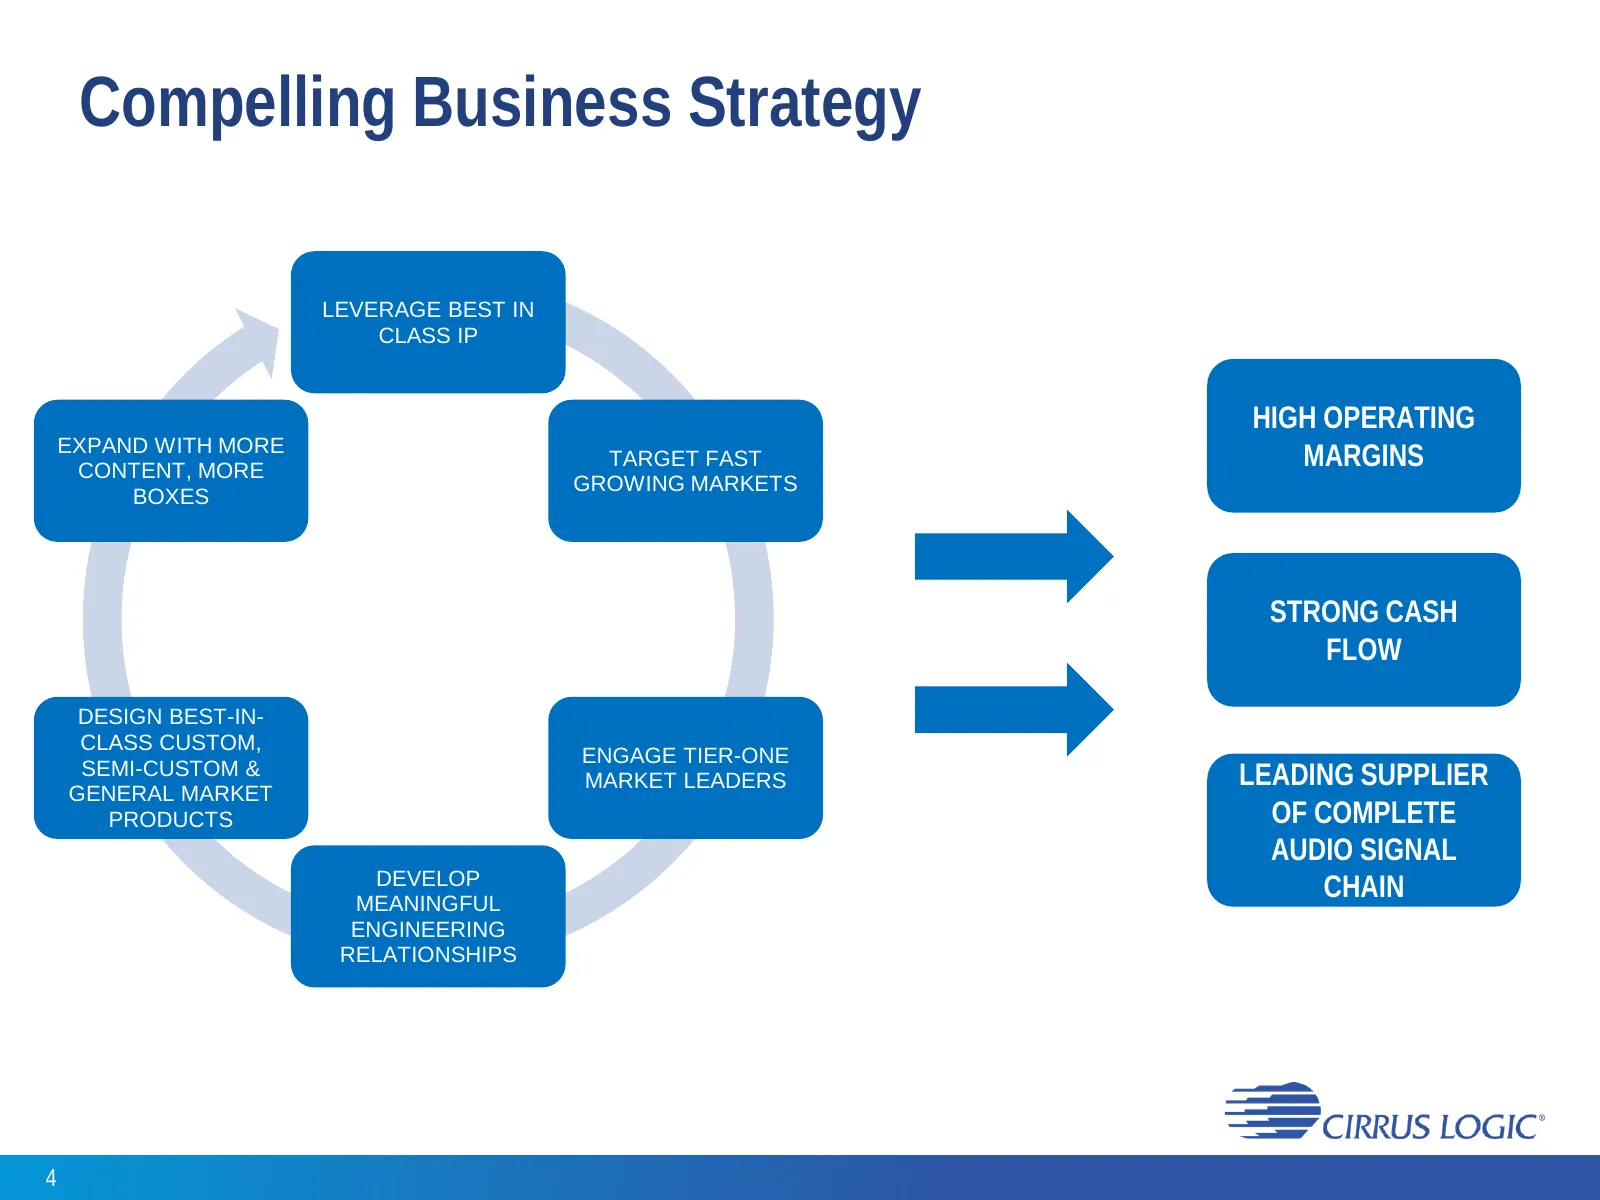
Slide 4: Compelling Business Strategy
Compelling Business Strategy LEVERAGE BEST IN CLASS IP HIGH OPERATING EXPAND WITH MORE CONTENT, MORE TARGET FAST MARGINS GROWING MARKETS BOXES STRONG CASH FLOW DESIGN BEST-IN- CLASS CUSTOM, ENGAGE TIER-ONE SEMI-CUSTOM & MARKET LEADERS LEADING SUPPLIER GENERAL MARKET PRODUCTS OF COMPLETE AUDIO SIGNAL
Slide 5: Continuous Investment in Innovation
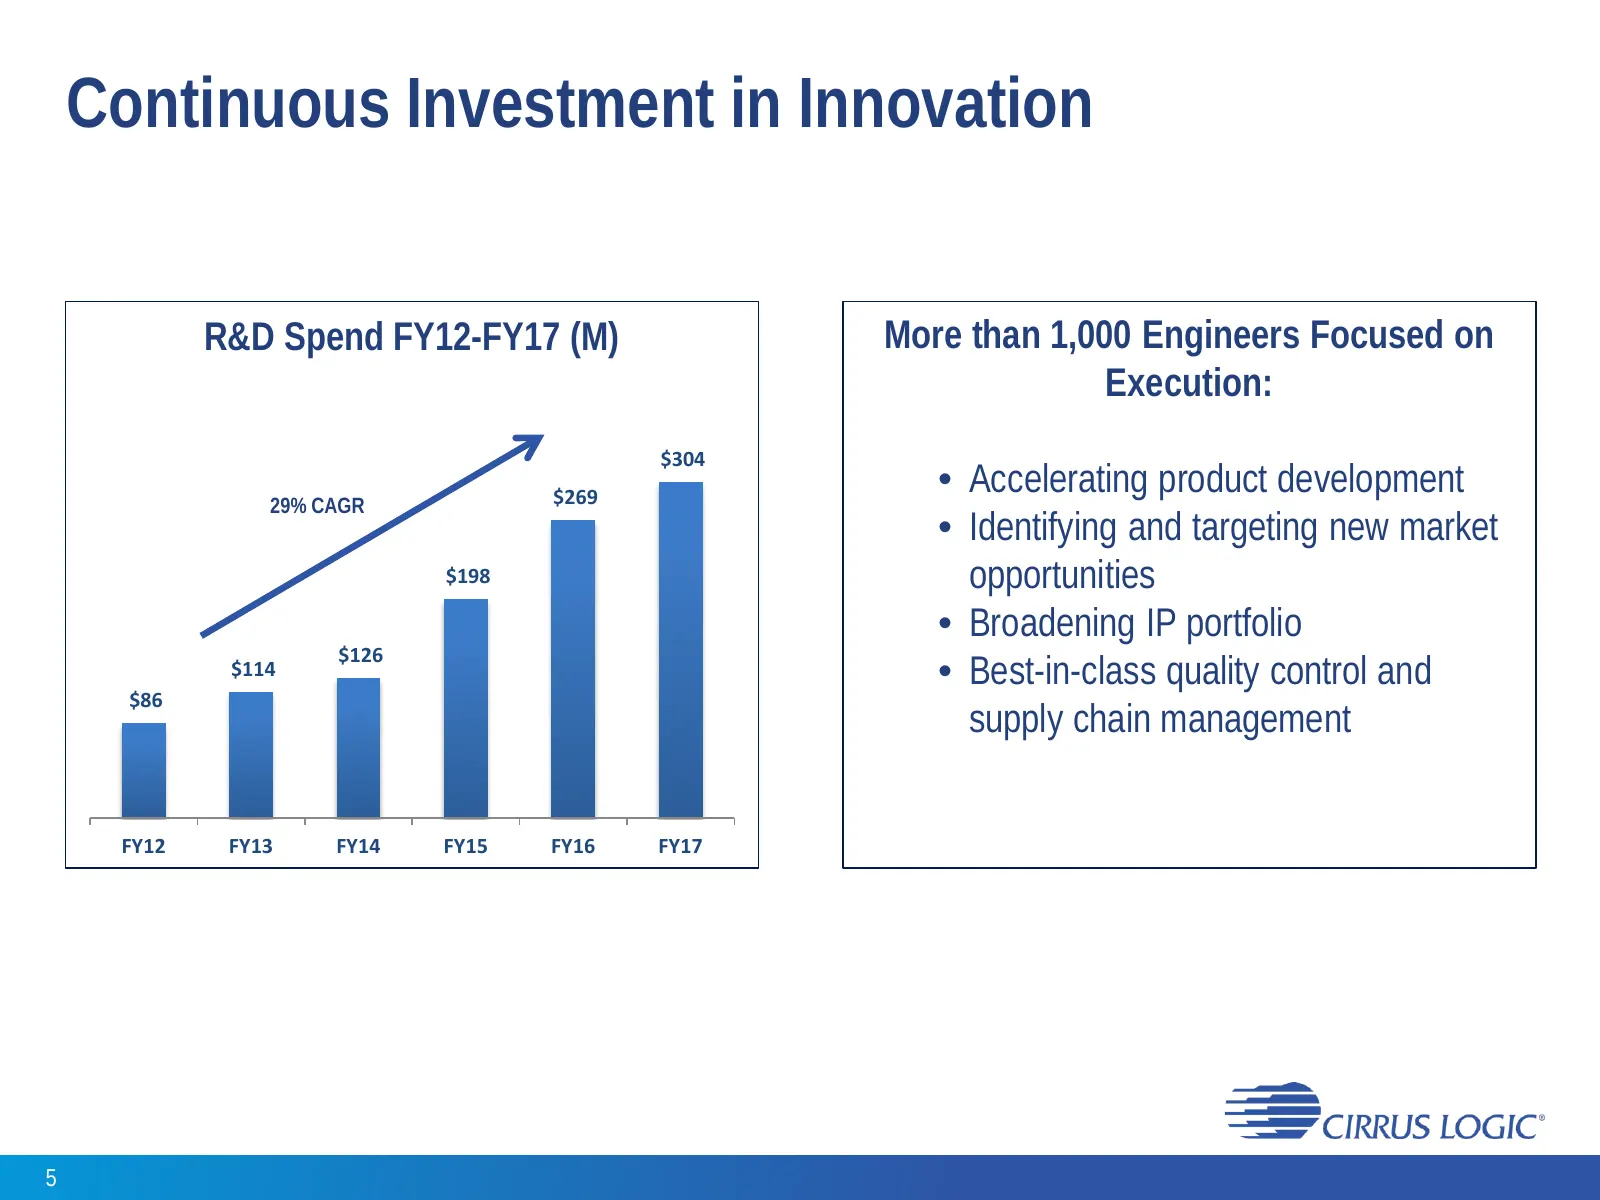
Continuous Investment in Innovation R&D Spend FY12-FY17 (M) More than 1,000 Engineers Focused on Execution: $304 $269 • Accelerating product development 29% CAGR • Identifying and targeting new market $198 opportunities • Broadening IP portfolio $126 $114 • Best-in-class quality control and $86 supp
Slide 6: Long-Term Track Record of Growth
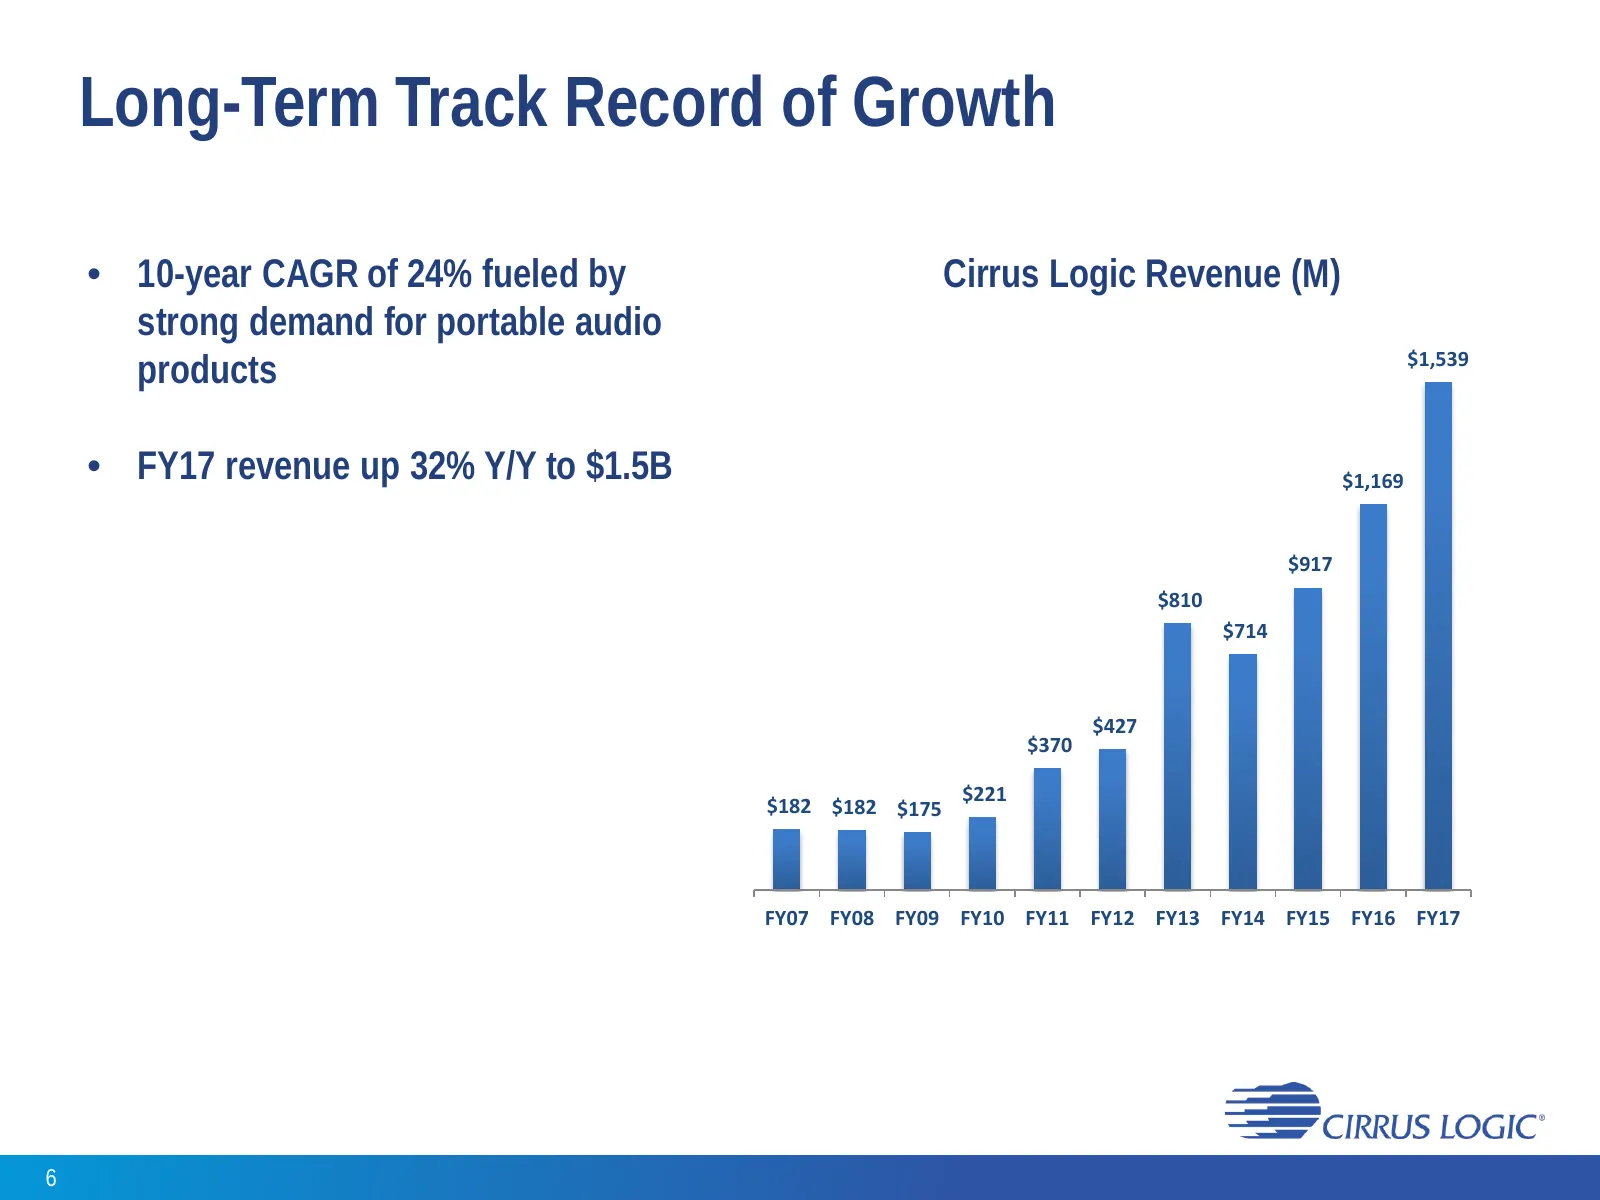
Long-Term Track Record of Growth • 10-year CAGR of 24% fueled by Cirrus Logic Revenue (M) strong demand for portable audio products $1,539 • FY17 revenue up 32% Y/Y to $1.5B $1,169 $917 $810 $714 $427 $370 $221 $182 $182 $175 FY07 FY08 FY09 FY10 FY11 FY12 FY13 FY14 FY15 FY16 FY17 6
Slide 7: Focus on Tier One Customers
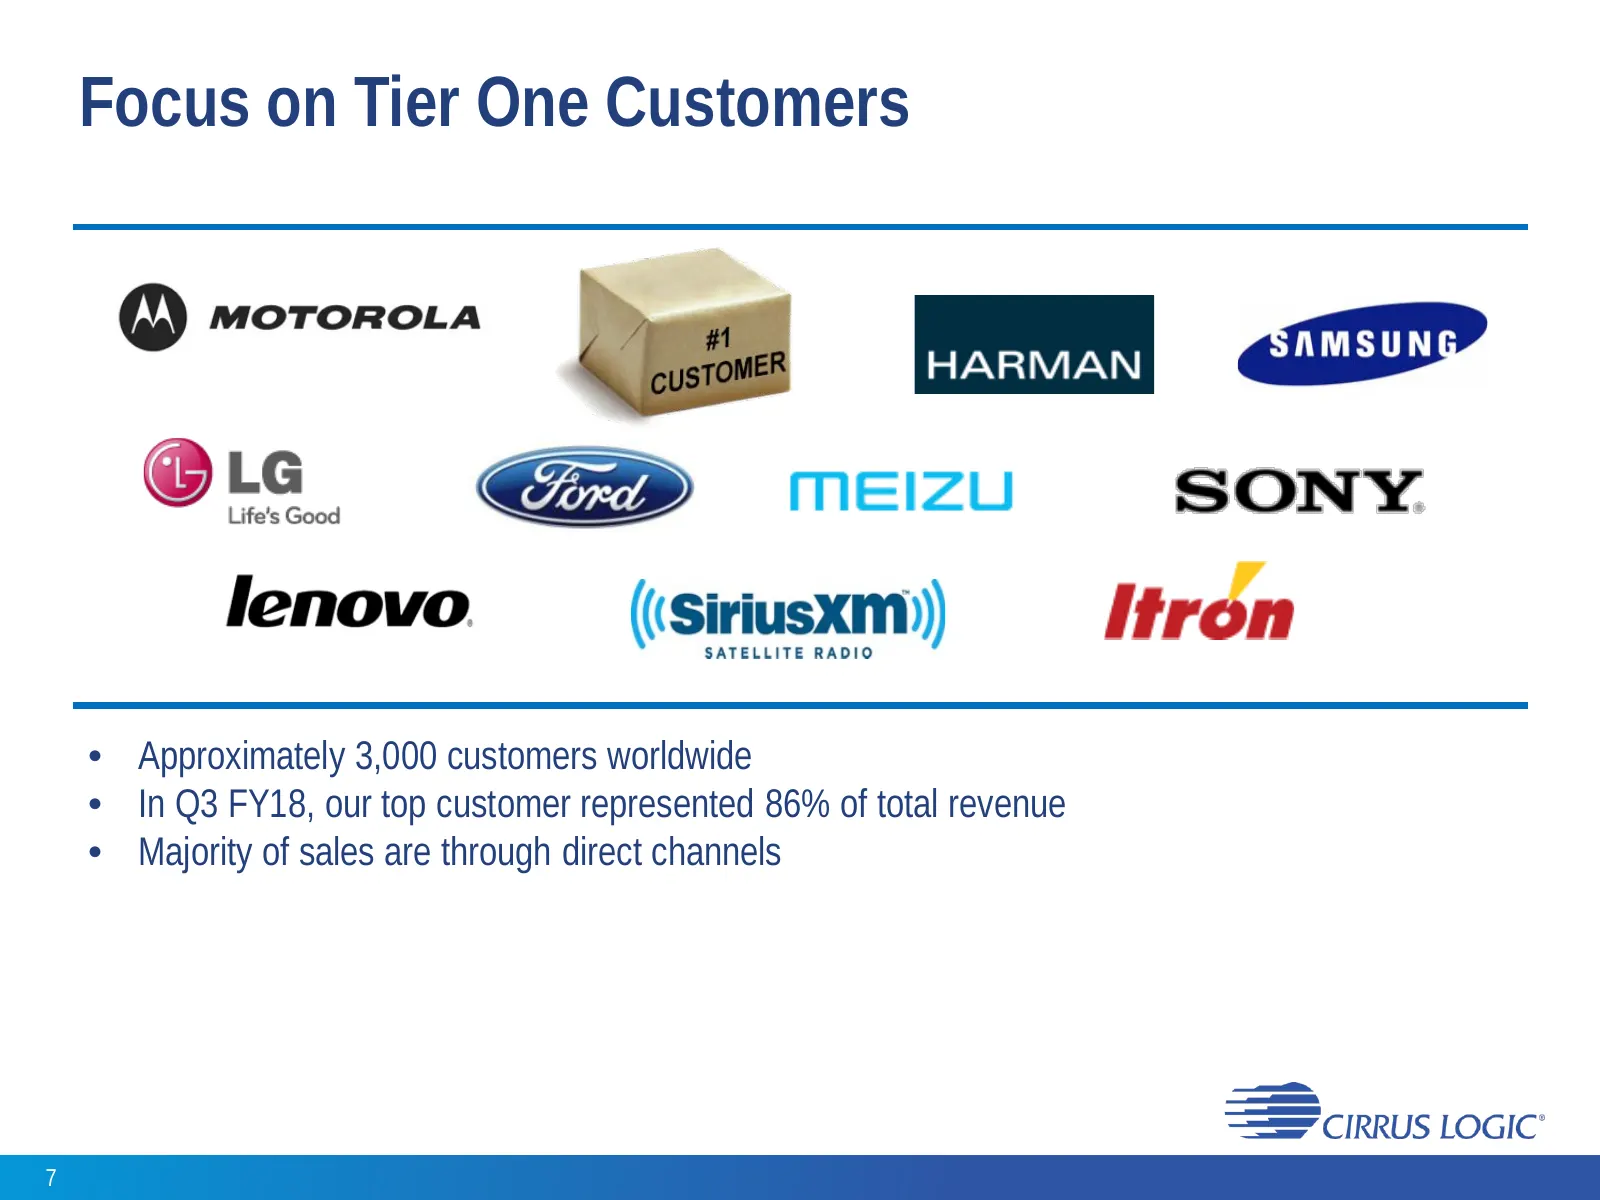
Focus on Tier One Customers • Approximately 3,000 customers worldwide • In Q3 FY18, our top customer represented 86% of total revenue • Majority of sales are through direct channels 7
Slide 8: Unique Corporate Culture
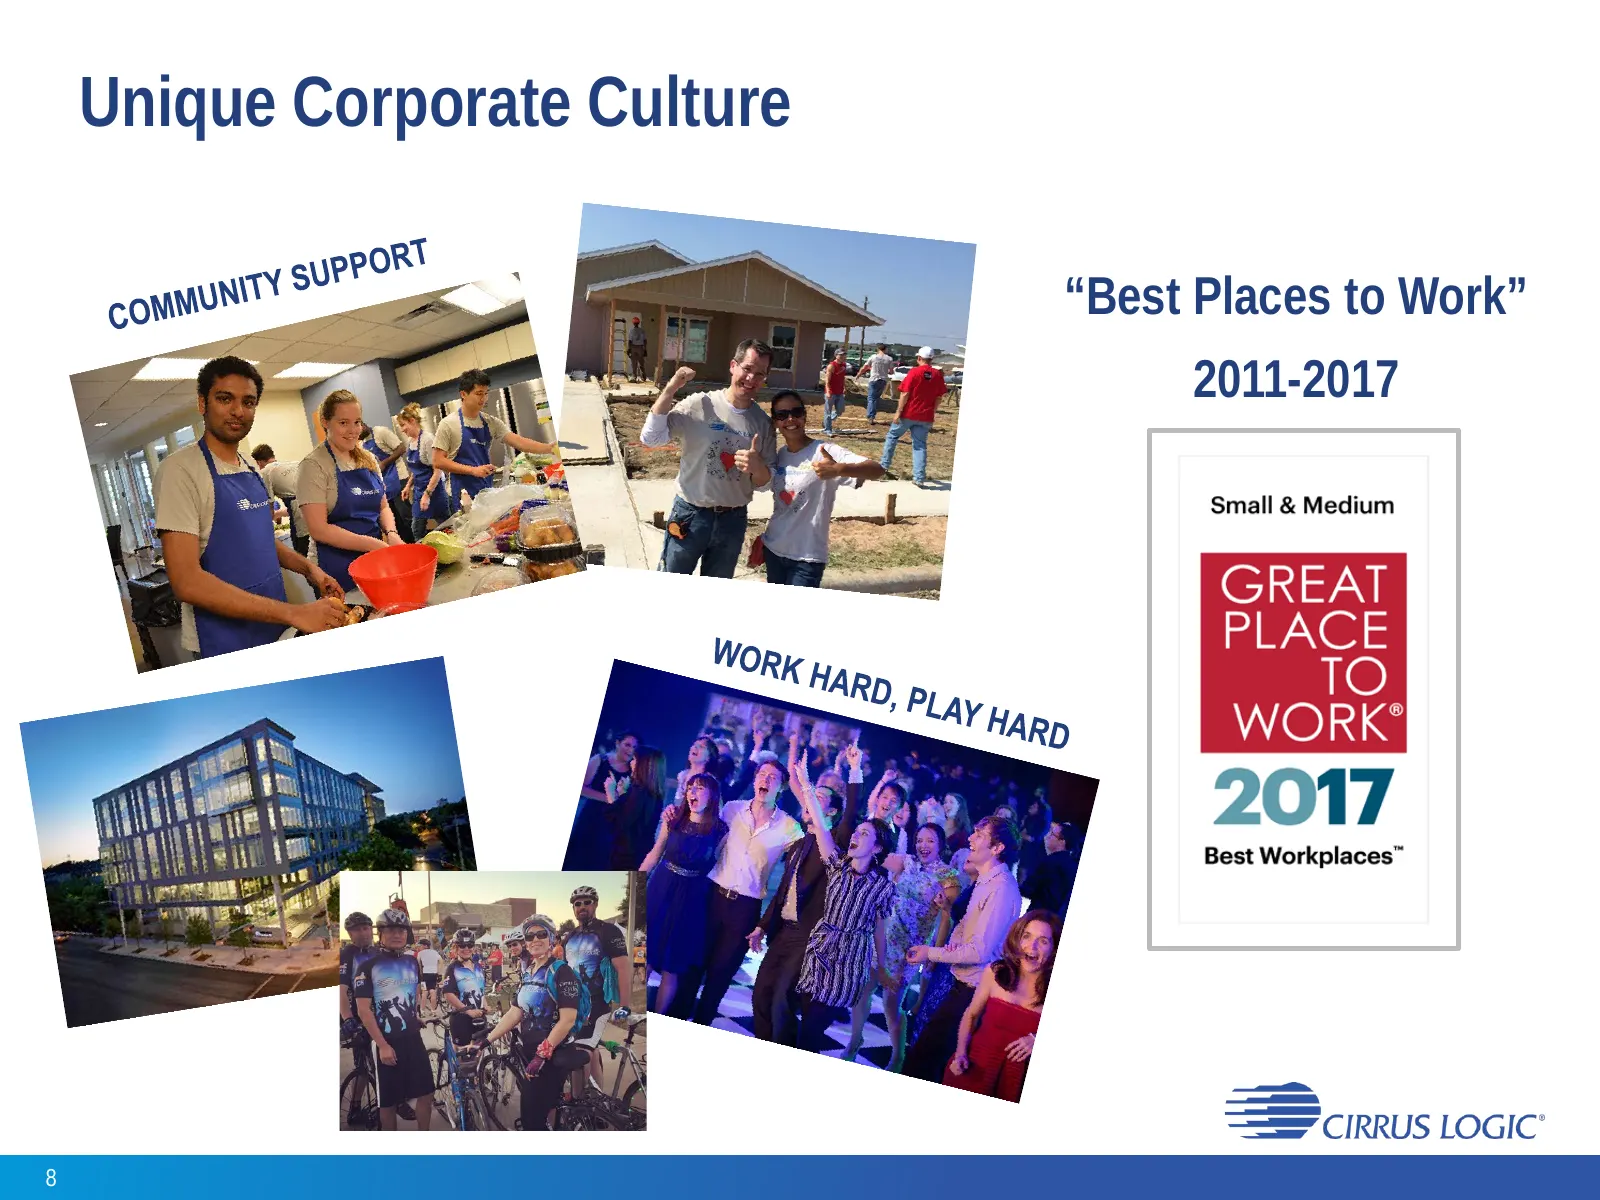
Unique Corporate Culture “Best Places to Work” 2011-2017 8

Slide 9: Market & Product Overview
Market & Product Overview ——w —__" ——— —== —
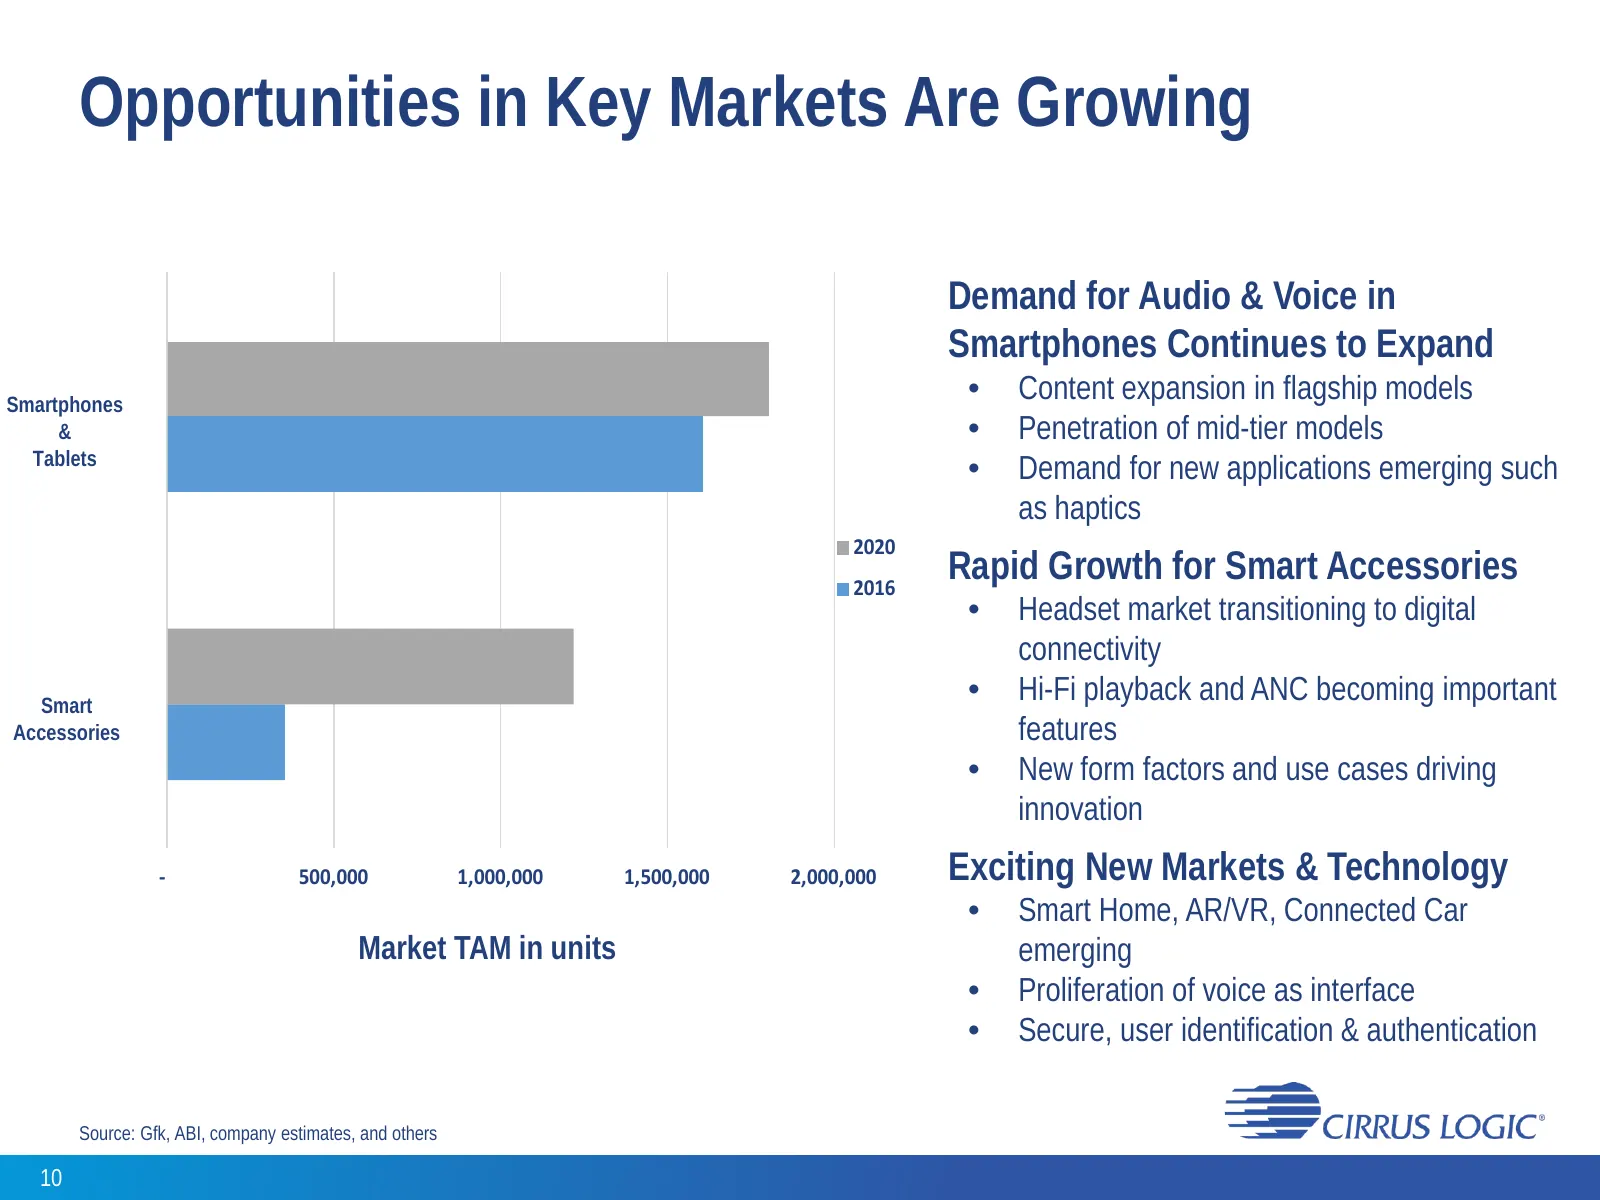
Slide 10: Opportunities in Key Markets Are Growing
Opportunities in Key Markets Are Growing • Demand for Audio & Voice in Smartphones Continues to Expand Smartphones • Content expansion in flagship models & • Penetration of mid-tier models Tablets • Demand for new applications emerging such as haptics 2020 2016 • Rapid Growth for Smart Accessories •
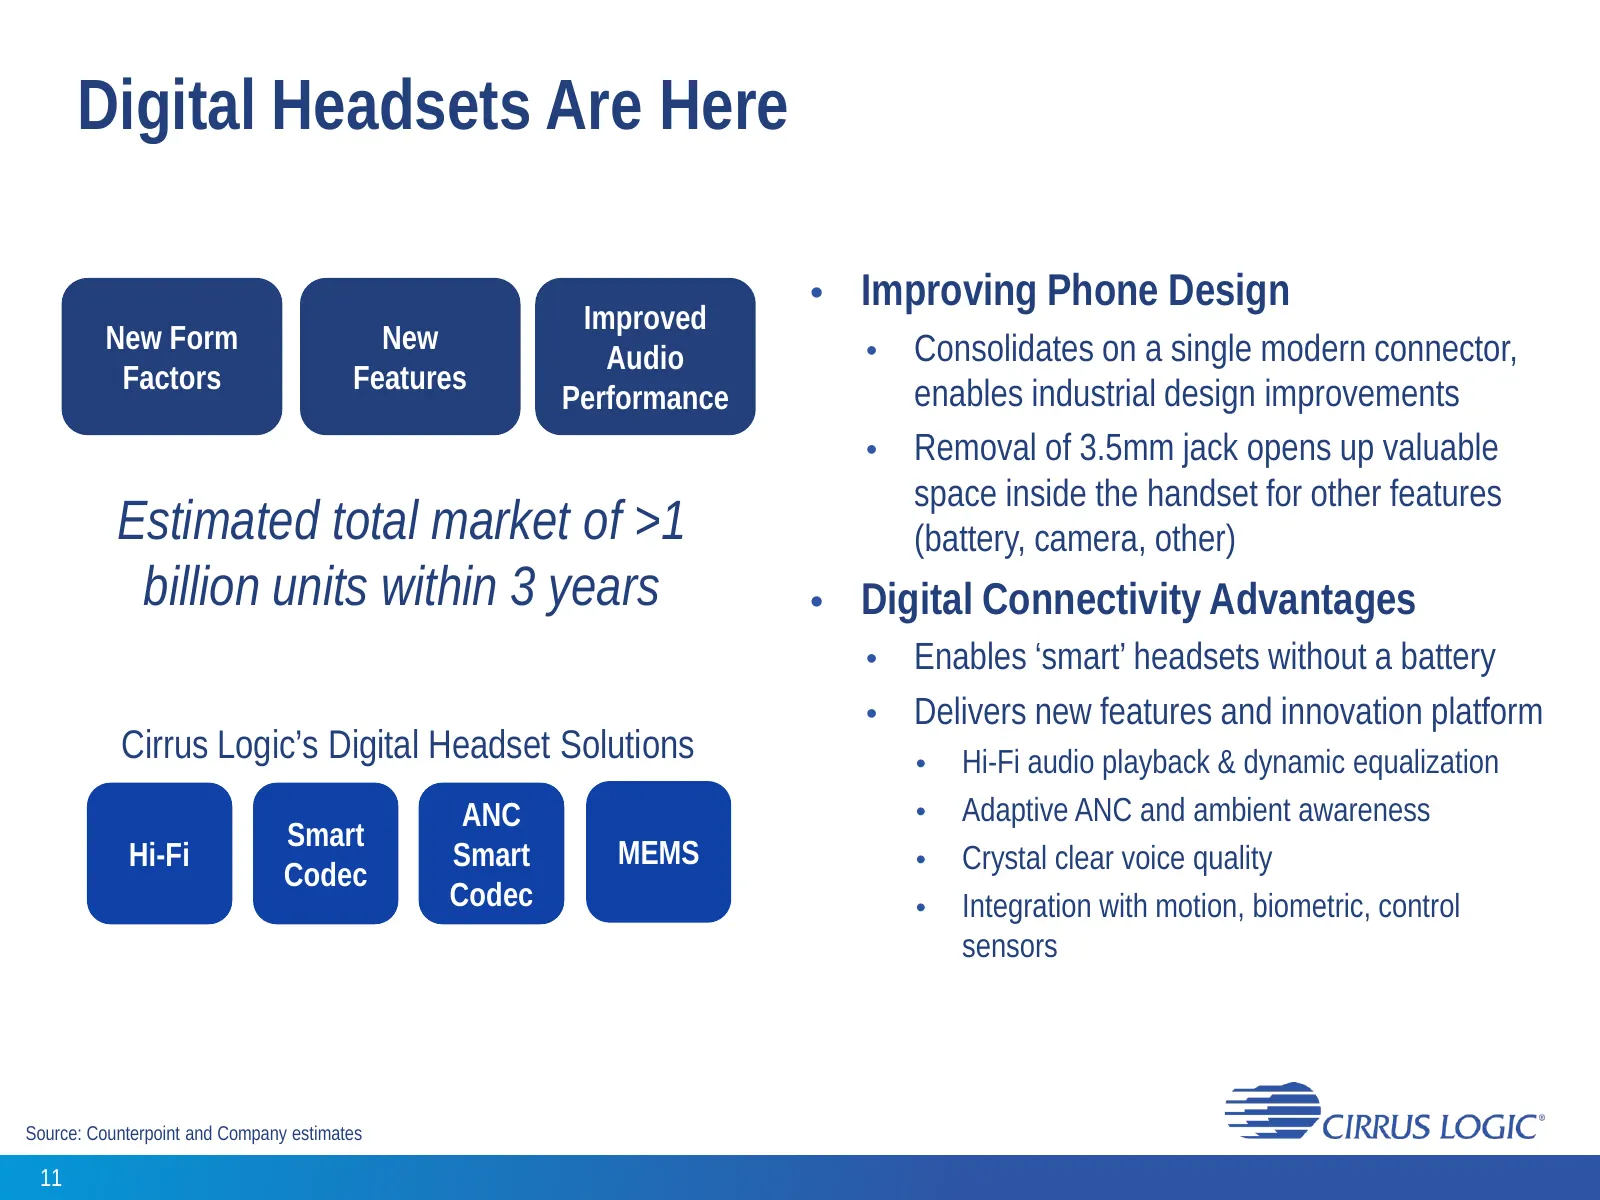
Slide 11: Digital Headsets Are Here
Digital Headsets Are Here • Improving Phone Design Improved New Form New Consolidates on a single modern connector, Audio • Factors Features Performance enables industrial design improvements • Removal of 3.5mm jack opens up valuable space inside the handset for other features Estimated total market
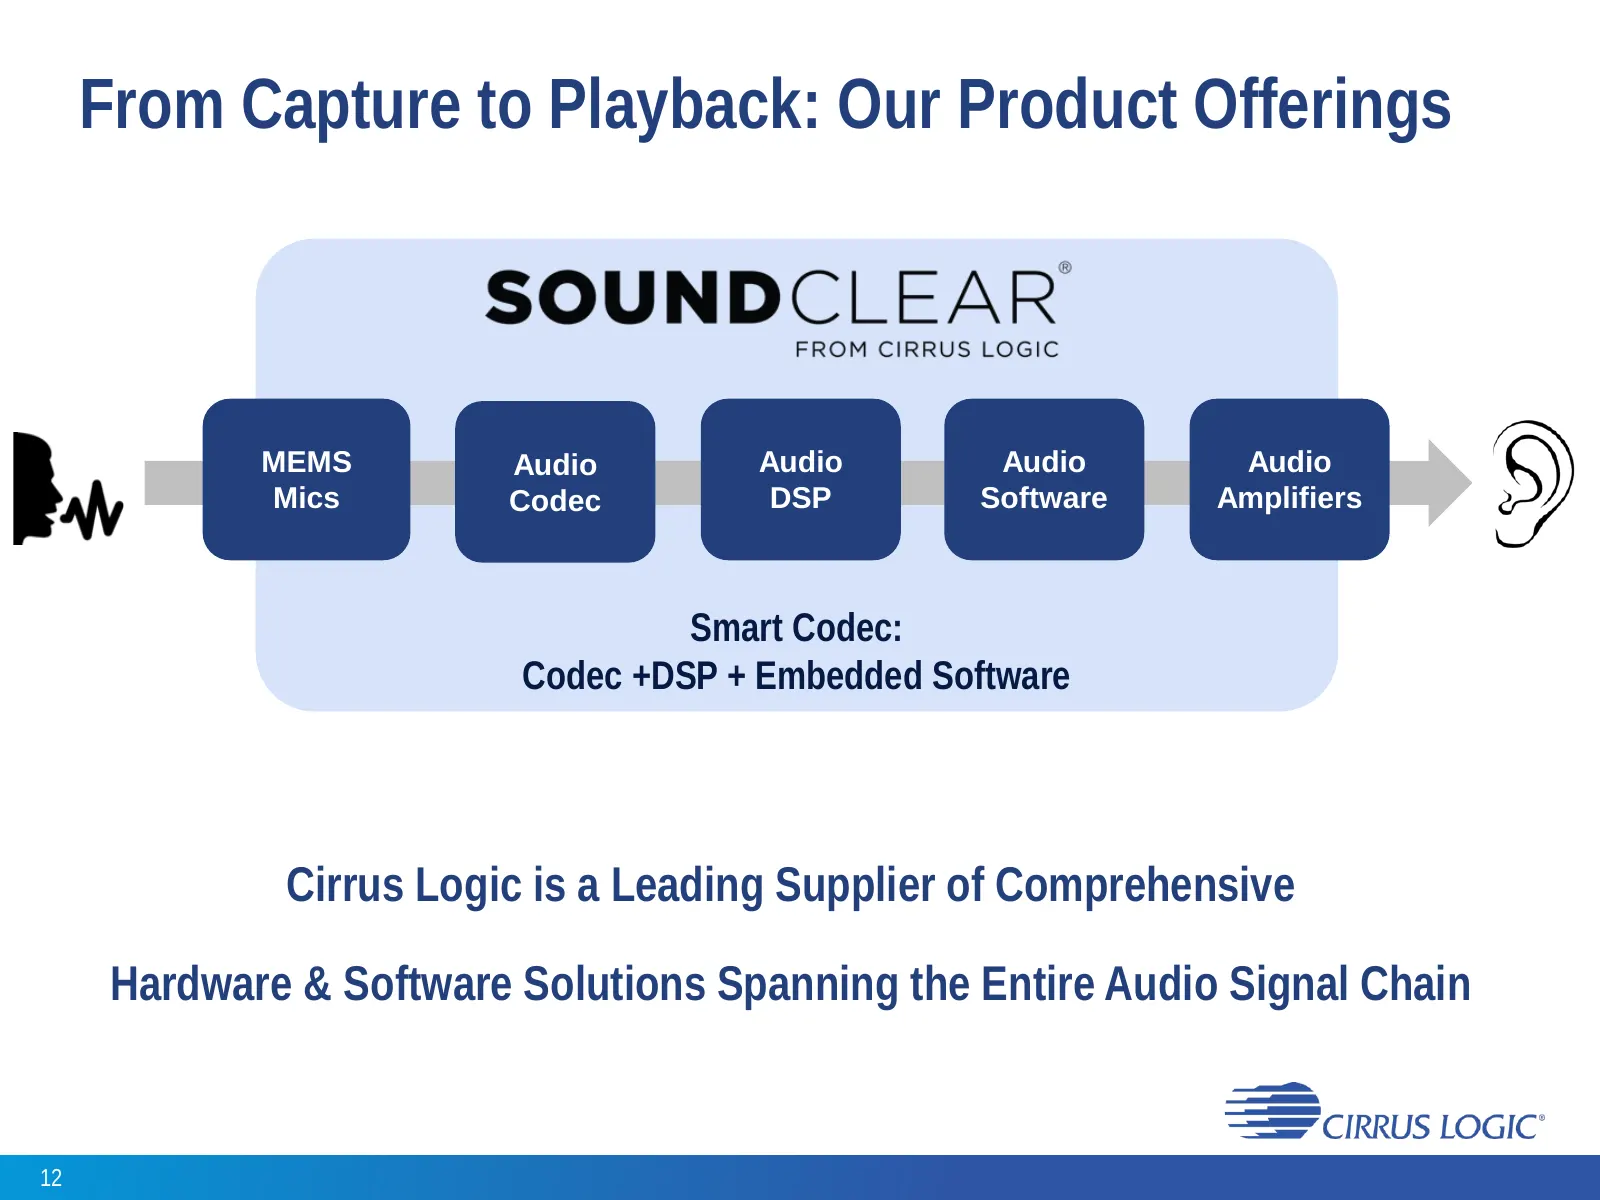
Slide 12: From Capture to Playback: Our Product Offerings
From Capture to Playback: Our Product Offerings MEMS Audio Audio Audio Audio Mics Codec DSP Software Amplifiers Smart Codec: Codec +DSP + Embedded Software Cirrus Logic is a Leading Supplier of Comprehensive Hardware & Software Solutions Spanning the Entire Audio Signal Chain 12
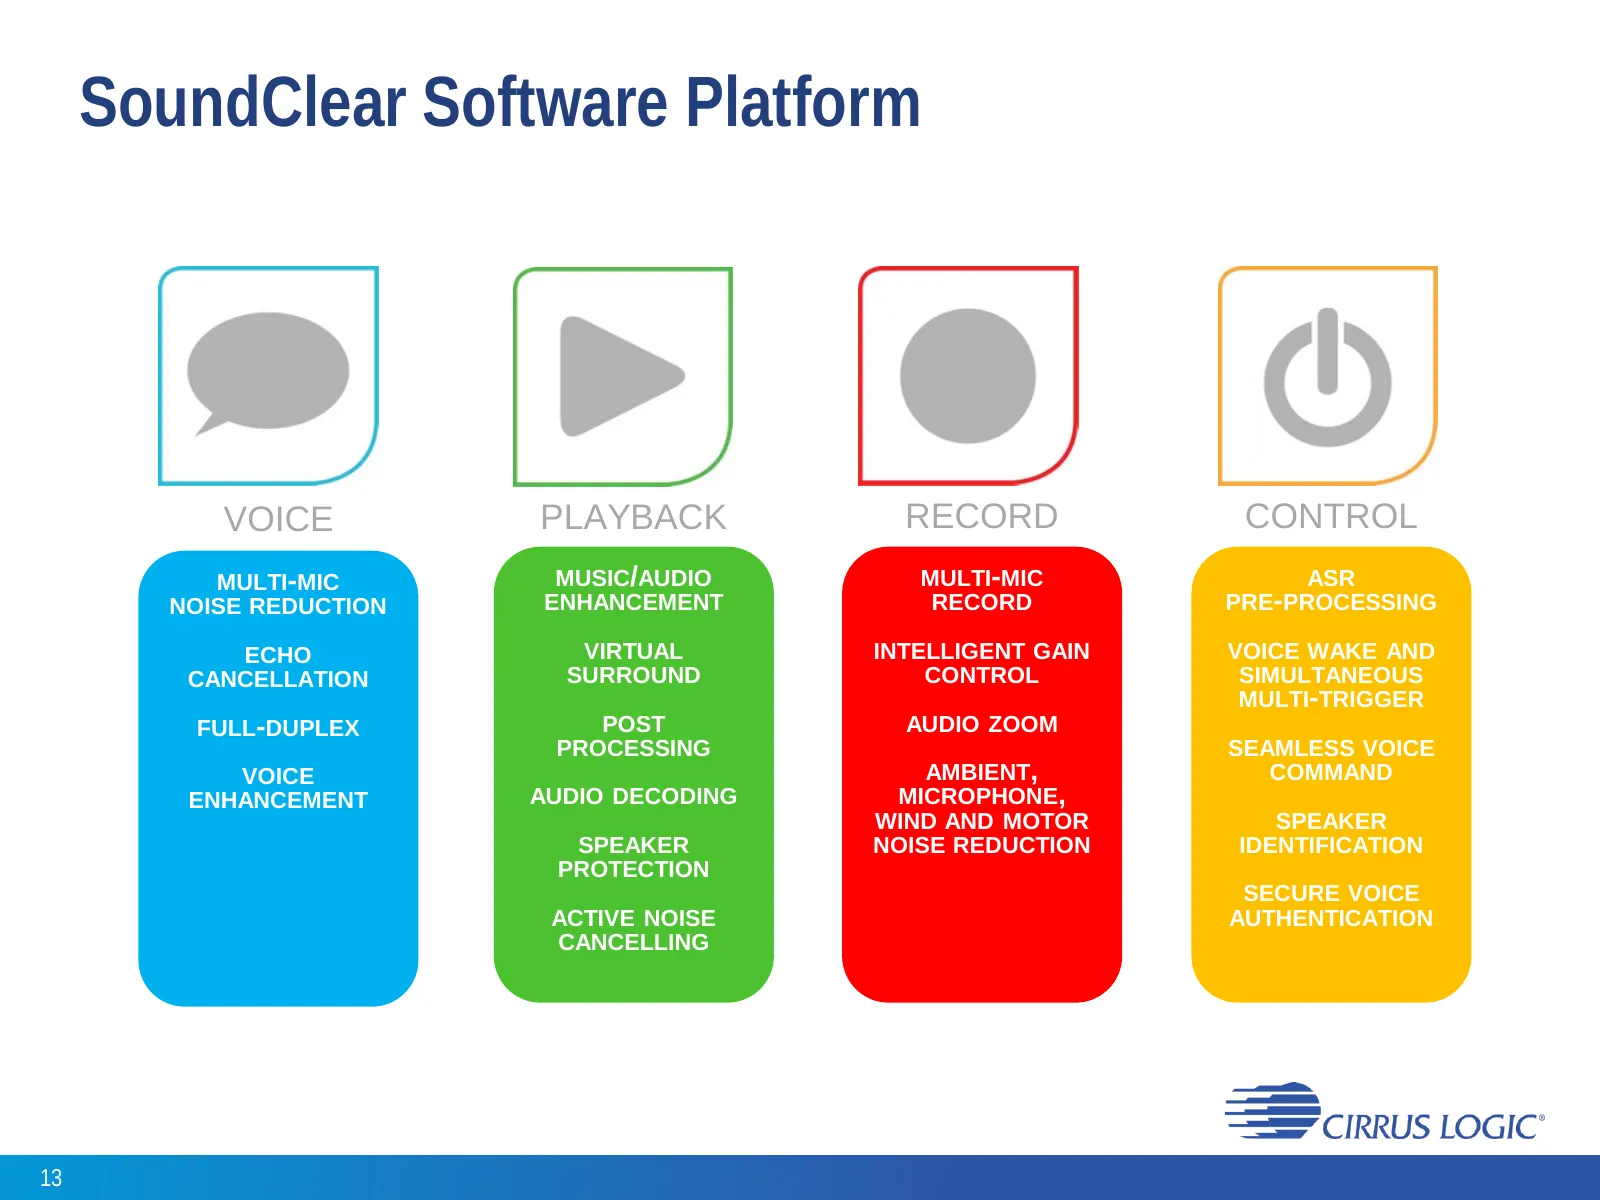
Slide 13: SoundClear Software Platform
SoundClear Software Platform VOICE PLAYBACK RECORD CONTROL MULTI-MIC MUSIC/AUDIO MULTI-MIC ASR NOISE REDUCTION ENHANCEMENT RECORD PRE-PROCESSING ECHO VIRTUAL INTELLIGENT GAIN VOICE WAKE AND CANCELLATION SURROUND CONTROL SIMULTANEOUS MULTI-TRIGGER FULL-DUPLEX POST AUDIO ZOOM PROCESSING SEAMLESS VOICE
Slide 14: Scalable Portfolio Drives New Opportunity
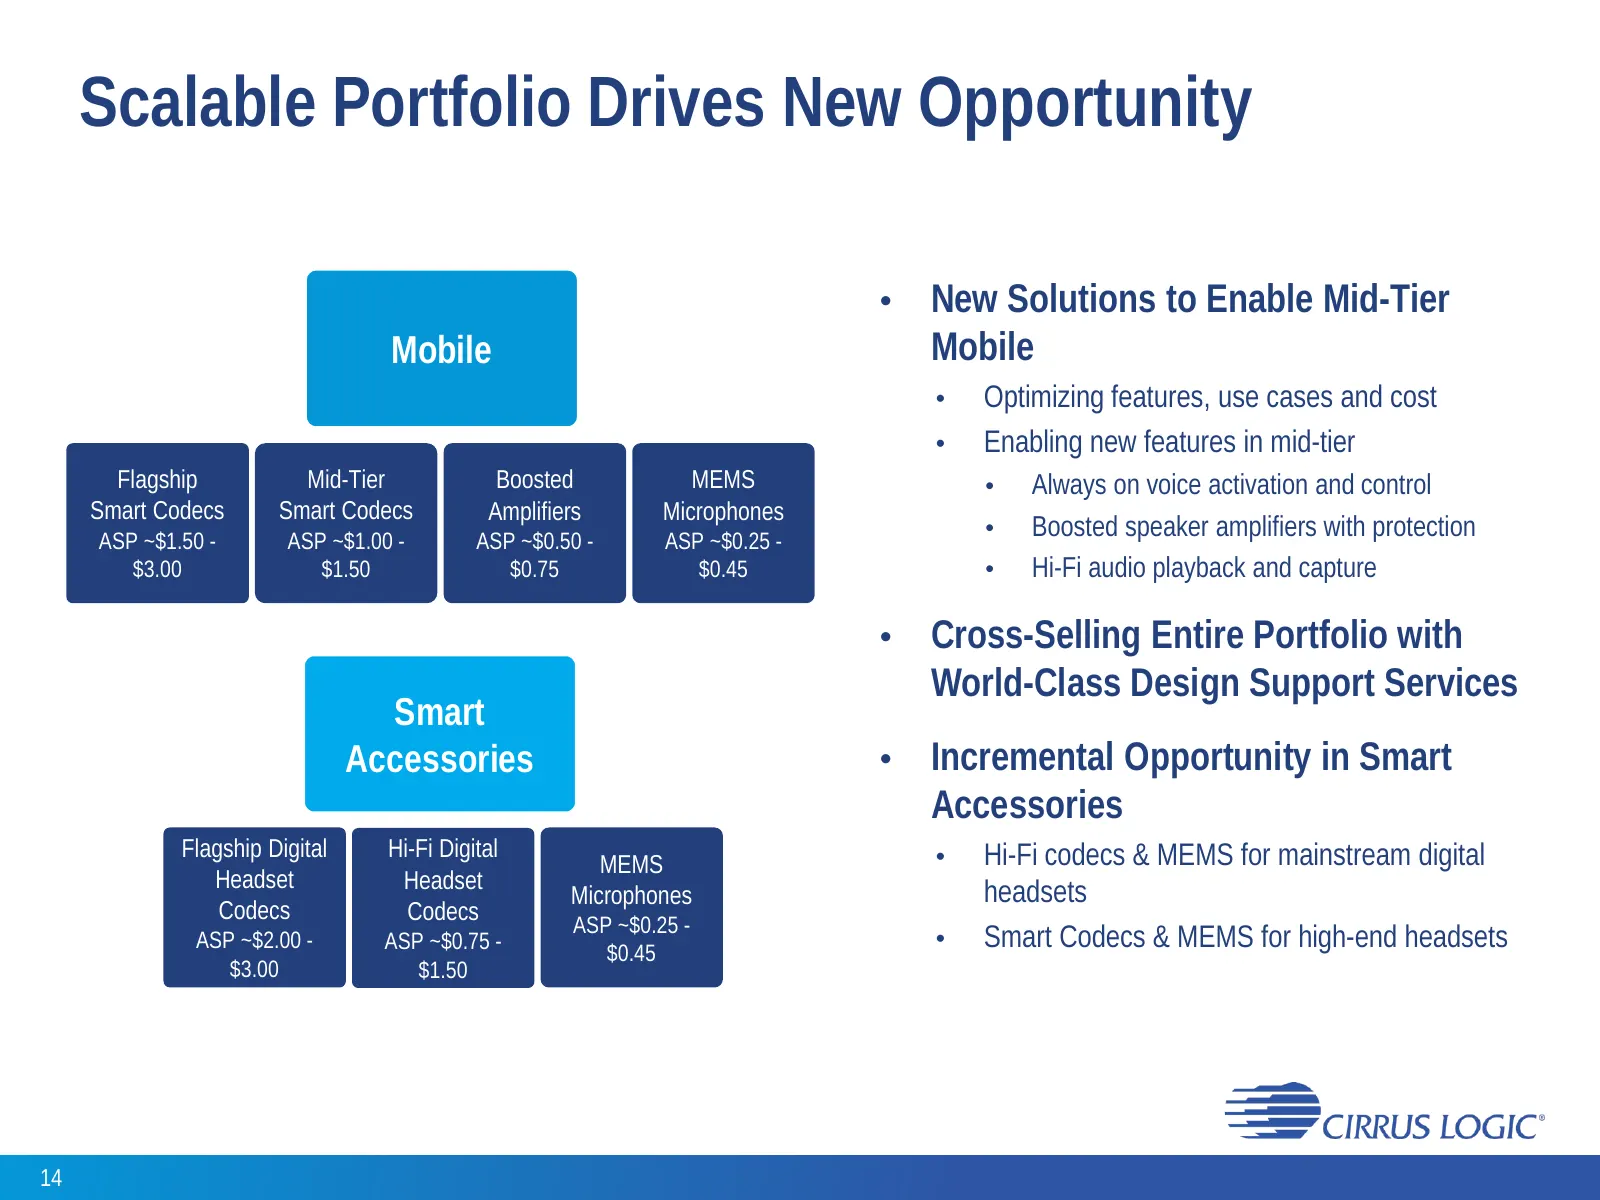
Scalable Portfolio Drives New Opportunity • New Solutions to Enable Mid-Tier Mobile Mobile • Optimizing features, use cases and cost • Enabling new features in mid-tier Flagship Mid-Tier Boosted MEMS • Always on voice activation and control Smart Codecs Smart Codecs Amplifiers Microphones ASP ~$1.50
Slide 15: Positioning the Company for Long-Term Growth
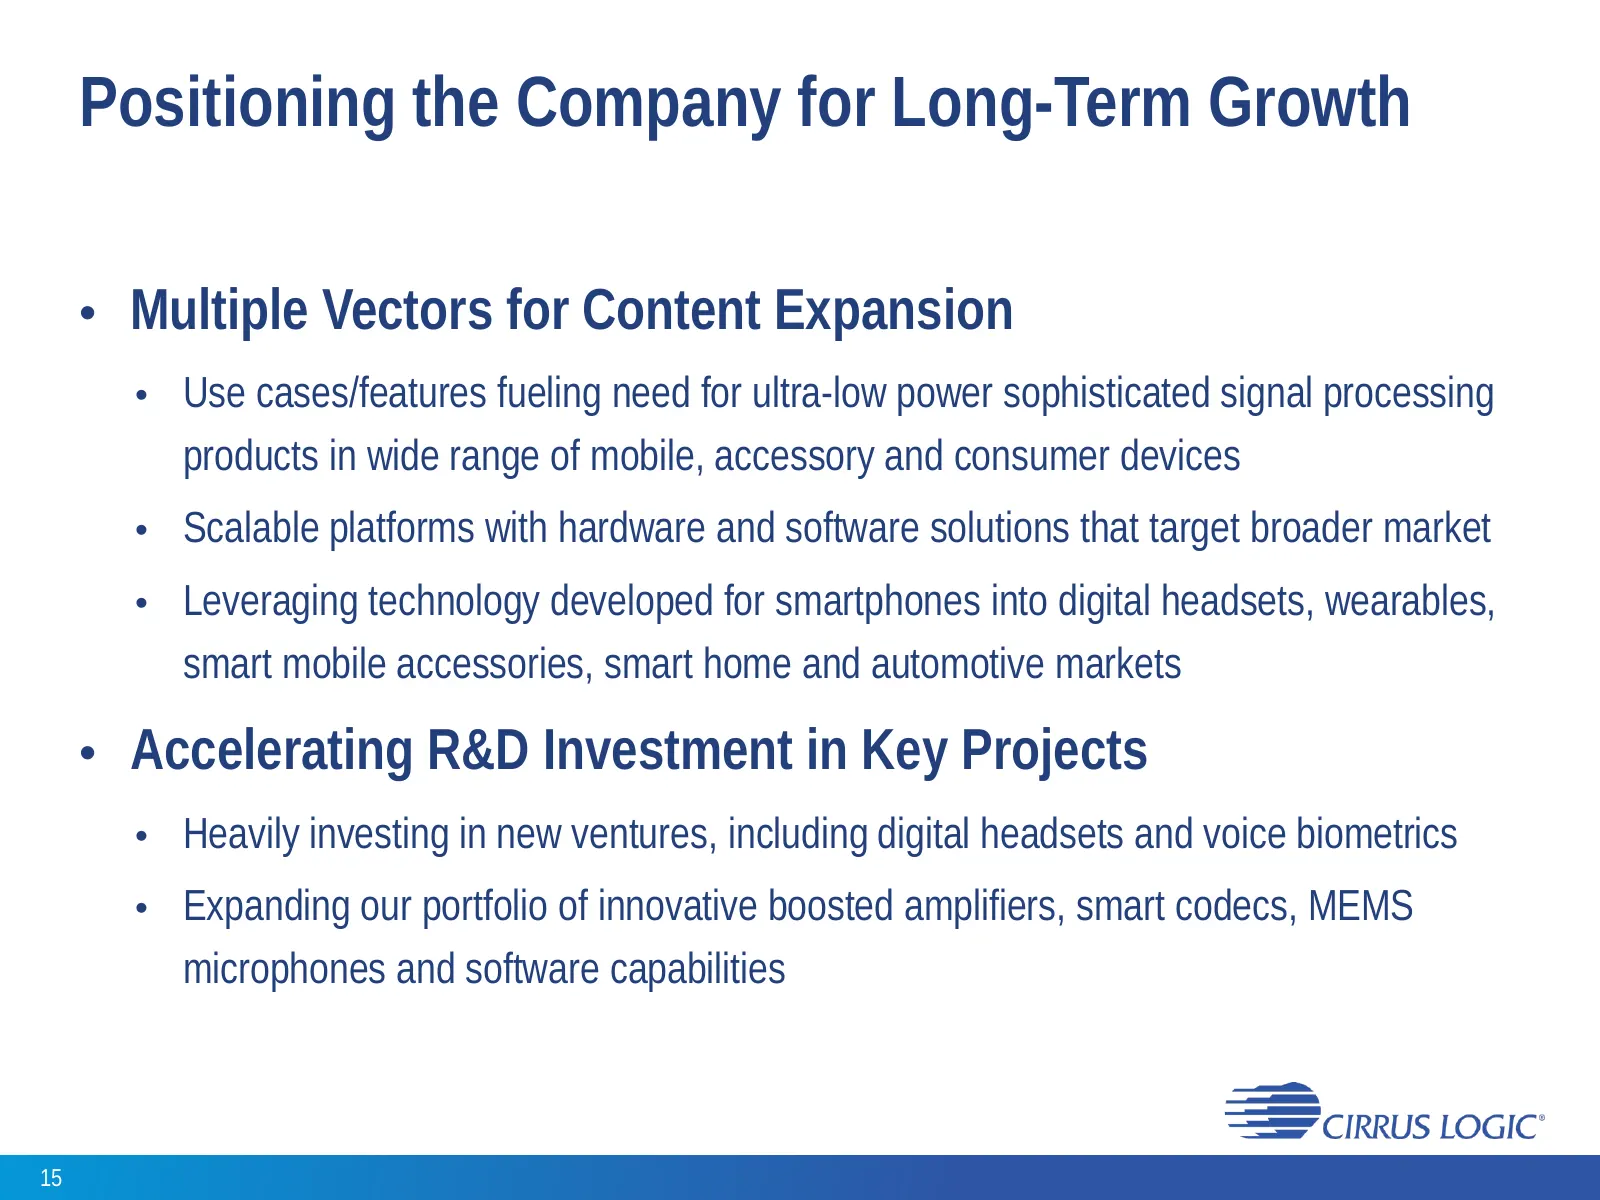
Positioning the Company for Long-Term Growth • Multiple Vectors for Content Expansion • Use cases/features fueling need for ultra-low power sophisticated signal processing products in wide range of mobile, accessory and consumer devices • Scalable platforms with hardware and software solutions that

Slide 16: Financials
Financials ——w —__" ——— —== —
Slide 17: Financial Highlights
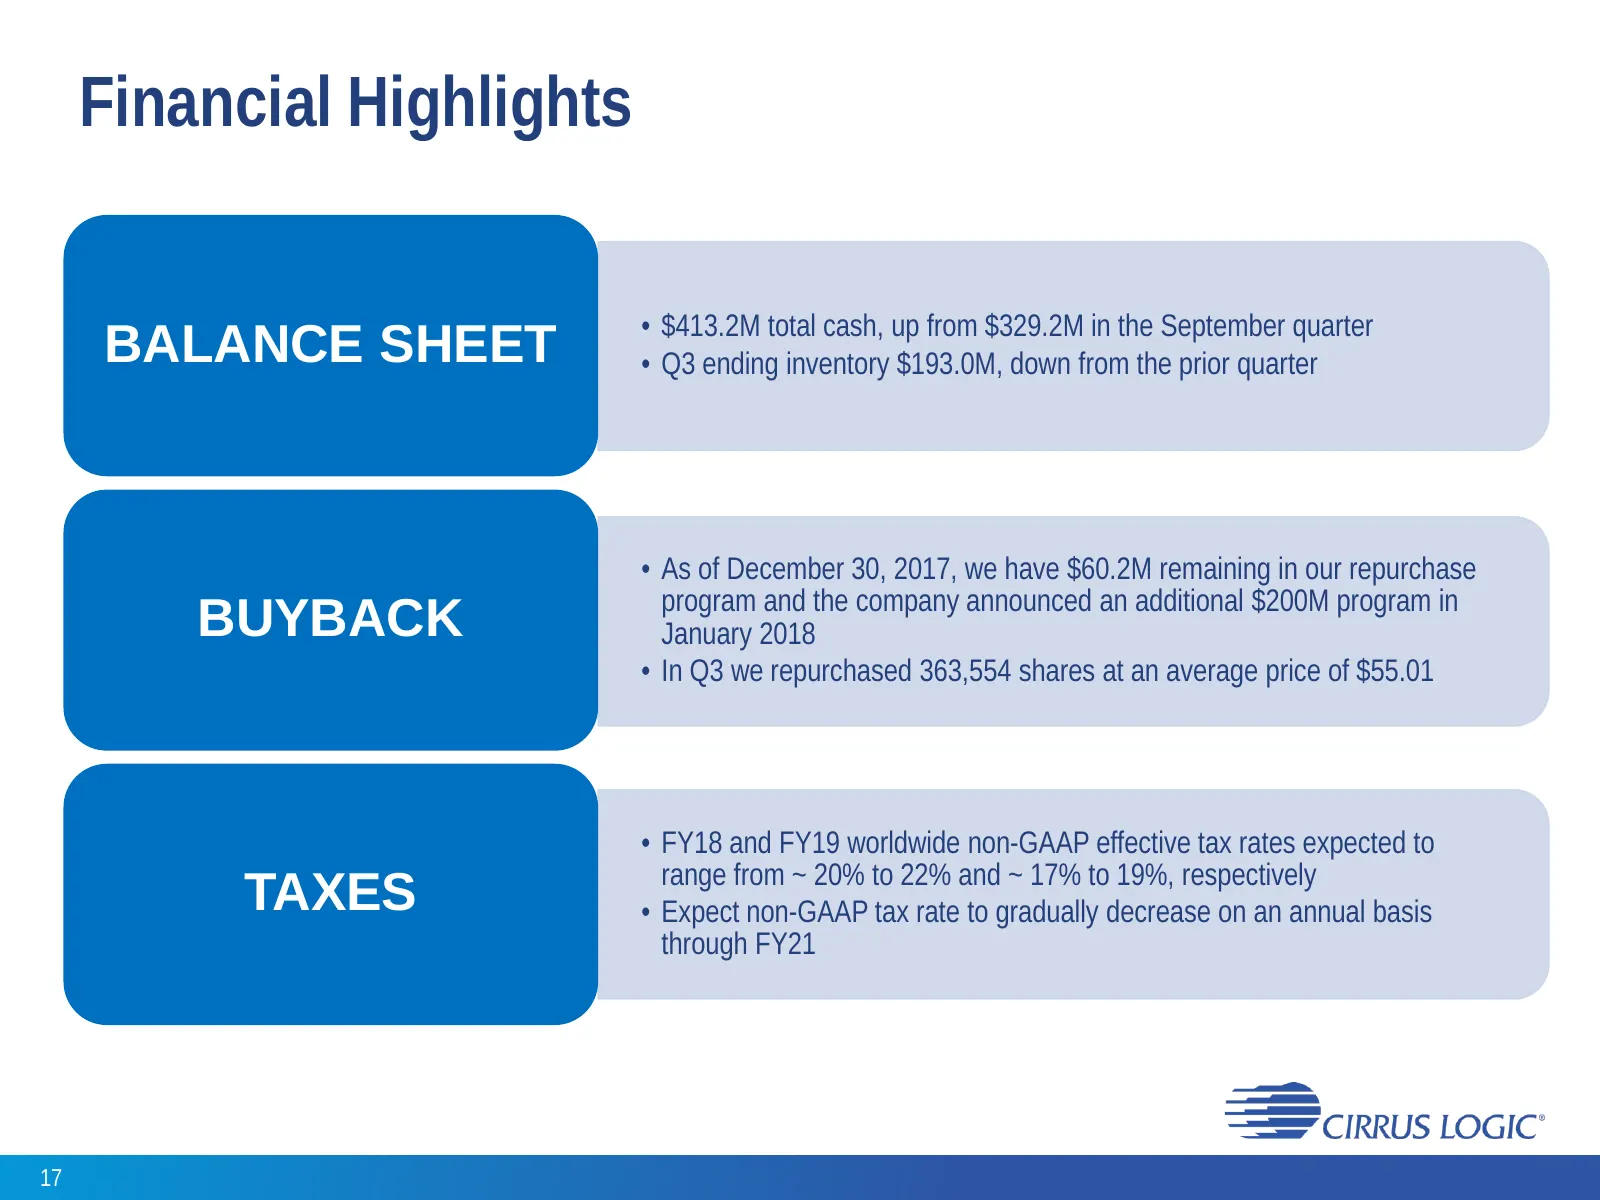
Financial Highlights • $413.2M total cash, up from $329.2M in the September quarter BALANCE SHEET • Q3 ending inventory $193.0M, down from the prior quarter • As of December 30, 2017, we have $60.2M remaining in our repurchase program and the company announced an additional $200M program in BUYBACK
Slide 18: Strong Cash Generation
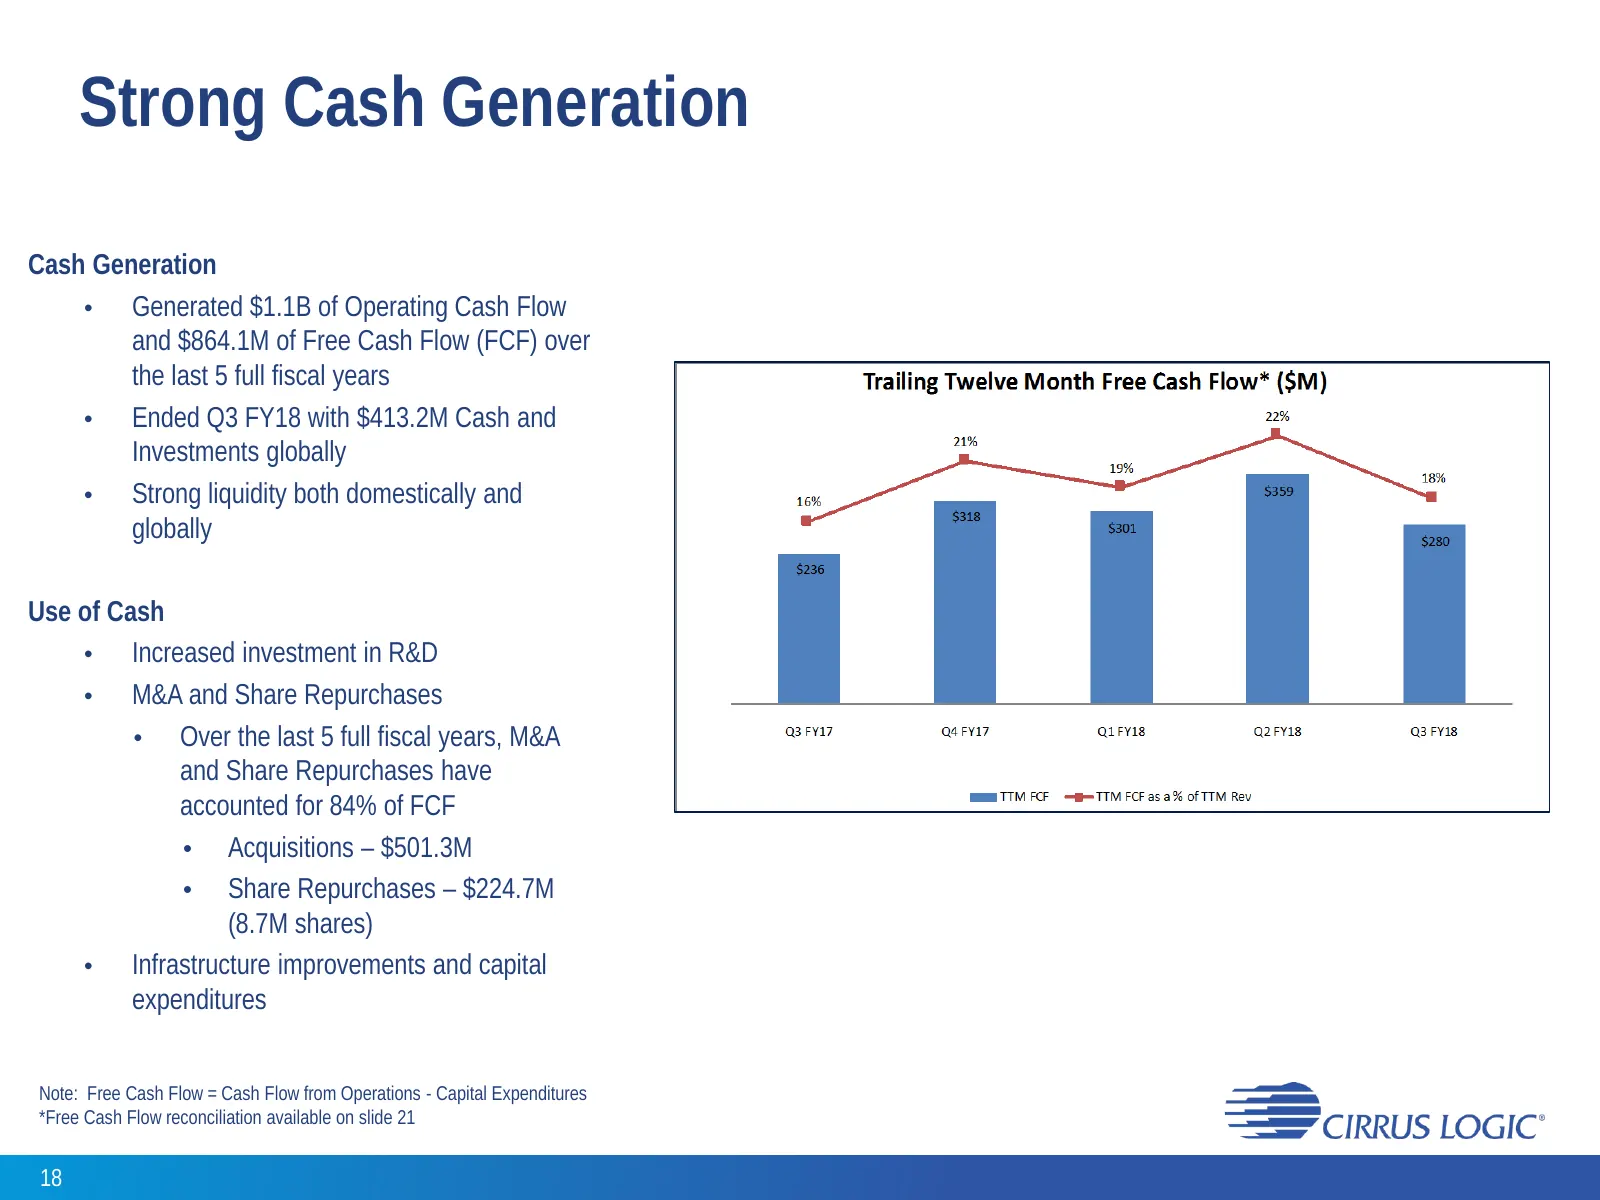
Strong Cash Generation Cash Generation • Generated $1.1B of Operating Cash Flow and $864.1M of Free Cash Flow (FCF) over the last 5 full fiscal years • Ended Q3 FY18 with $413.2M Cash and Investments globally • Strong liquidity both domestically and globally Use of Cash • Increased investment in R&D
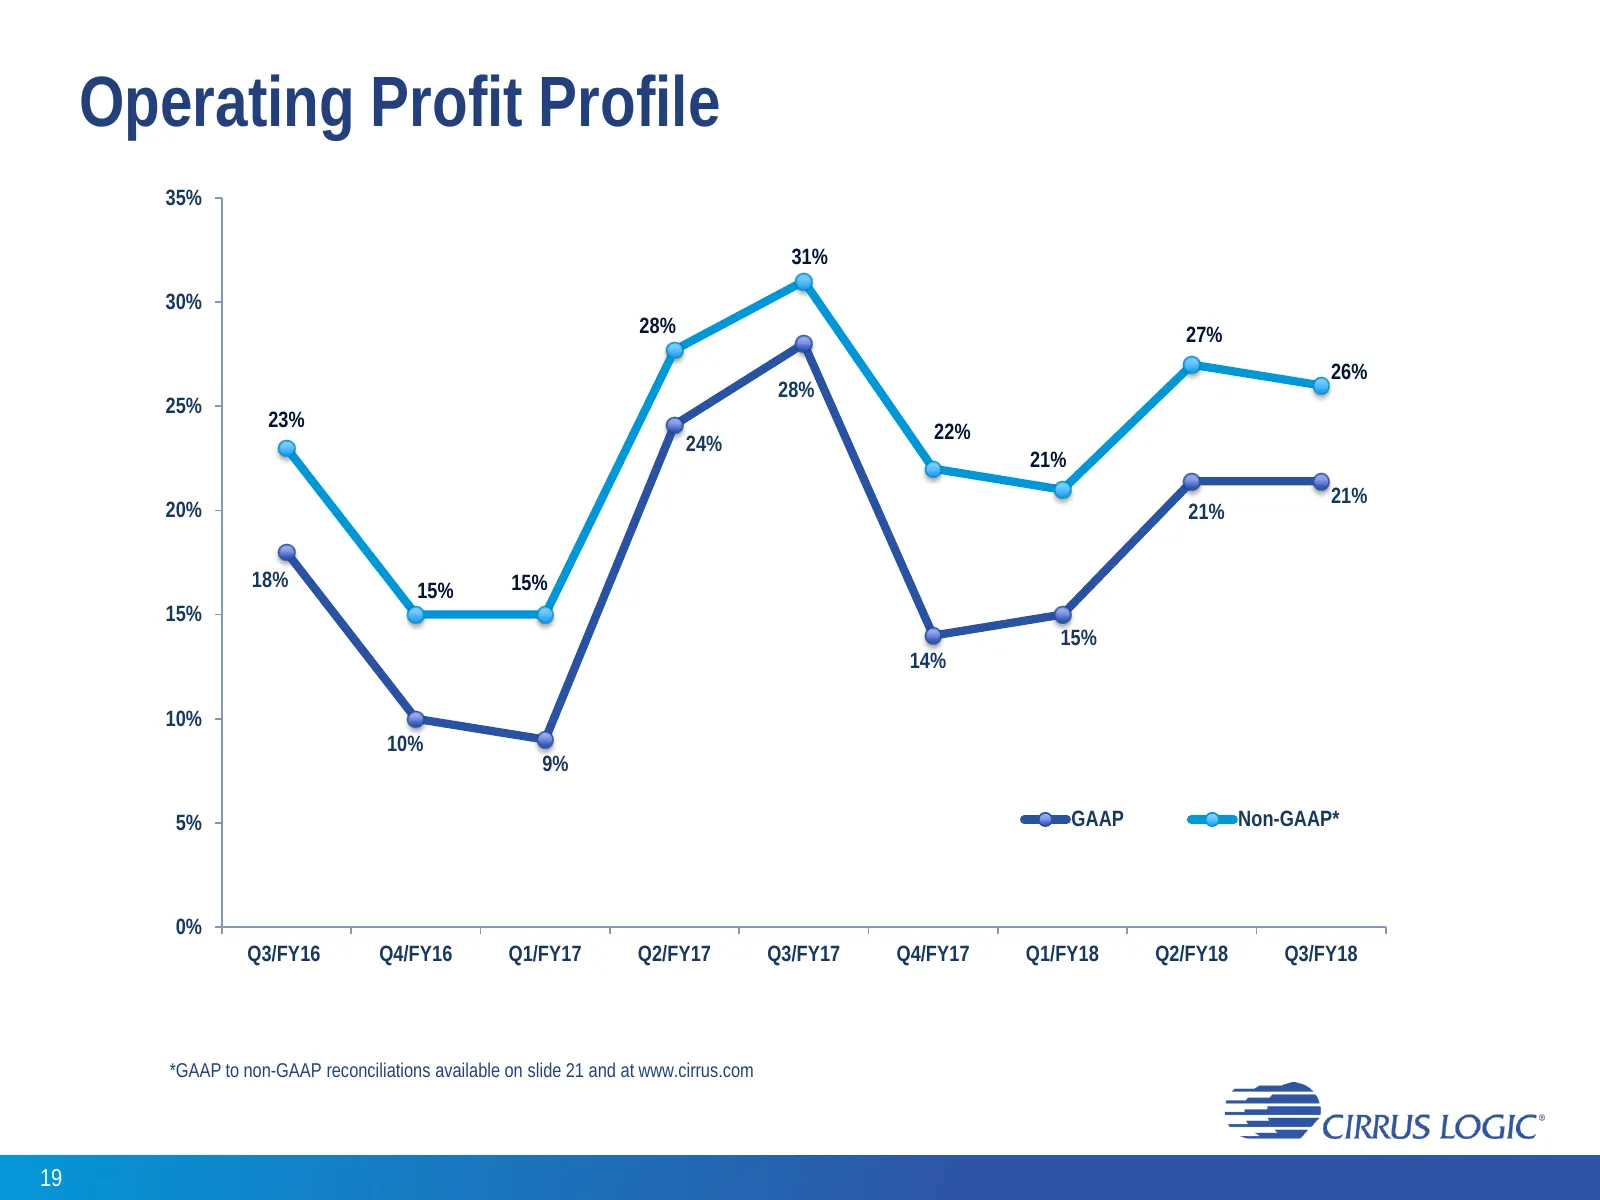
Slide 19: Operating Profit Profile
Operating Profit Profile 35% 31% 30% 28% 27% 26% 28% 25% 23% 22% 24% 21% 21% 20% 21% 18% 15% 15% 15% 15% 14% 10% 10% 9% 5% GAAP Non-GAAP* 0% Q3/FY16 Q4/FY16 Q1/FY17 Q2/FY17 Q3/FY17 Q4/FY17 Q1/FY18 Q2/FY18 Q3/FY18 *GAAP to non-GAAP reconciliations available on slide 21 and at www.cirrus.com 19
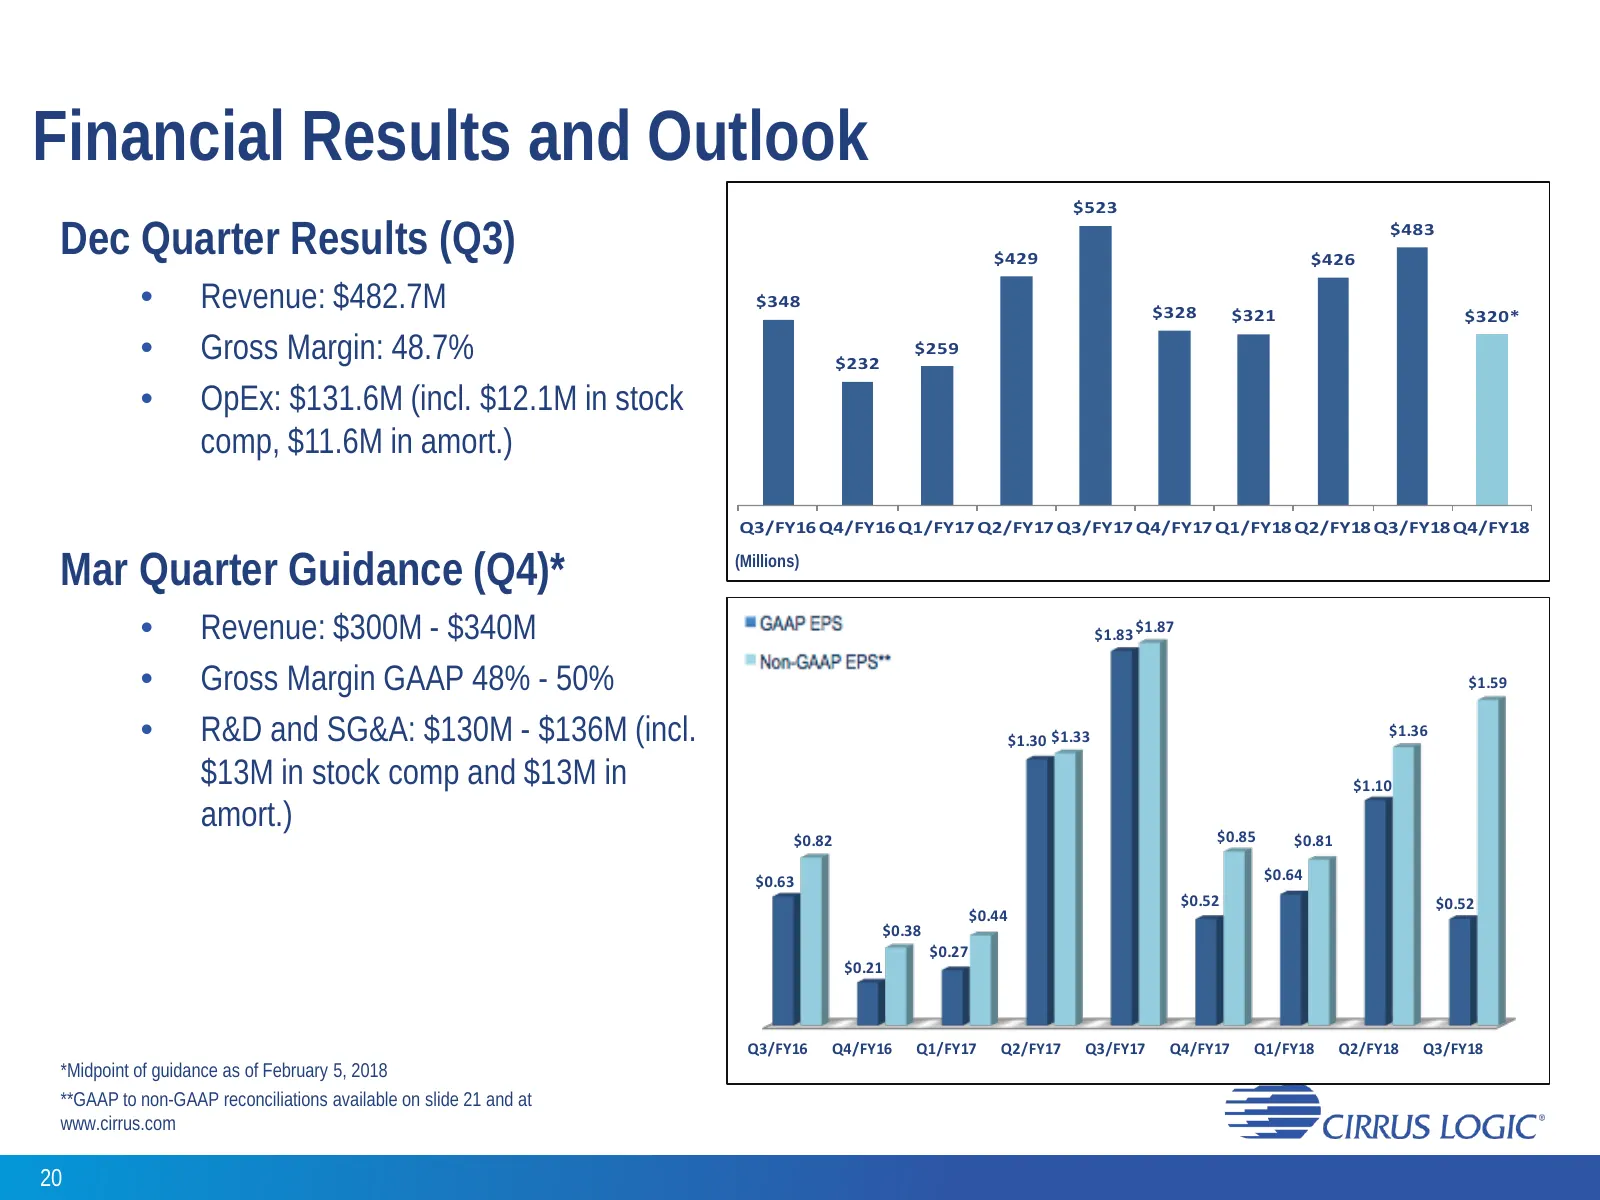
Slide 20: Financial Results and Outlook
Financial Results and Outlook $523 Dec Quarter Results (Q3) $429 $426 $483 • Revenue: $482.7M $348 $328 $321 $320* • Gross Margin: 48.7% $232 $259 • OpEx: $131.6M (incl. $12.1M in stock comp, $11.6M in amort.) Q3/FY16 Q4/FY16 Q1/FY17 Q2/FY17 Q3/FY17 Q4/FY17 Q1/FY18 Q2/FY18 Q3/FY18 Q4/FY18 Mar Quarte
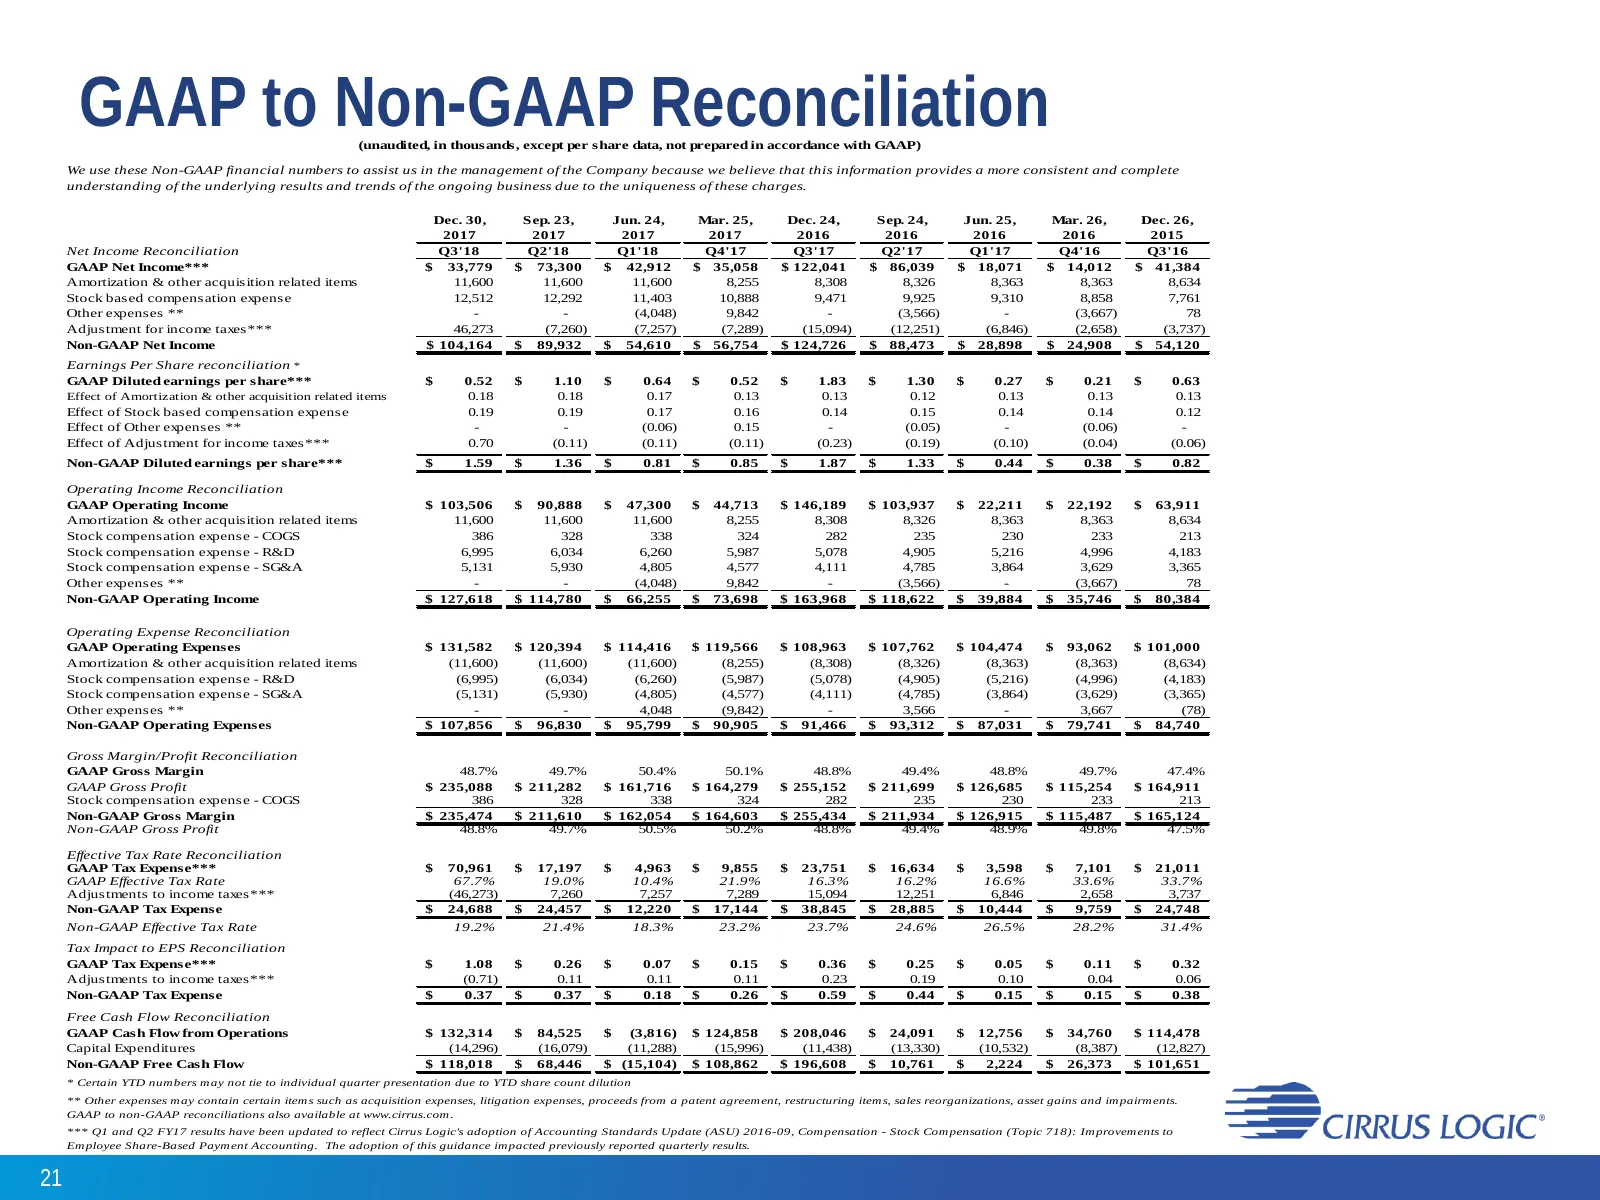
Slide 21: GAAP to Non-GAAP Reconciliation
GAAP to Non-GAAP Reconciliation (unaudited, in thousands, except per share data, not prepared in accordance with GAAP) We use these Non-GAAP financial numbers to assist us in the management of the Company because we believe that this information provides a more consistent and complete understanding

Slide 22: —_——i(<‘<i‘é( eC
— —_——i(<‘<i‘é( eC ee — —e CIRRUS LOGIC’
Source: Internet Archive copy of s21.q4cdn.com
More decks from Cirrus Logic, Inc.
 Q1 2026 Earnings Presentation26 slides · Aug 5, 2026
 Q3 2026 Earnings Presentation25 slides · Feb 3, 2026
 Q1 FY2026 Earnings Presentation25 slides · Aug 5, 2025
 Q4 2025 Earnings Presentation27 slides · May 6, 2025
 Q2 FY25 Earnings Presentation26 slides · Nov 4, 2024
 Q1 FY25 Earnings Presentation26 slides · Aug 6, 2024