Cirrus Logic, Inc. · NASDAQ:CRUS
Cirrus Logic — Q1 FY2026 Earnings Presentation
25 slides from Cirrus Logic's earnings presentation, Aug 5, 2025

Slide 1: Investor Relations Update
Investor Relations Update As of August 5, 2025
Slide 2: Safe Harbor Statement
Safe Harbor Statement Except for historical information contained herein, the matters set forth in this presentation contain forward-looking statements, including industry market projections; our revenue growth opportunities; our ability to fuel product and application diversification; our ability t
Slide 3: Industry and Market Data; Use of non-GAAP Financial Information
Industry and Market Data In this presentation, we rely on and refer to information and statistics regarding the sectors in which we compete and other industry data. We obtain statistics form third-party sources, including reports by market research firms. Although we believe these sources are reliab
Slide 4: Cirrus Logic at a Glance
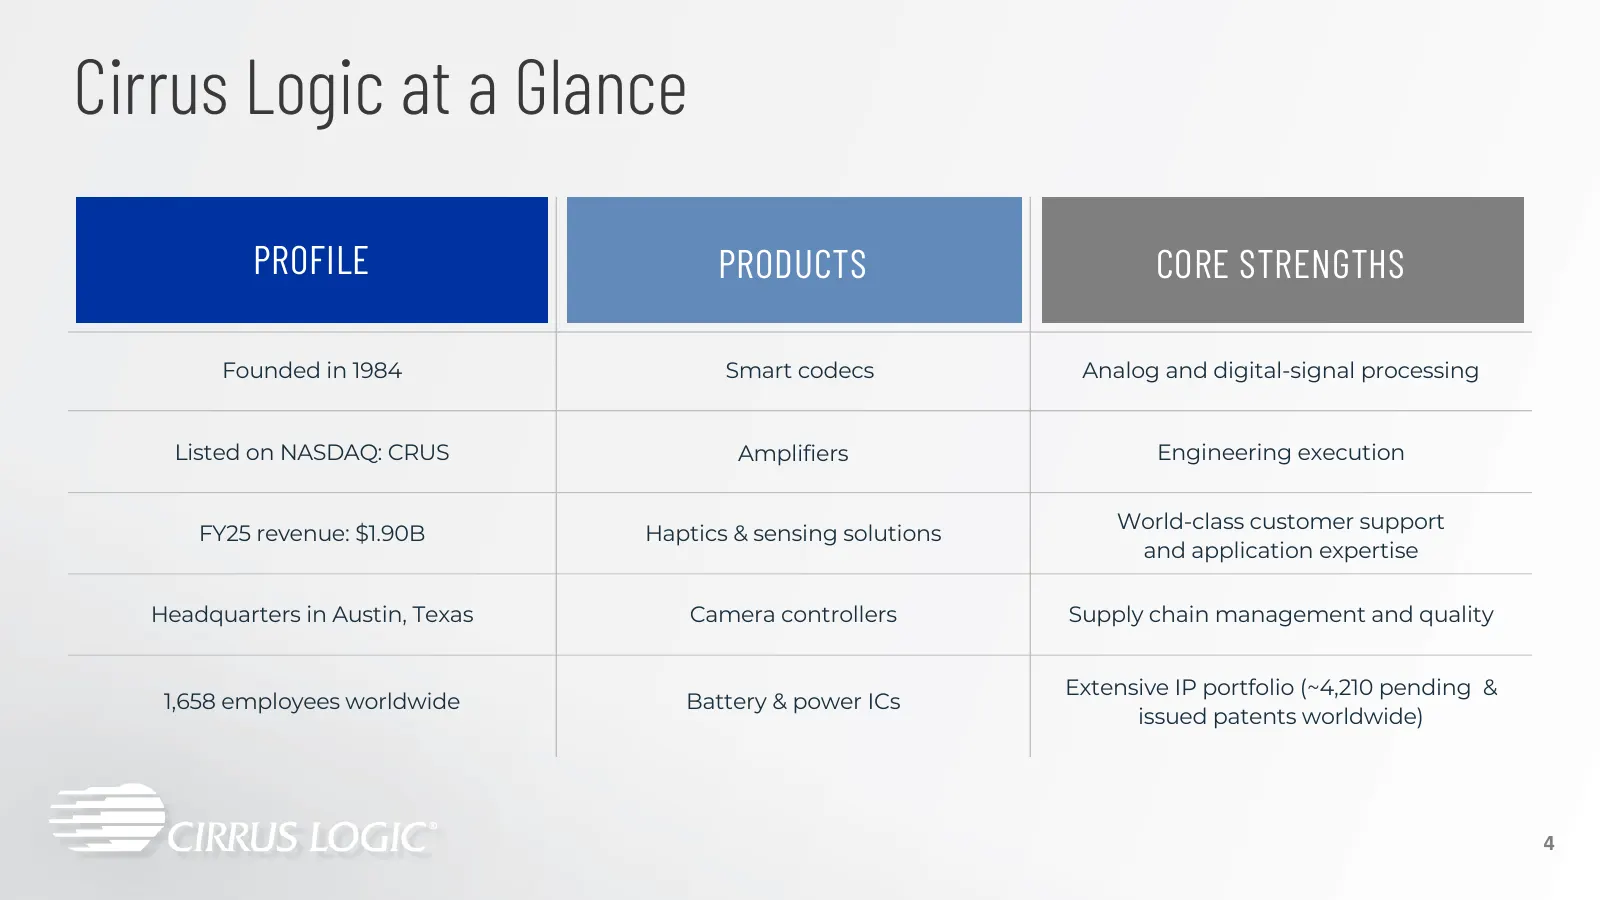
Cirrus Logic at a Glance PROFILE PRODUCTS CORE STRENGTHS Founded in 1984 Smart codecs Analog and digital-signal processing Listed on NASDAQ: CRUS Amplifiers Engineering execution World-class customer support FY25 revenue: $1.90B Haptics & sensing solutions and application expertise Headquarters in A
Slide 5: Strategy for Growth Through Product Diversification
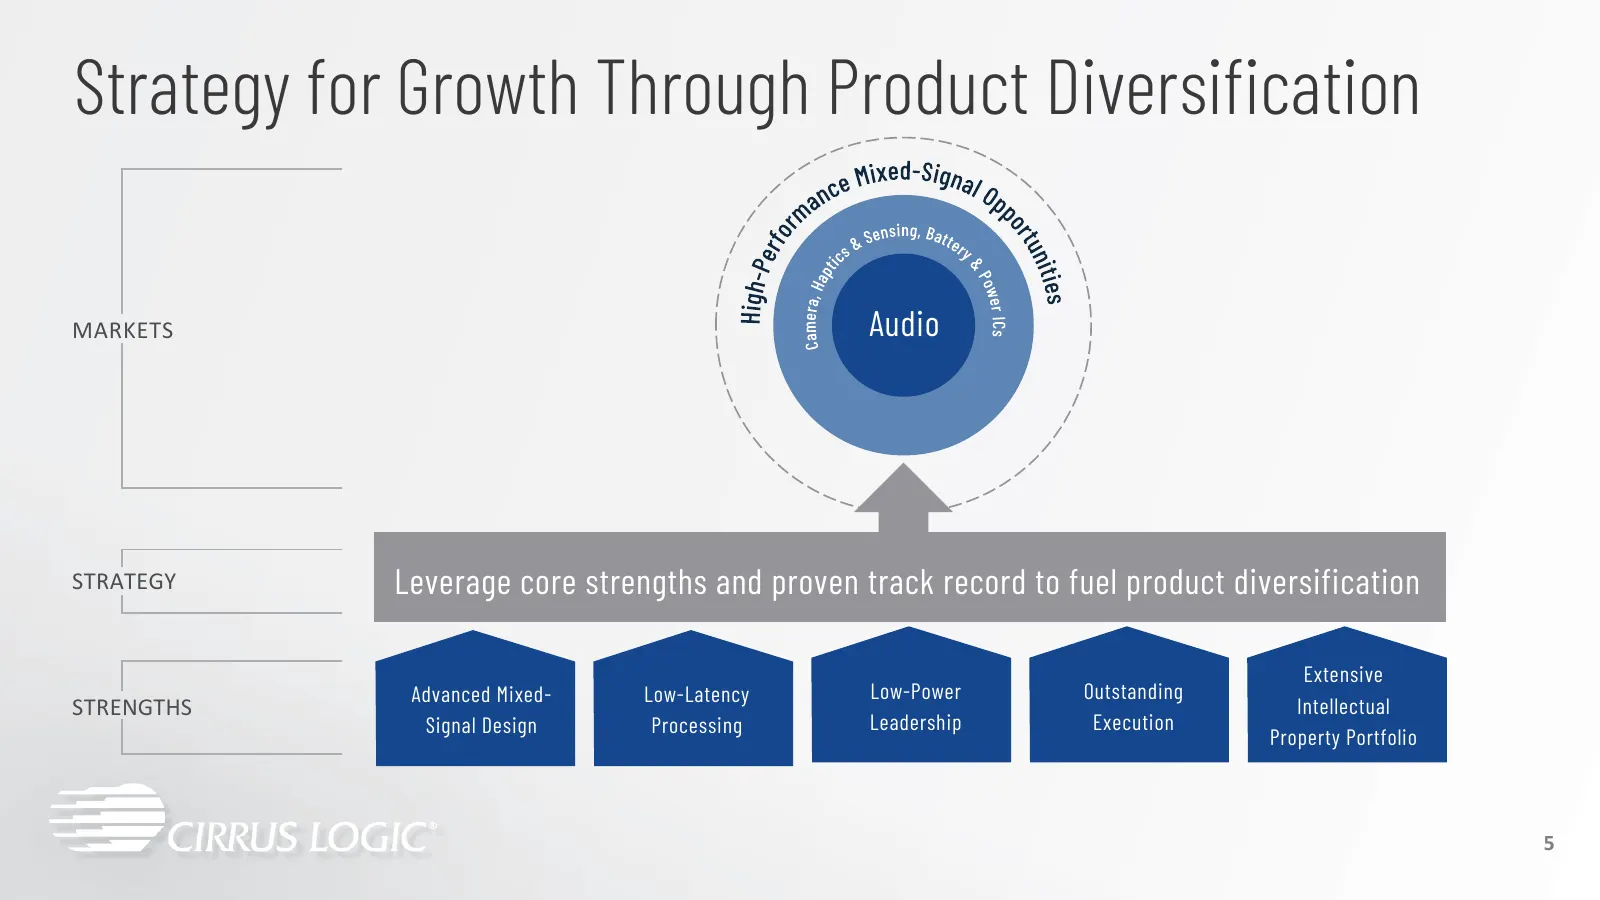
Strategy for Growth Through Product Diversification MARKETS Audio STRATEGY Leverage core strengths and proven track record to fuel product diversification Extensive Advanced Mixed- Low-Latency Low-Power Outstanding STRENGTHS Intellectual Signal Design Processing Leadership Execution Property Portfol
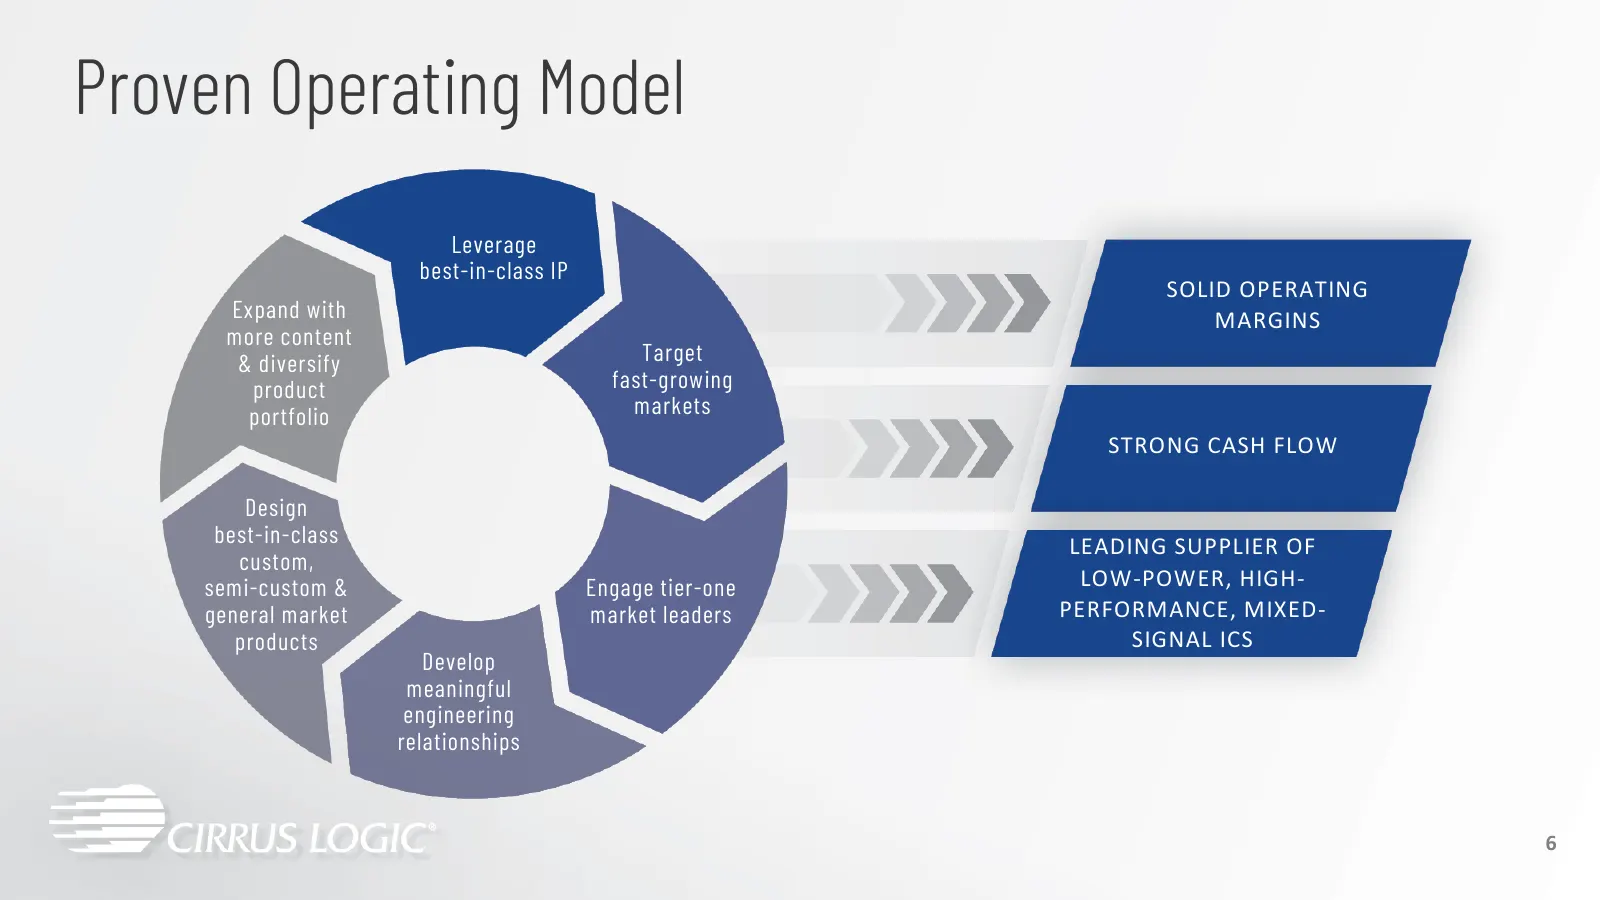
Slide 6: Proven Operating Model
Proven Operating Model Leverage best-in-class IP SOLID OPERATING Expand with MARGINS more content & diversify Target product fast-growing portfolio markets STRONG CASH FLOW Design best-in-class LEADING SUPPLIER OF custom, semi-custom & Engage tier-one LOW-POWER, HIGH- general market market leaders P
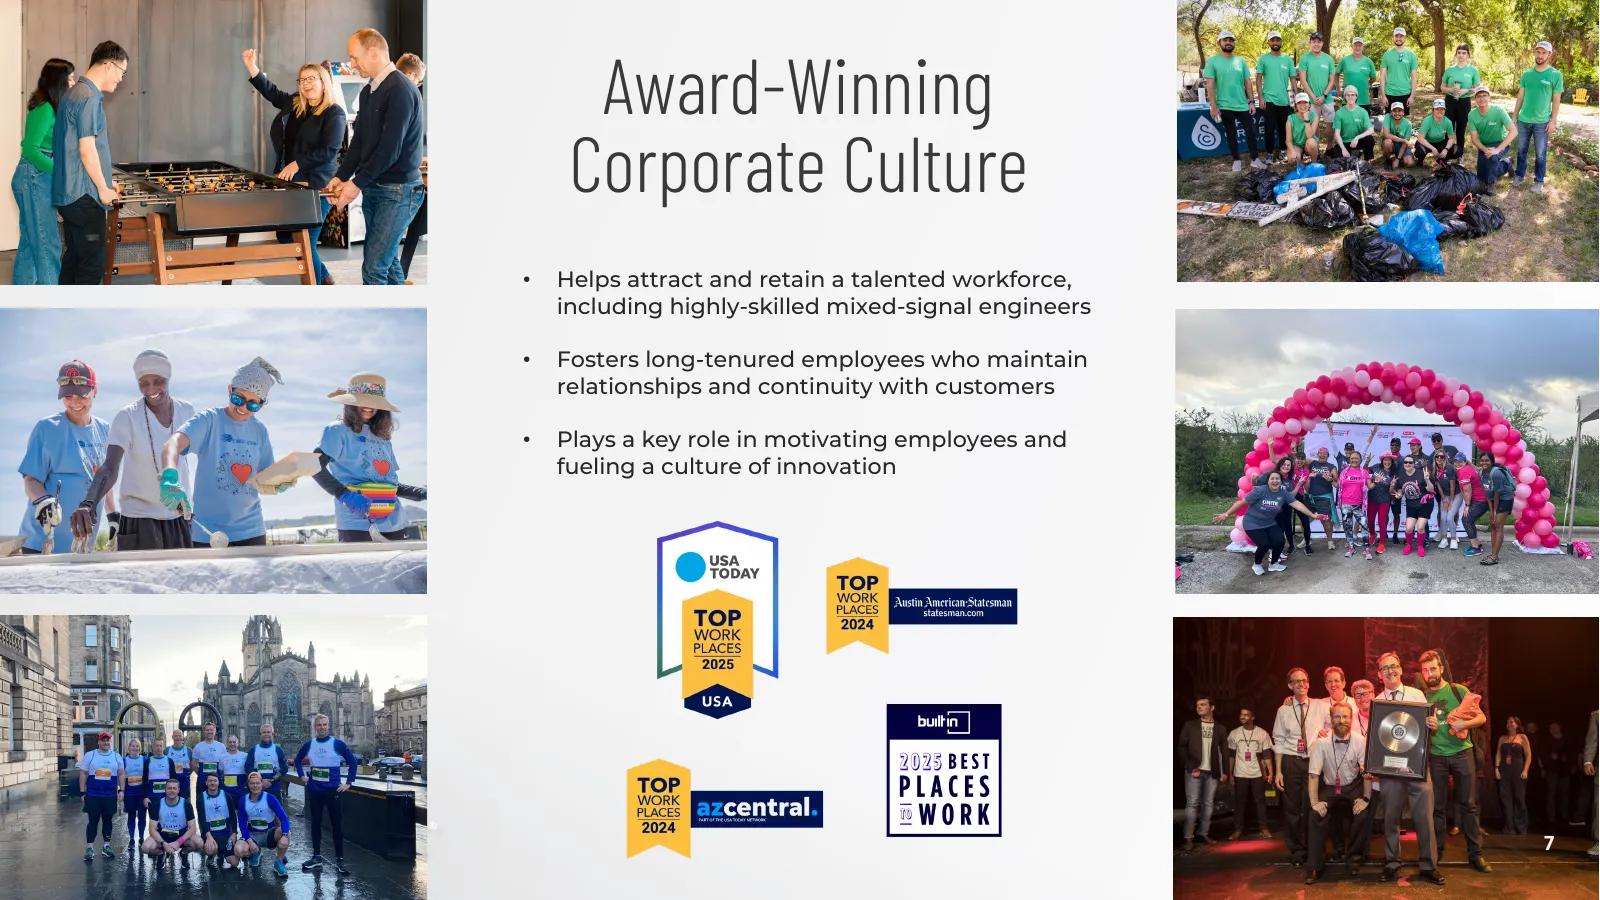
Slide 7: Award-Winning Corporate Culture
Award-Winning Corporate Culture • Helps attract and retain a talented workforce, including highly-skilled mixed-signal engineers • Fosters long-tenured employees who maintain relationships and continuity with customers • Plays a key role in motivating employees and fueling a culture of innovation 7

Slide 8: Technology & Market Overview
Technology & Market Overview 8
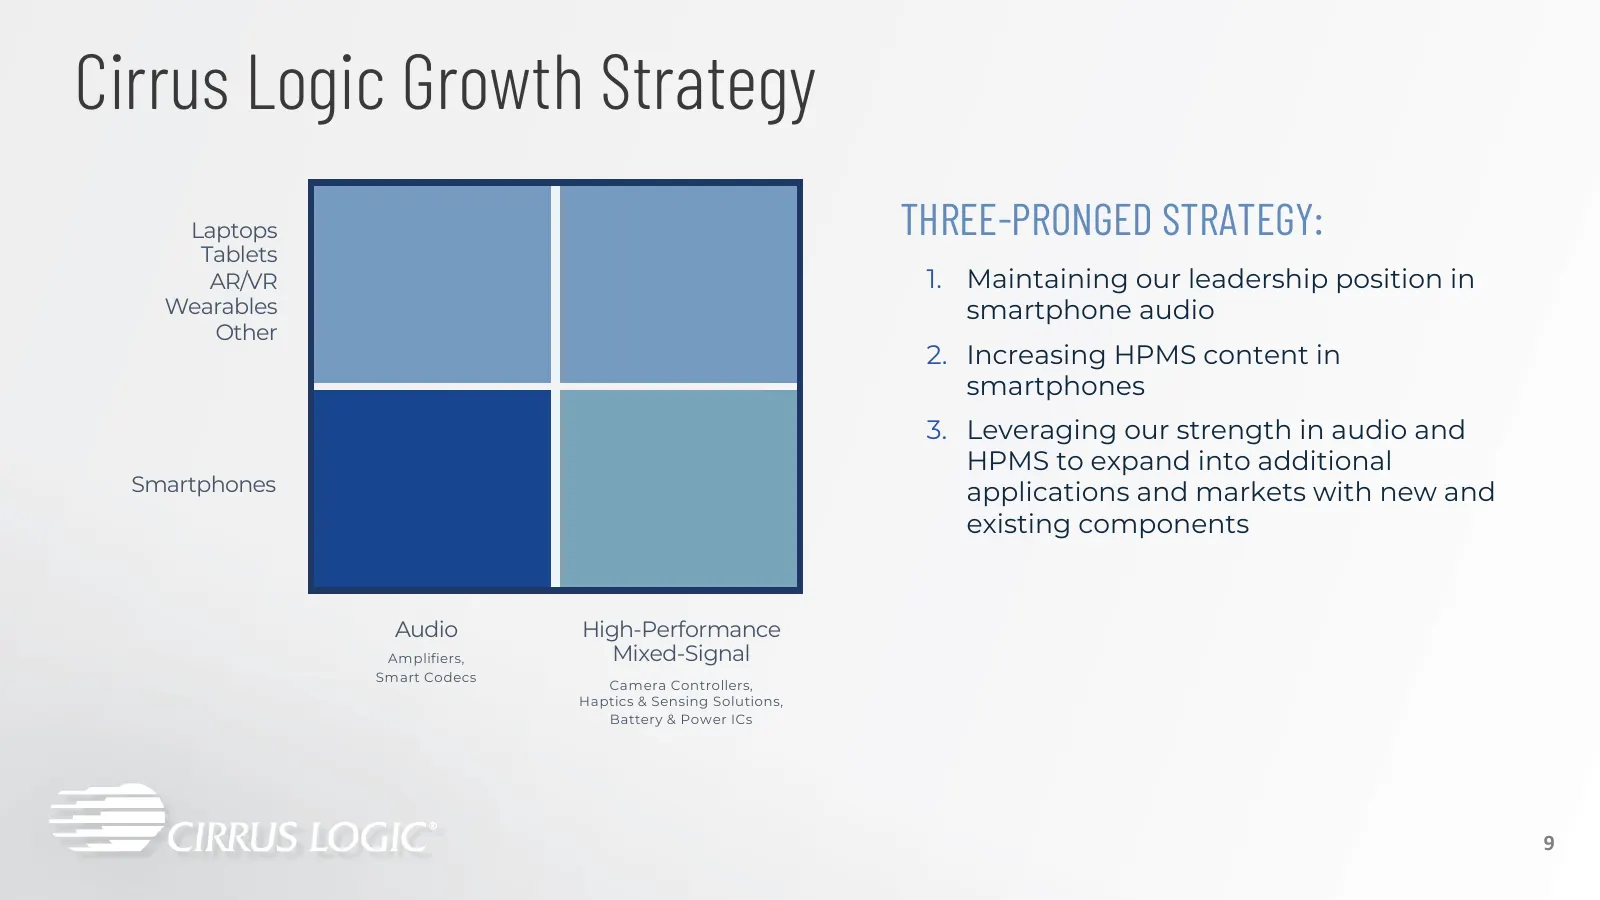
Slide 9: Cirrus Logic Growth Strategy
Cirrus Logic Growth Strategy Laptops THREE-PRONGED STRATEGY: Tablets AR/VR 1. Maintaining our leadership position in Wearables smartphone audio Other 2. Increasing HPMS content in smartphones 3. Leveraging our strength in audio and HPMS to expand into additional Smartphones applications and markets
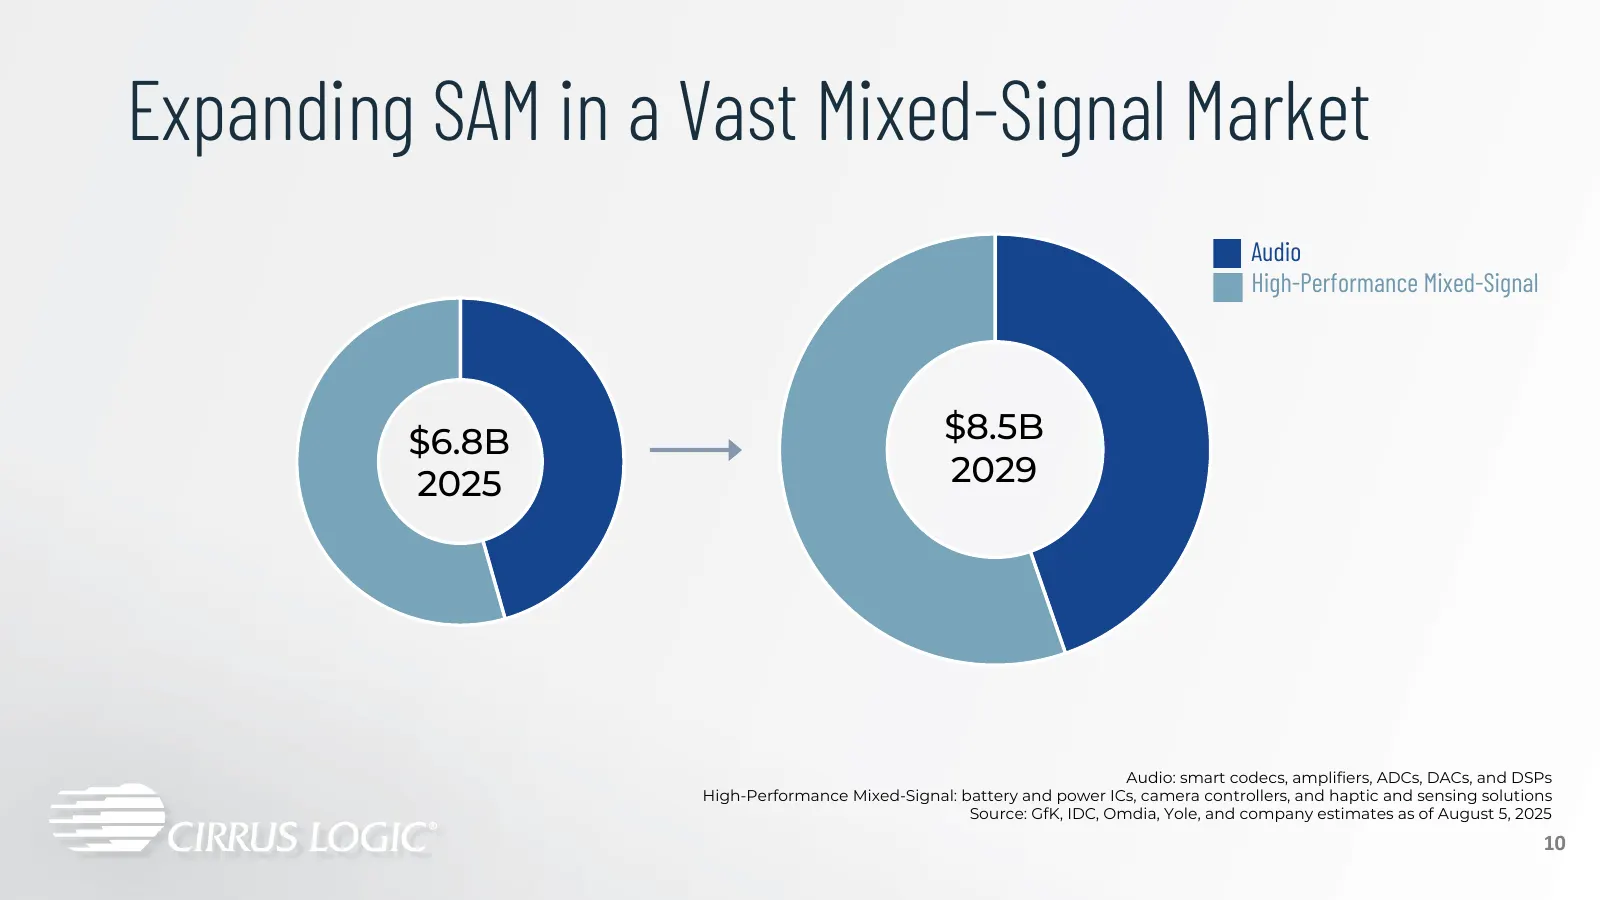
Slide 10: Expanding SAM in a Vast Mixed-Signal Market
Expanding SAM in a Vast Mixed-Signal Market Audio High-Performance Mixed-Signal $6.8B $8.5B 2025 2029 Audio: smart codecs, amplifiers, ADCs, DACs, and DSPs High-Performance Mixed-Signal: battery and power ICs, camera controllers, and haptic and sensing solutions Source: GfK, IDC, Omdia, Yole, and co
Slide 11: High-Performance Mixed-Signal Capabilities
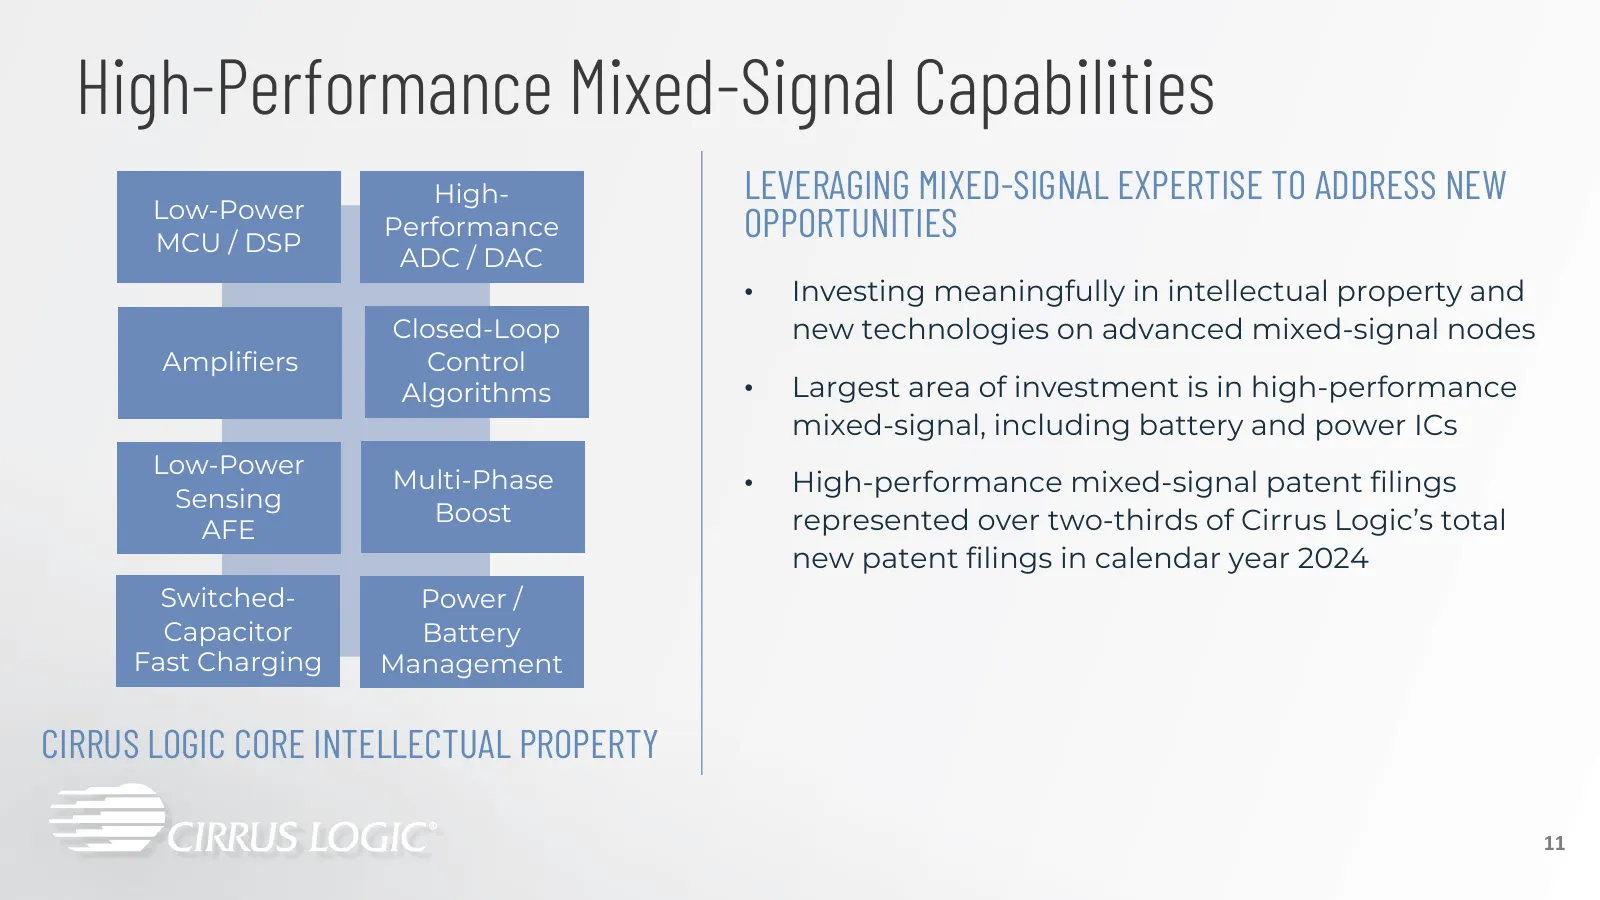
High-Performance Mixed-Signal Capabilities Low-Power High- LEVERAGING MIXED-SIGNAL EXPERTISE TO ADDRESS NEW MCU / DSP Performance OPPORTUNITIES ADC / DAC • Investing meaningfully in intellectual property and Closed-Loop new technologies on advanced mixed-signal nodes Amplifiers Control Algorithms •
Slide 12: Proven Track Record of Content Expansion in Smartphones
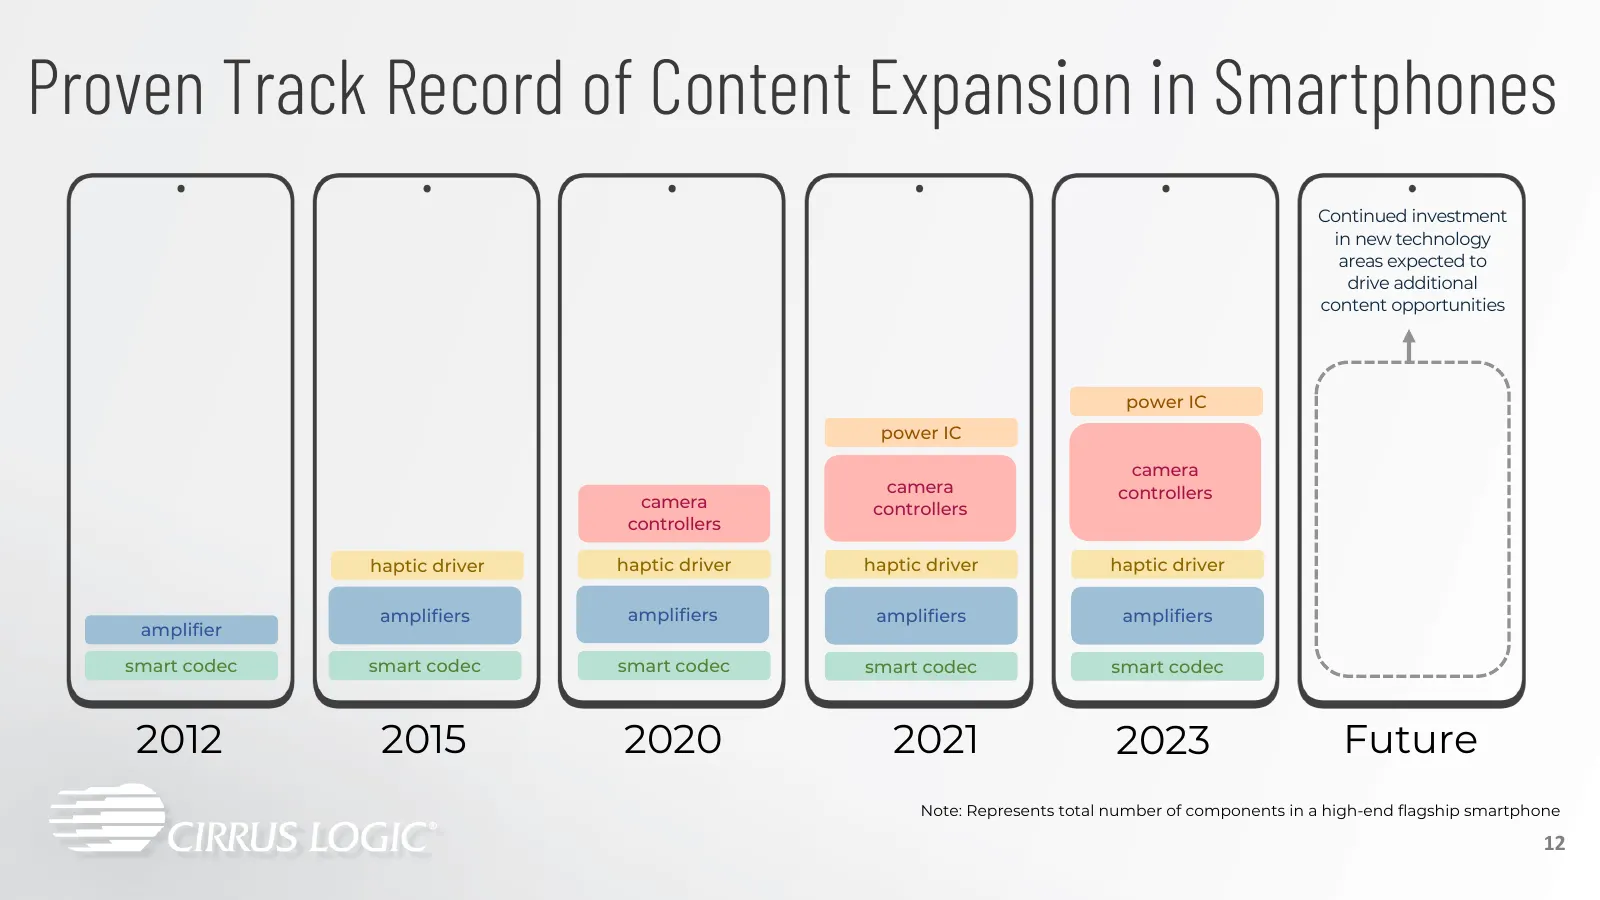
Proven Track Record of Content Expansion in Smartphones Continued investment in new technology areas expected to drive additional content opportunities power IC power IC camera camera controllers camera controllers controllers haptic driver haptic driver haptic driver haptic driver amplifiers amplif
Slide 13: Broadening Content Beyond Smartphones
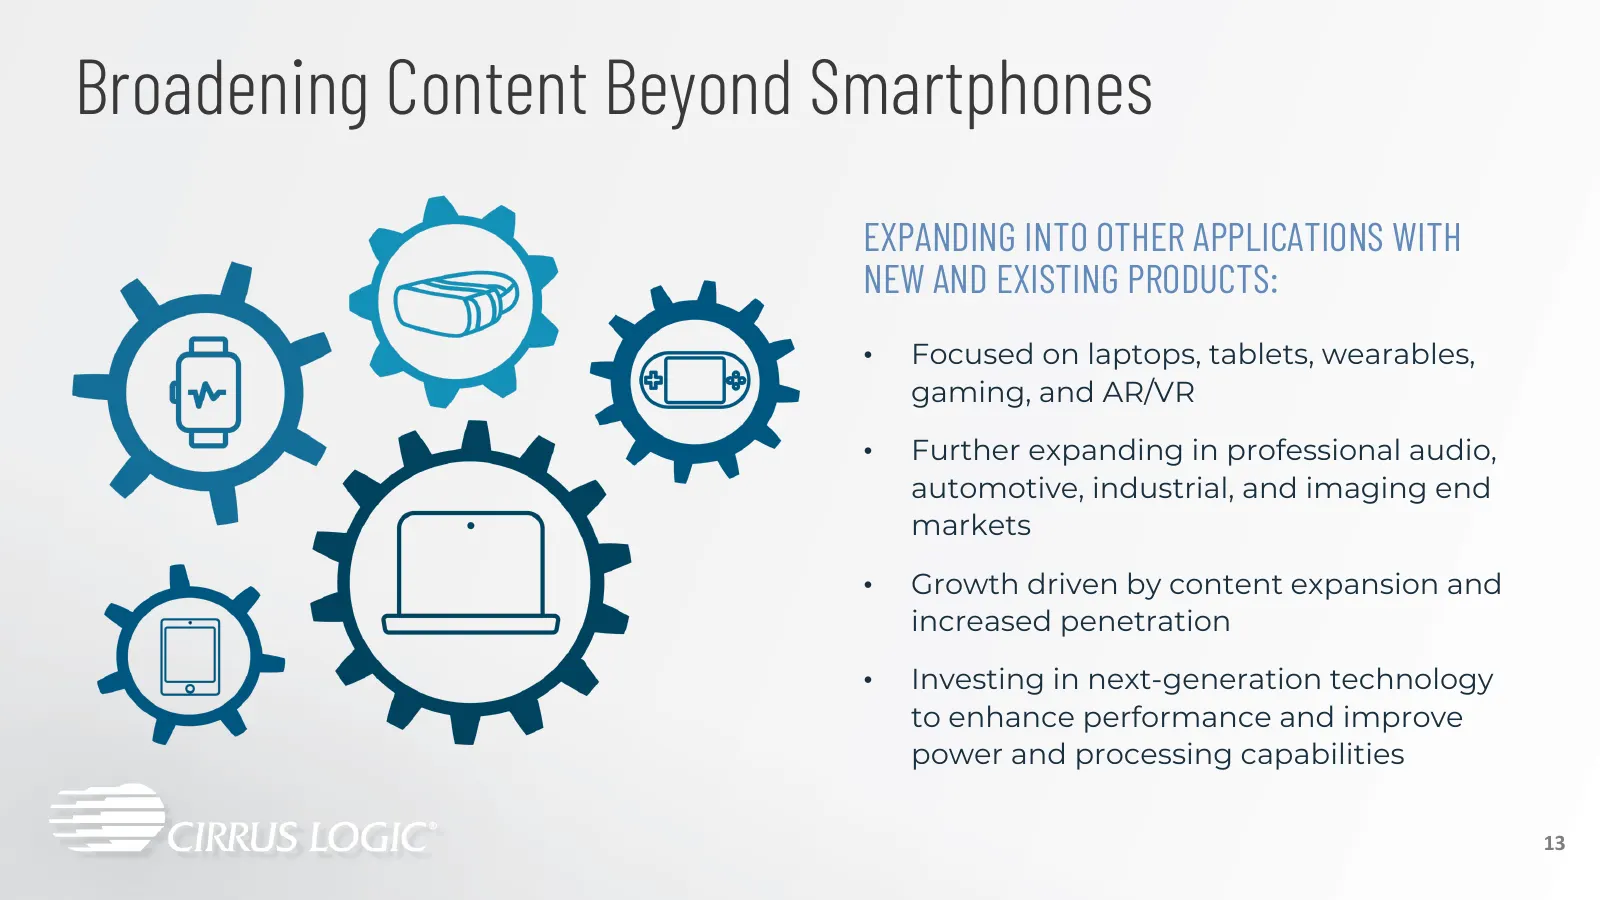
Broadening Content Beyond Smartphones EXPANDING INTO OTHER APPLICATIONS WITH NEW AND EXISTING PRODUCTS: • Focused on laptops, tablets, wearables, gaming, and AR/VR • Further expanding in professional audio, automotive, industrial, and imaging end markets • Growth driven by content expansion and incr
Slide 14: Meaningful Opportunity to Capture More Laptop SAM
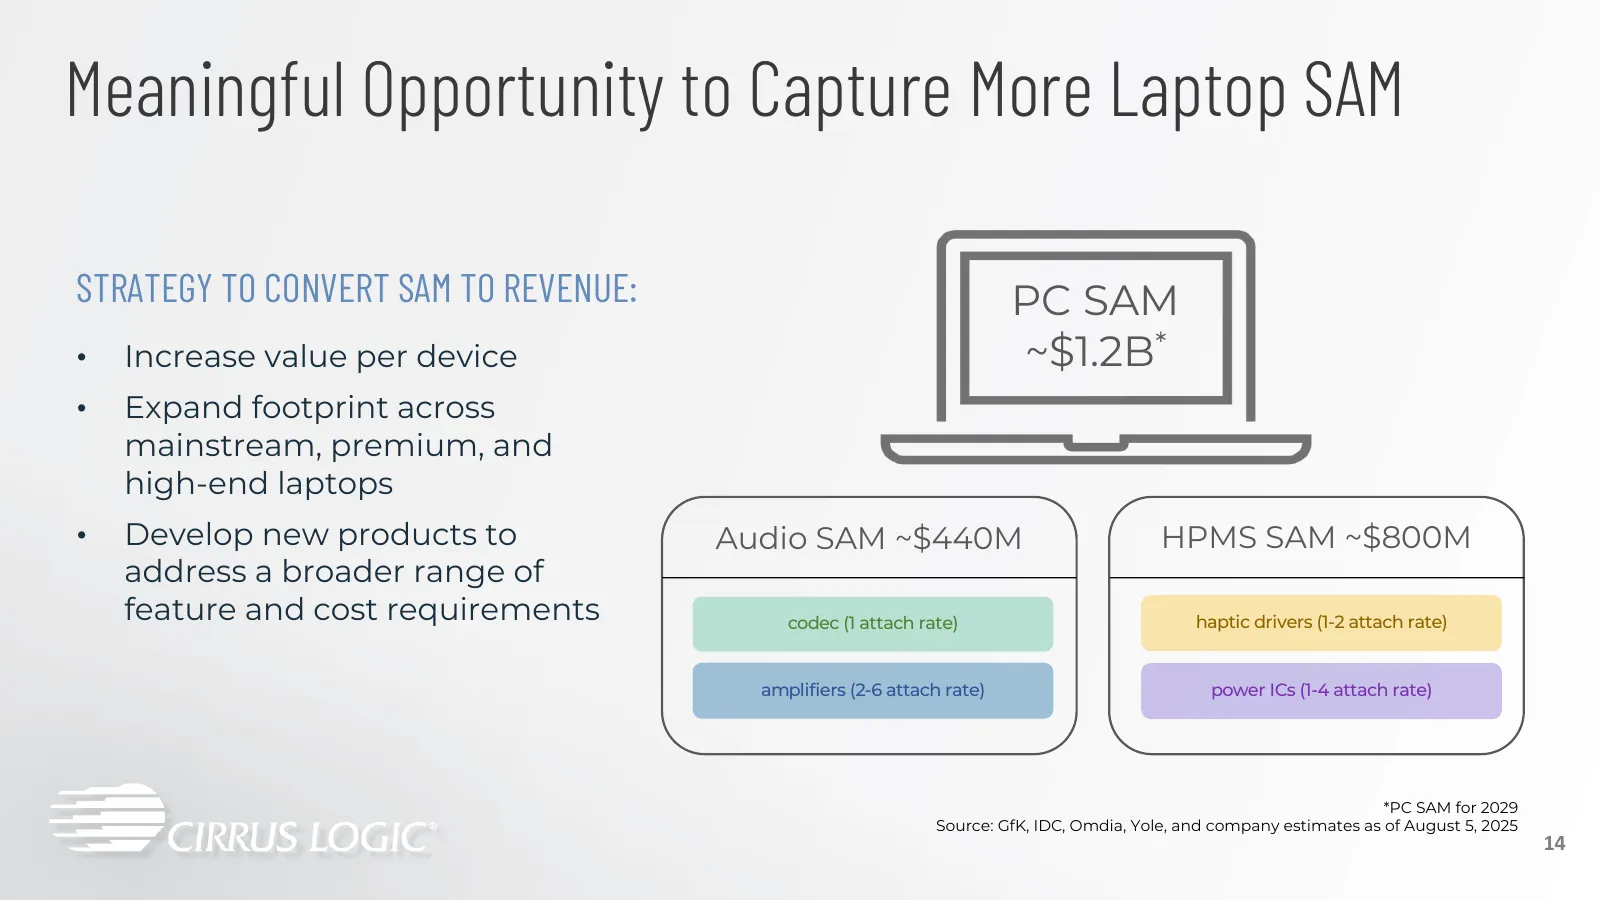
Meaningful Opportunity to Capture More Laptop SAM STRATEGY TO CONVERT SAM TO REVENUE: PC SAM • Increase value per device ~$1.2B* • Expand footprint across mainstream, premium, and high-end laptops • Develop new products to Audio SAM ~$440M HPMS SAM ~$800M address a broader range of feature and cost
Slide 15: Product Overview
Product Overview 15
Slide 16: Audio Products
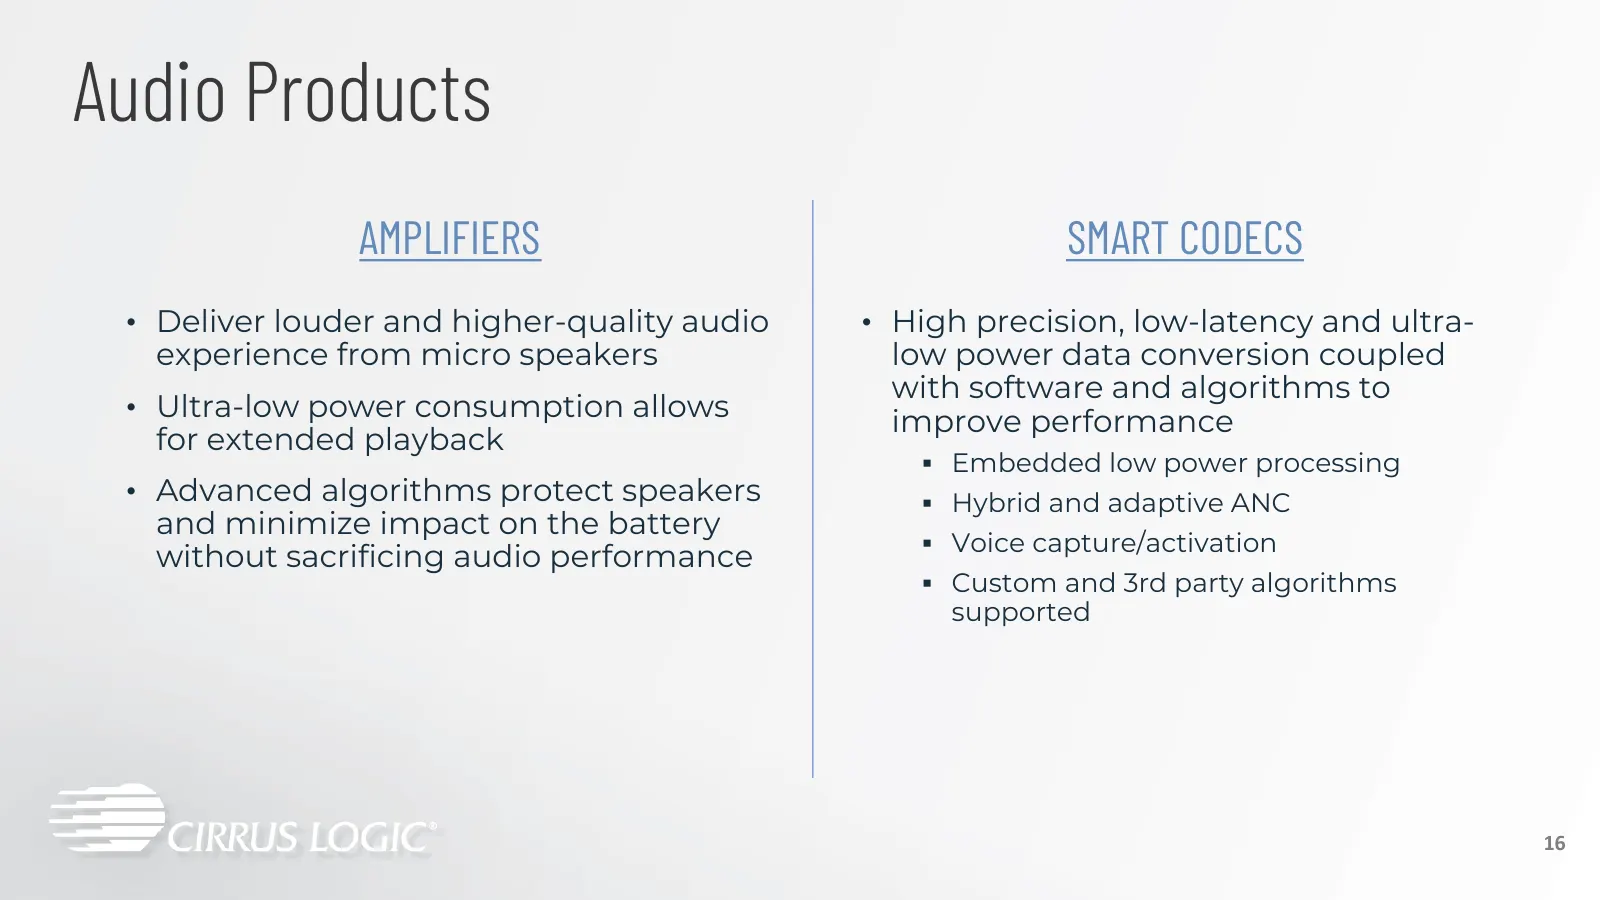
Audio Products AMPLIFIERS SMART CODECS • Deliver louder and higher-quality audio • High precision, low-latency and ultra- experience from micro speakers low power data conversion coupled with software and algorithms to • Ultra-low power consumption allows improve performance for extended playback §
Slide 17: High-Performance Mixed-Signal Products
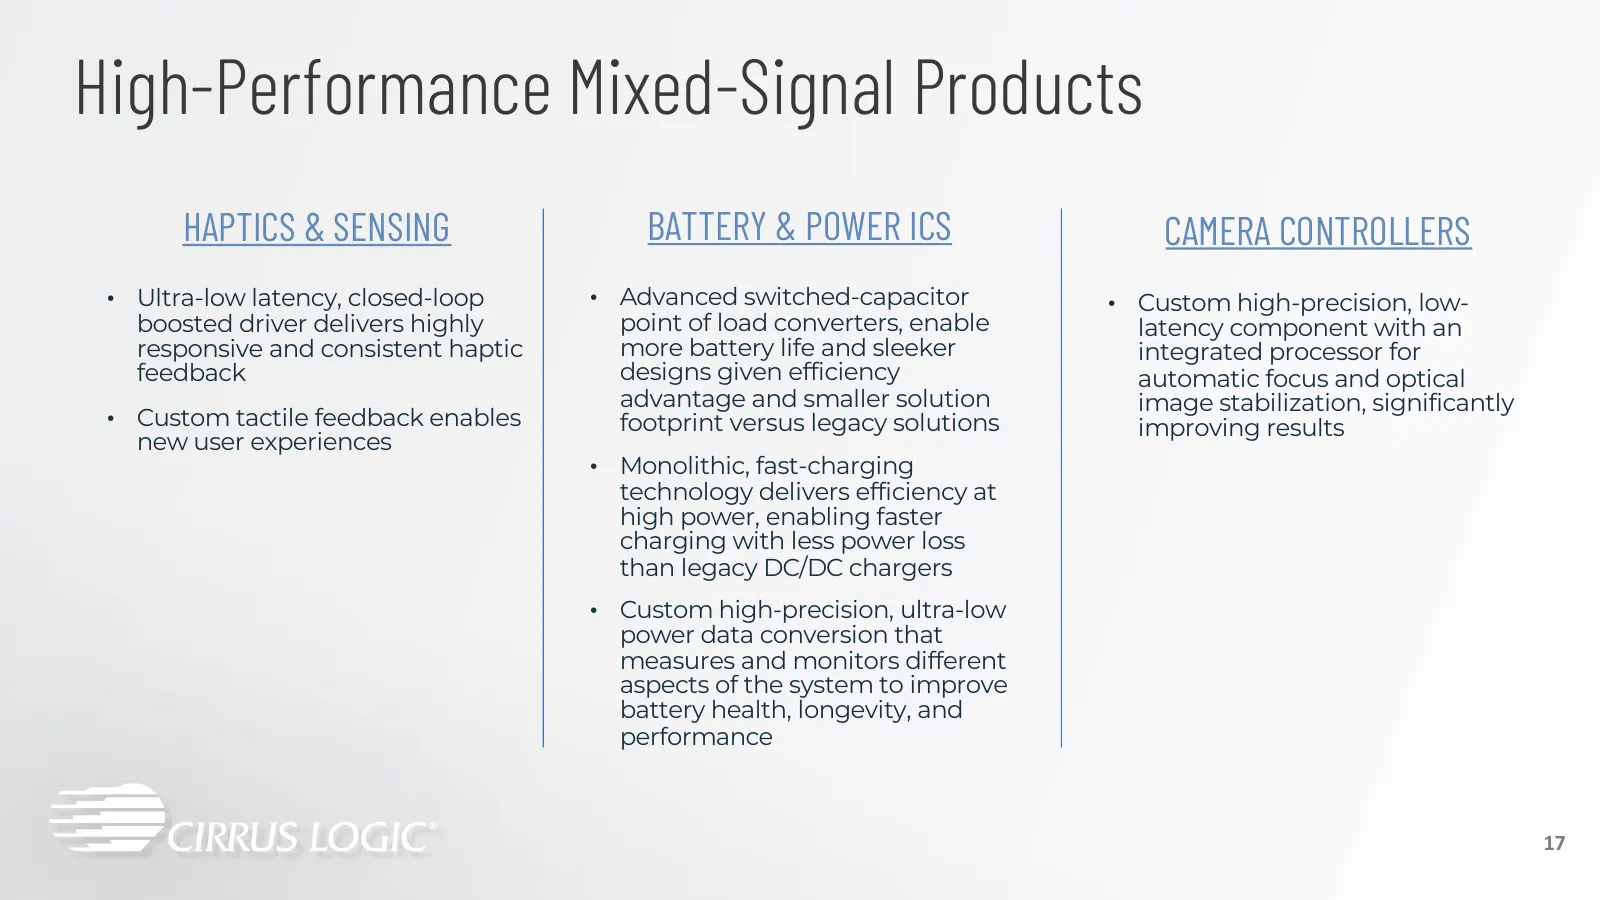
High-Performance Mixed-Signal Products HAPTICS & SENSING BATTERY & POWER ICS CAMERA CONTROLLERS • Ultra-low latency, closed-loop • Advanced switched-capacitor • Custom high-precision, low- boosted driver delivers highly point of load converters, enable latency component with an responsive and consis

Slide 18: Financials
Financials 18
Slide 19: Committed to Driving Shareholder Value
Committed to Driving Shareholder Value DRIVING LONG-TERM TARGETING LONG-TERM CONTINUING TO GENERATE REVENUE GROWTH OPERATING PROFIT EXPANSION STRONG CASH FLOW 19
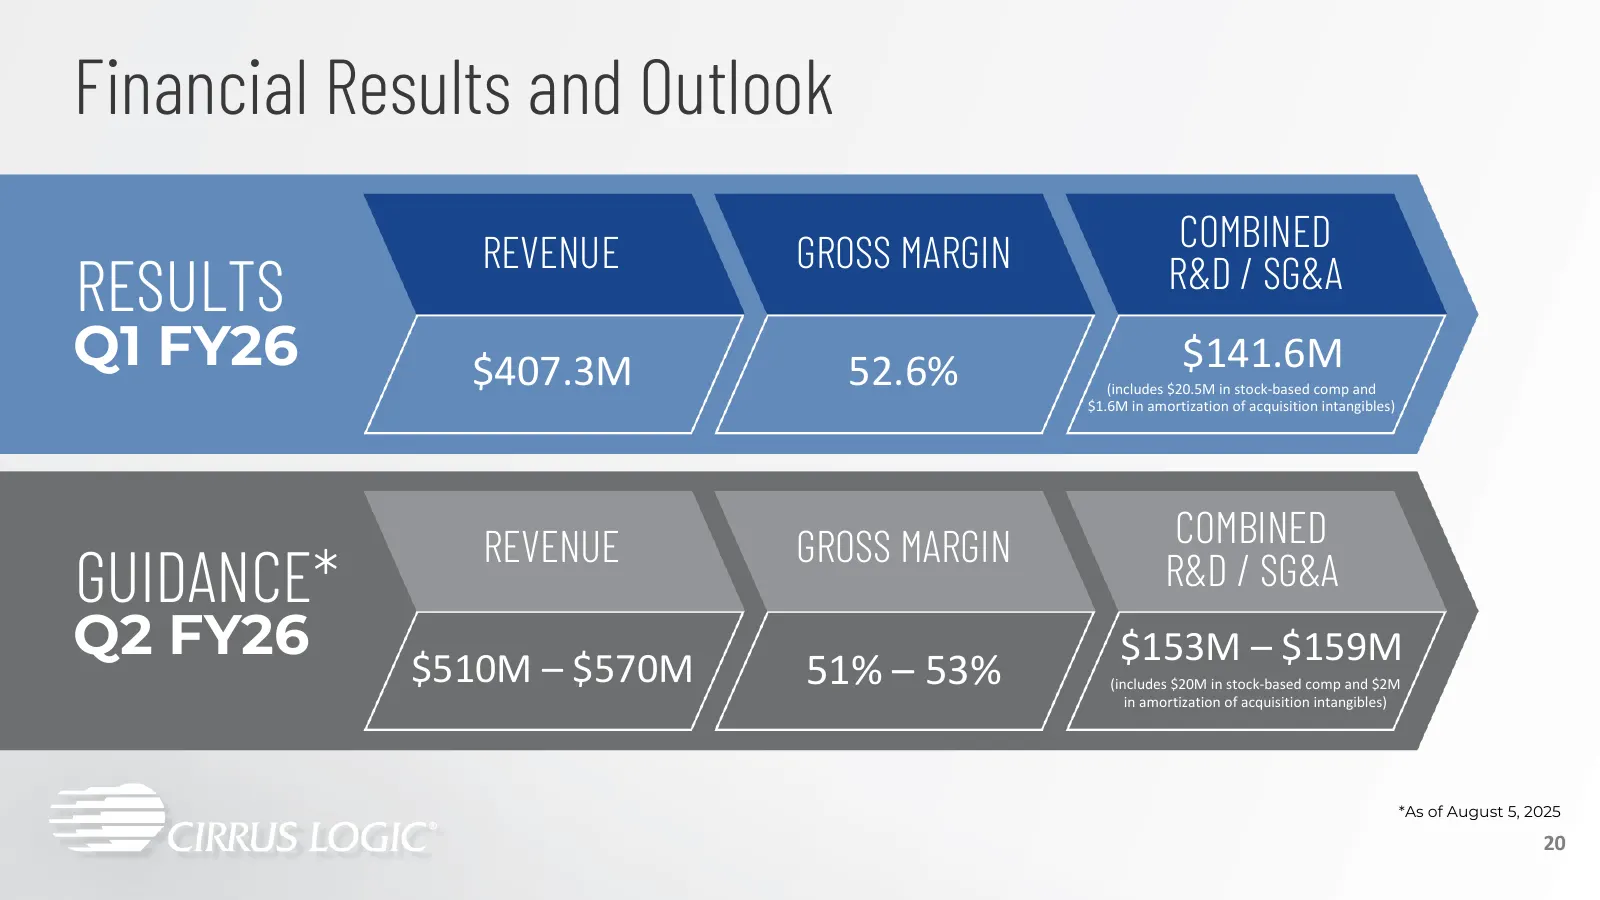
Slide 20: Financial Results and Outlook
Financial Results and Outlook REVENUE GROSS MARGIN COMBINED RESULTS R&D / SG&A Q1 FY26 $407.3M 52.6% $141.6M (includes $20.5M in stock-based comp and $1.6M in amortization of acquisition intangibles) REVENUE GROSS MARGIN COMBINED GUIDANCE* R&D / SG&A Q2 FY26 $510M – $570M $153M – $159M 51% – 53% (in
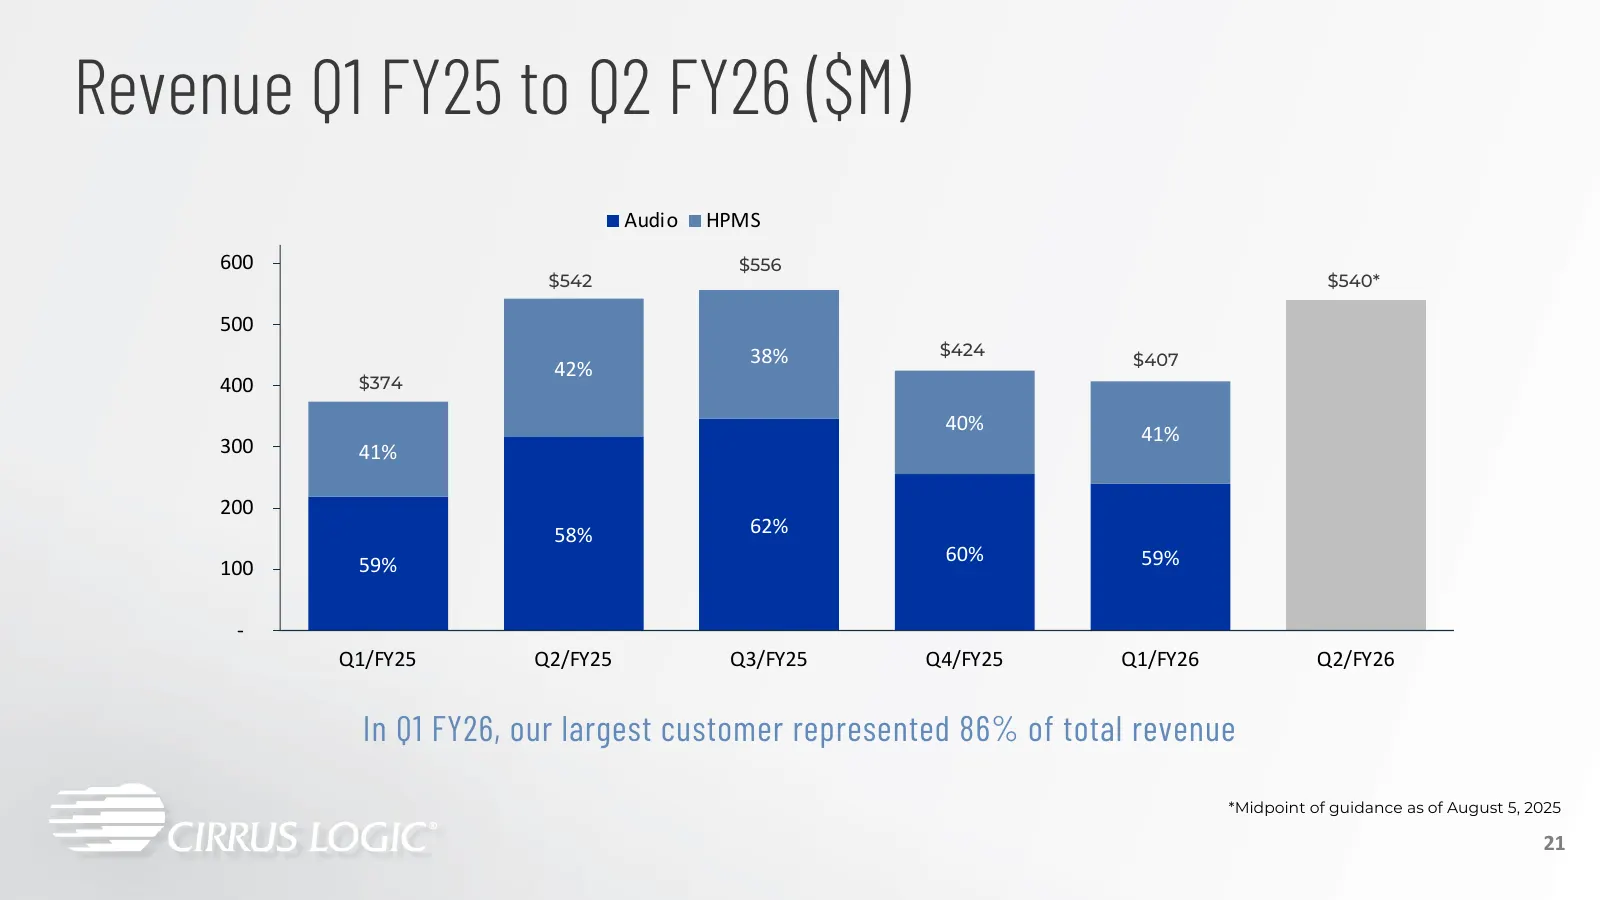
Slide 21: Revenue Q1 FY25 to Q2 FY26 ($M)
Revenue Q1 FY25 to Q2 FY26 ($M) Audio HPMS 600 $556 $542 $540* 500 38% $424 $407 42% 400 $374 40% 41% 300 41% 200 58% 62% 60% 59% 100 59% - Q1/FY25 Q2/FY25 Q3/FY25 Q4/FY25 Q1/FY26 Q2/FY26 In Q1 FY26, our largest customer represented 86% of total revenue *Midpoint of guidance as of August 5, 2025 21
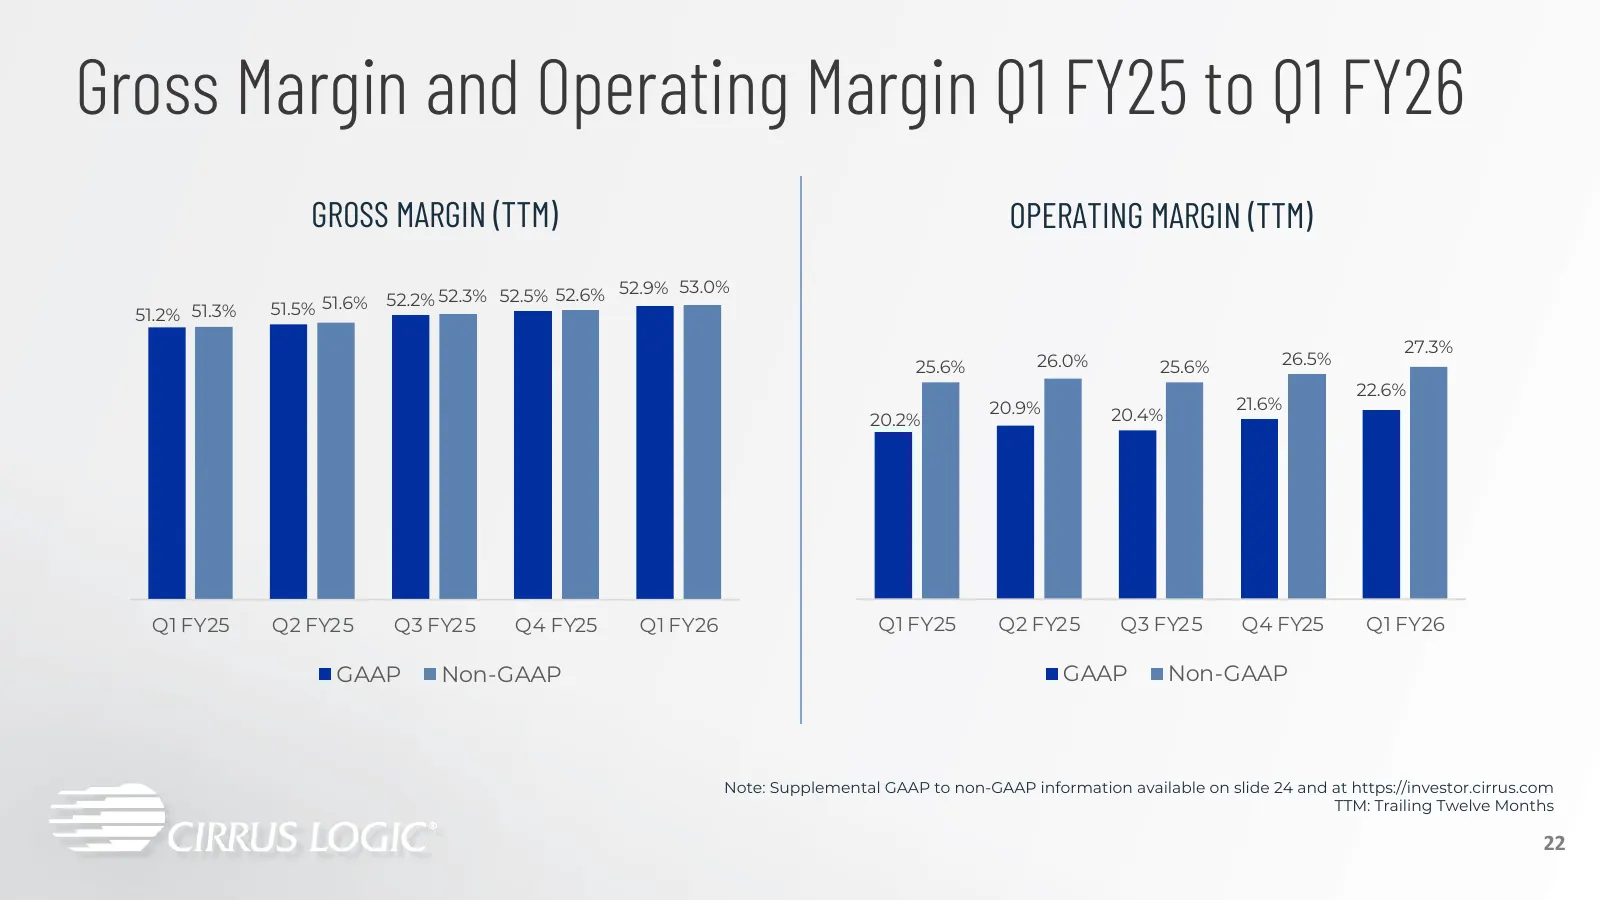
Slide 22: Gross Margin and Operating Margin Q1 FY25 to Q1 FY26
Gross Margin and Operating Margin Q1 FY25 to Q1 FY26 GROSS MARGIN (TTM) OPERATING MARGIN (TTM) 52.9% 53.0% 51.5% 51.6% 52.2% 52.3% 52.5% 52.6% 51.2% 51.3% 27.3% 25.6% 26.0% 25.6% 26.5% 22.6% 20.9% 21.6% 20.2% 20.4% Q1 FY25 Q2 FY25 Q3 FY25 Q4 FY25 Q1 FY26 Q1 FY25 Q2 FY25 Q3 FY25 Q4 FY25 Q1 FY26 GAAP
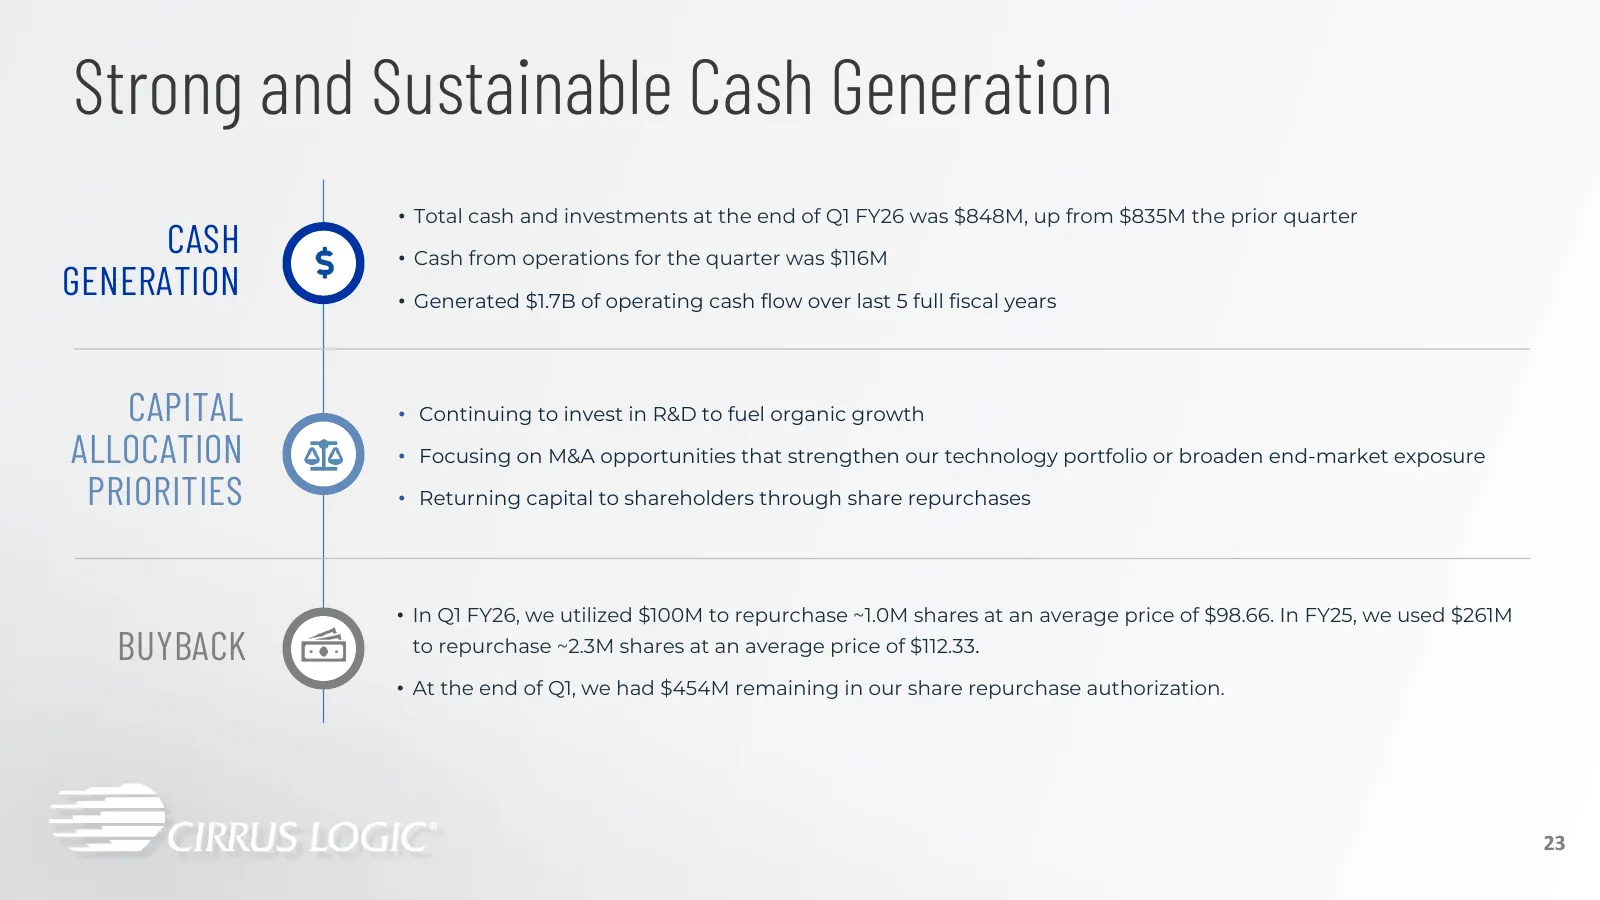
Slide 23: Strong and Sustainable Cash Generation
Strong and Sustainable Cash Generation • Total cash and investments at the end of Q1 FY26 was $848M, up from $835M the prior quarter CASH • Cash from operations for the quarter was $116M GENERATION • Generated $1.7B of operating cash flow over last 5 full fiscal years CAPITAL • Continuing to invest
Slide 24: GAAP and Non-GAAP Financial Information
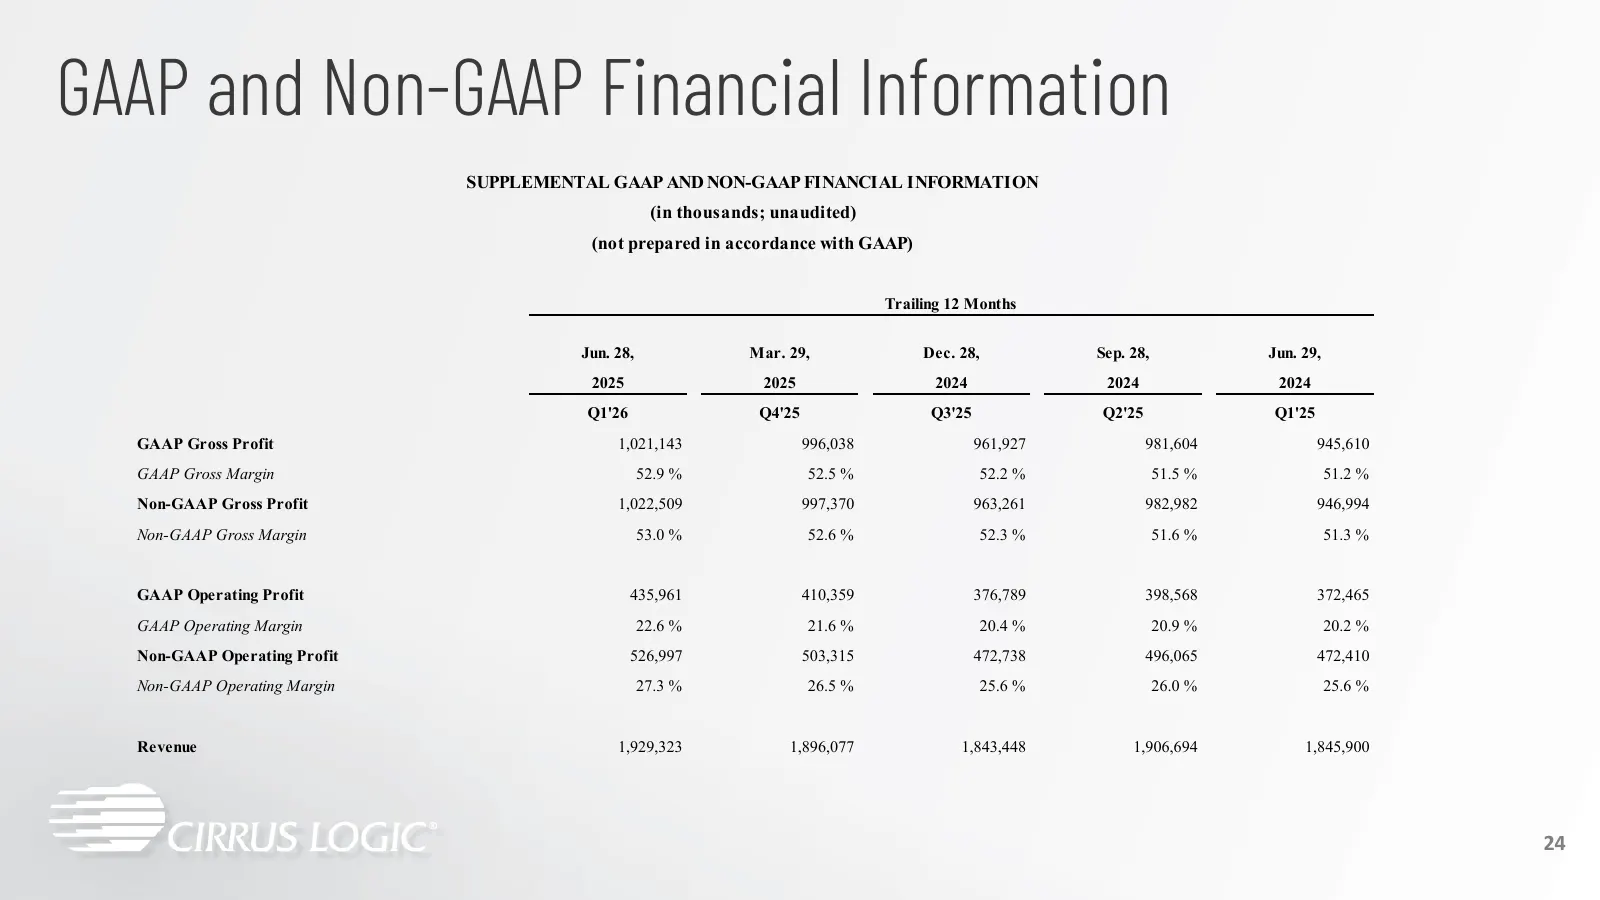
GAAP and Non-GAAP Financial Information SUPPLEMENTAL GAAP AND NON-GAAP FINANCIAL INFORMATION (in thousands; unaudited) (not prepared in accordance with GAAP) Trailing 12 Months Jun. 28, Mar. 29, Dec. 28, Sep. 28, Jun. 29, 2025 2025 2024 2024 2024 Q1'26 Q4'25 Q3'25 Q2'25 Q1'25 GAAP Gross Profit 1,021

Slide 25
Source: Internet Archive copy of s21.q4cdn.com
More decks from Cirrus Logic, Inc.
 Q1 2026 Earnings Presentation26 slides · Aug 5, 2026
 Q3 2026 Earnings Presentation25 slides · Feb 3, 2026
 Q4 2025 Earnings Presentation27 slides · May 6, 2025
 Q2 FY25 Earnings Presentation26 slides · Nov 4, 2024
 Q1 FY25 Earnings Presentation26 slides · Aug 6, 2024
 Q4 FY2024 Earnings Presentation28 slides · May 7, 2024