Perion Network Ltd · NASDAQ:PERI
Perion Network — Investor Presentation (December 2013)
32 slides from Perion Network's investor presentation, December 2013
Slide 1: Perion Network
Perion Network (NASDAQ: PERI) December 2013
Slide 2: Safe Harbor Statement
Safe Harbor Statement This presentation contains historical information and forward-looking statements within the meaning of The Private Securities Litigation Reform Act of 1995 with respect to the business, financial condition and results of operations of Perion. The words “will”, “believe,” “expec
Slide 3: Quick Facts About Us
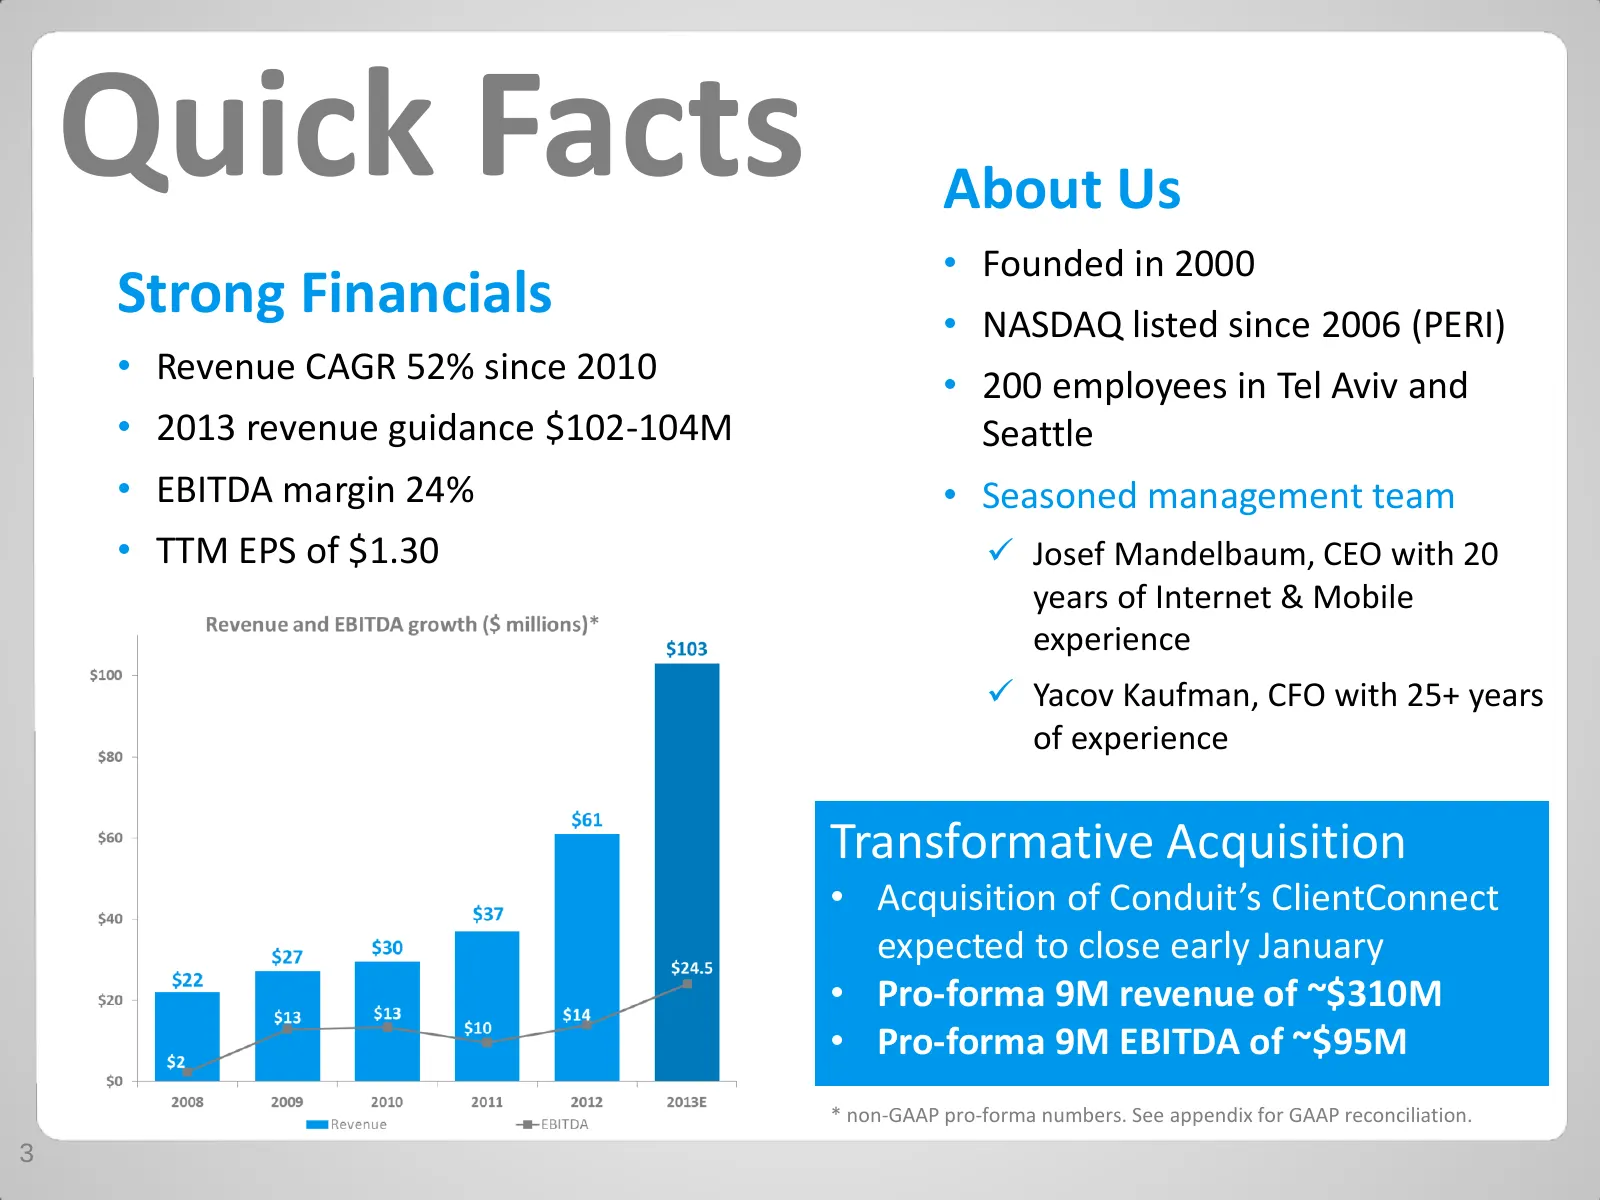
Quick Facts About Us • Founded in 2000 Strong Financials • NASDAQ listed since 2006 (PERI) • Revenue CAGR 52% since 2010 • 200 employees in Tel Aviv and • 2013 revenue guidance $102-104M Seattle • EBITDA margin 24% • Seasoned management team • TTM EPS of $1.30 Josef Mandelbaum, CEO with 20 years o
Slide 4: The Perion Story
The Perion Story 4
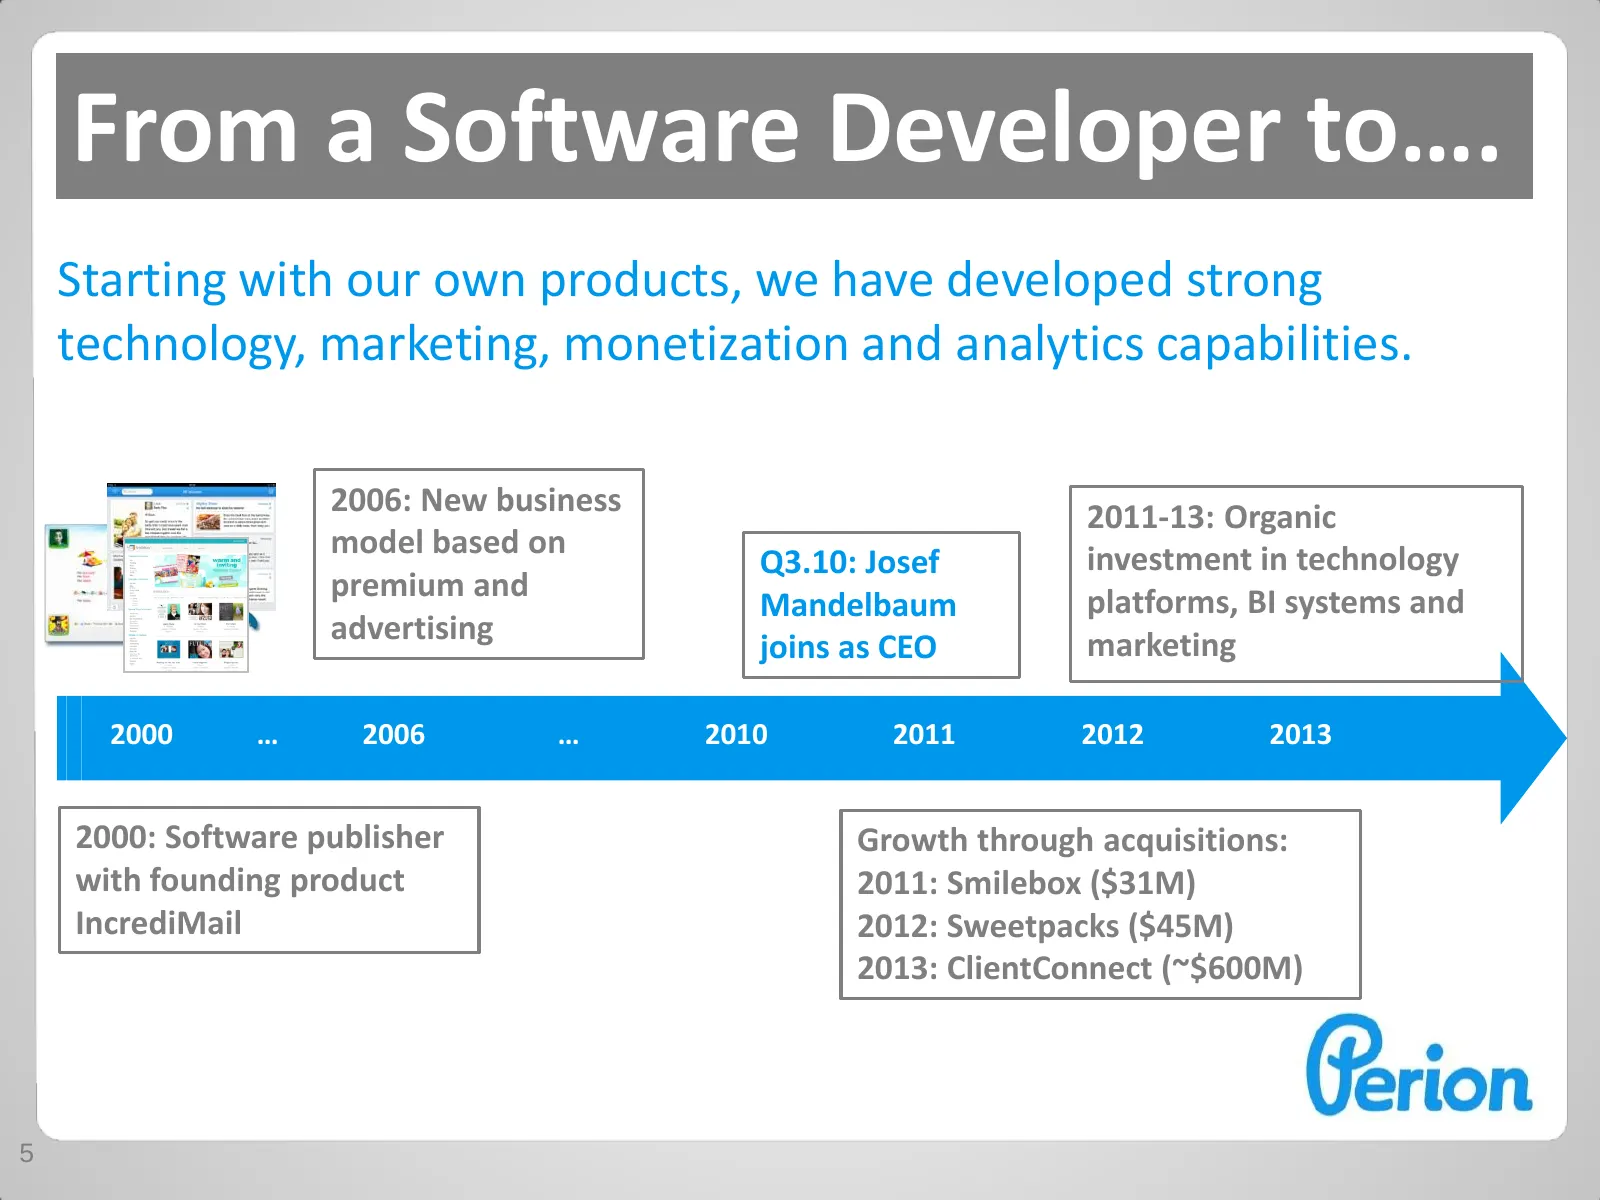
Slide 5: From a Software Developer to…
From a Software Developer to…. Starting with our own products, we have developed strong technology, marketing, monetization and analytics capabilities. 2006: New business 2011-13: Organic model based on investment in technology Q3.10: Josef premium and platforms, BI systems and Mandelbaum advertisin
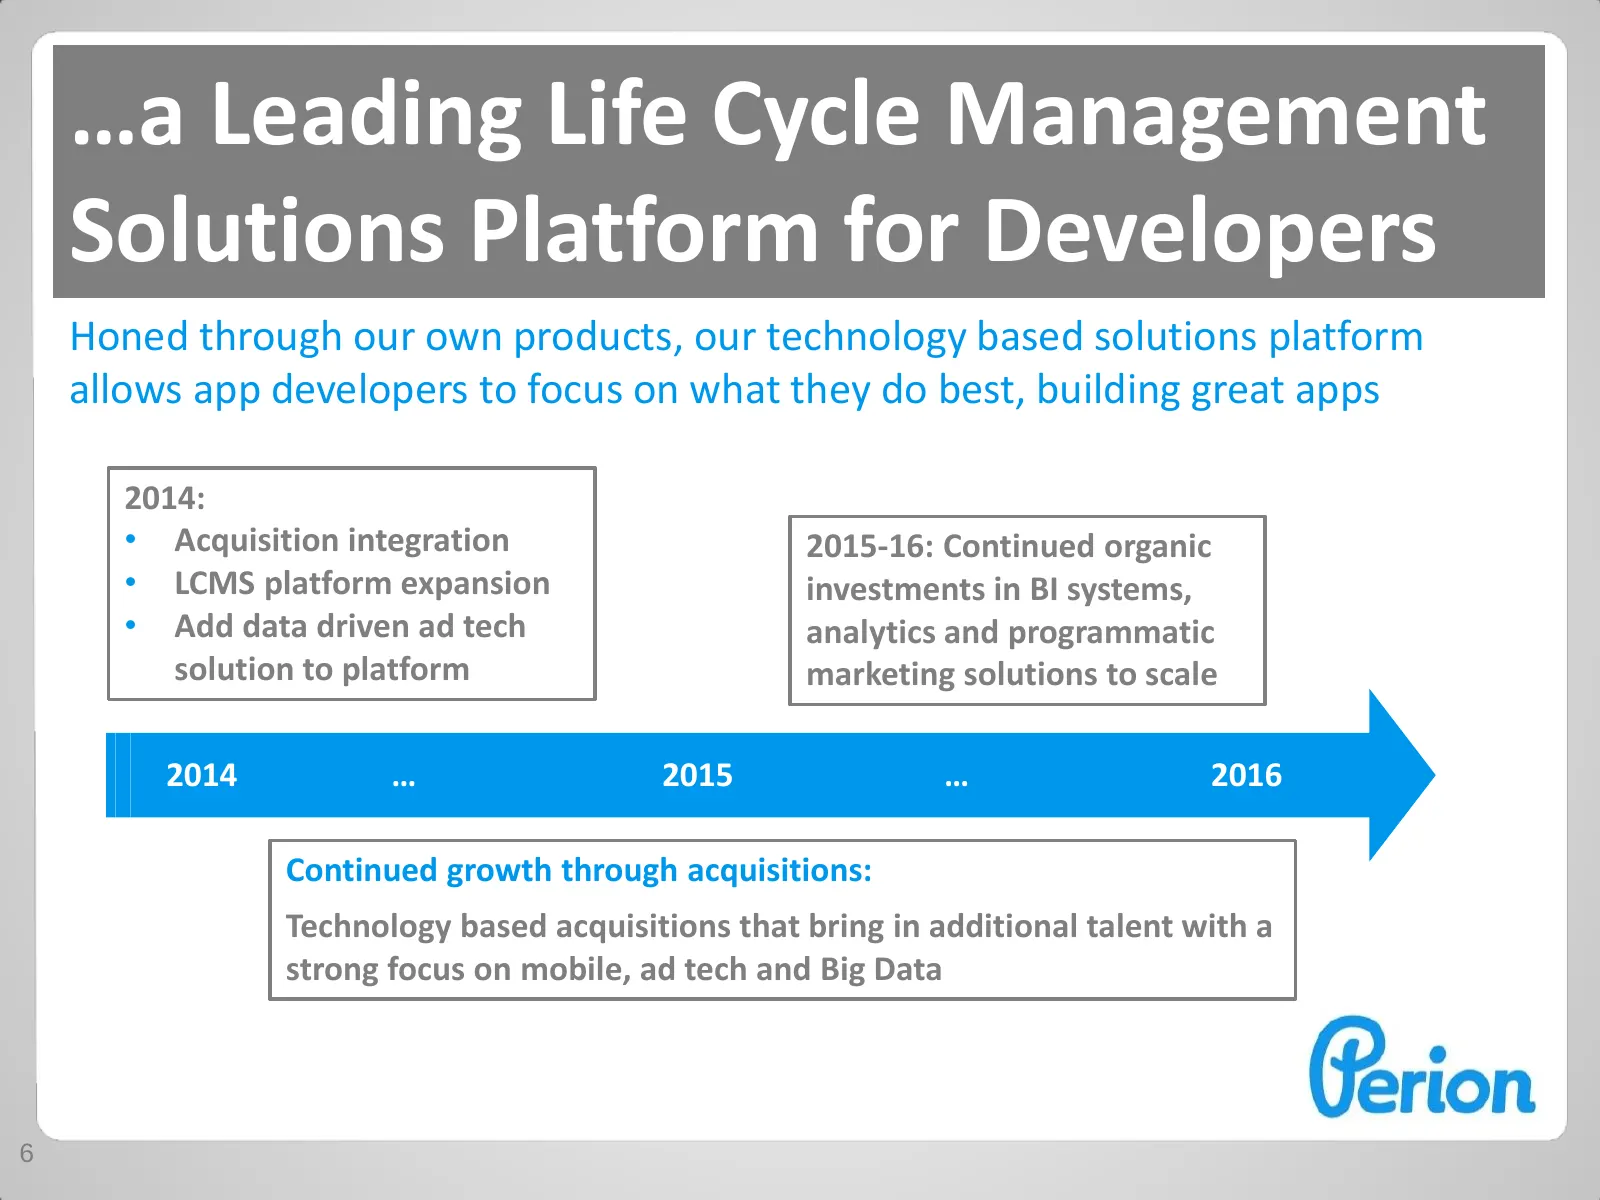
Slide 6: …a Leading Life Cycle Management Solutions Platform for Developers
…a Leading Life Cycle Management Solutions Platform for Developers Honed through our own products, our technology based solutions platform allows app developers to focus on what they do best, building great apps 2014: • Acquisition integration 2015-16: Continued organic • LCMS platform expansion inv
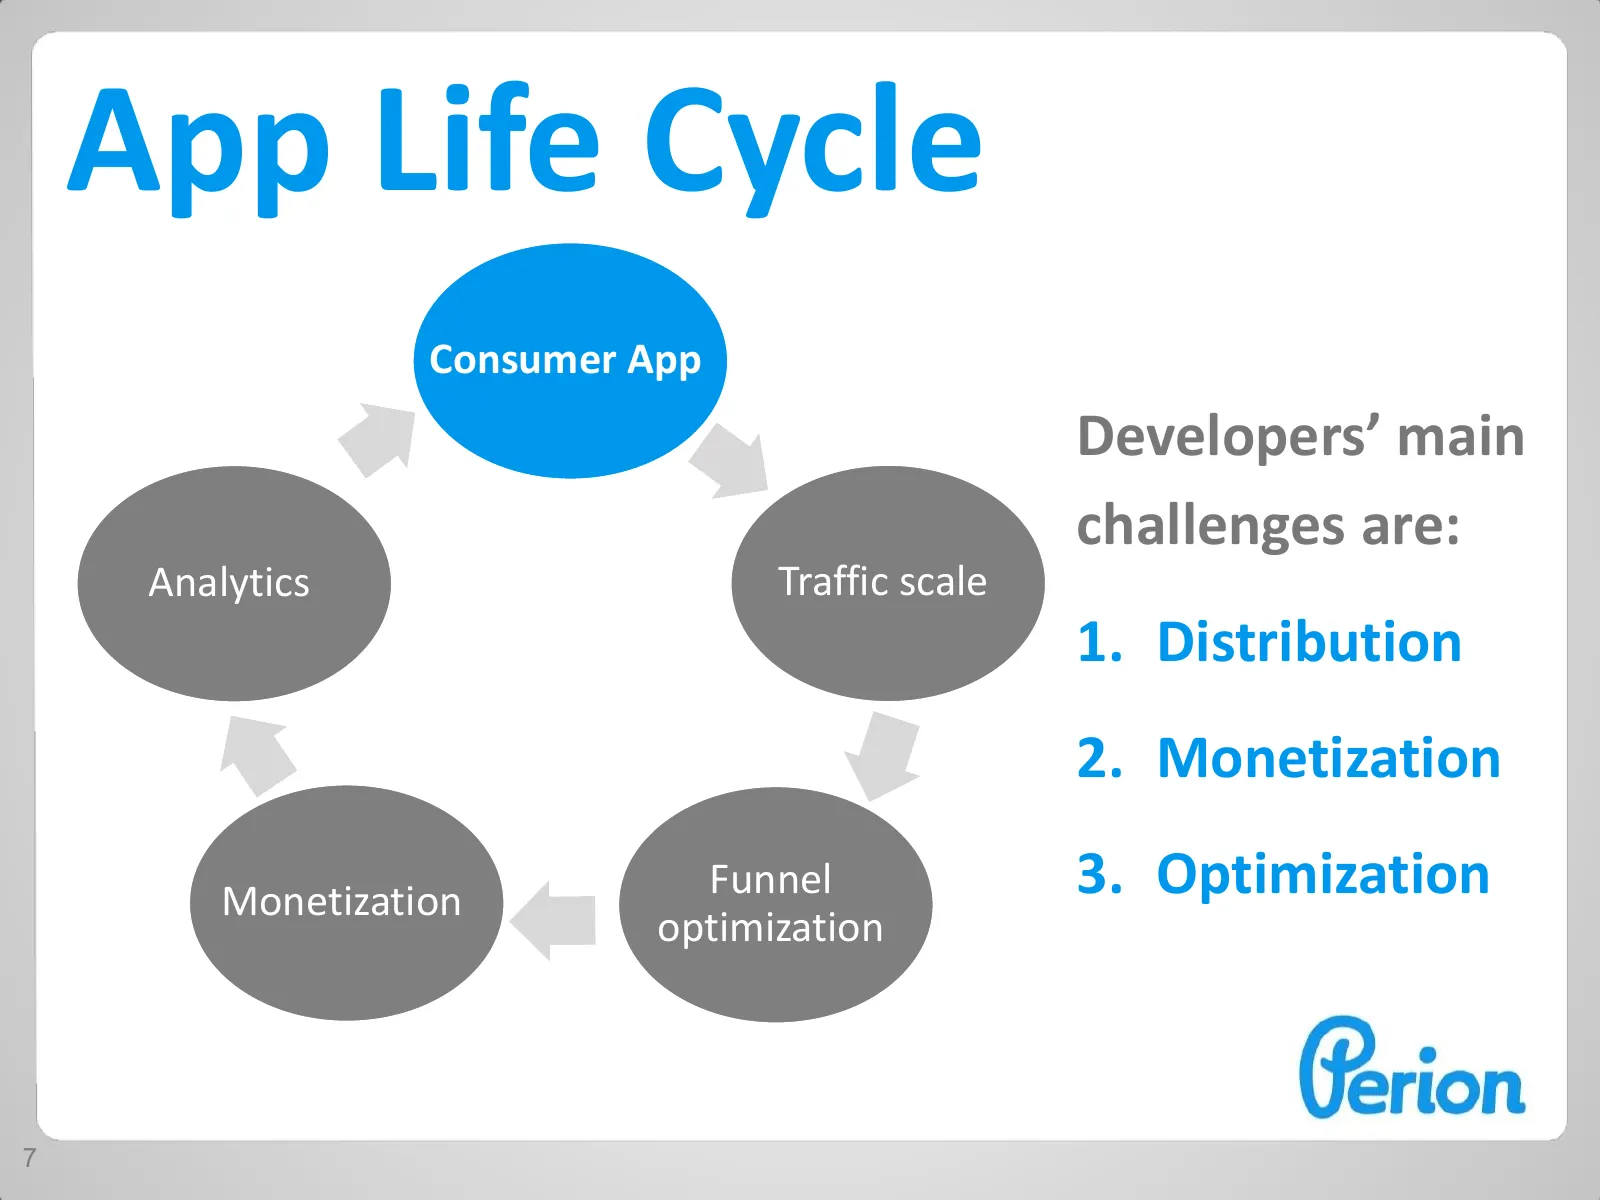
Slide 7: App Life Cycle
App Life Cycle Consumer App Developers’ main challenges are: Analytics Traffic scale 1. Distribution 2. Monetization Monetization Funnel 3. Optimization optimization 7
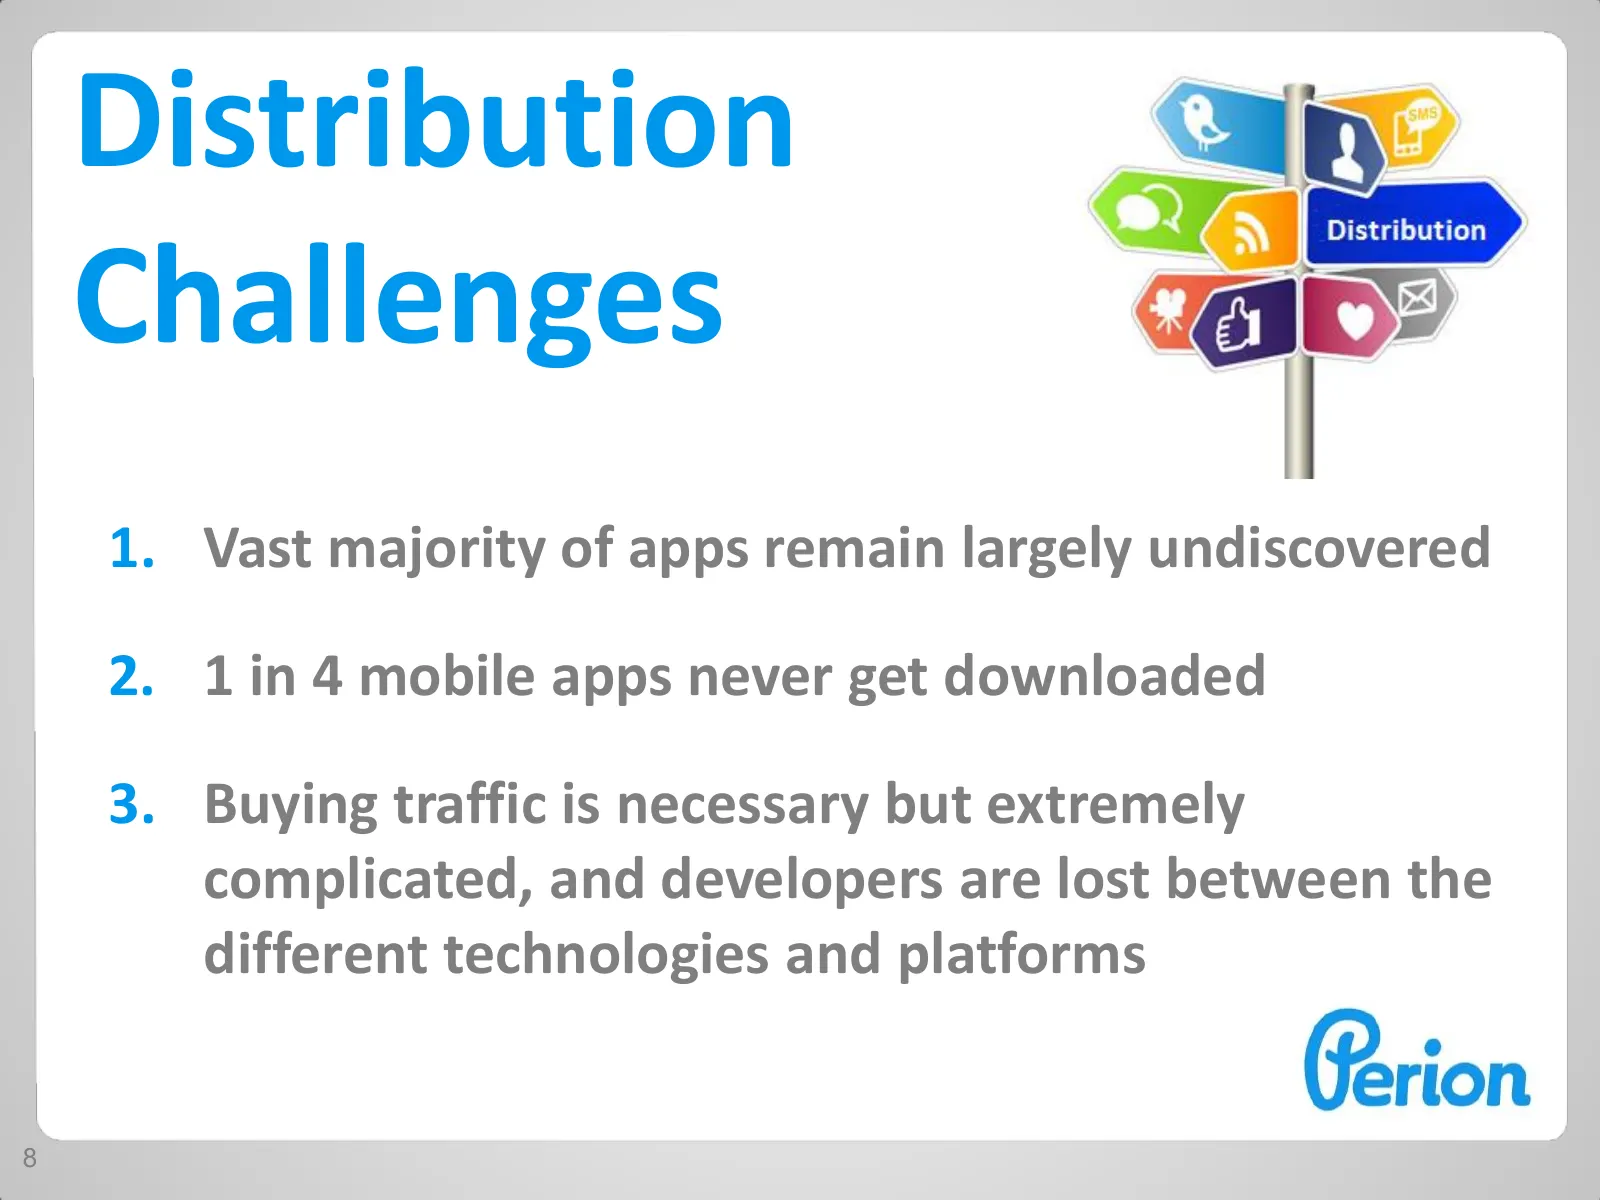
Slide 8: Distribution Challenges
Distribution Challenges 1. Vast majority of apps remain largely undiscovered 2. 1 in 4 mobile apps never get downloaded 3. Buying traffic is necessary but extremely complicated, and developers are lost between the different technologies and platforms 8
Slide 9: Monetization Challenges
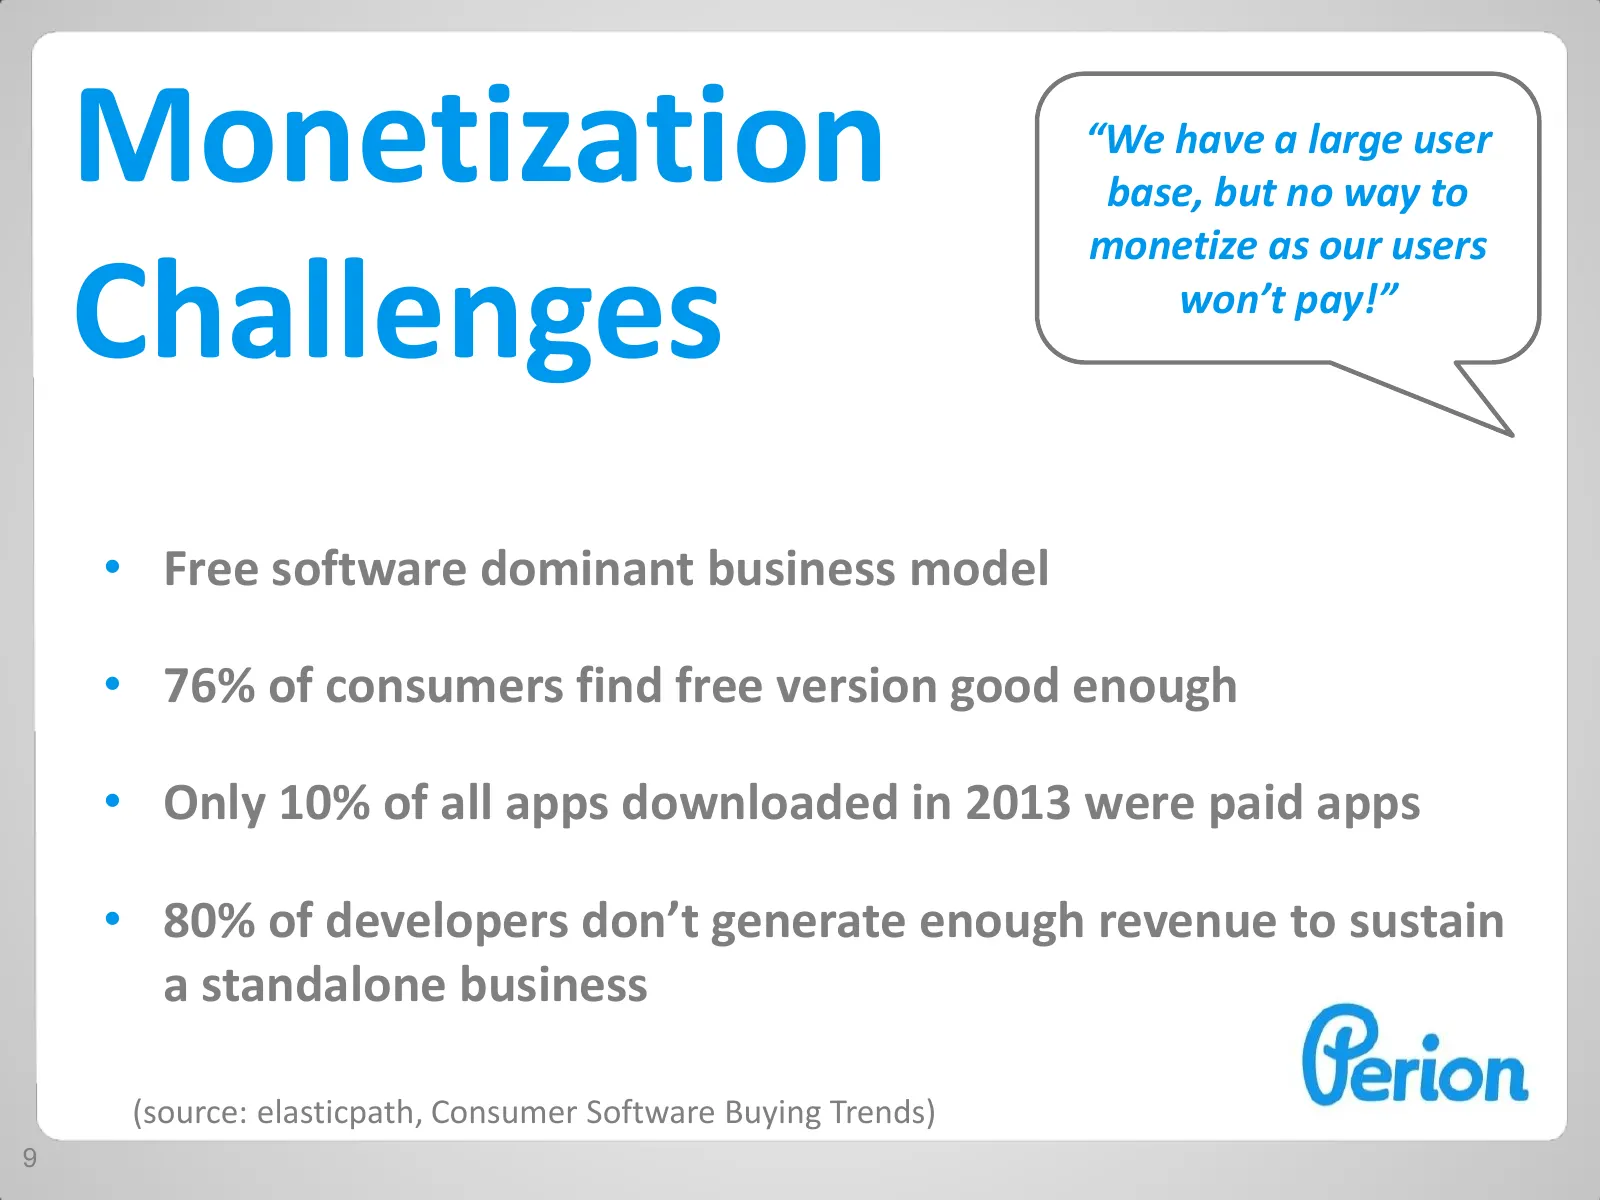
Monetization “We have a large user base, but no way to monetize as our users Challenges won’t pay!” • Free software dominant business model • 76% of consumers find free version good enough • Only 10% of all apps downloaded in 2013 were paid apps • 80% of developers don’t generate enough revenue to s
Slide 10: Optimization Challenges
Optimization Challenges Most app developers are small businesses without analytical capabilities or the required funds to: • Improve funnel conversion • Create systems for tracking revenue per user (LTV) • Implement traffic acquisition with positive ROI 10
Slide 11: Developers want to focus on making the best product
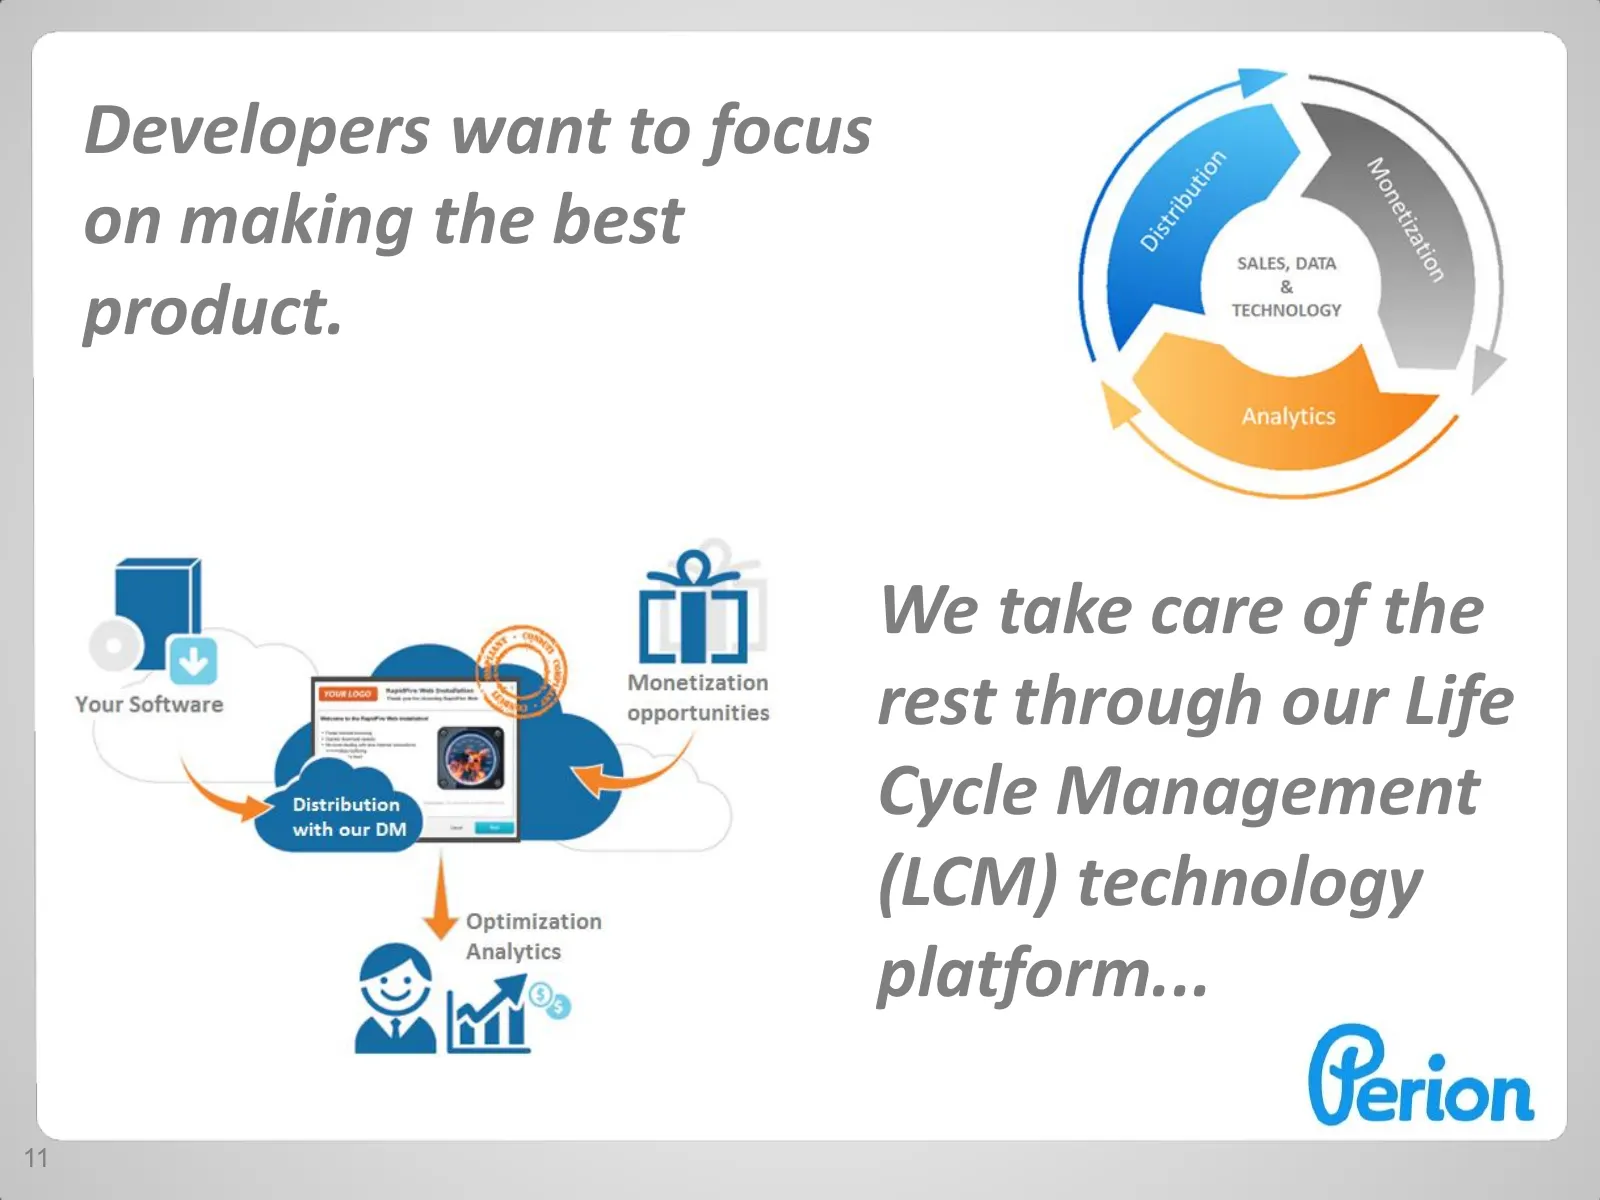
Developers want to focus on making the best product. We take care of the rest through our Life Cycle Management (LCM) technology platform... 11
Slide 12: Distribution Solution: Download Manager
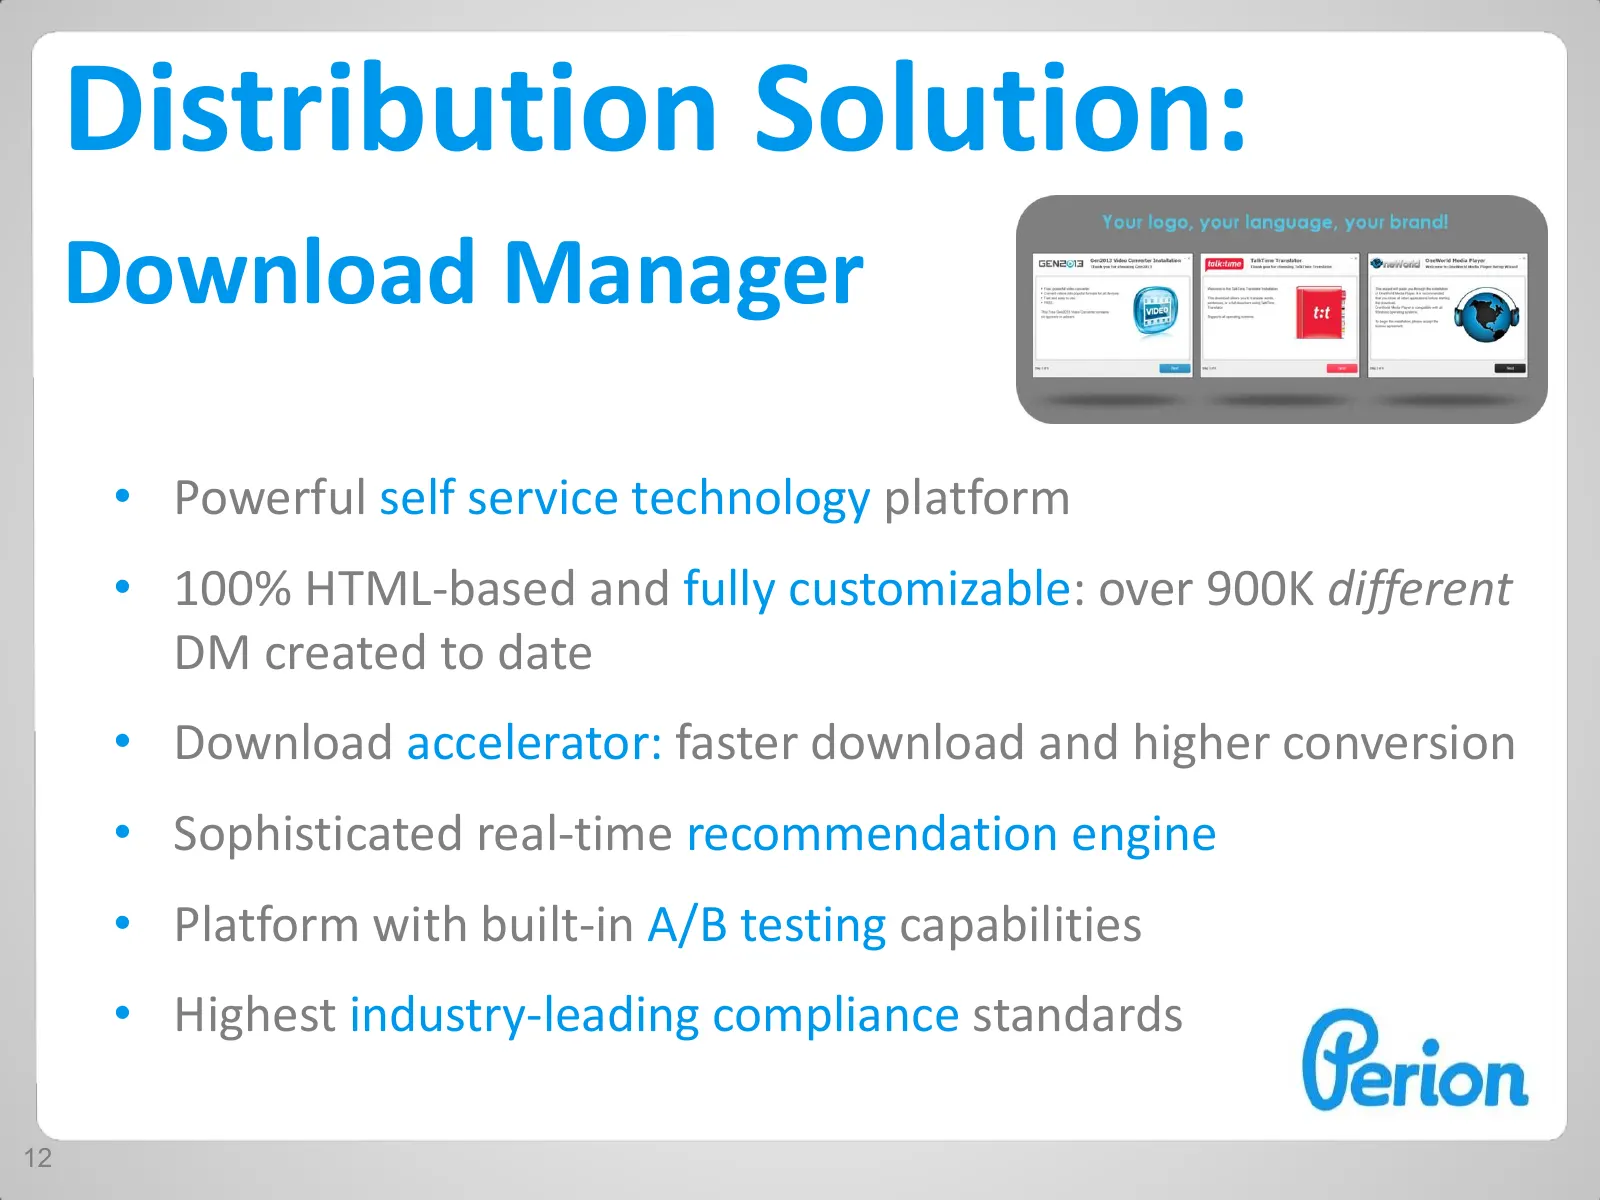
Distribution Solution: Download Manager • Powerful self service technology platform • 100% HTML-based and fully customizable: over 900K different DM created to date • Download accelerator: faster download and higher conversion • Sophisticated real-time recommendation engine • Platform with built-in
Slide 13: Distribution Solution: Marketing Services
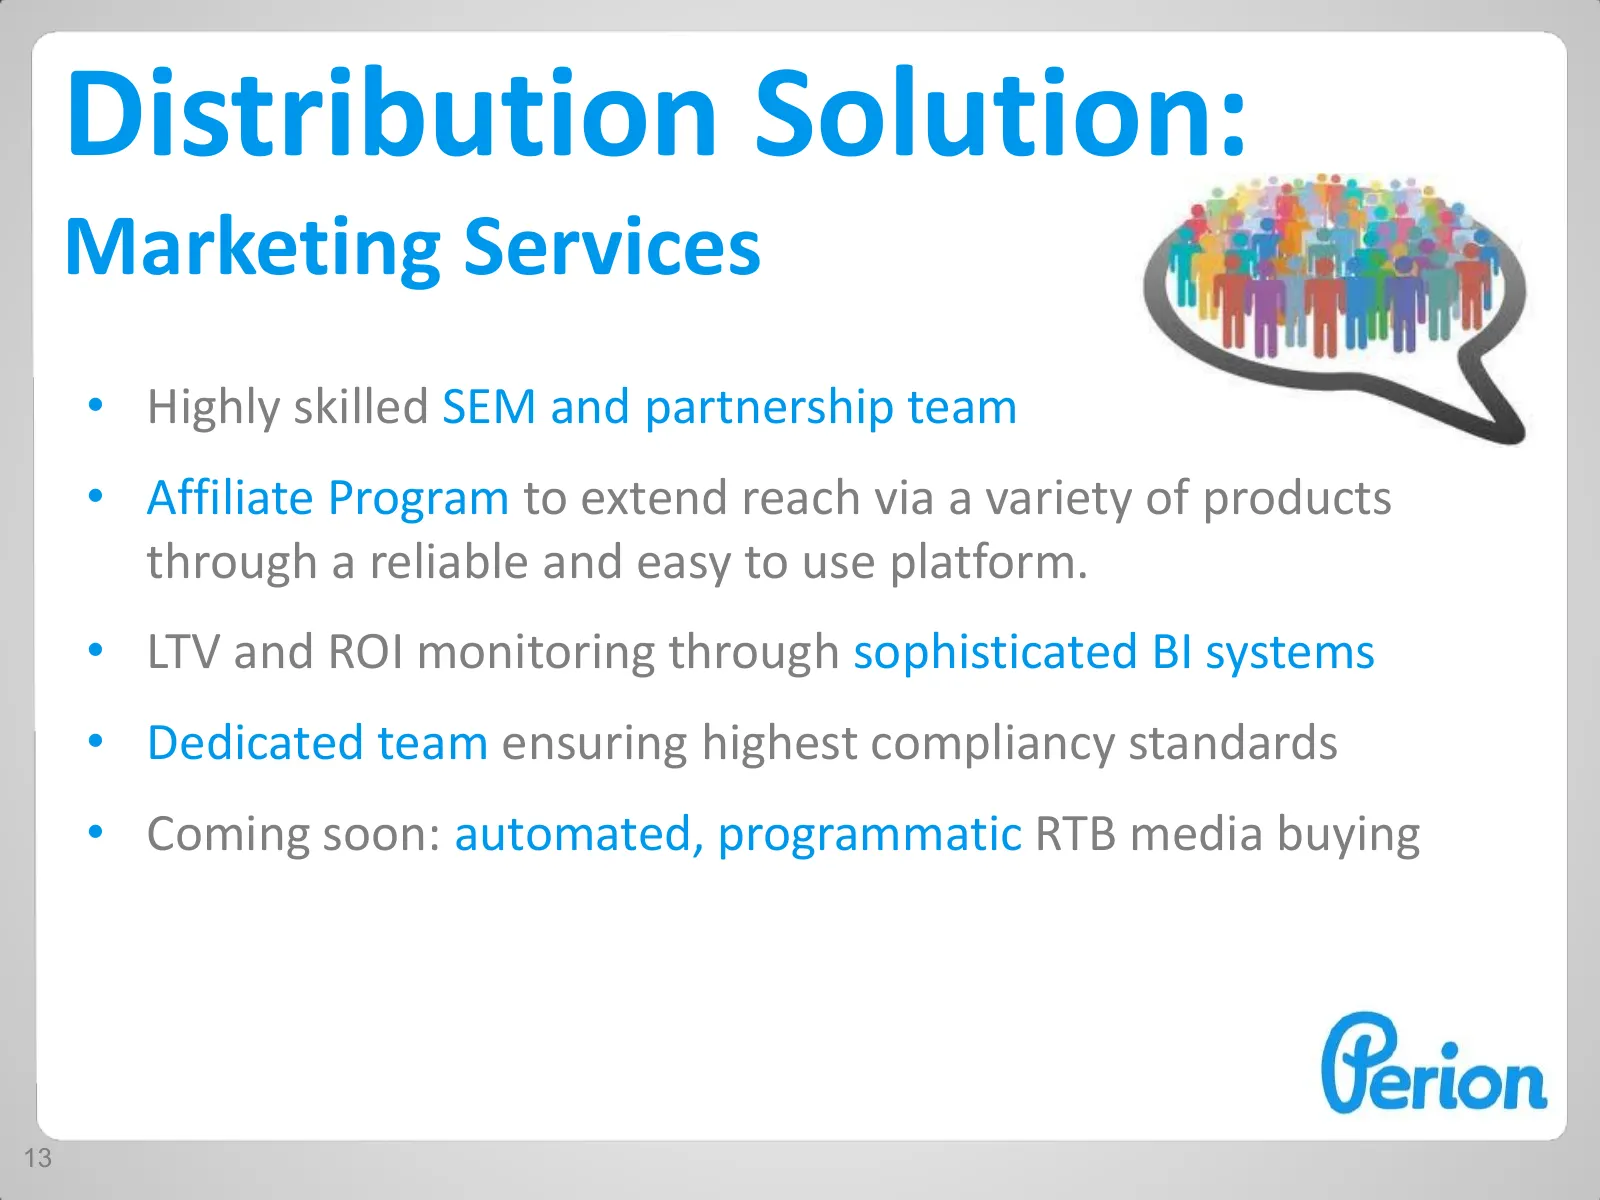
Distribution Solution: Marketing Services • Highly skilled SEM and partnership team • Affiliate Program to extend reach via a variety of products through a reliable and easy to use platform. • LTV and ROI monitoring through sophisticated BI systems • Dedicated team ensuring highest compliancy standa
Slide 14: Monetization Solutions
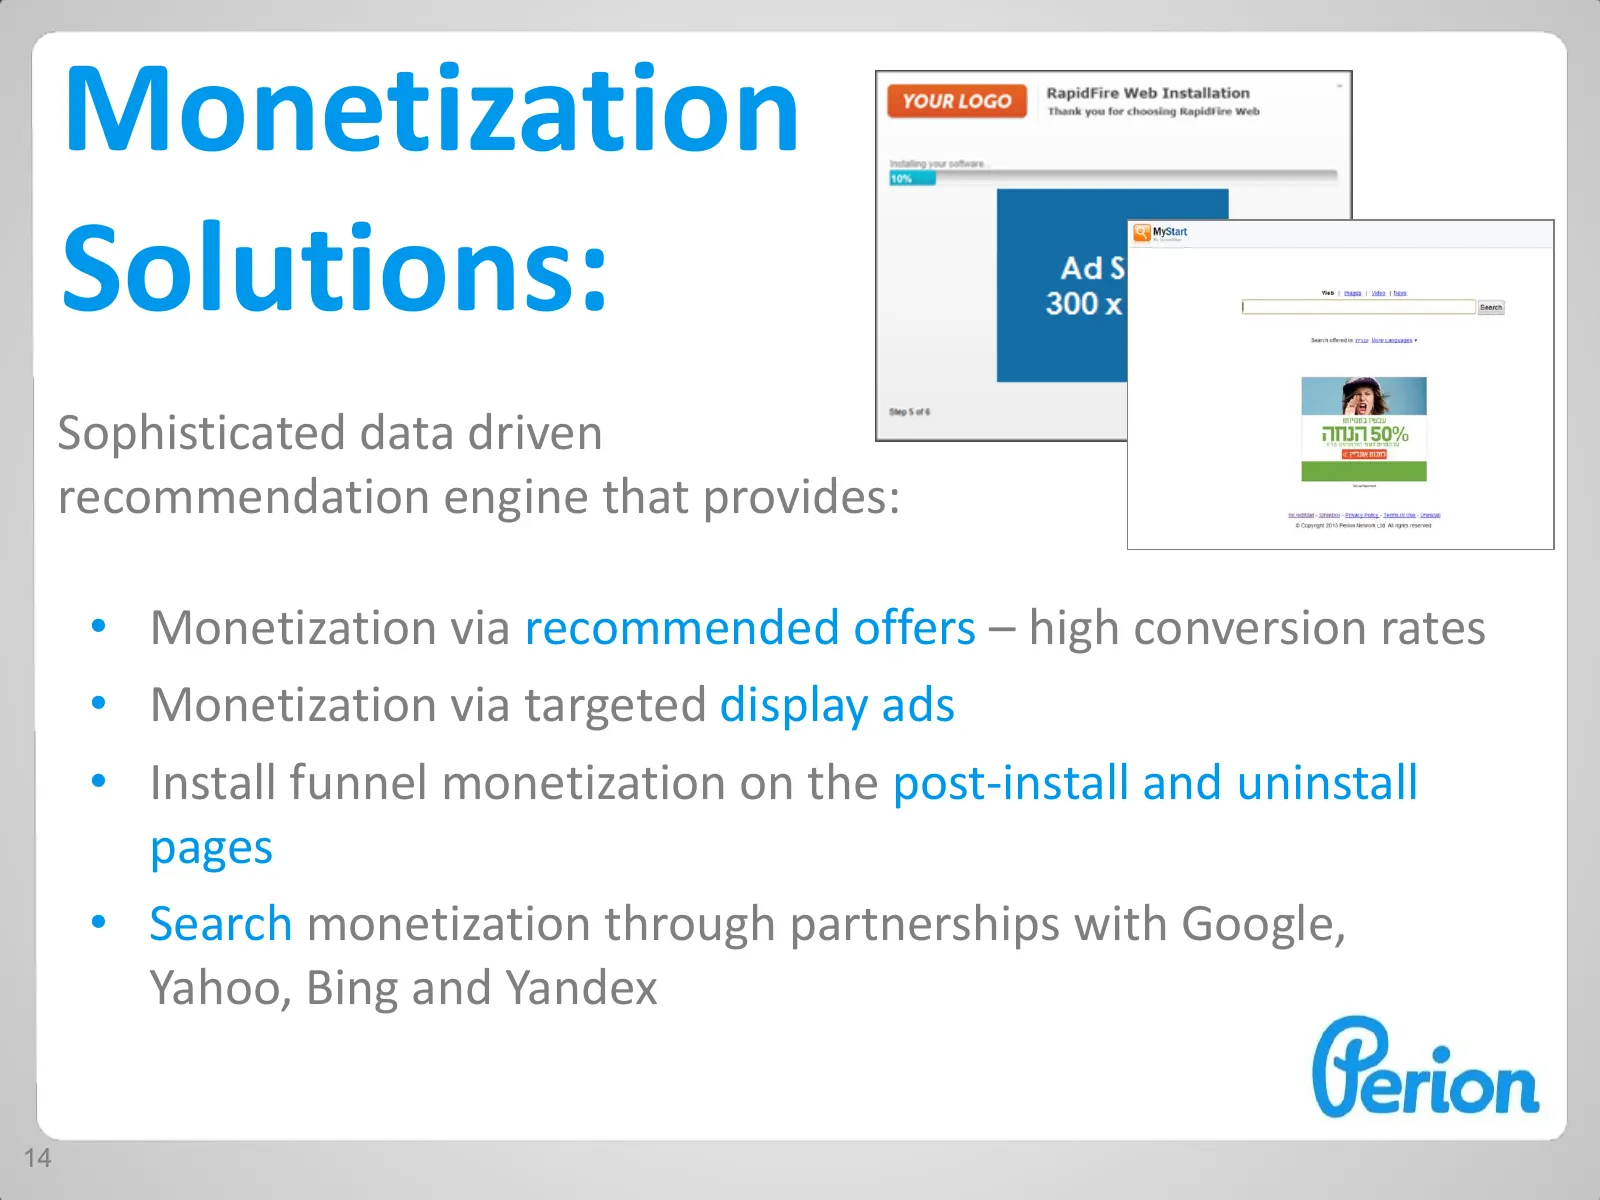
Monetization Solutions: Sophisticated data driven recommendation engine that provides: • Monetization via recommended offers – high conversion rates • Monetization via targeted display ads • Install funnel monetization on the post-install and uninstall pages • Search monetization through partnership
Slide 15: Analytics Solution
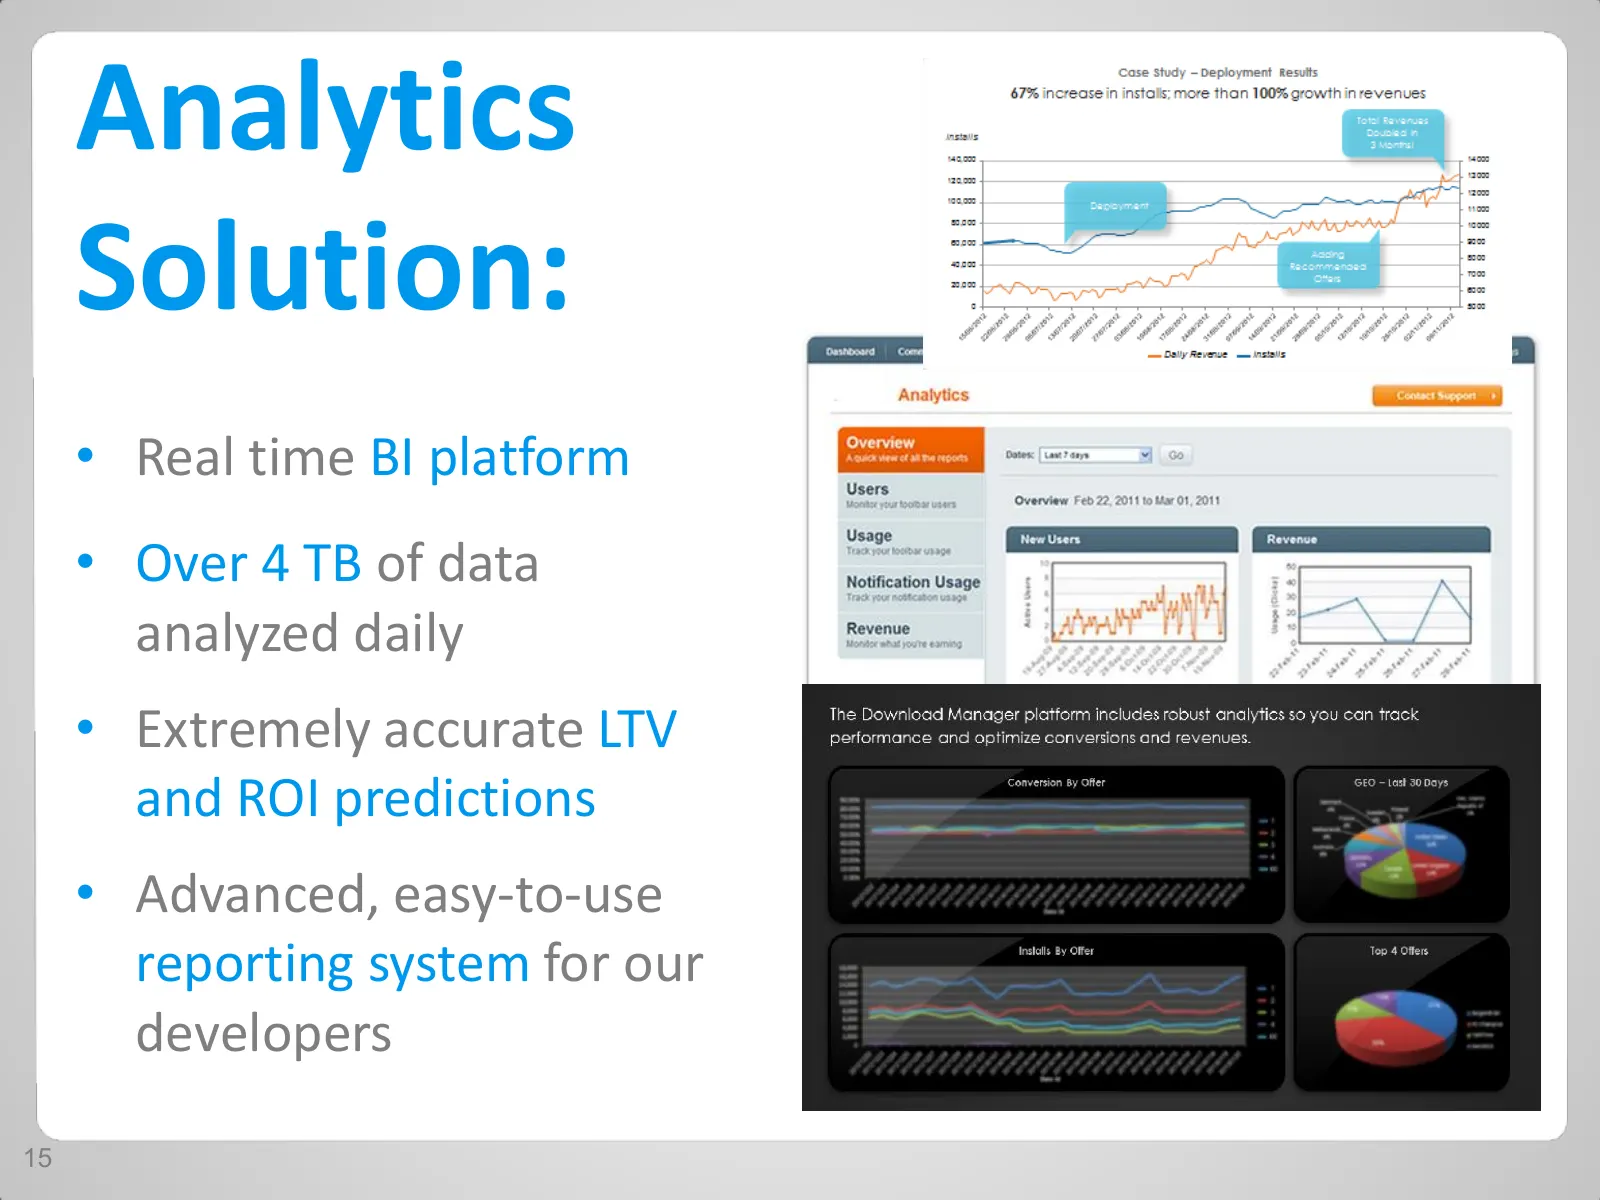
Analytics Solution: • Real time BI platform • Over 4 TB of data analyzed daily • Extremely accurate LTV and ROI predictions • Advanced, easy-to-use reporting system for our developers 15
Slide 16: What Makes Us Different
What Makes Us Different We understand developers, because we are one. The technology we are offering is the one we use for distributing, monetizing and optimizing our own products. 16
Slide 17: Our Products
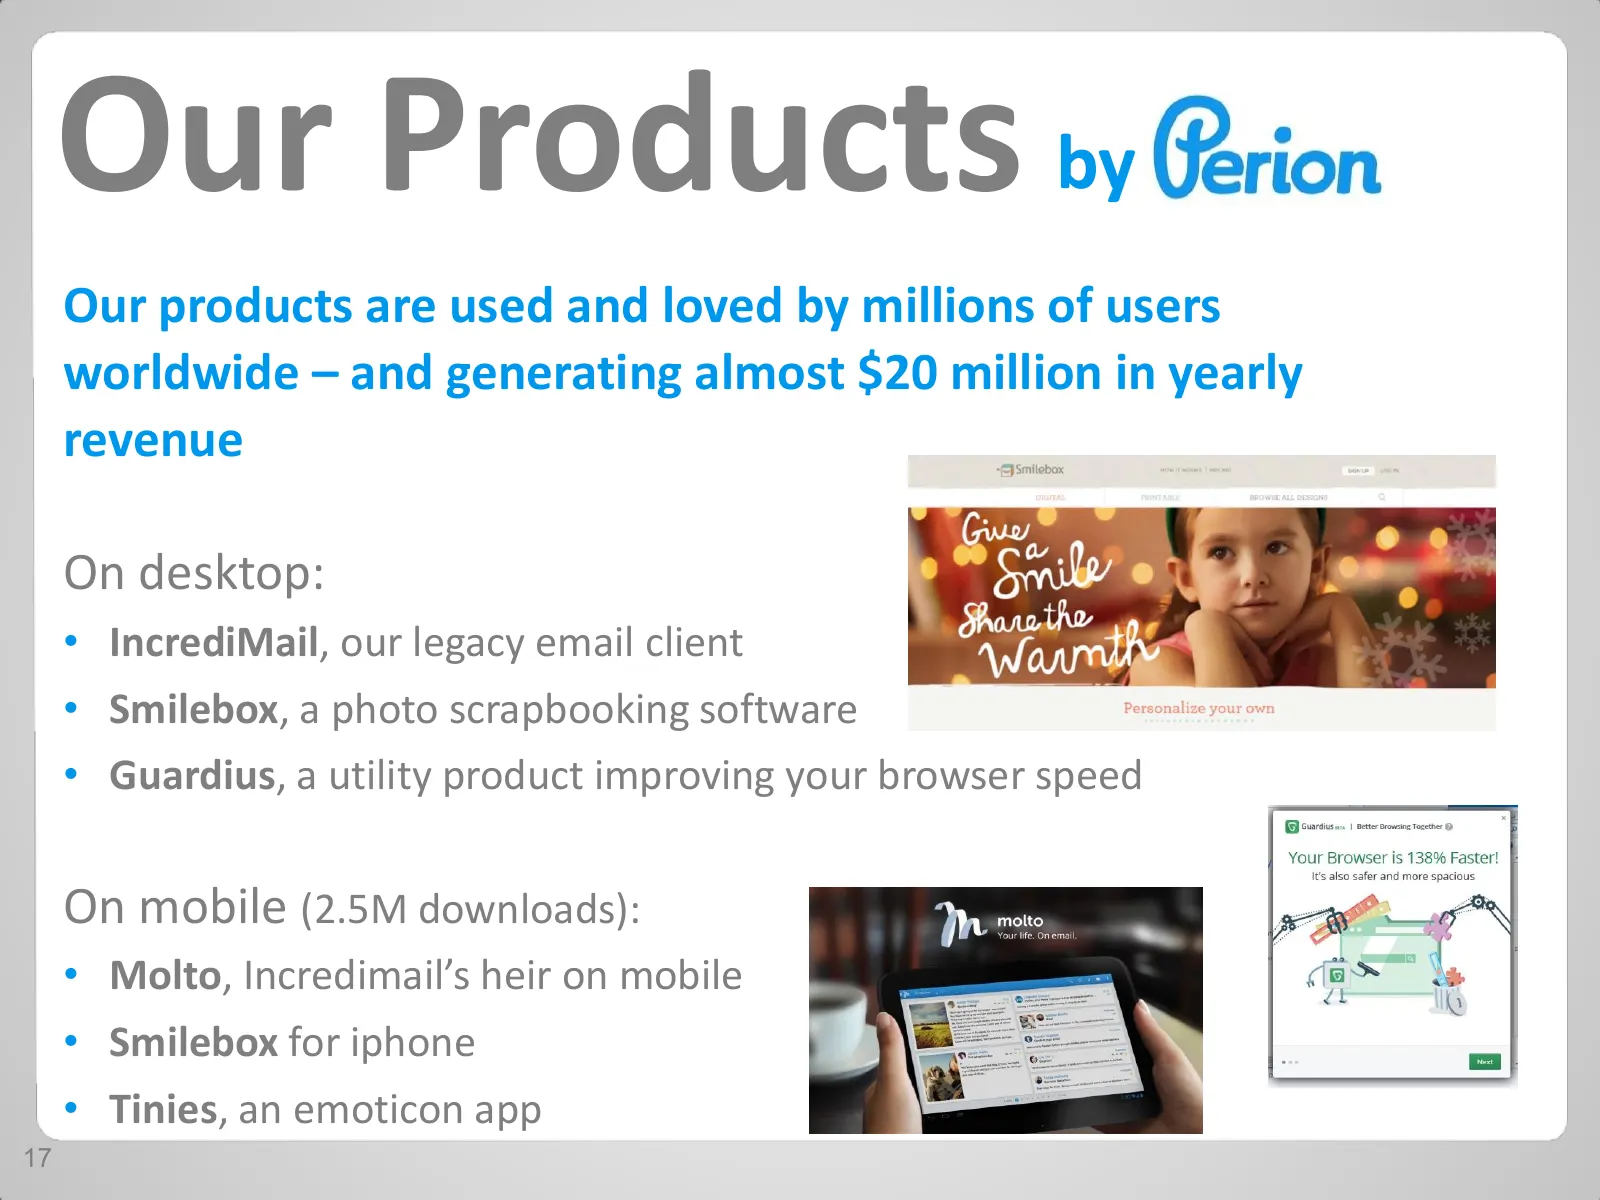
Our Products by Our products are used and loved by millions of users worldwide – and generating almost $20 million in yearly revenue On desktop: • IncrediMail, our legacy email client • Smilebox, a photo scrapbooking software • Guardius, a utility product improving your browser speed On mobile (2.5M
Slide 18: Smilebox Case Study
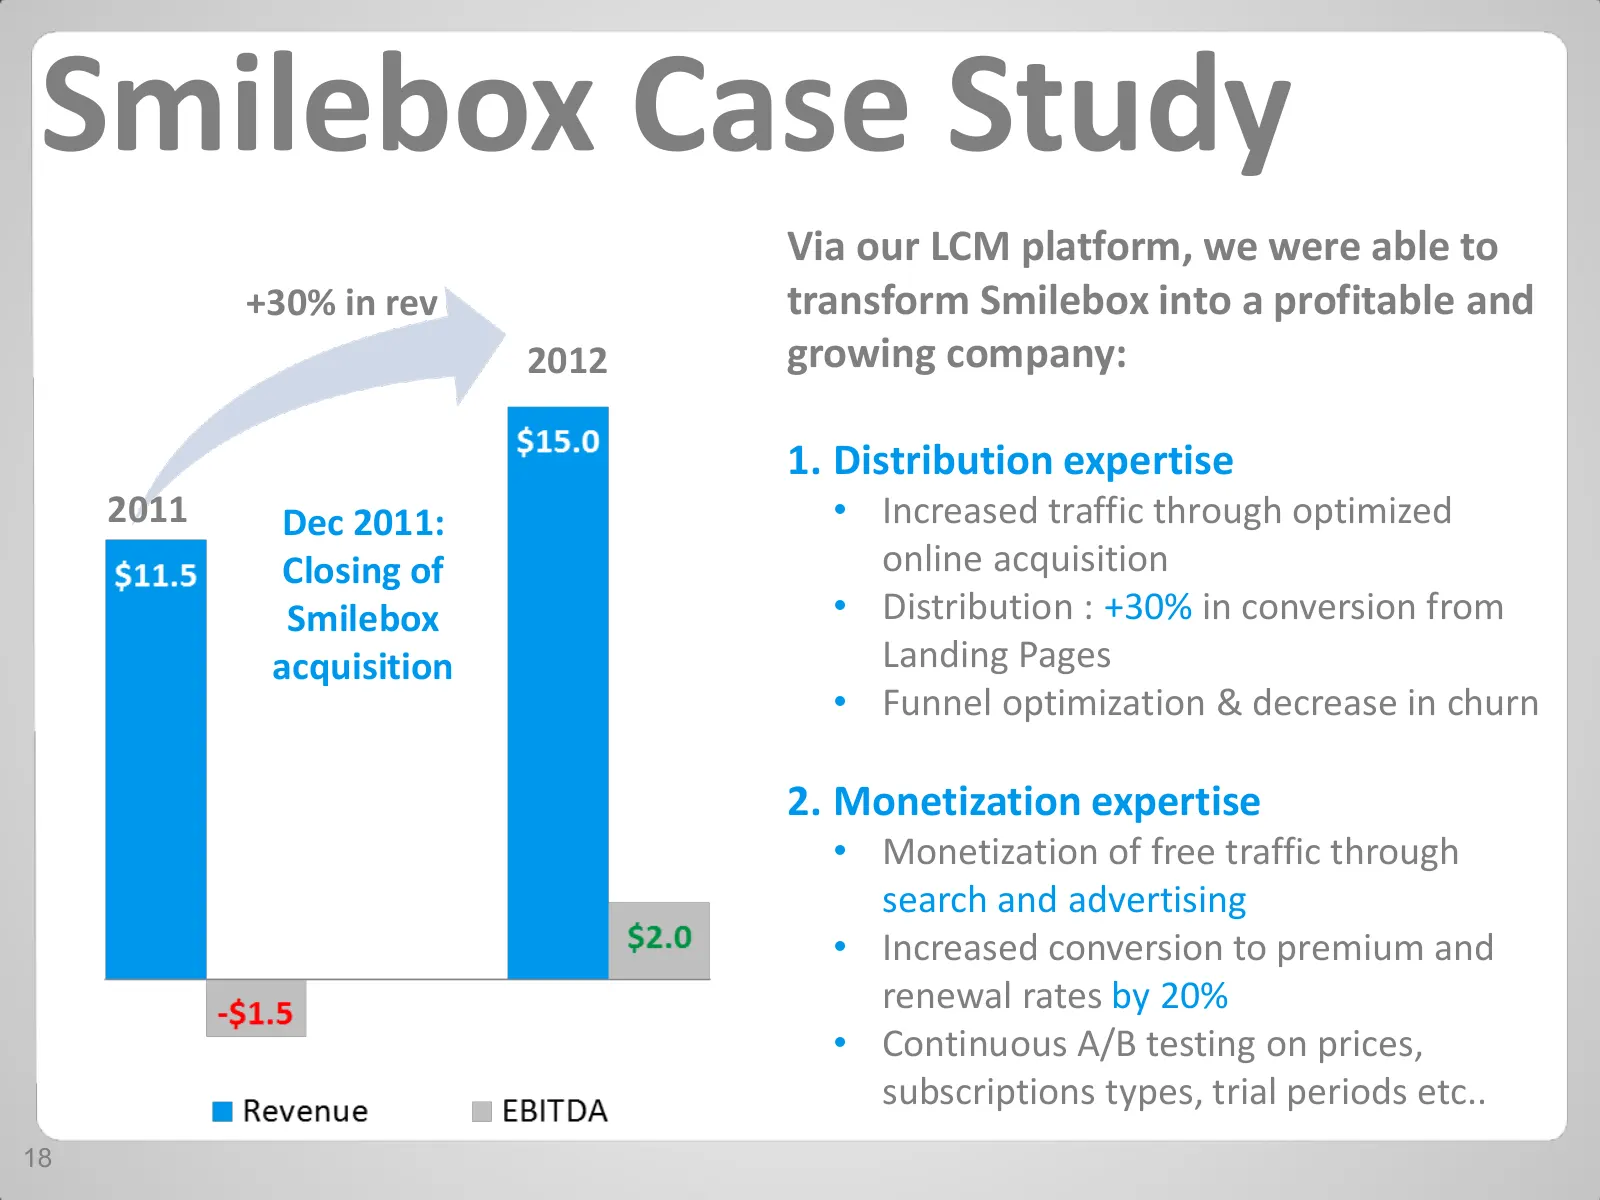
Smilebox Case Study Via our LCM platform, we were able to +30% in rev transform Smilebox into a profitable and 2012 growing company: 1. Distribution expertise 2011 Dec 2011: • Increased traffic through optimized Closing of online acquisition Smilebox • Distribution : +30% in conversion from acquisit

Slide 19: Looking Ahead…
Looking Ahead… 19
Slide 20: Main Growth Drivers
Main Growth Drivers 1. Enhancing LCM technology platform & growing global footprint 2. Leveraging core assets and competencies to expand into: • Programmatic data driven advertising • Mobile, social and video monetization solutions 20
Slide 21: Programmatic Display Advertising
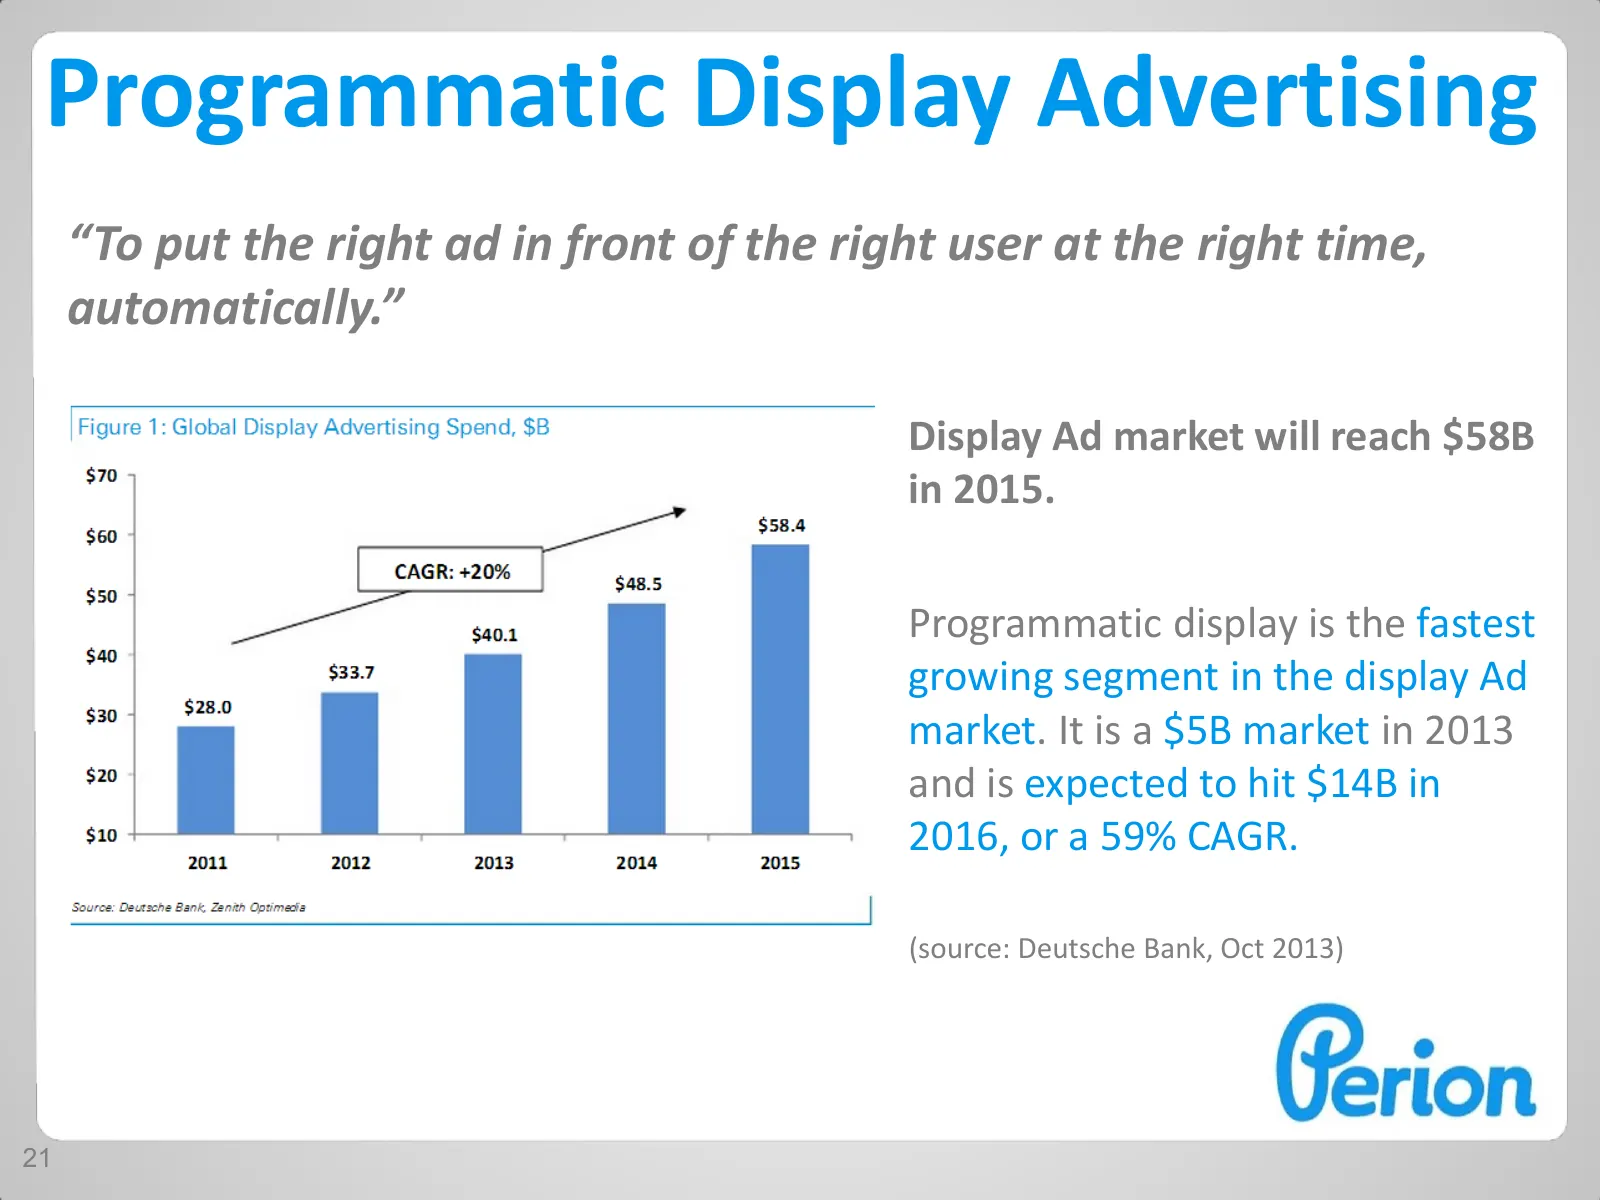
Programmatic Display Advertising “To put the right ad in front of the right user at the right time, automatically.” Display Ad market will reach $58B in 2015. Programmatic display is the fastest growing segment in the display Ad market. It is a $5B market in 2013 and is expected to hit $14B in 2016,
Slide 22: Leveraging our Data towards Targeted Advertising
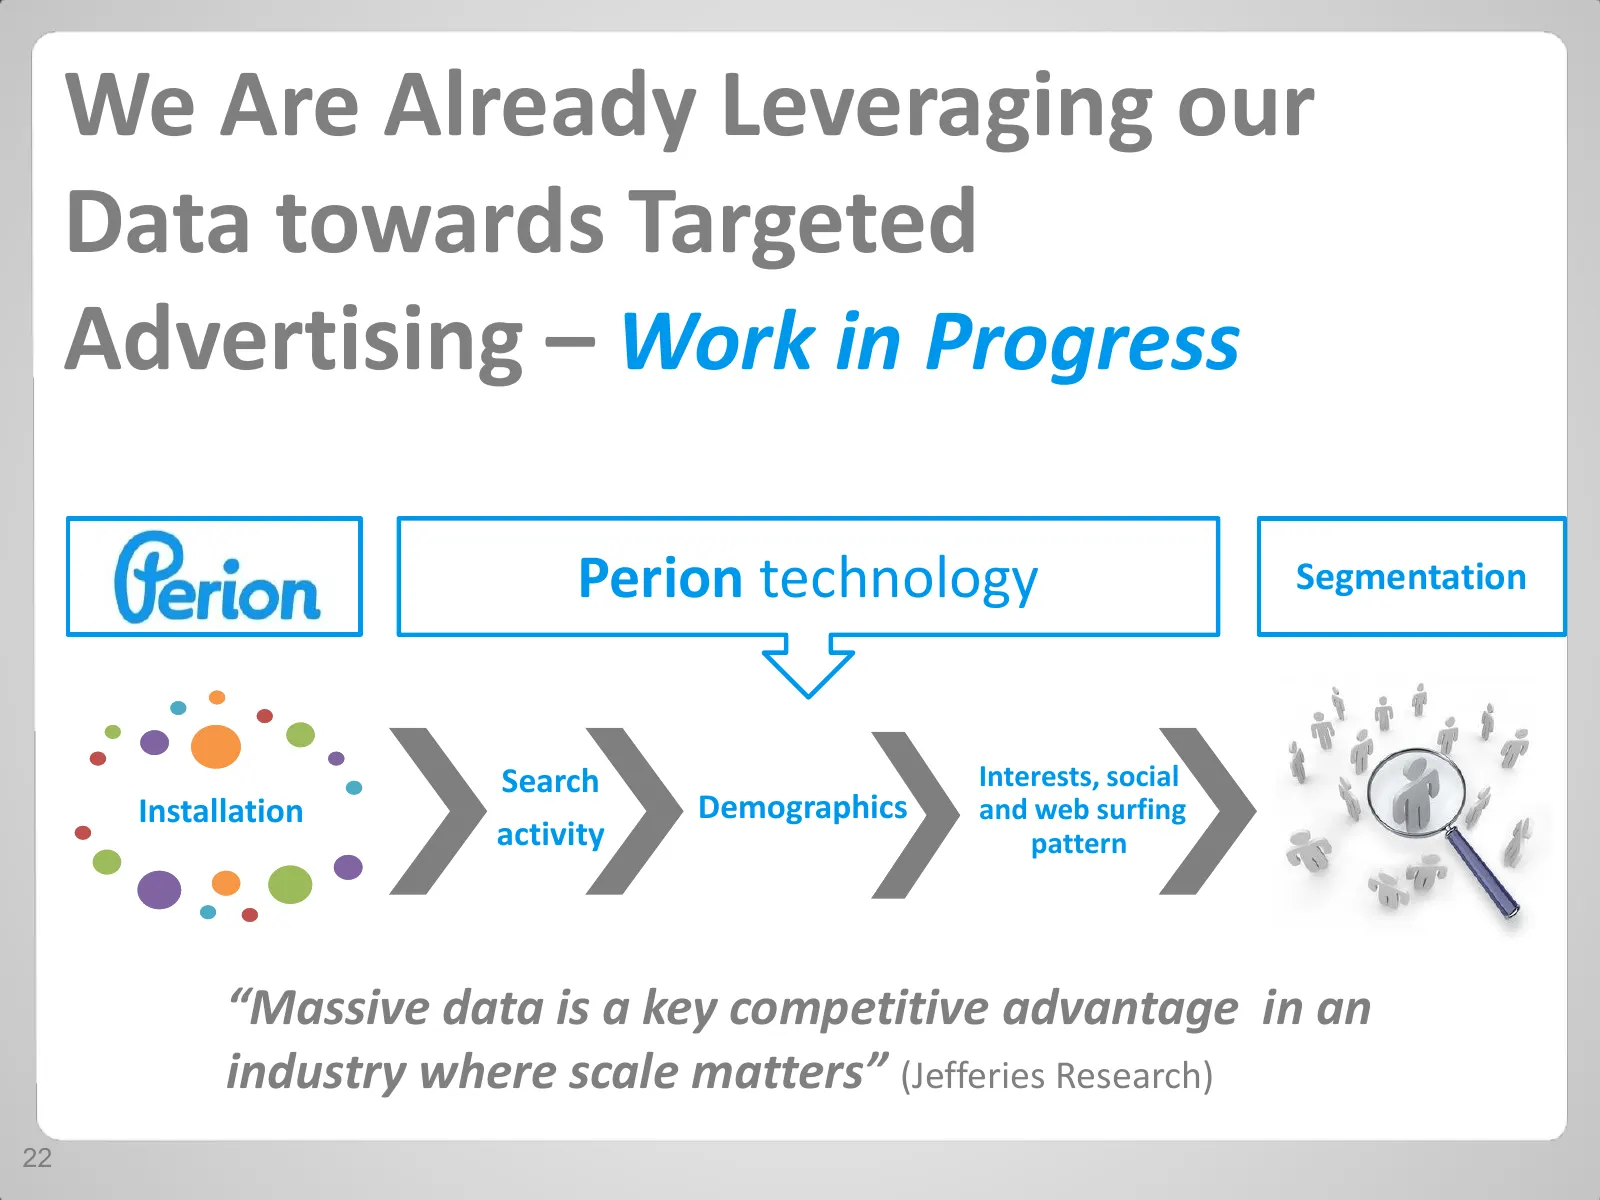
We Are Already Leveraging our Data towards Targeted Advertising – Work in Progress Perion technology Segmentation Search Interests, social Installation Demographics and web surfing activity pattern “Massive data is a key competitive advantage in an industry where scale matters” (Jefferies Research)
Slide 23: Mobile Market Continues to Grow
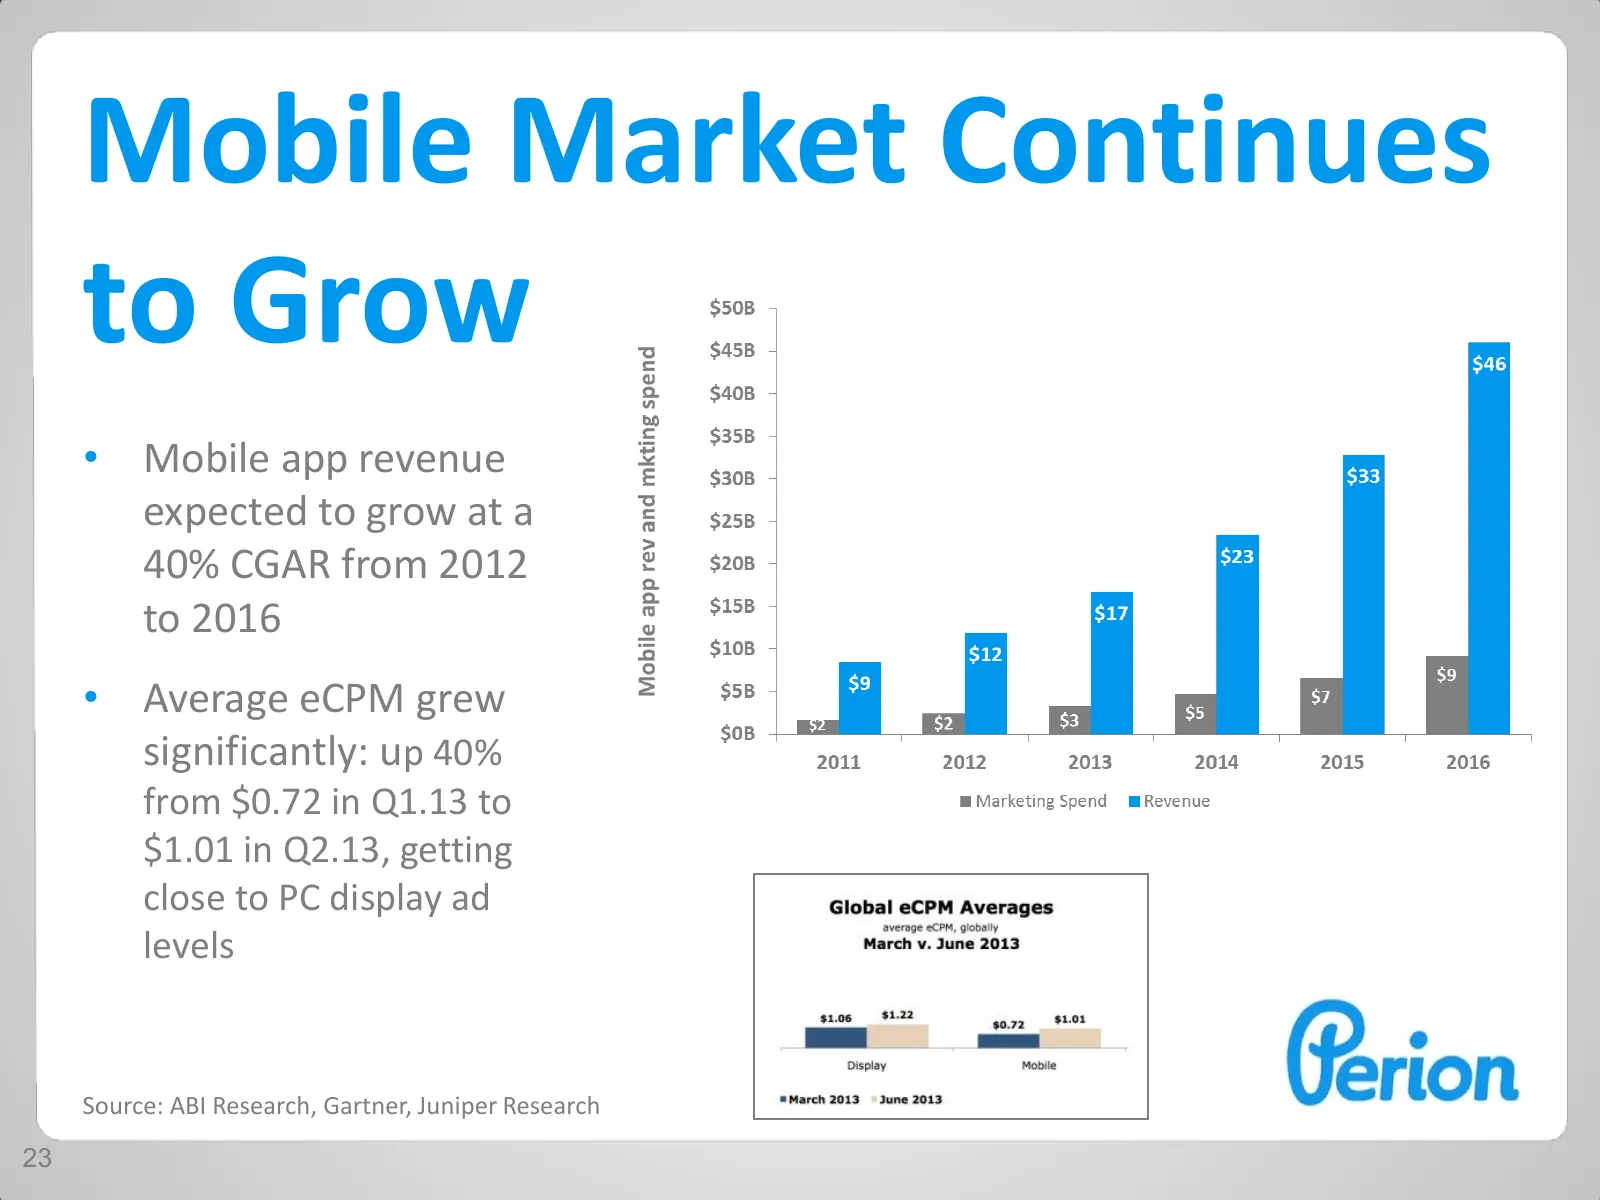
Mobile Market Continues to Grow • Mobile app revenue expected to grow at a 40% CGAR from 2012 to 2016 • Average eCPM grew significantly: up 40% from $0.72 in Q1.13 to $1.01 in Q2.13, getting close to PC display ad levels Source: ABI Research, Gartner, Juniper Research 23
Slide 24: Similar Dynamics for App Developers on Mobile
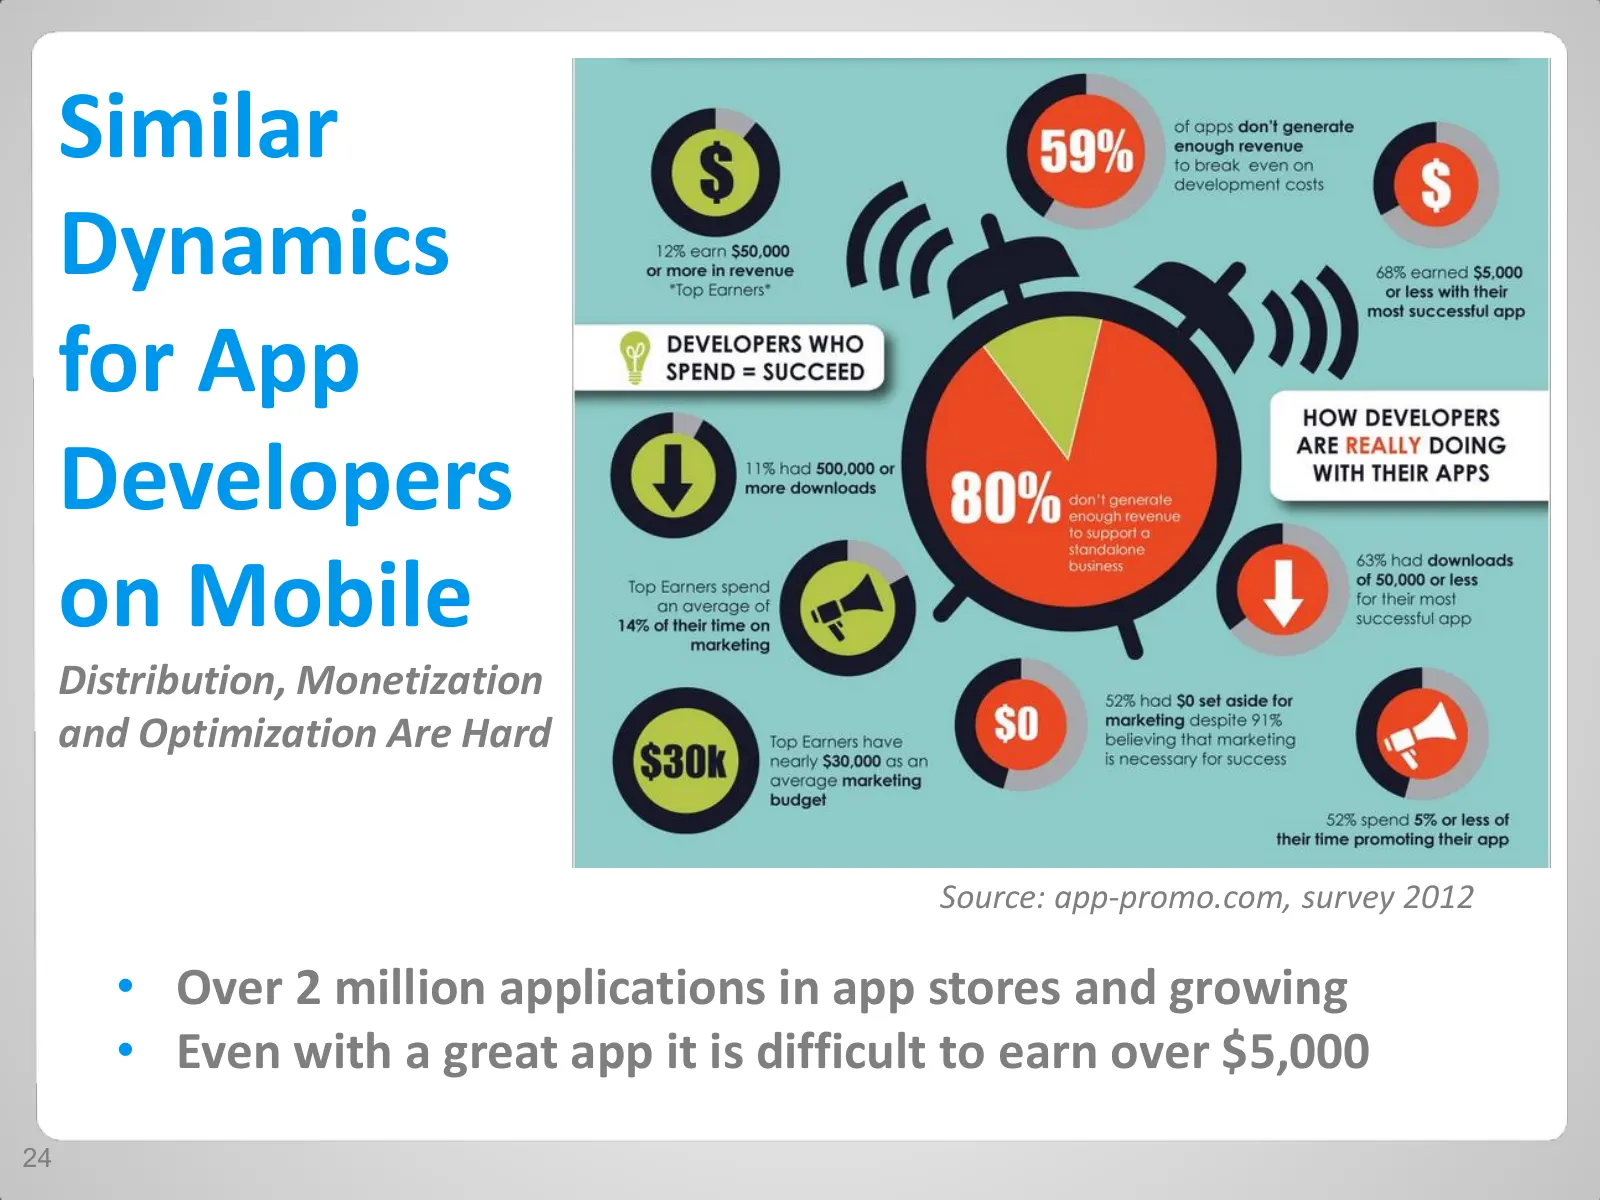
Similar Dynamics for App Developers on Mobile Distribution, Monetization and Optimization Are Hard Source: app-promo.com, survey 2012 • Over 2 million applications in app stores and growing • Even with a great app it is difficult to earn over $5,000 24
Slide 25: Financial Highlights
Financial Highlights 25
Slide 26: Standalone Financial Highlights (Non-GAAP)
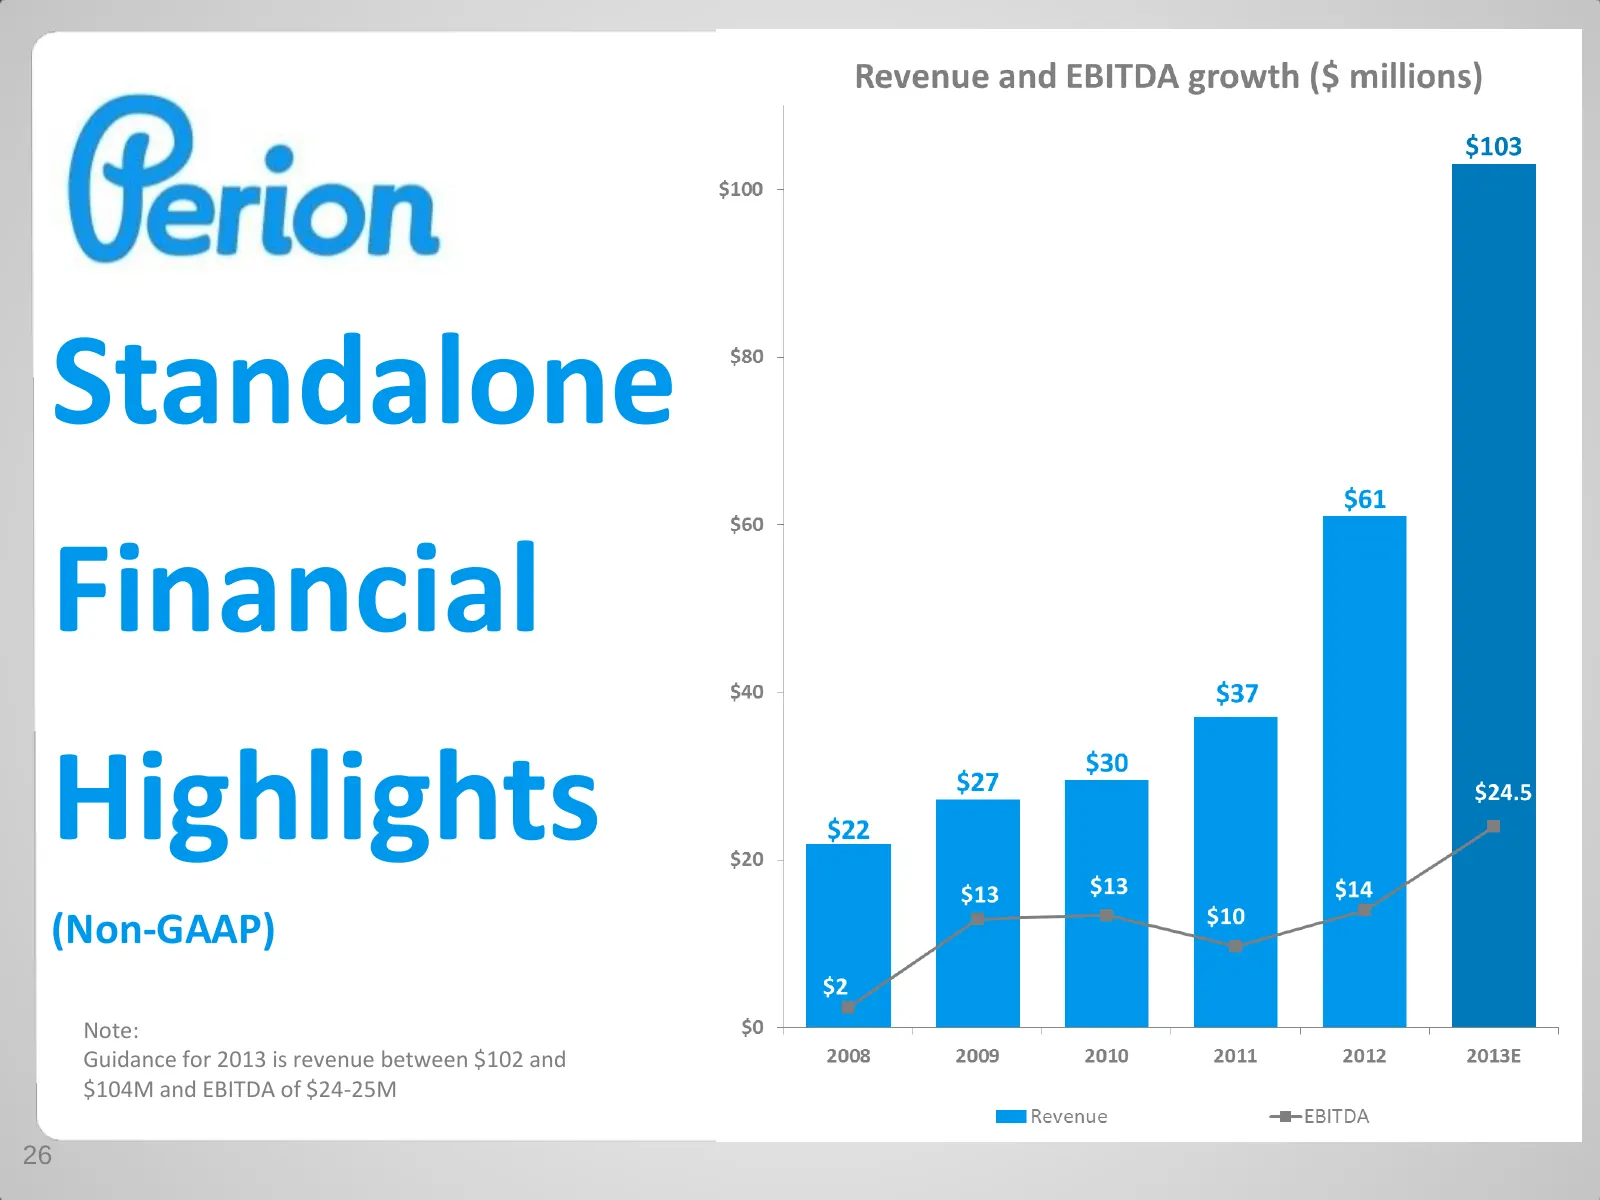
Standalone Financial Highlights (Non-GAAP) Note: Guidance for 2013 is revenue between $102 and $104M and EBITDA of $24-25M 26
Slide 27: Perion & ClientConnect Combined Revenue Snapshot
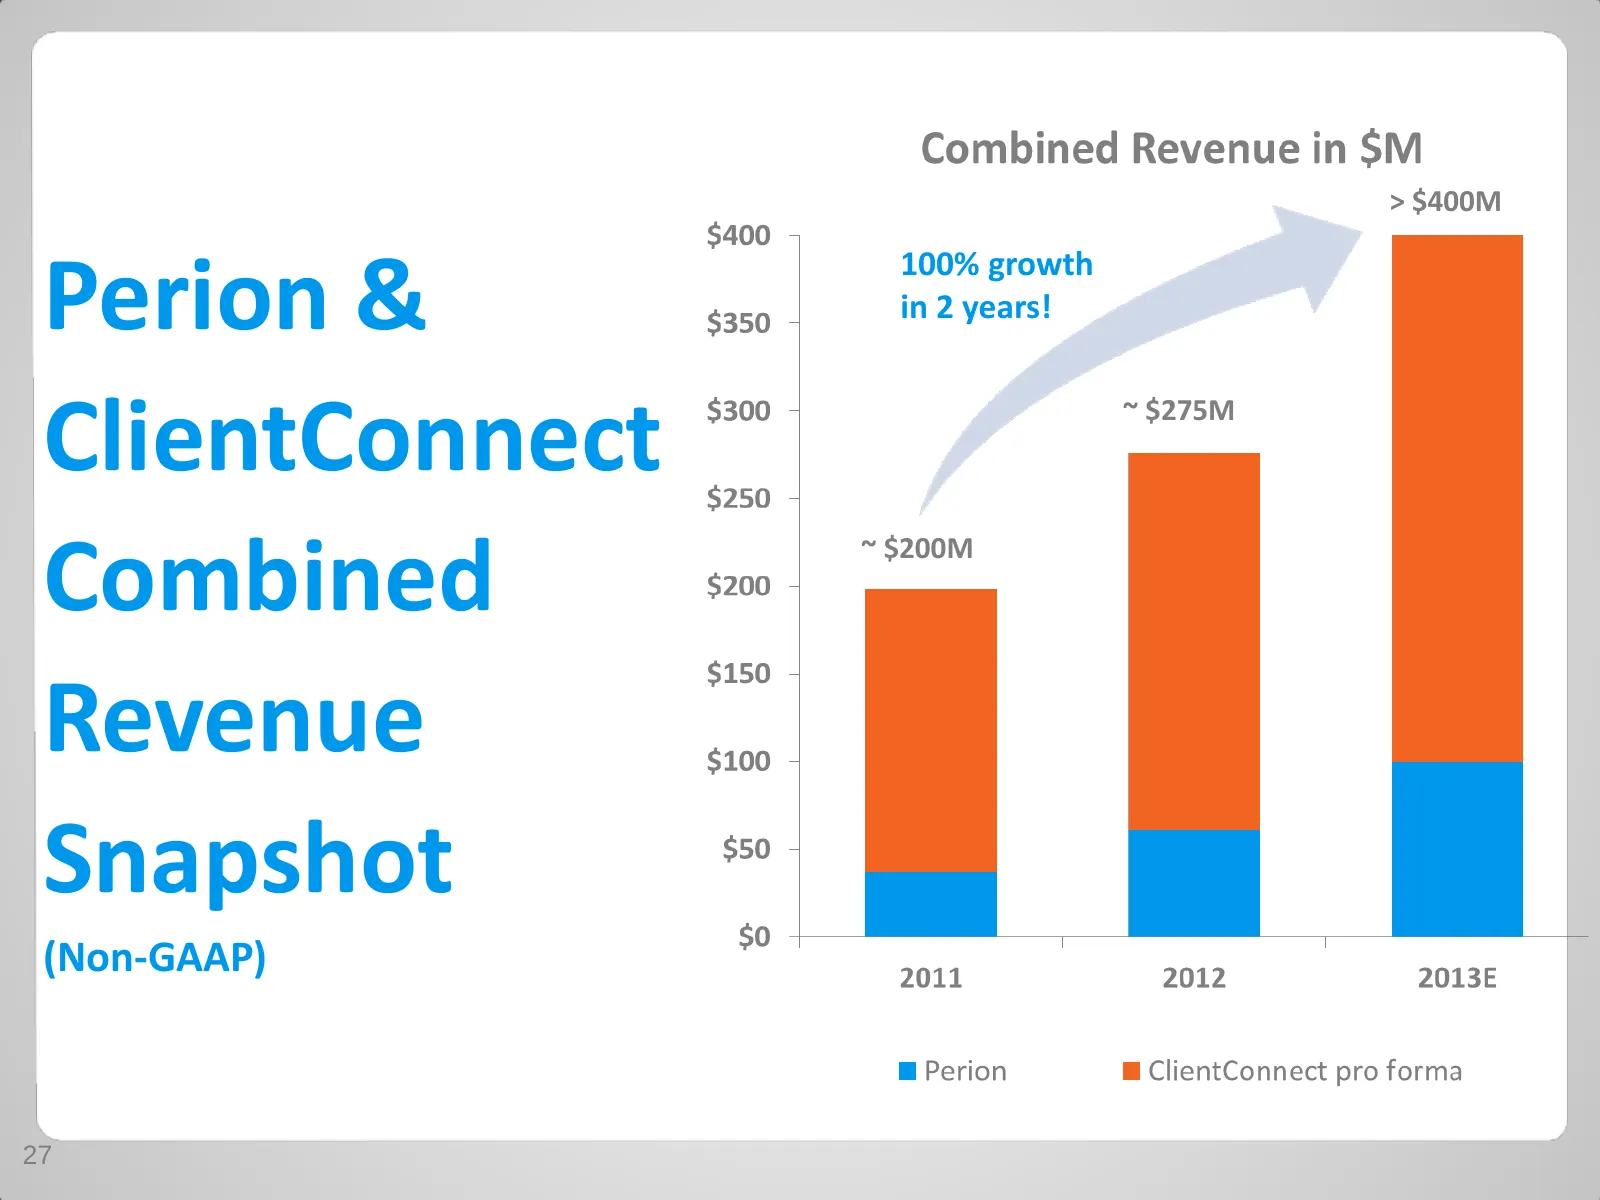
> $400M 100% growth Perion & in 2 years! ClientConnect ~ $275M Combined ~ $200M Revenue Snapshot (Non-GAAP) 27
Slide 28: Perion & ClientConnect Nine Month Financial Results
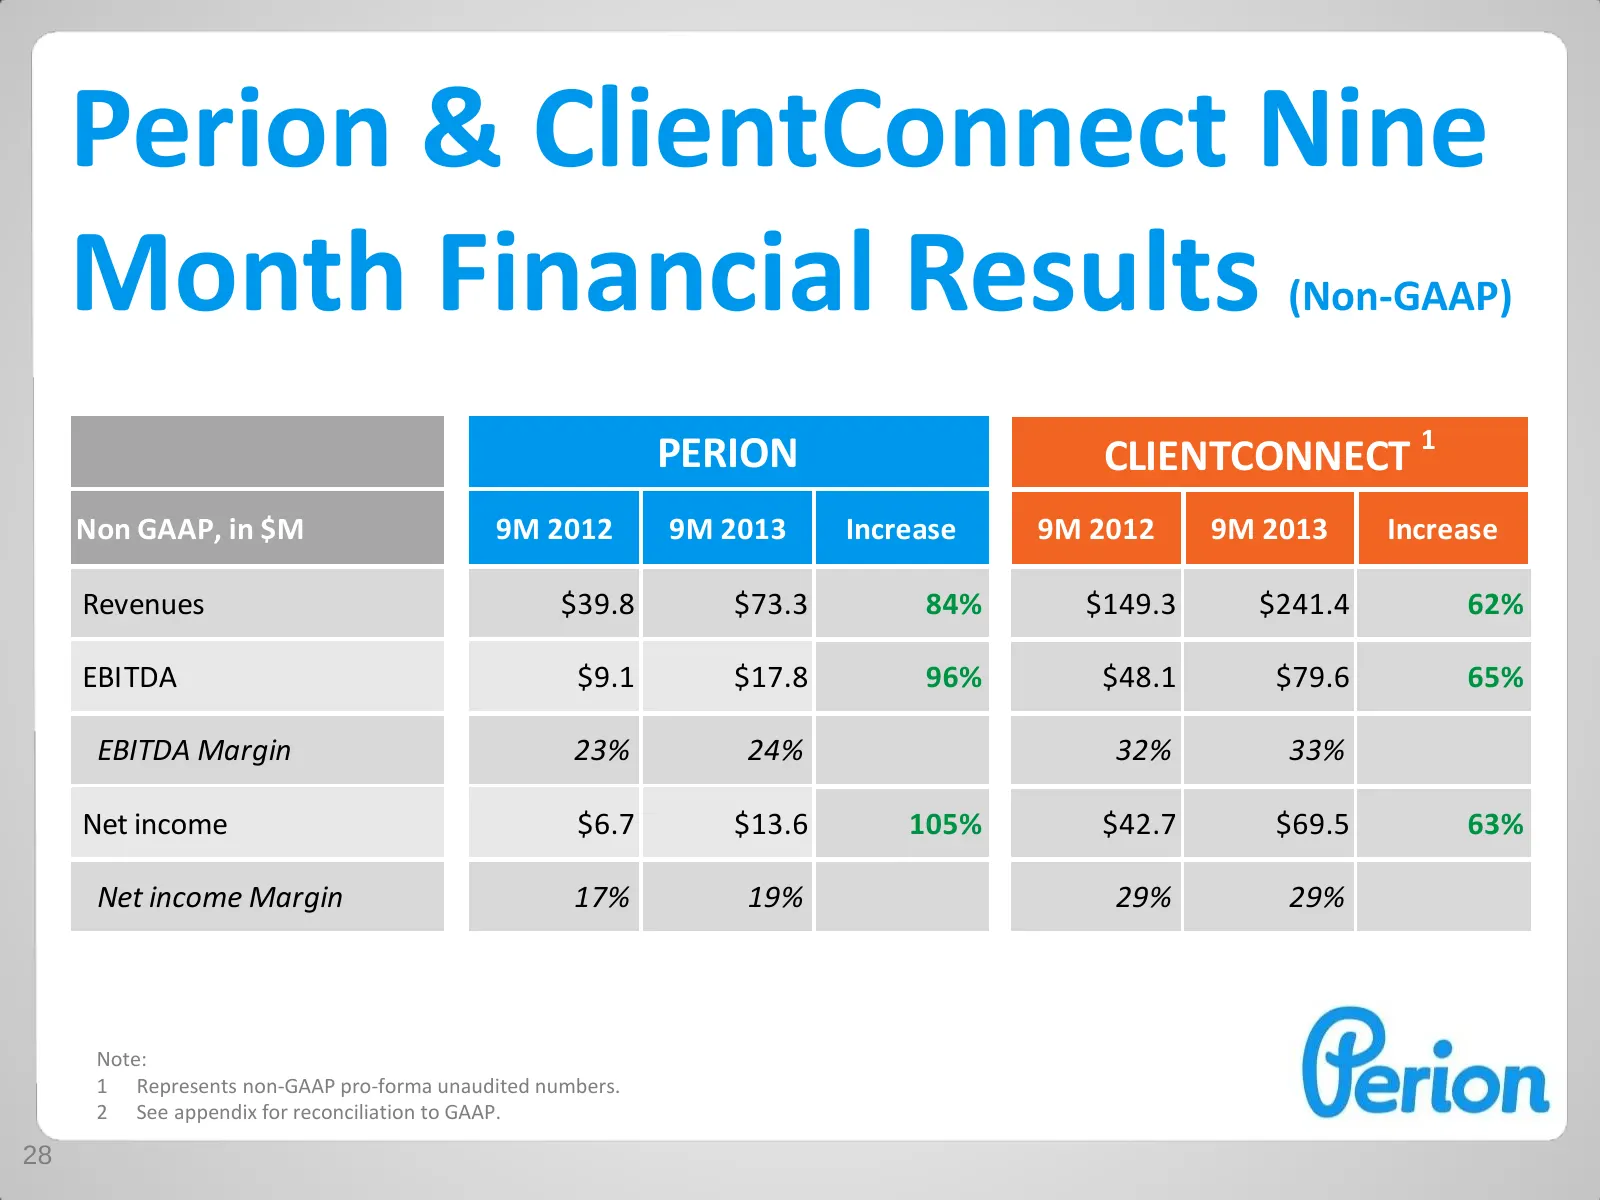
Perion & ClientConnect Nine Month Financial Results (Non-GAAP) PERION CLIENTCONNECT 1 Non GAAP, in $M 9M 2012 9M 2013 Increase 9M 2012 9M 2013 Increase Revenues $39.8 $73.3 84% $149.3 $241.4 62% EBITDA $9.1 $17.8 96% $48.1 $79.6 65% EBITDA Margin 23% 24% 32% 33% Net income $6.7 $13.6 105% $42.7 $69.
Slide 29: Key Takeaways
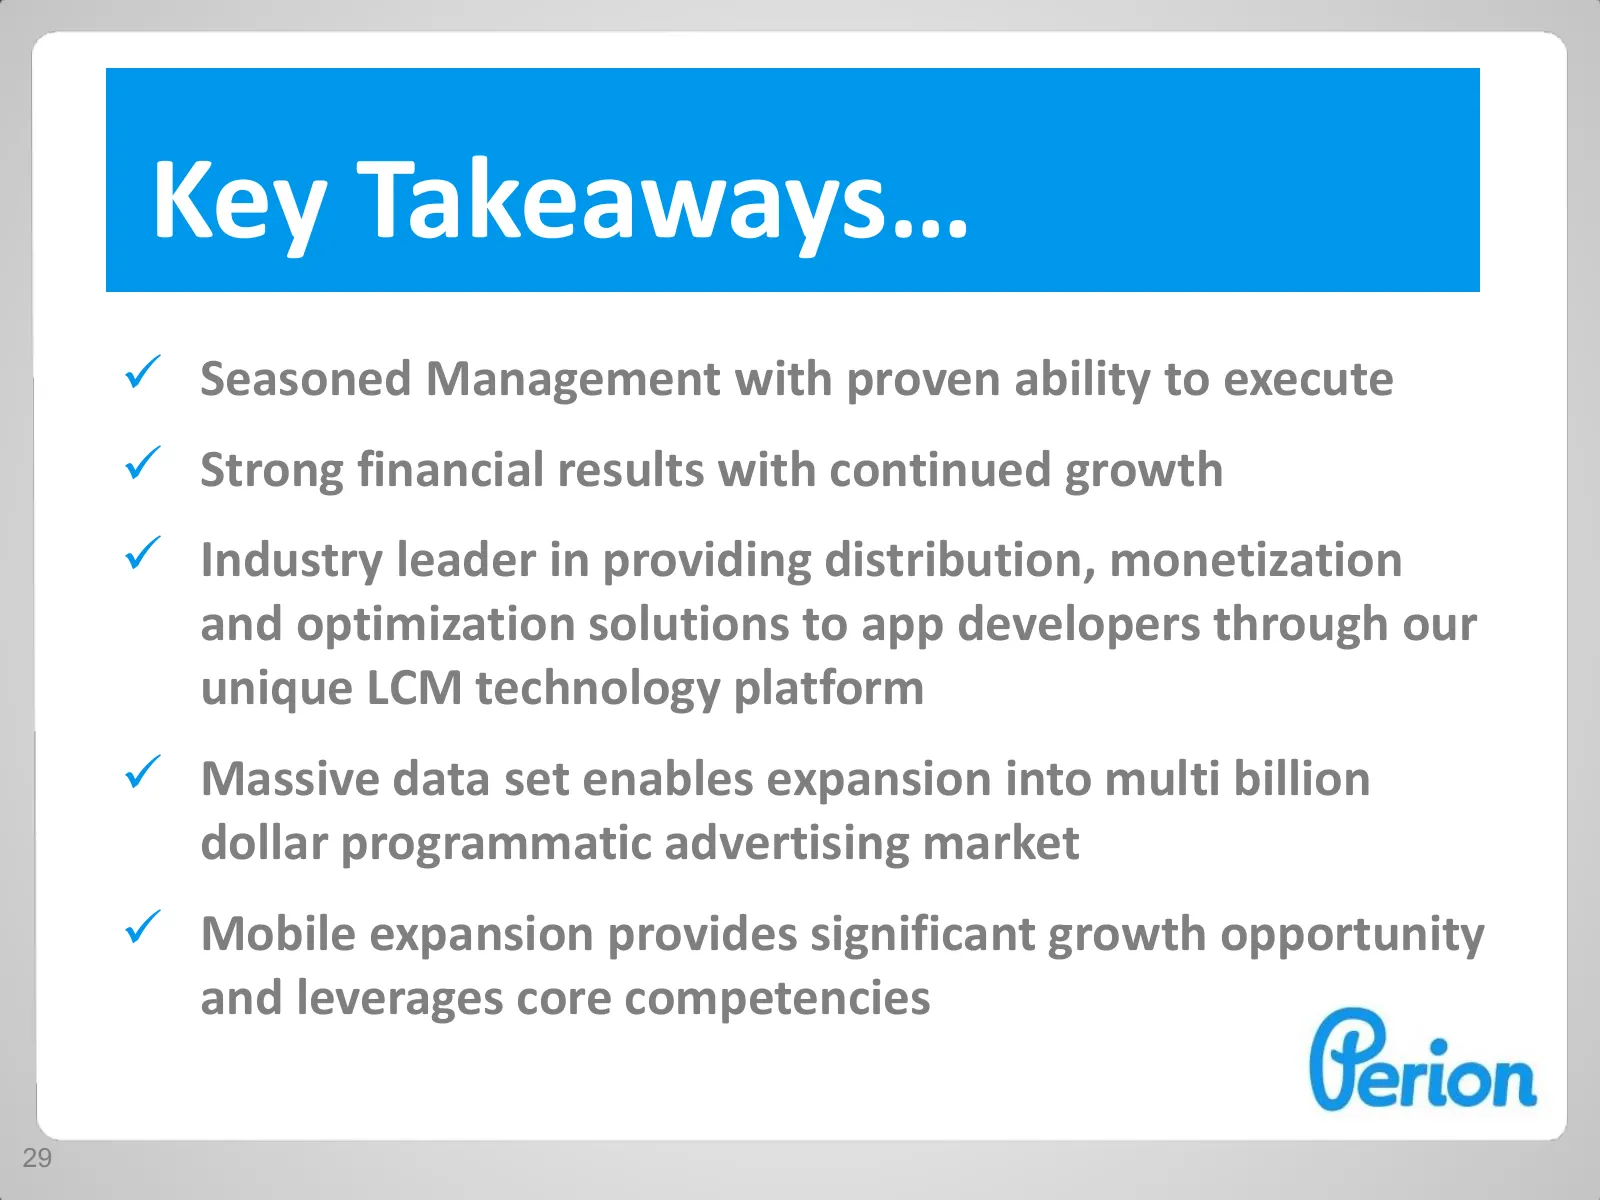
Key Takeaways… Seasoned Management with proven ability to execute Strong financial results with continued growth Industry leader in providing distribution, monetization and optimization solutions to app developers through our unique LCM technology platform Massive data set enables expansion
Slide 30: Appendix: GAAP Reconciliation
Appendix: GAAP Reconciliation 30
Slide 31: GAAP Reconciliation
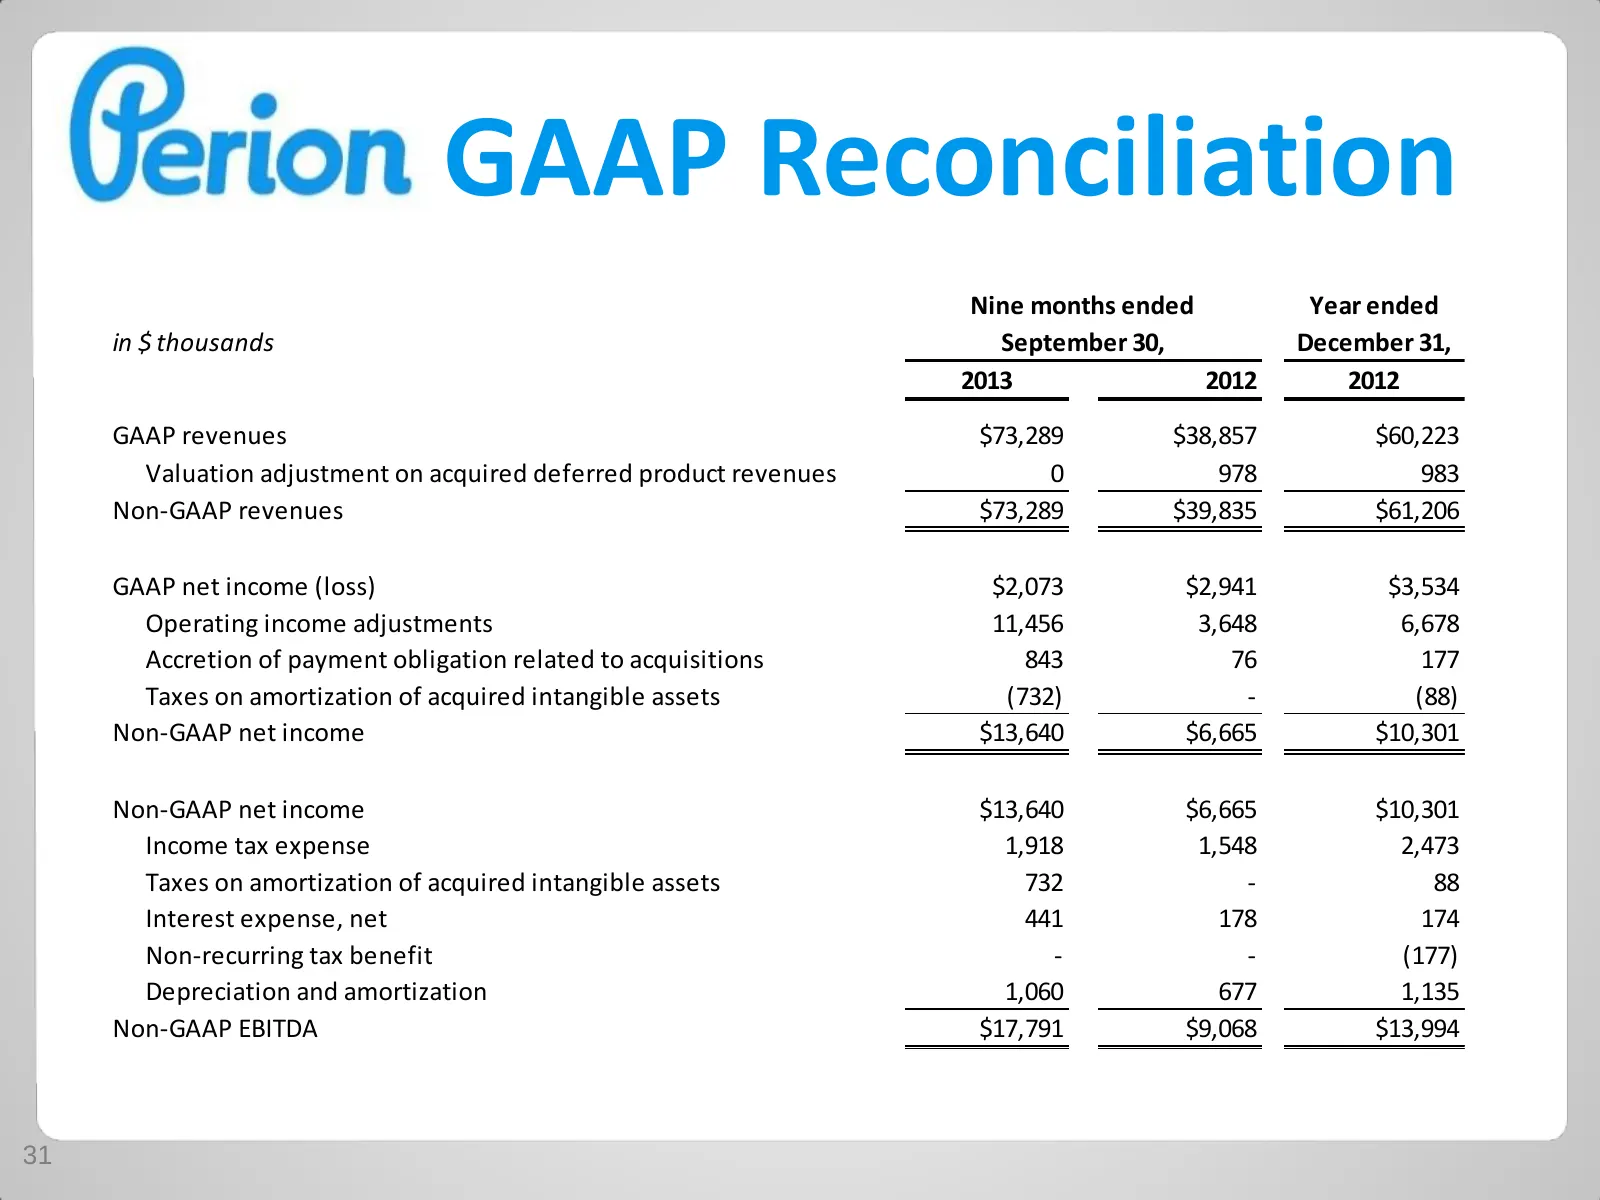
GAAP Reconciliation Nine months ended Year ended in $ thousands September 30, December 31, 2013 2012 2012 GAAP revenues $73,289 $38,857 $60,223 Valuation adjustment on acquired deferred product revenues 0 978 983 Non-GAAP revenues $73,289 $39,835 $61,206 GAAP net income (loss) $2,073 $2,941 $3,534 O
Slide 32: GAAP Reconciliation
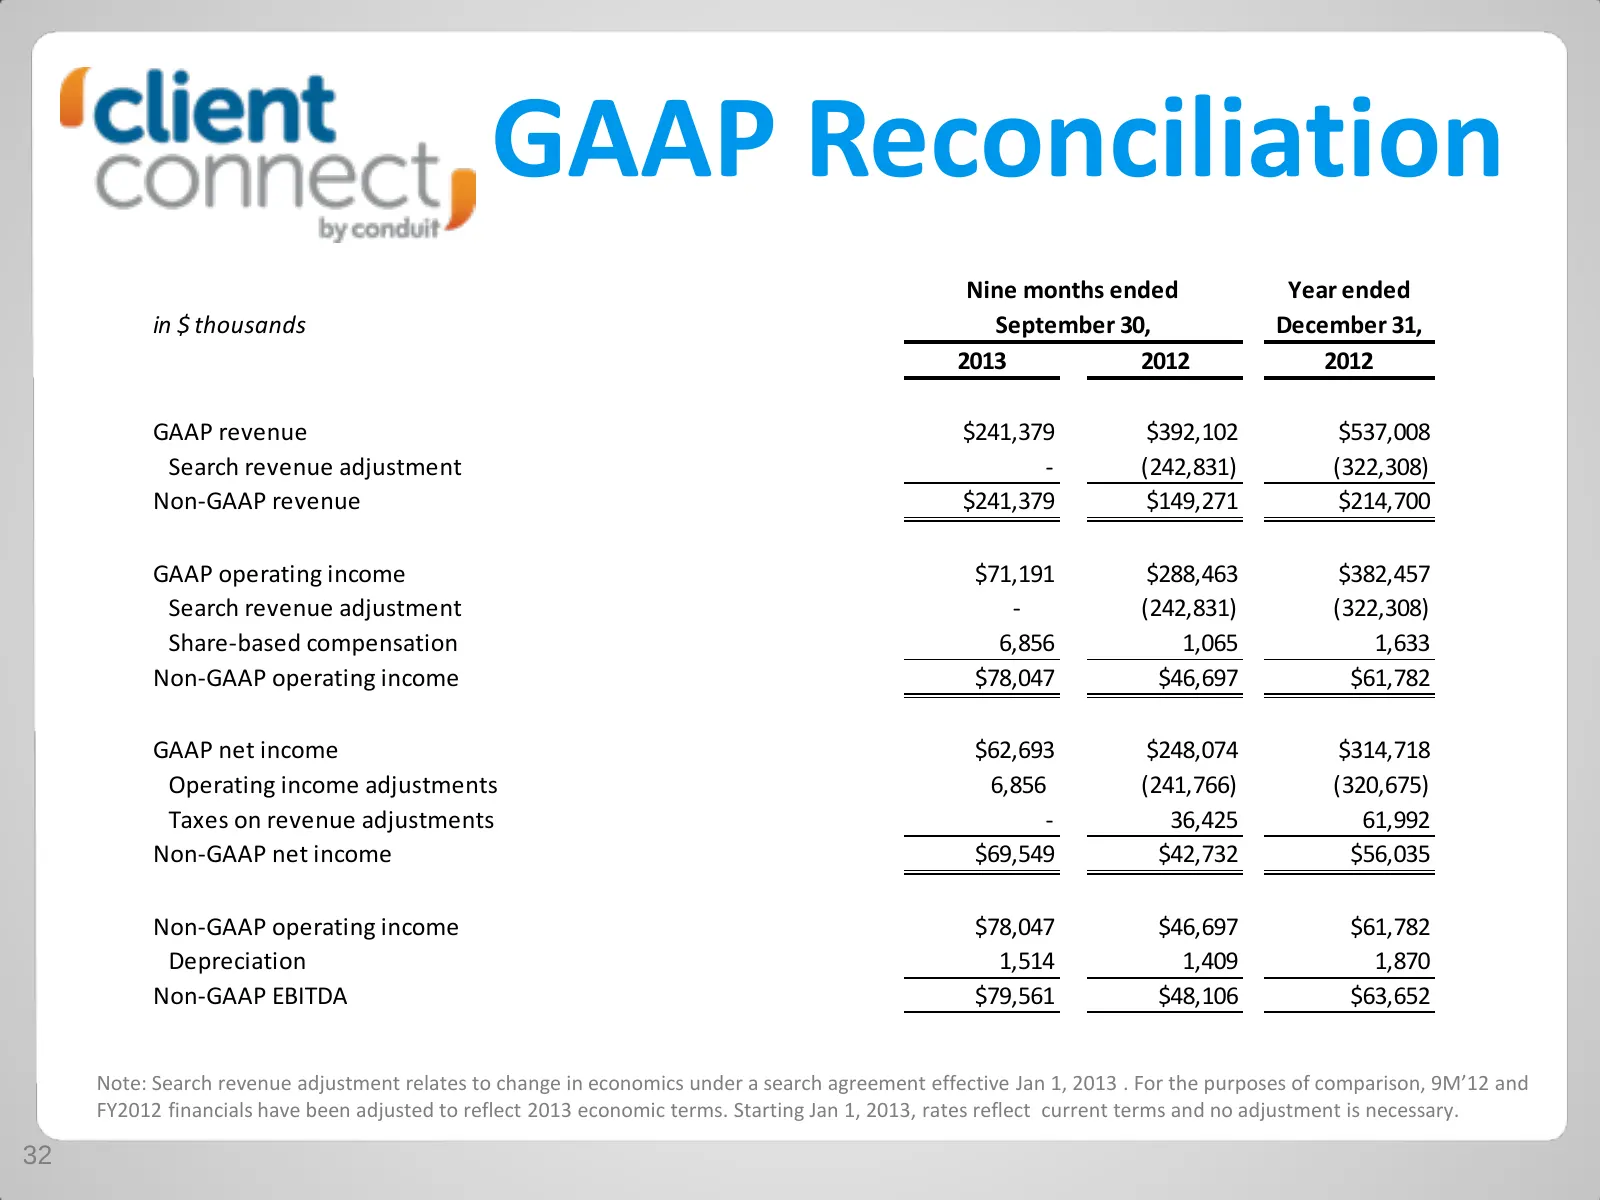
GAAP Reconciliation Nine months ended Year ended in $ thousands September 30, December 31, 2013 2012 2012 GAAP revenue $241,379 $392,102 $537,008 Search revenue adjustment - (242,831) (322,308) Non-GAAP revenue $241,379 $149,271 $214,700 GAAP operating income $71,191 $288,463 $382,457 Search revenue
Source: Internet Archive copy of perion.com
More decks from Perion Network Ltd
 Q2 2026 Earnings Presentation43 slides · Aug 10, 2026
 Investor Presentation (August 2026)83 slides · August 2026
 Investor Presentation (June 2026)80 slides · Jun 29, 2026
 Q1 2026 Earnings Presentation39 slides · May 20, 2026
 Q4 2025 Earnings Presentation54 slides · Feb 18, 2026
 Q3 2025 Earnings Presentation40 slides · Nov 12, 2025