Perion Network Ltd · NASDAQ:PERI
Perion Network — Investor Presentation (February 2021)
31 slides from Perion Network's investor presentation, February 2021
Slide 1: The capture & convince company
the capture & convince company Investor Presentation | February 2021 1
Slide 2: Forward looking statements
FORWARD LOOKING STATEMENTS This presentation and our remarks contain forward-looking statements (within the meaning of The Private Securities Litigation Reform Act of 1995) that involve substantial risks and uncertainties, including statements regarding our expectations and beliefs about our busines

Slide 3: Introduction
Introduction Doron Gerstel Maoz Sigron CEO CFO 3
Slide 4: Huge TAM (and getting huger)
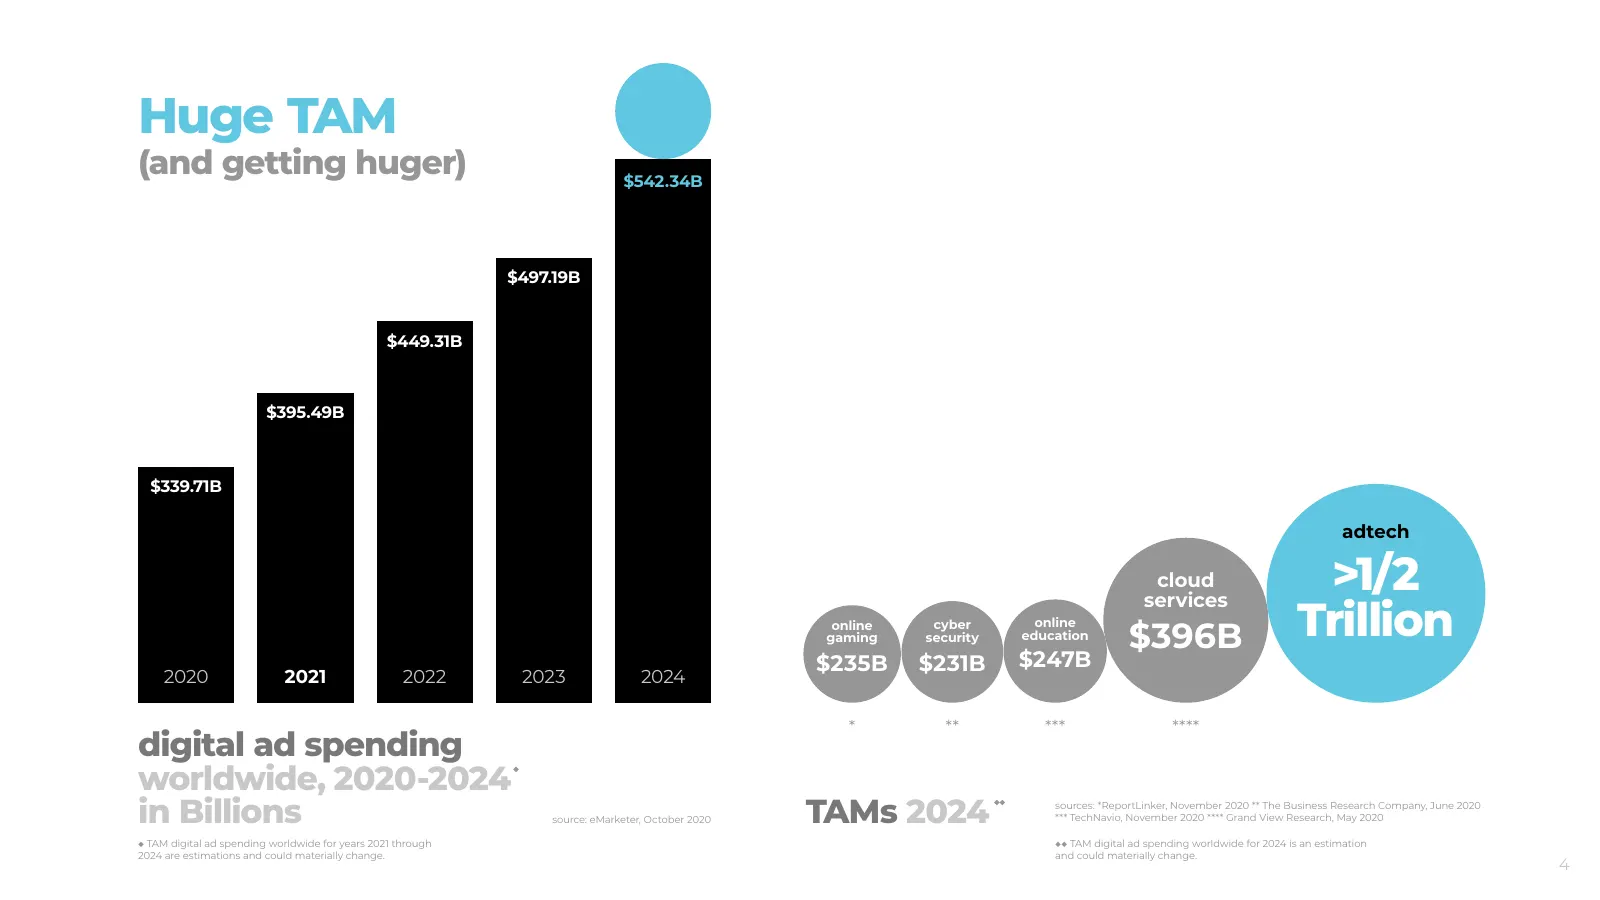
Huge TAM (and getting huger) $542.34B $497.19B $449.31B $395.49B $339.71B adtech cloud services >1/2 online gaming cyber security online education $396B Trillion $235B $231B $247B 2020 2021 2022 2023 2024 * ** *** **** digital ad spending worldwide, 2020-2024 in Billions source: eMarketer, October 2
Slide 5: Sources of growth
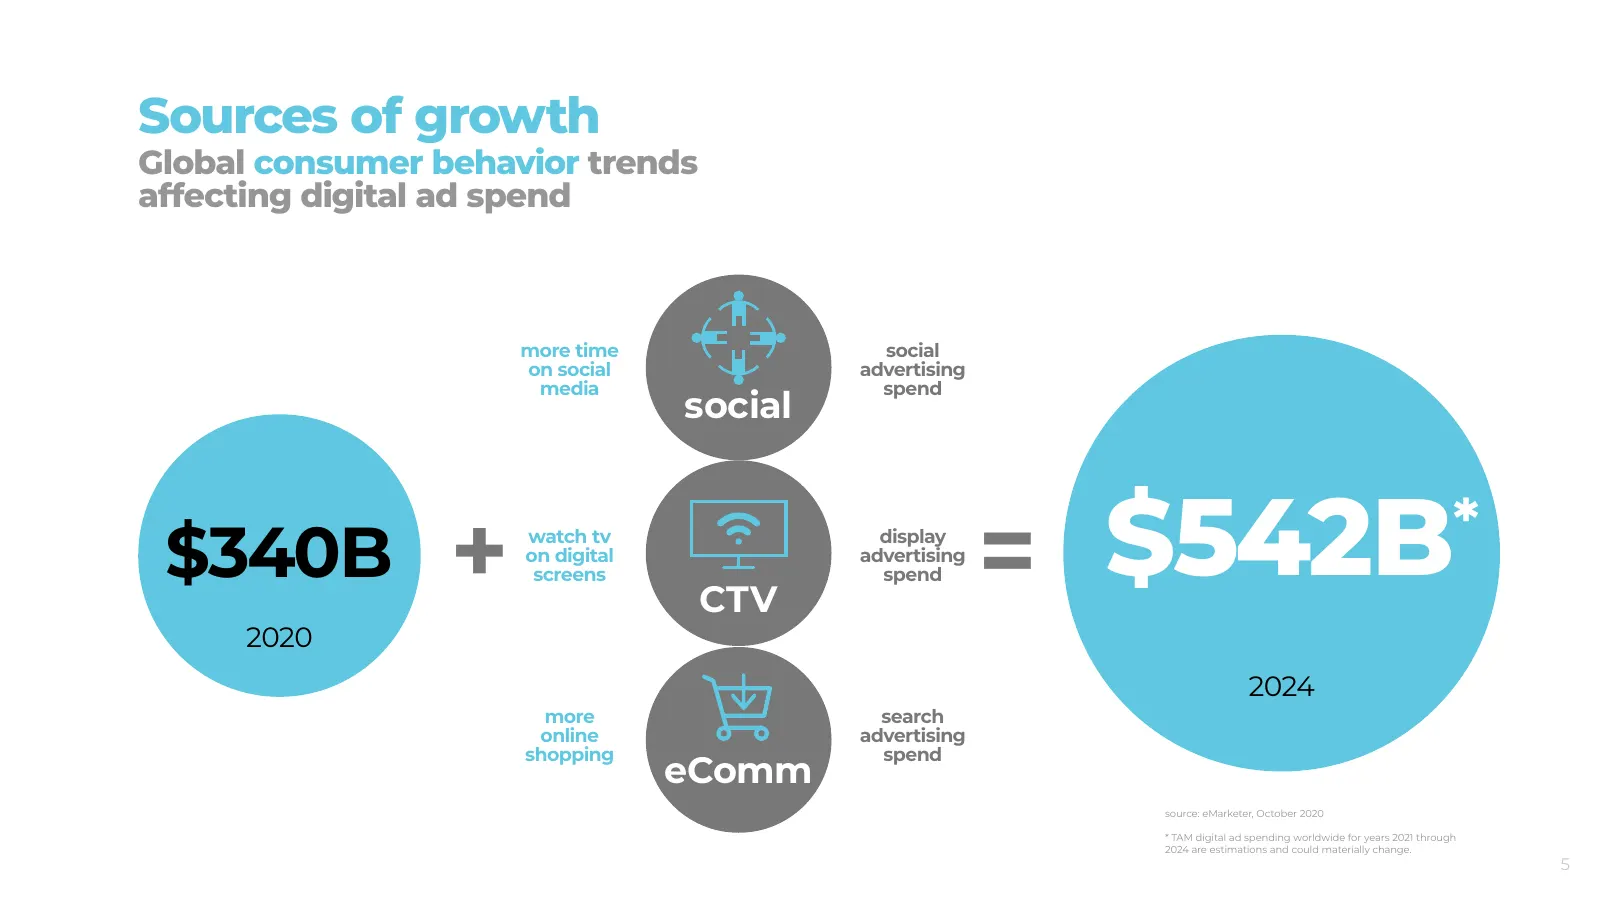
Sources of growth Global consumer behavior trends affecting digital ad spend more time social on social advertising media spend social $340B + watch tv on digital screens CTV display advertising spend = $542B * 2020 2024 more search online advertising shopping spend eComm source: eMarketer, October
Slide 6: Steady growth
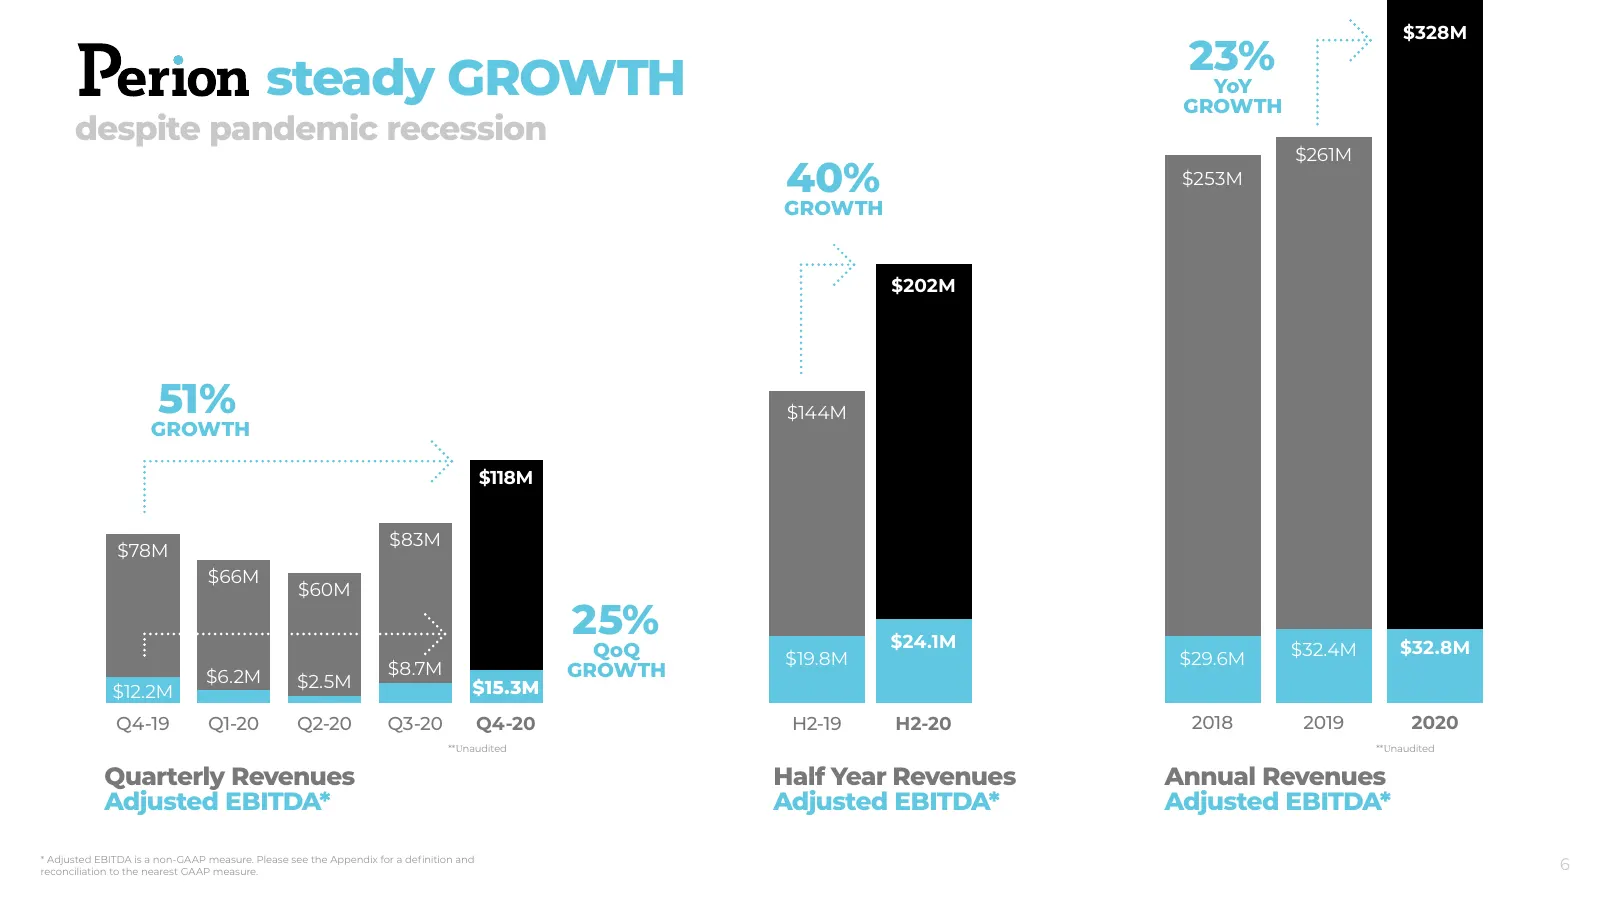
$328M 23% steady GROWTH YoY GROWTH despite pandemic recession $261M 40% $253M GROWTH $202M 51% $144M GROWTH $118M $83M $78M $66M $60M 25% $24.1M $32.8M QoQ $19.8M $29.6M $32.4M $6.2M $8.7M GROWTH $2.5M $15.3M $12.2M Q4-19 Q1-20 Q2-20 Q3-20 Q4-20 H2-19 H2-20 2018 2019 2020 **Unaudited **Unaudited Qua
Slide 7: Improved & strong balance sheet
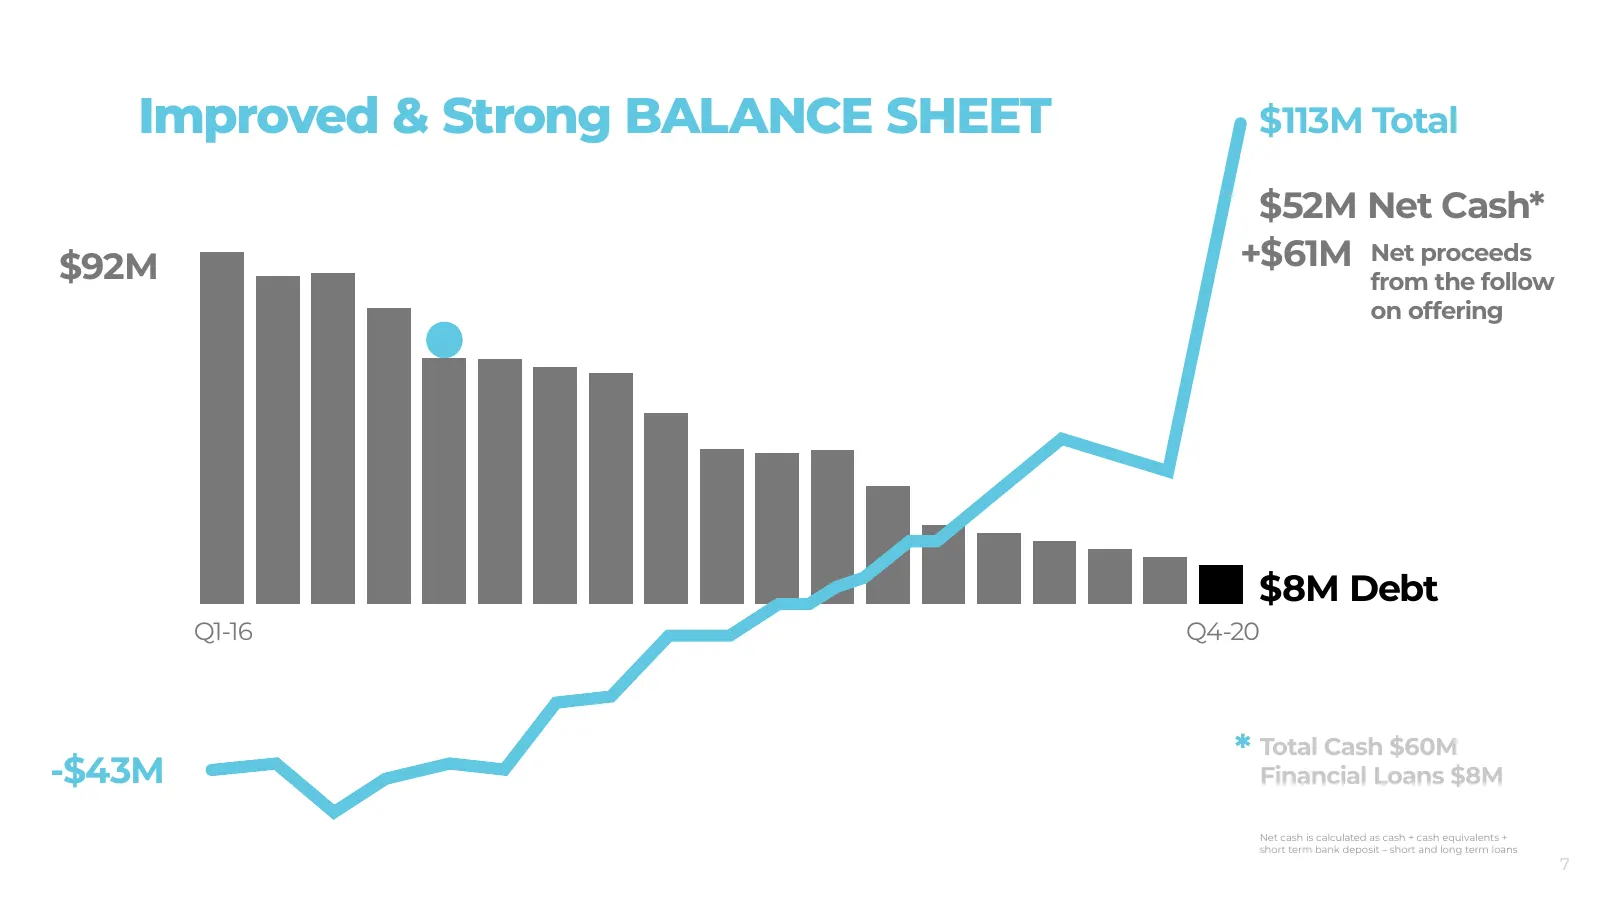
Improved & Strong BALANCE SHEET $113M Total $52M Net Cash* $92M +$61M Net proceeds 86.2 86.9 from the follow 77.7 on offering 64.6 64.4 62.3 60.7 50.2 40.8 39.7 40.5 31 20.8 18.8 16.7 14.6 $8M Debt 12.5 10.4 Q1-16 Q2-16 Q3-16 Q4-16 Q1-17 Q2-17 Q3-17 Q4-17 Q1-18 Q2-18 Q3-18 Q4-18 Q1-19 Q2-19 Q3-19 Q4
Slide 8: Strategy: diversification
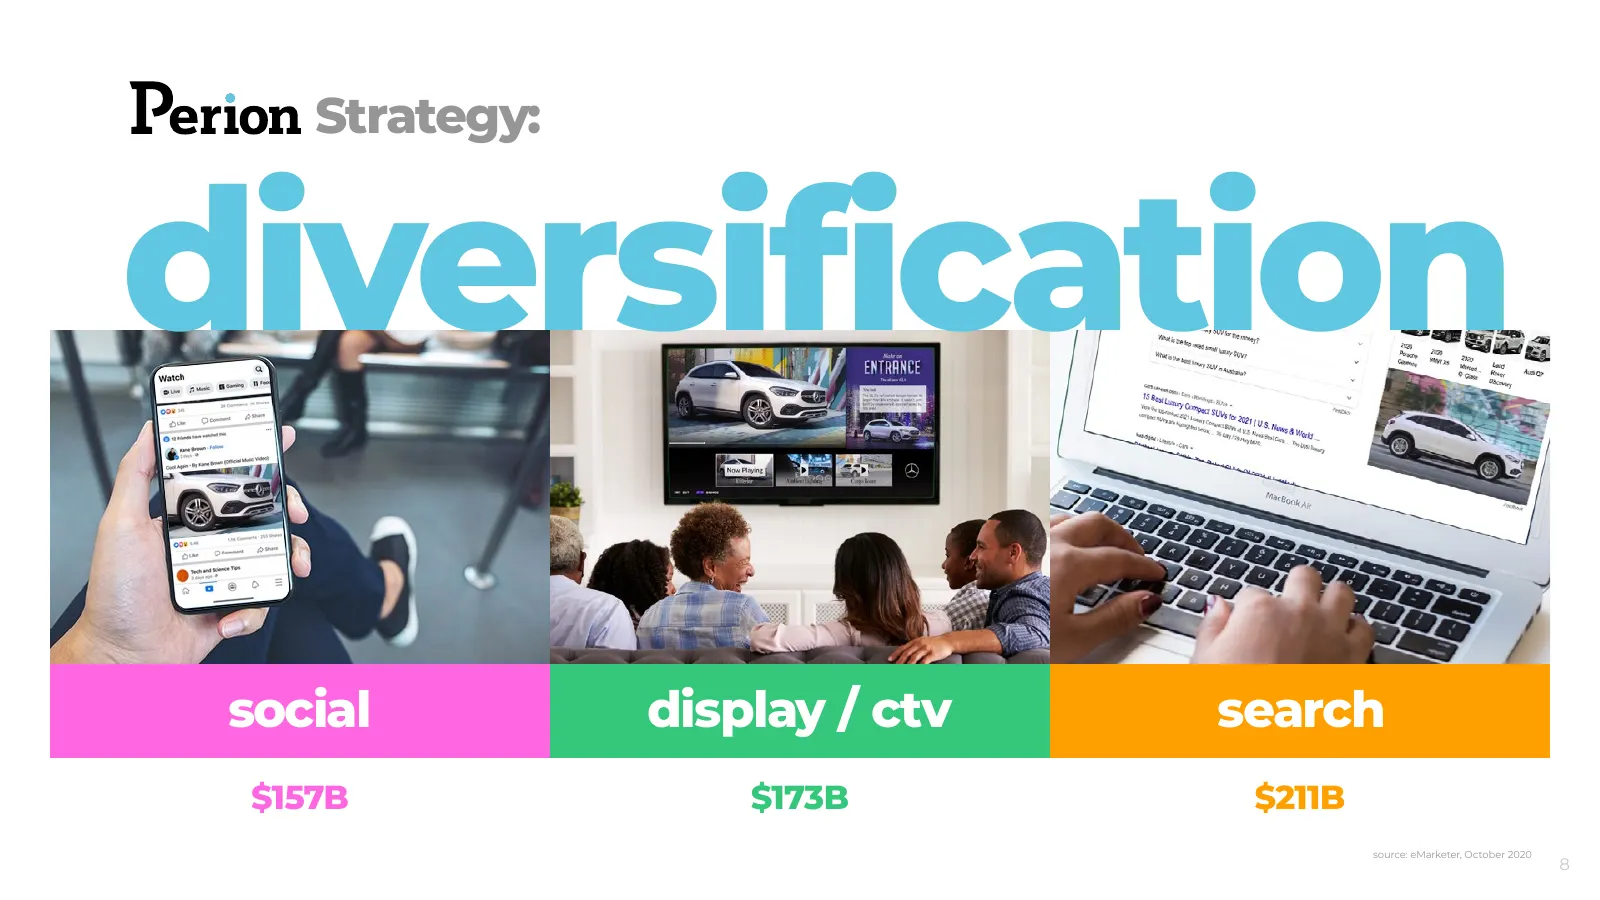
Strategy: diversification social display / ctv search $157B $173B $211B source: eMarketer, October 2020 8
Slide 9: Looking ahead
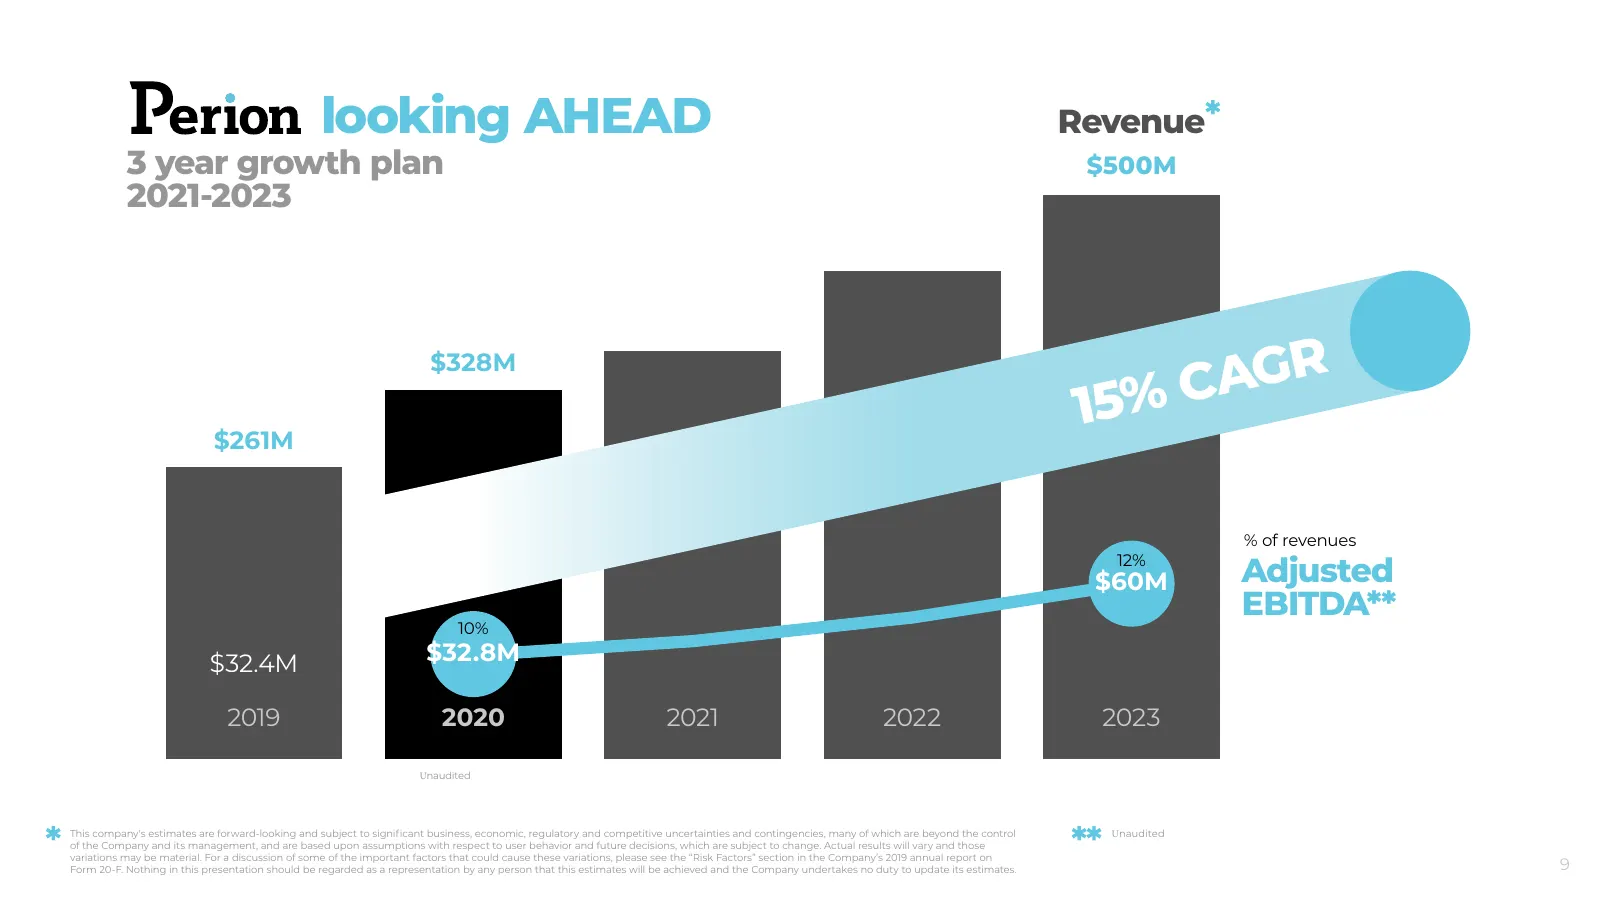
looking AHEAD Revenue 3 year growth plan $500M 2021-2023 $328M CAGR $261M 15% % of revenues 12% $60M Adjusted EBITDA** 10% $32.4M $32.8M 2019 2020 2021 2022 2023 Unaudited This company's estimates are forward-looking and subject to significant business, economic, regulatory and competitive uncertain
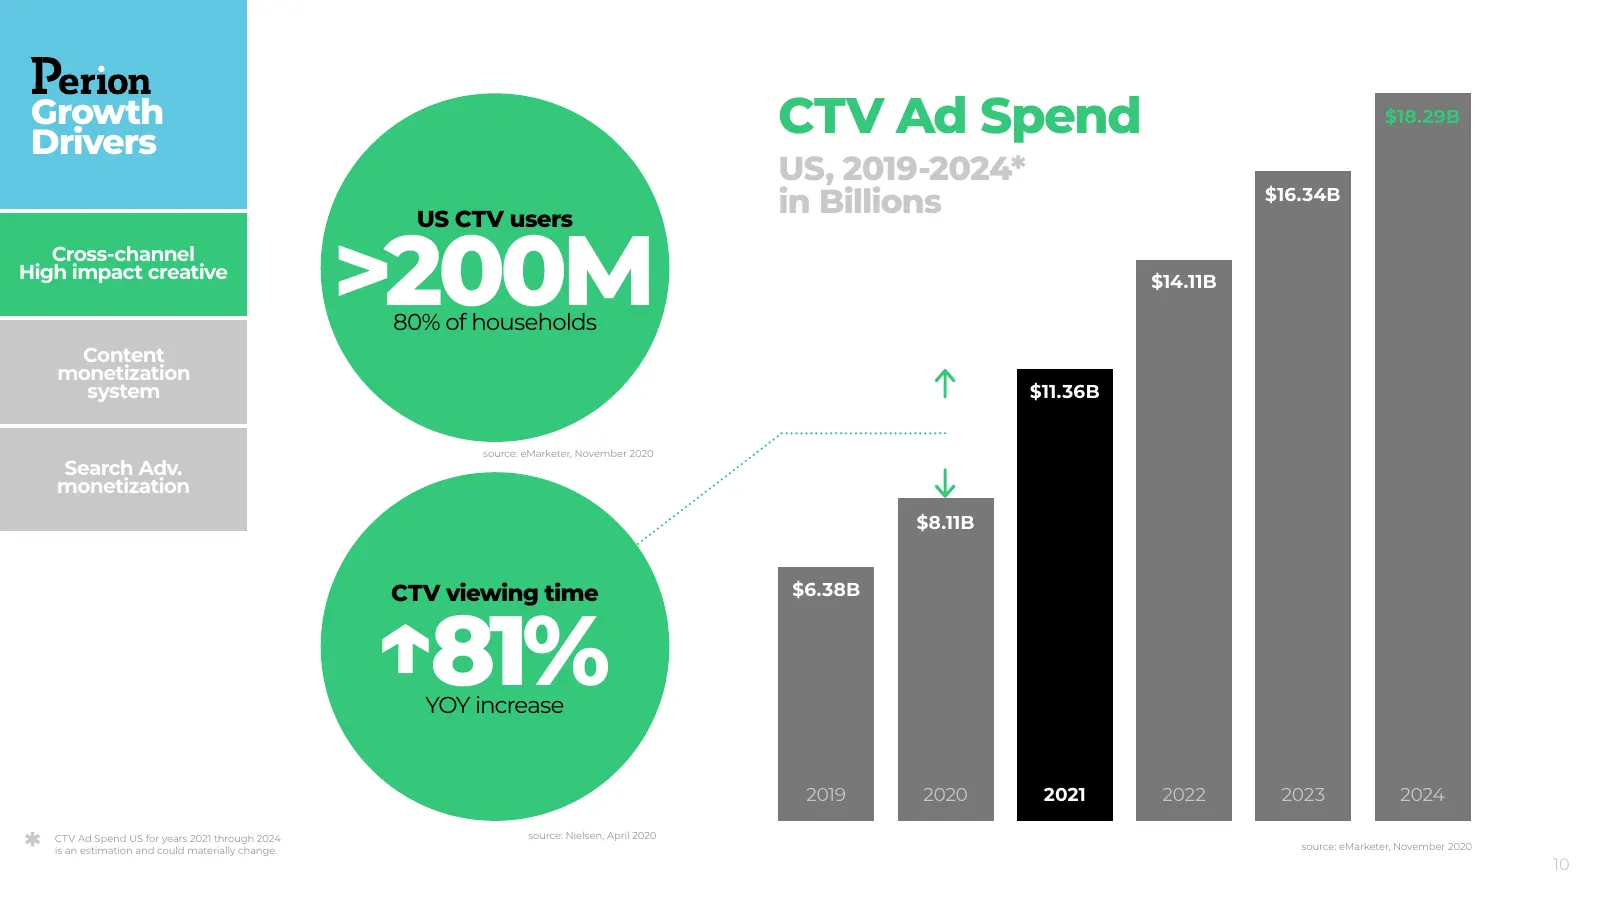
Slide 10: Growth drivers: CTV ad spend
Growth Drivers CTV Ad Spend $18.29B US, 2019-2024* in Billions $16.34B >200M US CTV users Cross-channel High impact creative $14.11B 80% of households Content monetization system $11.36B source: eMarketer, November 2020 Search Adv. monetization $8.11B ↑81% CTV viewing time $6.38B YOY increase 2019 2
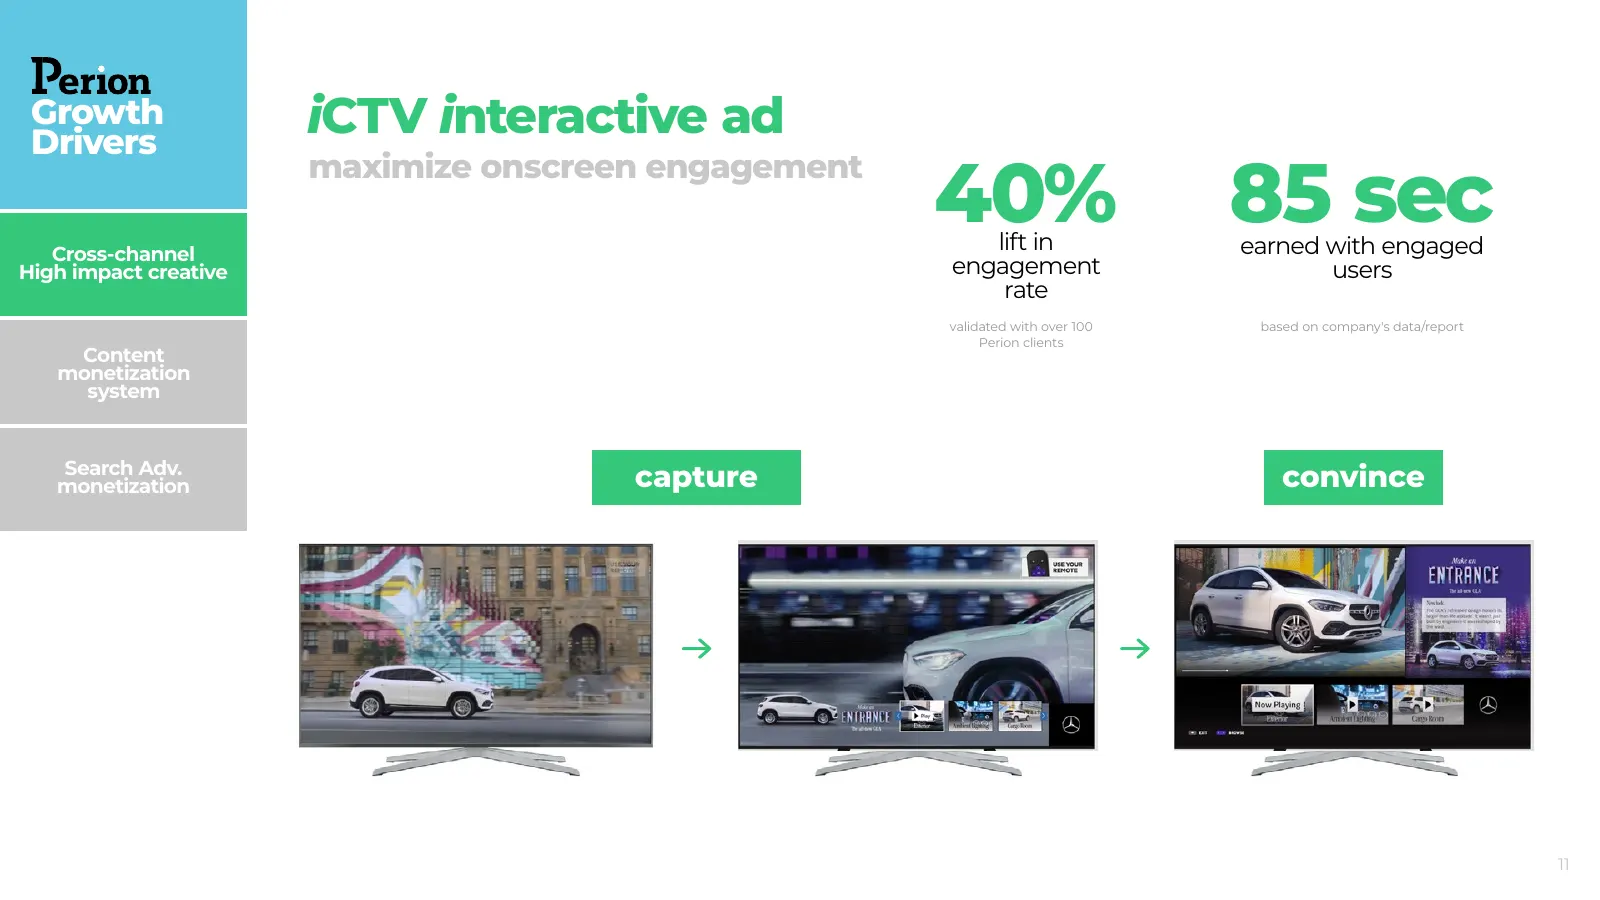
Slide 11: iCTV interactive ad
Growth Drivers iCTV interactive ad 40% 85 sec maximize onscreen engagement Cross-channel lift in earned with engaged High impact creative engagement users rate validated with over 100 based on company's data/report Perion clients Content monetization system Search Adv. monetization capture convince
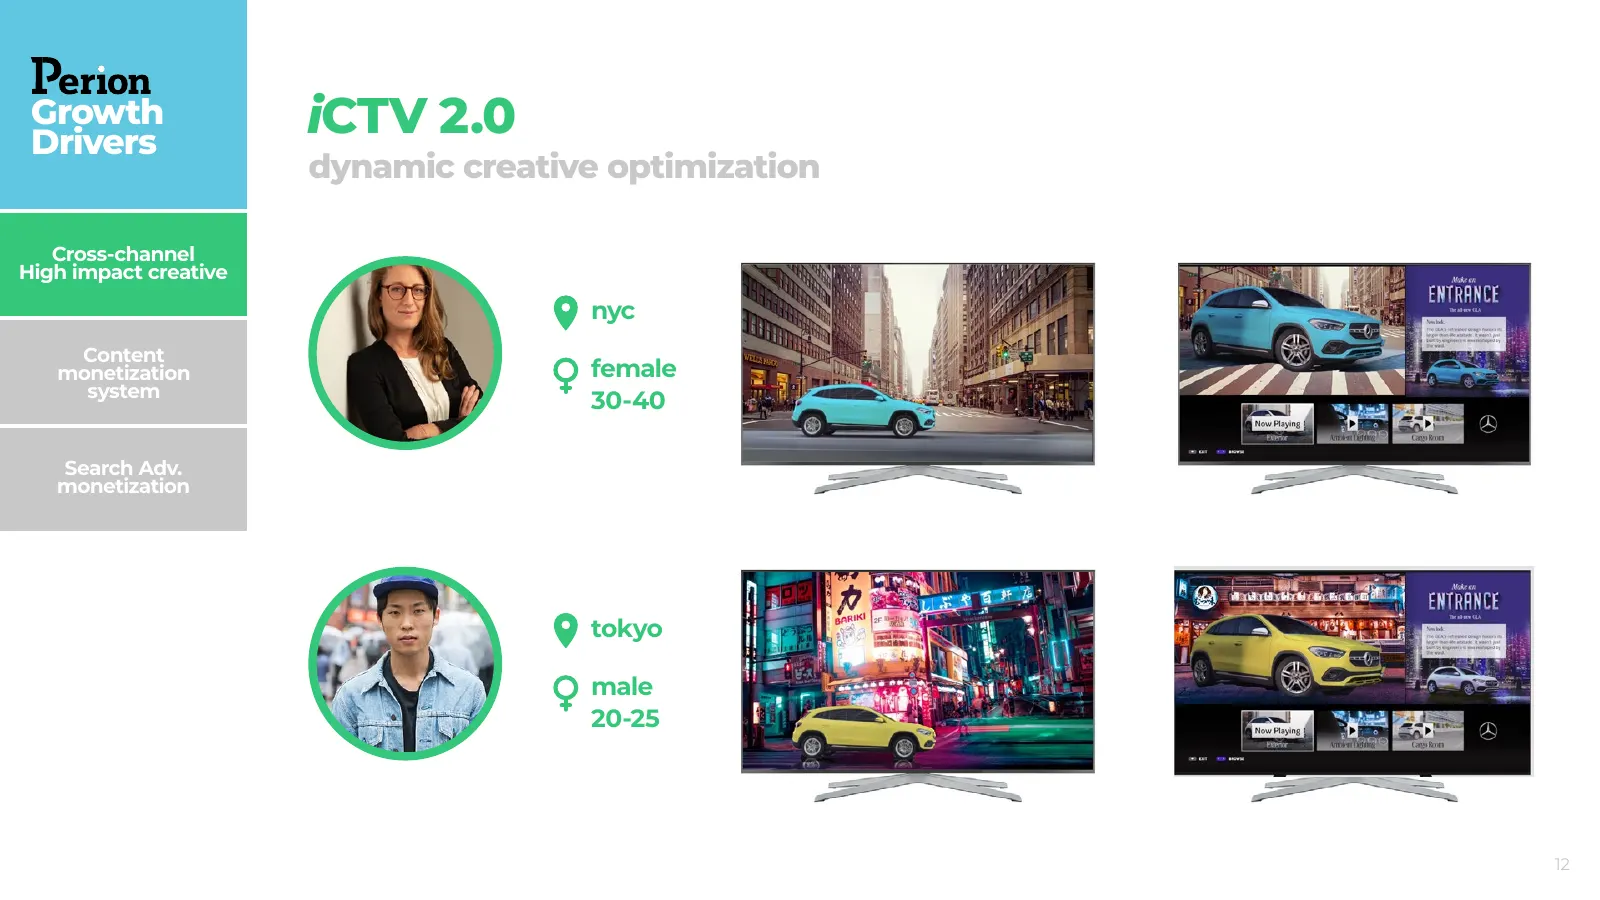
Slide 12: iCTV 2.0
Growth Drivers iCTV 2.0 dynamic creative optimization Cross-channel High impact creative nyc Content monetization female system 30-40 Search Adv. monetization tokyo male 20-25 12
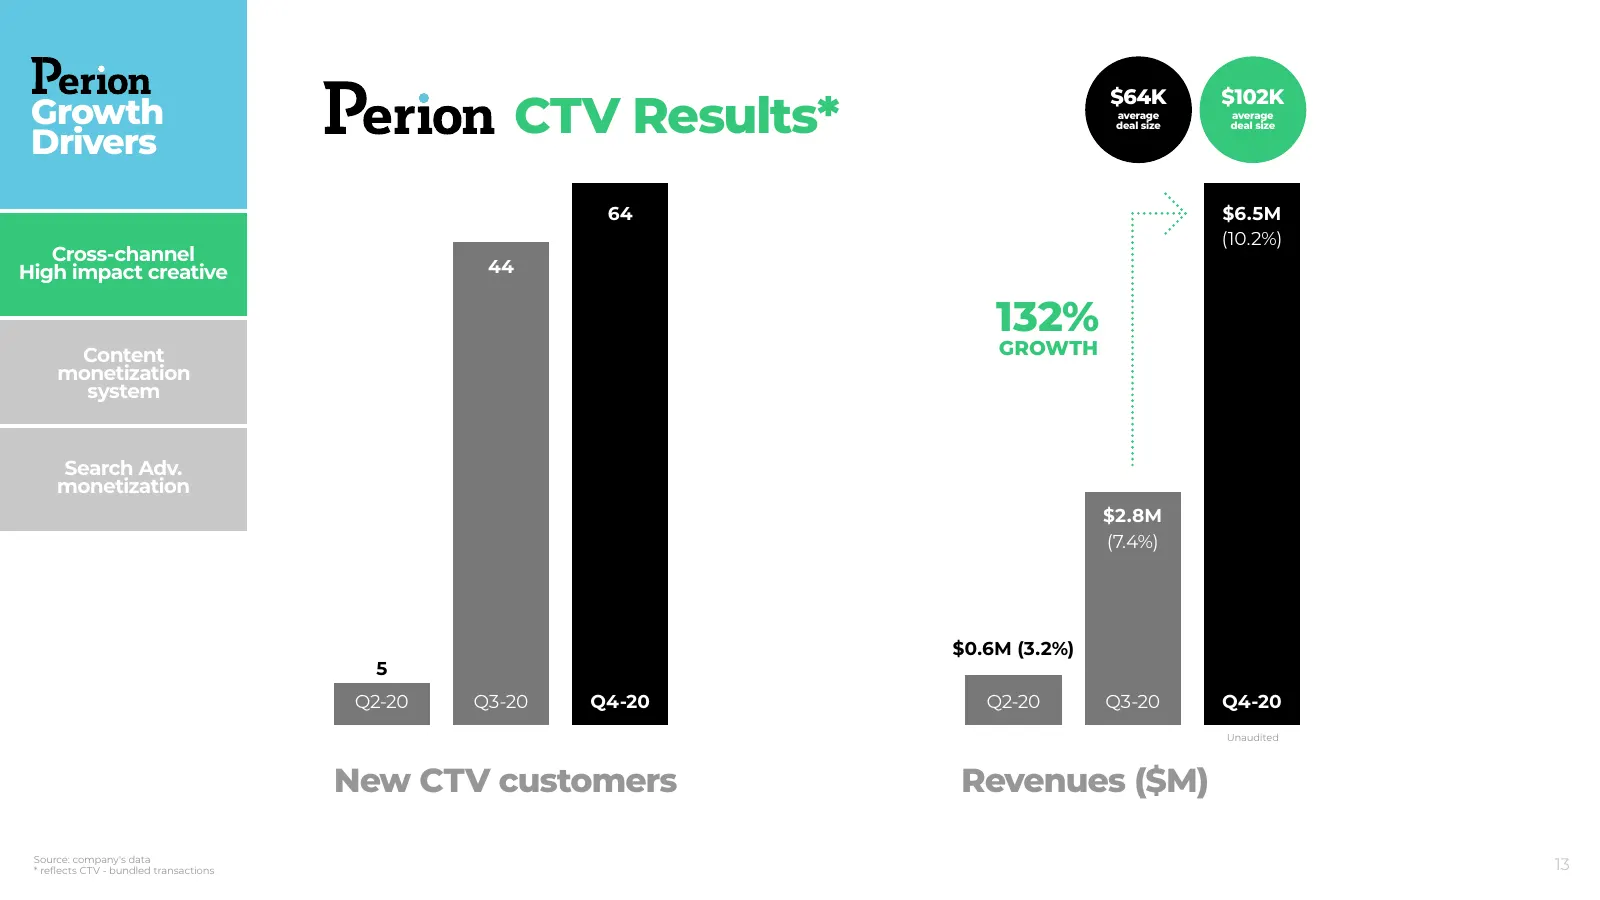
Slide 13: CTV Results
CTV Results* $64K $102K Growth average average Drivers deal size deal size 64 $6.5M (10.2%) Cross-channel High impact creative 44 132% Content GROWTH monetization system Search Adv. monetization $2.8M (7.4%) $0.6M (3.2%) 5 Q2-20 Q3-20 Q4-20 Q2-20 Q3-20 Q4-20 Unaudited New CTV customers Revenues ($M)
Slide 14: Publishers are struggling
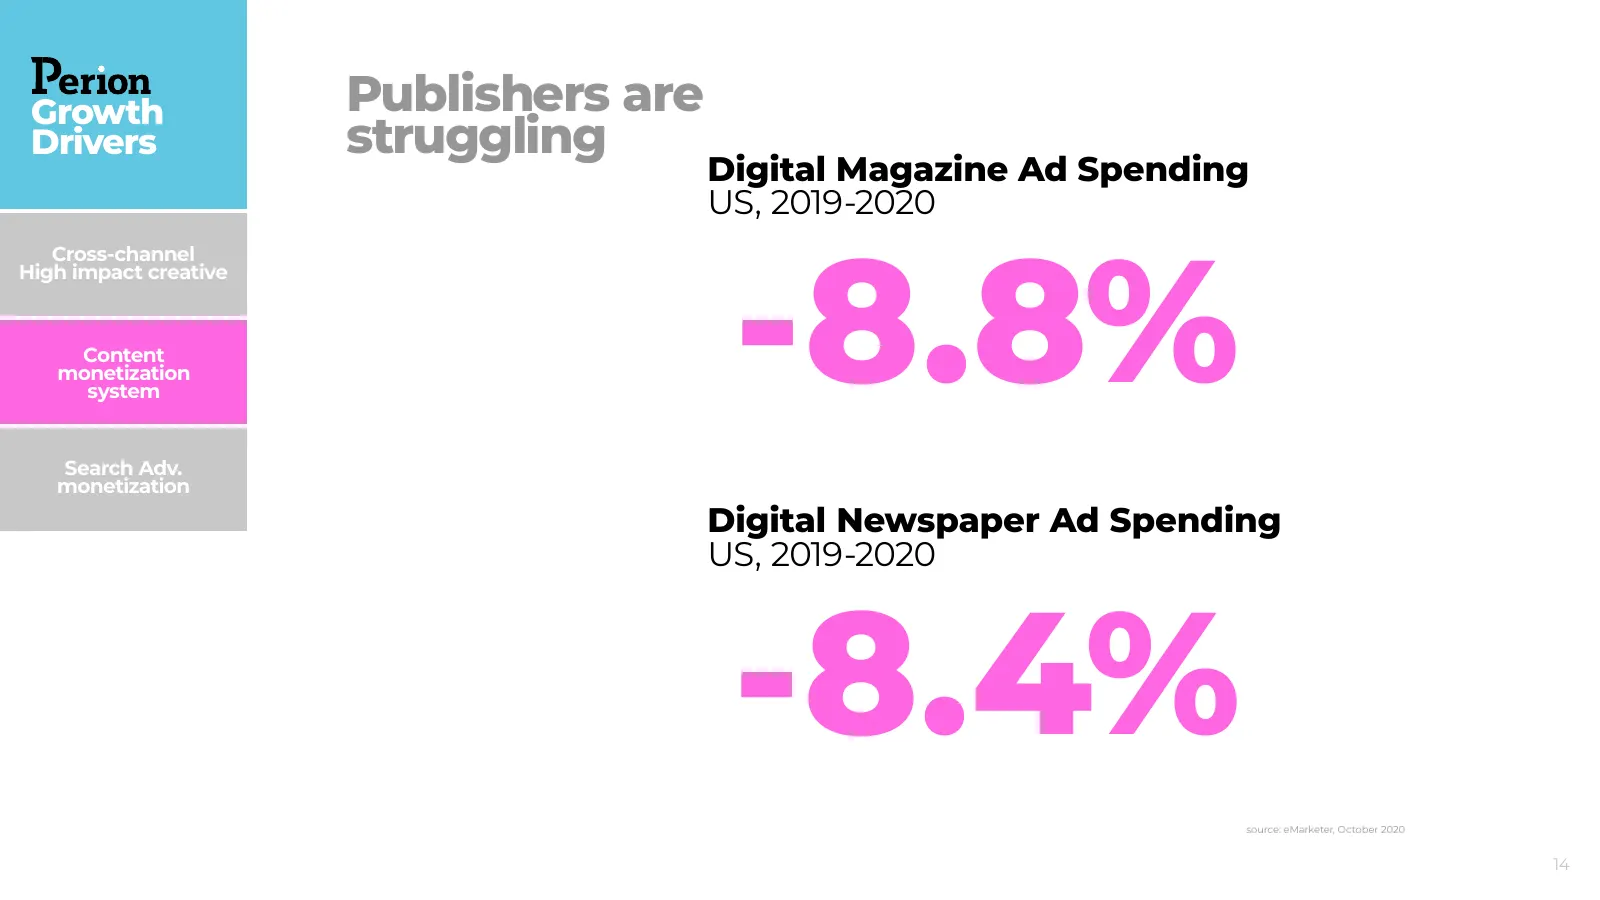
Growth Publishers are Drivers struggling Digital Magazine Ad Spending US, 2019-2020 -8.8% Cross-channel High impact creative Content monetization system Search Adv. monetization Digital Newspaper Ad Spending US, 2019-2020 -8.4% source: eMarketer, October 2020 14
Slide 15: Content monetization system
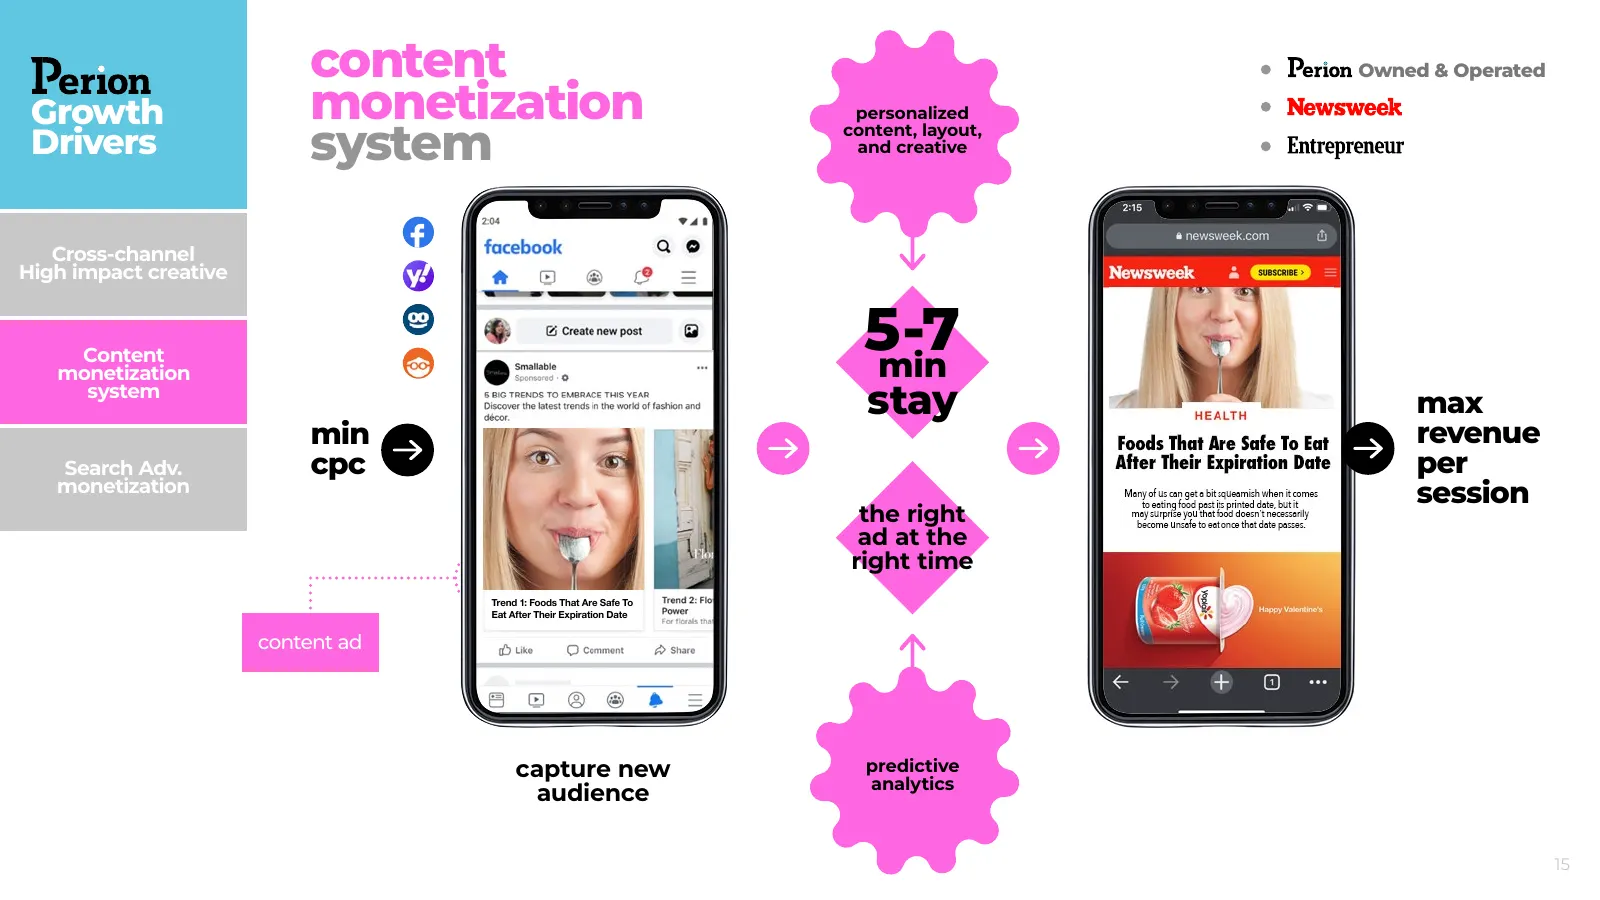
content Owned & Operated Growth monetization personalized Drivers system content, layout, and creative Cross-channel High impact creative Content monetization 5-7 min system stay max min revenue Search Adv. cpc per monetization session the right ad at the right time Trend 1: Foods That Are Safe To E
Slide 16: Display & social advertising revenues
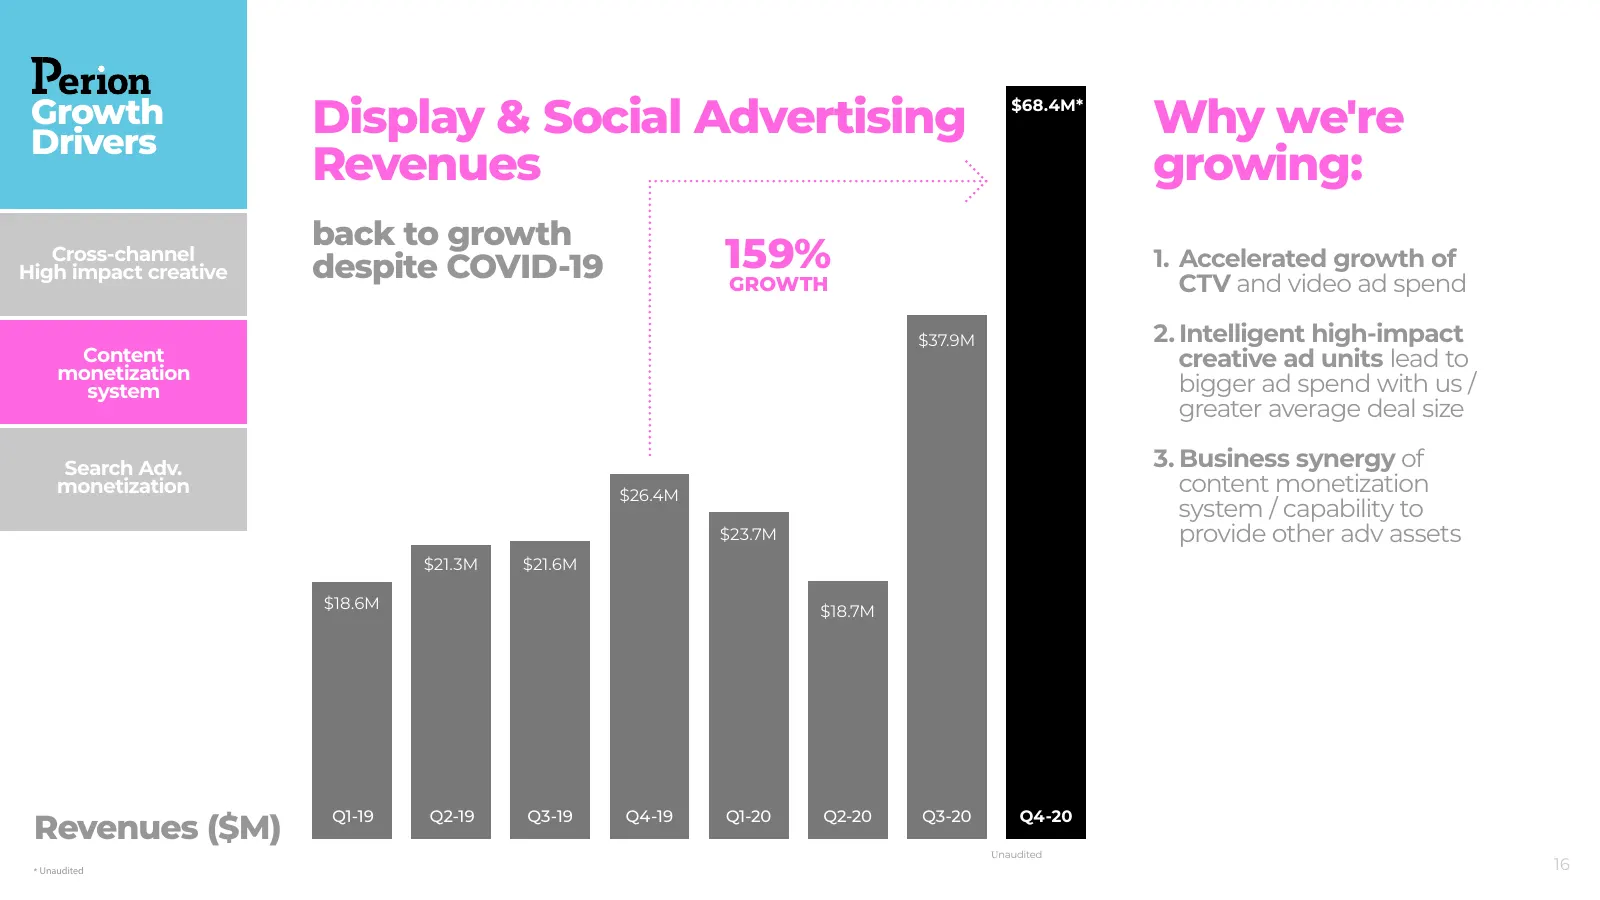
Growth Drivers Display & Social Advertising $68.4M* Why we're Revenues growing: back to growth Cross-channel High impact creative despite COVID-19 159% 1. Accelerated growth of GROWTH CTV and video ad spend $37.9M 2. Intelligent high-impact Content creative ad units lead to monetization system bigge
Slide 17: Key growth drivers: search ad spending
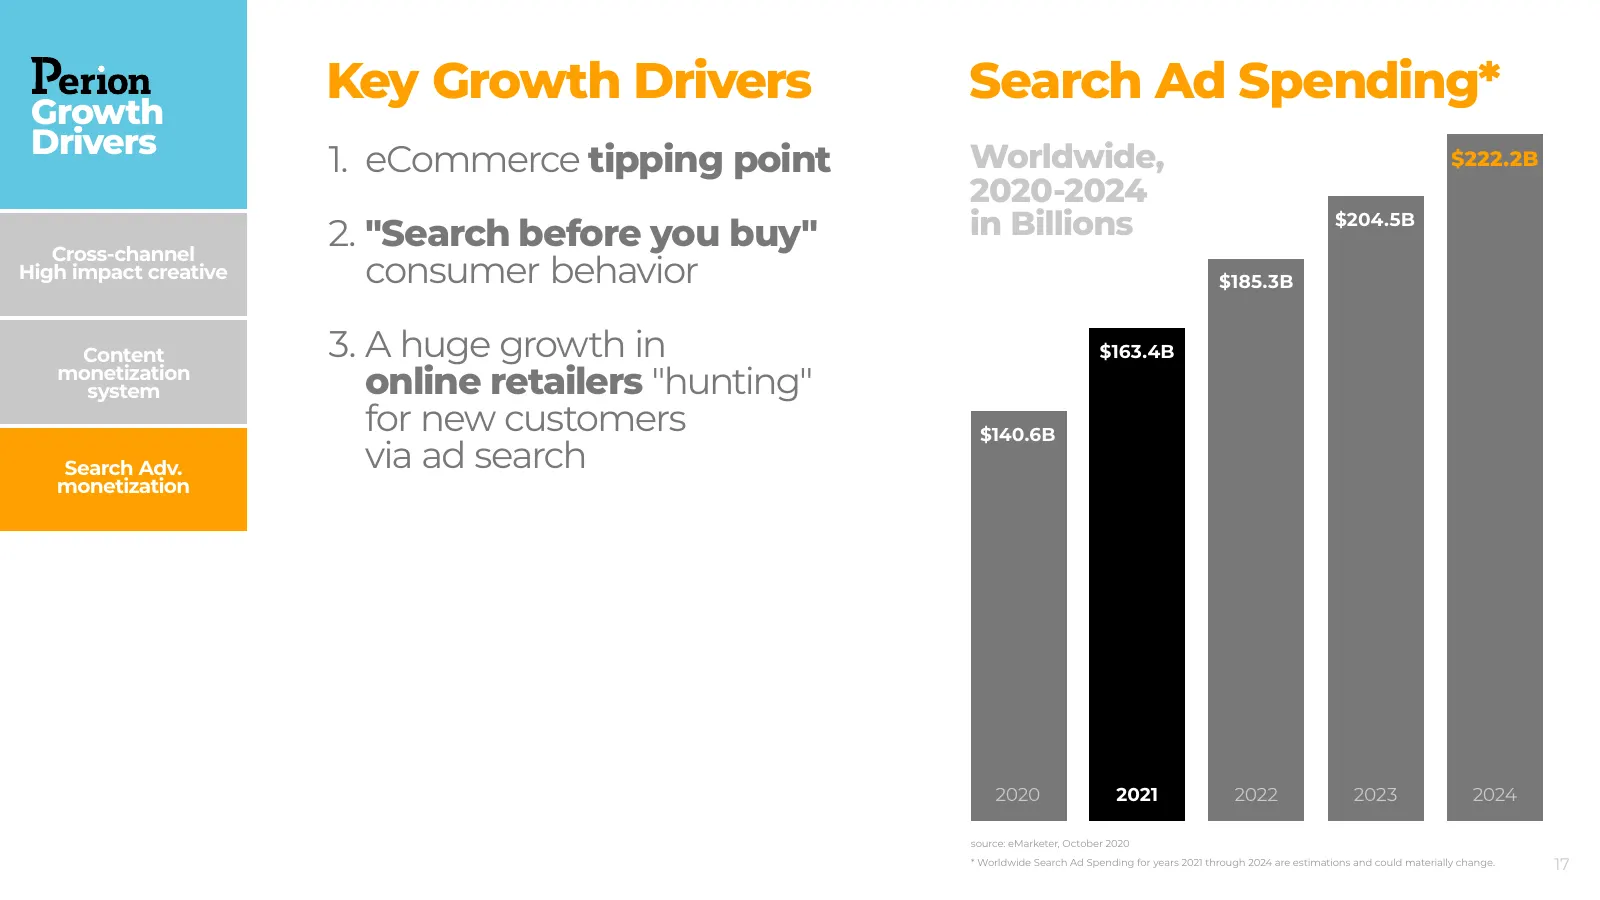
Key Growth Drivers Search Ad Spending* Growth Drivers 1. eCommerce tipping point Worldwide, $222.2B 2020-2024 2. "Search before you buy" in Billions $204.5B Cross-channel High impact creative consumer behavior $185.3B Content 3. A huge growth in $163.4B monetization system online retailers "hunting"
Slide 18: New monetization opportunities within apps
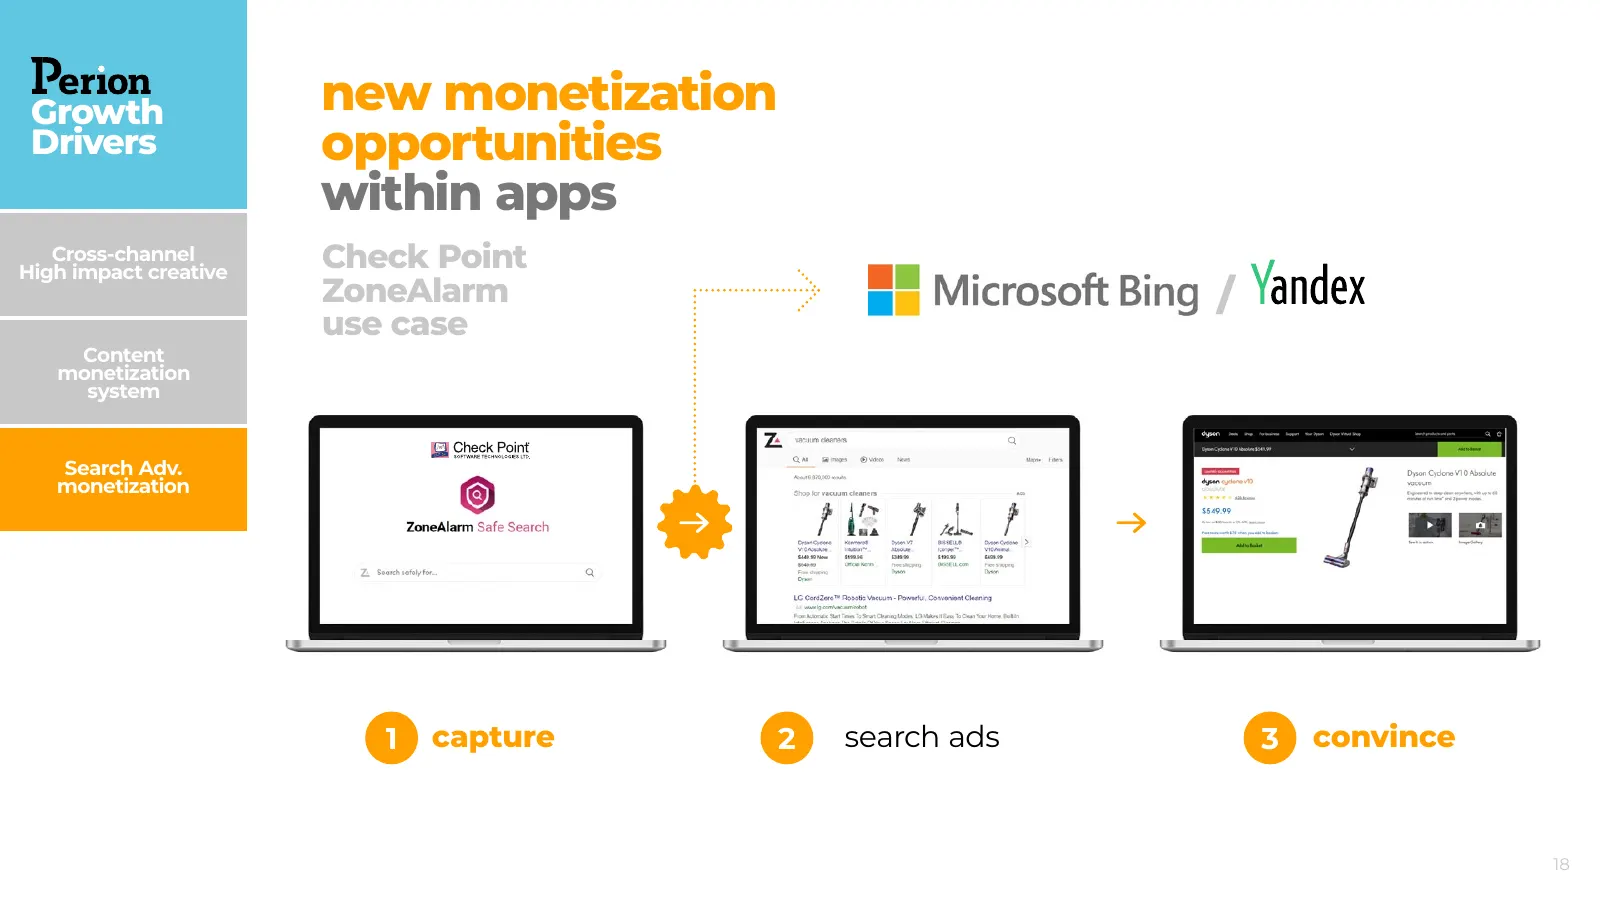
Growth new monetization Drivers opportunities within apps Cross-channel High impact creative Check Point ZoneAlarm / use case Content monetization system Search Adv. monetization 1 capture 2 search ads 3 convince 18
Slide 19: Search mediation for publishers
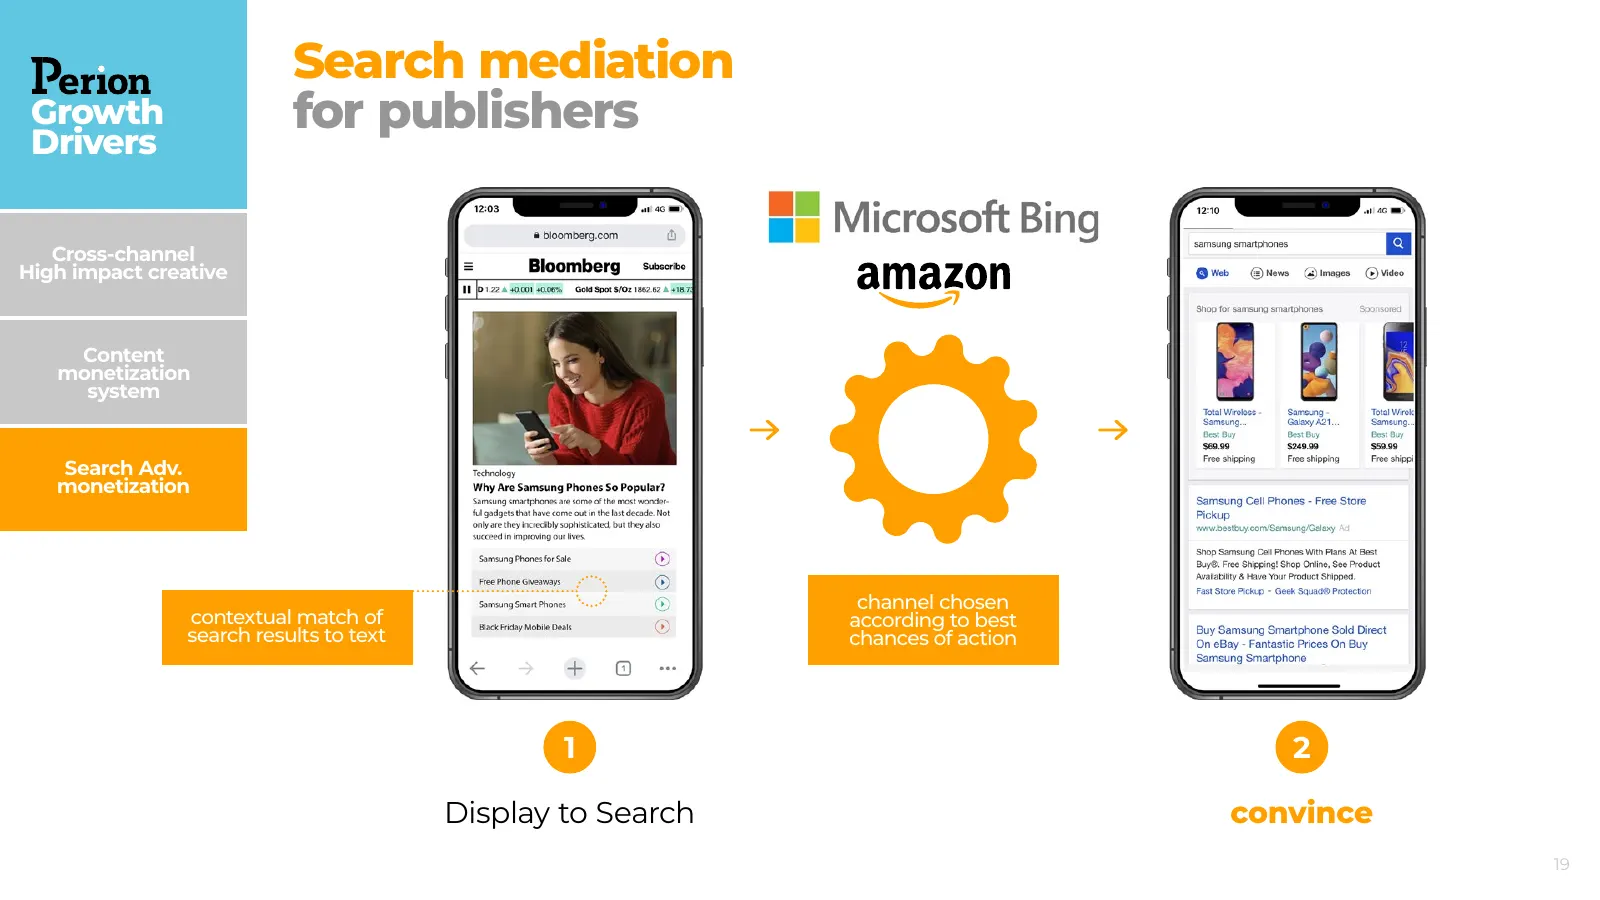
Search mediation Growth for publishers Drivers Cross-channel High impact creative Content monetization system Search Adv. monetization channel chosen contextual match of according to best search results to text chances of action 1 2 Display to Search convince 19
Slide 20: $800M new agreement signed Nov. 2020
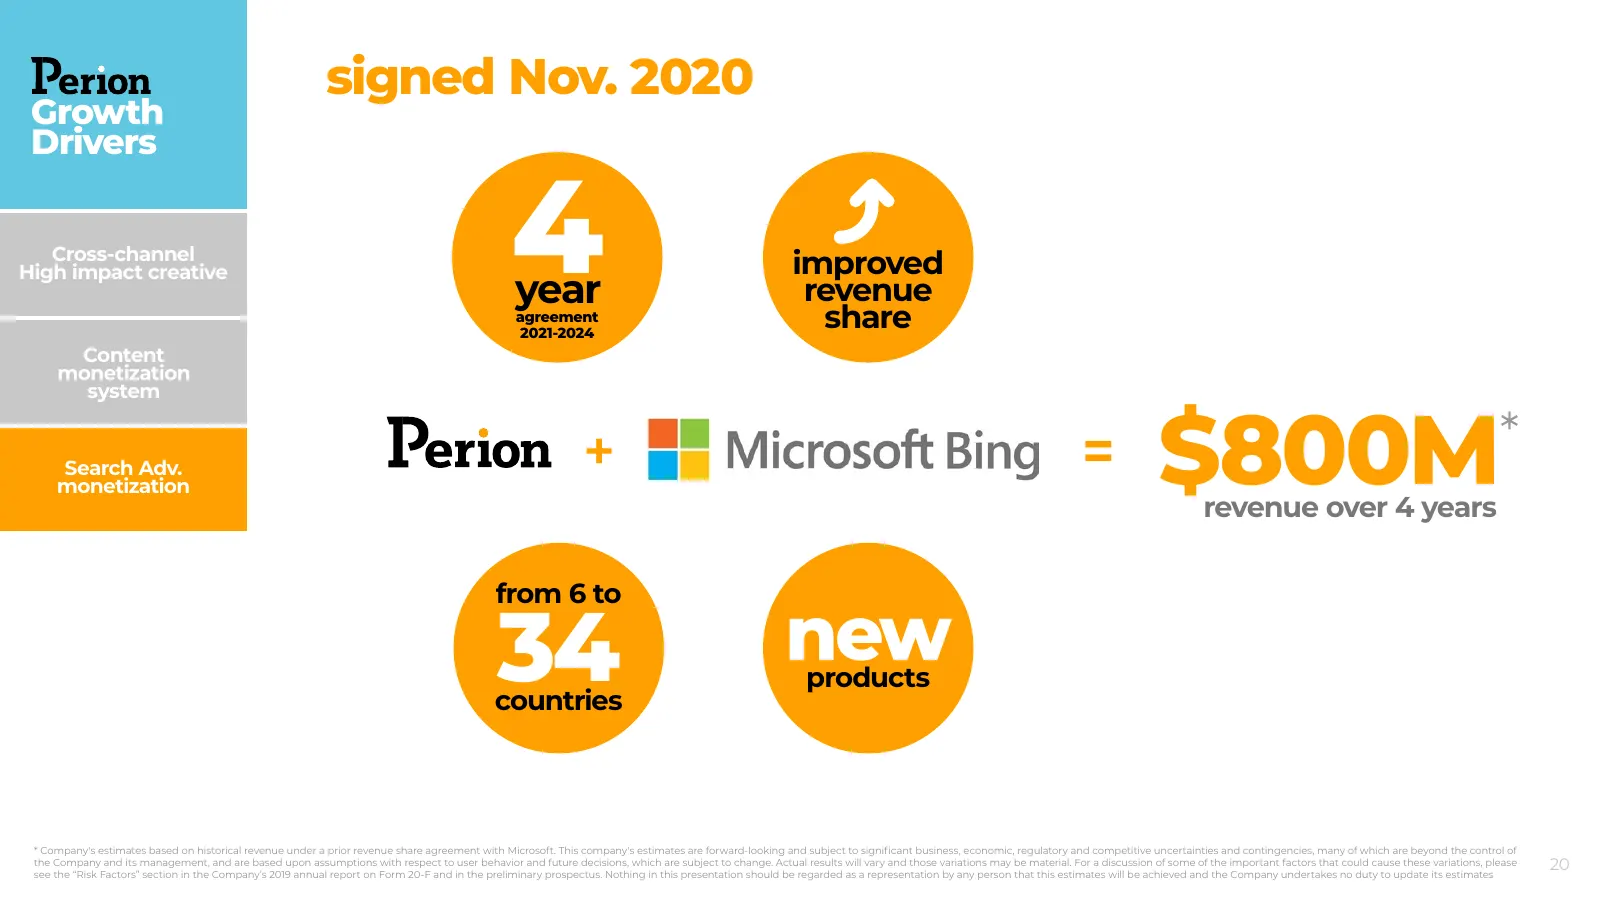
signed Nov. 2020 Growth Drivers Cross-channel High impact creative 4year agreement 2021-2024 improved revenue share Content monetization system Search Adv. monetization + = $800M revenue over 4 years * from 6 to 34 countries new products * Company's estimates based on historical revenue under a prio
Slide 21: Search advertising revenues
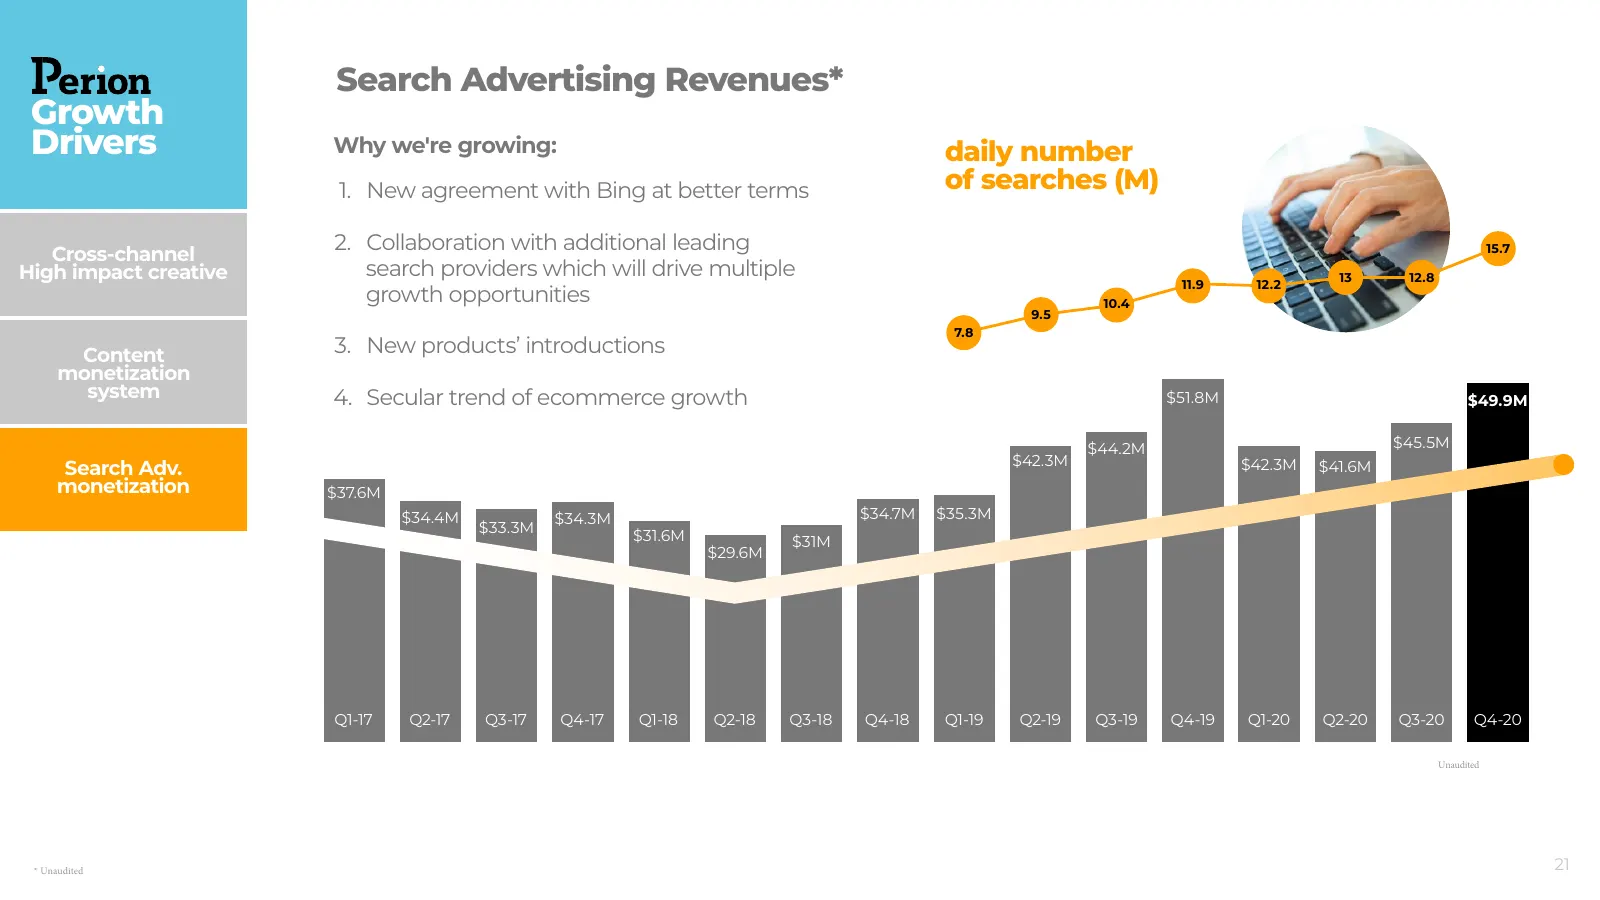
Search Advertising Revenues* Growth Drivers Why we're growing: daily number 1. New agreement with Bing at better terms of searches (M) Cross-channel 2. Collaboration with additional leading 15.7 High impact creative search providers which will drive multiple 13 12.8 11.9 12.2 growth opportunities 10
Slide 22: 5 ways the future points to $500M
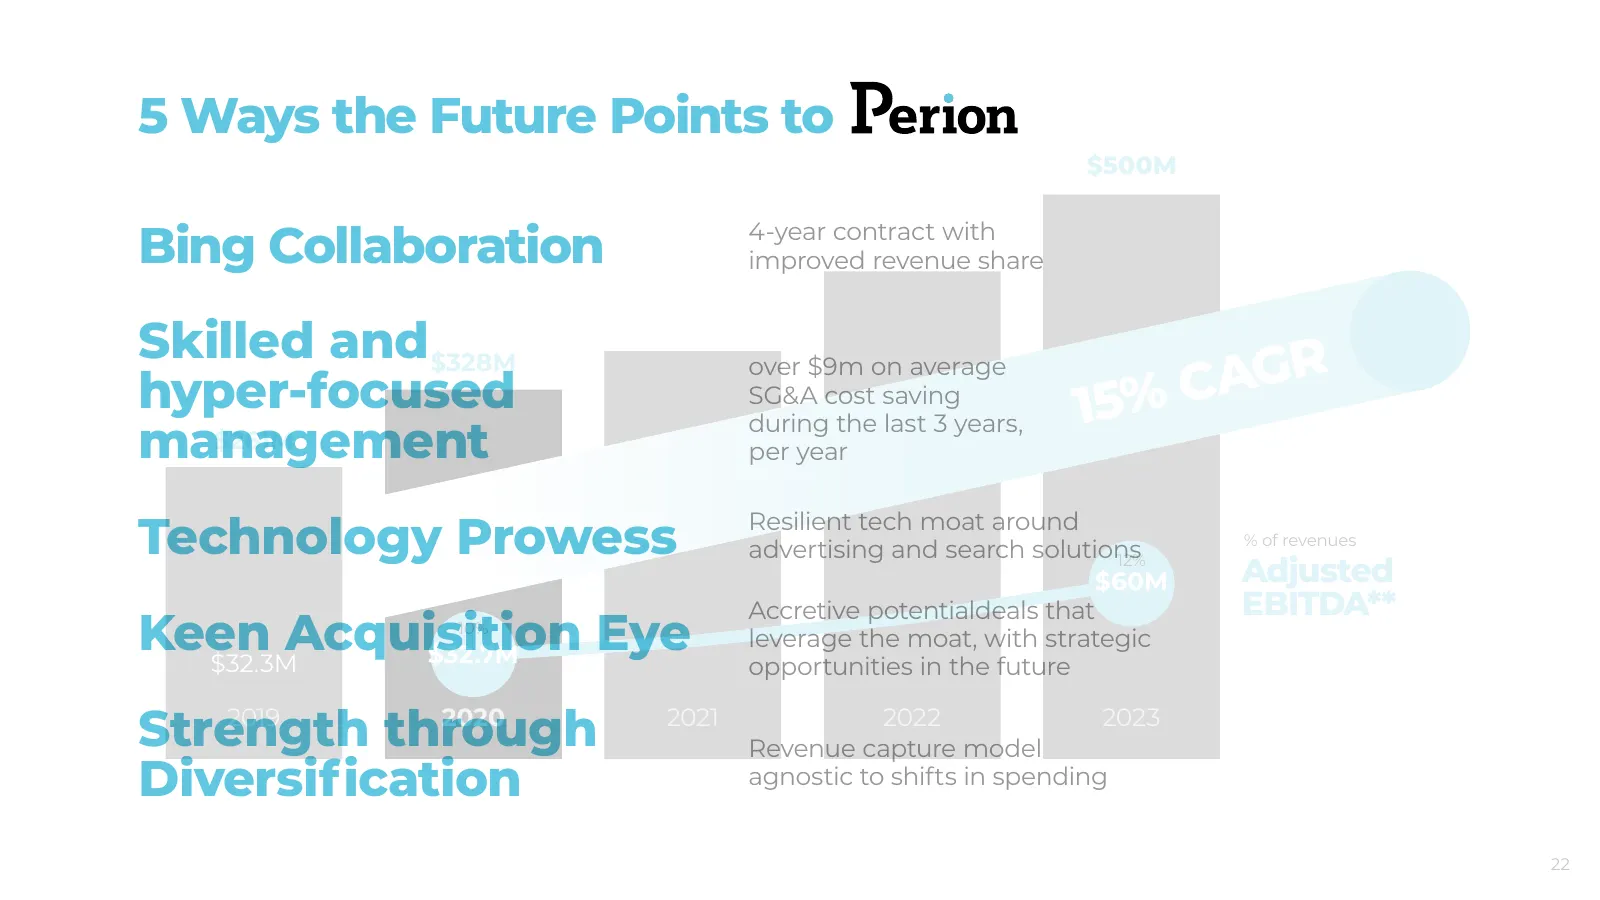
5 Ways the Future Points to $500M Bing Collaboration 4-year contract with improved revenue share Skilled and$328M R hyper-focused over $9m on average CAG SG&A cost saving 15% management during the last 3 years, $261M per year Technology Prowess Resilient tech moat around advertising and search solut
Slide 23: Peer group comparison
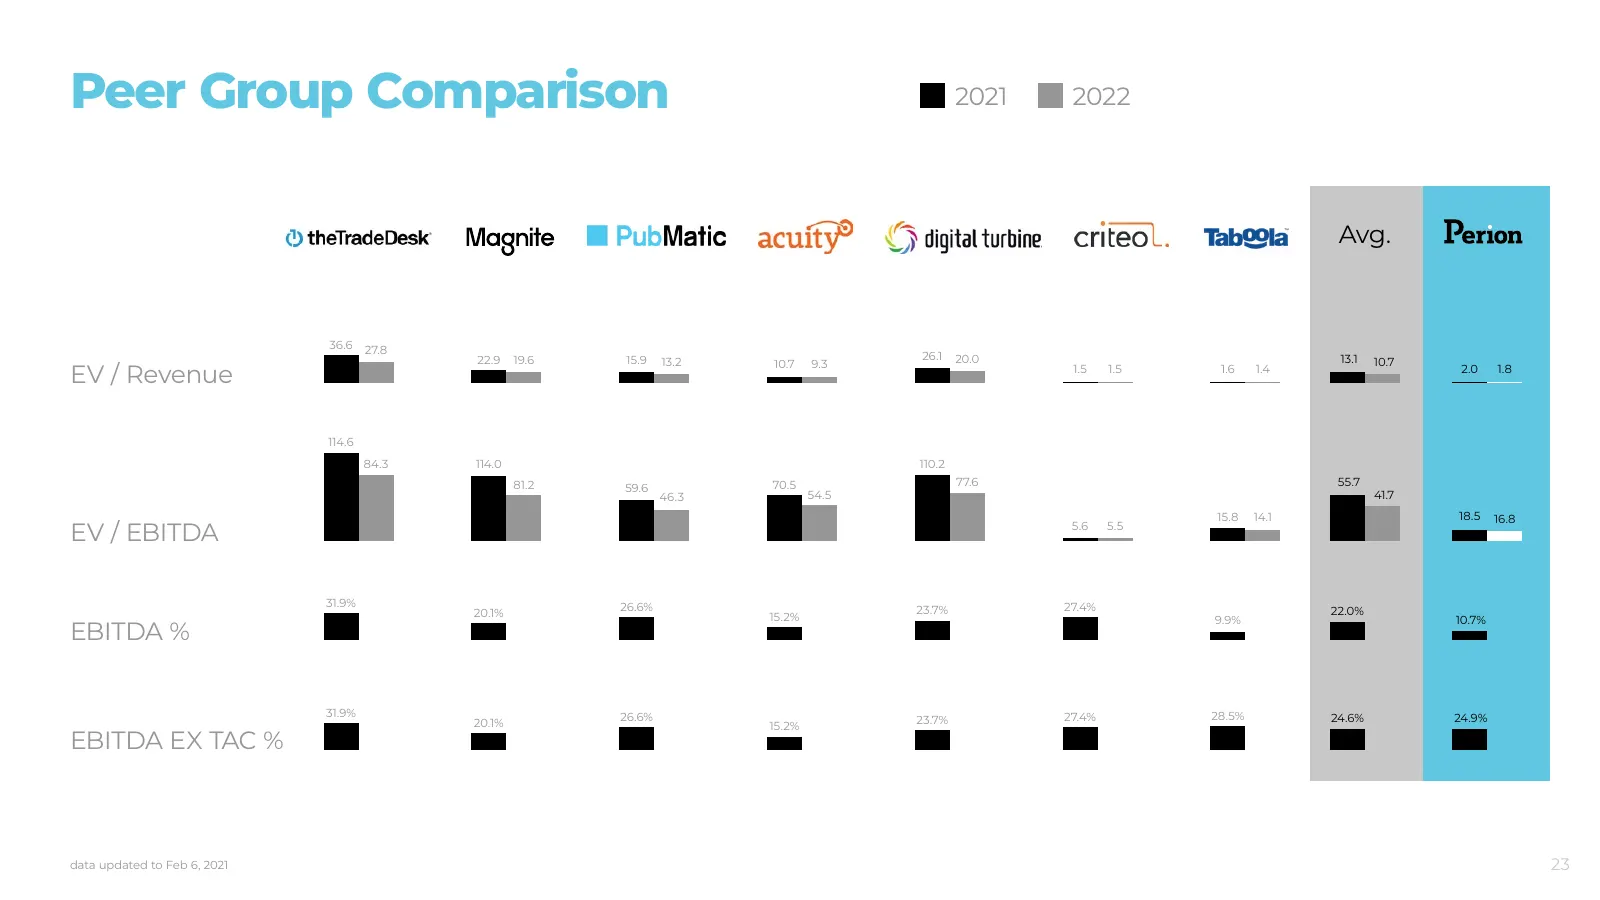
Peer Group Comparison 2021 2022 Avg. 36.6 27.8 22.9 19.6 15.9 26.1 20.0 13.1 10.7 13.2 10.7 9.3 EV / Revenue 1.5 1.5 1.6 1.4 2.0 1.8 114.6 84.3 114.0 110.2 81.2 59.6 70.5 77.6 55.7 46.3 54.5 41.7 15.8 14.1 18.5 16.8 EV / EBITDA 5.6 5.5 31.9% 26.6% 27.4% 20.1% 23.7% 22.0% 15.2% 9.9% 10.7% EBITDA % 31
Slide 24: Perion capture&convince
Perion ~ 7 capture&convince

Slide 25: Thank you
thank you 25
Slide 26: Appendix
appendix 26
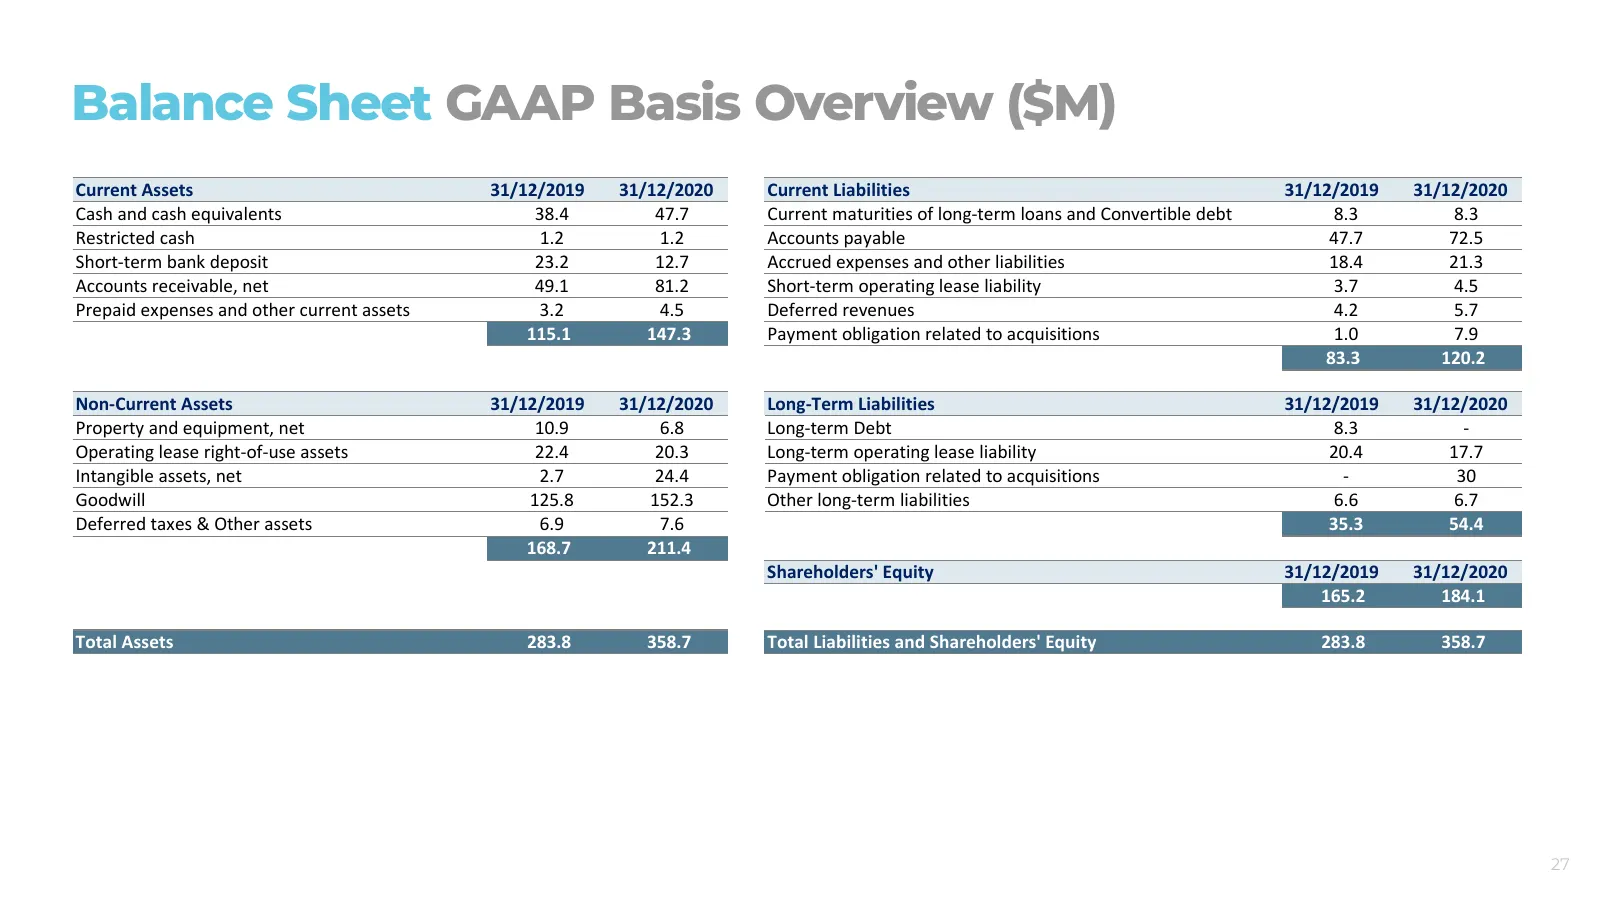
Slide 27: Balance Sheet GAAP Basis Overview ($M)
Balance Sheet GAAP Basis Overview ($M) Current Assets 31/12/2019 31/12/2020 Current Liabilities 31/12/2019 31/12/2020 Cash and cash equivalents 38.4 47.7 Current maturities of long-term loans and Convertible debt 8.3 8.3 Restricted cash 1.2 1.2 Accounts payable 47.7 72.5 Short-term bank deposit 23.2
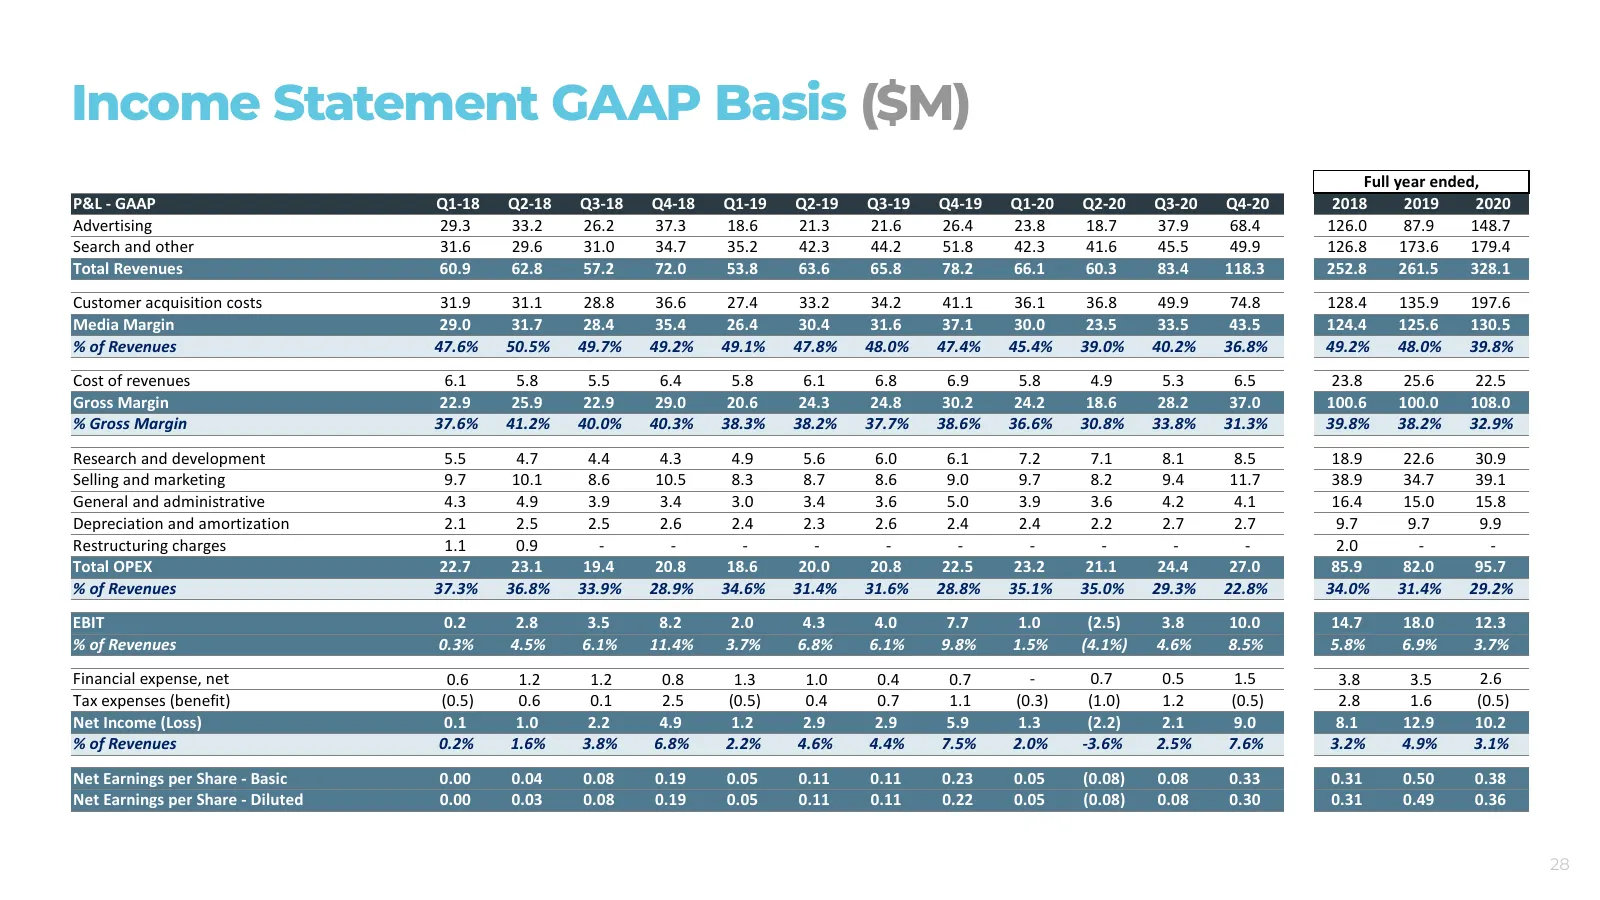
Slide 28: Income Statement GAAP Basis ($M)
Income Statement GAAP Basis ($M) Full year ended, P&L - GAAP Q1-18 Q2-18 Q3-18 Q4-18 Q1-19 Q2-19 Q3-19 Q4-19 Q1-20 Q2-20 Q3-20 Q4-20 2018 2019 2020 Advertising 29.3 33.2 26.2 37.3 18.6 21.3 21.6 26.4 23.8 18.7 37.9 68.4 126.0 87.9 148.7 Search and other 31.6 29.6 31.0 34.7 35.2 42.3 44.2 51.8 42.3 4
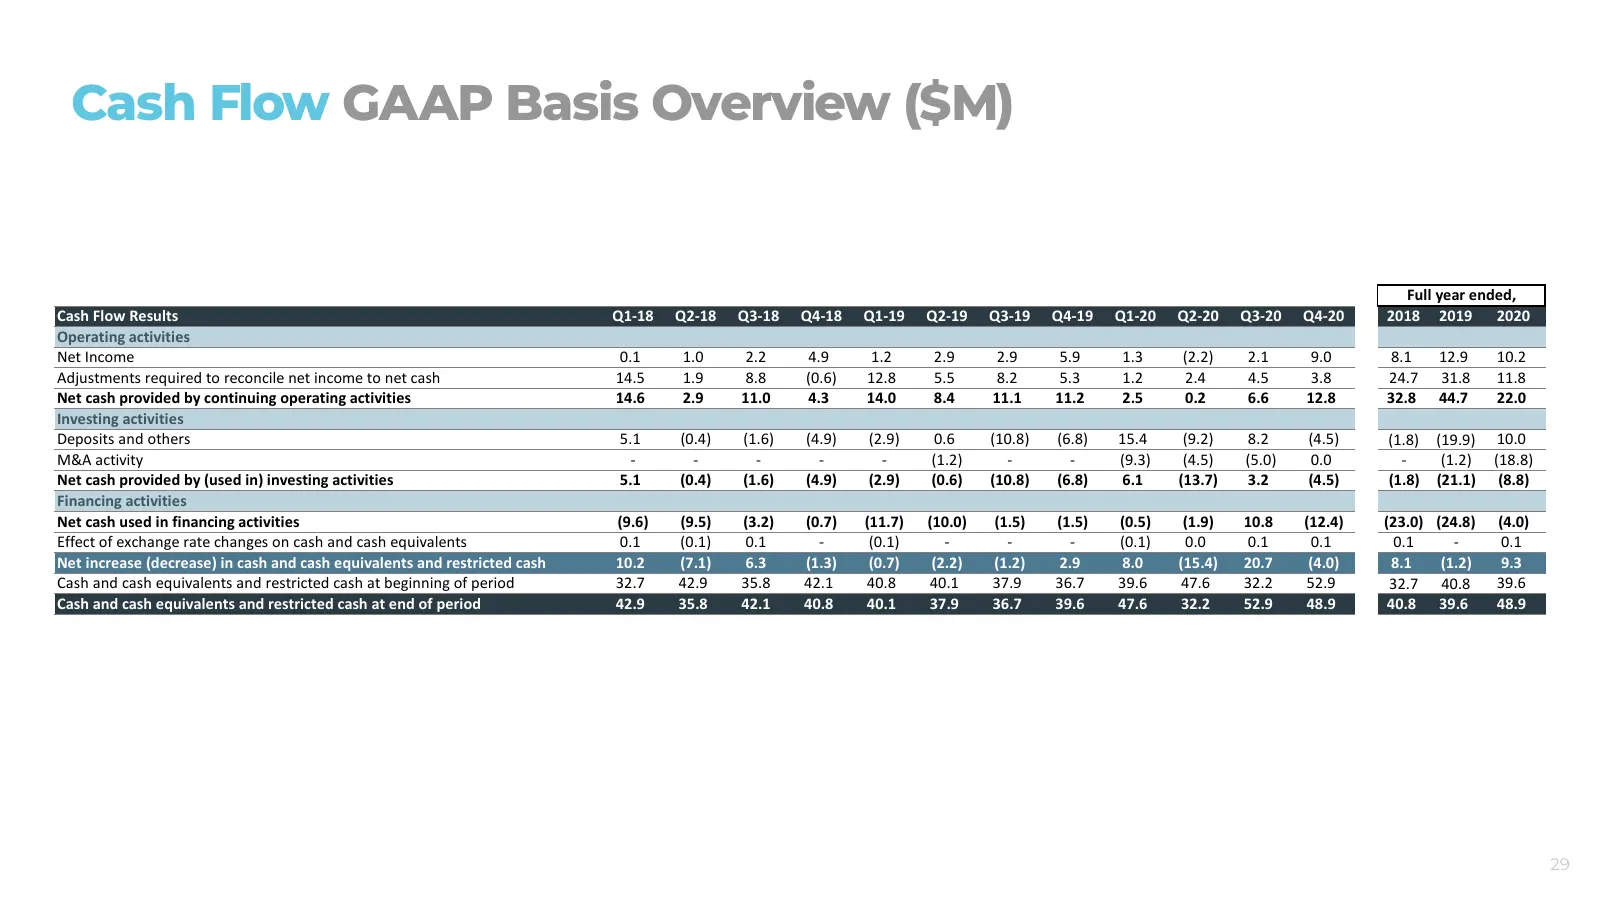
Slide 29: Cash Flow GAAP Basis Overview ($M)
Cash Flow GAAP Basis Overview ($M) Full year ended, Cash Flow Results Q1-18 Q2-18 Q3-18 Q4-18 Q1-19 Q2-19 Q3-19 Q4-19 Q1-20 Q2-20 Q3-20 Q4-20 2018 2019 2020 Operating activities Net Income 0.1 1.0 2.2 4.9 1.2 2.9 2.9 5.9 1.3 (2.2) 2.1 9.0 8.1 12.9 10.2 Adjustments required to reconcile net income to
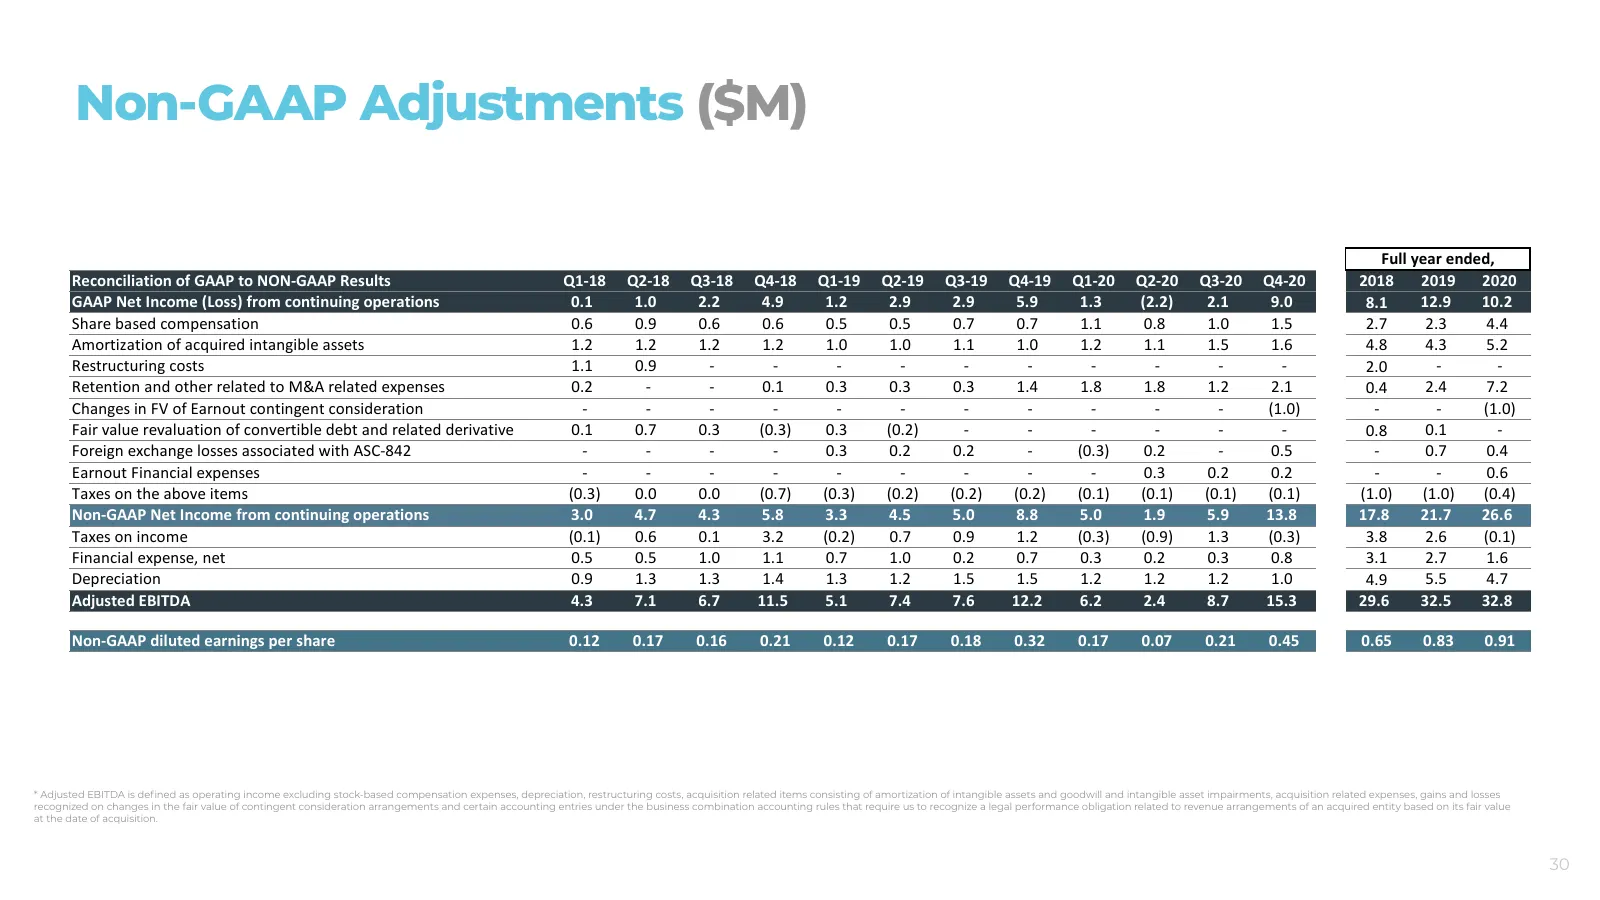
Slide 30: Non-GAAP Adjustments ($M)
Non-GAAP Adjustments ($M) Full year ended, Reconciliation of GAAP to NON-GAAP Results Q1-18 Q2-18 Q3-18 Q4-18 Q1-19 Q2-19 Q3-19 Q4-19 Q1-20 Q2-20 Q3-20 Q4-20 2018 2019 2020 GAAP Net Income (Loss) from continuing operations 0.1 1.0 2.2 4.9 1.2 2.9 2.9 5.9 1.3 (2.2) 2.1 9.0 8.1 12.9 10.2 Share based c
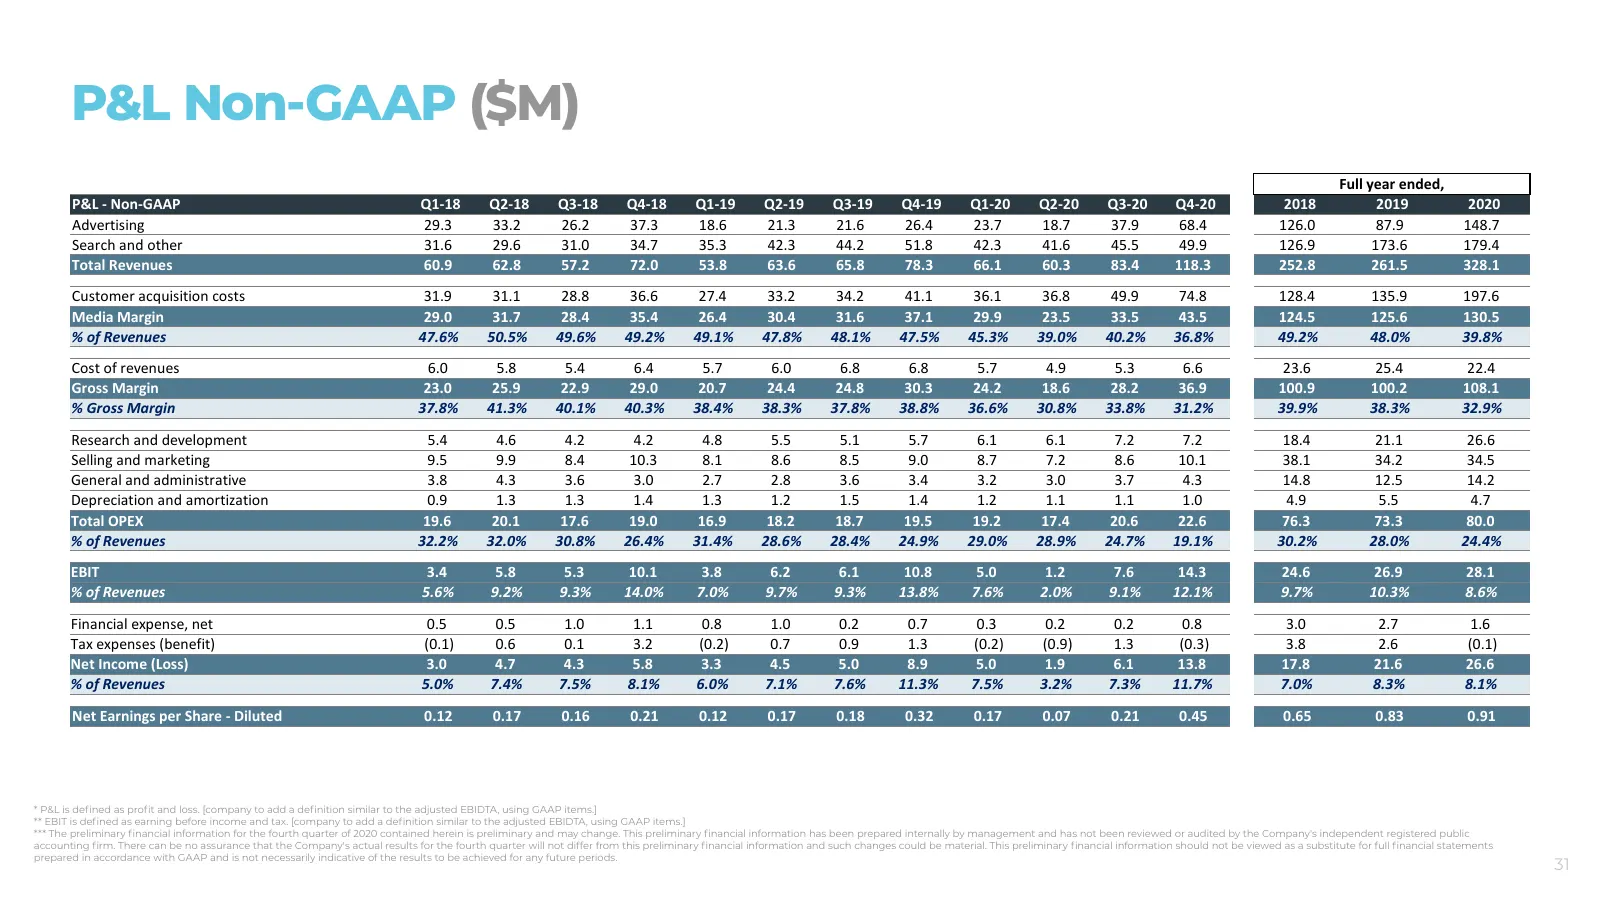
Slide 31: P&L Non-GAAP ($M)
P&L Non-GAAP ($M) Full year ended, P&L - Non-GAAP Q1-18 Q2-18 Q3-18 Q4-18 Q1-19 Q2-19 Q3-19 Q4-19 Q1-20 Q2-20 Q3-20 Q4-20 2018 2019 2020 Advertising 29.3 33.2 26.2 37.3 18.6 21.3 21.6 26.4 23.7 18.7 37.9 68.4 126.0 87.9 148.7 Search and other 31.6 29.6 31.0 34.7 35.3 42.3 44.2 51.8 42.3 41.6 45.5 49
Source: Internet Archive copy of perion.com
More decks from Perion Network Ltd
 Q2 2026 Earnings Presentation43 slides · Aug 10, 2026
 Investor Presentation (August 2026)83 slides · August 2026
 Investor Presentation (June 2026)80 slides · Jun 29, 2026
 Q1 2026 Earnings Presentation39 slides · May 20, 2026
 Q4 2025 Earnings Presentation54 slides · Feb 18, 2026
 Q3 2025 Earnings Presentation40 slides · Nov 12, 2025