Premier Financial — First Defiance Financial — Investor Presentation (February 2020)
40 slides from Premier Financial's investor presentation, Feb 13, 2020
Slide 1: Investor Update February 2020
Investor Update February 2020 Donald P. Hileman CEO Gary M. Small President Paul D. Nungester EVP & CFO
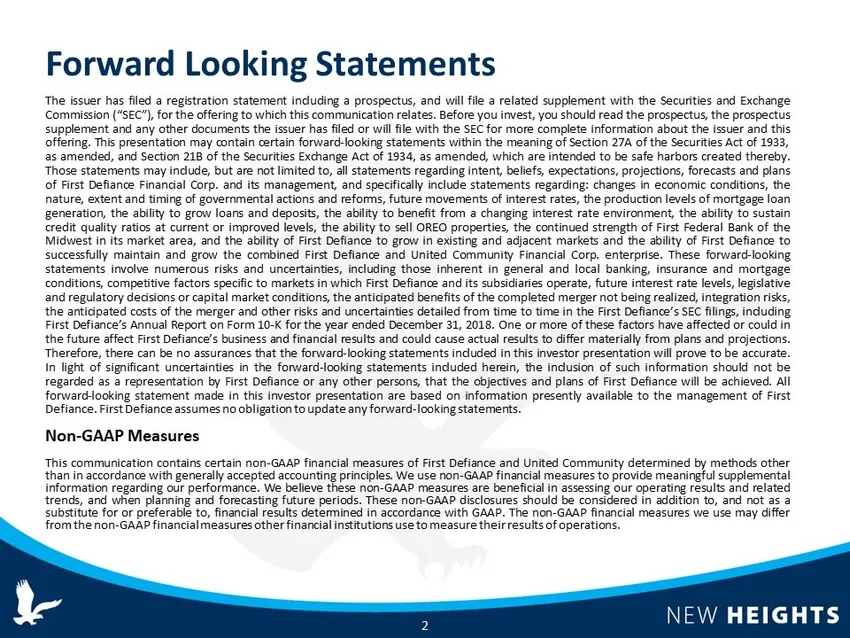
Slide 2: Forward Looking Statements
Forward Looking Statements The issuer has filed a registration statement including a prospectus, and will file a related supplement with the Securities and Exchange Commission (“SEC”), for the offering to which this communication relates . Before you invest, you should read the prospectus, the prosp
Slide 3: Company Overview
Company Overview FIRST DEFIANCE FINANCIAL CORR Better tagether. NEW HEIGHTS
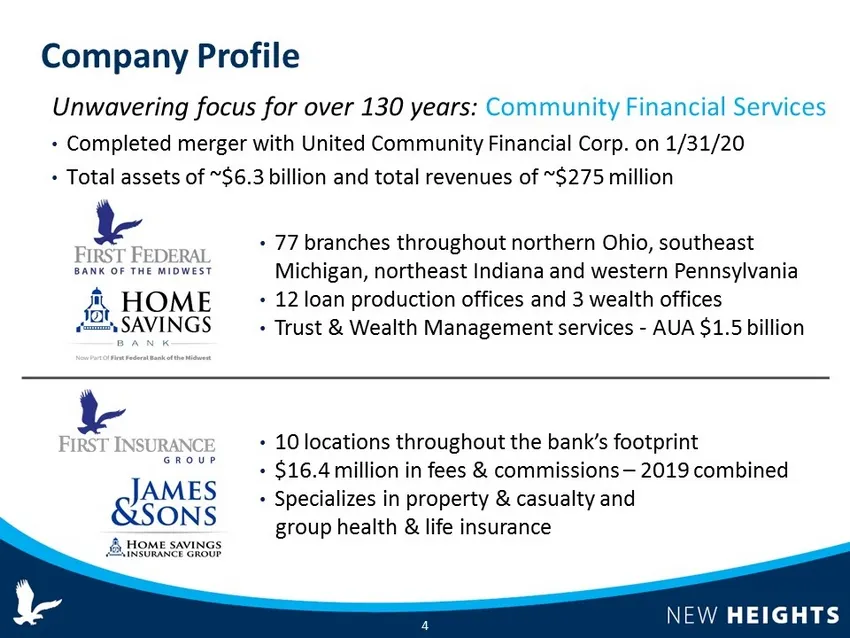
Slide 4: Company Profile
Company Profile Unwavering focus for over 130 years: Community Financial Services • Completed merger with United Community Financial Corp. on 1/31/20 • Total assets of ~$6.3 billion and total revenues of ~$275 million • 77 branches throughout northern Ohio, southeast Michigan, northeast Indiana and
Slide 5: Investment Highlights
Investment Highlights • Market leader across northern Ohio deeply rooted in the communities we have served since the 1890s • Growing presence in metro markets • Experienced, disciplined management team • Robust, diversified loan mix with a stable deposit base • Consistently strong net interest margi
Slide 6: Looking to the Future
6 • Expect continued strong loan volume production or mid - to - upper single digit growth rates for combined organization • Management focus on leadership transition, merger execution and building talent within the organization • E nhanced products, services and technology while honoring our commit
Slide 7: Strategic Focus
7 Strategic Focus • Profitability • High performance objectives for revenue growth, expense control and maintaining strong asset quality • Growth • Organic and through acquisitions, targeting newer markets, new relationships, enhanced delivery and products in more established markets • Shareholder V
Slide 8: Partnering to Create Significant Value
8 Partnering to Create Significant Value x Cultu r e, lea de r shi p & s t r a t egic f amilia rity x St r on g financial c omp a tibility…c r e d it, per f orma n ce, e xpenses x Pri or suc c es s fu l ac quisitio n c omple tion s and i n t eg r a t i o n e xp e rience s x Transformative partnershi
Slide 9: Executive Leadership
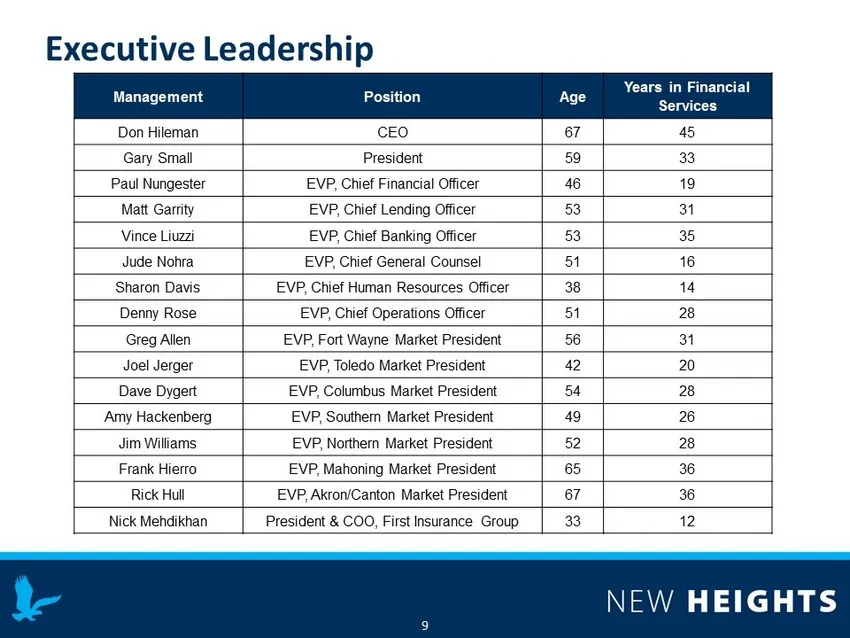
Executive Leadership Management Position Age Years in Financial Services Don Hileman CEO 67 45 Gary Small President 59 33 Paul Nungester EVP, Chief Financial Officer 46 19 Matt Garrity EVP, Chief Lending Officer 53 31 Vince Liuzzi EVP, Chief Banking Officer 53 35 Jude Nohra EVP, Chief General Counse
Slide 10: Ohio's Premier Community Bank
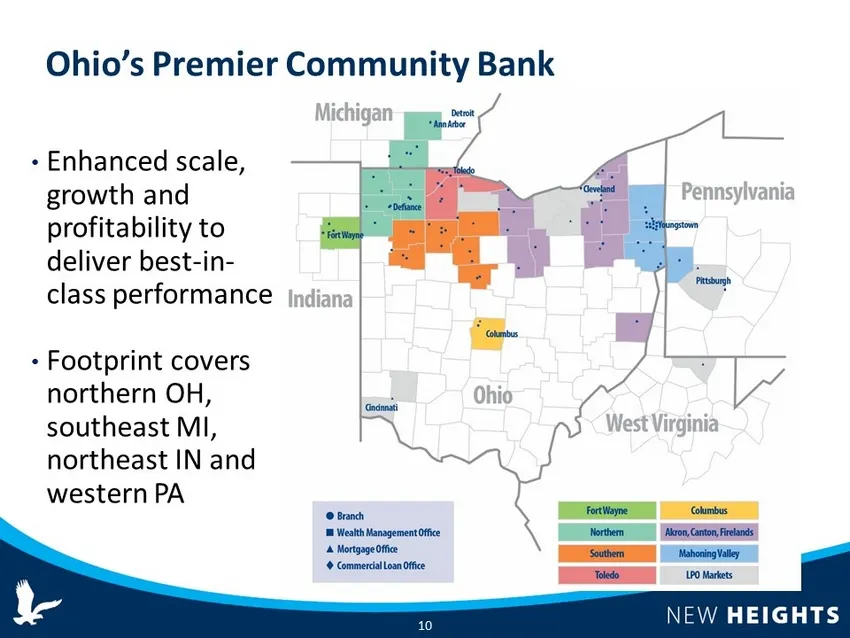
Ohio’s Premier Community Bank • Enhanced scale, growth and profitability to deliver best - in - class performance • Footprint covers northern OH, southeast MI, northeast IN and western PA 10
Slide 11: Consistent Profitability
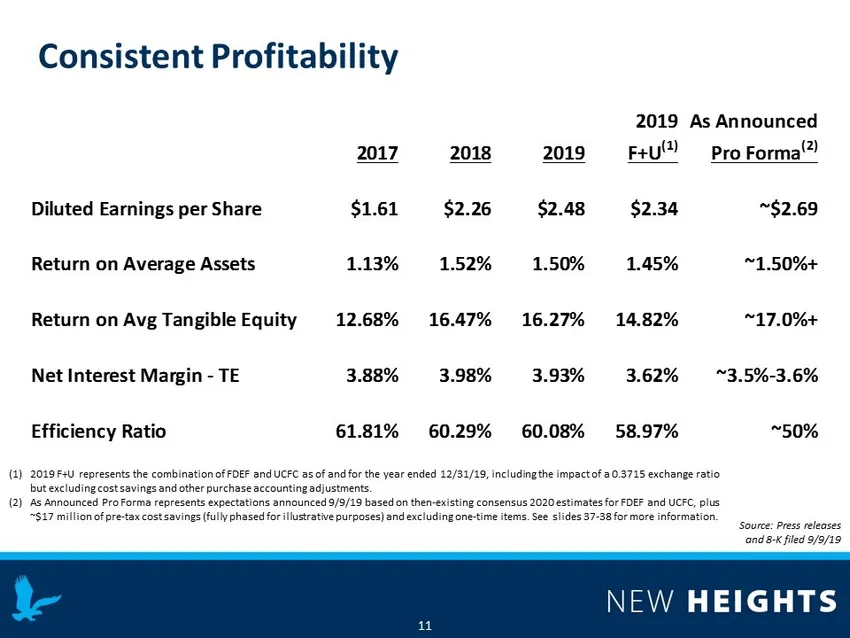
Consistent Profitability 11 Source : Press releases and 8 - K filed 9/9/19 2017 2018 2019 2019 F+U (1) As Announced Pro Forma (2) Diluted Earnings per Share $1.61 $2.26 $2.48 $2.34 ~$2.69 Return on Average Assets 1.13% 1.52% 1.50% 1.45% ~1.50%+ Return on Avg Tangible Equity 12.68% 16.47% 16.27% 14.8
Slide 12: 2018 Performance Recognition
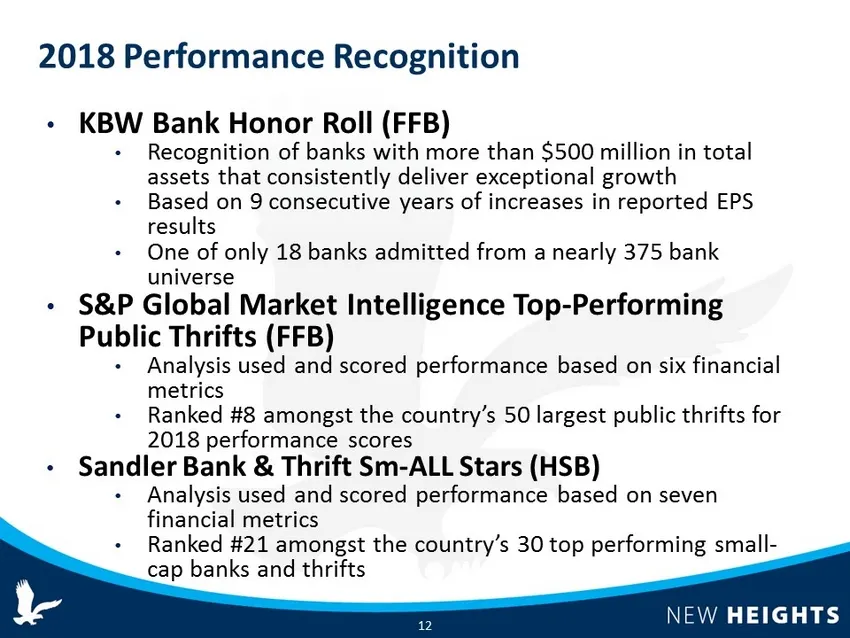
12 2018 Performance Recognition • KBW Bank Honor Roll (FFB) • Recognition of banks with more than $500 million in total assets that consistently deliver exceptional growth • Based on 9 consecutive years of increases in reported EPS results • One of only 18 banks admitted from a nearly 375 bank unive
Slide 13: Strong Sales & Service Delivery
• Demonstrating our core values in all interactions to create long - term, profitable relationships • Enhancing customer experience through technology advancements • Reaching more customers through digital channel development • Growing our communities through our people 13 Strong Sales & Service Del
Slide 14: Market Area Growth – Loans
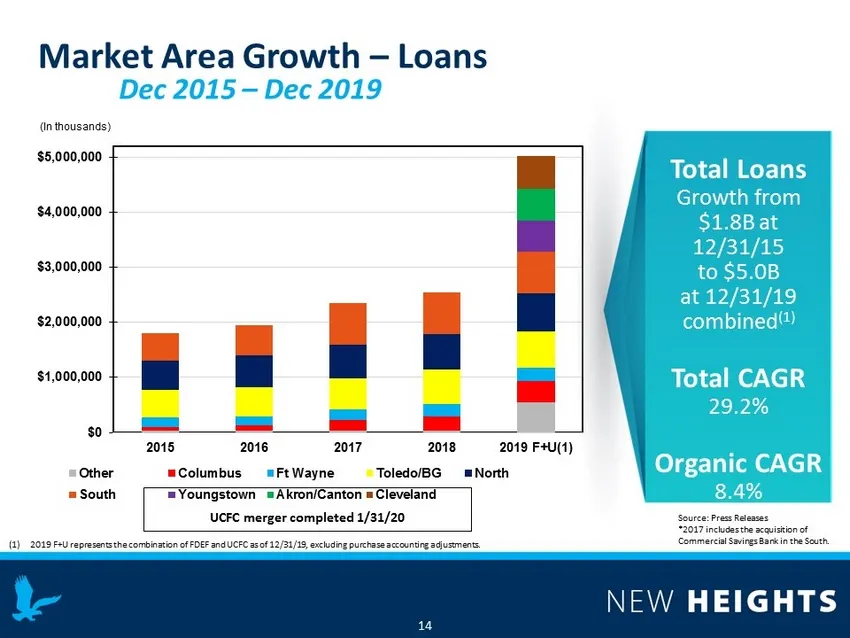
Dec 2015 – Dec 2019 14 Market Area Growth – Loans $0 $1,000,000 $2,000,000 $3,000,000 $4,000,000 $5,000,000 2015 2016 2017 2018 2019 F+U(1) Other Columbus Ft Wayne Toledo/BG North South Youngstown Akron/Canton Cleveland (In thousands) Source: Press Releases *2017 includes the acquisition of Commerci
Slide 15: Market Area Growth – Deposits
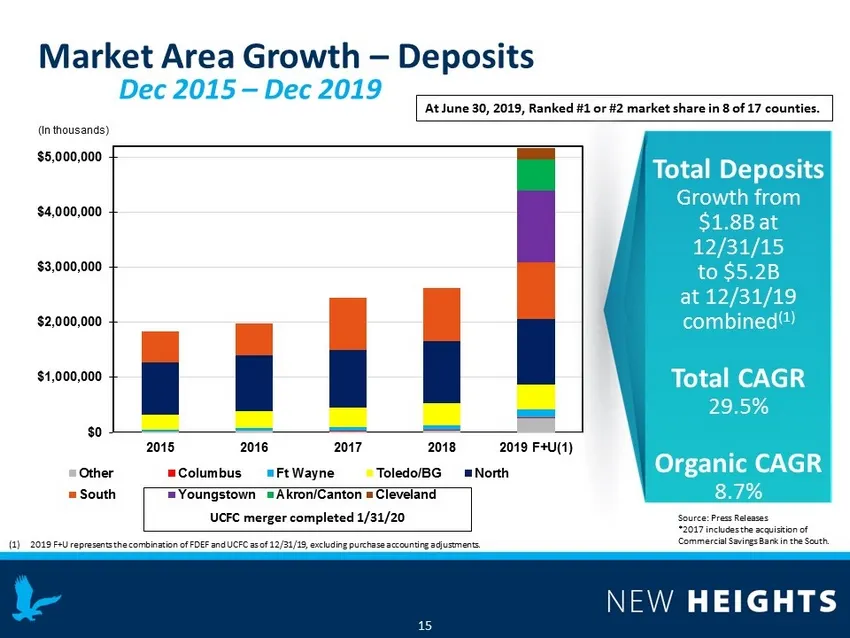
Dec 2015 – Dec 2019 15 Market Area Growth – Deposits (In thousands) At June 30, 2019, Ranked #1 or #2 market share in 8 of 17 counties. $0 $1,000,000 $2,000,000 $3,000,000 $4,000,000 $5,000,000 2015 2016 2017 2018 2019 F+U(1) Other Columbus Ft Wayne Toledo/BG North South Youngstown Akron/Canton Clev
Slide 16: Strong Shareholder Returns
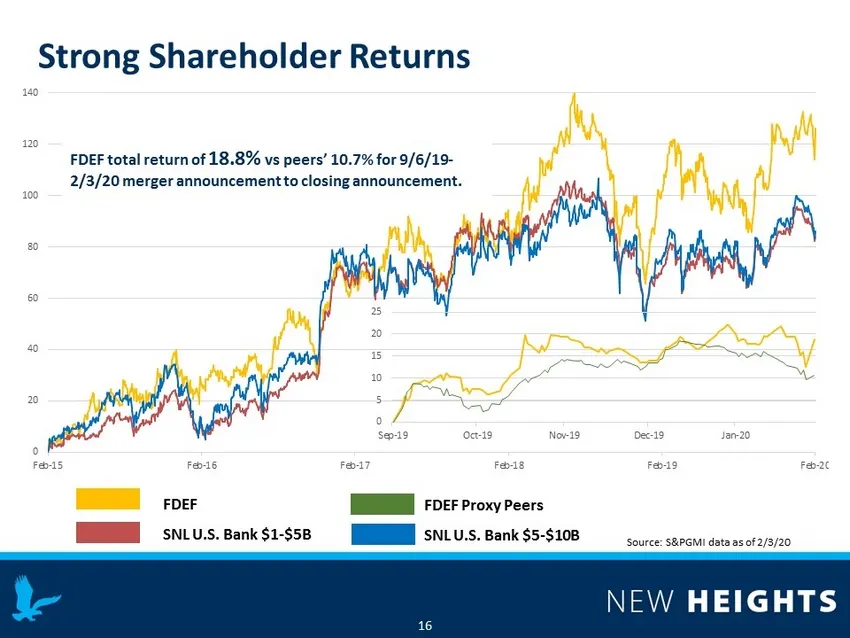
0 20 40 60 80 100 120 140 Feb-15 Feb-16 Feb-17 Feb-18 Feb-19 Feb-20 Source: S&PGMI data as of 2/3/20 16 Strong Shareholder Returns FDEF SNL U.S. Bank $1 - $5B FDEF Proxy Peers SNL U.S. Bank $5 - $10B FDEF total return of 18.8% vs peers’ 10.7% for 9/6/19 - 2/3/20 merger announcement to closing announ
Slide 17: Financial Highlights
Financial Highlights FIRST DEFIANCE FINANCIAL CORR Better tagether. NEW HEIGHTS
Slide 18: Net Income & Earnings Per Share
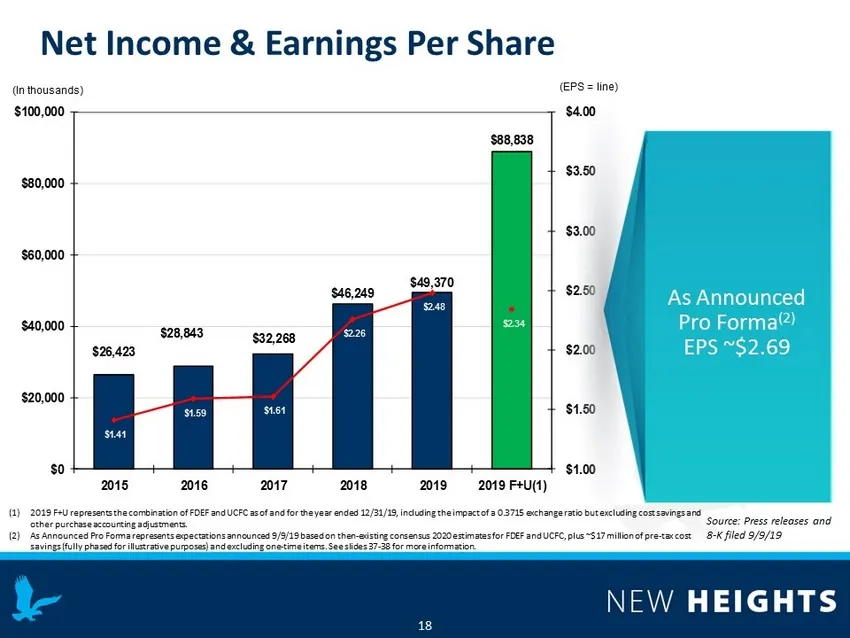
18 Net Income & Earnings Per Share Source : Press releases and 8 - K filed 9/9/19 $26,423 $28,843 $32,268 $46,249 $49,370 $88,838 $1.41 $1.59 $1.61 $2.26 $2.48 $2.34 $1.00 $1.50 $2.00 $2.50 $3.00 $3.50 $4.00 $0 $20,000 $40,000 $60,000 $80,000 $100,000 2015 2016 2017 2018 2019 2019 F+U(1) As Announce
Slide 19: Total Assets & Return on Assets
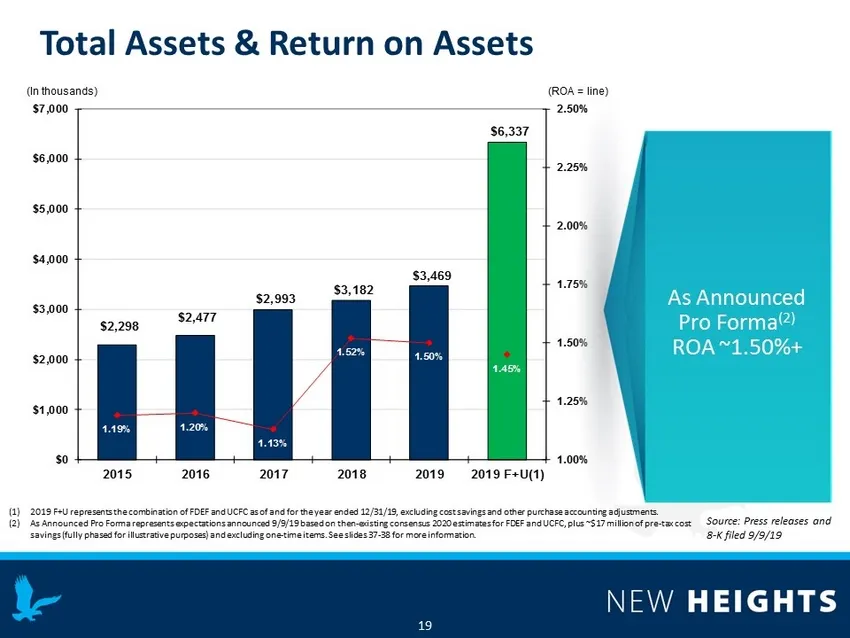
19 $2,298 $2,477 $2,993 $3,182 $3,469 $6,337 1.19% 1.20% 1.13% 1.52% 1.50% 1.45% 1.00% 1.25% 1.50% 1.75% 2.00% 2.25% 2.50% $0 $1,000 $2,000 $3,000 $4,000 $5,000 $6,000 $7,000 2015 2016 2017 2018 2019 2019 F+U(1) Total Assets & Return on Assets As Announced Pro Forma (2) ROA ~1.50%+ Source : Press re
Slide 20: Loan Portfolio Composition
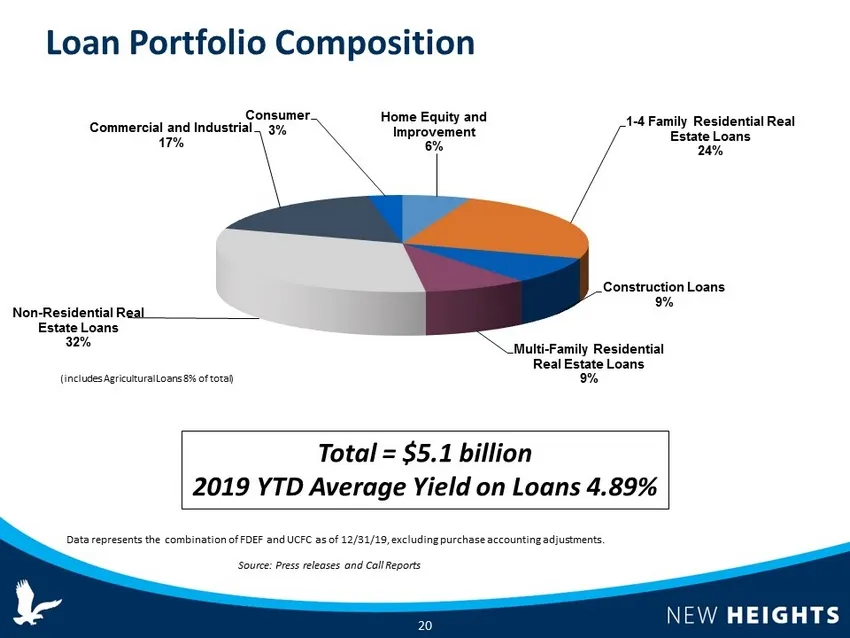
20 Loan Portfolio Composition Home Equity and Improvement 6% 1 - 4 Family Residential Real Estate Loans 24% Construction Loans 9% Multi - Family Residential Real Estate Loans 9% Non - Residential Real Estate Loans 32% Commercial and Industrial 17% Consumer 3% (includes Agricultural Loans 8% of total
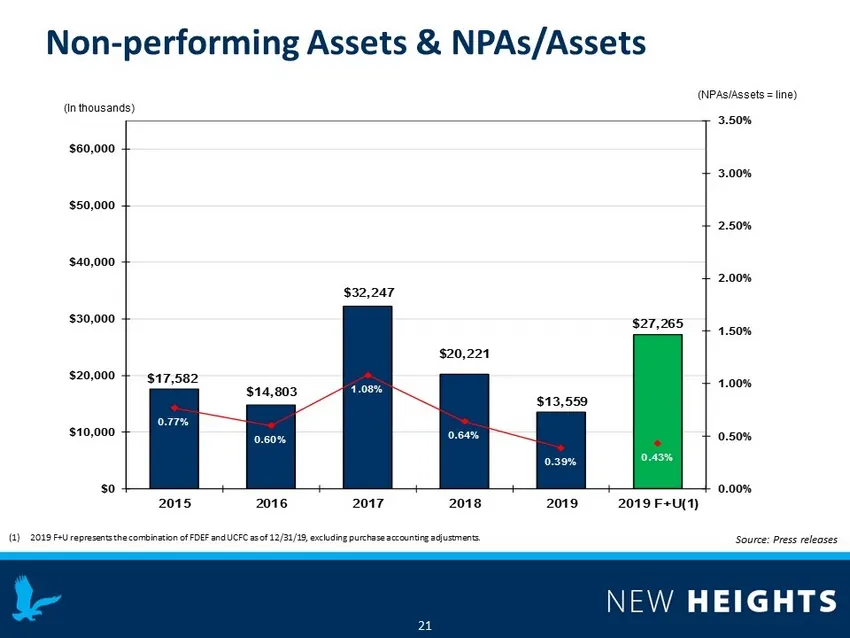
Slide 21: Non-performing Assets & NPAs/Assets
$17,582 $14,803 $32,247 $20,221 $13,559 $27,265 0.77% 0.60% 1.08% 0.64% 0.39% 0.43% 0.00% 0.50% 1.00% 1.50% 2.00% 2.50% 3.00% 3.50% $0 $10,000 $20,000 $30,000 $40,000 $50,000 $60,000 2015 2016 2017 2018 2019 2019 F+U(1) 21 Non - performing Assets & NPAs/Assets Source : Press releases (In thousands)
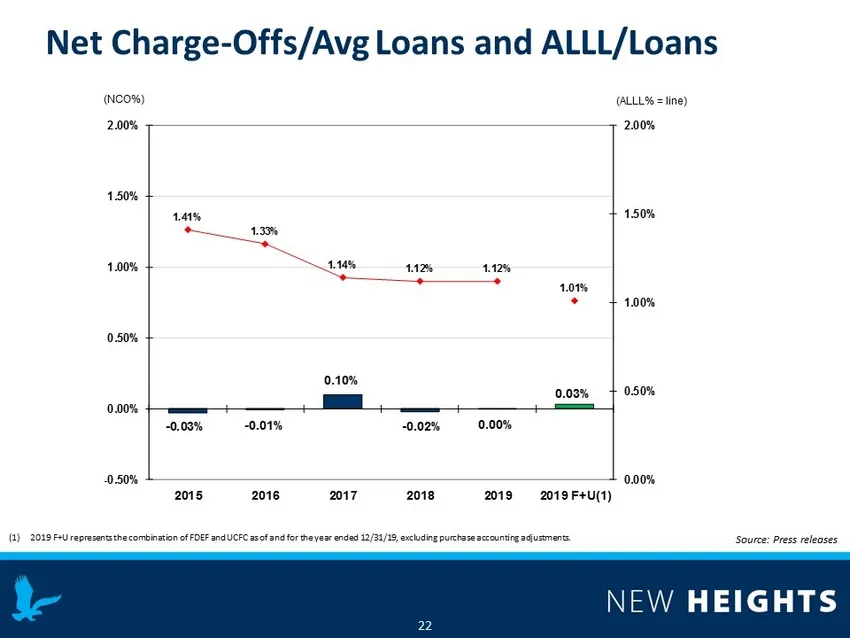
Slide 22: Net Charge-Offs/Avg Loans and ALLL/Loans
22 Net Charge - Offs/ Avg Loans and ALLL/Loans Source : Press releases - 0.03% - 0.01% 0.10% - 0.02% 0.00% 0.03% 1.41% 1.33% 1.14% 1.12% 1.12% 1.01% 0.00% 0.50% 1.00% 1.50% 2.00% -0.50% 0.00% 0.50% 1.00% 1.50% 2.00% 2015 2016 2017 2018 2019 2019 F+U(1) (ALLL% = line) (NCO%) (1) 2019 F+U represents t
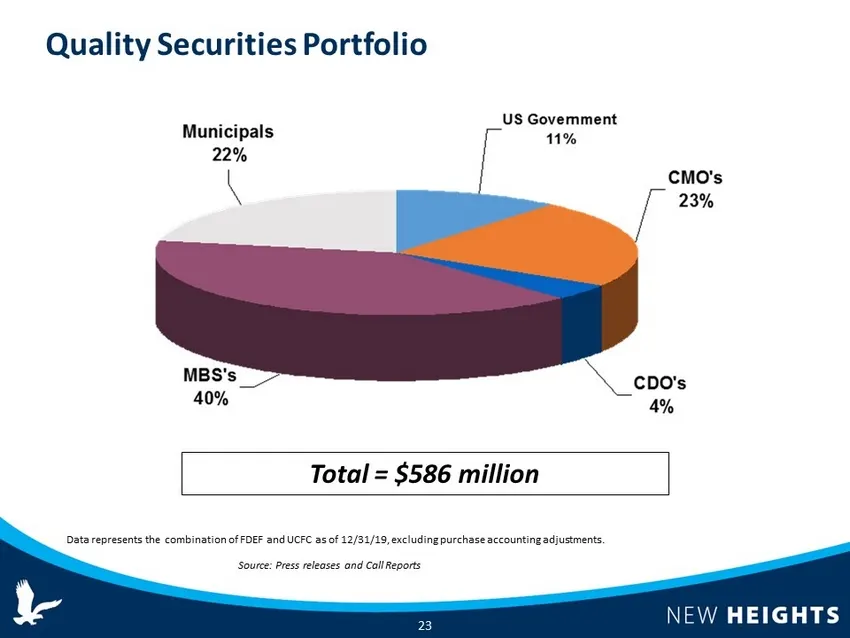
Slide 23: Quality Securities Portfolio
Quality Securities Portfolio US Government 11% CMO's 23% CDO's 4% MBS's 40% Municipals 22% 23 Total = $586 million Data represents the combination of FDEF and UCFC as of 12/31/19 , excluding purchase accounting adjustments. Source: Press releases and Call Reports
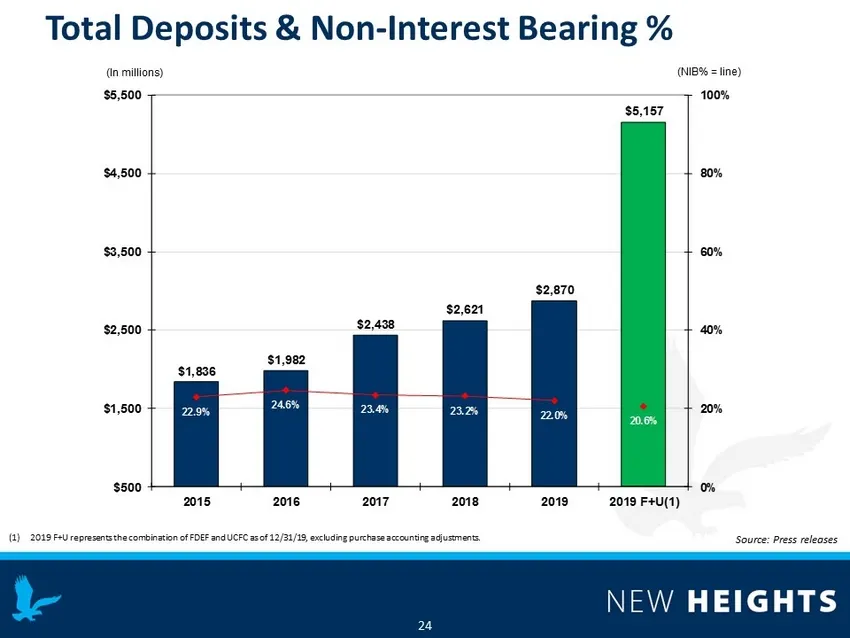
Slide 24: Total Deposits & Non-Interest Bearing %
Total Deposits & Non - Interest Bearing % (In millions) $1,836 $1,982 $2,438 $2,621 $2,870 $5,157 22.9% 24.6% 23.4% 23.2% 22.0% 20.6% 0% 20% 40% 60% 80% 100% $500 $1,500 $2,500 $3,500 $4,500 $5,500 2015 2016 2017 2018 2019 2019 F+U(1) 24 Source : Press releases (NIB% = line) (1) 2019 F+U represents
Slide 25: Deposit Base Composition
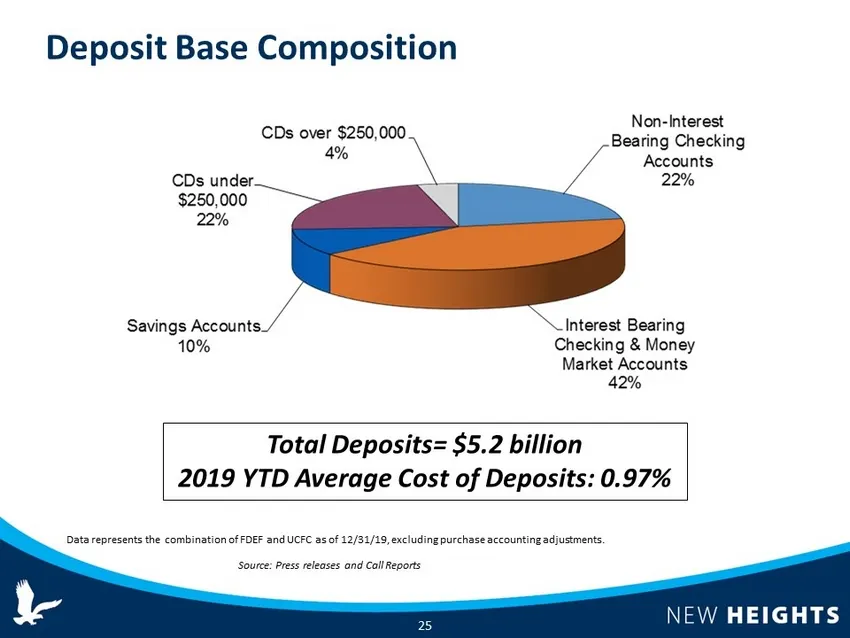
Non - Interest Bearing Checking Accounts 22% Interest Bearing Checking & Money Market Accounts 42% Savings Accounts 10% CDs under $250,000 22% CDs over $250,000 4% Deposit Base Composition 25 Total Deposits= $5.2 billion 2019 YTD Average Cost of Deposits: 0.97% Data represents the combination of FDE
Slide 26: Capital Levels
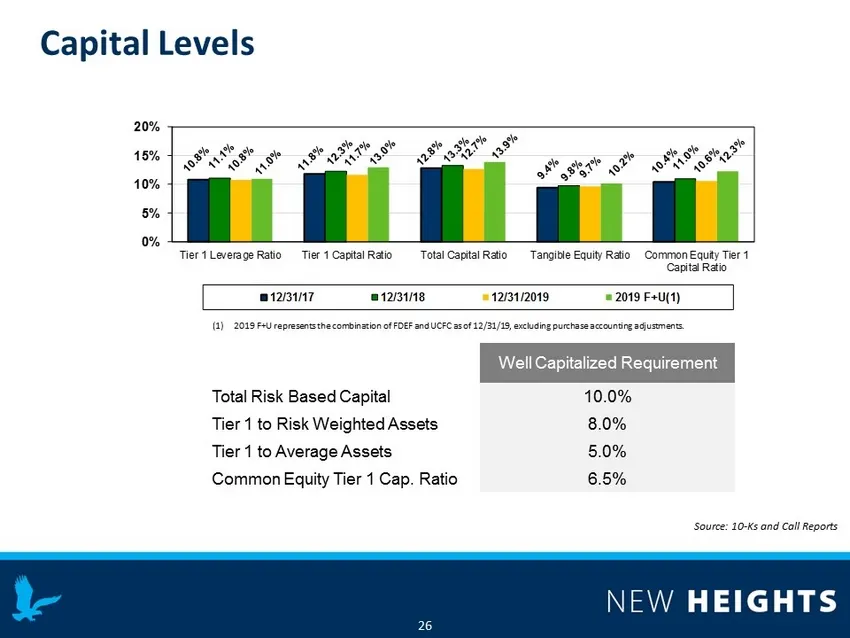
Source : 10 - Ks and Call Reports 26 Capital Levels 0% 5% 10% 15% 20% Tier 1 Leverage Ratio Tier 1 Capital Ratio Total Capital Ratio Tangible Equity Ratio Common Equity Tier 1 Capital Ratio 12/31/17 12/31/18 12/31/2019 2019 F+U(1) Well Capitalized Requirement Total Risk Based Capital 10.0% Tier 1 to
Slide 27: Net Interest Income & Margin
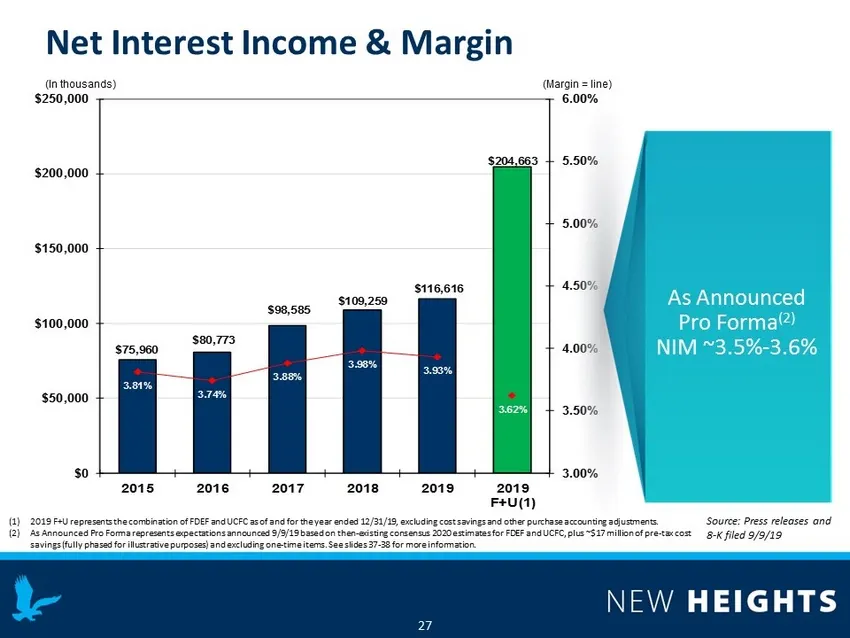
27 Net Interest Income & Margin $75,960 $80,773 $98,585 $109,259 $116,616 $204,663 3.81% 3.74% 3.88% 3.98% 3.93% 3.62% 3.00% 3.50% 4.00% 4.50% 5.00% 5.50% 6.00% $0 $50,000 $100,000 $150,000 $200,000 $250,000 2015 2016 2017 2018 2019 2019 F+U(1) Source : Press releases and 8 - K filed 9/9/19 As Annou
Slide 28: PTPP Income & ROA
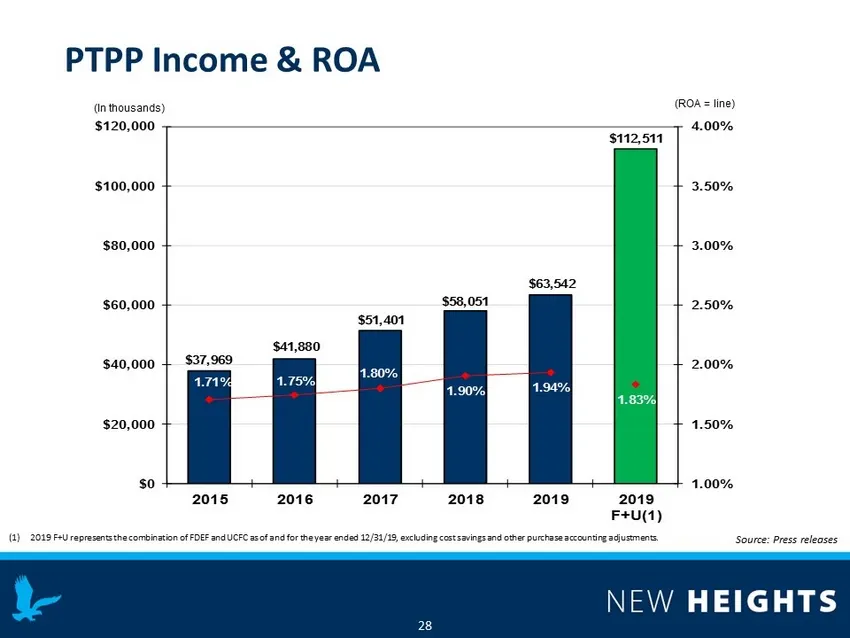
28 Source : Press releases $37,969 $41,880 $51,401 $58,051 $63,542 $112,511 1.71% 1.75% 1.80% 1.90% 1.94% 1.83% 1.00% 1.50% 2.00% 2.50% 3.00% 3.50% 4.00% $0 $20,000 $40,000 $60,000 $80,000 $100,000 $120,000 2015 2016 2017 2018 2019 2019 F+U(1) PTPP Income & ROA (In thousands) (ROA = line) (1) 2019 F
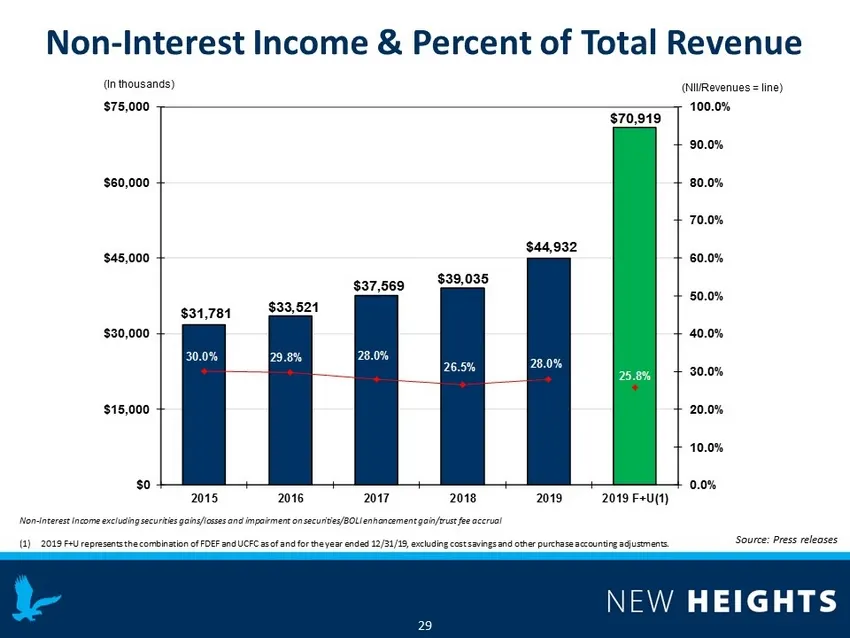
Slide 29: Non-Interest Income & Percent of Total Revenue
29 Non - Interest Income & Percent of Total Revenue Source : Press releases $31,781 $33,521 $37,569 $39,035 $44,932 $70,919 30.0% 29.8% 28.0% 26.5% 28.0% 25.8% 0.0% 10.0% 20.0% 30.0% 40.0% 50.0% 60.0% 70.0% 80.0% 90.0% 100.0% $0 $15,000 $30,000 $45,000 $60,000 $75,000 2015 2016 2017 2018 2019 2019 F
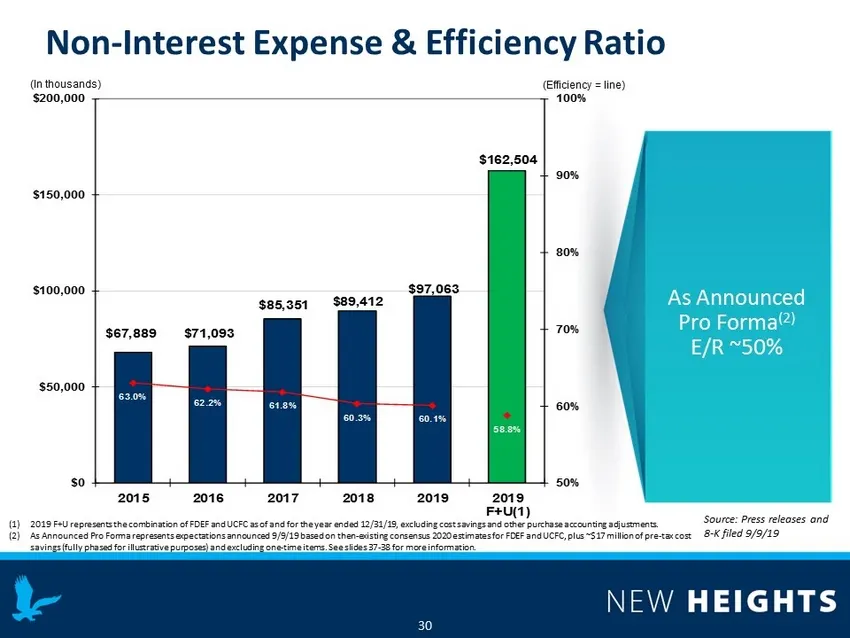
Slide 30: Non-Interest Expense & Efficiency Ratio
$67,889 $71,093 $85,351 $89,412 $97,063 $162,504 63.0% 62.2% 61.8% 60.3% 60.1% 58.8% 50% 60% 70% 80% 90% 100% $0 $50,000 $100,000 $150,000 $200,000 2015 2016 2017 2018 2019 2019 F+U(1) 30 Non - Interest Expense & Efficiency Ratio Source : Press releases and 8 - K filed 9/9/19 As Announced Pro Forma
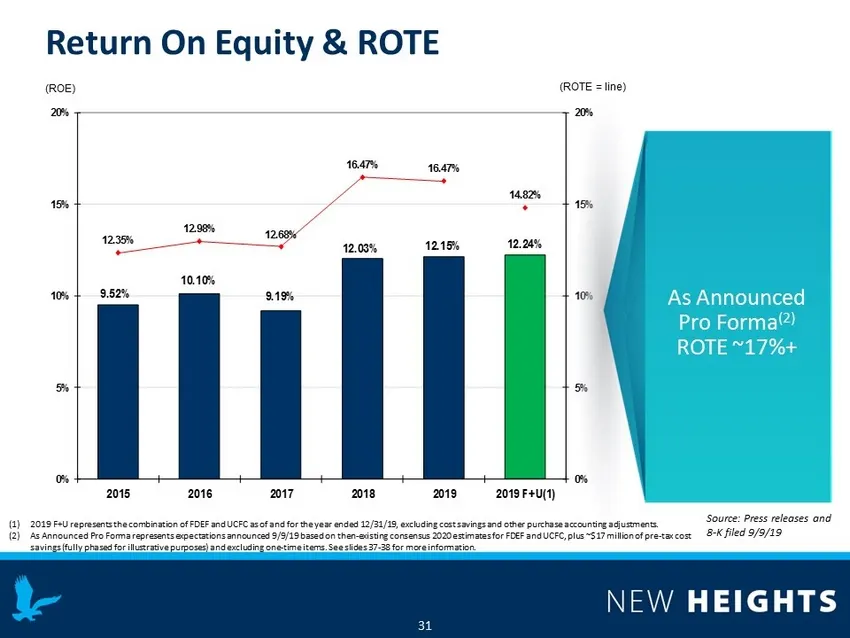
Slide 31: Return On Equity & ROTE
31 Return On Equity & ROTE 9.52% 10.10% 9.19% 12.03% 12.15% 12.24% 12.35% 12.98% 12.68% 16.47% 16.47% 14.82% 0% 5% 10% 15% 20% 0% 5% 10% 15% 20% 2015 2016 2017 2018 2019 2019 F+U(1) Source : Press releases and 8 - K filed 9/9/19 As Announced Pro Forma (2) ROTE ~17%+ (ROTE = line) (ROE) (1) 2019 F+U
Slide 32: Shareholder Value
Shareholder Value FIRST DEFIANCE FINANCIAL CORR Better tagether. NEW HEIGHTS
Slide 33: Maximizing Shareholder Value: EPS, Dividends and Stock Price
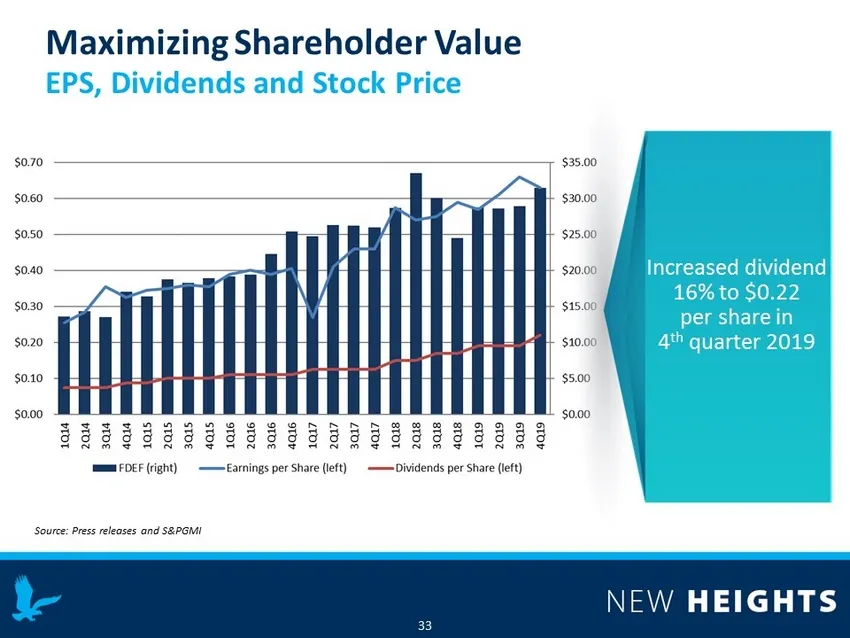
33 Maximizing Shareholder Value EPS, Dividends and Stock Price Source : Press releases and S&PGMI Increased dividend 16% to $0.22 per share in 4 th quarter 2019
Slide 34: Maximizing Shareholder Value
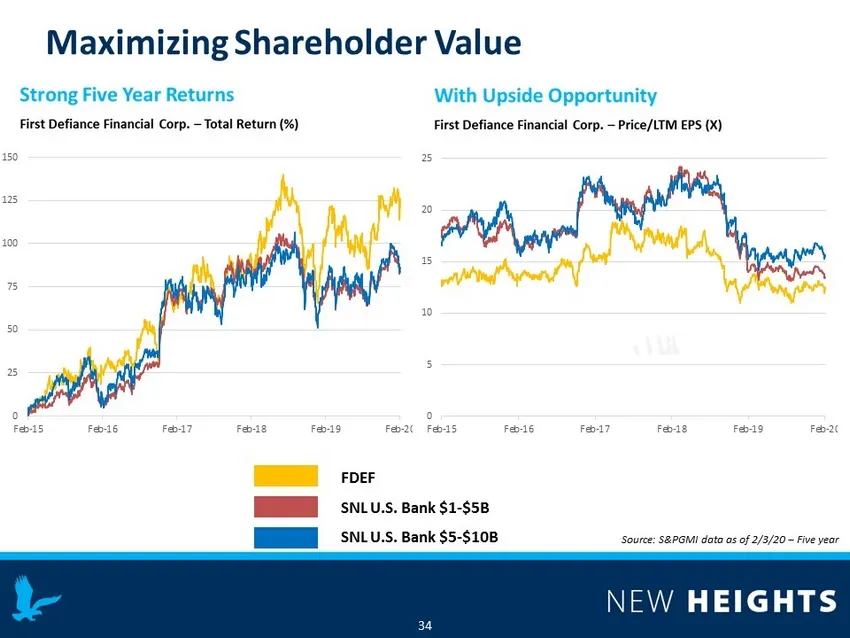
34 Maximizing Shareholder Value Source : S&PGMI data as of 2/3/20 – Five year FDEF SNL U.S. Bank $1 - $5B SNL U.S. Bank $5 - $10B 0 5 10 15 20 25 Feb-15 Feb-16 Feb-17 Feb-18 Feb-19 Feb-20 0 25 50 75 100 125 150 Feb-15 Feb-16 Feb-17 Feb-18 Feb-19 Feb-20
Slide 35: Maximizing Shareholder Value: Investment Opportunity
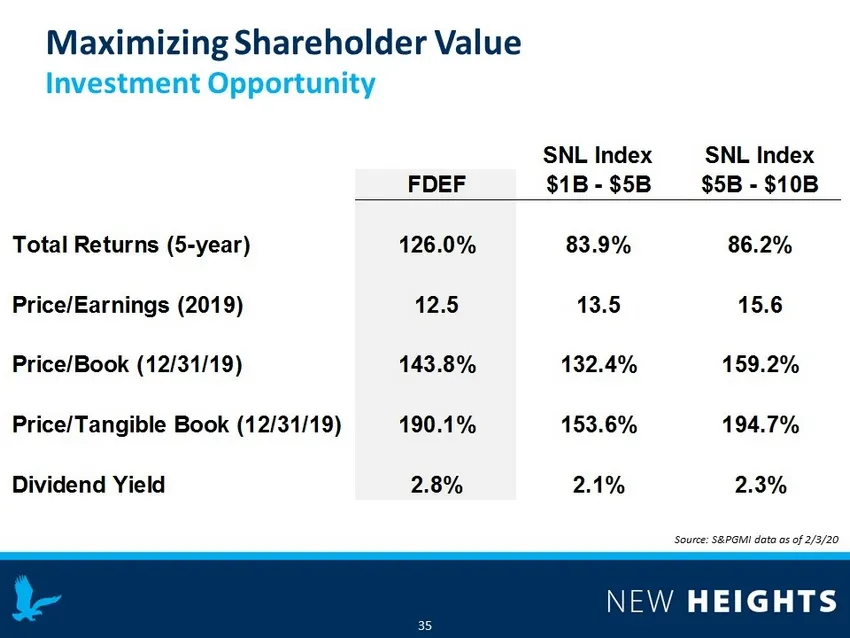
35 Source : S&PGMI data as of 2/3/20 Maximizing Shareholder Value Investment Opportunity SNL Index SNL Index FDEF $1B - $5B $5B - $10B Total Returns (5-year) 126.0% 83.9% 86.2% Price/Earnings (2019) 12.5 13.5 15.6 Price/Book (12/31/19) 143.8% 132.4% 159.2% Price/Tangible Book (12/31/19) 190.1% 153.6
Slide 36: Summary
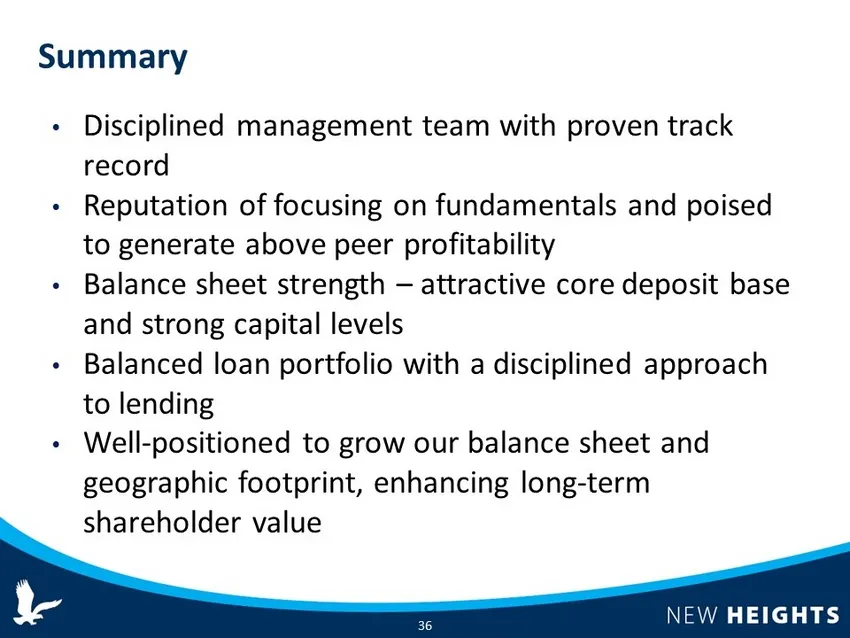
36 • Disciplined management team with proven track record • Reputation of focusing on fundamentals and poised to generate above peer profitability • Balance sheet strength – attractive core deposit base and strong capital levels • Balanced loan portfolio with a disciplined approach to lending • Well
Slide 37: Key Merger Assumptions As Announced 9/9/19
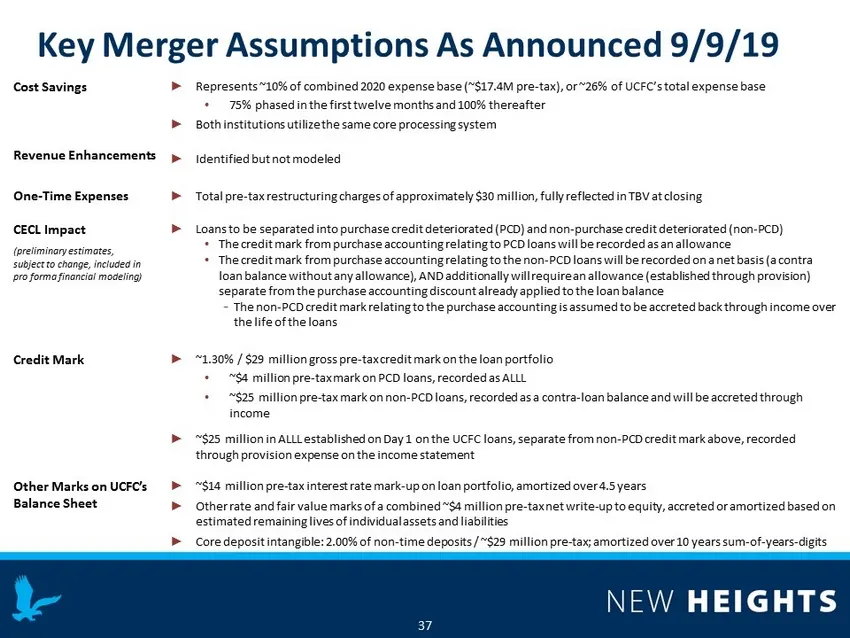
37 Cost Savings ► Represents ~10% of combined 2020 expense base (~$17.4M pre - tax), or ~26% of UCFC’s total expense base • 75% phased in the first twelve months and 100% thereafter ► Both institutions utilize the same core processing system One - Time Expenses ► Total pre - tax restructuring charge
Slide 38: Pro Forma Merger Notes
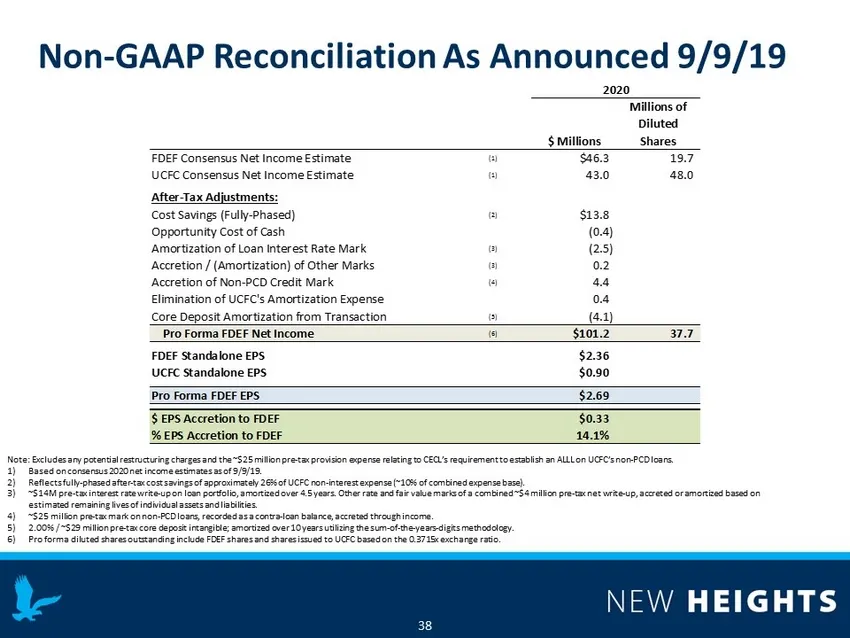
38 Note: Excludes any potential restructuring charges and the ~$25 million pre - tax provision expense relating to CECL’s requirement to establish an ALLL on UCFC’s non - PCD loans. 1) Based on consensus 2020 net income estimates as of 9/9/19. 2) Reflects fully - phased after - tax cost savings of a
Slide 39: Thank you
39 Thank you. Donald P. Hileman | CEO 419 - 785 - 2210 | dhileman@first - fed.com Gary M. Small | President 330 - 742 - 0655 | gsmall@first - fed.com Paul D. Nungester | EVP & CFO 419 - 785 - 8700 | pnungester@first - fed.com

Slide 40: First Defiance contact addresses
a FIRST DEFIANCE FINANCIAL CORR First Defiance Financial Corp. 601 Clinton Street Defiance, OH 43512 419-782-5104 Faefcom a FIRST FEDERAL BANK First Federal Bank of the Midwest 275 West Federal Street Youngstown, OH 44503 330-782-0500 Fist Fed.com tL FIRST INSURANCE GROUP First Insurance Group 511 F
Source: SEC EDGAR · 8-K filed Feb 13, 2020
More decks from Premier Financial Corp
 Investor Presentation (February 2025)51 slides · Feb 10, 2025
 Q4 2024 Earnings Presentation23 slides · Jan 22, 2025
 Q3 2024 Earnings Presentation50 slides · Nov 6, 2024
 Q3 2024 Earnings Presentation22 slides · Oct 23, 2024
 Investor Presentation (August 2024)54 slides · Aug 30, 2024
 Merger or Acquisition (July 2024)39 slides · Jul 26, 2024