Premier Financial — Investor Presentation (February 2025)
51 slides from Premier Financial's investor presentation, Feb 10, 2025
Slide 1: Investor Presentation (Q1 2025)
Investor Presentation(Q1 2025)(WSBC financials as of the three months ended December 31, 2024) John Iannone Senior Vice President, Investor Relations 304-905-7021 ©2025 WesBanco, Inc. | All rights reserved
Slide 2: Forward-looking statements
Forward-looking statements in this report relating to WesBanco’s plans, strategies, objectives, expectations, intentions and adequacy of resources, are made pursuant to the safe harbor provisions of the Private Securities Litigation Reform Act of 1995. The information contained in this report should
Slide 3: Additional Information about the Acquisition and Where to Find It
In connection with the proposed Merger, the Company filed with the Securities and Exchange Commission (the “SEC”) a Registration Statement on Form S-4 which includes a joint proxy statement of Premier Financial and the Company and a prospectus of the Company with respect to shares of the Company’s c
Slide 4: Diversified business model with strong market presence
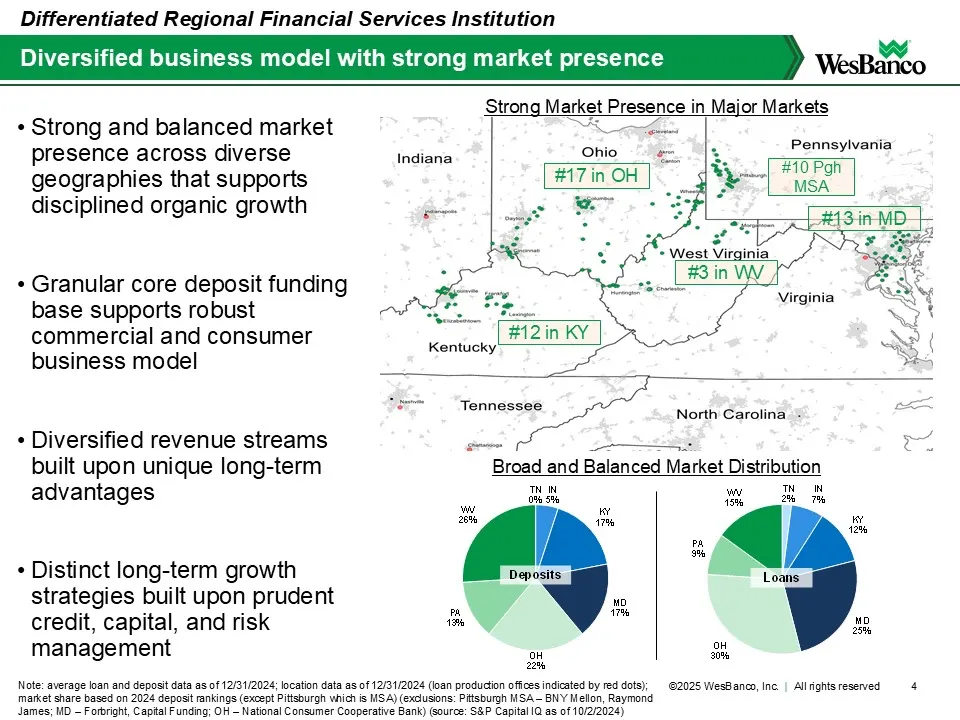
TN 2% IN 7% KY 12% MD 25% OH 30% PA 9% WV 15% Loans TN 0% IN 5% KY 17% MD 17% OH 22% PA 13% WV 26% Deposits • Strong and balanced market presence across diverse geographies that supports disciplined organic growth • Granular core deposit funding base supports robust commercial and consumer business
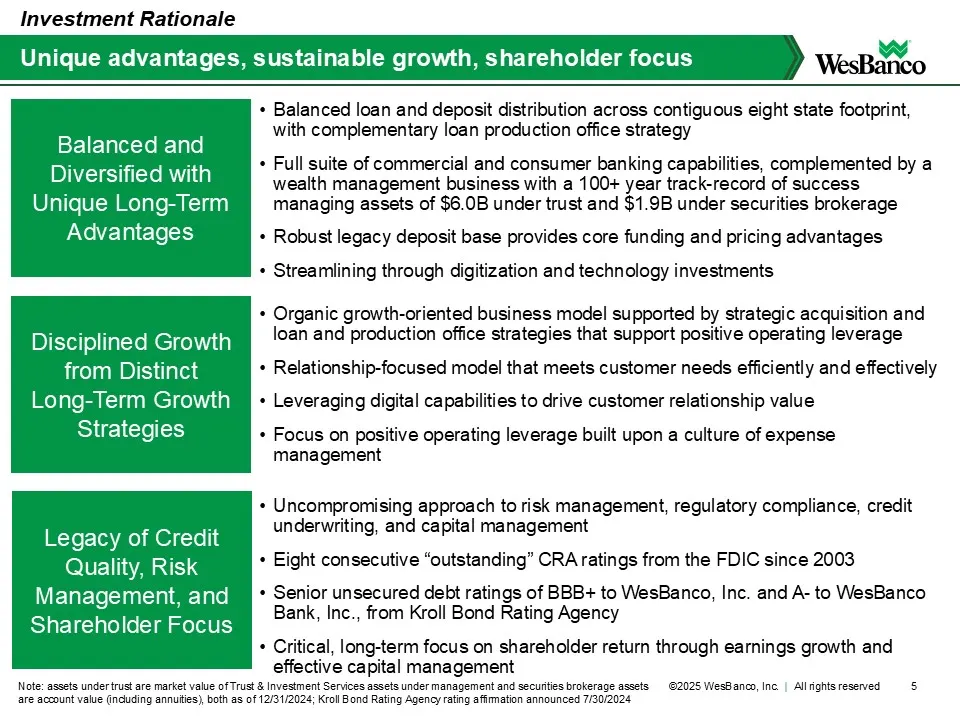
Slide 5: Unique advantages, sustainable growth, shareholder focus
• Balanced loan and deposit distribution across contiguous eight state footprint, with complementary loan production office strategy • Full suite of commercial and consumer banking capabilities, complemented by a wealth management business with a 100+ year track-record of success managing assets of
Slide 6: Strategies for Long-Term Success
Strategies for Long-Term Success ©2025 WesBanco, Inc. | All rights reserved
Slide 7: Long-Term Growth Strategies
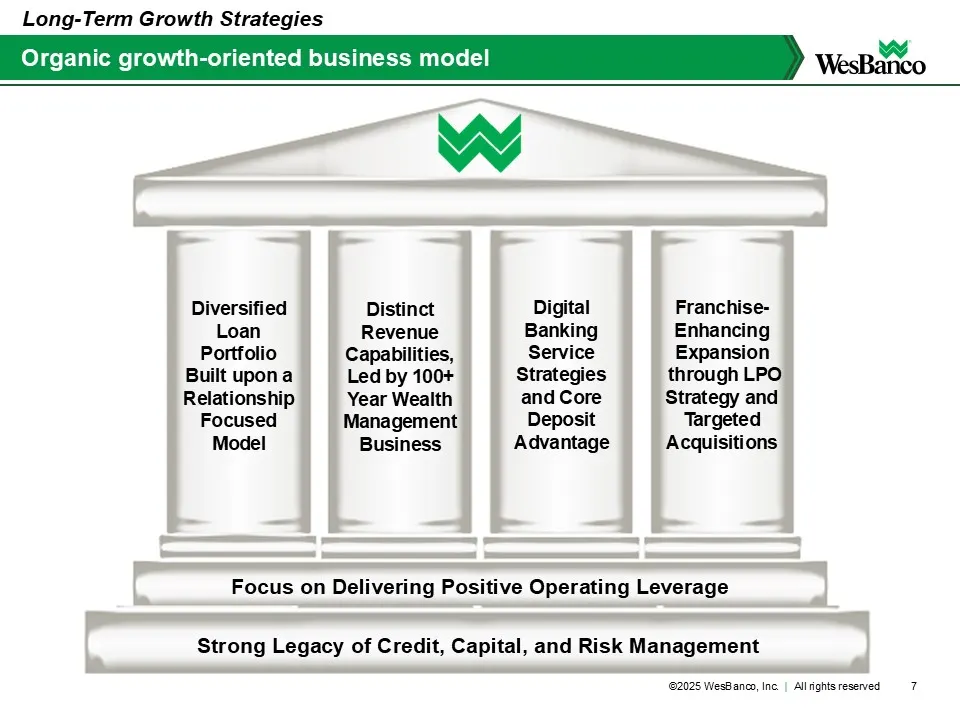
Organic growth-oriented business model Long-Term Growth Strategies Focus on Delivering Positive Operating Leverage Strong Legacy of Credit, Capital, and Risk Management Diversified Loan Portfolio Built upon a Relationship Focused Model Distinct Revenue Capabilities, Led by 100+ Year Wealth Managemen
Slide 8: Diversified loan portfolio
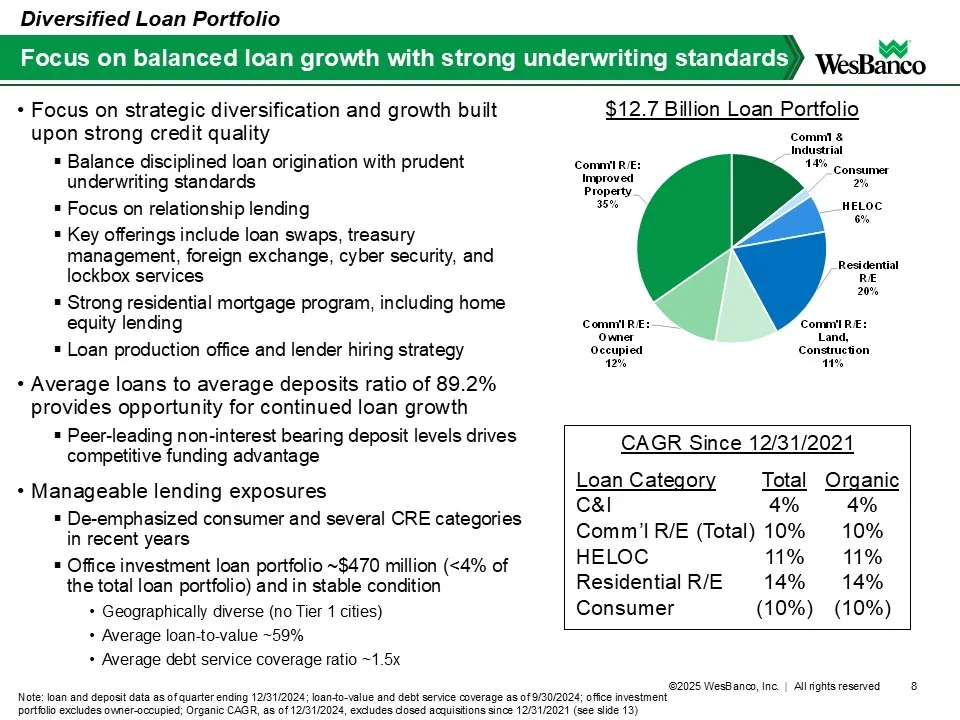
Comm'l & Industrial 14% Consumer 2% HELOC 6% Residential R/E 20% Comm'l R/E: Land, Construction 11% Comm'l R/E: Owner Occupied 12% Comm'l R/E: Improved Property 35% • Focus on strategic diversification and growth built upon strong credit quality ▪ Balance disciplined loan origination with prudent un
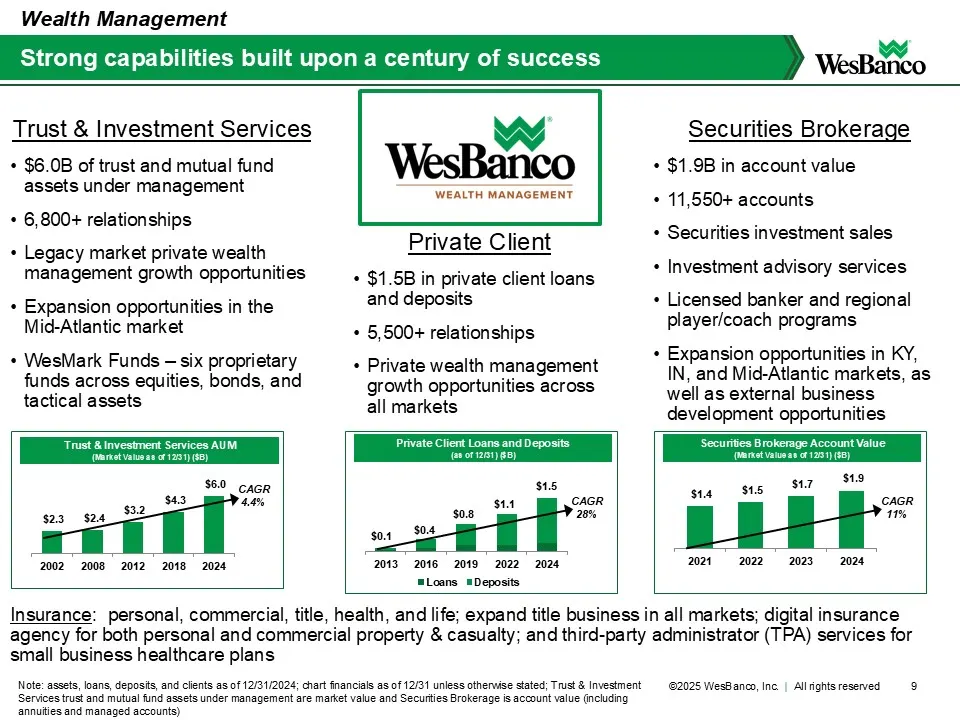
Slide 9: Strong capabilities built upon a century of success
Securities Brokerage • $1.9B in account value • 11,550+ accounts • Securities investment sales • Investment advisory services • Licensed banker and regional player/coach programs • Expansion opportunities in KY, IN, and Mid-Atlantic markets, as well as external business development opportunities Tru
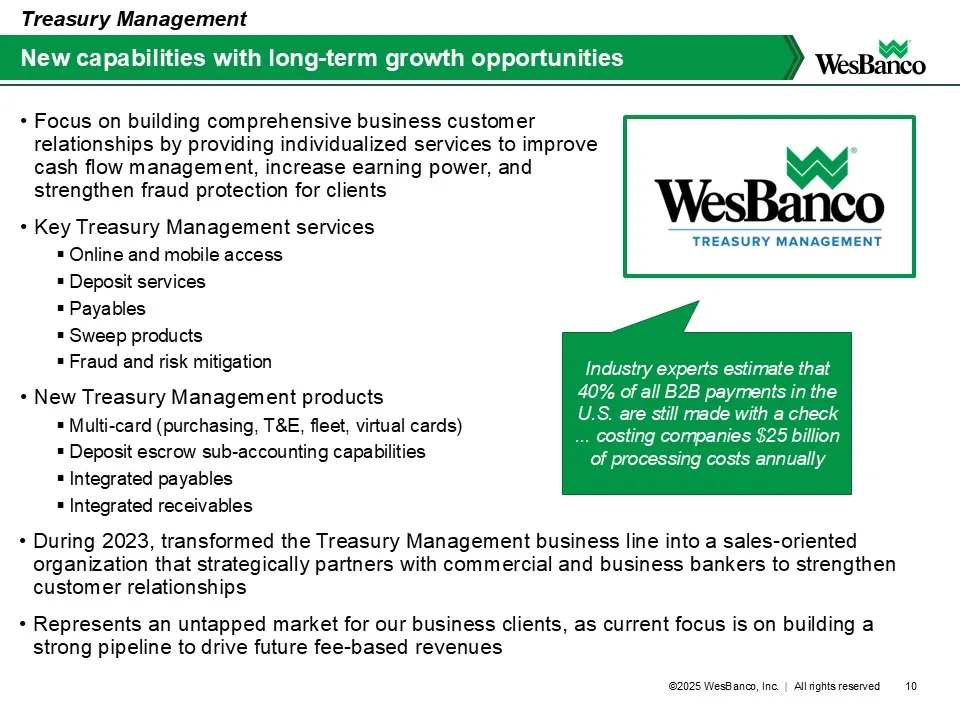
Slide 10: New capabilities with long-term growth opportunities
New capabilities with long-term growth opportunities Treasury Management • Focus on building comprehensive business customer relationships by providing individualized services to improve cash flow management, increase earning power, and strengthen fraud protection for clients • Key Treasury Manageme
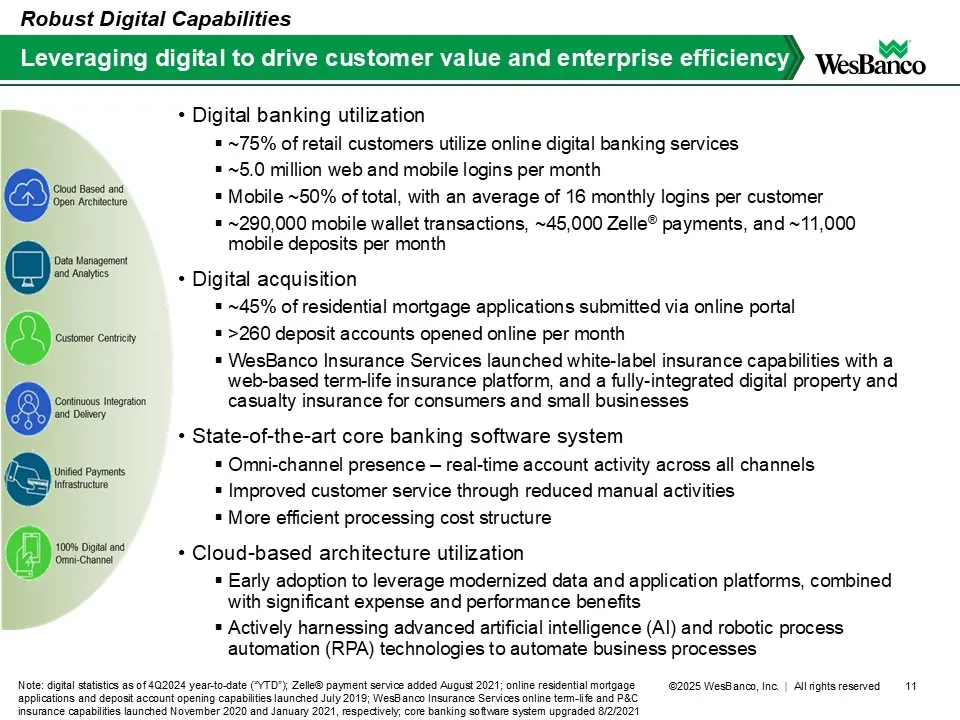
Slide 11: Digital banking service strategies
• Digital banking utilization ▪ ~75% of retail customers utilize online digital banking services ▪ ~5.0 million web and mobile logins per month ▪ Mobile ~50% of total, with an average of 16 monthly logins per customer ▪ ~290,000 mobile wallet transactions, ~45,000 Zelle® payments, and ~11,000 mobile
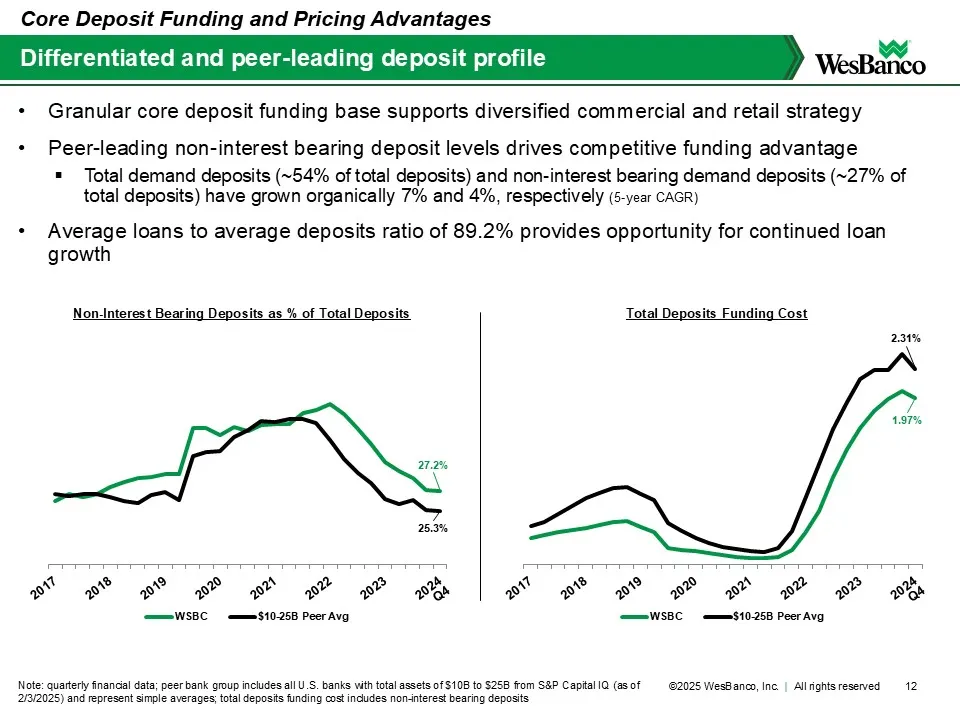
Slide 12: Differentiated and peer-leading deposit profile
Differentiated and peer-leading deposit profile Note: quarterly financial data; peer bank group includes all U.S. banks with total assets of $10B to $25B from S&P Capital IQ (as of 2/3/2025) and represent simple averages; total deposits funding cost includes non-interest bearing deposits Core Deposi
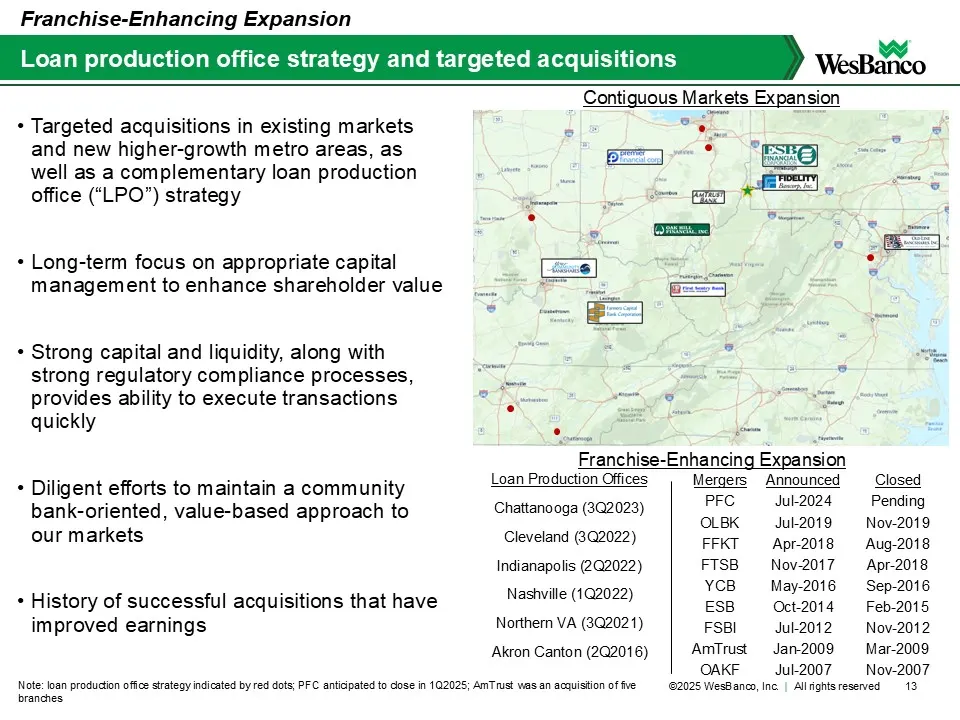
Slide 13: Franchise-Enhancing Expansion
Targeted acquisitions in existing markets and new higher-growth metro areas, as well as a complementary loan production office (“LPO”) strategy • Long-term focus on appropriate capital management to enhance shareholder value • Strong capital and liquidity, along with strong regulatory compliance pro
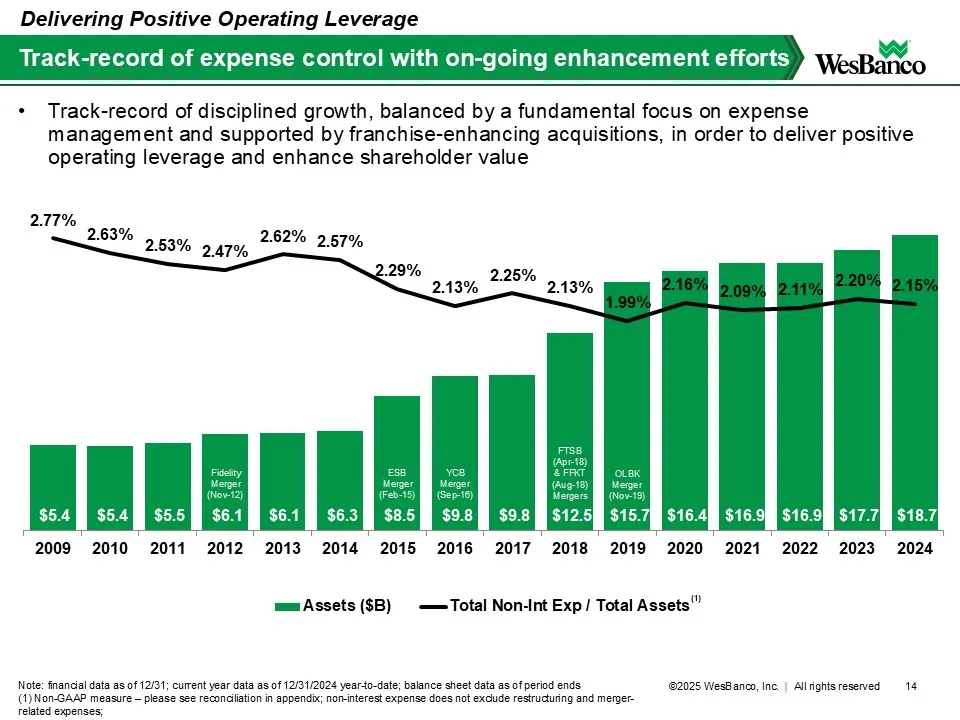
Slide 14: Track-record of expense control with on-going enhancement efforts
$5.4 $5.4 $5.5 $6.1 $6.1 $6.3 $8.5 $9.8 $9.8 $12.5 $15.7 $16.4 $16.9 $16.9 $17.7 $18.7 2.77% 2.63% 2.53% 2.47% 2.62% 2.57% 2.29% 2.13% 2.25% 2.13% 1.99% 2.16% 2.09% 2.11% 2.20% 2.15% $0.0 $1.0 $2.0 $3.0 $4.0 $5.0 $6.0 $7.0 $8.0 $9.0 $10.0 $11.0 $12.0 $13.0 $14.0 $15.0 $16.0 $17.0 $18.0 $19.0 $20.0 2
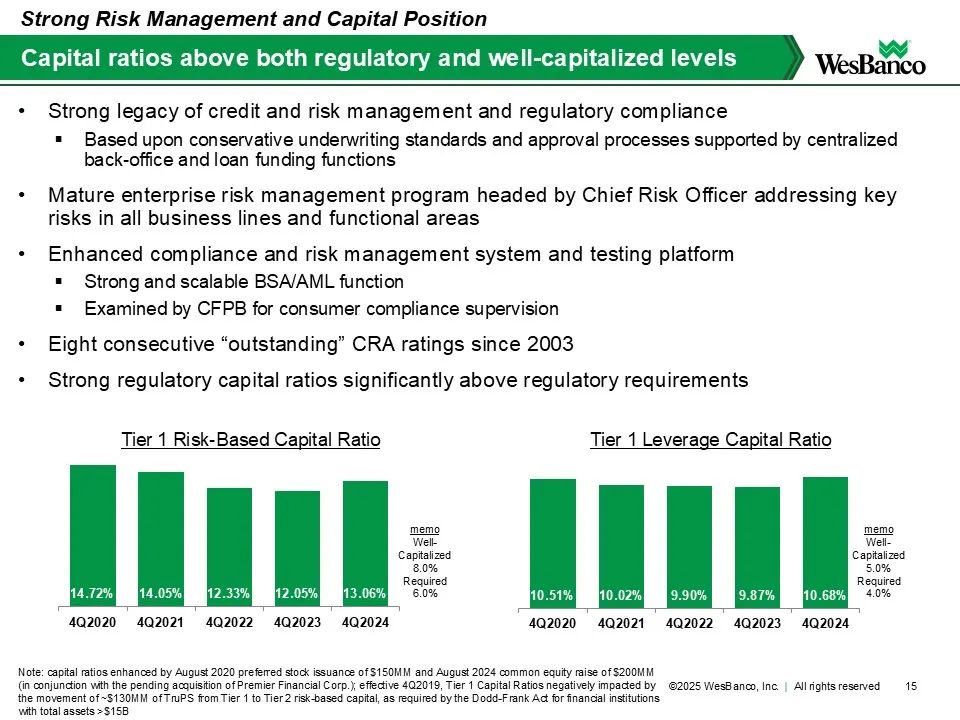
Slide 15: Capital ratios above both regulatory and well-capitalized levels
• Strong legacy of credit and risk management and regulatory compliance ▪ Based upon conservative underwriting standards and approval processes supported by centralized back-office and loan funding functions • Mature enterprise risk management program headed by Chief Risk Officer addressing key risk
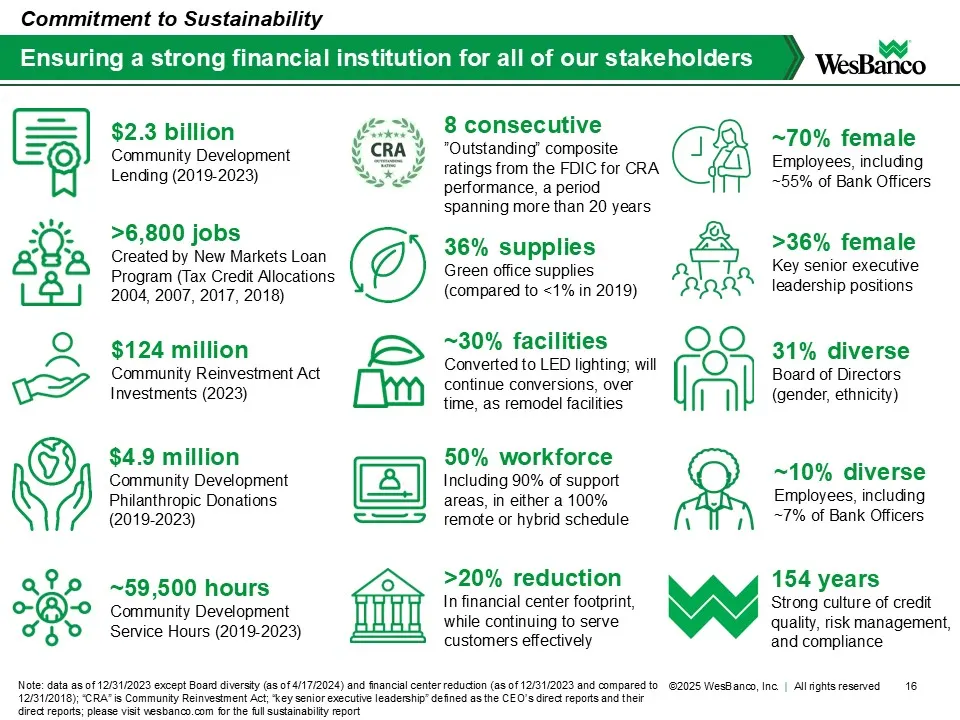
Slide 16: Commitment to Sustainability
16 Ensuring a strong financial institution for all of our stakeholders Note: data as of 12/31/2023 except Board diversity (as of 4/17/2024) and financial center reduction (as of 12/31/2023 and compared to 12/31/2018); “CRA” is Community Reinvestment Act; “key senior executive leadership” defined as
Slide 17: Awards and recognition
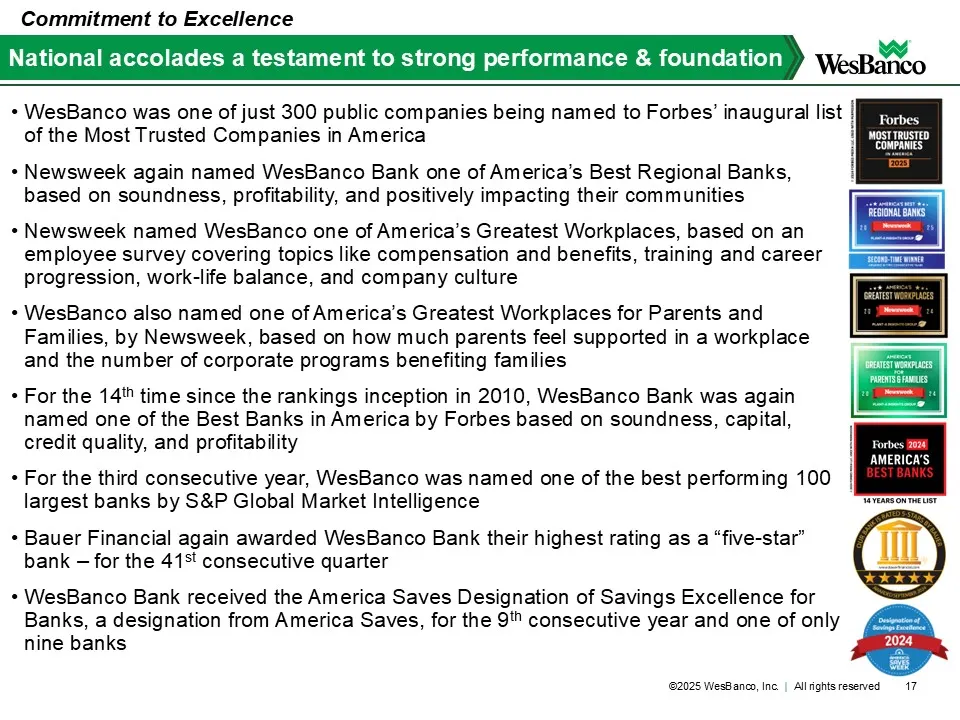
• WesBanco was one of just 300 public companies being named to Forbes’ inaugural list of the Most Trusted Companies in America • Newsweek again named WesBanco Bank one of America’s Best Regional Banks, based on soundness, profitability, and positively impacting their communities • Newsweek named Wes
Slide 18: Financial Overview
Financial Overview ©2025 WesBanco, Inc. | All rights reserved
Slide 19: Q4 2024 highlights
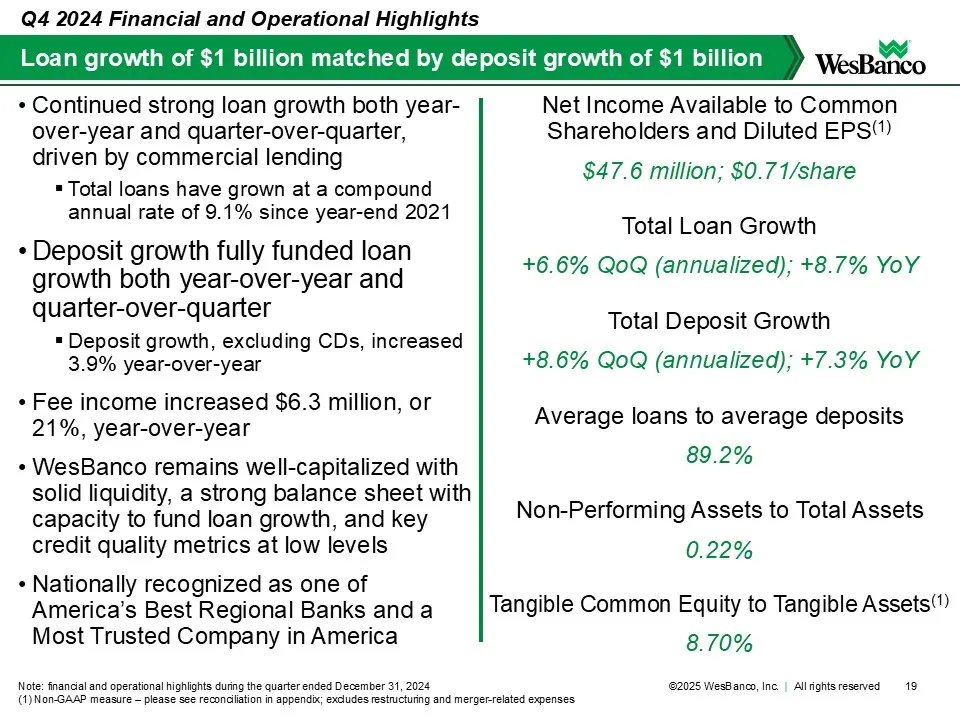
• Continued strong loan growth both year-over-year and quarter-over-quarter, driven by commercial lending ▪ Total loans have grown at a compound annual rate of 9.1% since year-end 2021 • Deposit growth fully funded loan growth both year-over-year and quarter-over-quarter ▪ Deposit growth, excluding
Slide 20: Loan growth
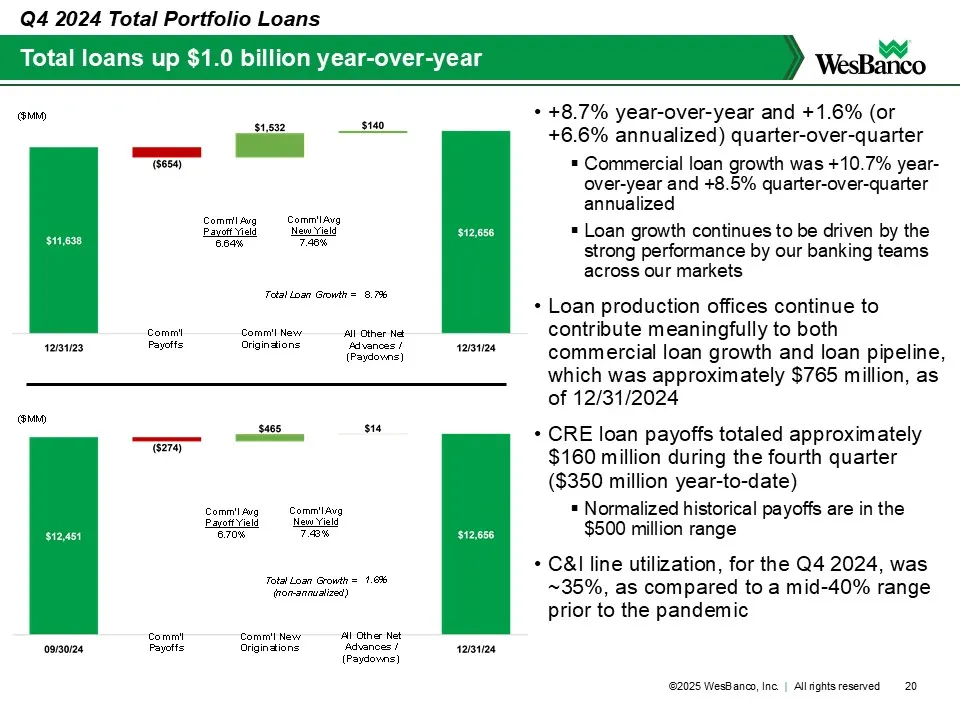
Comm'l Payoffs Comm'l New Originations All Other Net Advances / (Paydowns) Comm'l Avg Payoff Yield 6.64% Comm'l Avg New Yield 7.46% Total Loan Growth = 8.7% ($MM) Comm'l Payoffs Comm'l New Originations All Other Net Advances / (Paydowns) Total Loan Growth = (non-annualized) 1.6% Comm'l Avg Payoff Yi
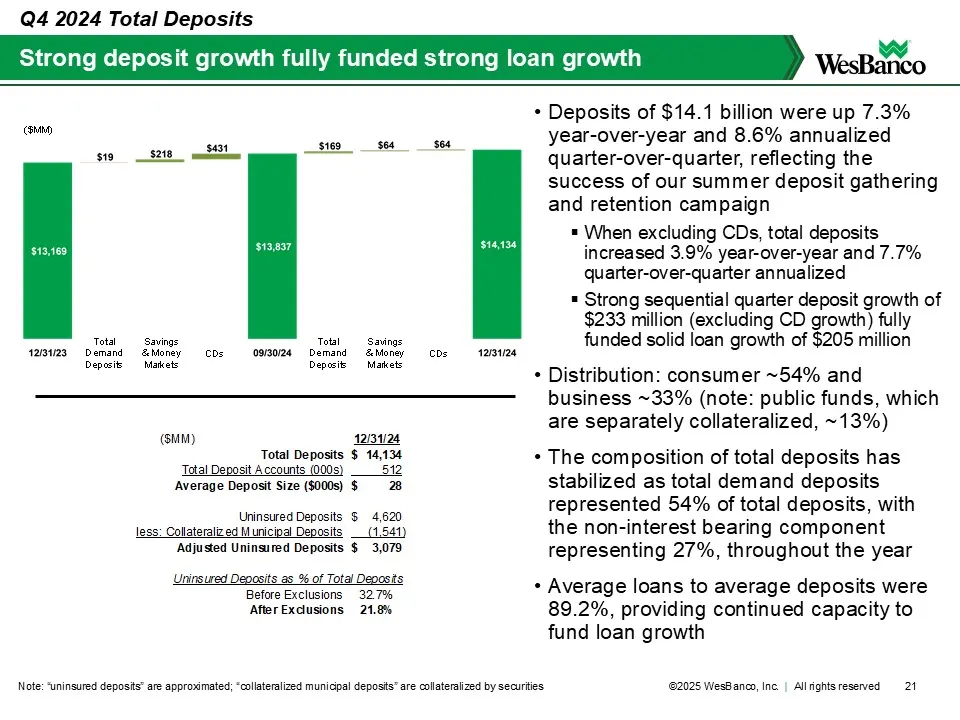
Slide 21: Strong deposit growth fully funded strong loan growth
($MM) 12/31/24 Total Deposits $ 1 4,134 Total Deposit Accounts (000s) 512 Average Deposit Size ($000s) $ 28 Uninsured Deposits $ 4 ,620 less: Collateralized Municipal Deposits (1,541) Adjusted Uninsured Deposits $ 3 ,079 Uninsured Deposits as % of Total Deposits Before Exclusions 32.7% After Exclusi
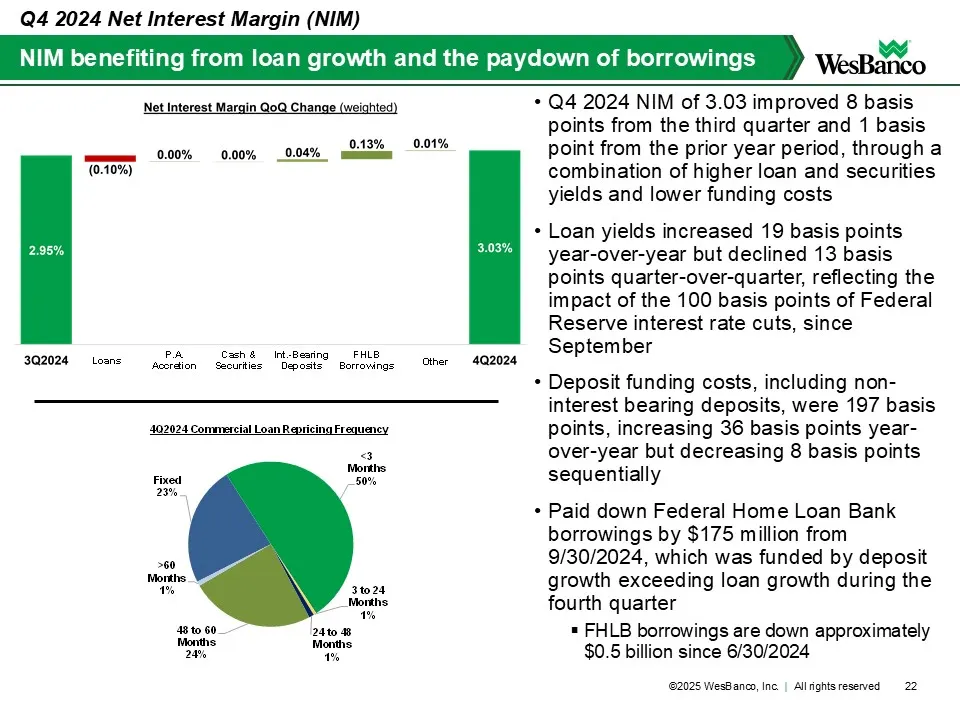
Slide 22: Net interest margin
NIM benefiting from loan growth and the paydown of borrowings • Q4 2024 NIM of 3.03 improved 8 basis points from the third quarter and 1 basis point from the prior year period, through a combination of higher loan and securities yields and lower funding costs • Loan yields increased 19 basis points
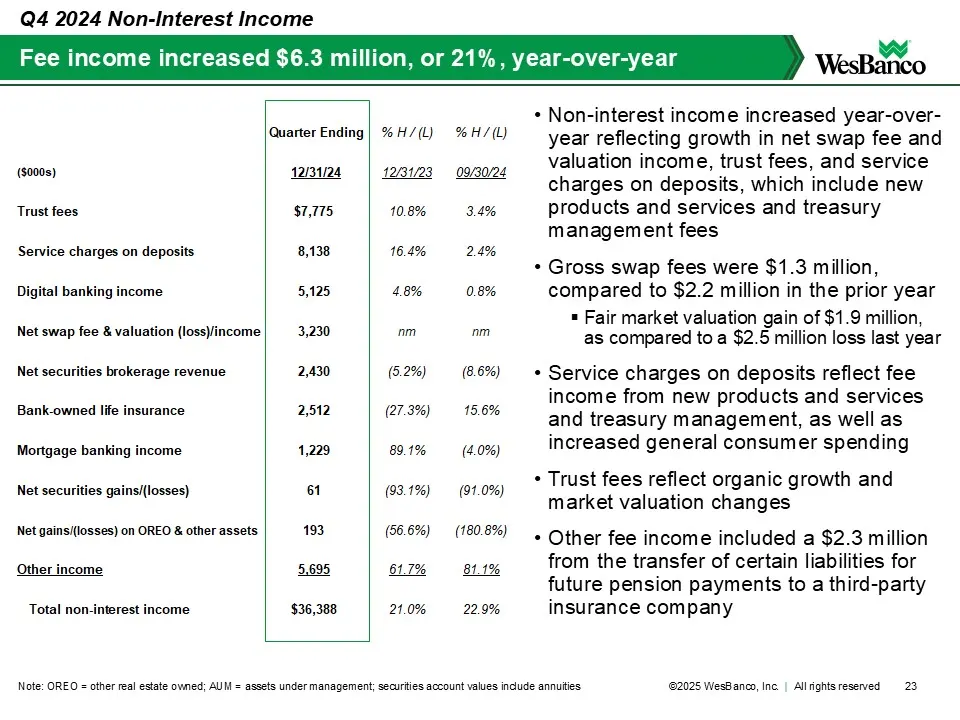
Slide 23: Non-interest income
Quarter Ending % H / (L) % H / (L) ($000s) 12/31/24 12/31/23 09/30/24 Trust fees $7,775 10.8% 3.4% Service charges on deposits 8,138 16.4% 2.4% Digital banking income 5,125 4.8% 0.8% Net swap fee & valuation (loss)/income 3,230 nm nm Net securities brokerage revenue 2,430 (5.2%) (8.6%) Bank-owned li
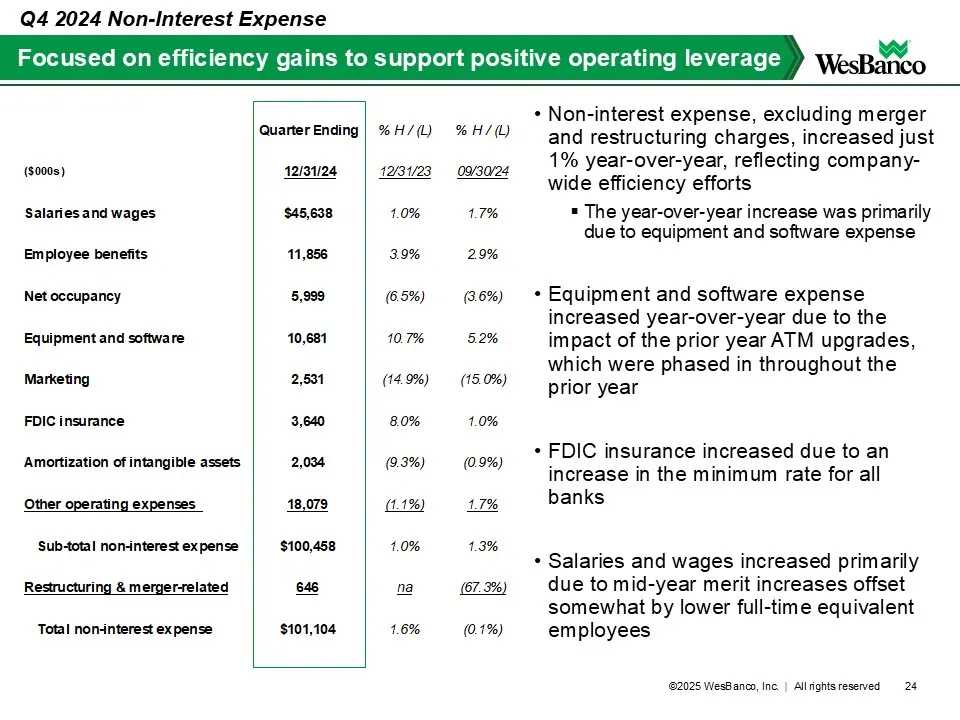
Slide 24: Q4 2024 Non-Interest Expense
Quarter Ending % H / (L) % H / (L) ($000s) 12/31/24 12/31/23 09/30/24 Salaries and wages $45,638 1.0% 1.7% Employee benefits 11,856 3.9% 2.9% Net occupancy 5,999 (6.5%) (3.6%) Equipment and software 10,681 10.7% 5.2% Marketing 2,531 (14.9%) (15.0%) FDIC insurance 3,640 8.0% 1.0% Amortization of inta
Slide 25: Comparable operating measures to peer bank group
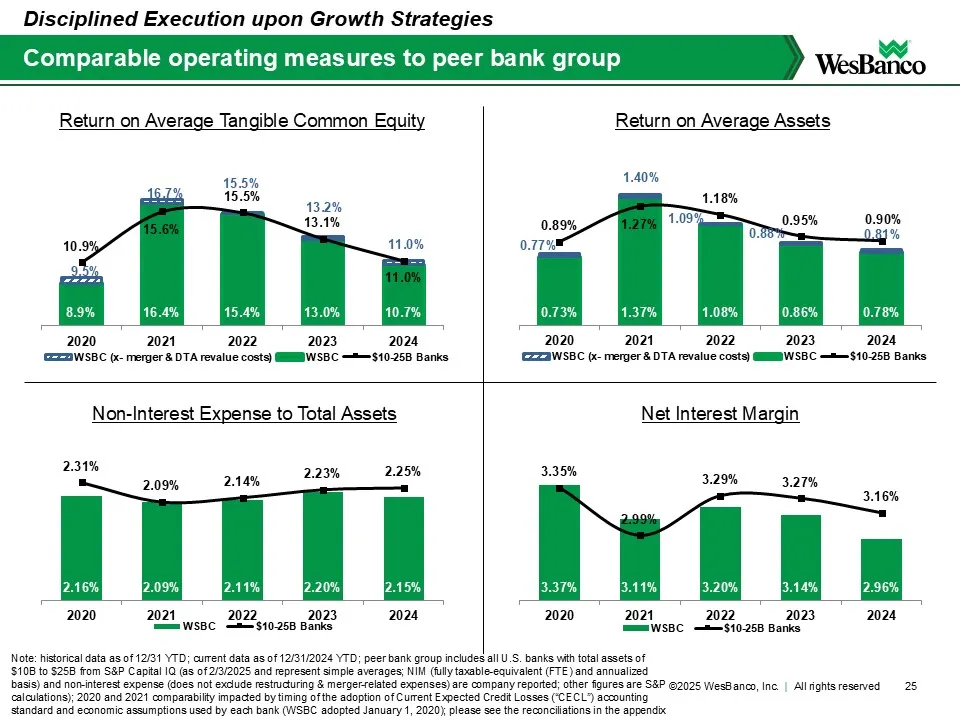
2.16% 2.09% 2.11% 2.20% 2.15% 2.31% 2.09% 2.14% 2.23% 2.25% 2020 2021 2022 2023 2024 WSBC $10-25B Banks 25 Comparable operating measures to peer bank group Note: historical data as of 12/31 YTD; current data as of 12/31/2024 YTD; peer bank group includes all U.S. banks with total assets of $10B to $
Slide 26: Favorable asset quality measures compared to peer bank group
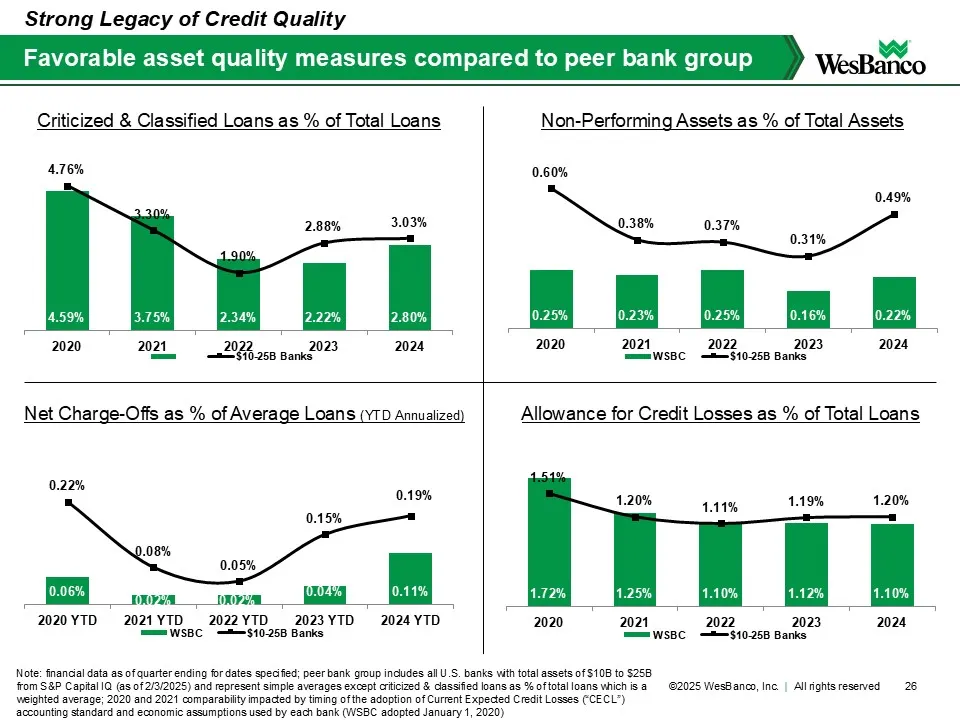
0.25% 0.23% 0.25% 0.16% 0.22% 0.60% 0.38% 0.37% 0.31% 0.49% 2020 2021 2022 2023 2024 WSBC $10-25B Banks 0.06% 0.02% 0.02% 0.04% 0.11% 0.22% 0.08% 0.05% 0.15% 0.19% 2020 YTD 2021 YTD 2022 YTD 2023 YTD 2024 YTD WSBC $10-25B Banks 1.72% 1.25% 1.10% 1.12% 1.10% 1.51% 1.20% 1.11% 1.19% 1.20% 2020 2021 20
Slide 27: Returning value to shareholders
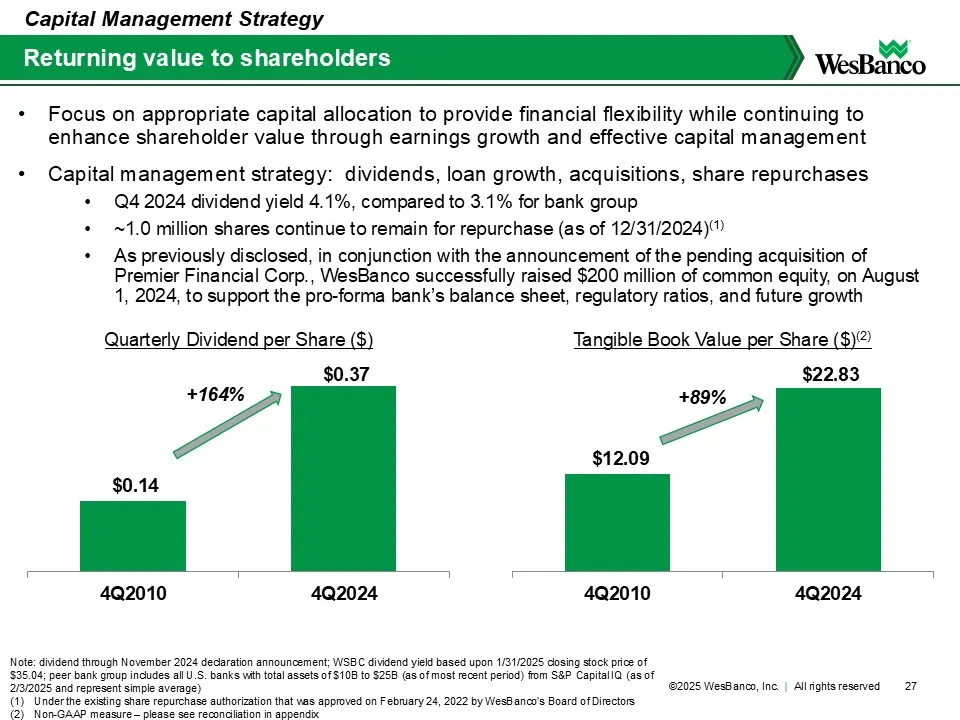
$0.14 $0.37 4Q2010 4Q2024 $12.09 $22.83 4Q2010 4Q2024 27 Returning value to shareholders Note: dividend through November 2024 declaration announcement; WSBC dividend yield based upon 1/31/2025 closing stock price of $35.04; peer bank group includes all U.S. banks with total assets of $10B to $25B (a
Slide 28: Appendix
Appendix ©2025 WesBanco, Inc. | All rights reserved
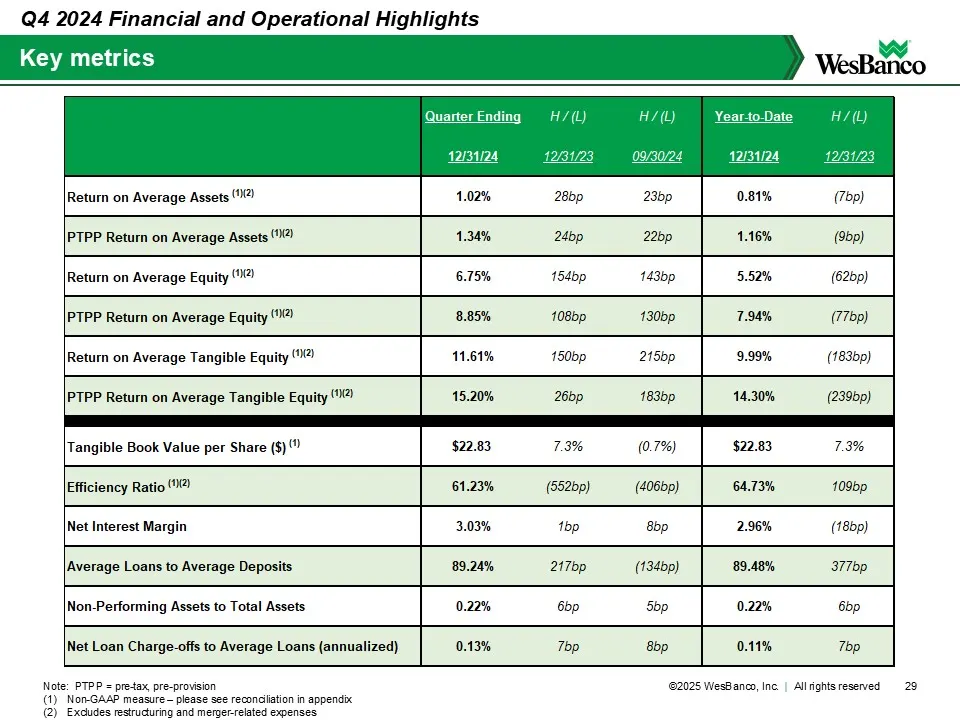
Slide 29: Key metrics
H / (L) H / (L) H / (L) 12/31/24 12/31/23 09/30/24 12/31/24 12/31/23 Return on Average Assets (1)(2) 1.02% 28bp 23bp 0.81% (7bp) PTPP Return on Average Assets (1)(2) 1.34% 24bp 22bp 1.16% (9bp) Return on Average Equity (1)(2) 6.75% 154bp 143bp 5.52% (62bp) PTPP Return on Average Equity (1)(2) 8.85%
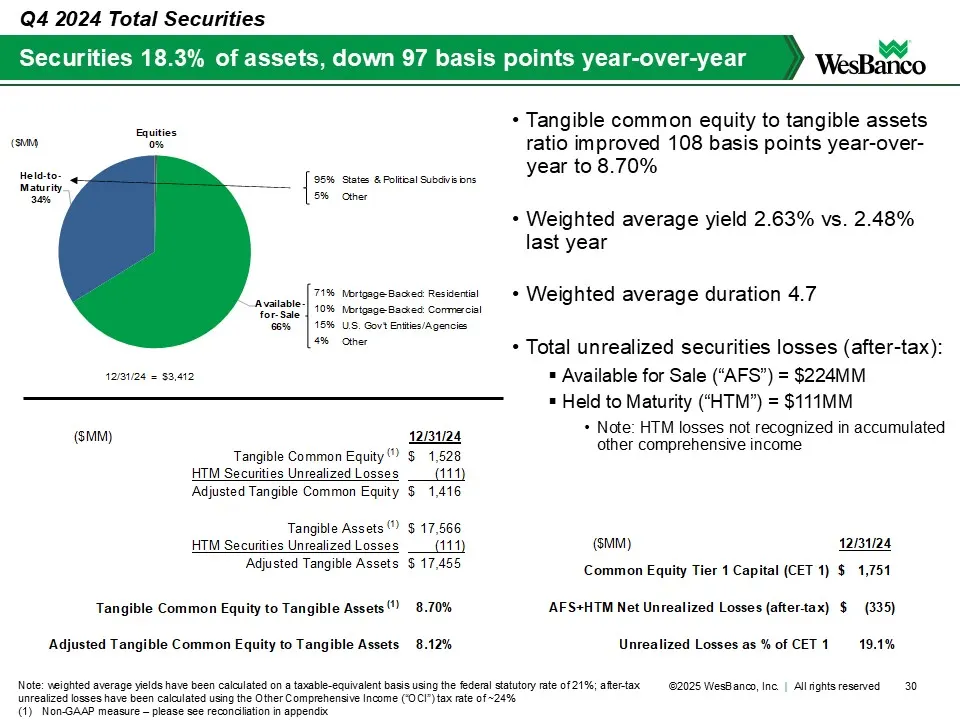
Slide 30: Securities portfolio
95% States & Political Subdivisions 5% Other 71% Mortgage-Backed: Residential 10% Mortgage-Backed: Commercial 15% U.S. Gov't Entities/Agencies 4% Other Equities 0% Available-for- Sale 66% Held-to- Maturity 34% 12/31/24 $3,412 = ($MM) ($MM) 12/31/24 Tangible Common Equity (1) $ 1 ,528 HTM Securities
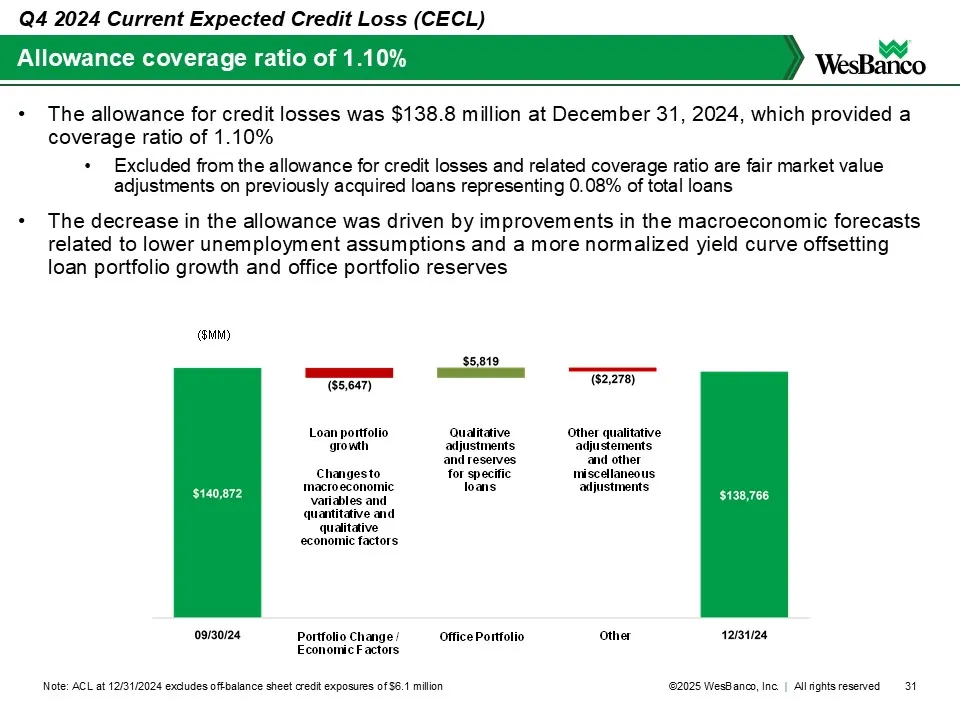
Slide 31: Allowance coverage ratio of 1.10%
Portfolio Change / Economic Factors Office Portfolio Other Qualitative adjustments and reserves for specific loans Other qualitative adjustements and other miscellaneous adjustments Loan portfolio growth Changes to macroeconomic variables and quantitative and qualitative economic factors ($MM) 31 Al
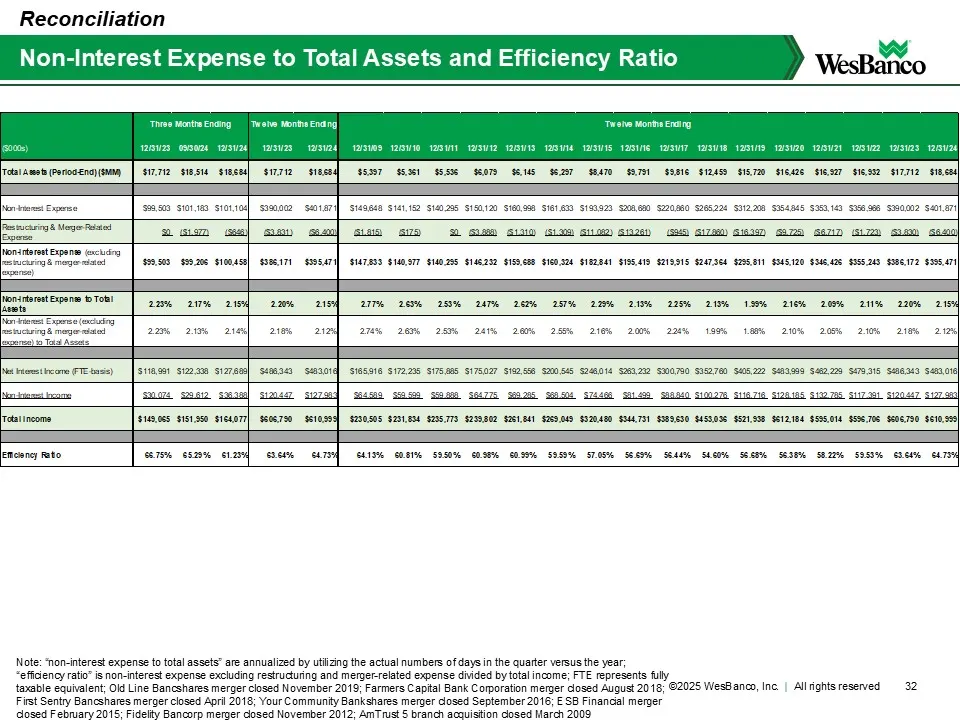
Slide 32: Non-interest expense to assets reconciliation
($000s) 12/31/23 09/30/24 12/31/24 12/31/23 12/31/24 12/31/09 12/31/10 12/31/11 12/31/12 12/31/13 12/31/14 12/31/15 12/31/16 12/31/17 12/31/18 12/31/19 12/31/20 12/31/21 12/31/22 12/31/23 12/31/24 Total Assets (Period-End) ($MM) $17,712 $18,514 $18,684 $17,712 $18,684 $5,397 $5,361 $5,536 $6,079 $6,
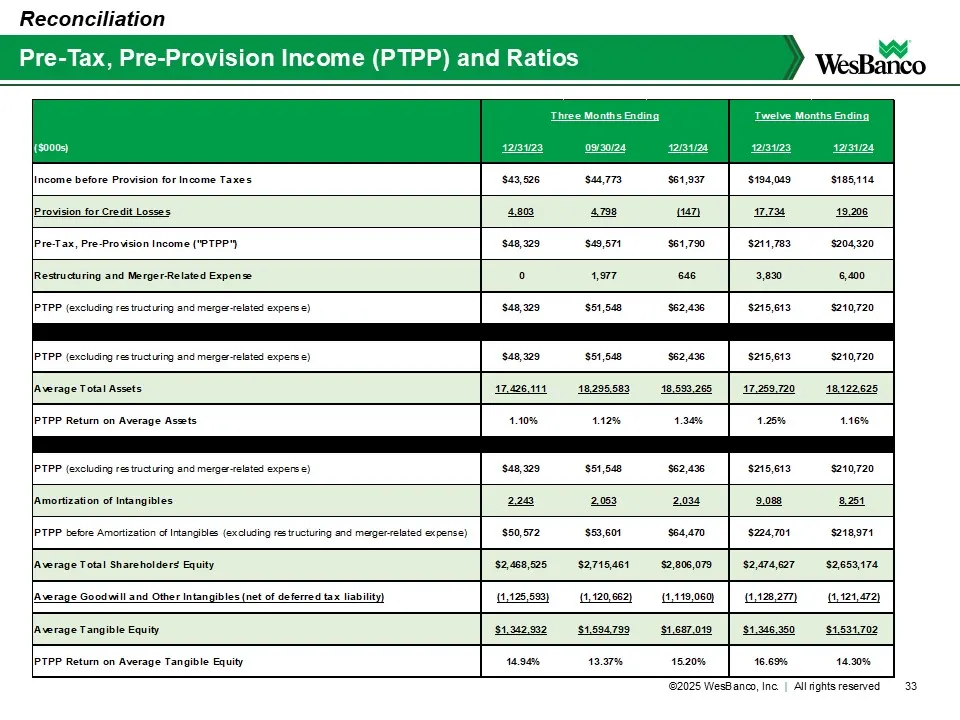
Slide 33: Pre-tax pre-provision income reconciliation
($000s) 12/31/23 09/30/24 12/31/24 12/31/23 12/31/24 Income before Provision for Income Taxes $43,526 $44,773 $61,937 $194,049 $185,114 Provision for Credit Losses 4,803 4,798 (147) 17,734 19,206 Pre-Tax, Pre-Provision Income ("PTPP") $48,329 $49,571 $61,790 $211,783 $204,320 Restructuring and Merge
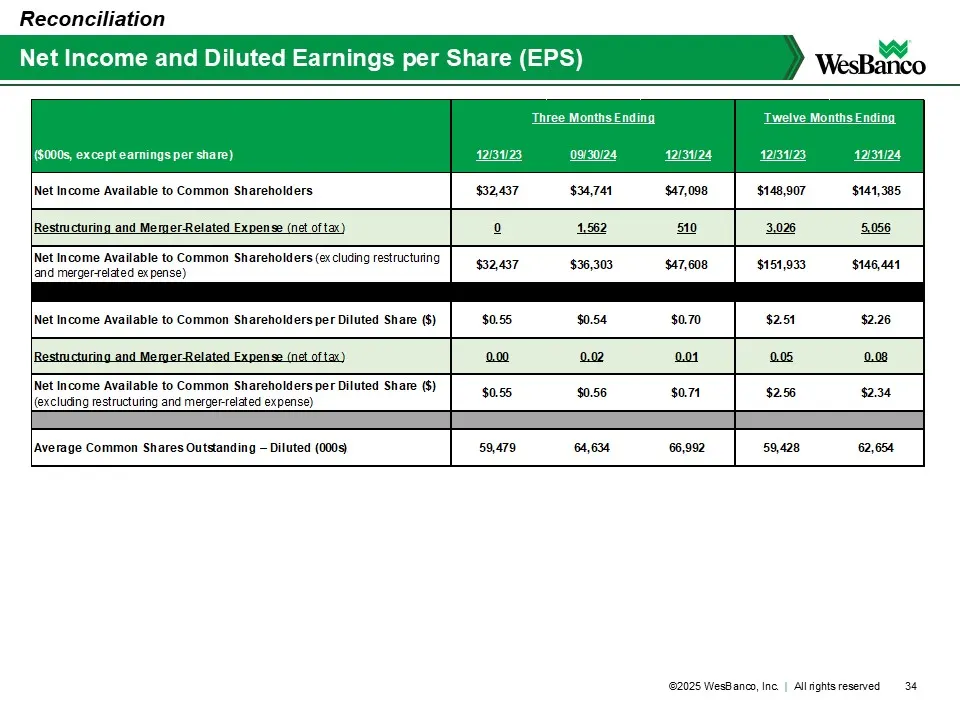
Slide 34: Net Income and Diluted EPS Reconciliation
($000s, except earnings per share) 12/31/23 09/30/24 12/31/24 12/31/23 12/31/24 Net Income Available to Common Shareholders $32,437 $34,741 $47,098 $148,907 $141,385 Restructuring and Merger-Related Expense (net of tax) 0 1,562 510 3,026 5,056 Net Income Available to Common Shareholders (excluding r
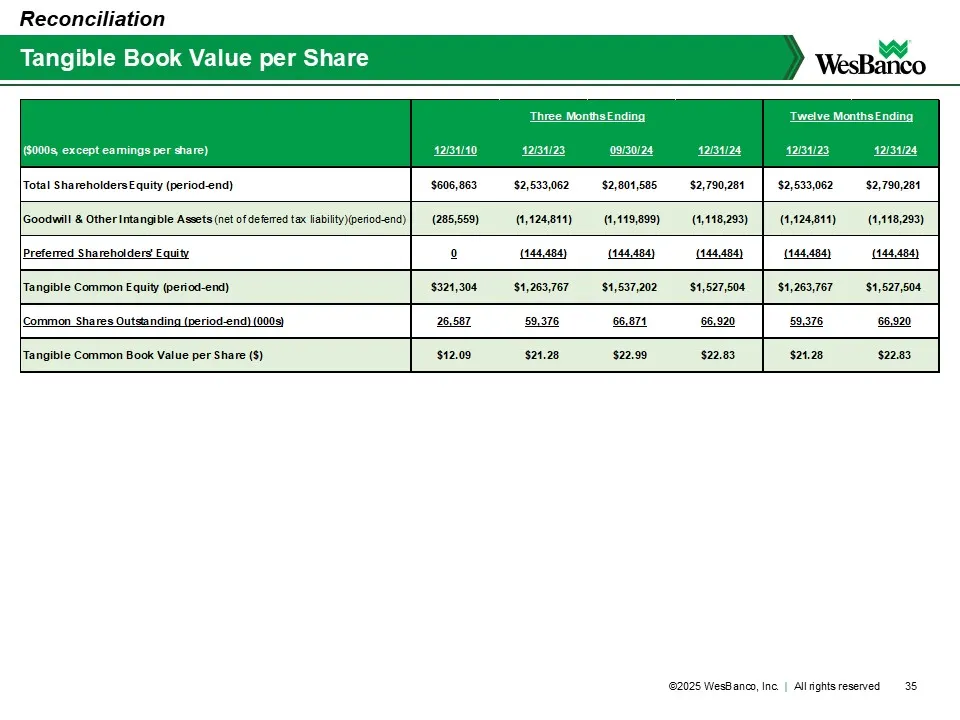
Slide 35: Tangible Book Value per Share Reconciliation
($000s, except earnings per share) 12/31/10 12/31/23 09/30/24 12/31/24 12/31/23 12/31/24 Total Shareholders Equity (period-end) $606,863 $2,533,062 $2,801,585 $2,790,281 $2,533,062 $2,790,281 Goodwill & Other Intangible Assets (net of deferred tax liability)(period-end) (285,559) (1,124,811) (1,119,
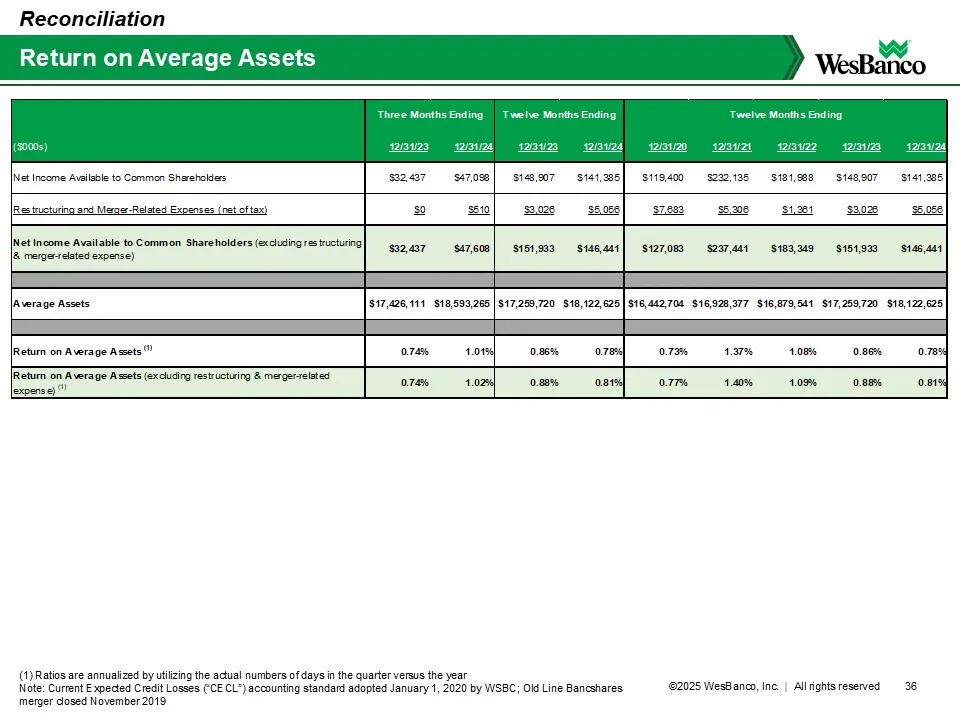
Slide 36: Return on Average Assets Reconciliation
36 Return on Average Assets (1) Ratios are annualized by utilizing the actual numbers of days in the quarter versus the year Note: Current Expected Credit Losses (“CECL”) accounting standard adopted January 1, 2020 by WSBC; Old Line Bancshares merger closed November 2019 Reconciliation ($000s) 12/31
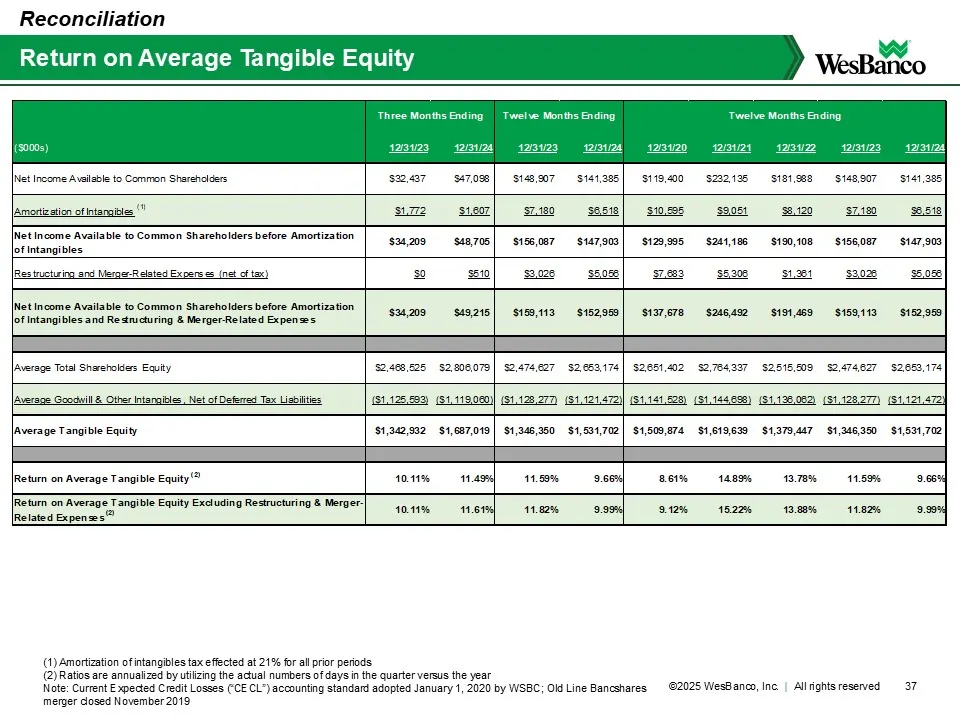
Slide 37: Return on Average Equity reconciliation
($000s) 12/31/23 12/31/24 12/31/23 12/31/24 12/31/20 12/31/21 12/31/22 12/31/23 12/31/24 Net Income Available to Common Shareholders $32,437 $47,098 $148,907 $141,385 $119,400 $232,135 $181,988 $148,907 $141,385 Amortization of Intangibles (1) $1,772 $1,607 $7,180 $6,518 $10,595 $9,051 $8,120 $7,180
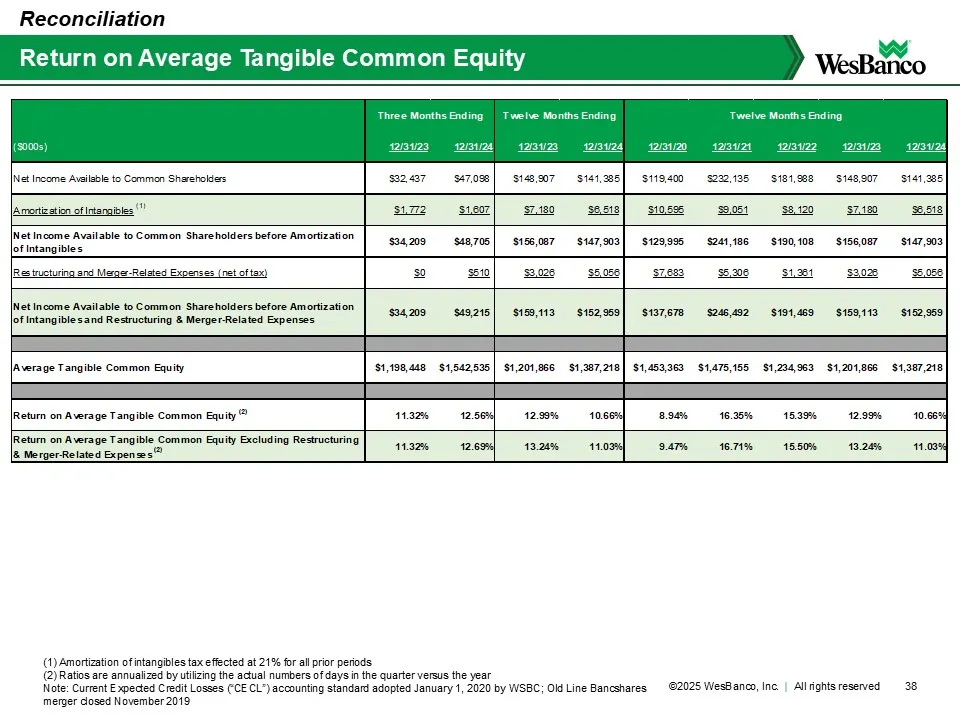
Slide 38: Return on Average Tangible Common Equity Reconciliation
38 Return on Average Tangible Common Equity Reconciliation (1) Amortization of intangibles tax effected at 21% for all prior periods (2) Ratios are annualized by utilizing the actual numbers of days in the quarter versus the year Note: Current Expected Credit Losses (“CECL”) accounting standard adop
Slide 39: Appendix for Proposed Acquisition of Premier Financial Corp.
Appendix for Proposed Acquisition of Premier Financial Corp. NOTE: slides in this section are directly from the presentation filed in conjunction with the acquisition announcement on July 26, 2024 – for additional information, please see the associated Form 8-K filing at https://investor.wesbanco.co
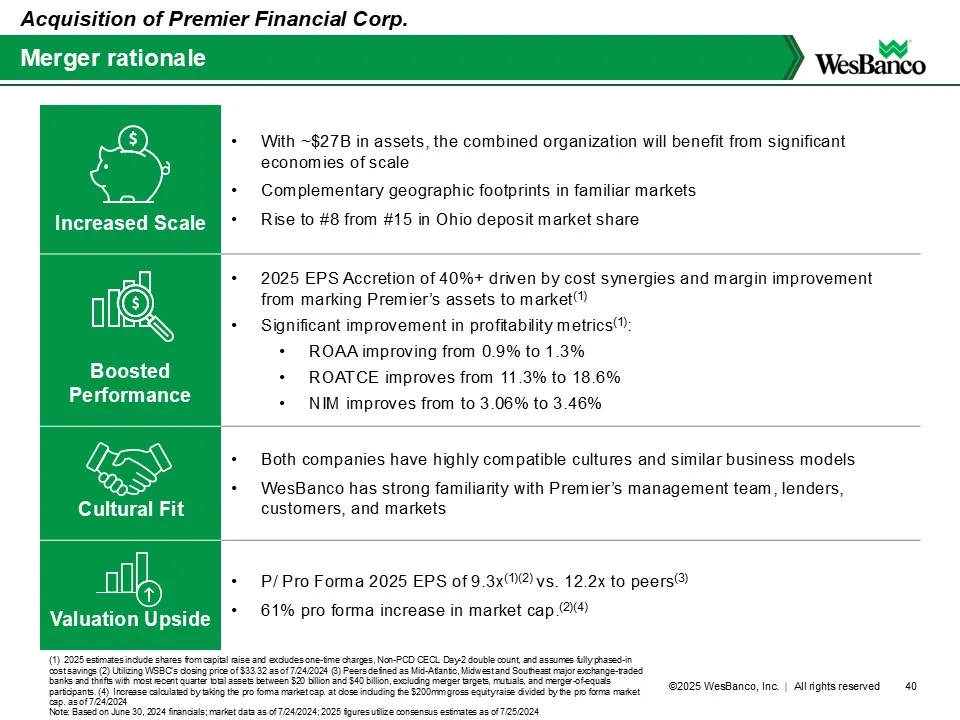
Slide 40: Merger rationale
Increased Scale • With ~$27B in assets, the combined organization will benefit from significant economies of scale • Complementary geographic footprints in familiar markets • Rise to #8 from #15 in Ohio deposit market share Boosted Performance • 2025 EPS Accretion of 40%+ driven by cost synergies an
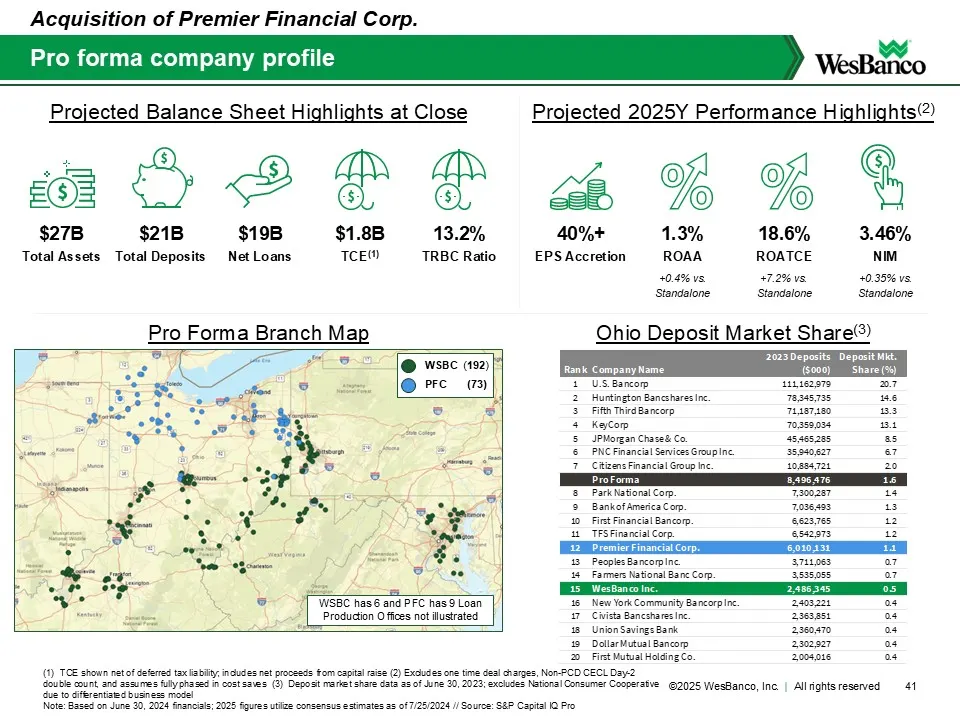
Slide 41: Pro forma company profile
Pro forma company profile 41 (1) TCE shown net of deferred tax liability; includes net proceeds from capital raise (2) Excludes one time deal charges, Non-PCD CECL Day-2 double count, and assumes fully phased in cost saves (3) Deposit market share data as of June 30, 2023; excludes National Consumer
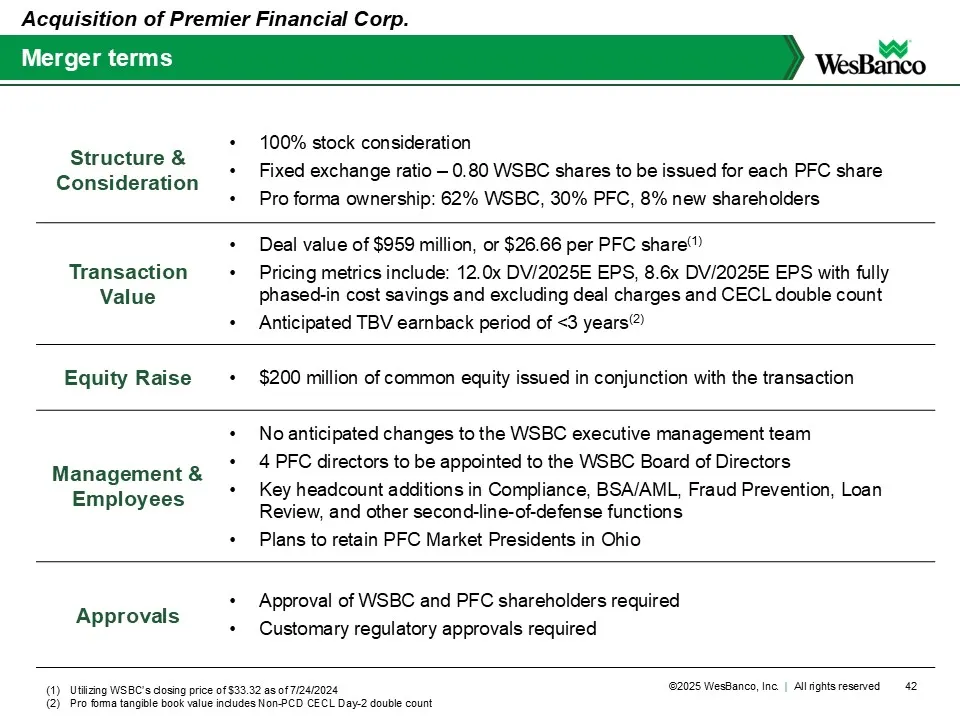
Slide 42: Transaction summary
Structure & Consideration • 100% stock consideration • Fixed exchange ratio – 0.80 WSBC shares to be issued for each PFC share • Pro forma ownership: 62% WSBC, 30% PFC, 8% new shareholders Transaction Value • Deal value of $959 million, or $26.66 per PFC share(1) • Pricing metrics include: 12.0x DV/
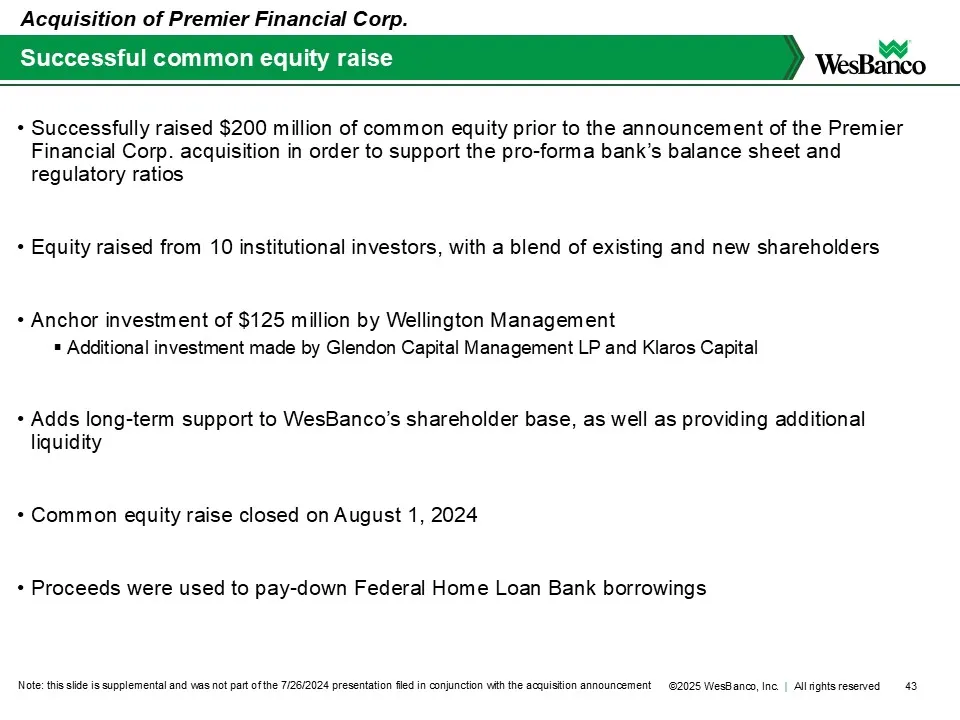
Slide 43: Successful common equity raise
• Successfully raised $200 million of common equity prior to the announcement of the Premier Financial Corp. acquisition in order to support the pro-forma bank’s balance sheet and regulatory ratios • Equity raised from 10 institutional investors, with a blend of existing and new shareholders • Ancho
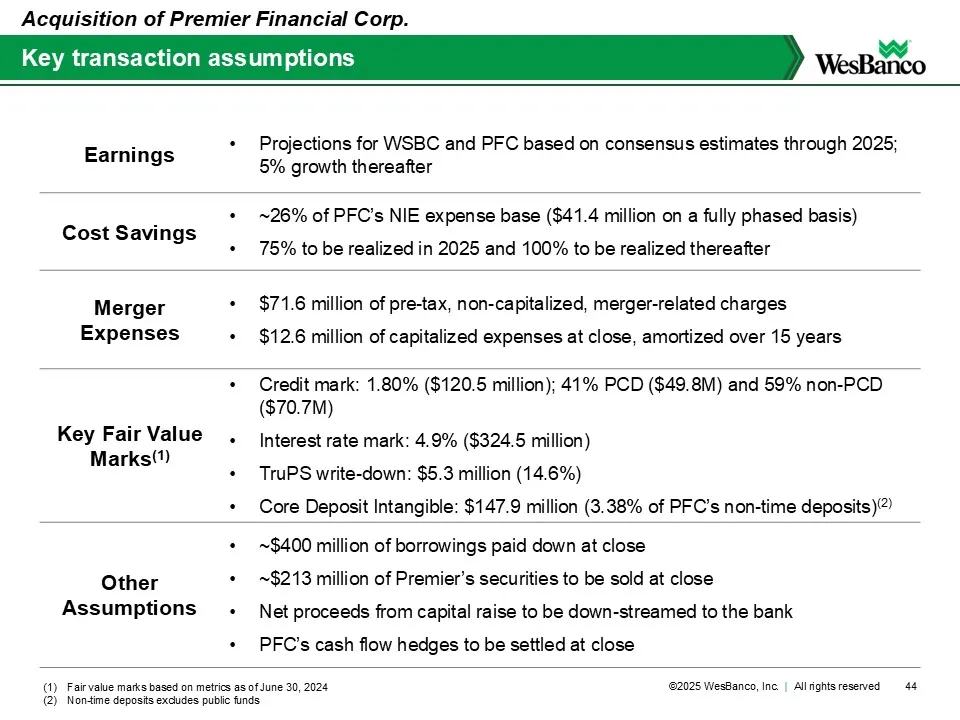
Slide 44: Key assumptions
Earnings • Projections for WSBC and PFC based on consensus estimates through 2025; 5% growth thereafter Cost Savings • ~26% of PFC’s NIE expense base ($41.4 million on a fully phased basis) • 75% to be realized in 2025 and 100% to be realized thereafter Merger Expenses • $71.6 million of pre-tax, no
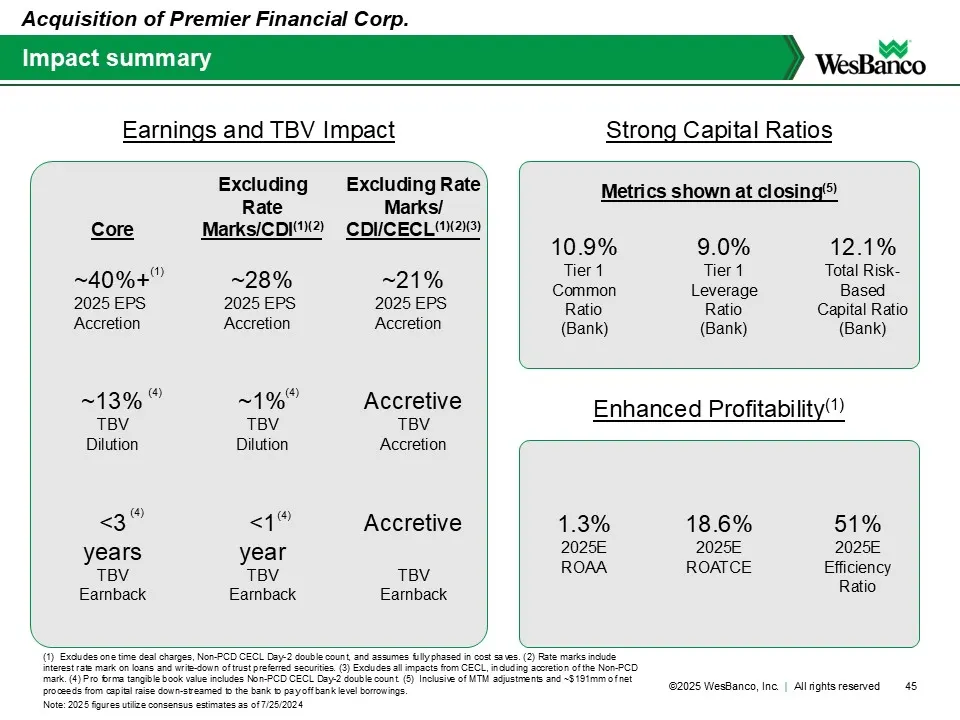
Slide 45: Impact summary
Impact summary Acquisition of Premier Financial Corp. 45 (1) Excludes one time deal charges, Non-PCD CECL Day-2 double count, and assumes fully phased in cost saves. (2) Rate marks include interest rate mark on loans and write-down of trust preferred securities. (3) Excludes all impacts from CECL, i
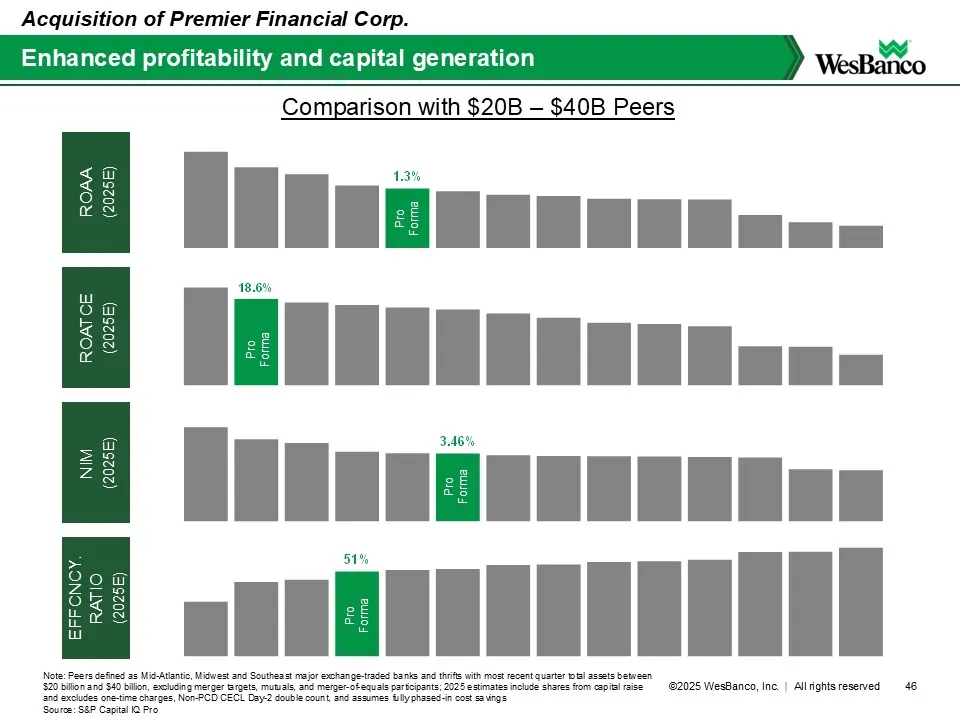
Slide 46: Enhanced profitability and capital generation
Enhanced profitability and capital generation Acquisition of Premier Financial Corp. 46 Note: Peers defined as Mid-Atlantic, Midwest and Southeast major exchange-traded banks and thrifts with most recent quarter total assets between $20 billion and $40 billion, excluding merger targets, mutuals, and
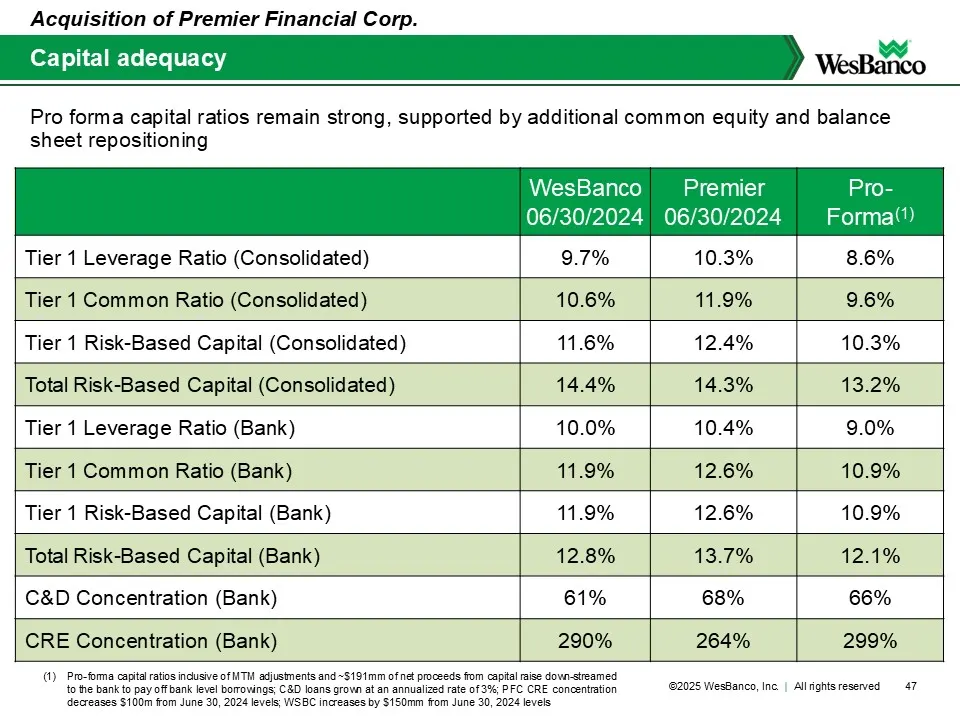
Slide 47: Capital adequacy
WesBanco 06/30/2024 Premier 06/30/2024 Pro- Forma(1) Tier 1 Leverage Ratio (Consolidated) 9.7% 10.3% 8.6% Tier1CommonRatio (Consolidated) 10.6% 11.9% 9.6% Tier1Risk-BasedCapital (Consolidated) 11.6% 12.4% 10.3% TotalRisk-BasedCapital (Consolidated) 14.4% 14.3% 13.2% Tier1LeverageRatio (Bank) 10.0% 1
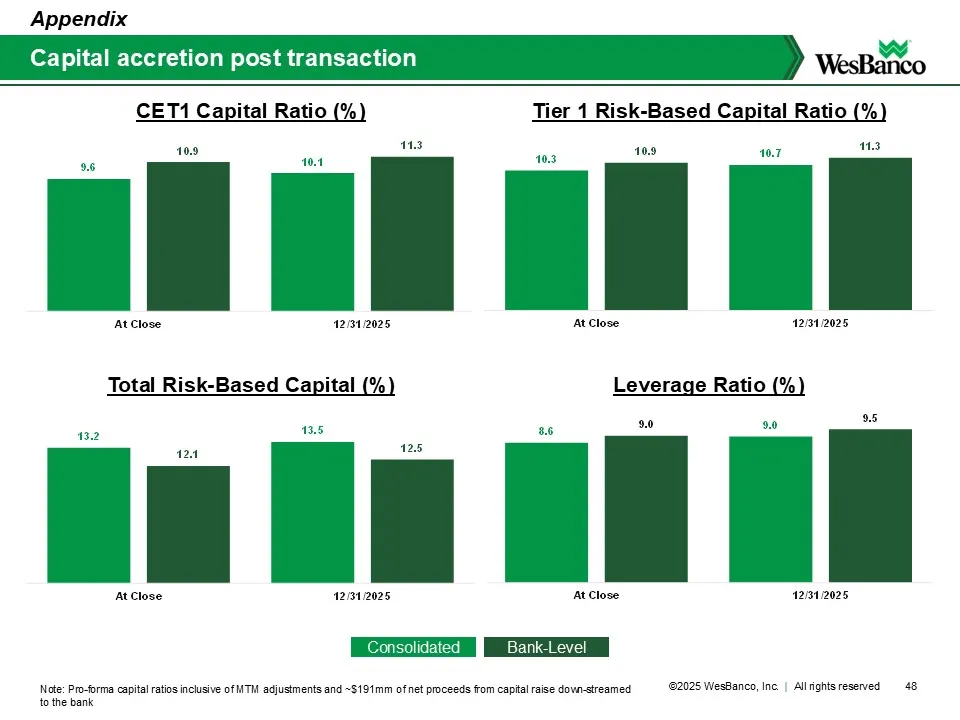
Slide 48: Capital accretion post transaction
Capital accretion post transaction Appendix 48 CET1 Capital Ratio (%) Total Risk-Based Capital (%) Leverage Ratio (%) Tier 1 Risk-Based Capital Ratio (%) 9.6 10.1 10.9 11.3 At Close 12/31/2025 8.6 9.0 9.0 9.5 At Close 12/31/2025 13.2 13.5 12.1 12.5 At Close 12/31/2025 10.3 10.7 10.9 11.3 At Close 12
Slide 49: Illustrative pro forma earnings accretion reconciliation
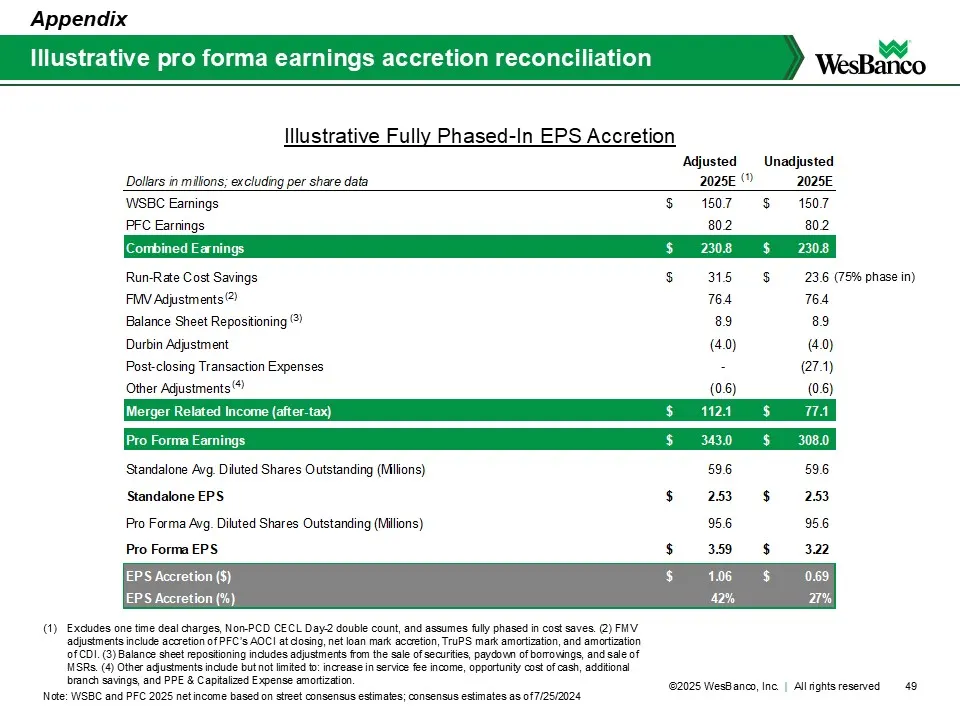
Illustrative pro forma earnings accretion reconciliation Illustrative Fully Phased-In EPS Accretion Appendix 49 Adjusted Unadjusted Dollars in millions; excluding per share data 2025E(1) 2025E WSBC Earnings $ 1 50.7 $ 1 50.7 PFC Earnings 8 0.2 8 0.2 Combined Earnings $ 2 30.8 $ 2 30.8 Run-Rate Cost
Slide 50: Tangible book value impact and goodwill
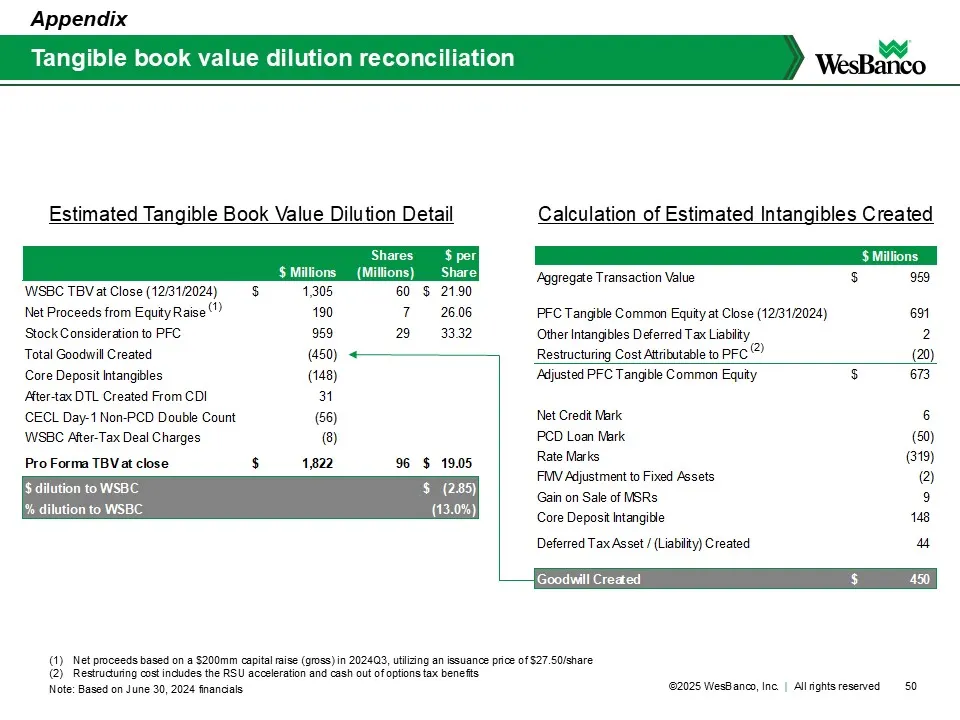
Shares $ per $ Millions (Millions) Share WSBC TBV at Close (12/31/2024) $ 1 ,305 60 $ 2 1.90 Net Proceeds from Equity Raise 190 7 26.06 Stock Consideration to PFC 959 29 33.32 Total Goodwill Created (4 50) Core Deposit Intangibles (1 48) After-tax DTL Created From CDI 31 CECL Day-1 Non-PCD Double Co
Slide 51: Non-GAAP reconciliations
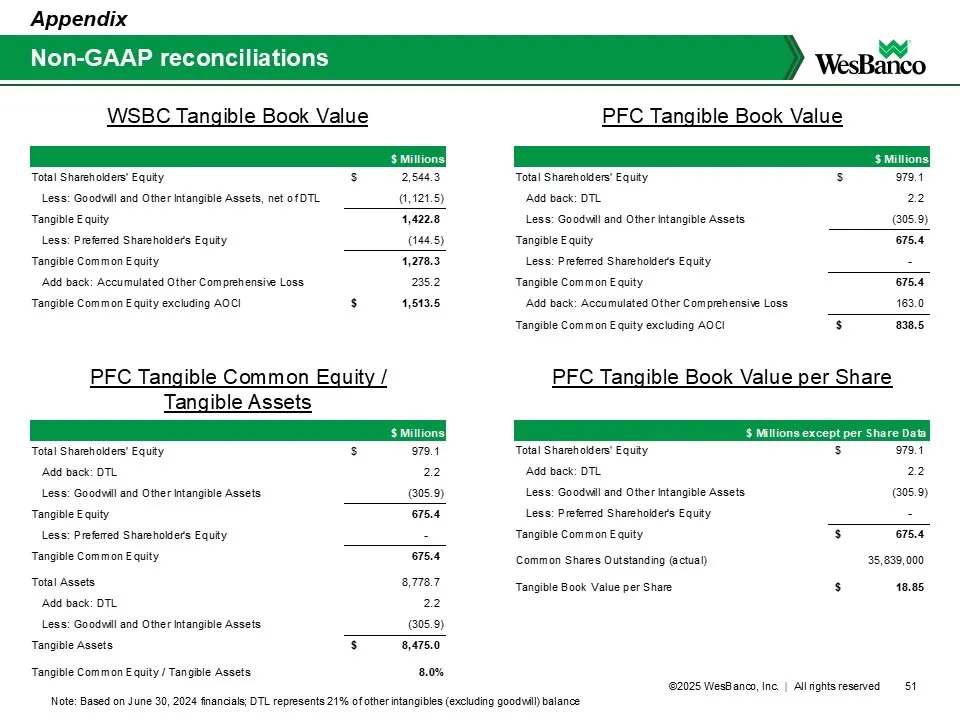
Non-GAAP reconciliations Appendix 51 WSBC Tangible Book Value $ Millions Total Shareholders' Equity $ 2 ,544.3 Less: Goodwill and Other Intangible Assets, net of DTL (1,121.5) Tangible Equity 1,422.8 Less: Preferred Shareholder's Equity (144.5) Tangible Common Equity 1 ,278.3 Add back: Accumulated O
Source: SEC EDGAR · 425 filed Feb 10, 2025
More decks from Premier Financial Corp
 Q4 2024 Earnings Presentation23 slides · Jan 22, 2025
 Q3 2024 Earnings Presentation50 slides · Nov 6, 2024
 Q3 2024 Earnings Presentation22 slides · Oct 23, 2024
 Investor Presentation (August 2024)54 slides · Aug 30, 2024
 Merger or Acquisition (July 2024)39 slides · Jul 26, 2024
 Q2 2020 Earnings Presentation52 slides · Jul 29, 2020