Rockwool A/S Class A · OMXCOP:ROCK_A
Rockwool A/S Class A — Rockwool International — Non-Deal Roadshow (July 2009)
58 slides from Rockwool A/S Class A's roadshow presentation, Jul 3, 2009
Slide 1: Investor Road show London
Investor Road show London 03 July 2009 CEO Eelco van Heel VP Thorkild Diness Jensen 1 1
Slide 2: Forward-looking statement
Forward-looking statement The statements on the future in this presentation, including expected sales and earnings, are associated with risks and uncertainties and may be affected by factors influencing the activities of the group, e.g. the global economic environment, including interest and exchang
Slide 3: The Rockwool Group
The Rockwool Group 3 3
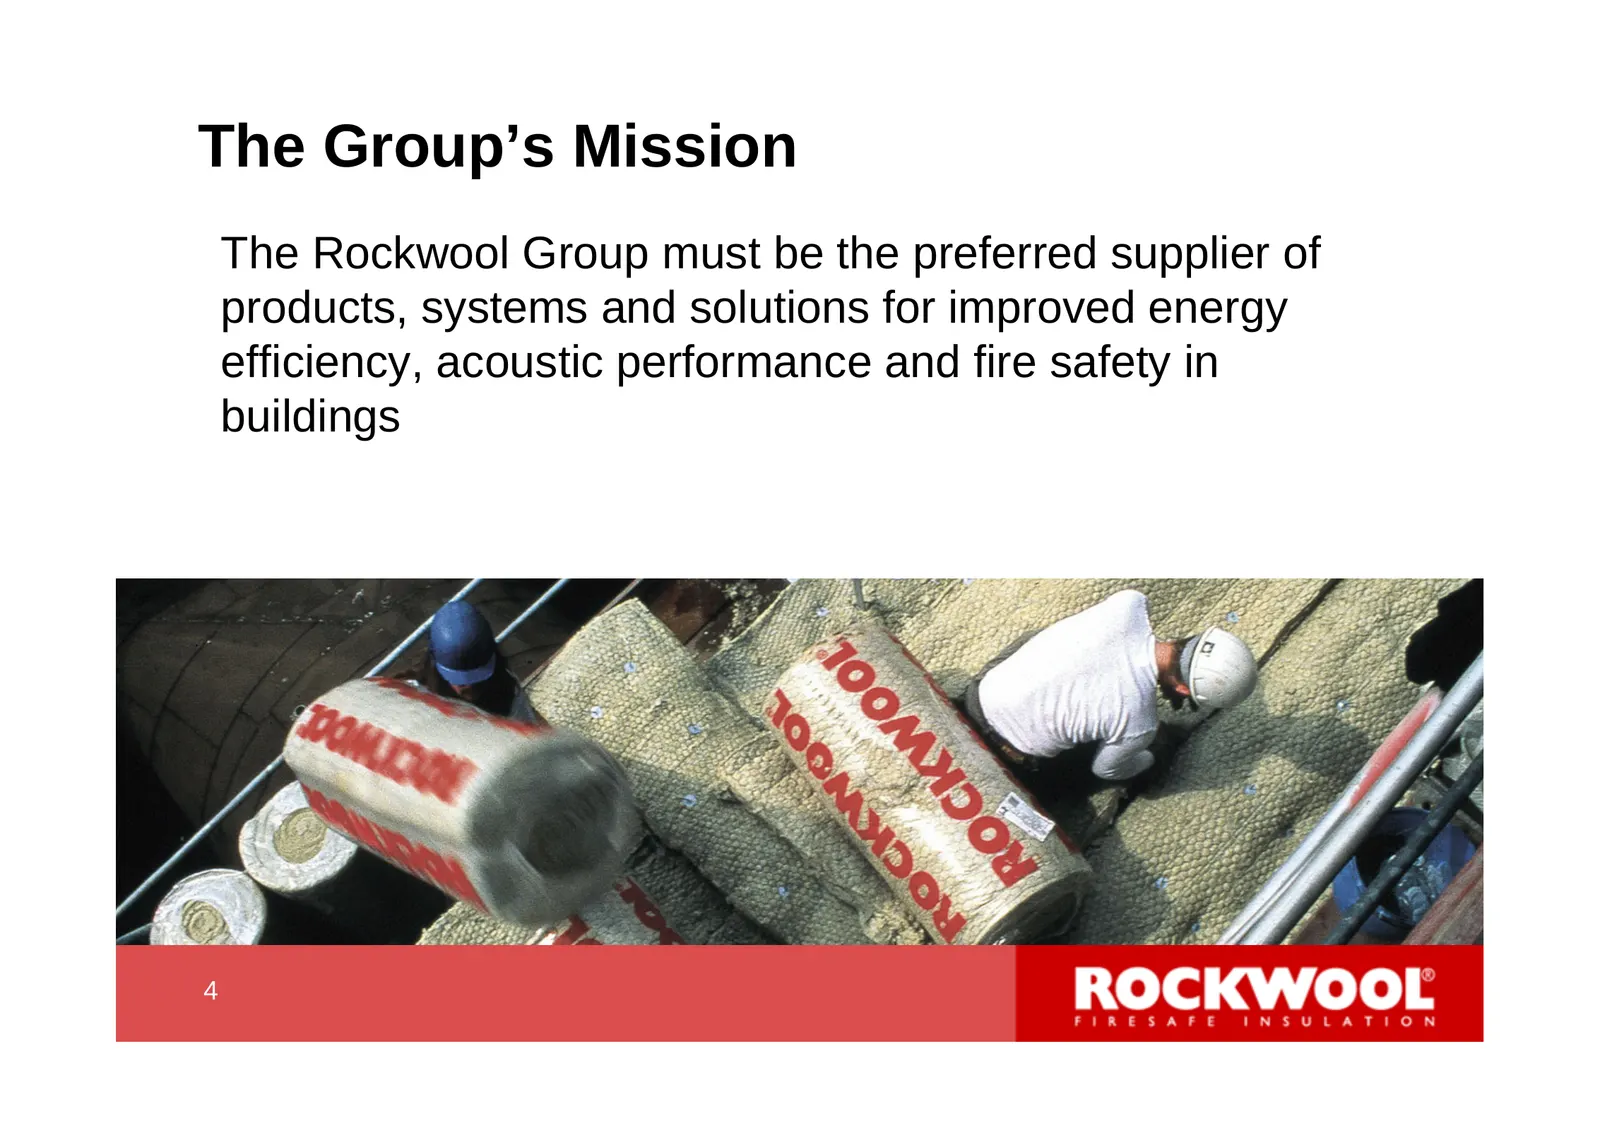
Slide 4: The Group's Mission
The Group’s Mission The Rockwool Group must be the preferred supplier of products, systems and solutions for improved energy efficiency, acoustic performance and fire safety in buildings 4 4
Slide 5: The Rockwool Group
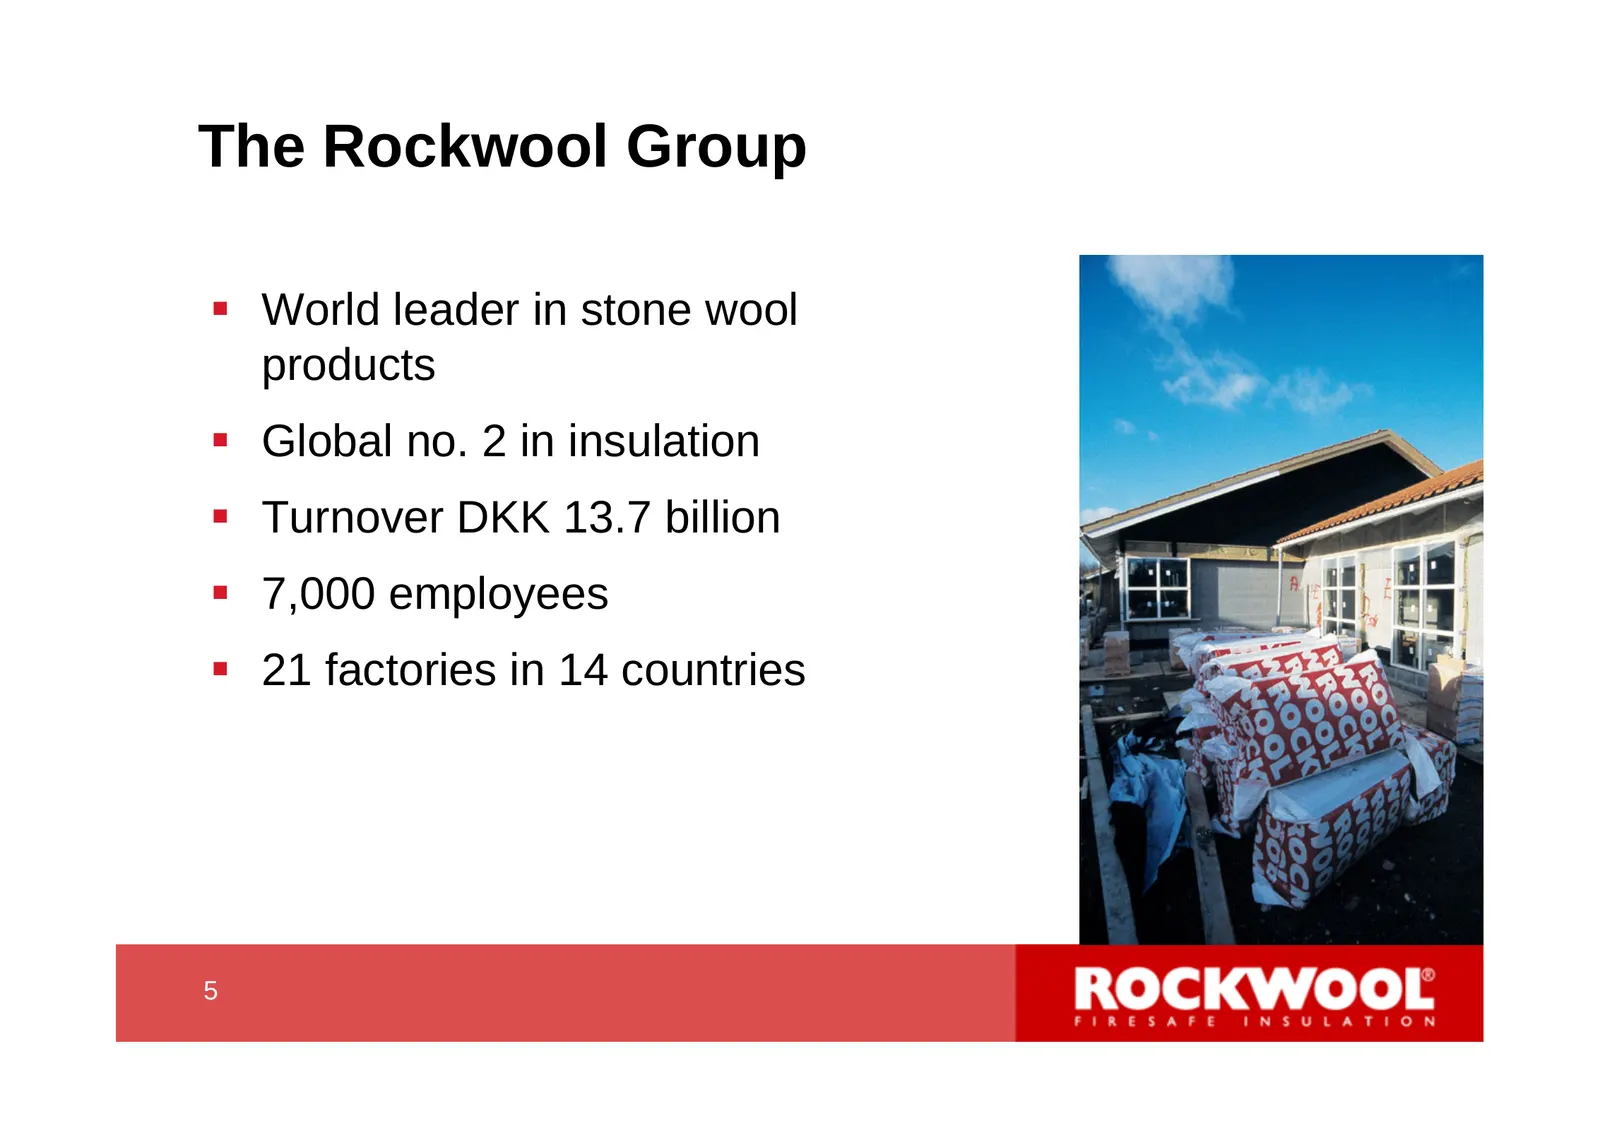
The Rockwool Group World leader in stone wool products Global no. 2 in insulation Turnover DKK 13.7 billion 7,000 employees 21 factories in 14 countries 5 5
Slide 6: Sales distributed on business area
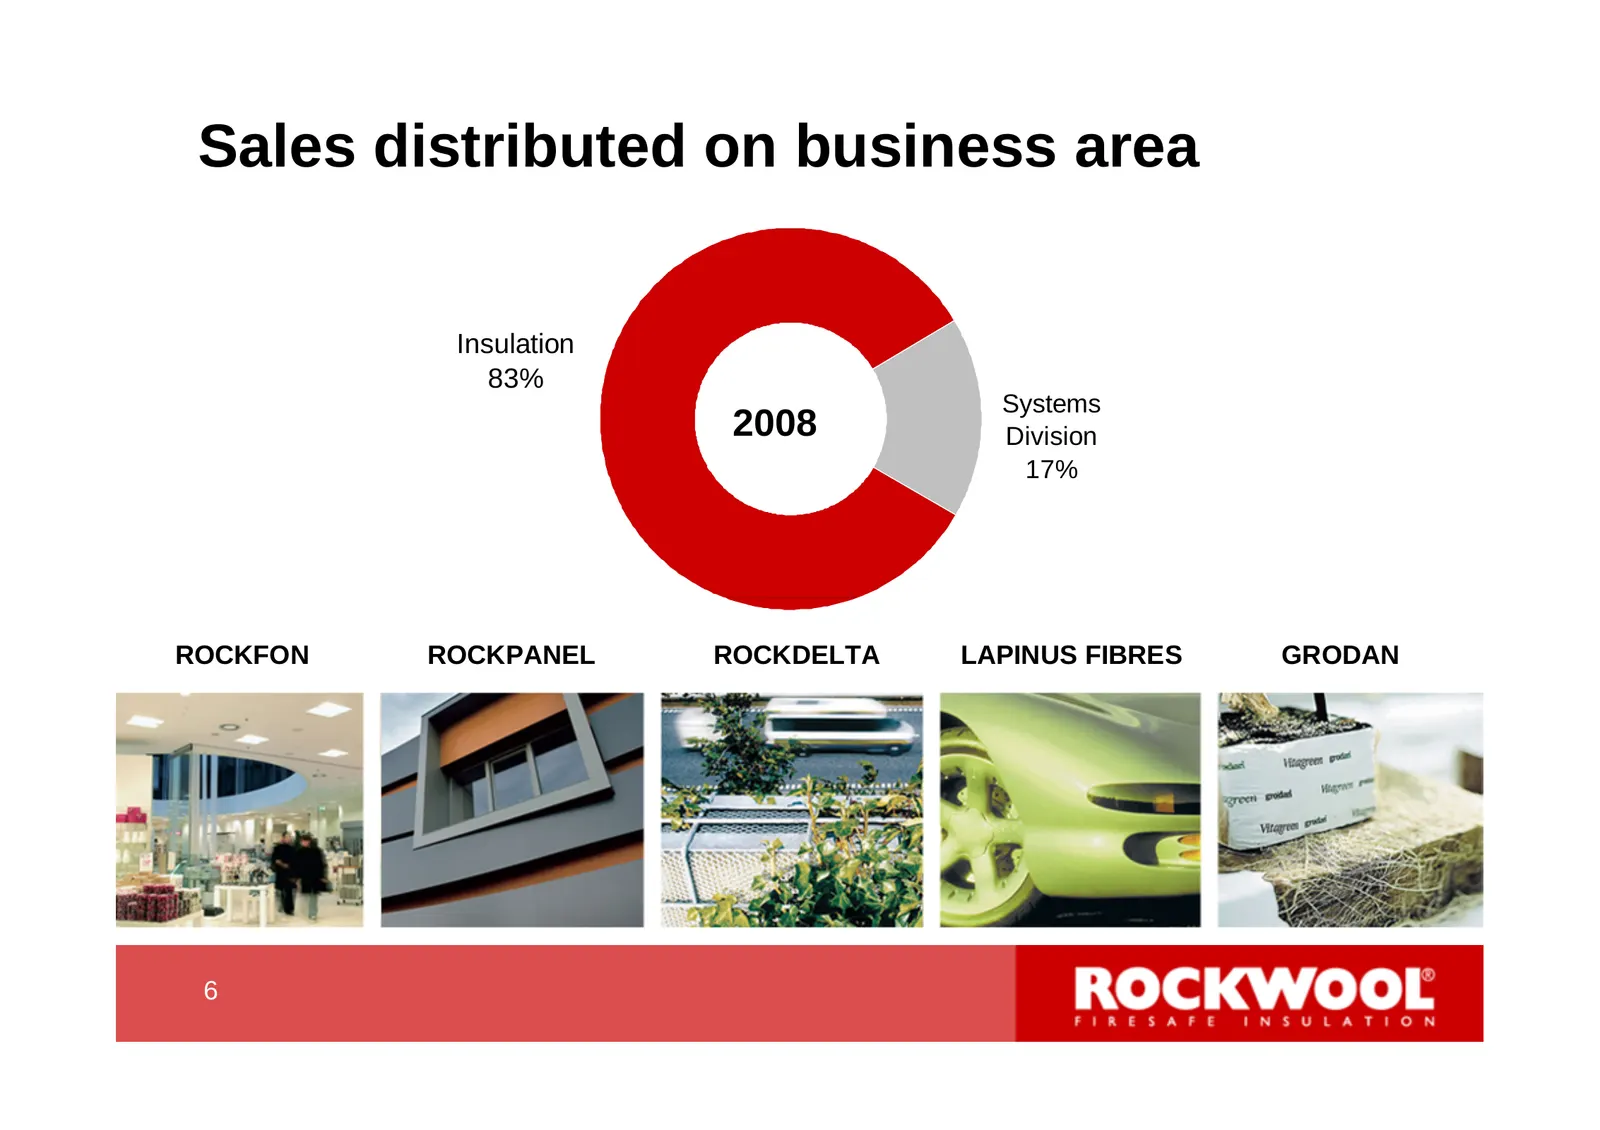
Sales distributed on business area Insulation 83% Systems 2008 Division 17% ROCKFON ROCKPANEL ROCKDELTA LAPINUS FIBRES GRODAN 6 6
Slide 7: Sales distributed on countries
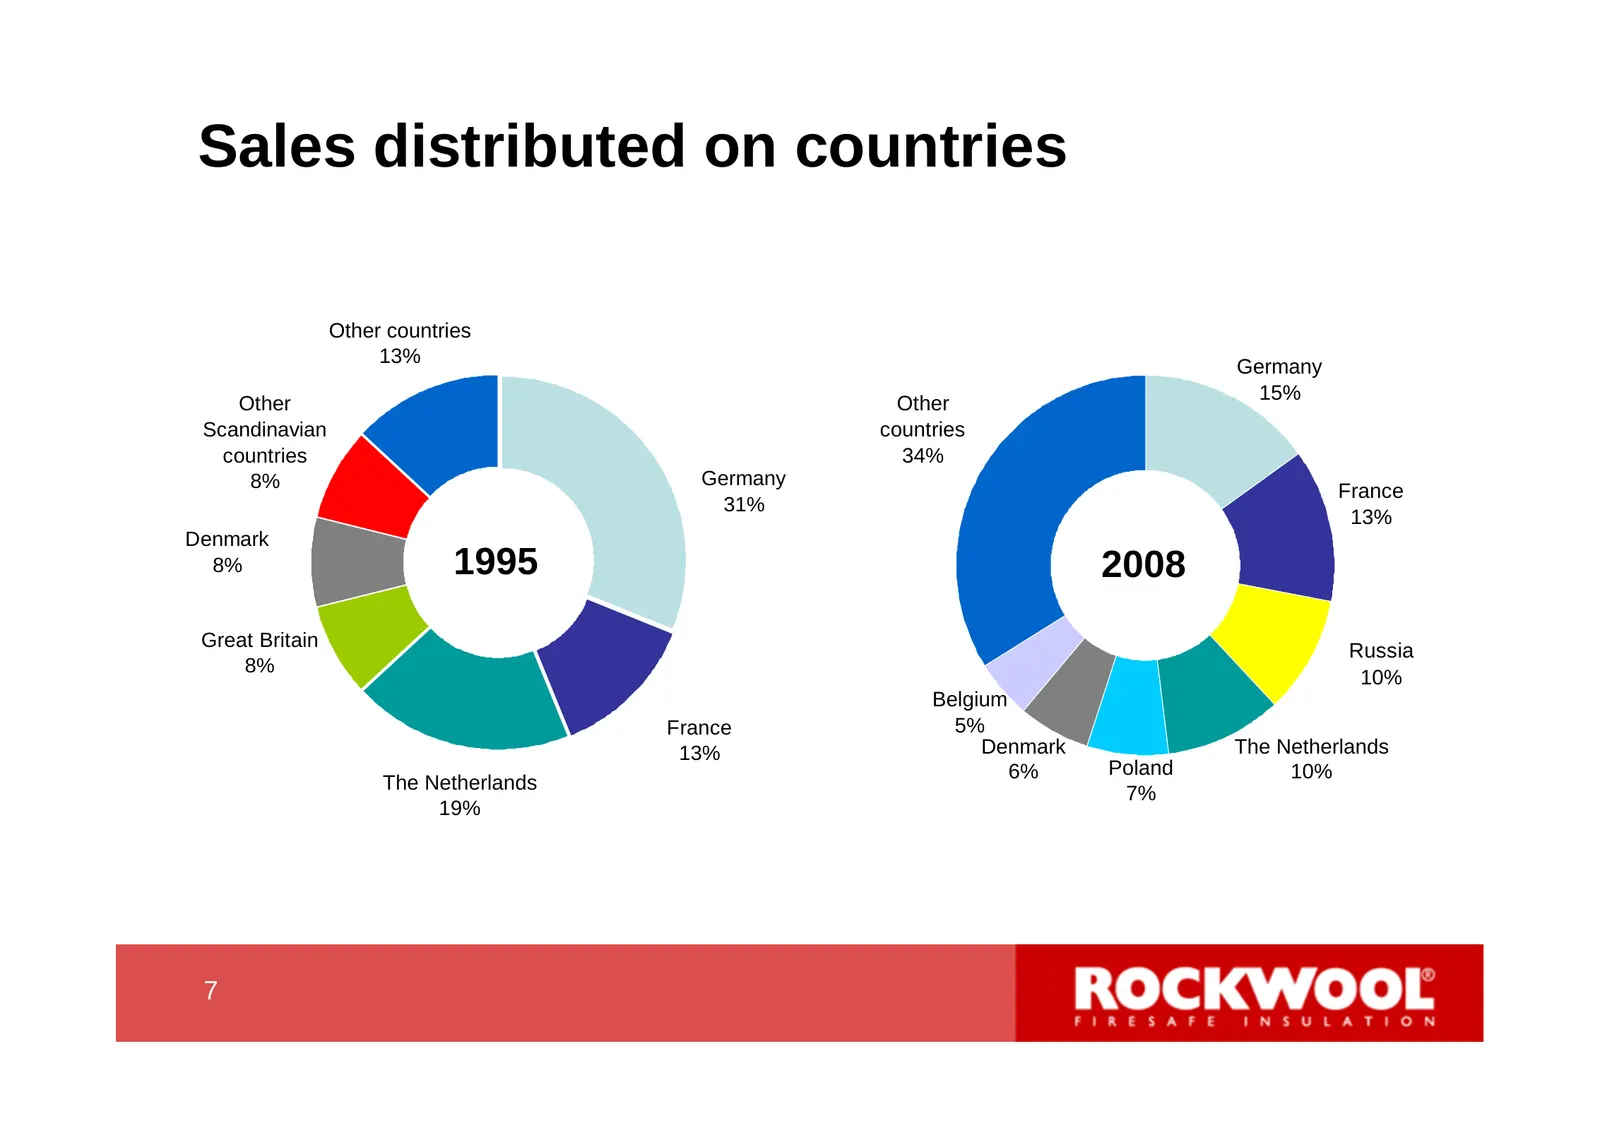
Sales distributed on countries Other countries 13% Germany Other 15% Other Scandinavian countries countries 34% 8% Germany France 31% 13% Denmark 8% 1995 2008 Great Britain Russia 8% 10% Belgium France 5% 13% Denmark The Netherlands 6% Poland 10% The Netherlands 7% 19% 7 7
Slide 8: Rockwool production is capital intensive – a new plant costs €130 mill.
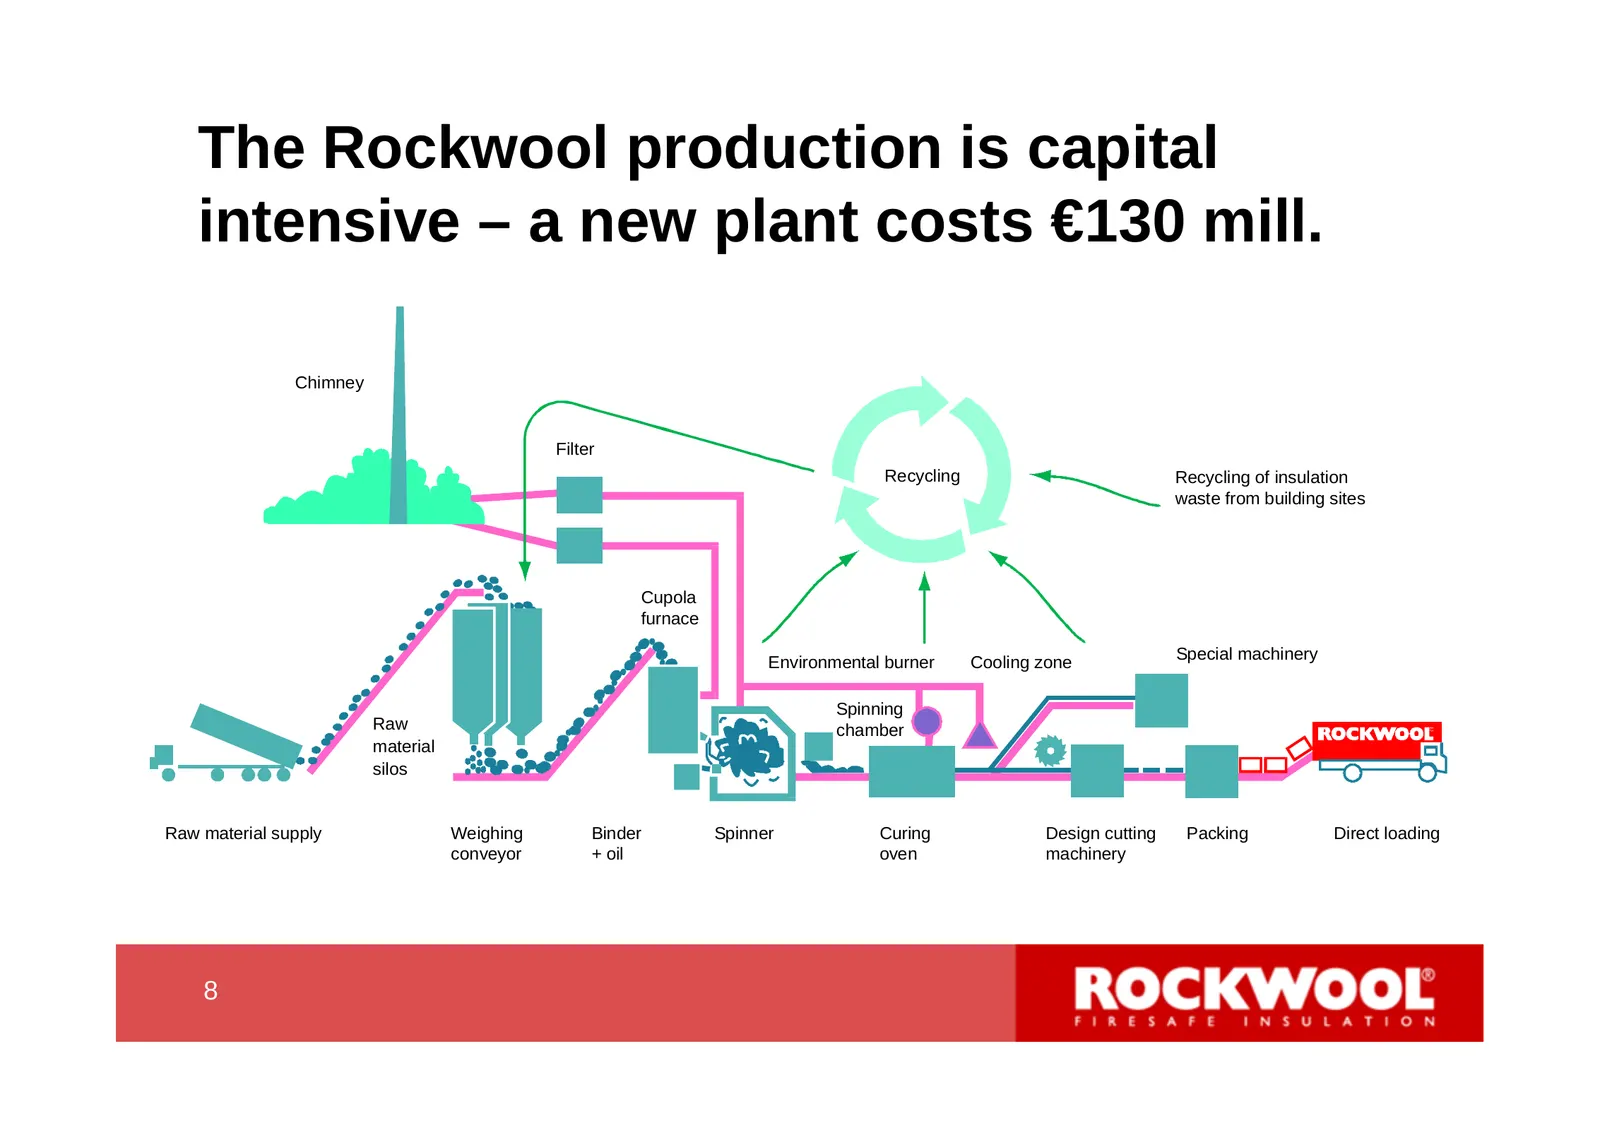
The Rockwool production is capital intensive – a new plant costs €130 mill. Chimney Filter Recycling Recycling of insulation waste from building sites Cupola furnace Environmental burner Cooling zone Special machinery Spinning Raw chamber material silos Raw material supply Weighing Binder Spinner Cu
Slide 9: Insulation market
Insulation market 9 9
Slide 10: European insulation market 2008
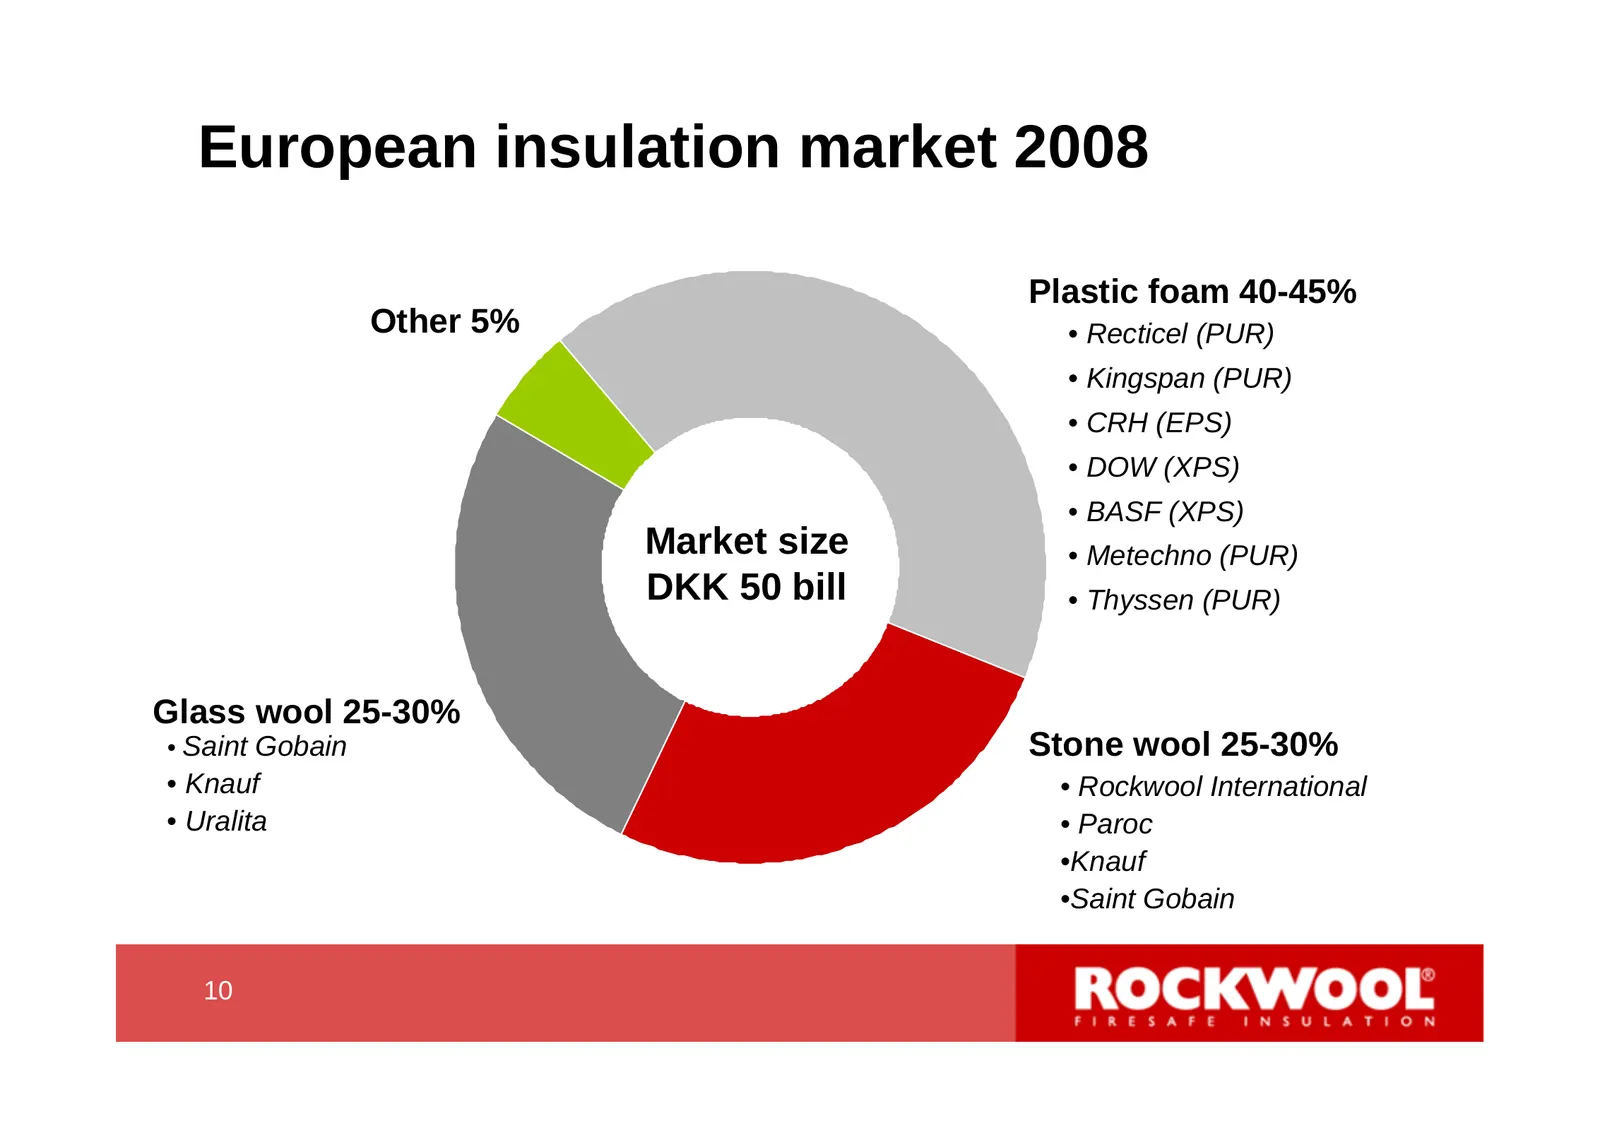
European insulation market 2008 Plastic foam 40-45% Other 5% • Recticel (PUR) • Kingspan (PUR) • CRH (EPS) • DOW (XPS) • BASF (XPS) Market size • Metechno (PUR) DKK 50 bill • Thyssen (PUR) Glass wool 25-30% • Saint Gobain Stone wool 25-30% • Knauf • Rockwool International • Uralita • Paroc •Knauf •S
Slide 11: North American insulation market 2008
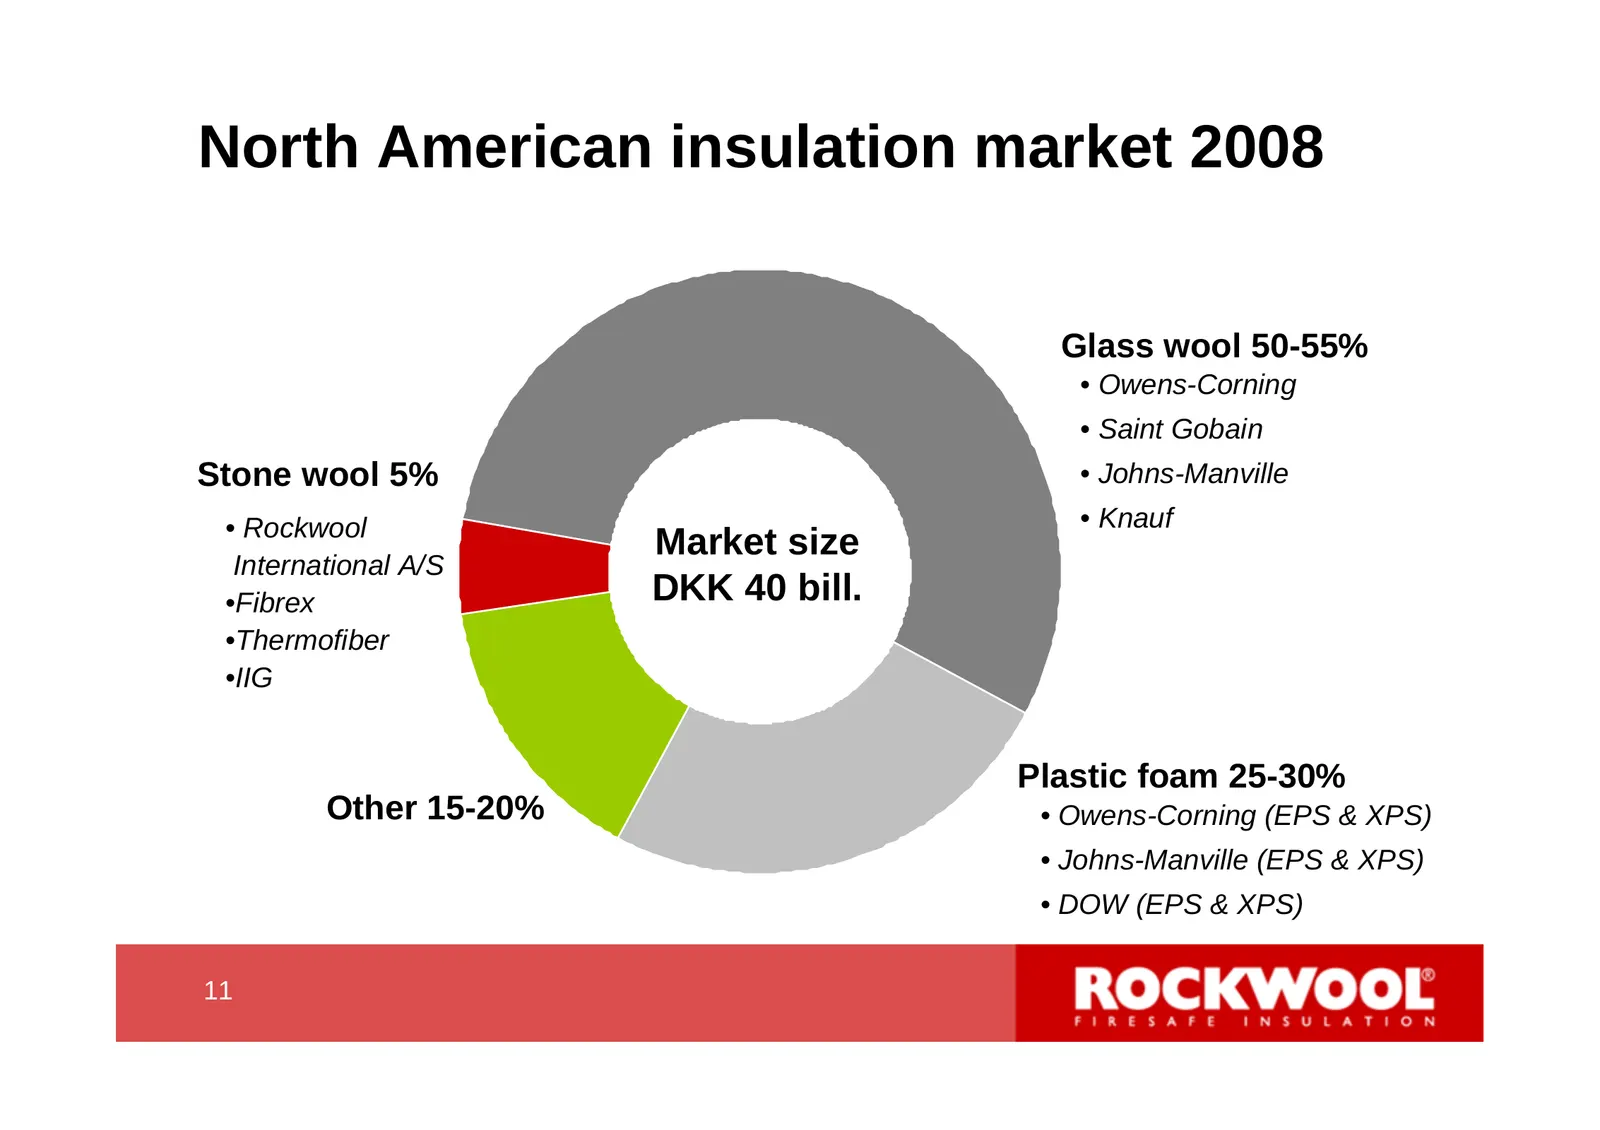
North American insulation market 2008 Glass wool 50-55% • Owens-Corning • Saint Gobain Stone wool 5% • Johns-Manville • Rockwool • Knauf Market size International A/S •Fibrex DKK 40 bill. •Thermofiber •IIG Plastic foam 25-30% Other 15-20% • Owens-Corning (EPS & XPS) • Johns-Manville (EPS & XPS) • DO
Slide 12: Market penetration potential still considerable
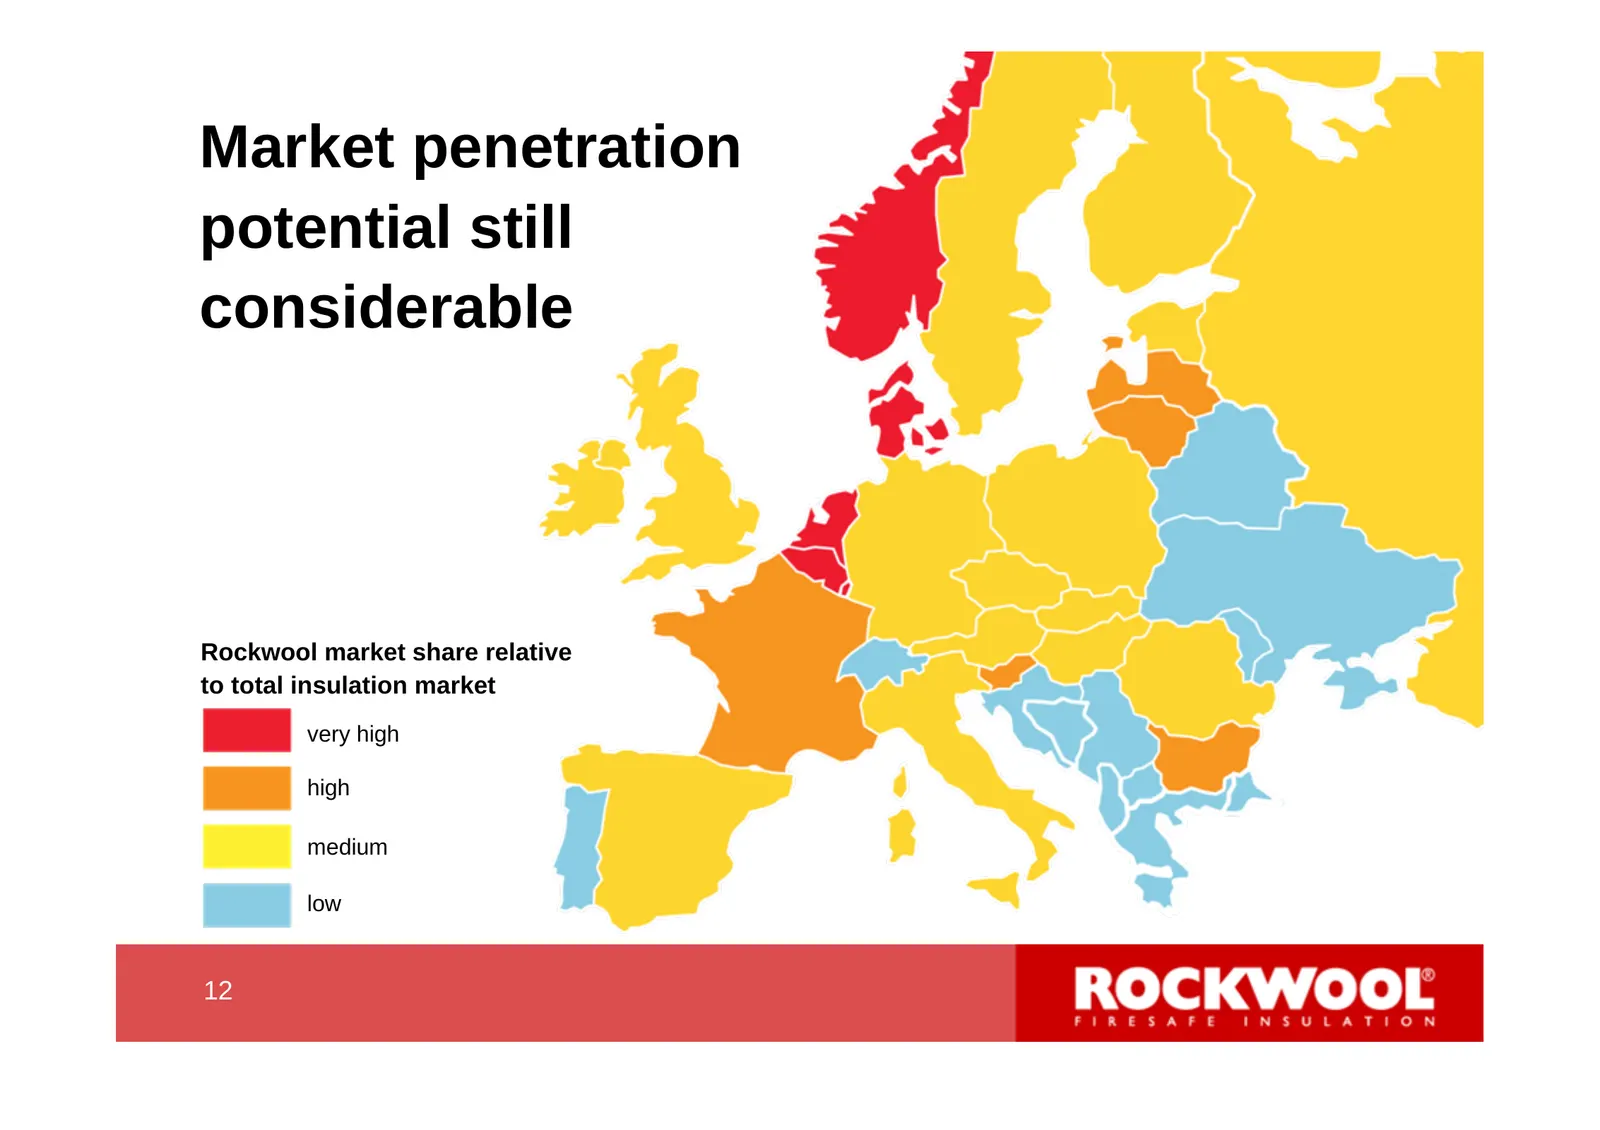
Market penetration potential still considerable Rockwool market share relative to total insulation market very high high medium low 12 12
Slide 13: Product properties and market segments
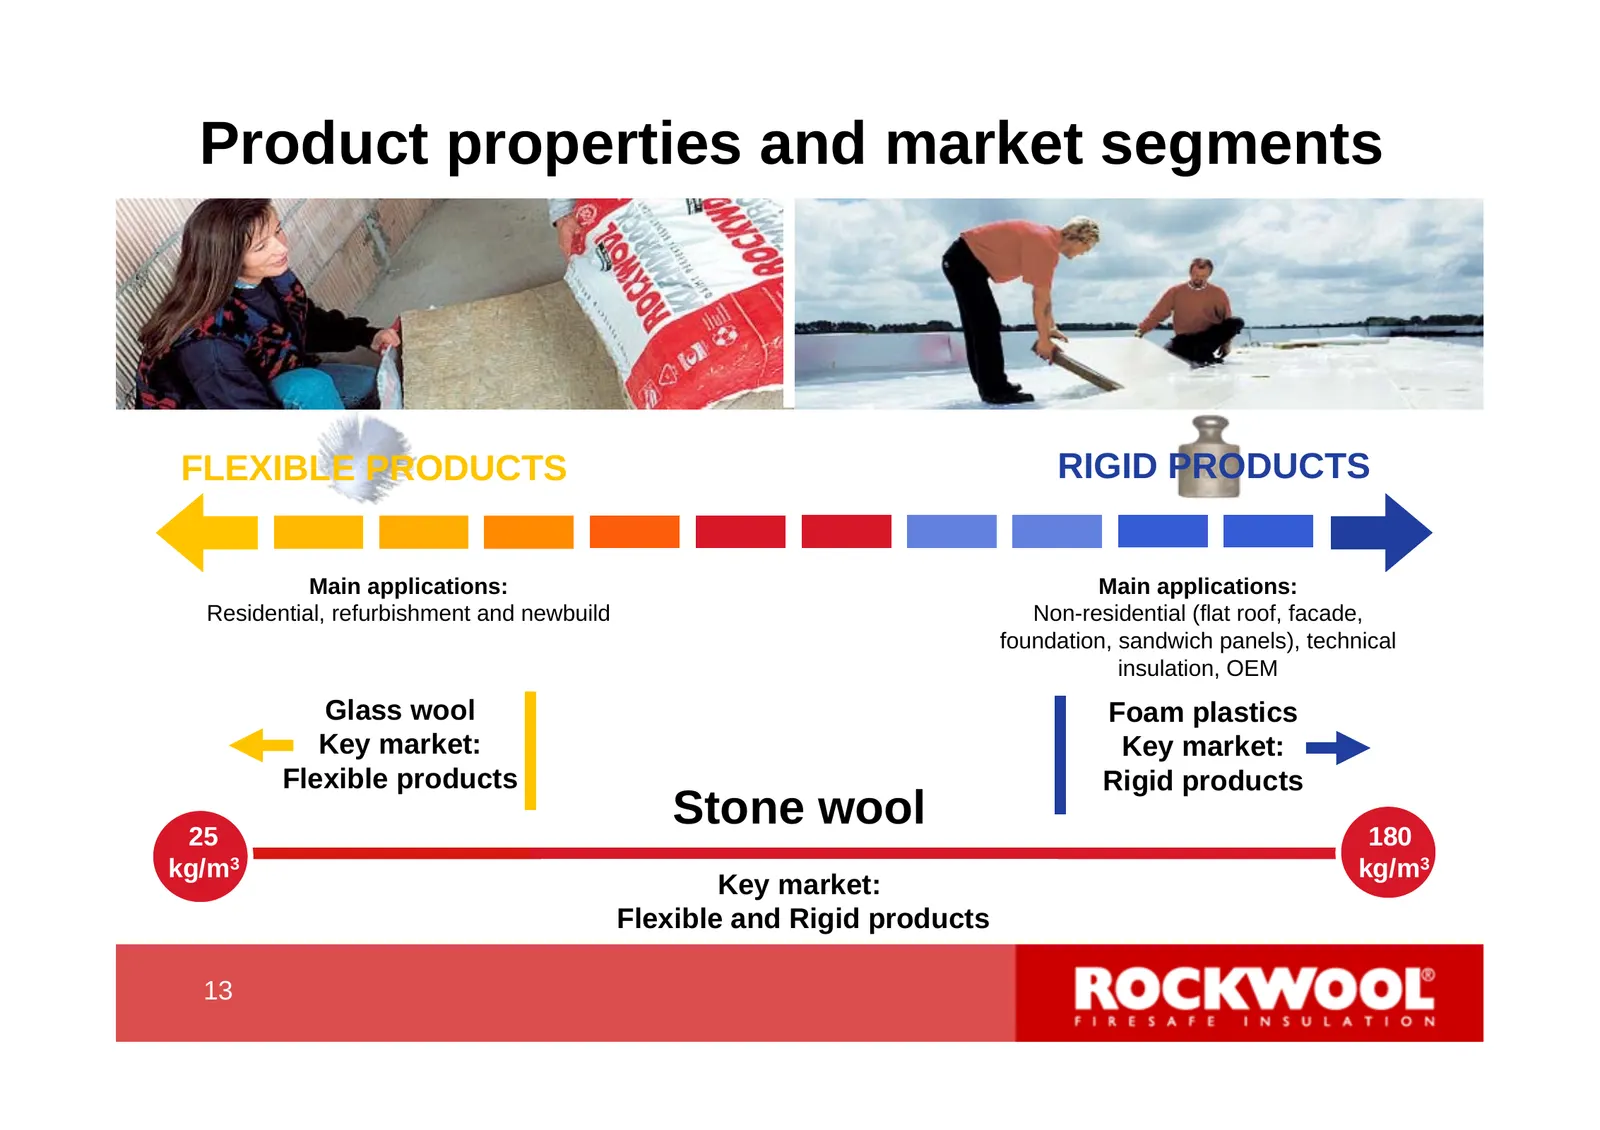
Product properties and market segments FLEXIBLE PRODUCTS RIGID PRODUCTS Main applications: Main applications: Residential, refurbishment and newbuild Non-residential (flat roof, facade, foundation, sandwich panels), technical insulation, OEM Glass wool Foam plastics Key market: Key market: Flexible
Slide 14: Product properties - Insulation
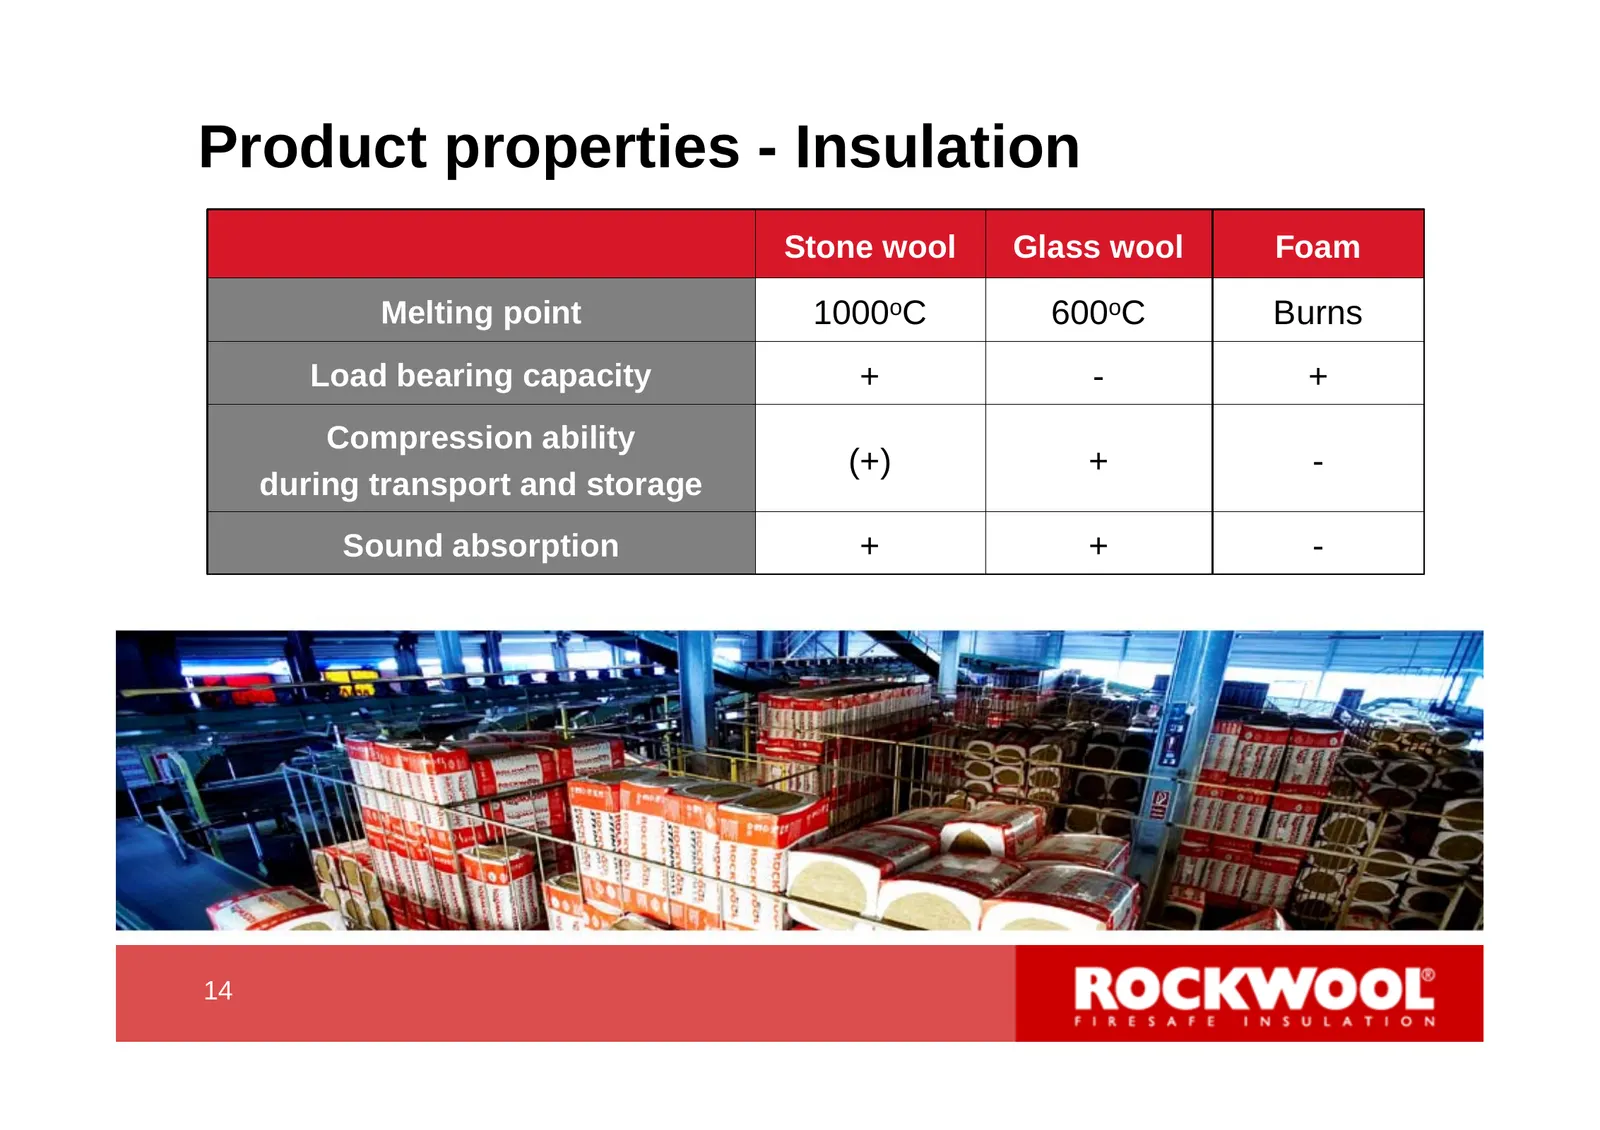
Product properties - Insulation Stone wool Glass wool Foam Melting point 1000oC 600oC Burns Load bearing capacity + - + Compression ability (+) + - during transport and storage Sound absorption + + - 14 14
Slide 15: European insulation market
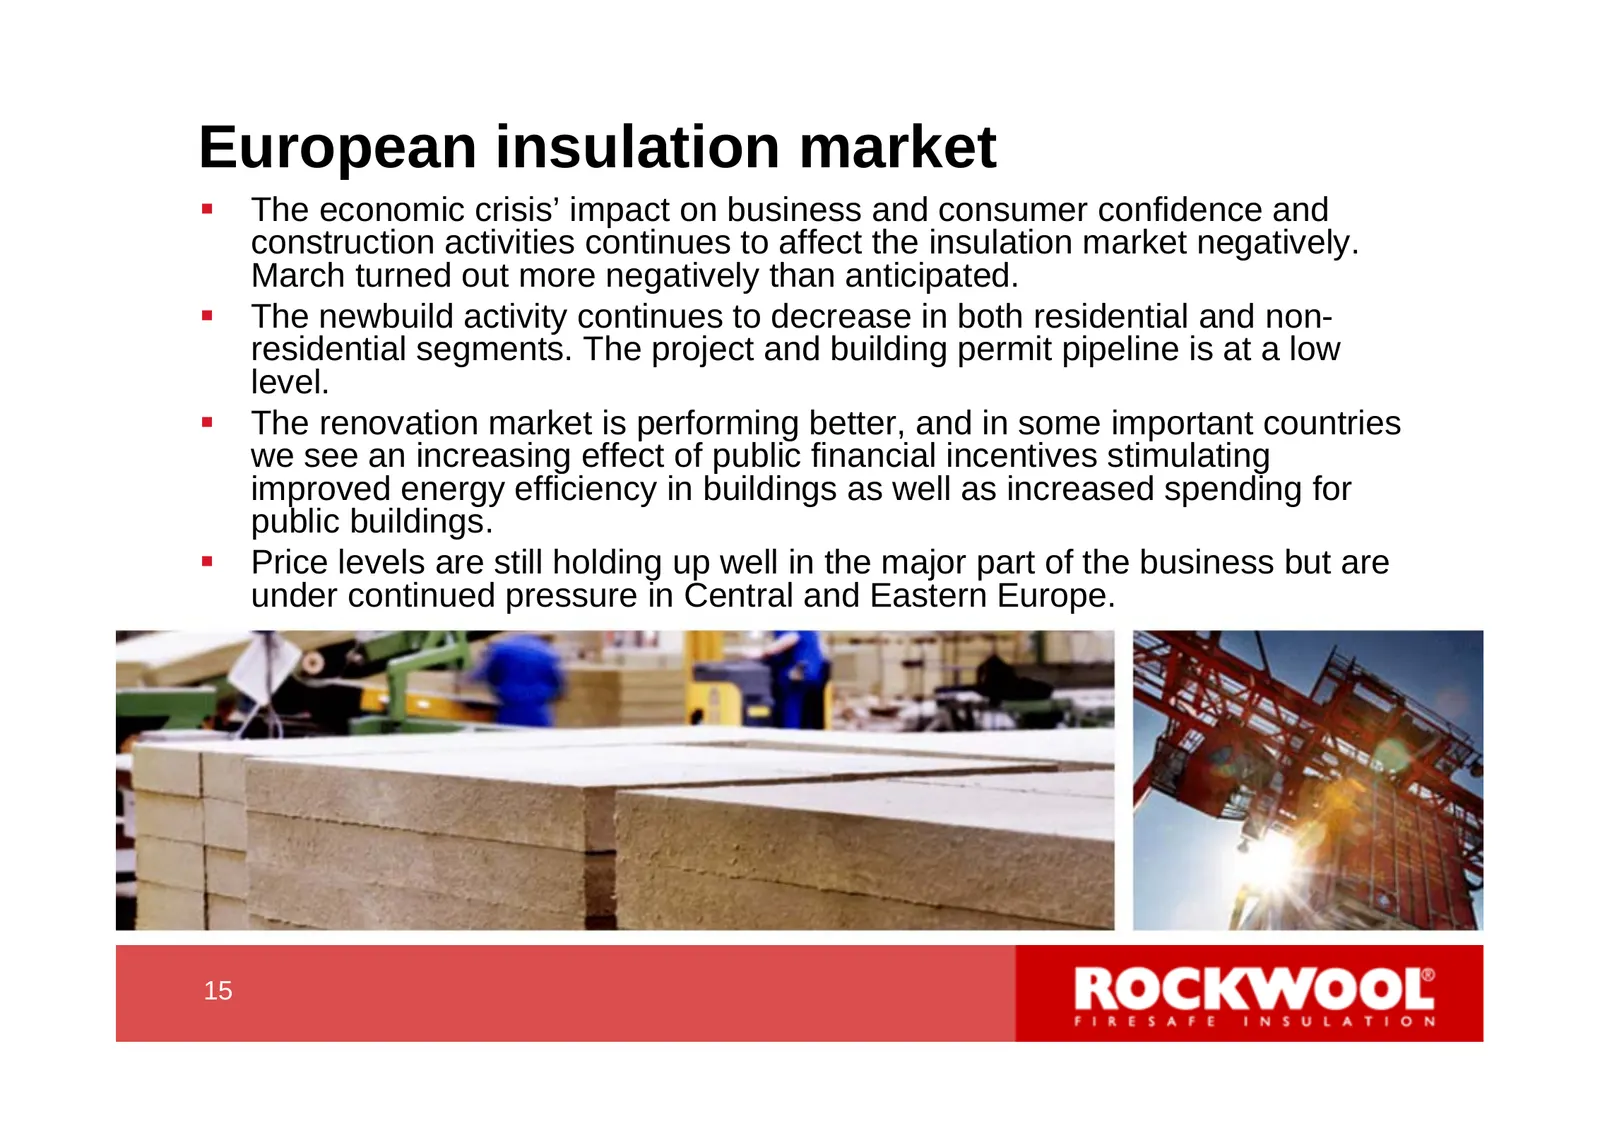
European insulation market The economic crisis’ impact on business and consumer confidence and construction activities continues to affect the insulation market negatively. March turned out more negatively than anticipated. The newbuild activity continues to decrease in both residential and non-
Slide 16: Construction region 1: The Anglo-Saxon downturn
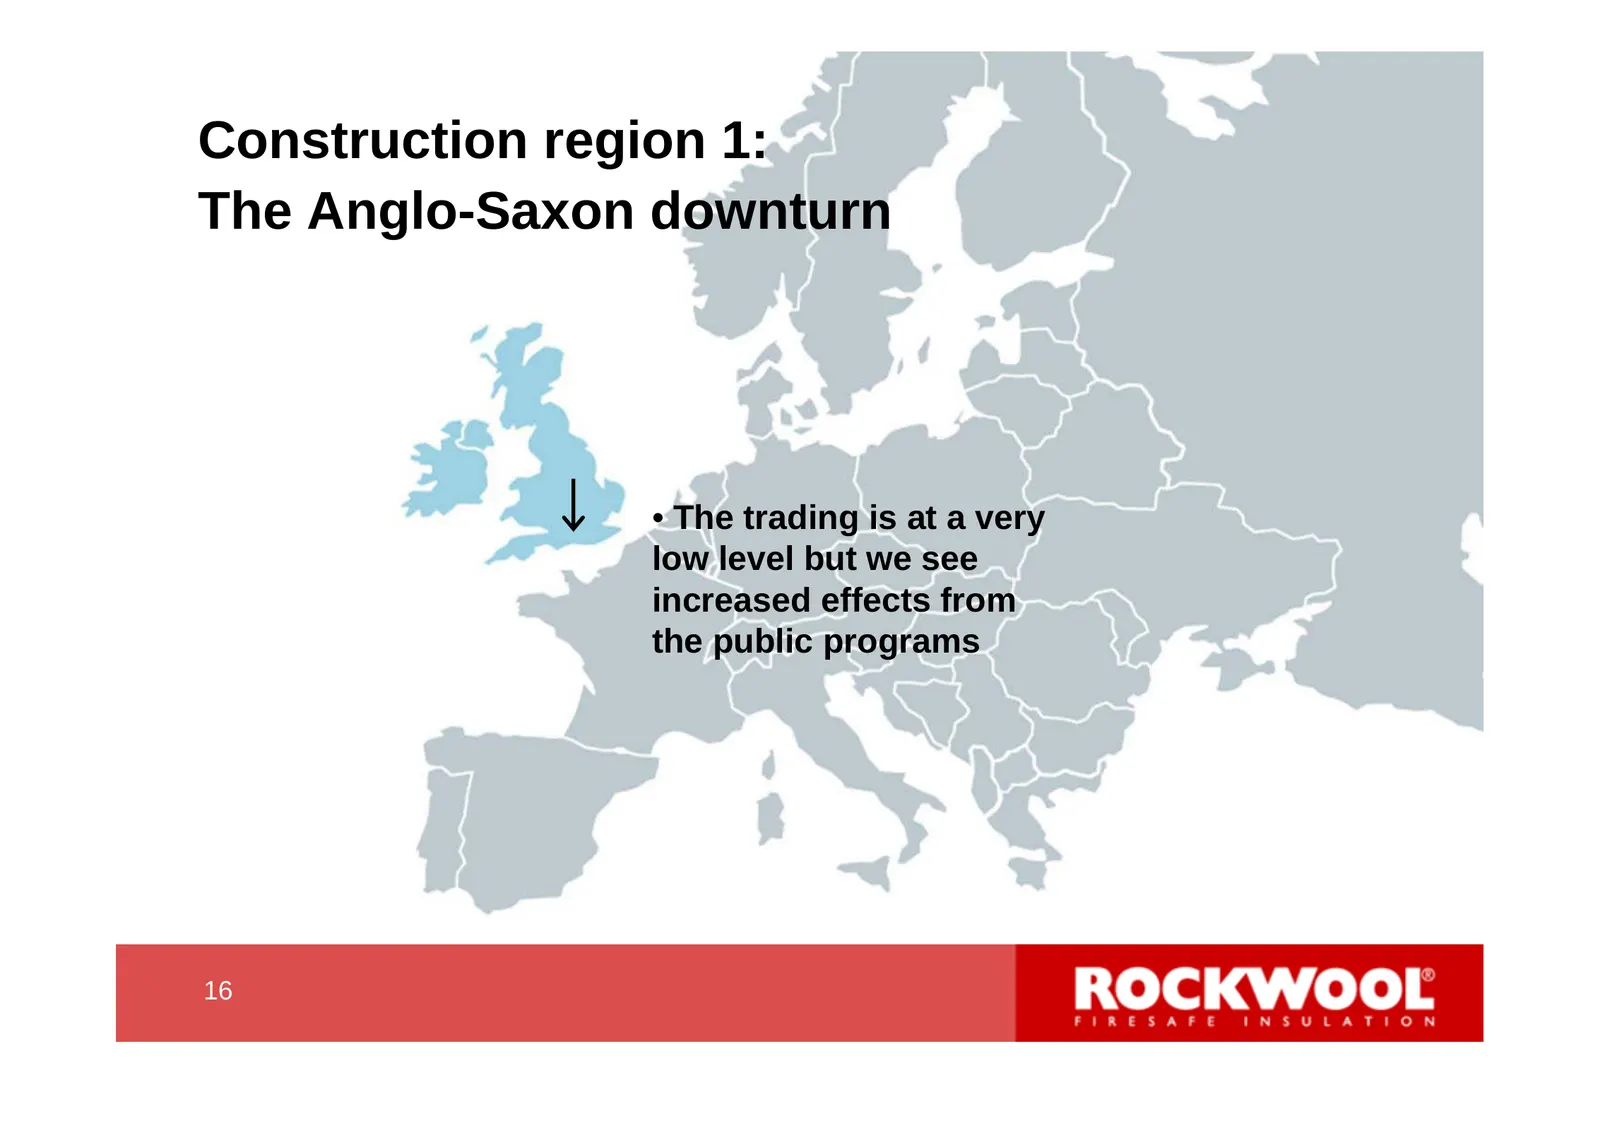
Construction region 1: The Anglo-Saxon downturn • The trading is at a very low level but we see increased effects from the public programs 16 16
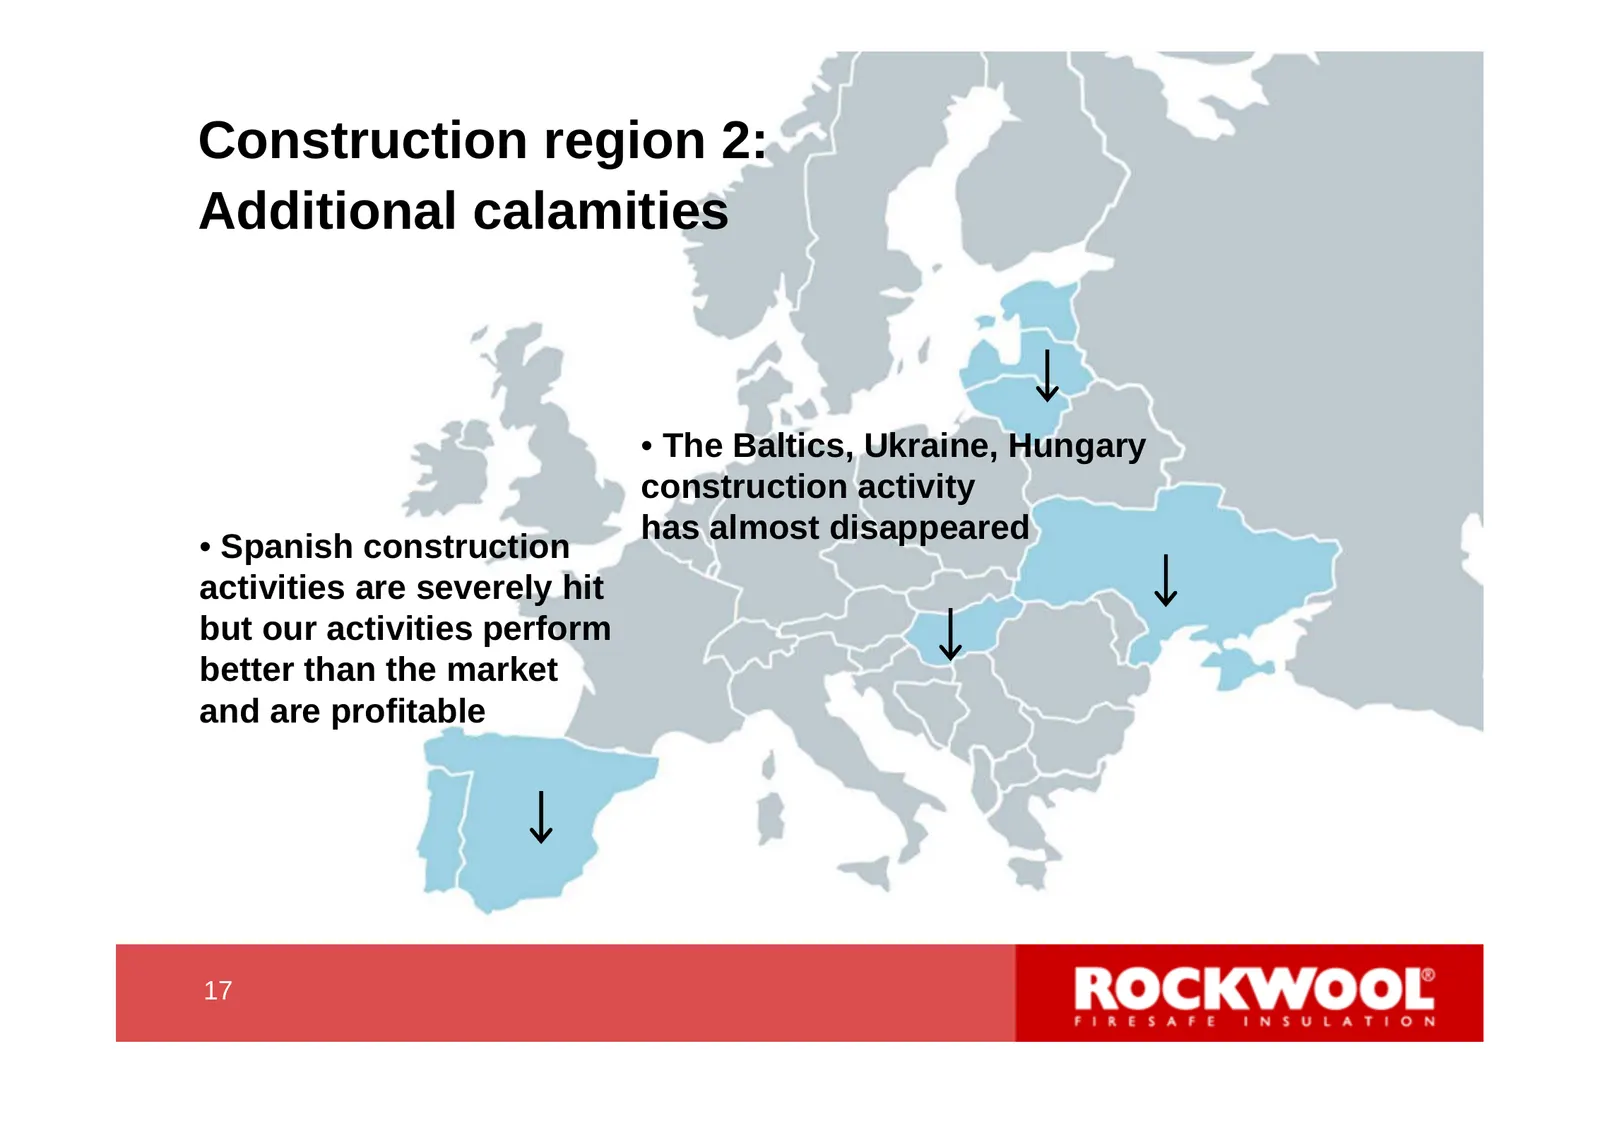
Slide 17: Construction region 2: Additional calamities
Construction region 2: Additional calamities • The Baltics, Ukraine, Hungary construction activity has almost disappeared • Spanish construction activities are severely hit but our activities perform better than the market and are profitable 17 17
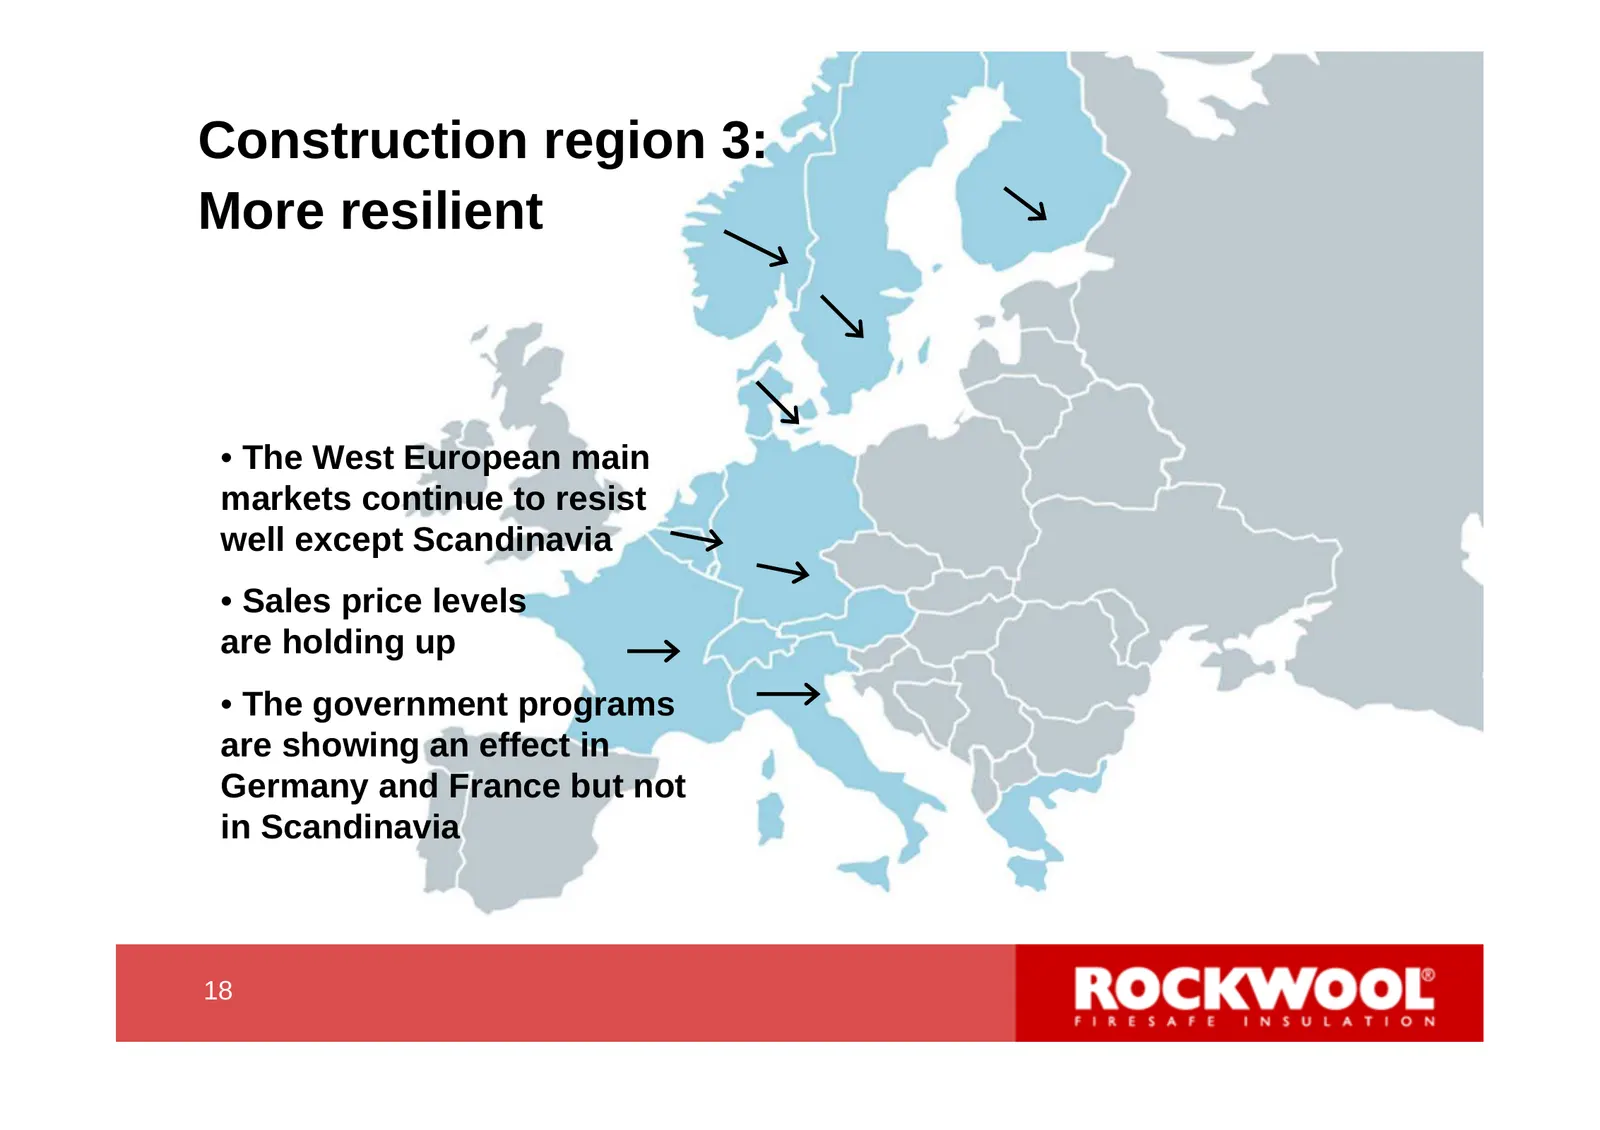
Slide 18: Construction region 3: More resilient
Construction region 3: More resilient • The West European main markets continue to resist well except Scandinavia • Sales price levels are holding up • The government programs are showing an effect in Germany and France but not in Scandinavia 18 18
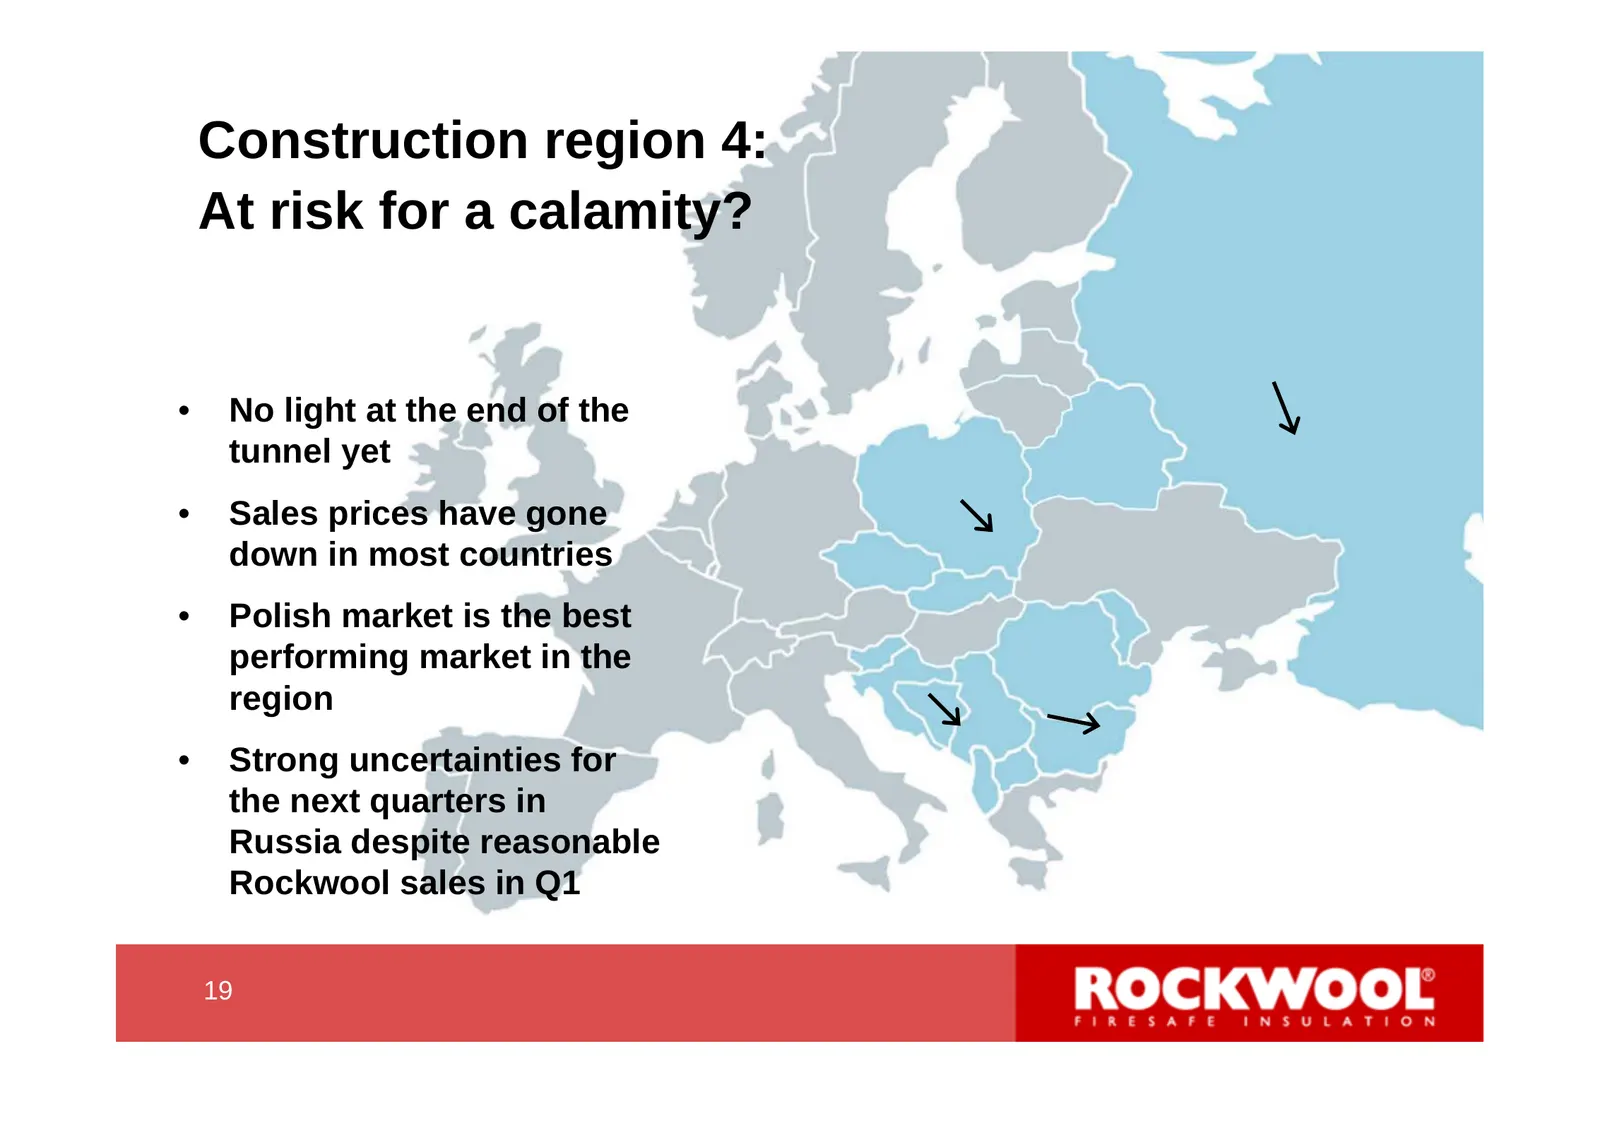
Slide 19: Construction region 4: At risk for a calamity?
Construction region 4: At risk for a calamity? • No light at the end of the tunnel yet • Sales prices have gone down in most countries • Polish market is the best performing market in the region • Strong uncertainties for the next quarters in Russia despite reasonable Rockwool sales in Q1 19 19
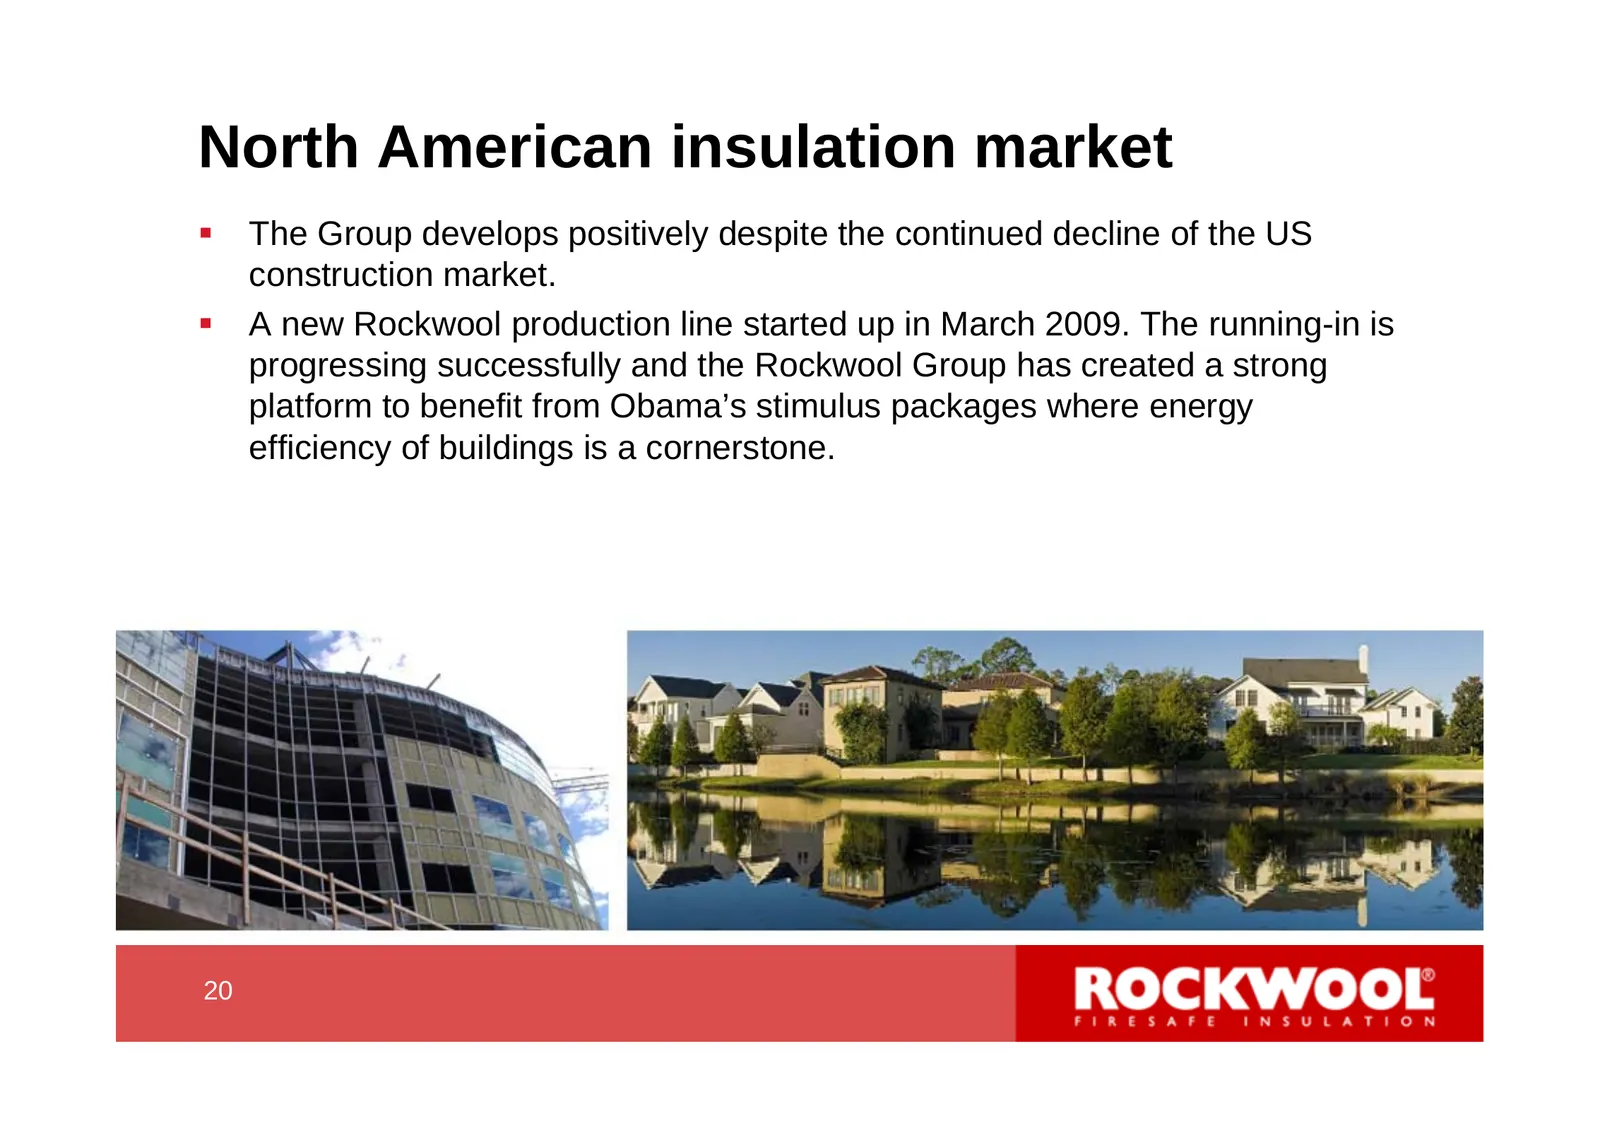
Slide 20: North American insulation market
North American insulation market The Group develops positively despite the continued decline of the US construction market. A new Rockwool production line started up in March 2009. The running-in is progressing successfully and the Rockwool Group has created a strong platform to benefit from Oba
Slide 21: Systems Division
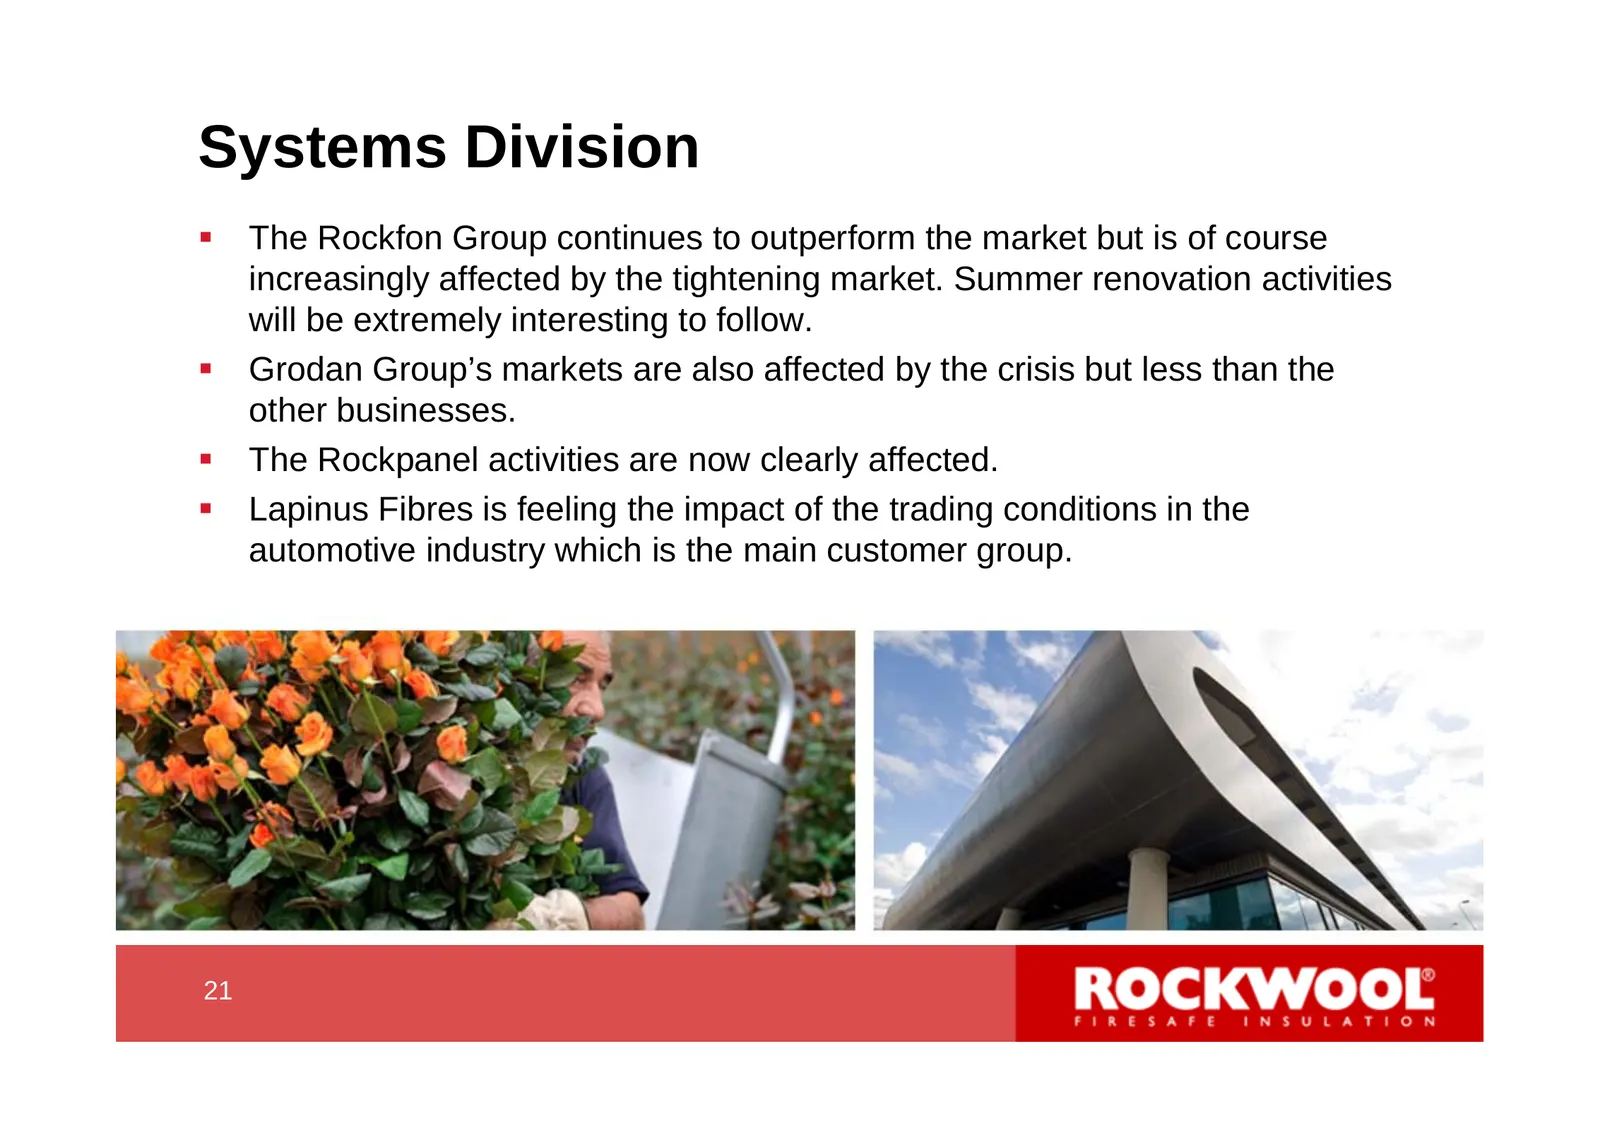
Systems Division The Rockfon Group continues to outperform the market but is of course increasingly affected by the tightening market. Summer renovation activities will be extremely interesting to follow. Grodan Group’s markets are also affected by the crisis but less than the other businesses.
Slide 22: The industry's response to the crisis
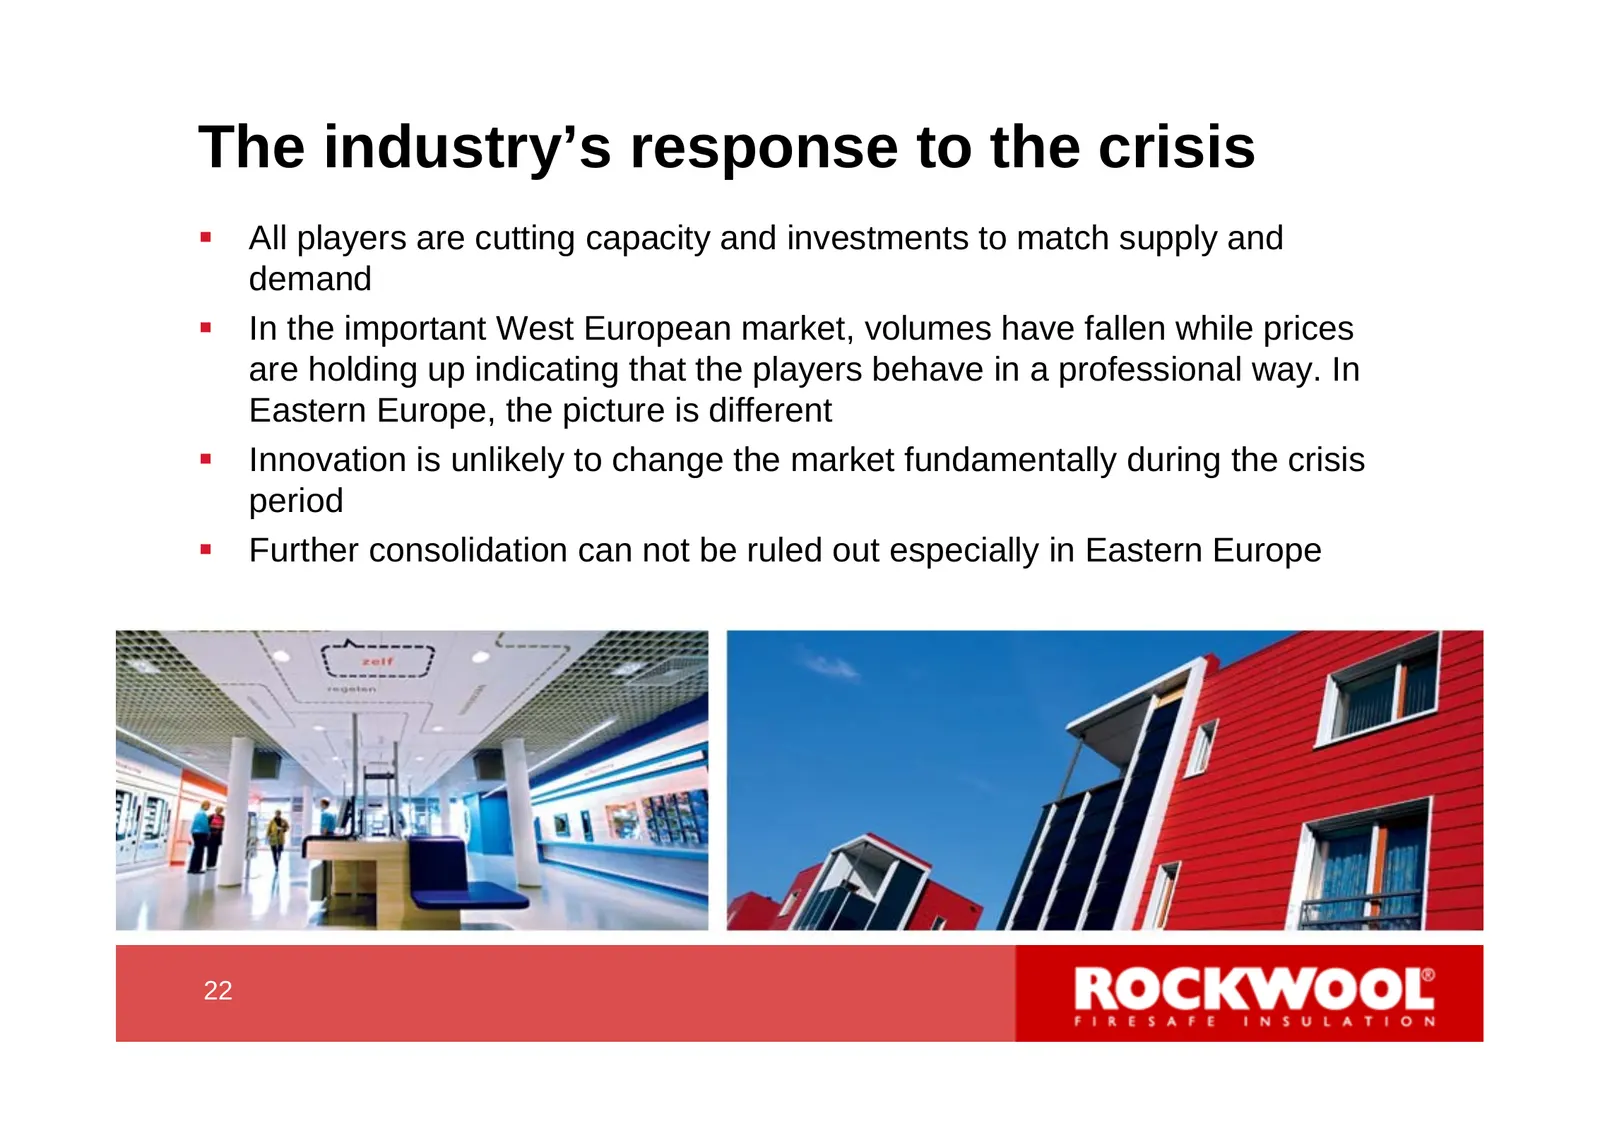
The industry’s response to the crisis All players are cutting capacity and investments to match supply and demand In the important West European market, volumes have fallen while prices are holding up indicating that the players behave in a professional way. In Eastern Europe, the picture is dif
Slide 23: Energy and climate as growth drivers
Energy and climate as growth drivers 23 23
Slide 24: The Energy Efficiency train will not slow down
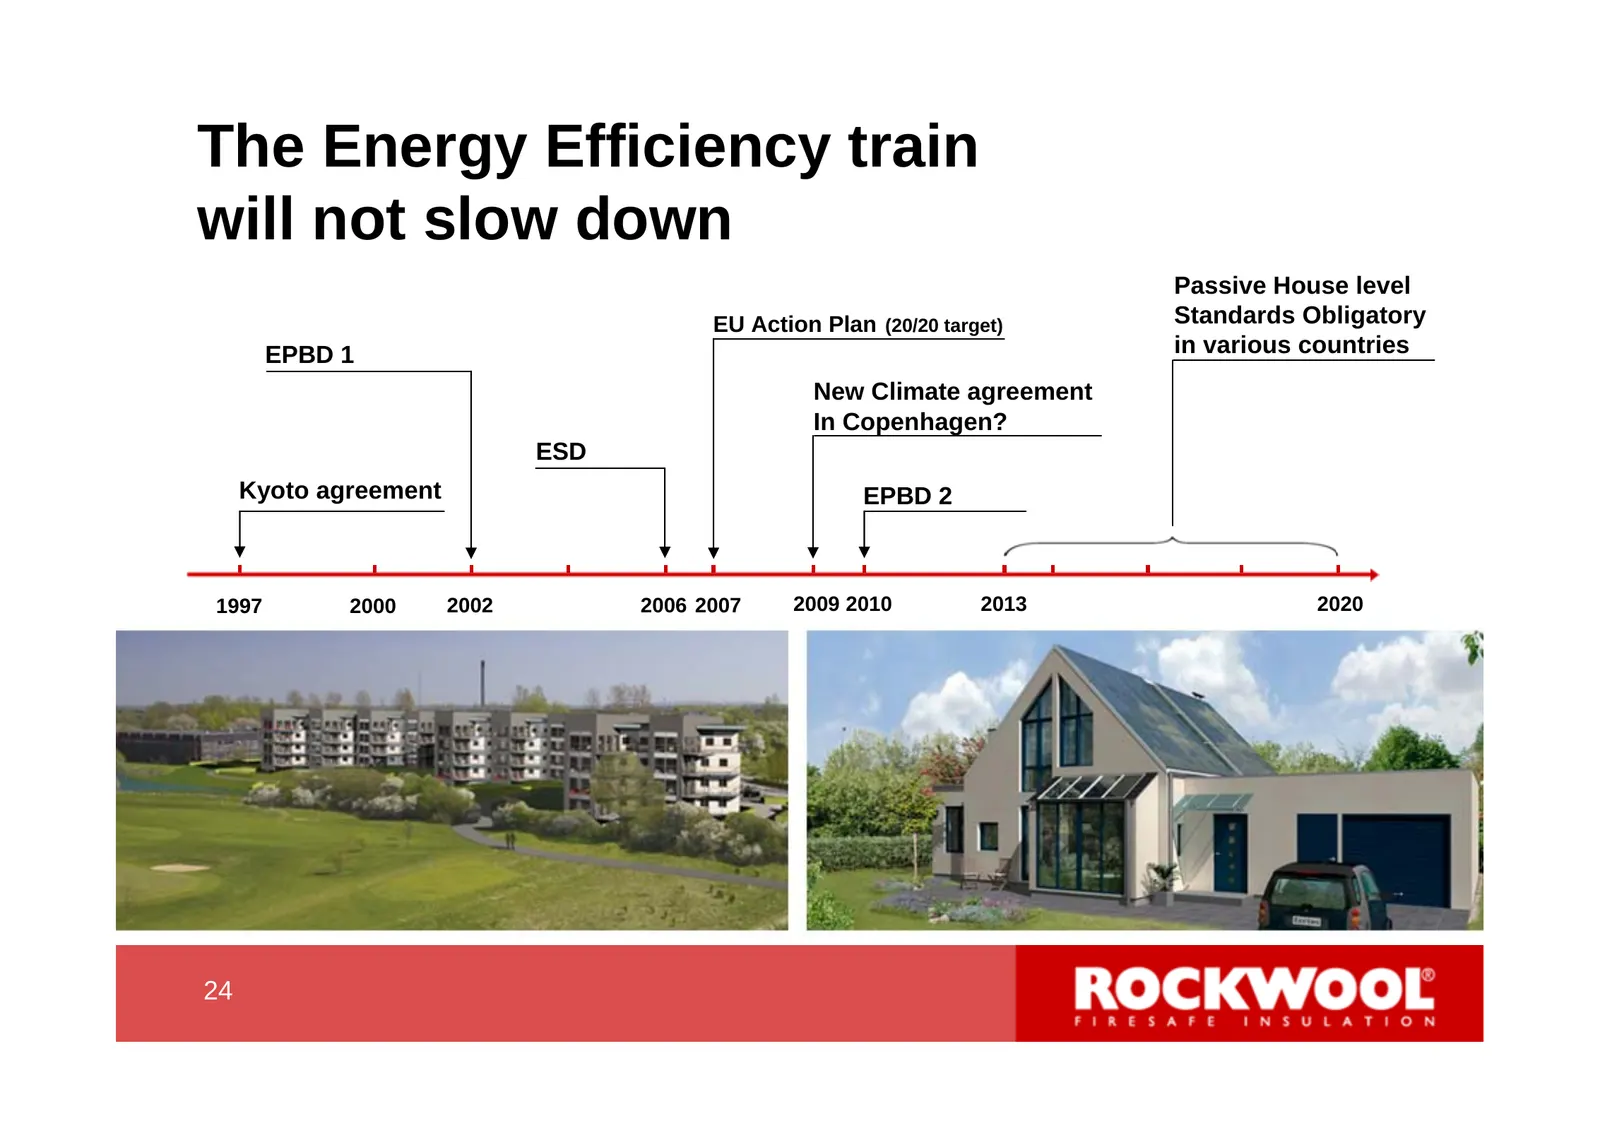
The Energy Efficiency train will not slow down Passive House level EU Action Plan (20/20 target) Standards Obligatory EPBD 1 in various countries New Climate agreement In Copenhagen? ESD Kyoto agreement EPBD 2 1997 2000 2002 2006 2007 2009 2010 2013 2020 24 24
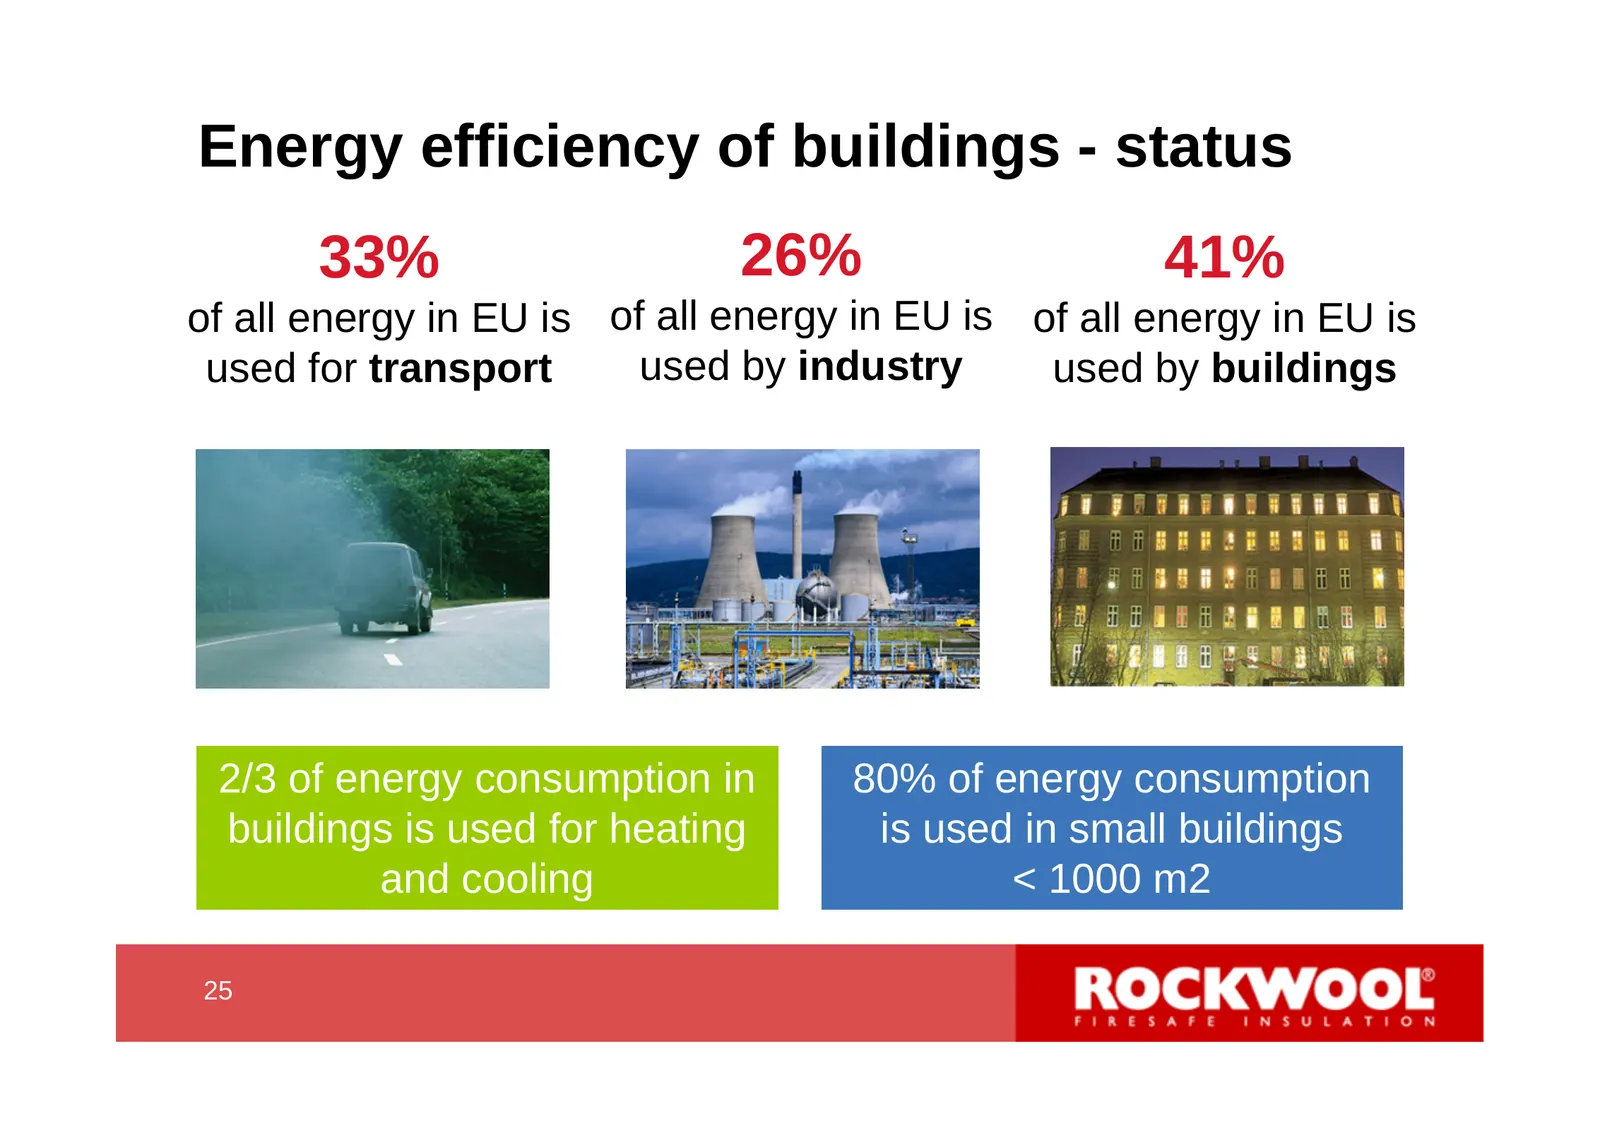
Slide 25: Energy efficiency of buildings - status
Energy efficiency of buildings - status 33% 26% 41% of all energy in EU is of all energy in EU is of all energy in EU is used for transport used by industry used by buildings 2/3 of energy consumption in 80% of energy consumption buildings is used for heating is used in small buildings and cooling <
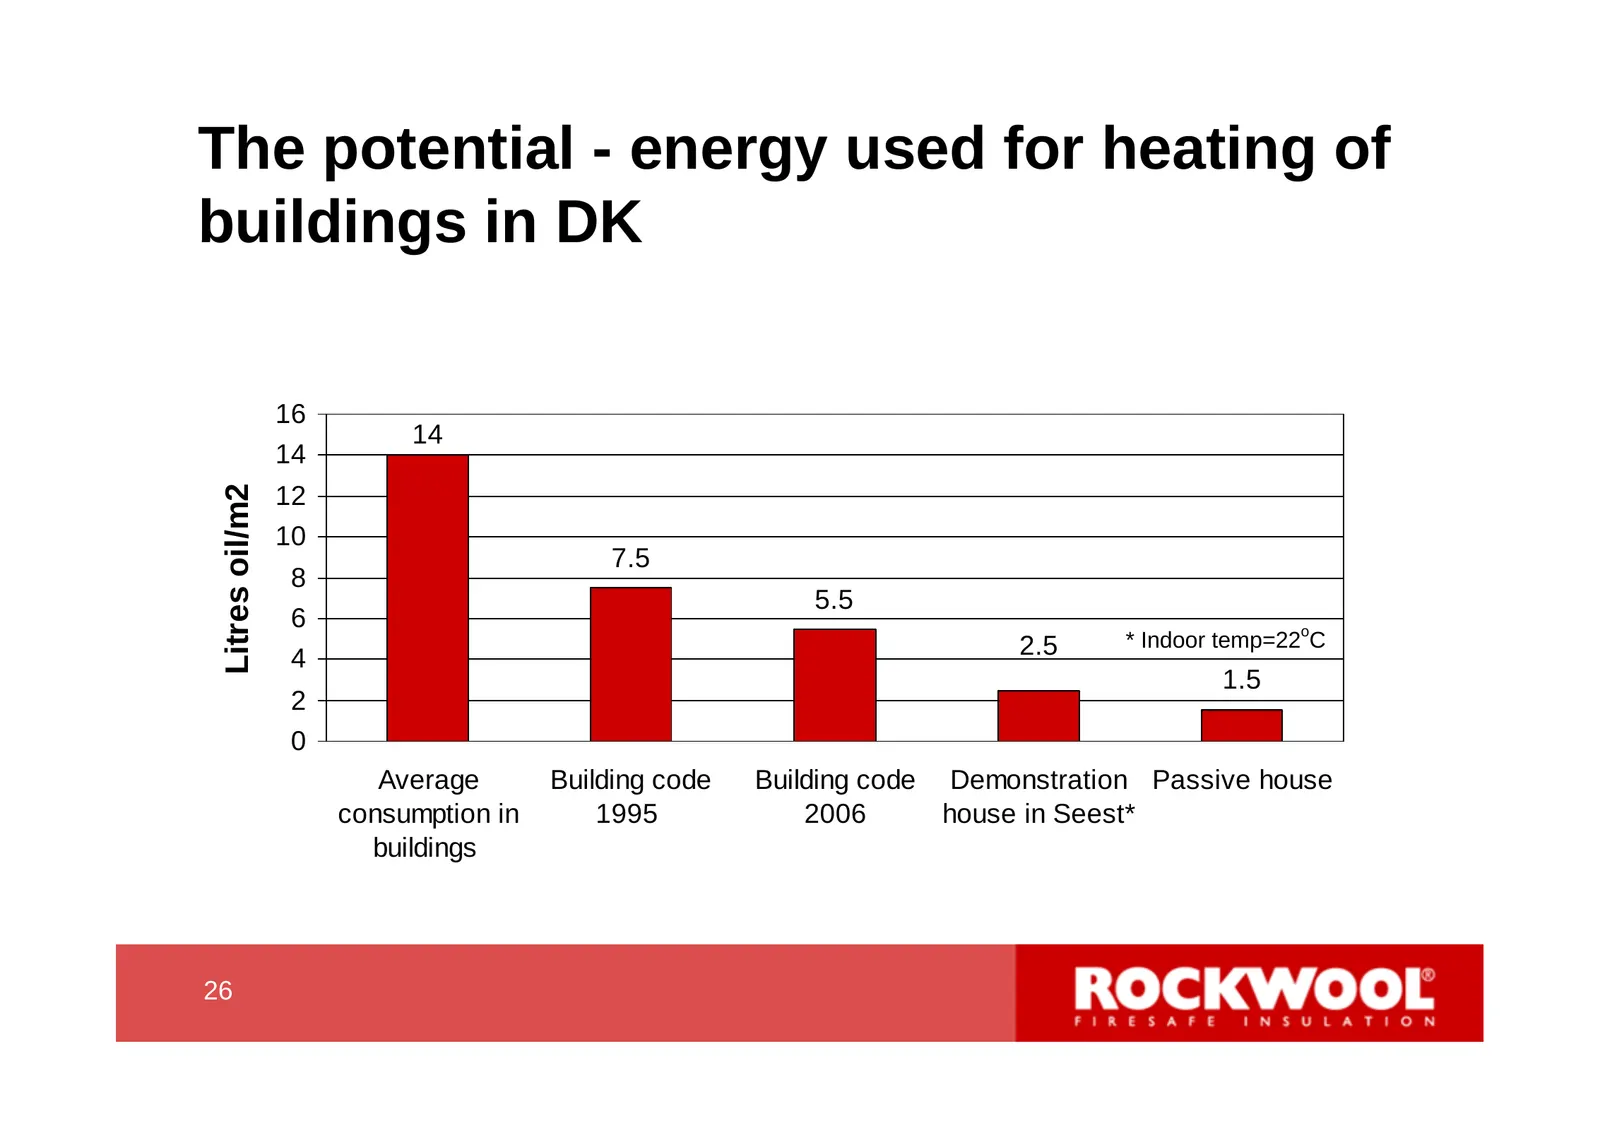
Slide 26: Potential - energy used for heating of buildings in DK
The potential - energy used for heating of buildings in DK 16 14 14 Litres oil/m2 12 10 7.5 8 5.5 6 2.5 * Indoor temp=22oC 4 1.5 2 0 Average Building code Building code Demonstration Passive house consumption in 1995 2006 house in Seest* buildings 26 26
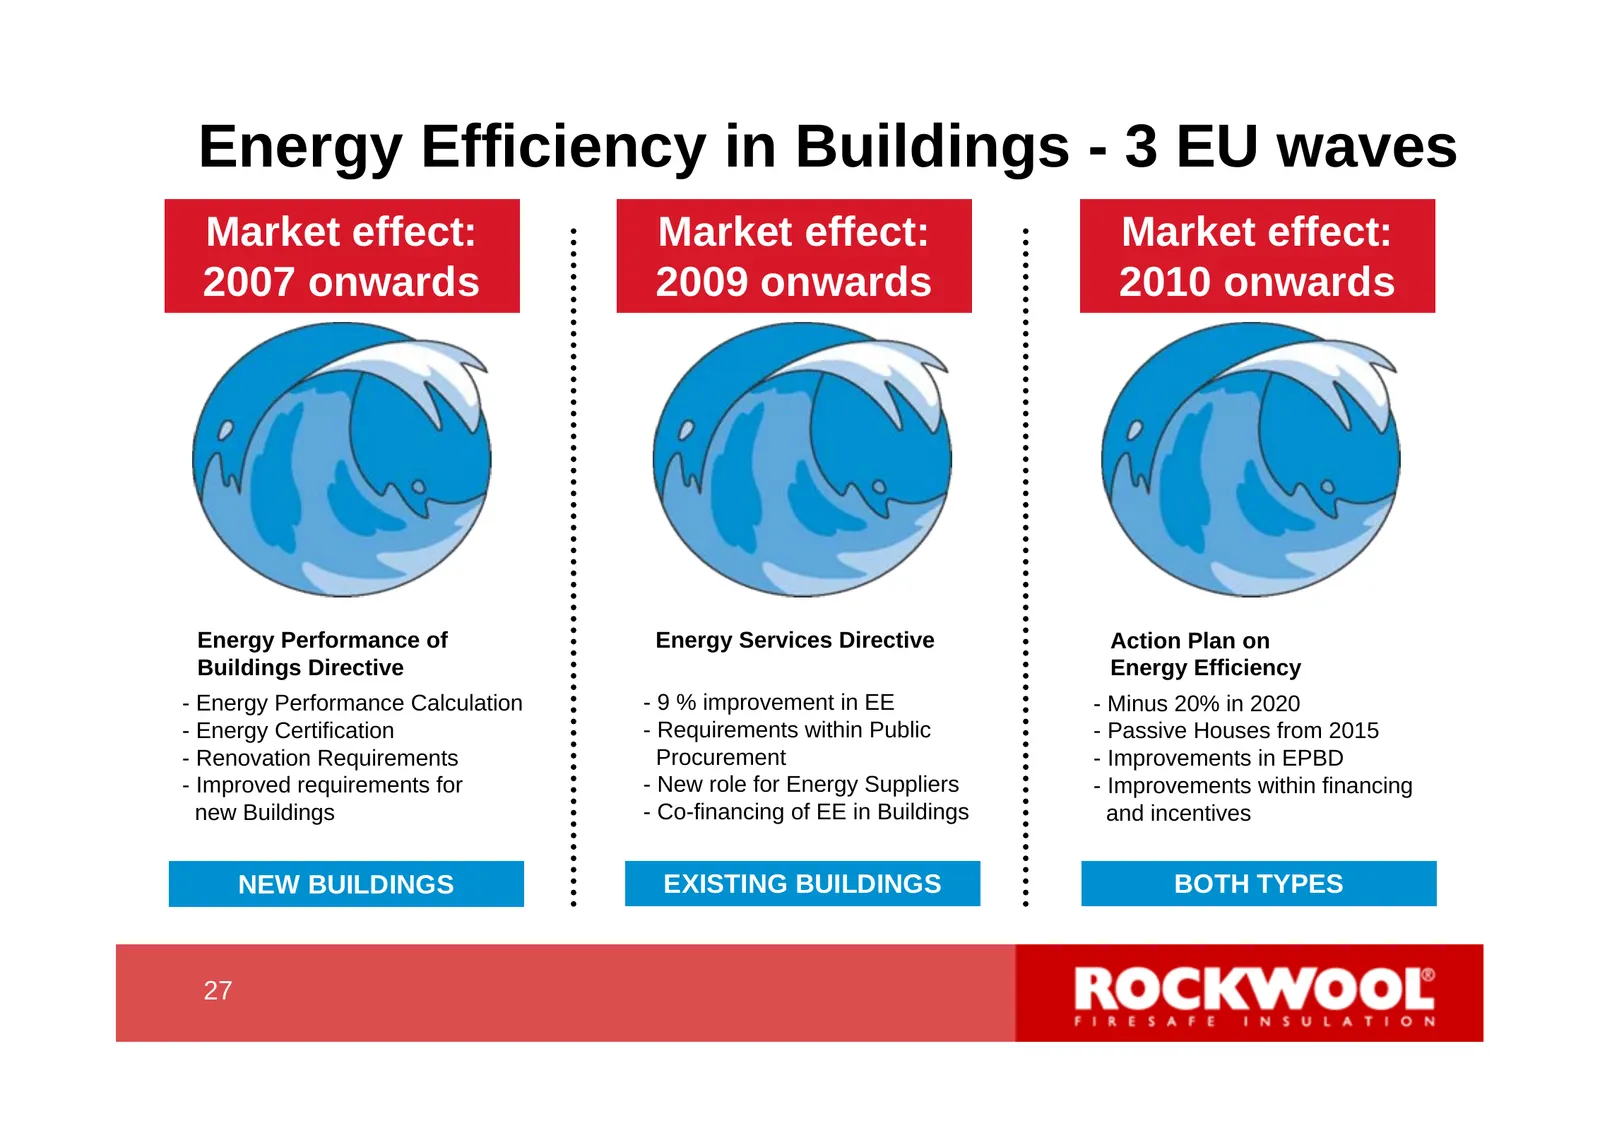
Slide 27: Energy Efficiency in Buildings - 3 EU waves
Energy Efficiency in Buildings - 3 EU waves Market effect: Market effect: Market effect: 2007 onwards 2009 onwards 2010 onwards Energy Performance of Energy Services Directive Action Plan on Buildings Directive Energy Efficiency - Energy Performance Calculation - 9 % improvement in EE - Minus 20% in
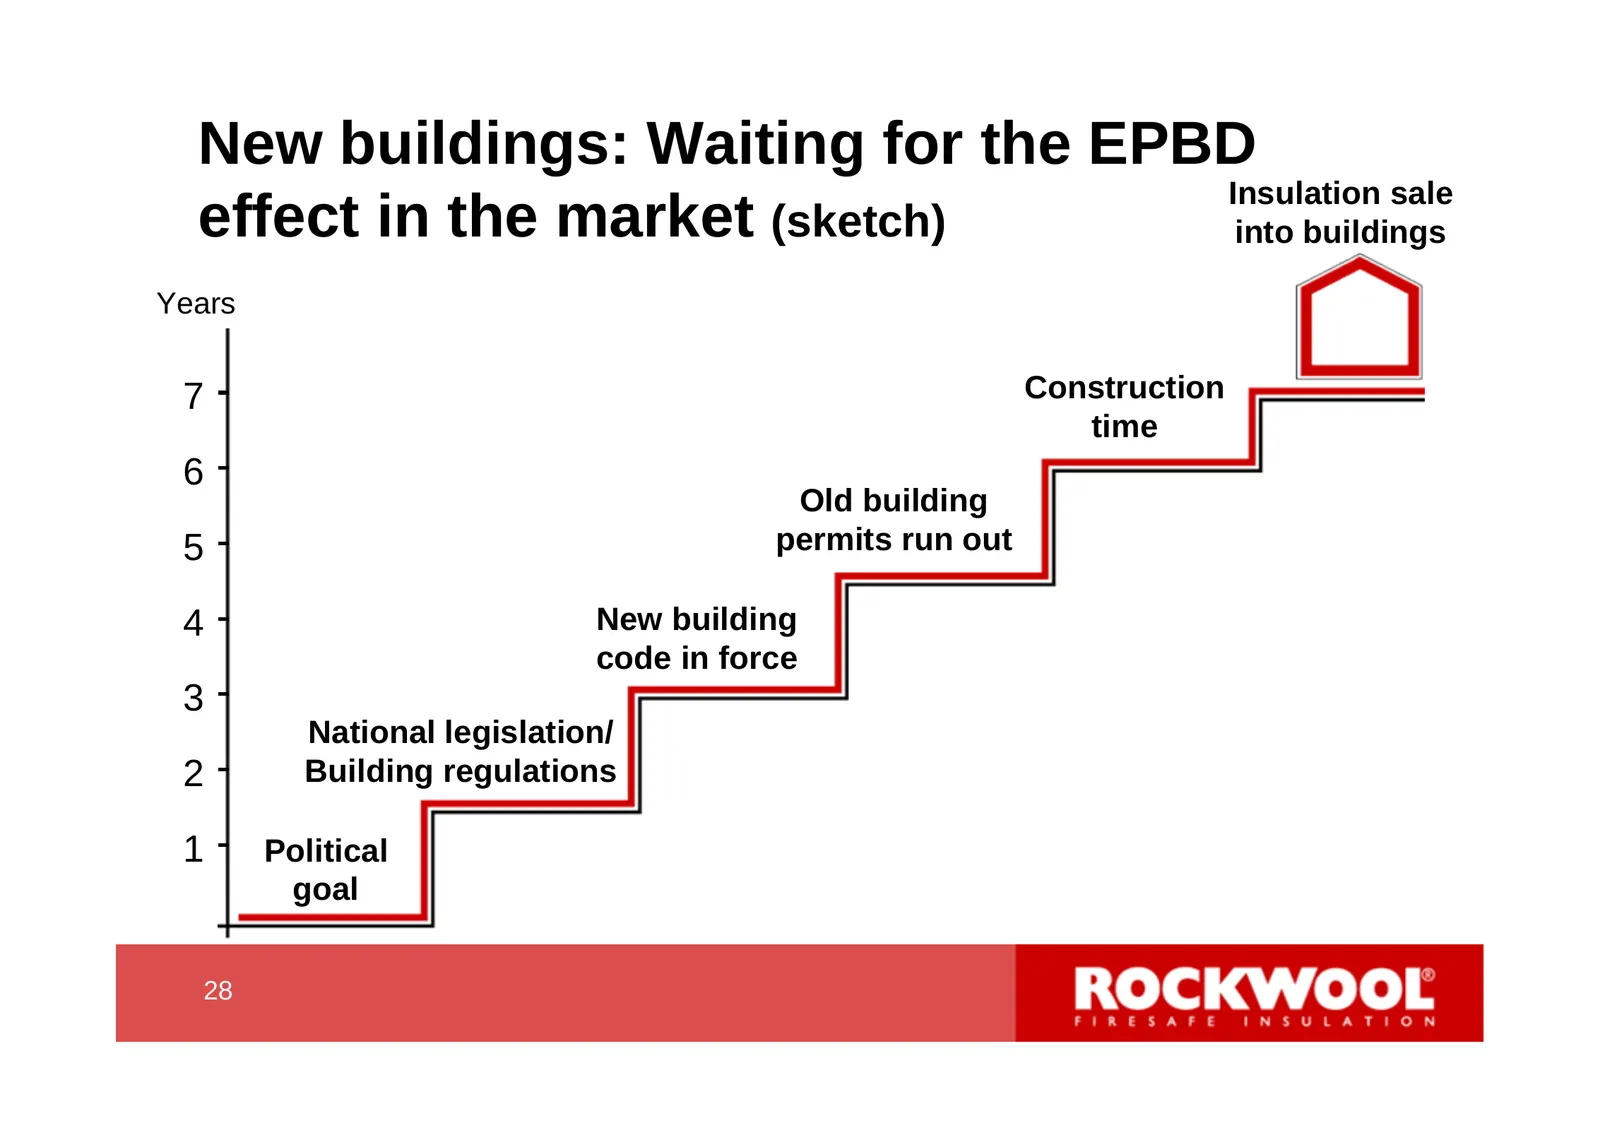
Slide 28: New buildings: Waiting for the EPBD effect in the market
New buildings: Waiting for the EPBD Insulation sale effect in the market (sketch) into buildings Years 7 Construction time 6 Old building 5 permits run out 4 New building code in force 3 National legislation/ 2 Building regulations 1 Political goal 28 28
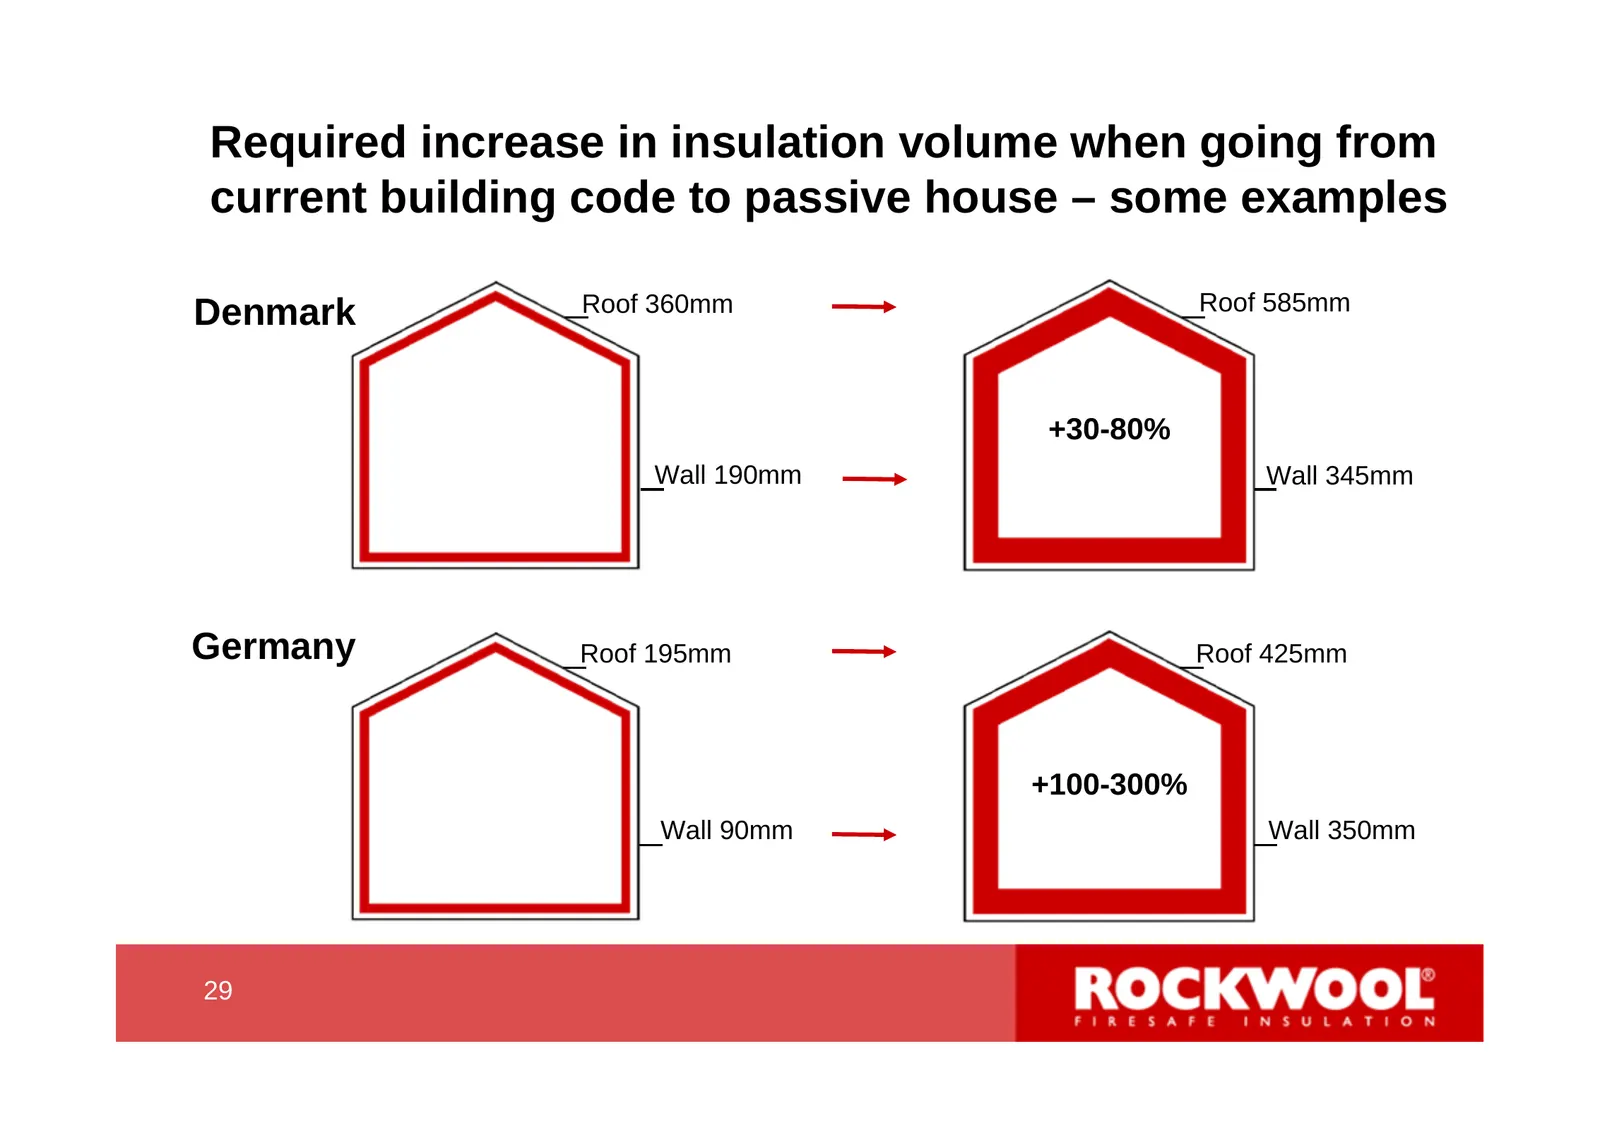
Slide 29: Required increase in insulation volume for passive house
Required increase in insulation volume when going from current building code to passive house – some examples Roof 360mm Roof 585mm Denmark +30-80% Wall 190mm Wall 345mm Germany Roof 195mm Roof 425mm +100-300% Wall 90mm Wall 350mm 29 29
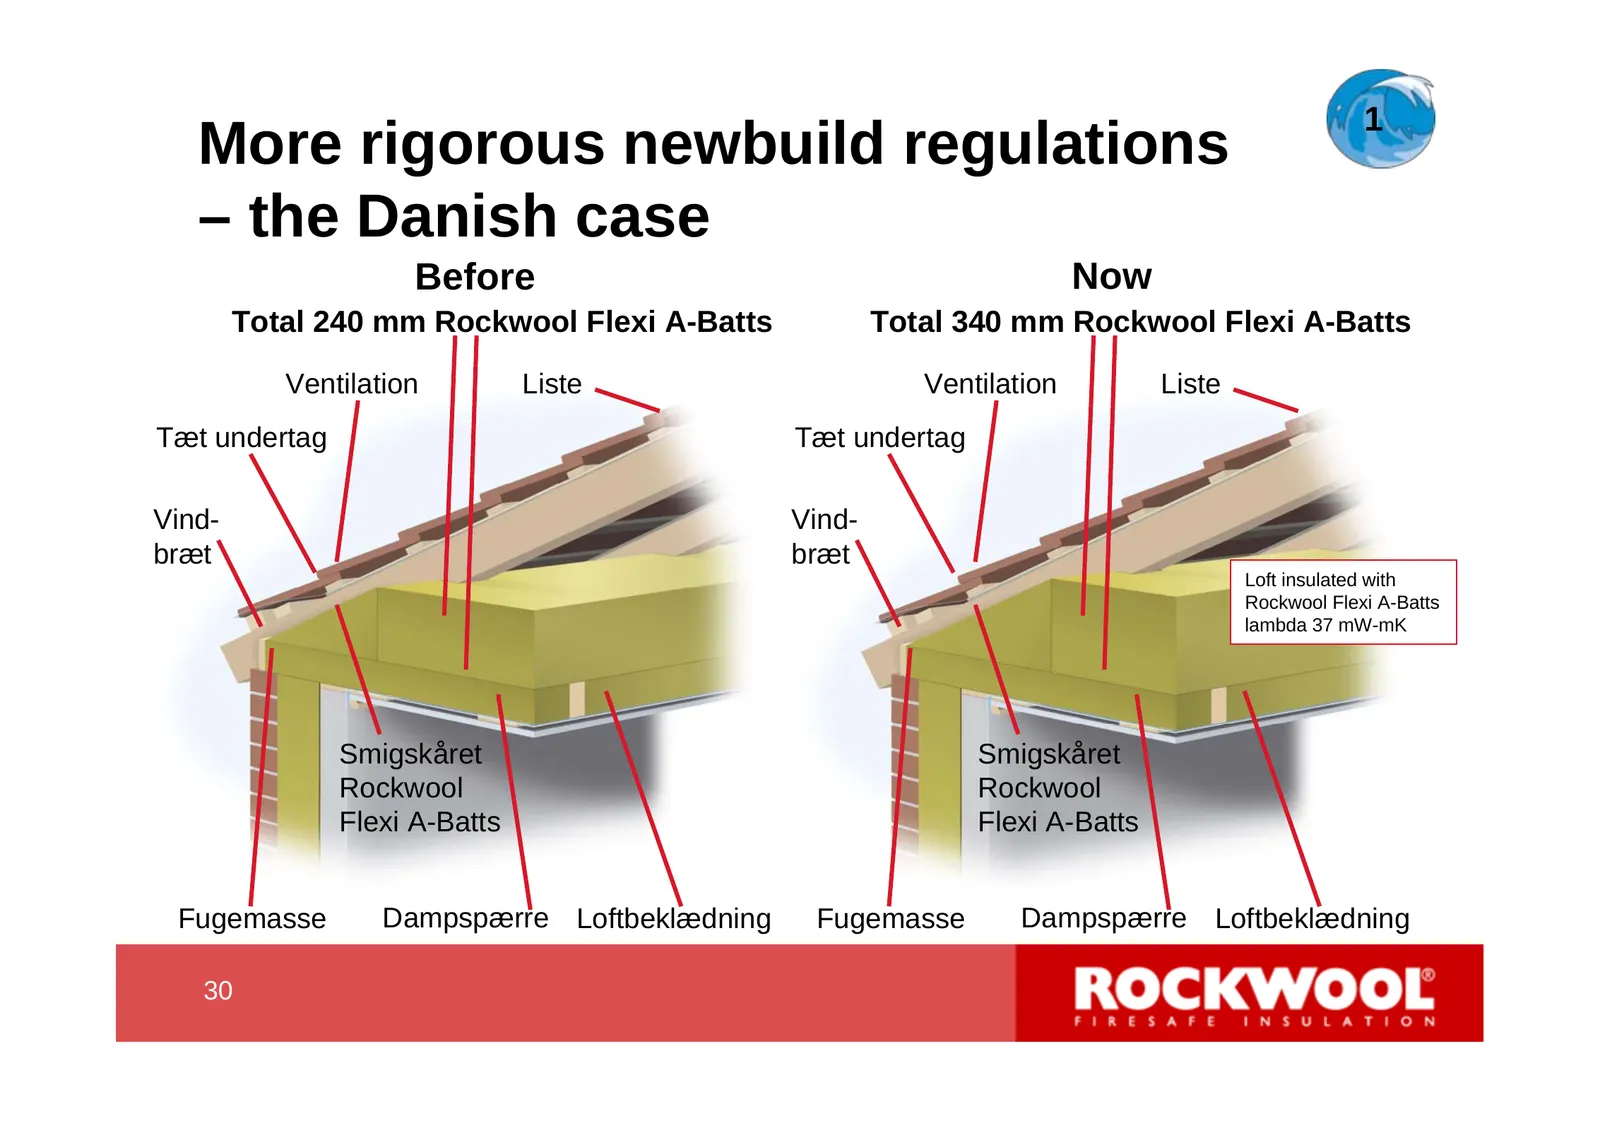
Slide 30: More rigorous newbuild regulations – the Danish case
1 More rigorous newbuild regulations – the Danish case Before Now Total 240 mm Rockwool Flexi A-Batts Total 340 mm Rockwool Flexi A-Batts Ventilation Liste Ventilation Liste Tæt undertag Tæt undertag Vind- Vind- bræt bræt Loft insulated with Rockwool Flexi A-Batts lambda 37 mW-mK Smigskåret Smigskår
Slide 31: The governmental support packages. How much will they contribute in 2009?
The governmental support packages. How much will they contribute in 2009? Economic support packages launched in most markets consisting of a combination of accelerated investments in public buildings and financial refurbishment incentives for residential buildings could start having a positive effec
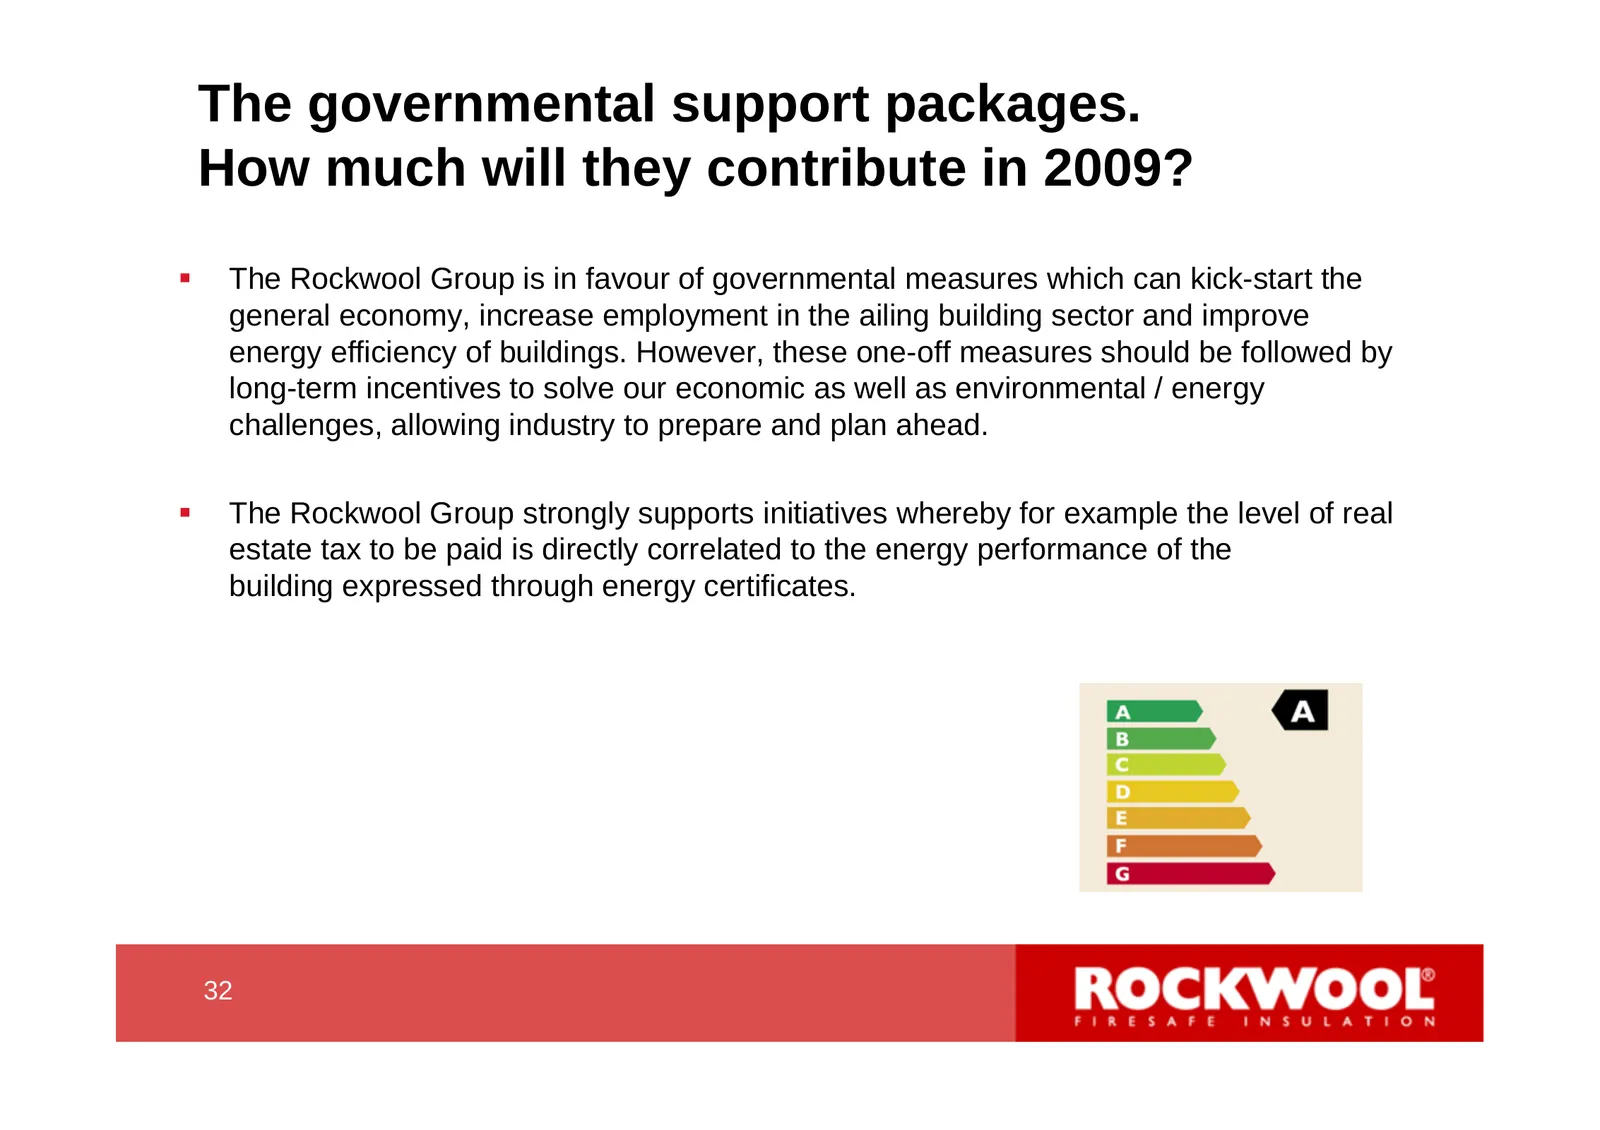
Slide 32: The governmental support packages. How much will they contribute in 2009?
The governmental support packages. How much will they contribute in 2009? The Rockwool Group is in favour of governmental measures which can kick-start the general economy, increase employment in the ailing building sector and improve energy efficiency of buildings. However, these one-off measures
Slide 33: Adapting the company
Adapting the company 33 33
Slide 34: Sizing production and organisation for the future
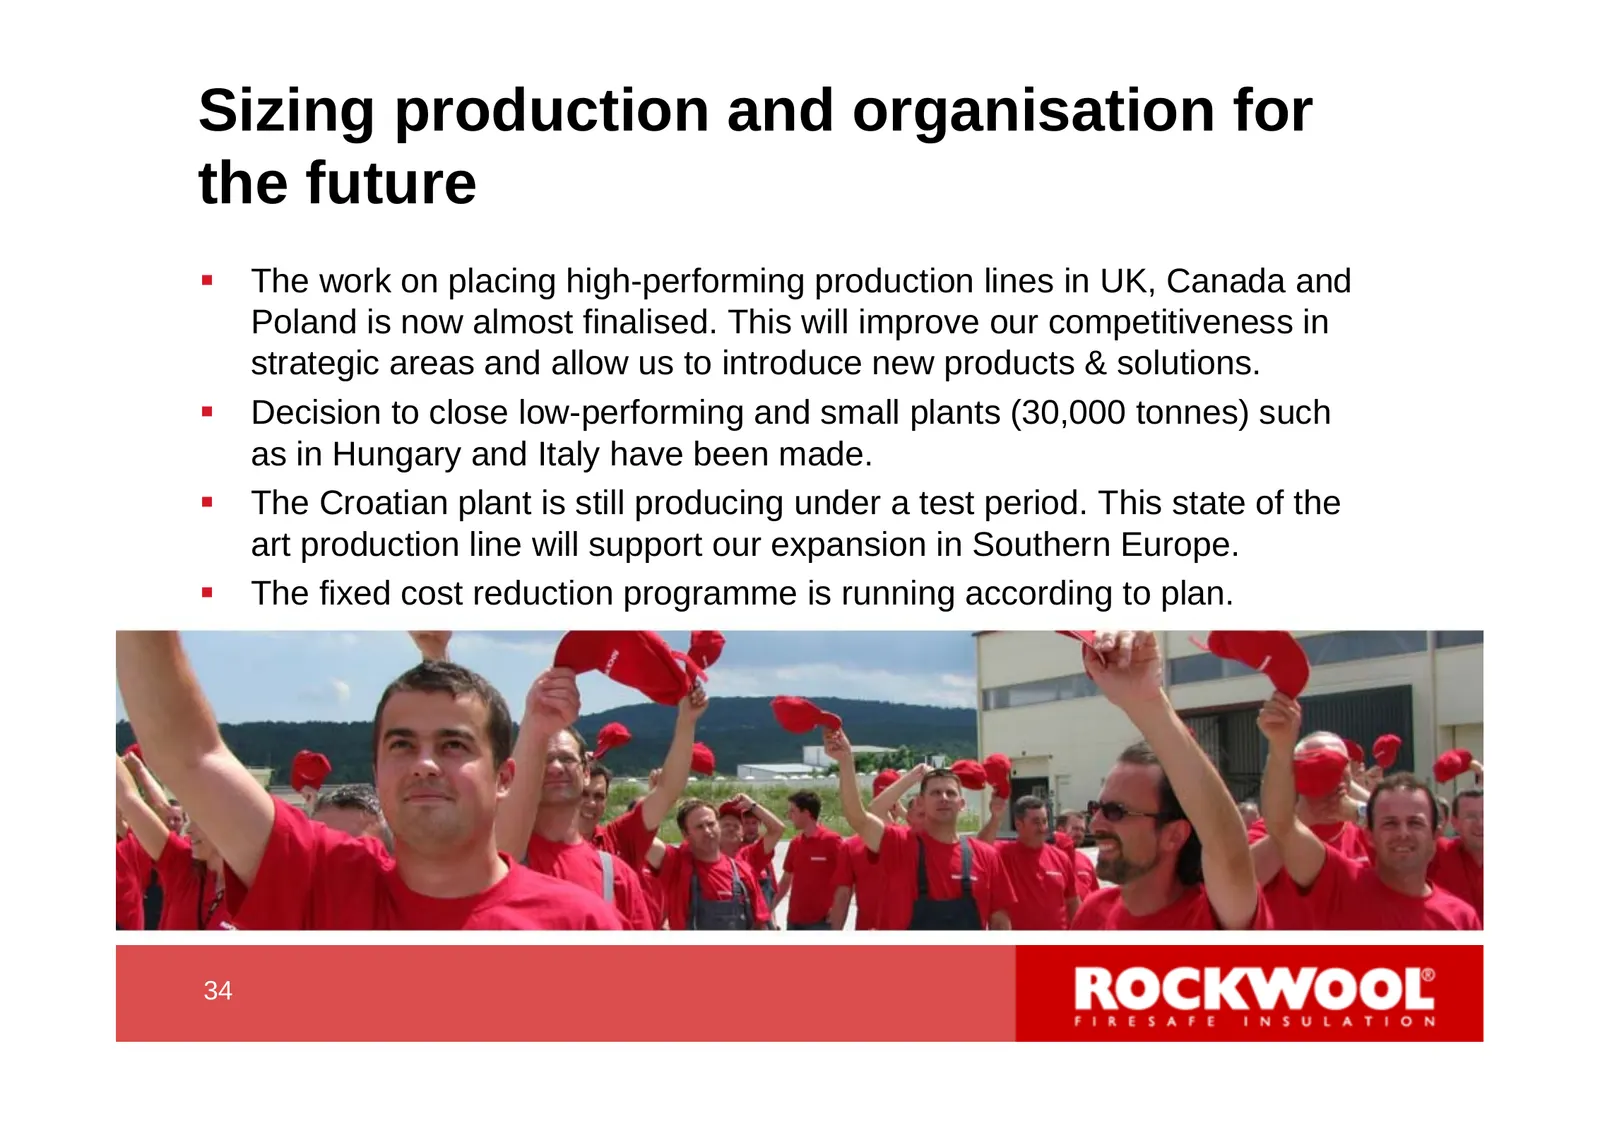
Sizing production and organisation for the future The work on placing high-performing production lines in UK, Canada and Poland is now almost finalised. This will improve our competitiveness in strategic areas and allow us to introduce new products & solutions. Decision to close low-performing a
Slide 35: Rockwool factories
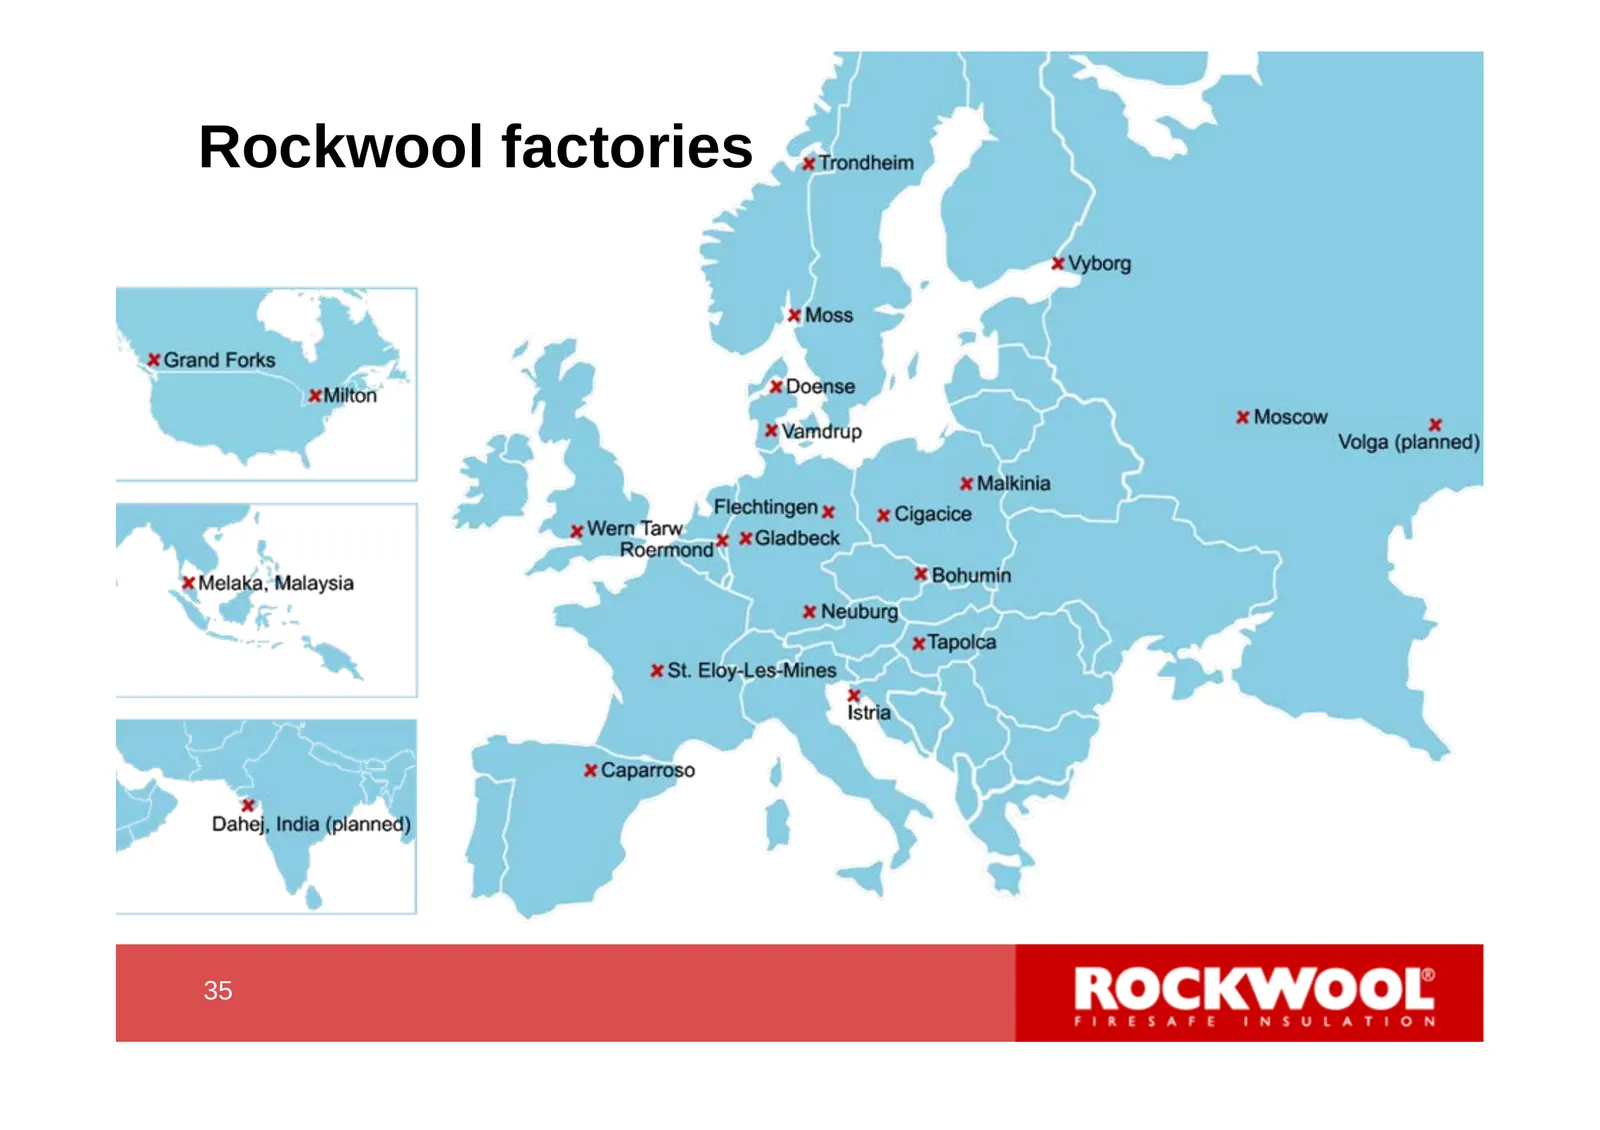
Rockwool factOrieS “rorem x Vyborg * Moss * Grand Forks X Milton x Doense x Moscow x gemctup Volga (planned) Malkinia Flechtingen x x Cigacice x Wern Tarw Roentiond* x Gladbeck * Melaka, Malaysia * Bohumin * Neuburg xTapoica * St. Eloy-Les-Mines x. Istria * Caparroso * Dahej, India (planned) ROCKWOO
Slide 36: Capital expansion
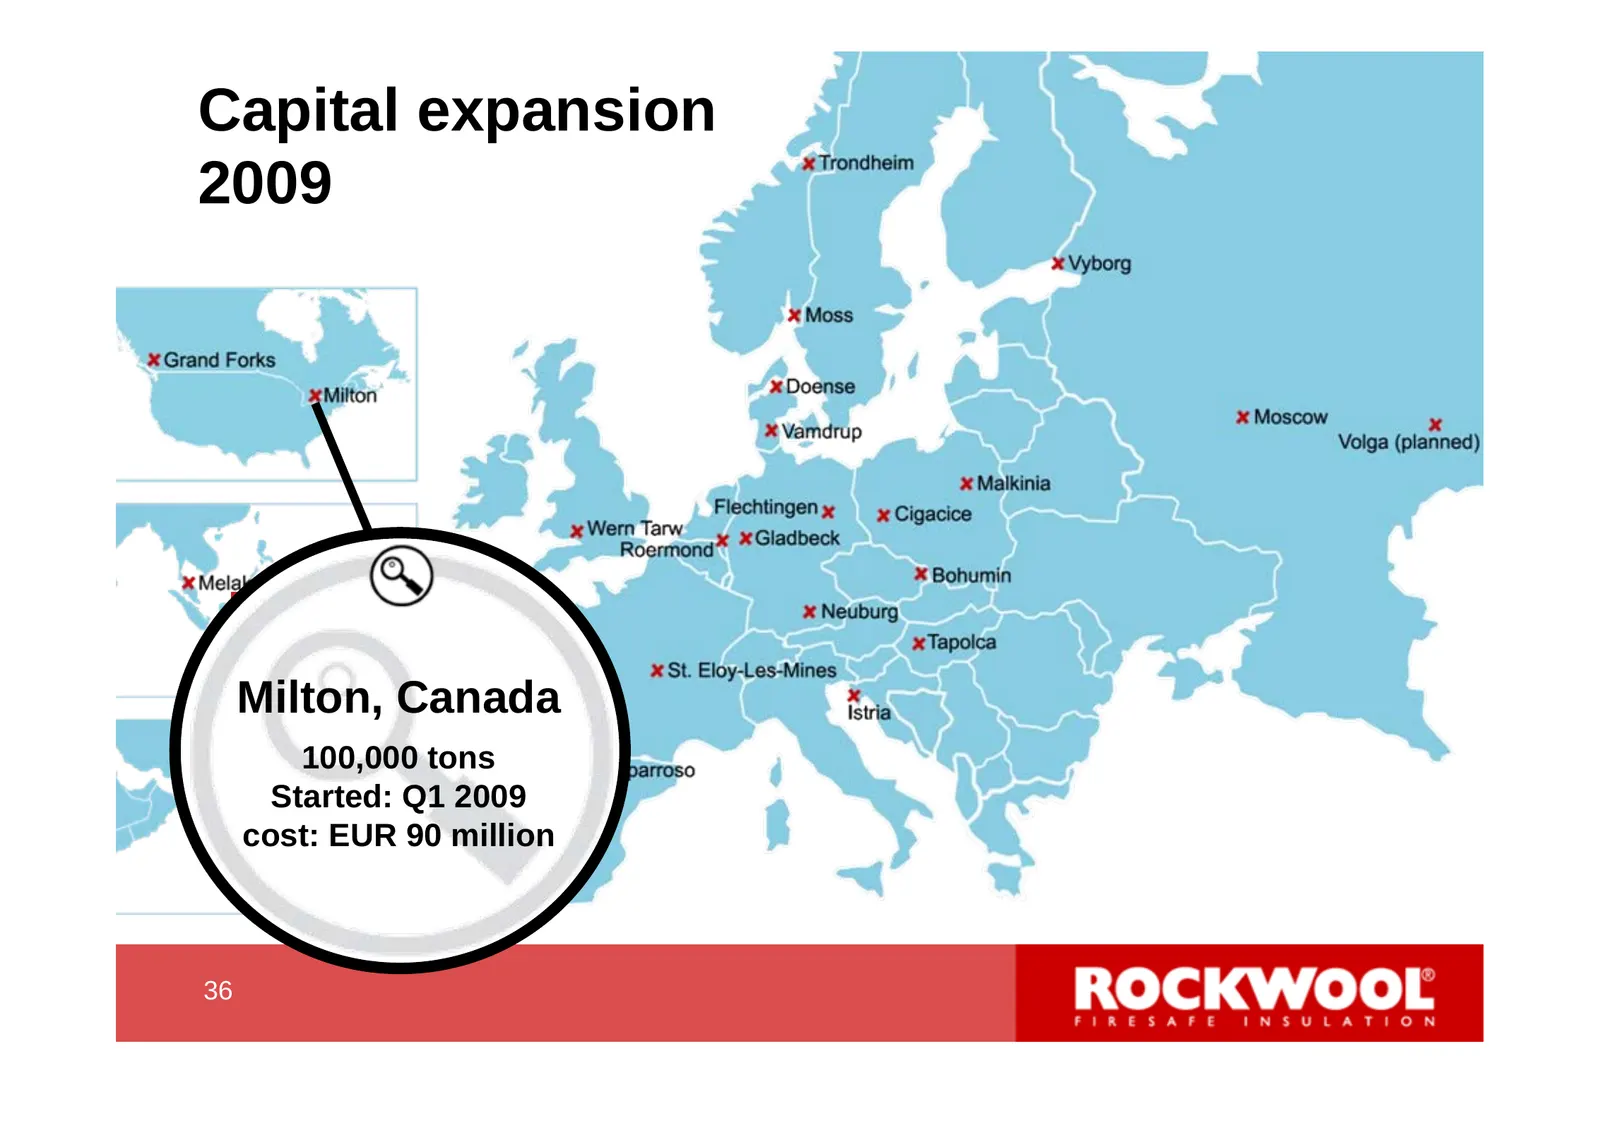
Capital expansion 2009 >5% 3-5 % Milton, 1-3 % Canada 0-1 % tons 100,000 Started: < 0 % Q1 2009 cost: EUR 90 million 36 36
Slide 37: Capital expansion future
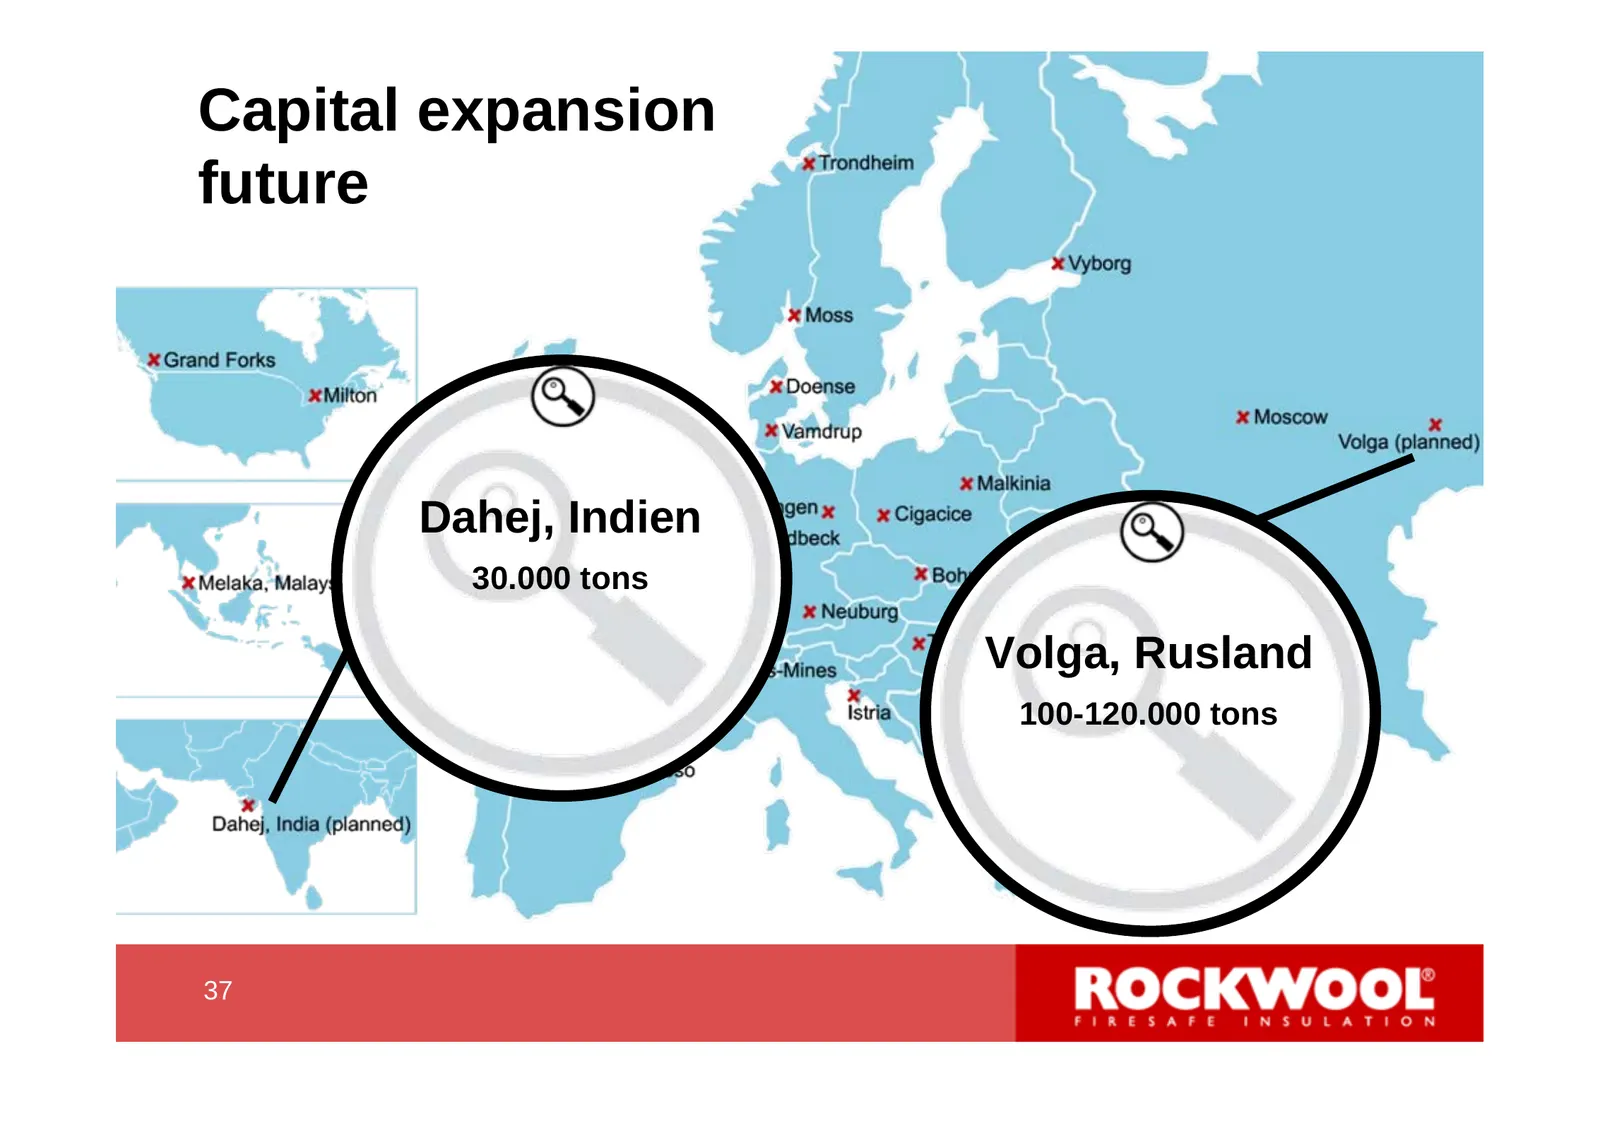
Capital expansion future Dahej, Indien 30.000 tons Volga, Rusland 100-120.000 tons 37 37
Slide 38: Asian insulation operations expansion
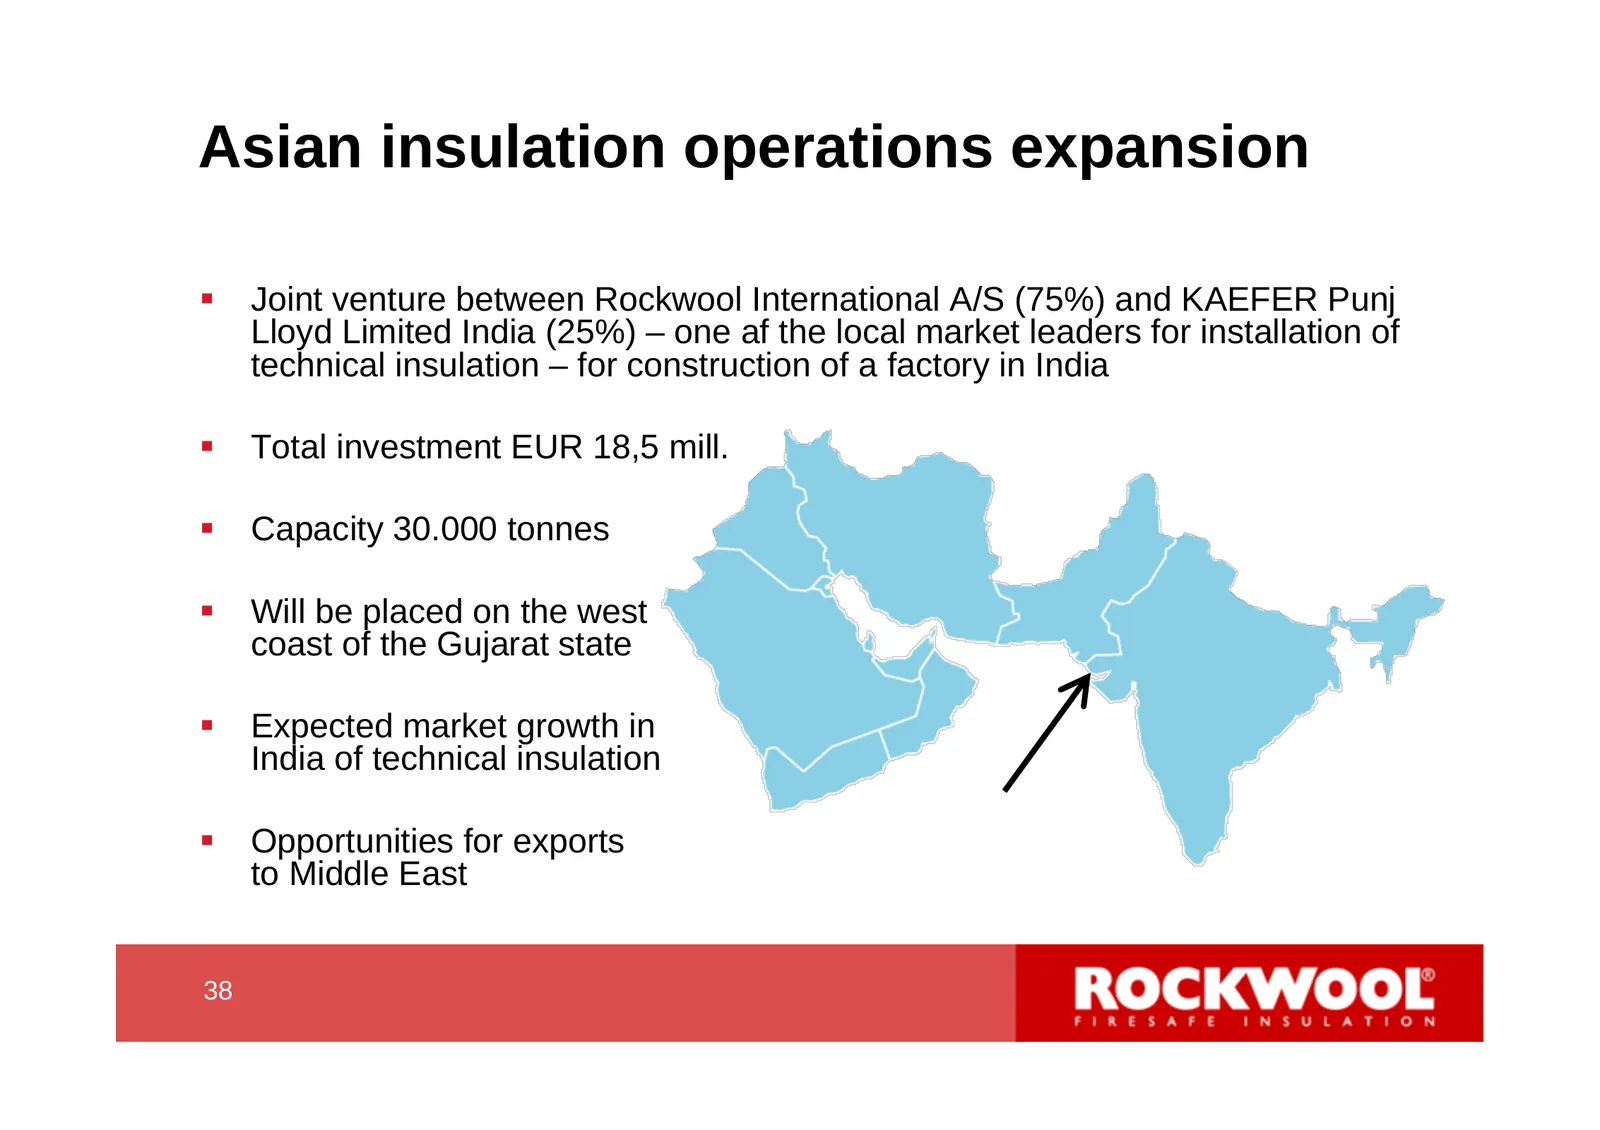
Asian insulation operations expansion Joint venture between Rockwool International A/S (75%) and KAEFER Punj Lloyd Limited India (25%) – one af the local market leaders for installation of technical insulation – for construction of a factory in India Total investment EUR 18,5 mill. Capacity 30
Slide 39: Financials
Financials 39 39
Slide 40: Net sales first quarter
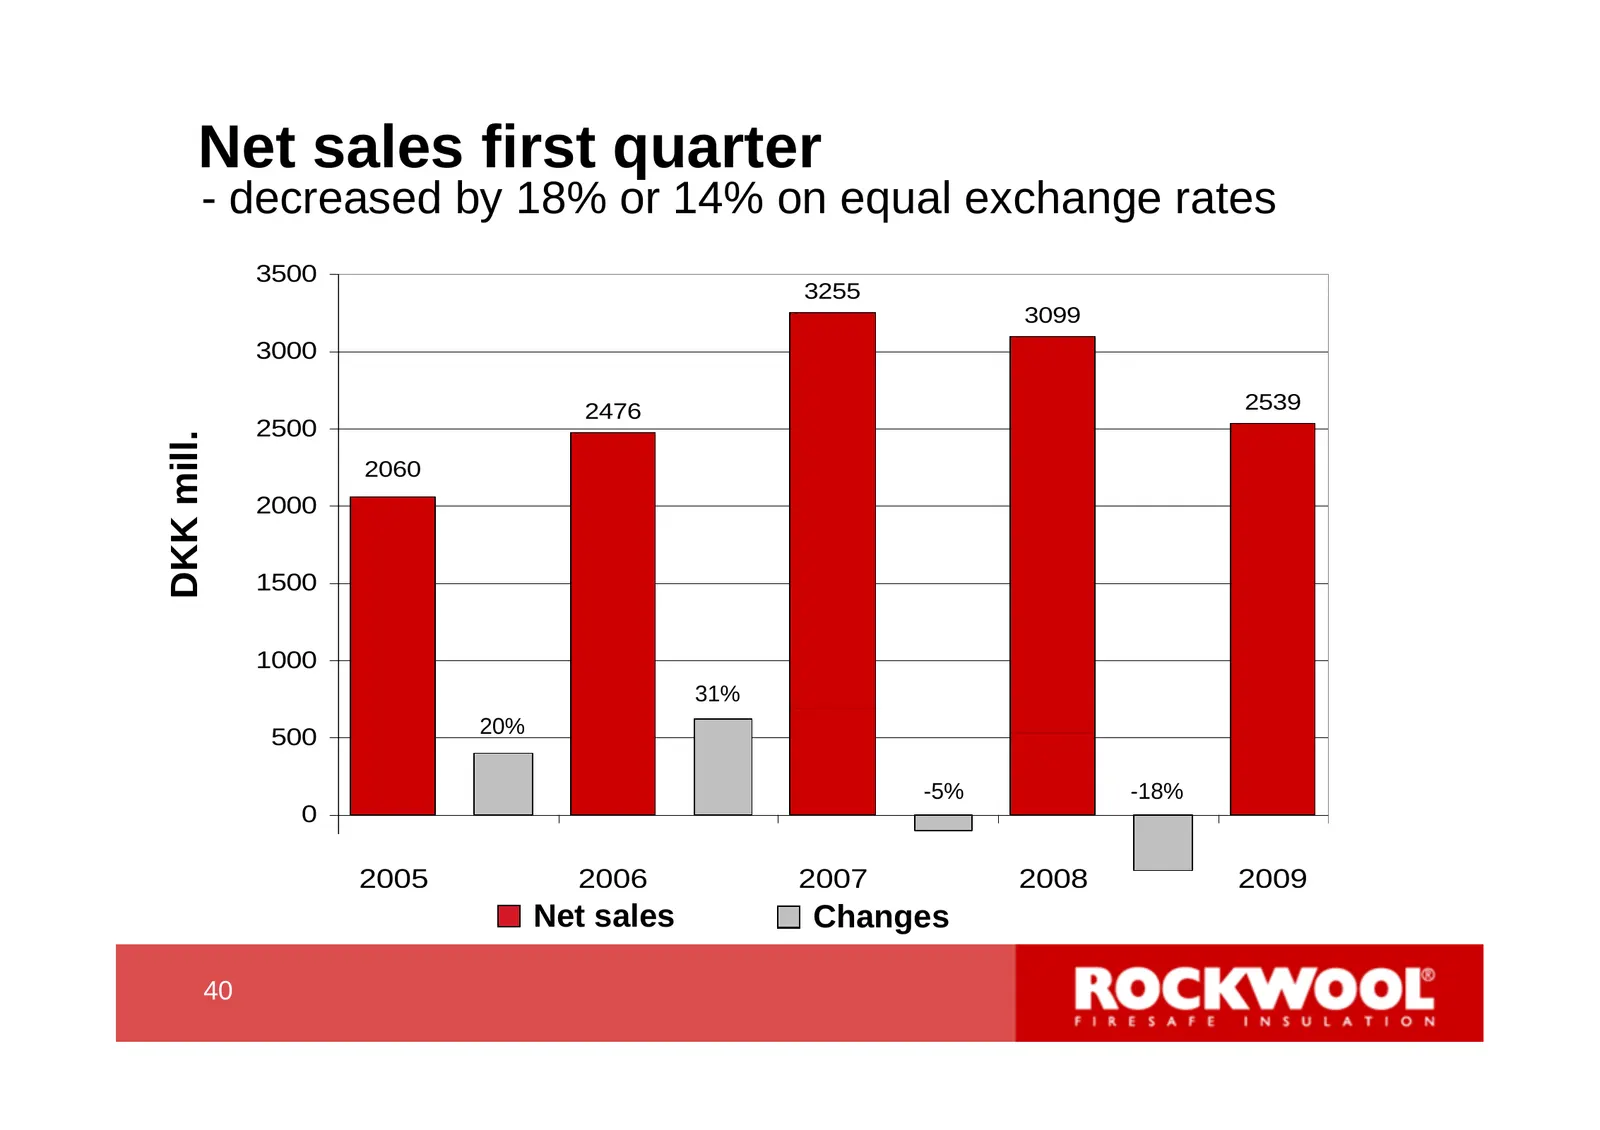
Net sales first quarter - decreased by 18% or 14% on equal exchange rates 3500 3255 3099 3000 2476 2539 2500 DKK mill. 2060 2000 1500 1000 31% 500 20% -5% -18% 0 -500 2005 2006 2007 2008 2009 Net sales Changes 40 40
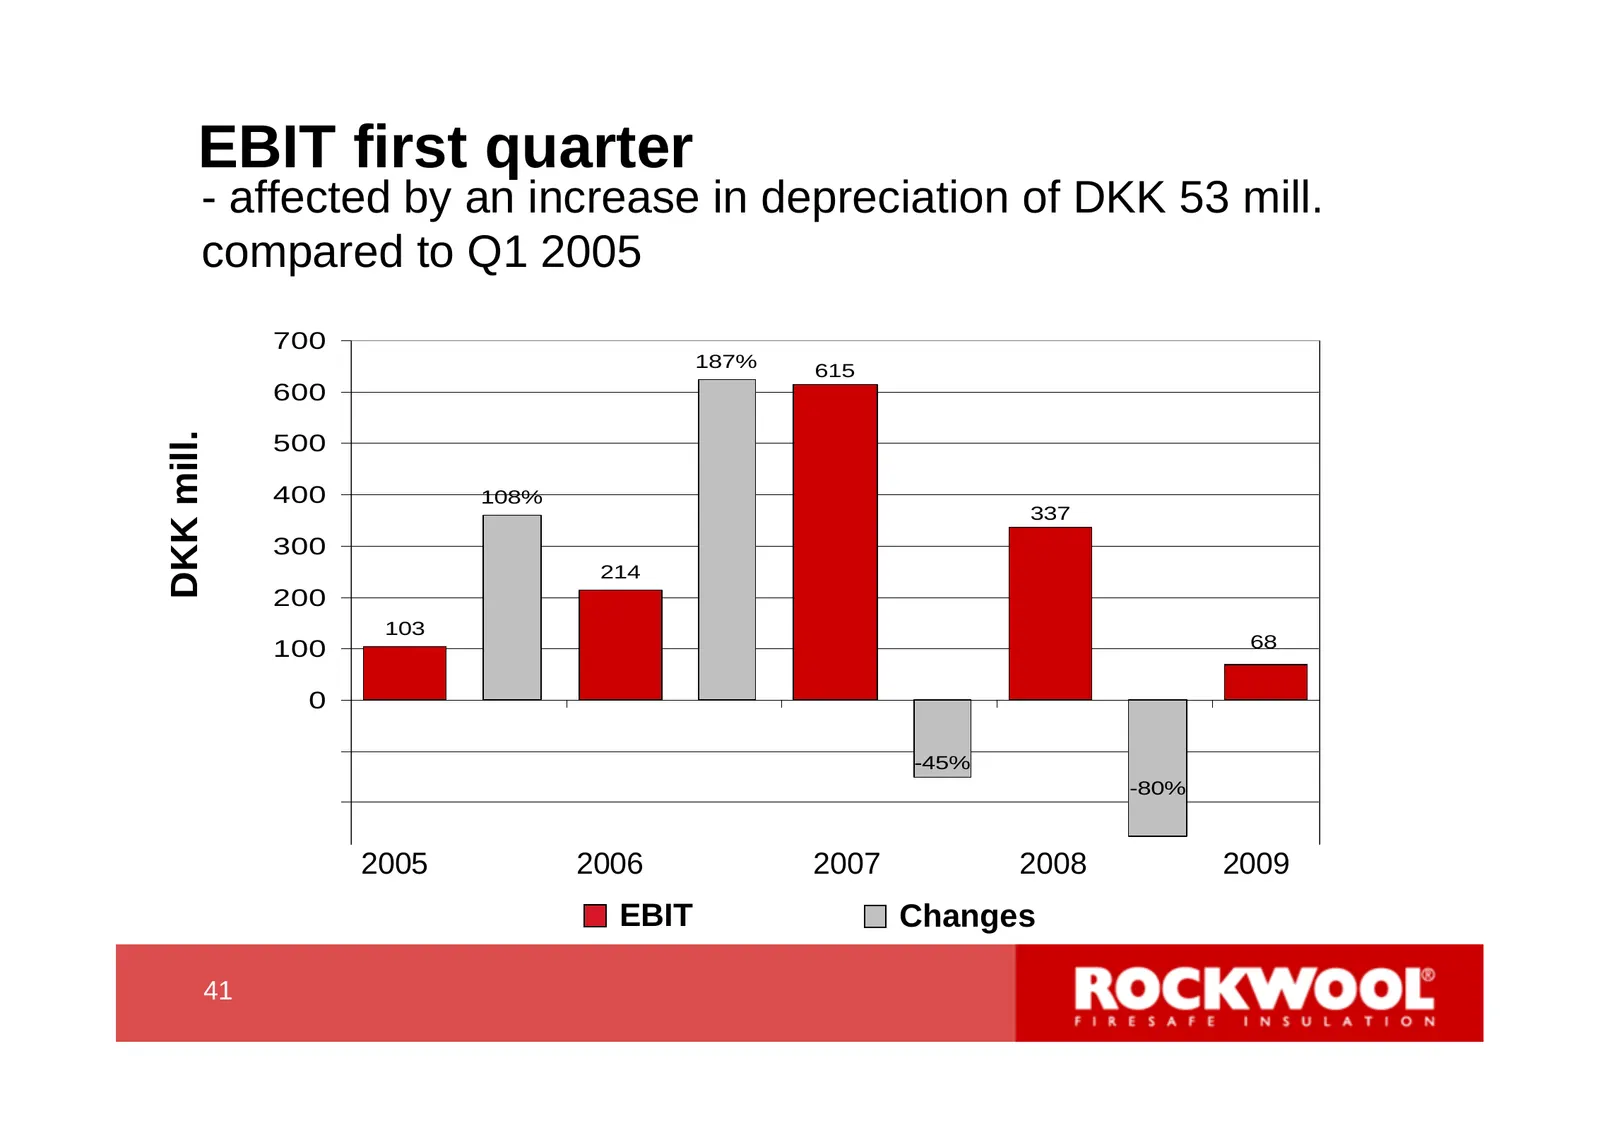
Slide 41: EBIT first quarter
EBIT first quarter - affected by an increase in depreciation of DKK 53 mill. compared to Q1 2005 700 210% 187% 615 600 160% DKK mill. 500 400 108% 337 110% 300 214 200 60% 103 100 68 10% 0 -100 -45% -40% -80% -200 -300 -90% 2005 2006 2007 2008 2009 EBIT Changes 41 41
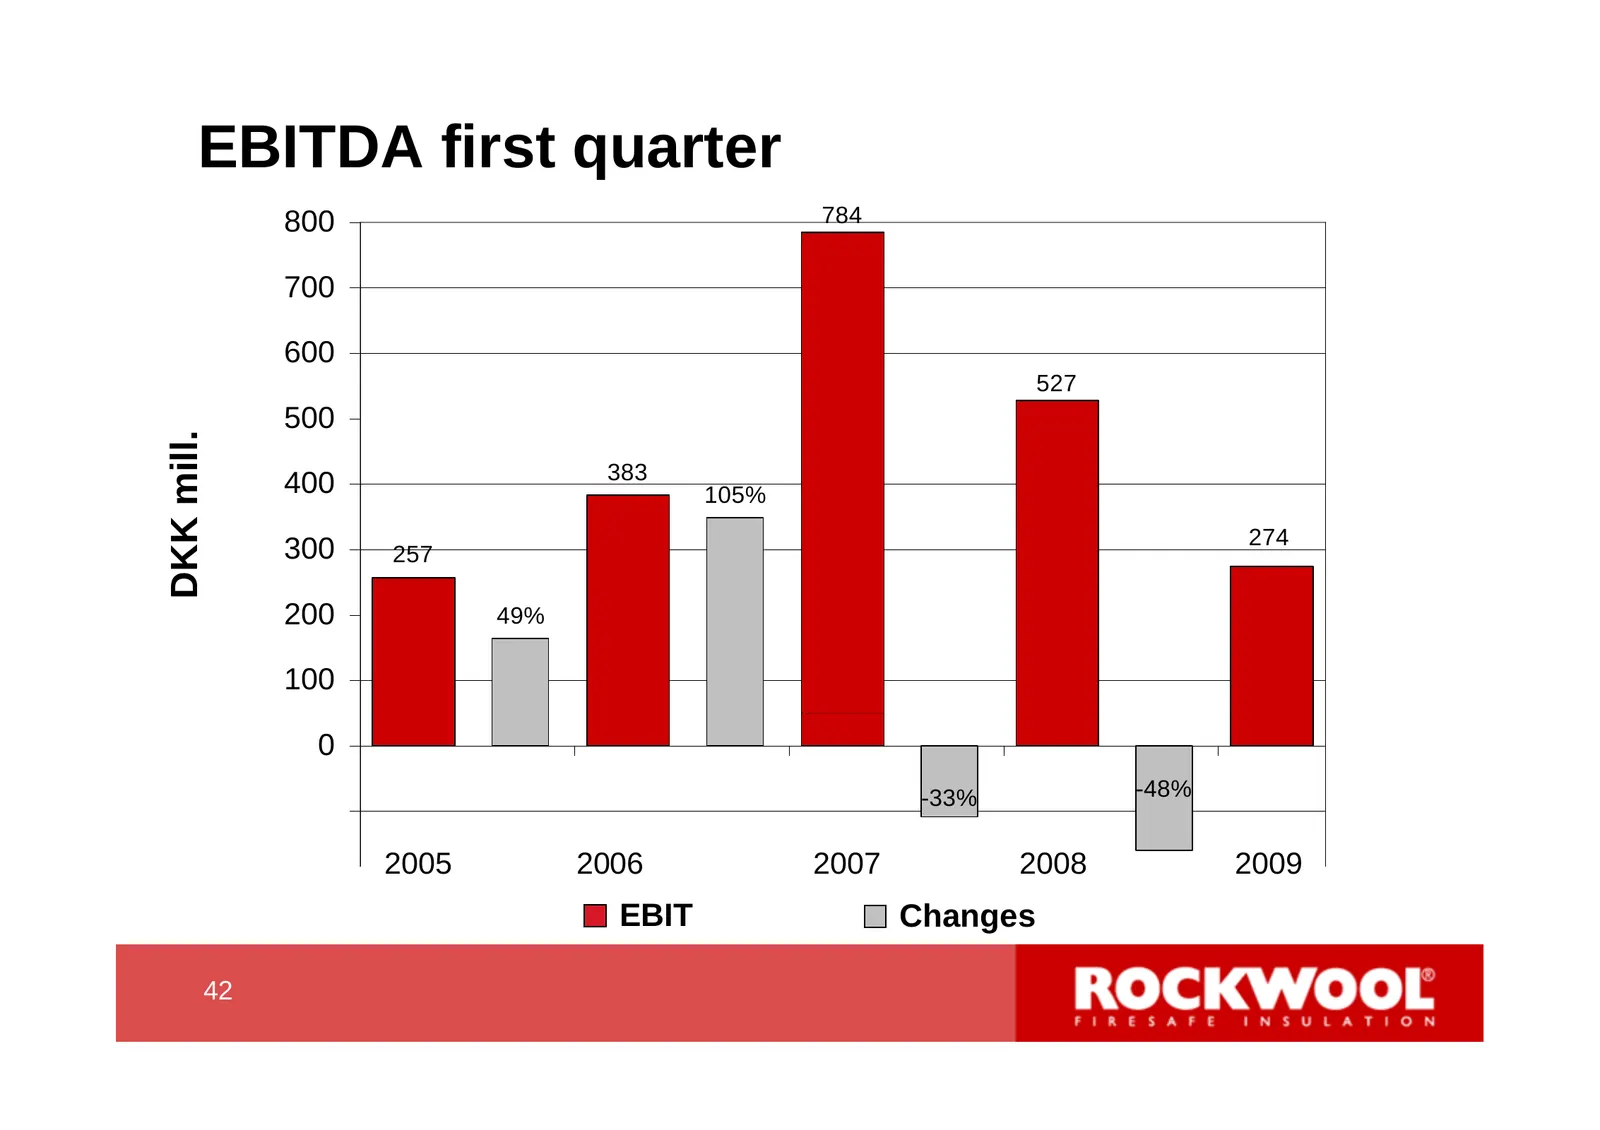
Slide 42: EBITDA first quarter
EBITDA first quarter 800 784 240% 700 190% 600 527 500 DKK mill. 140% 383 400 105% 274 300 257 90% 200 49% 40% 100 0 -10% -33% -48% -100 -200 2005 2006 2007 2008 2009 -60% EBIT Changes 42 42
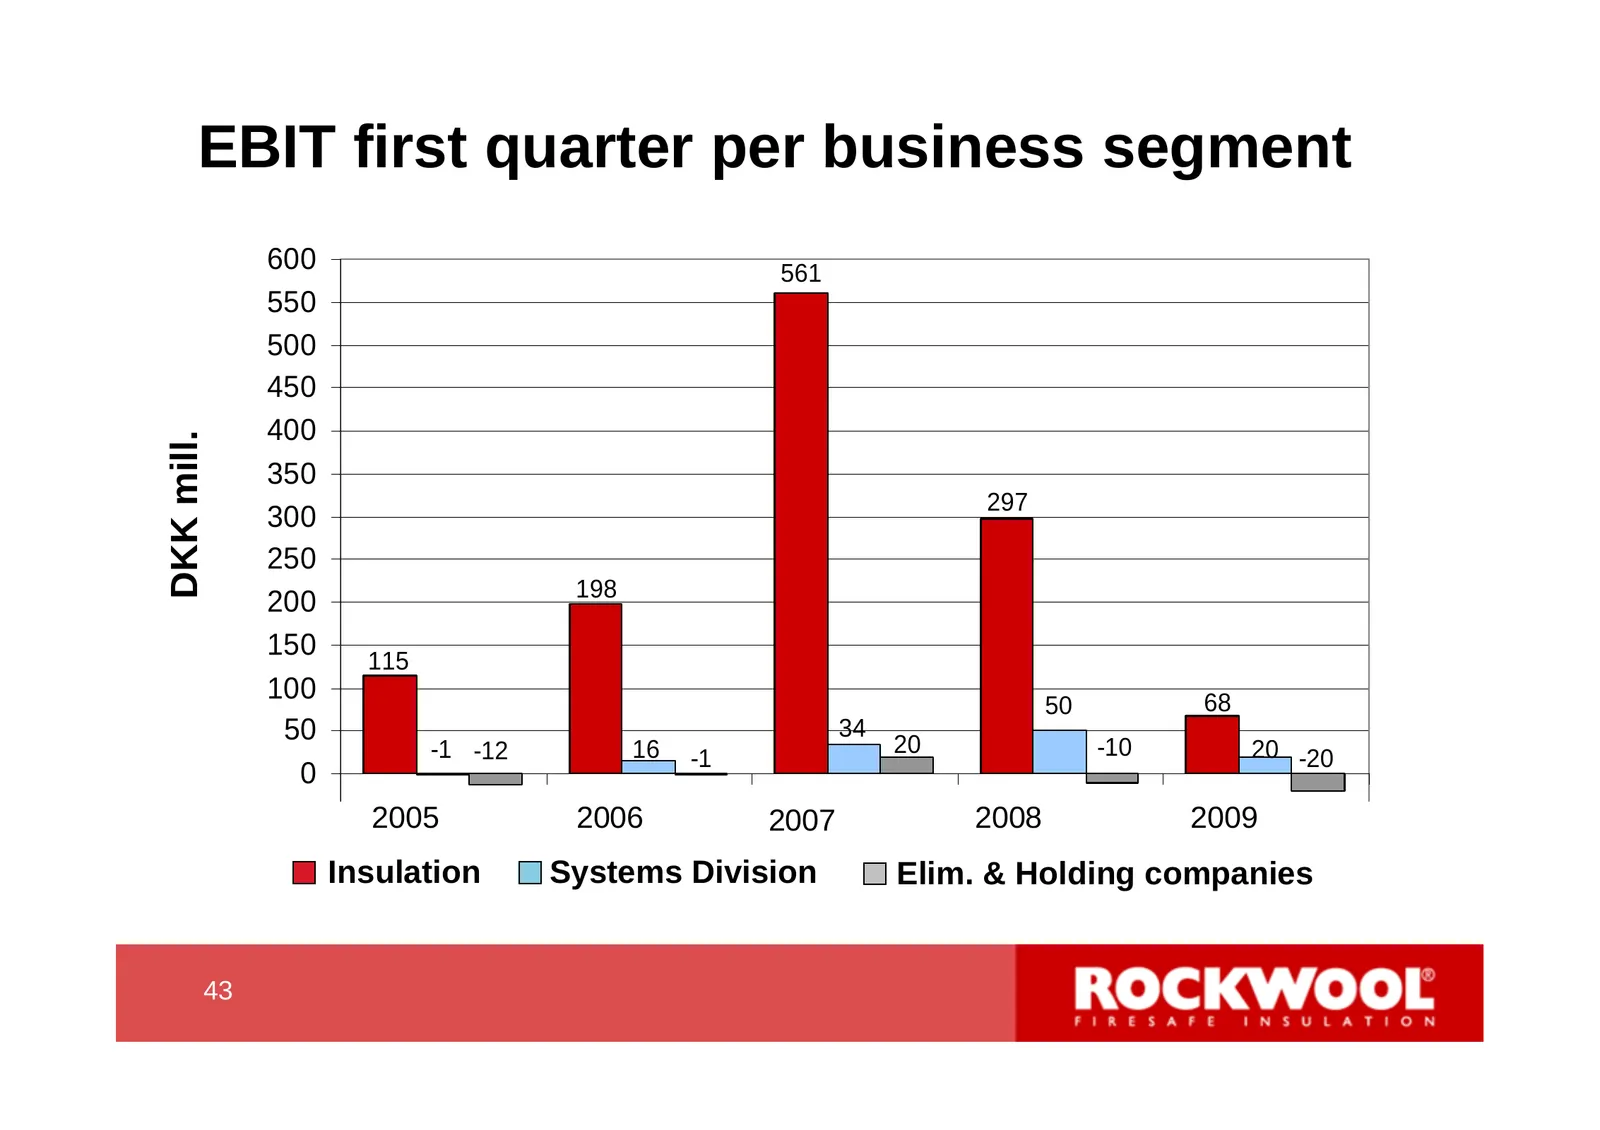
Slide 43: EBIT first quarter per business segment
EBIT first quarter per business segment 600 561 550 500 450 400 DKK mill. 350 297 300 250 198 200 150 115 100 68 50 50 34 20 -1 -12 16 -1 -10 20 -20 0 -50 2005 2006 2007 2008 2009 Insulation Systems Division Elim. & Holding companies 43 43
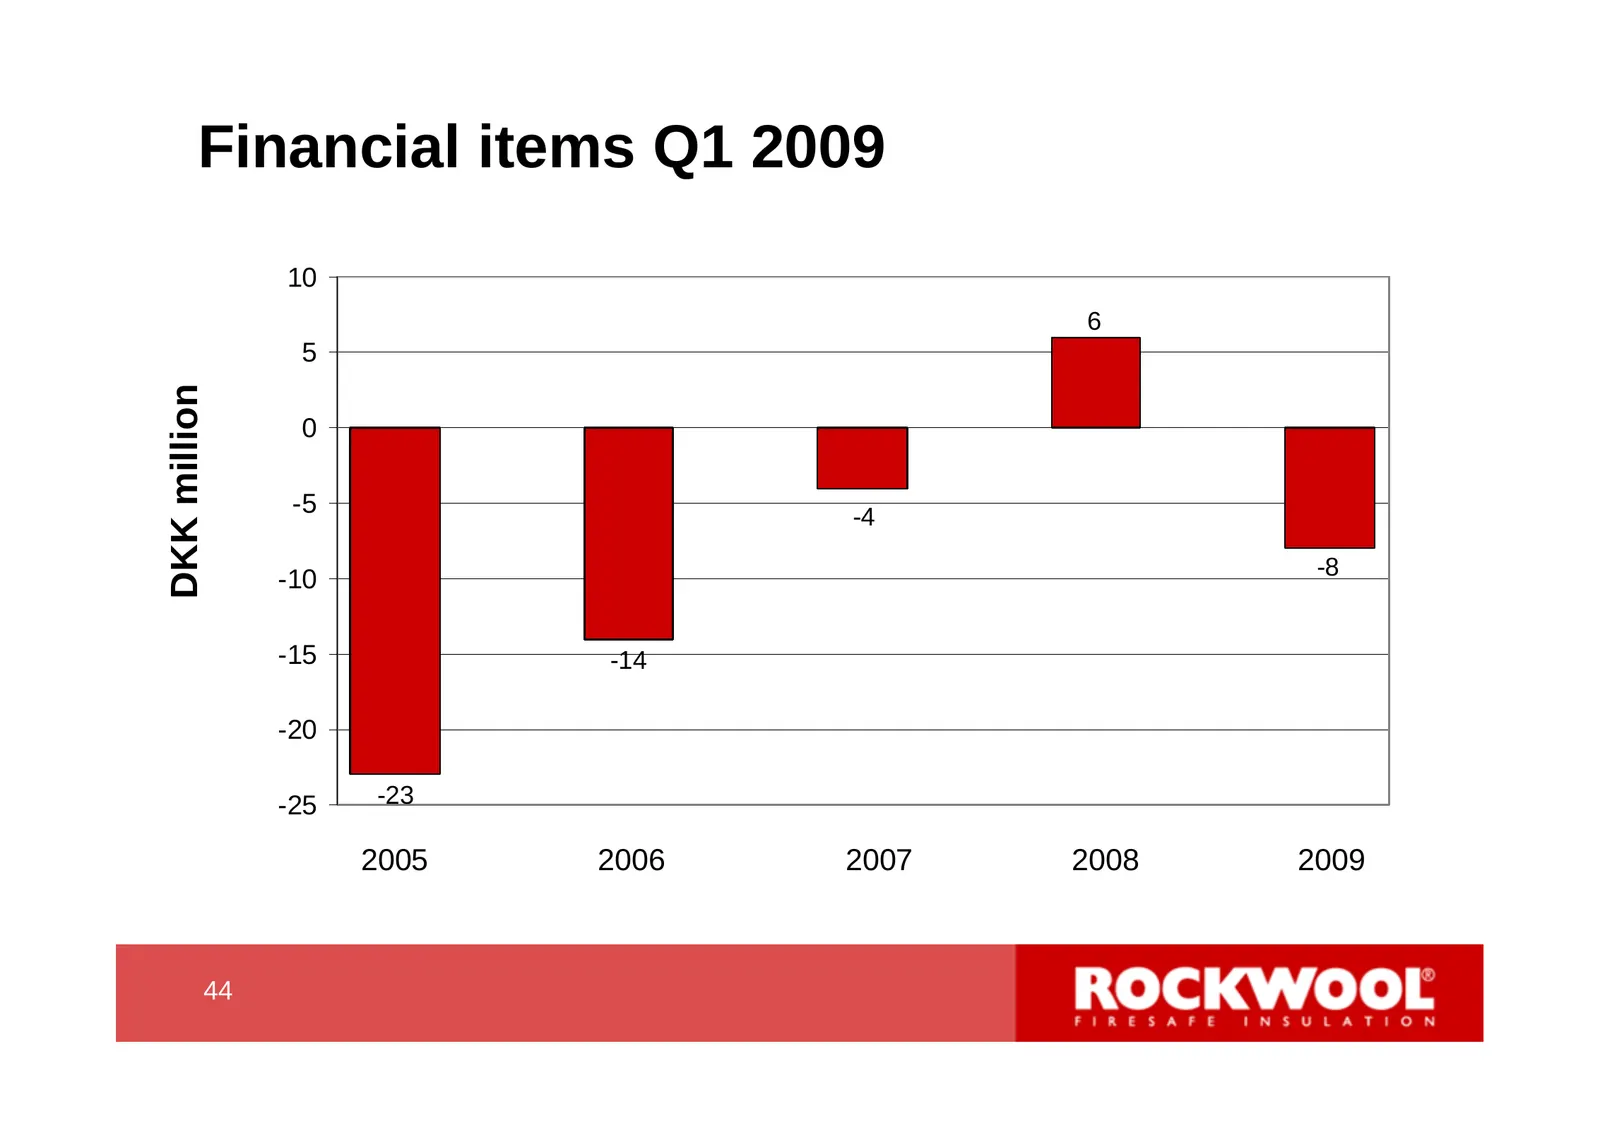
Slide 44: Financial items Q1 2009
Financial items Q1 2009 10 6 5 DKK million 0 -5 -4 -10 -8 -15 -14 -20 -25 -23 2005 2006 2007 2008 2009 44 44
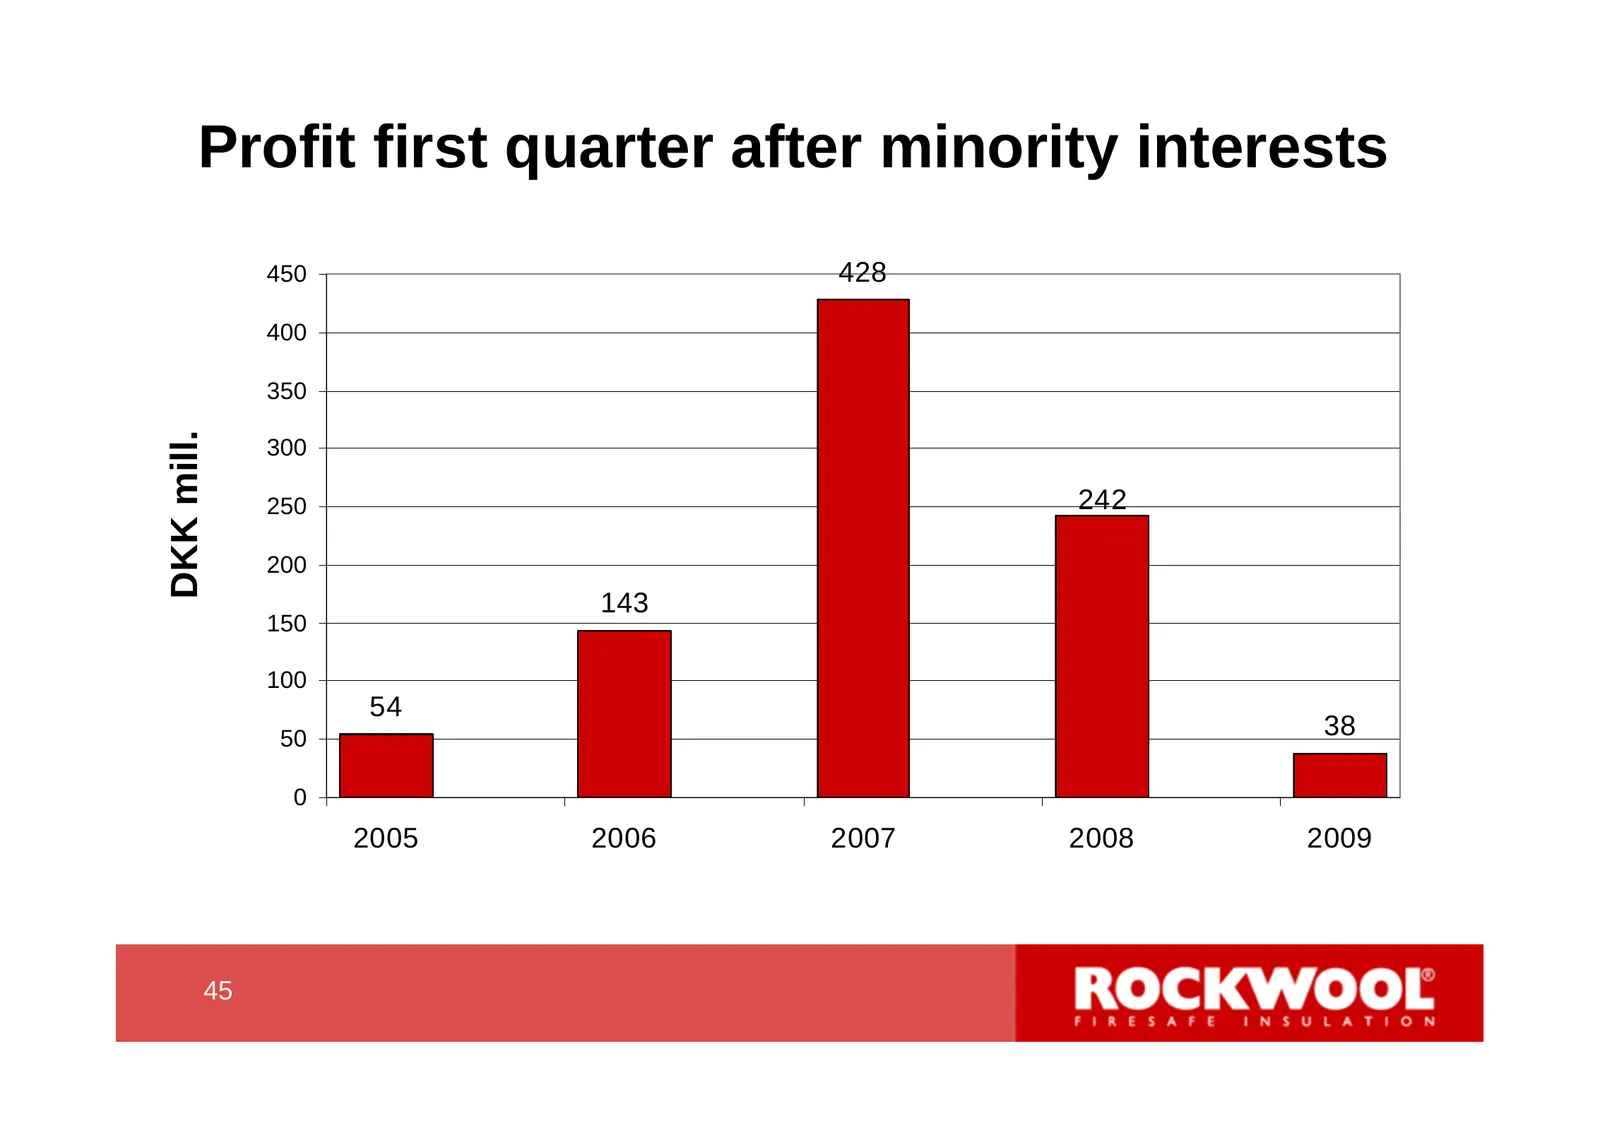
Slide 45: Profit first quarter after minority interests
Profit first quarter after minority interests 450 428 400 350 DKK mill. 300 250 242 200 143 150 100 54 50 38 0 2005 2006 2007 2008 2009 45 45
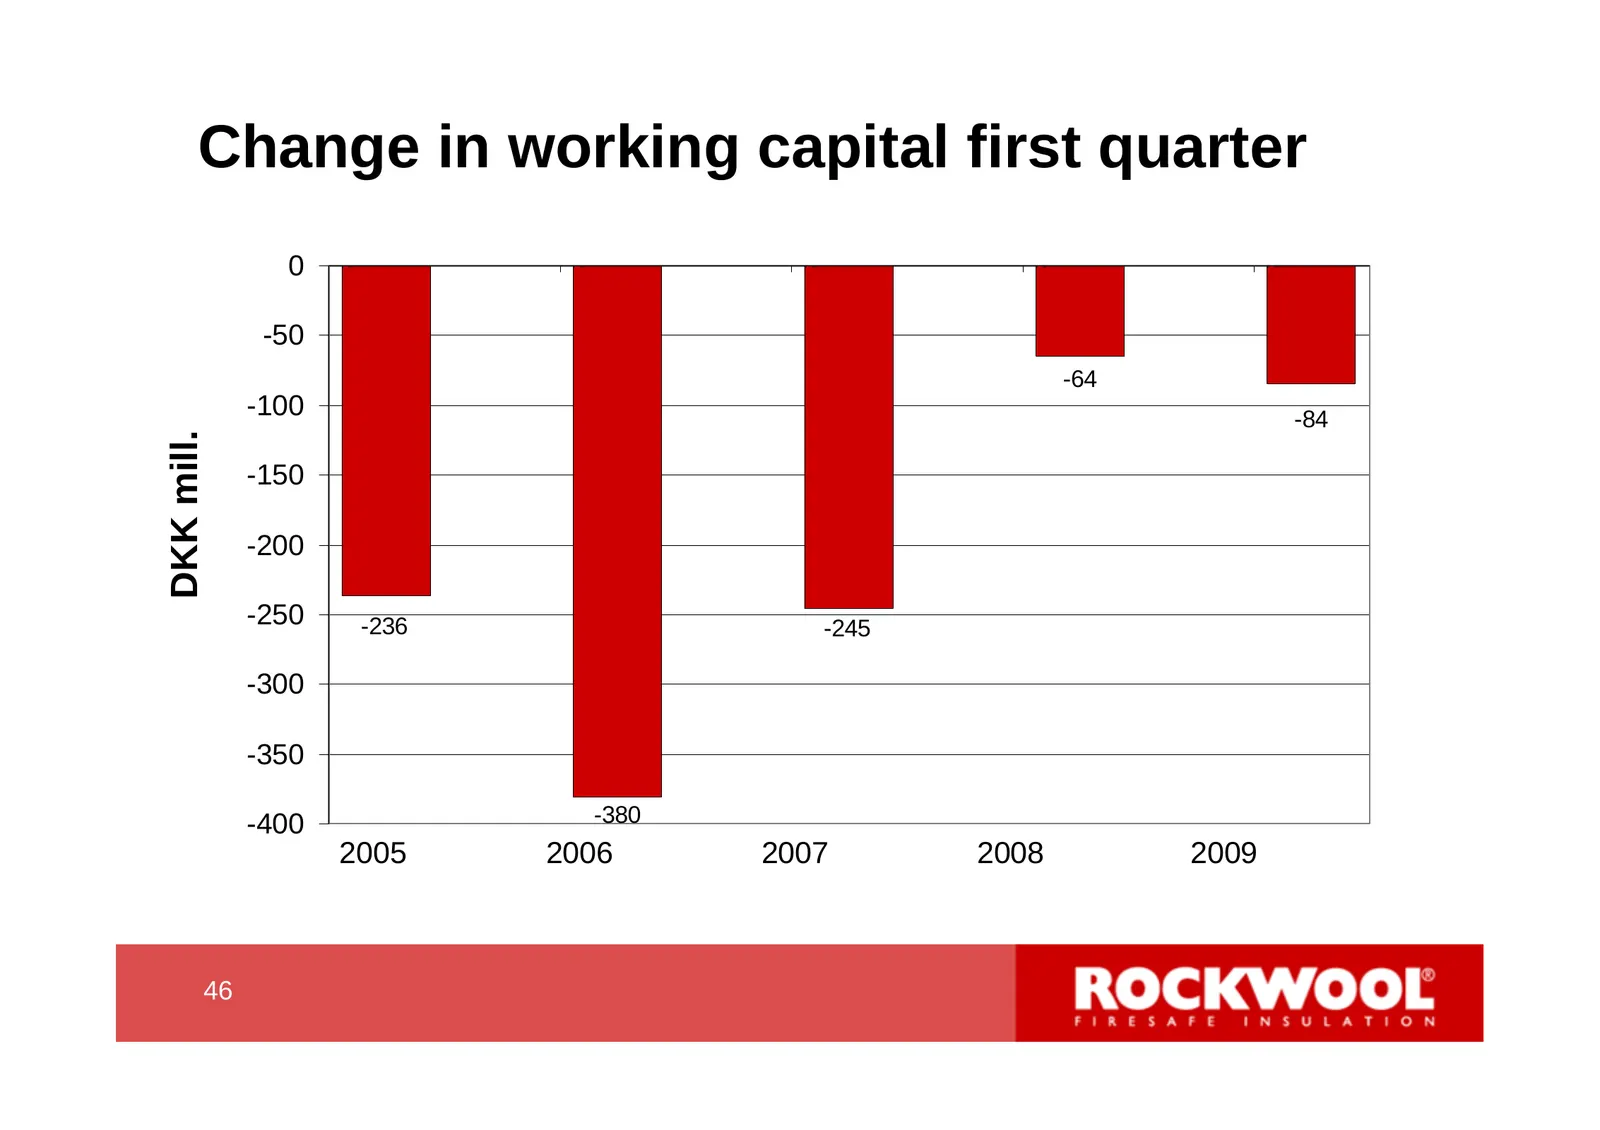
Slide 46: Change in working capital first quarter
Change in working capital first quarter 0 -50 -64 -100 -84 DKK mill. -150 -200 -250 -236 -245 -300 -350 -400 -380 2005 2006 2007 2008 2009 46 46
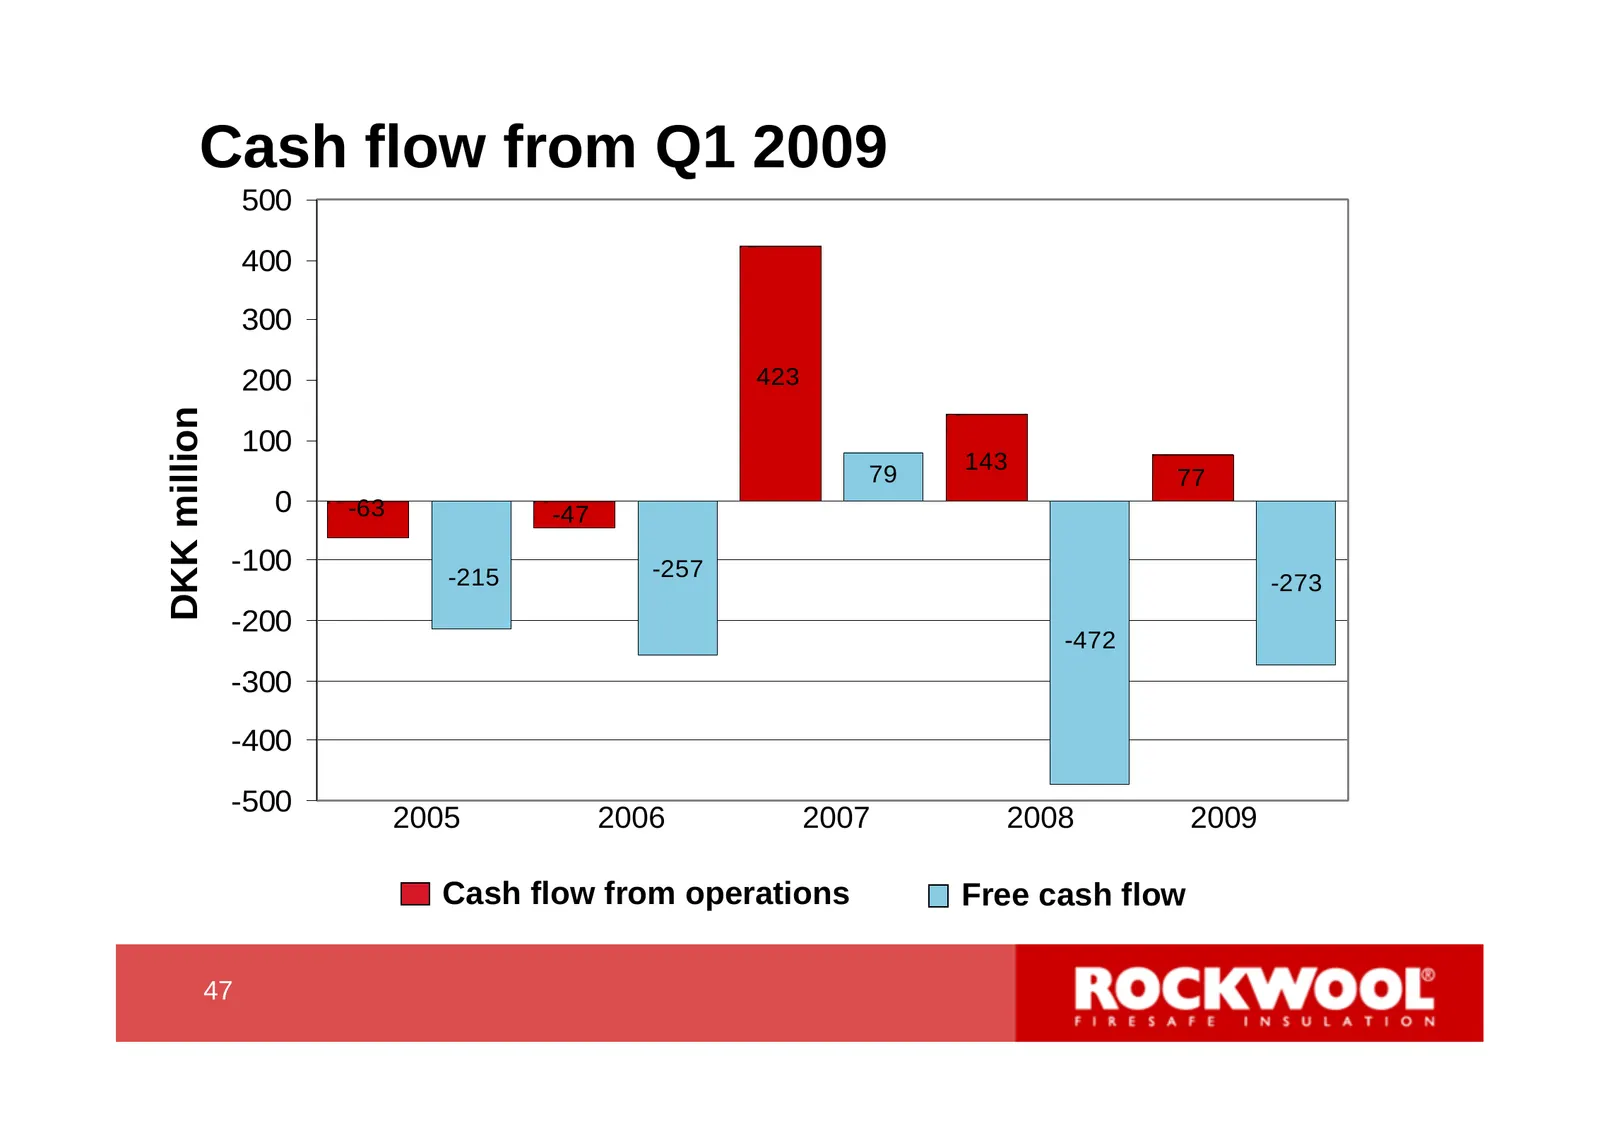
Slide 47: Cash flow from Q1 2009
Cash flow from Q1 2009 500 400 300 200 423 DKK million 100 143 79 77 0 -63 -47 -100 -215 -257 -273 -200 -472 -300 -400 -500 2005 2006 2007 2008 2009 Cash flow from operations Free cash flow 47 47
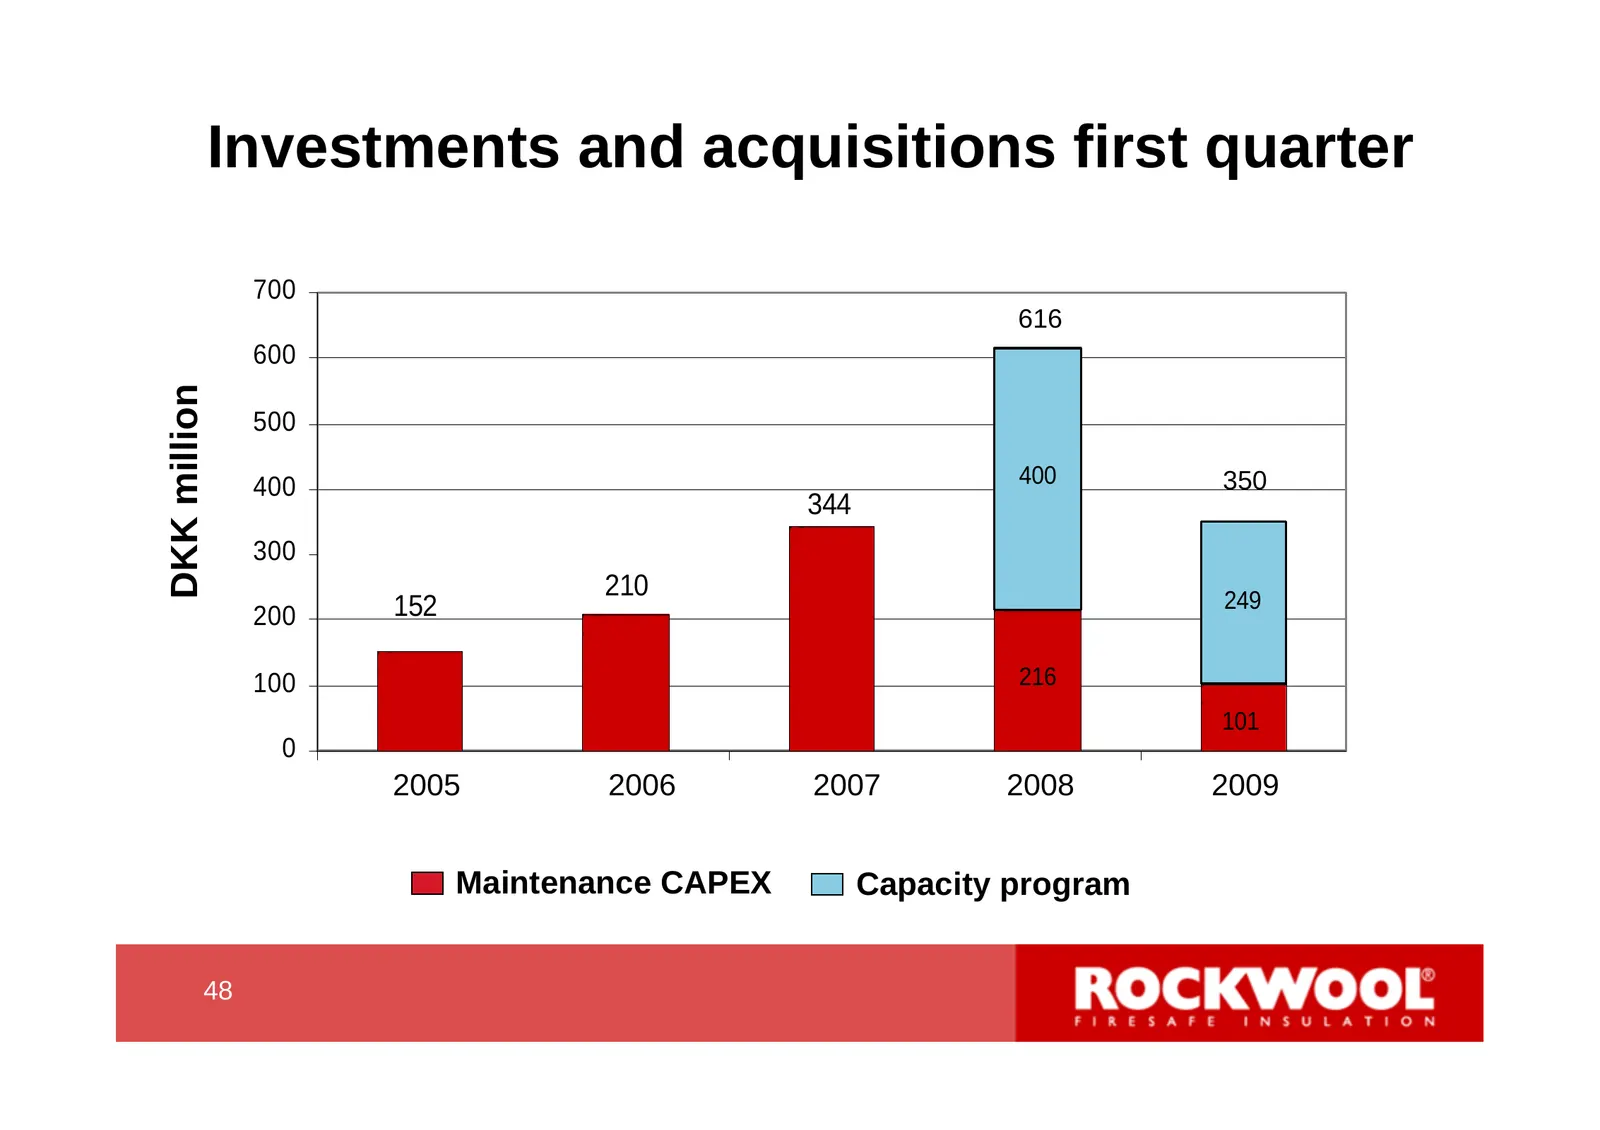
Slide 48: Investments and acquisitions first quarter
Investments and acquisitions first quarter 700 616 600 DKK million 500 400 400 350 344 300 210 249 200 152 100 216 101 0 2005 1 2006 2 2007 3 2008 4 2009 5 Maintenance CAPEX Capacity program 48 48
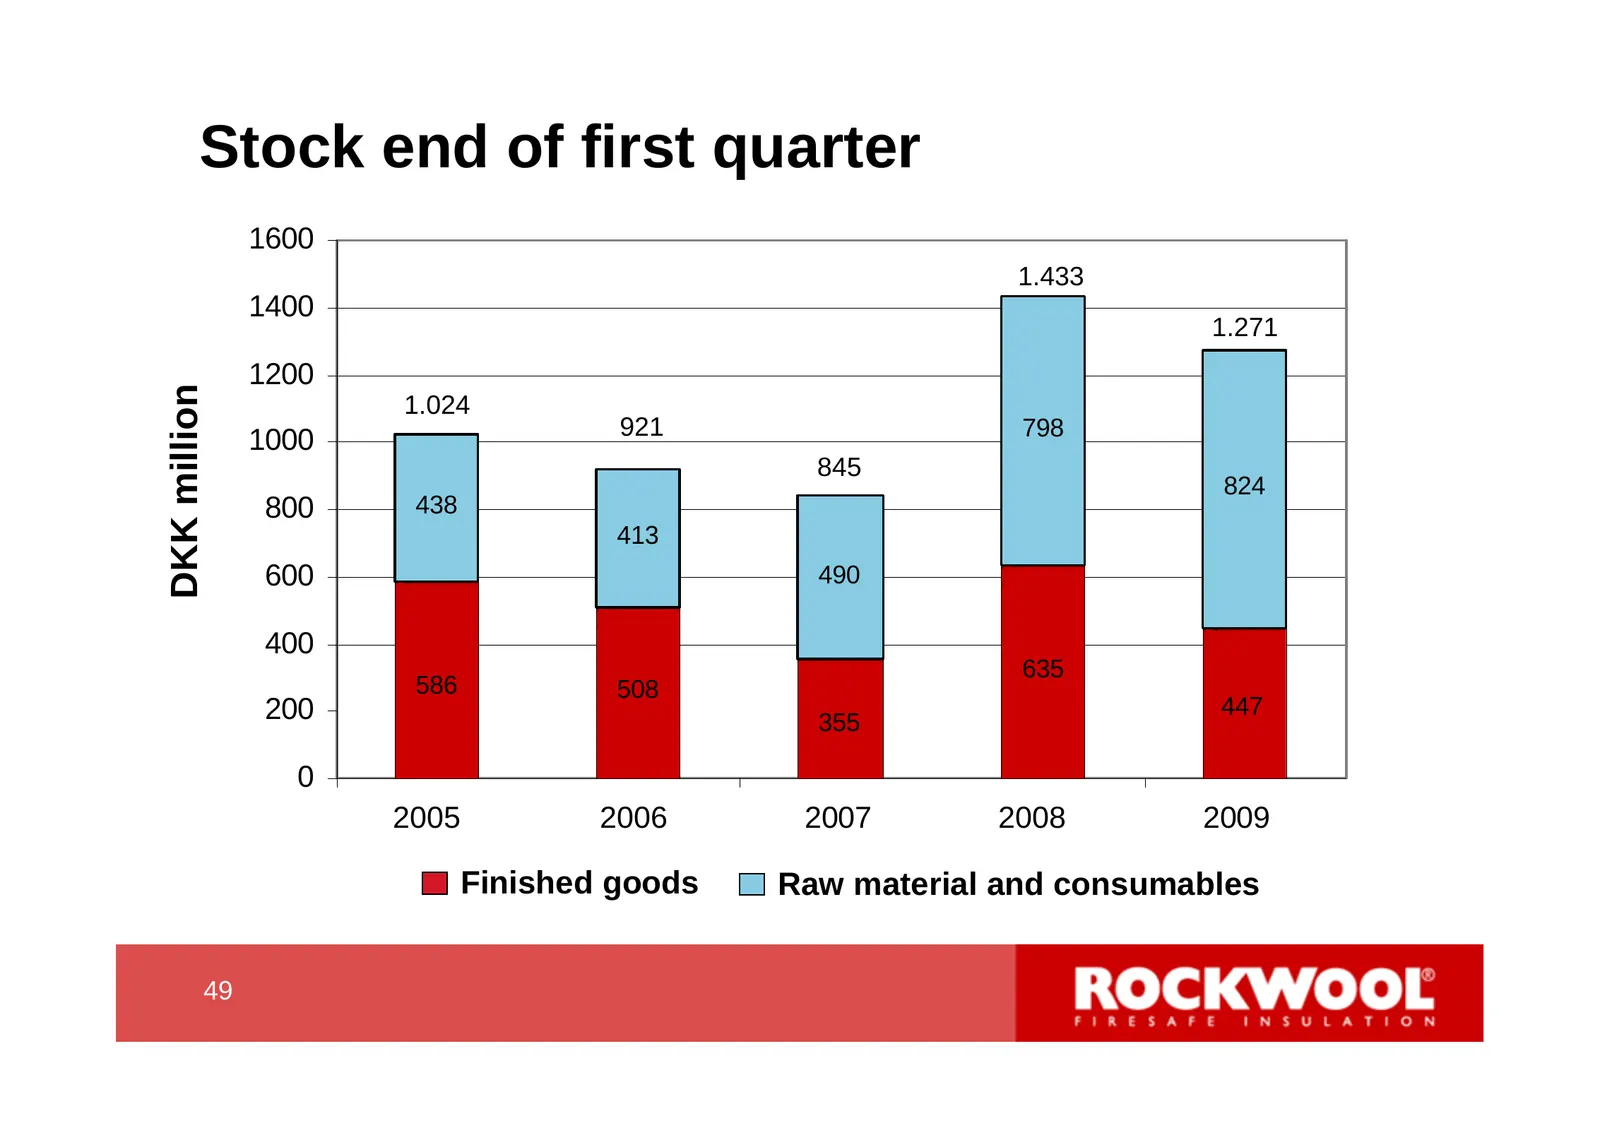
Slide 49: Stock end of first quarter
Stock end of first quarter 1600 1.433 1400 1.271 1200 DKK million 1.024 921 798 1000 845 824 800 438 413 600 490 400 635 586 508 200 447 355 0 2005 1 2006 2 2007 3 2008 4 2009 5 Finished goods Raw material and consumables 49 49
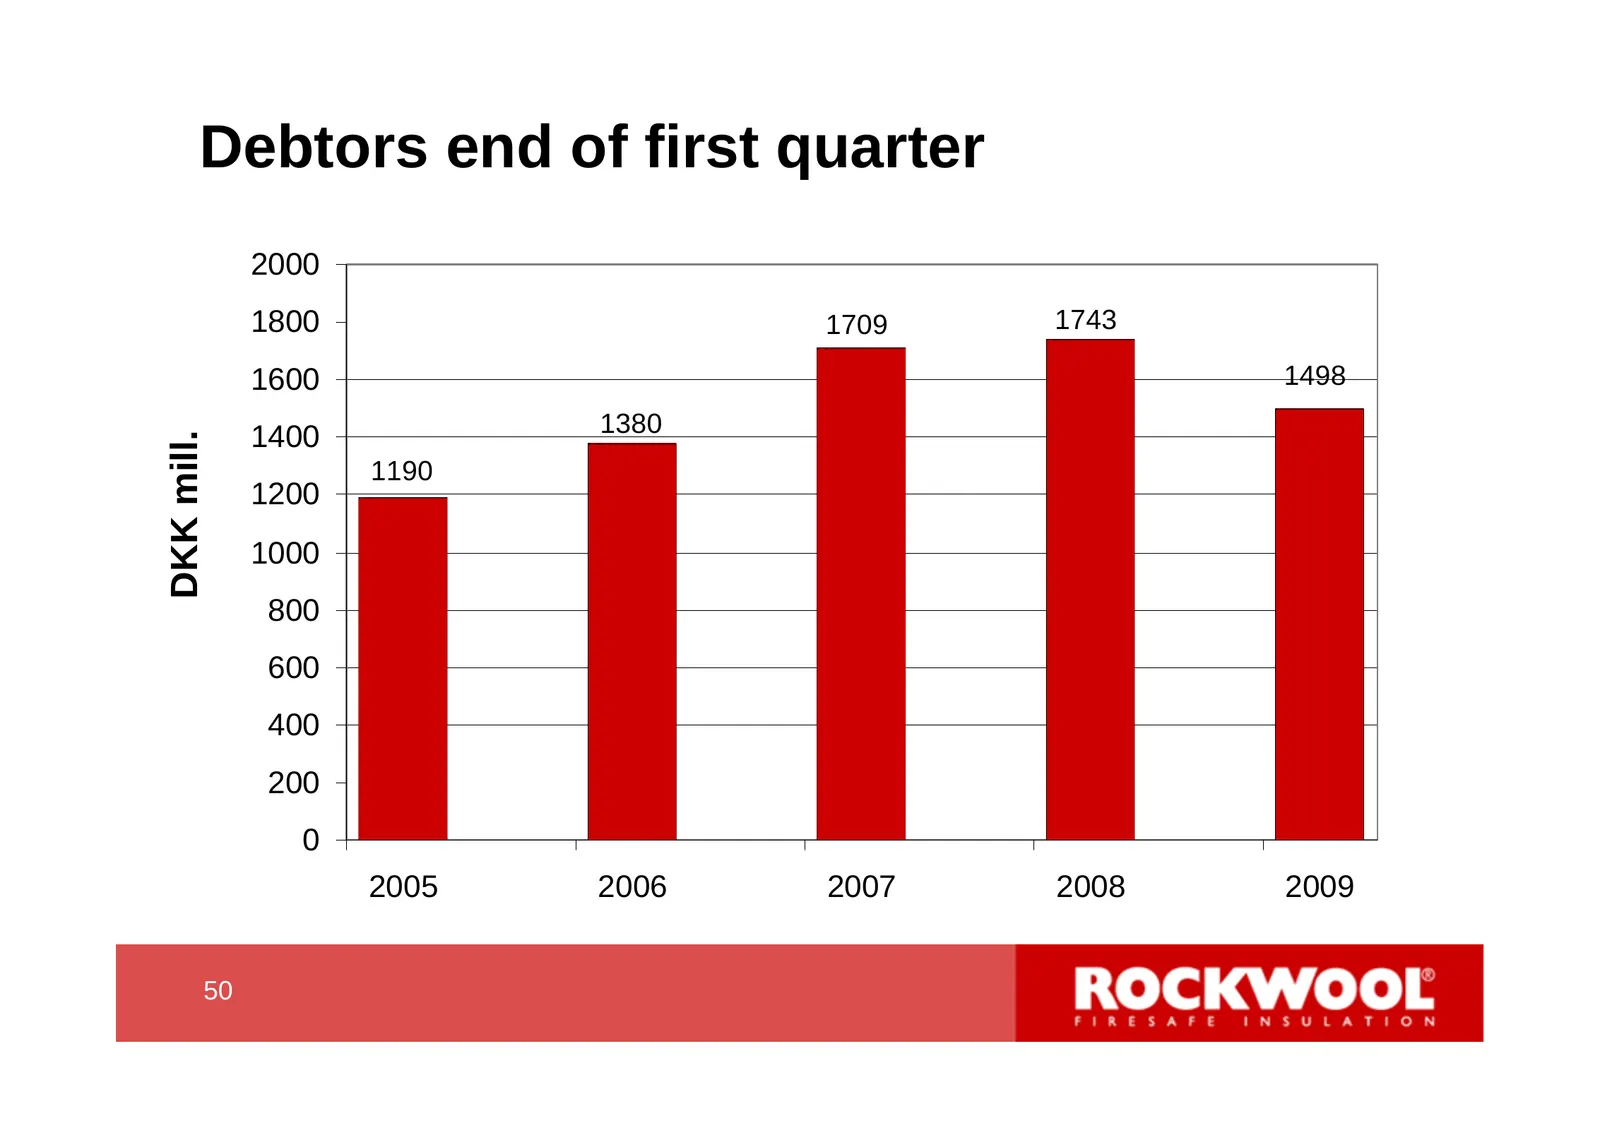
Slide 50: Debtors end of first quarter
Debtors end of first quarter 2000 1800 1709 1743 1600 1498 1400 1380 DKK mill. 1190 1200 1000 800 600 400 200 0 2005 2006 2007 2008 2009 50 50
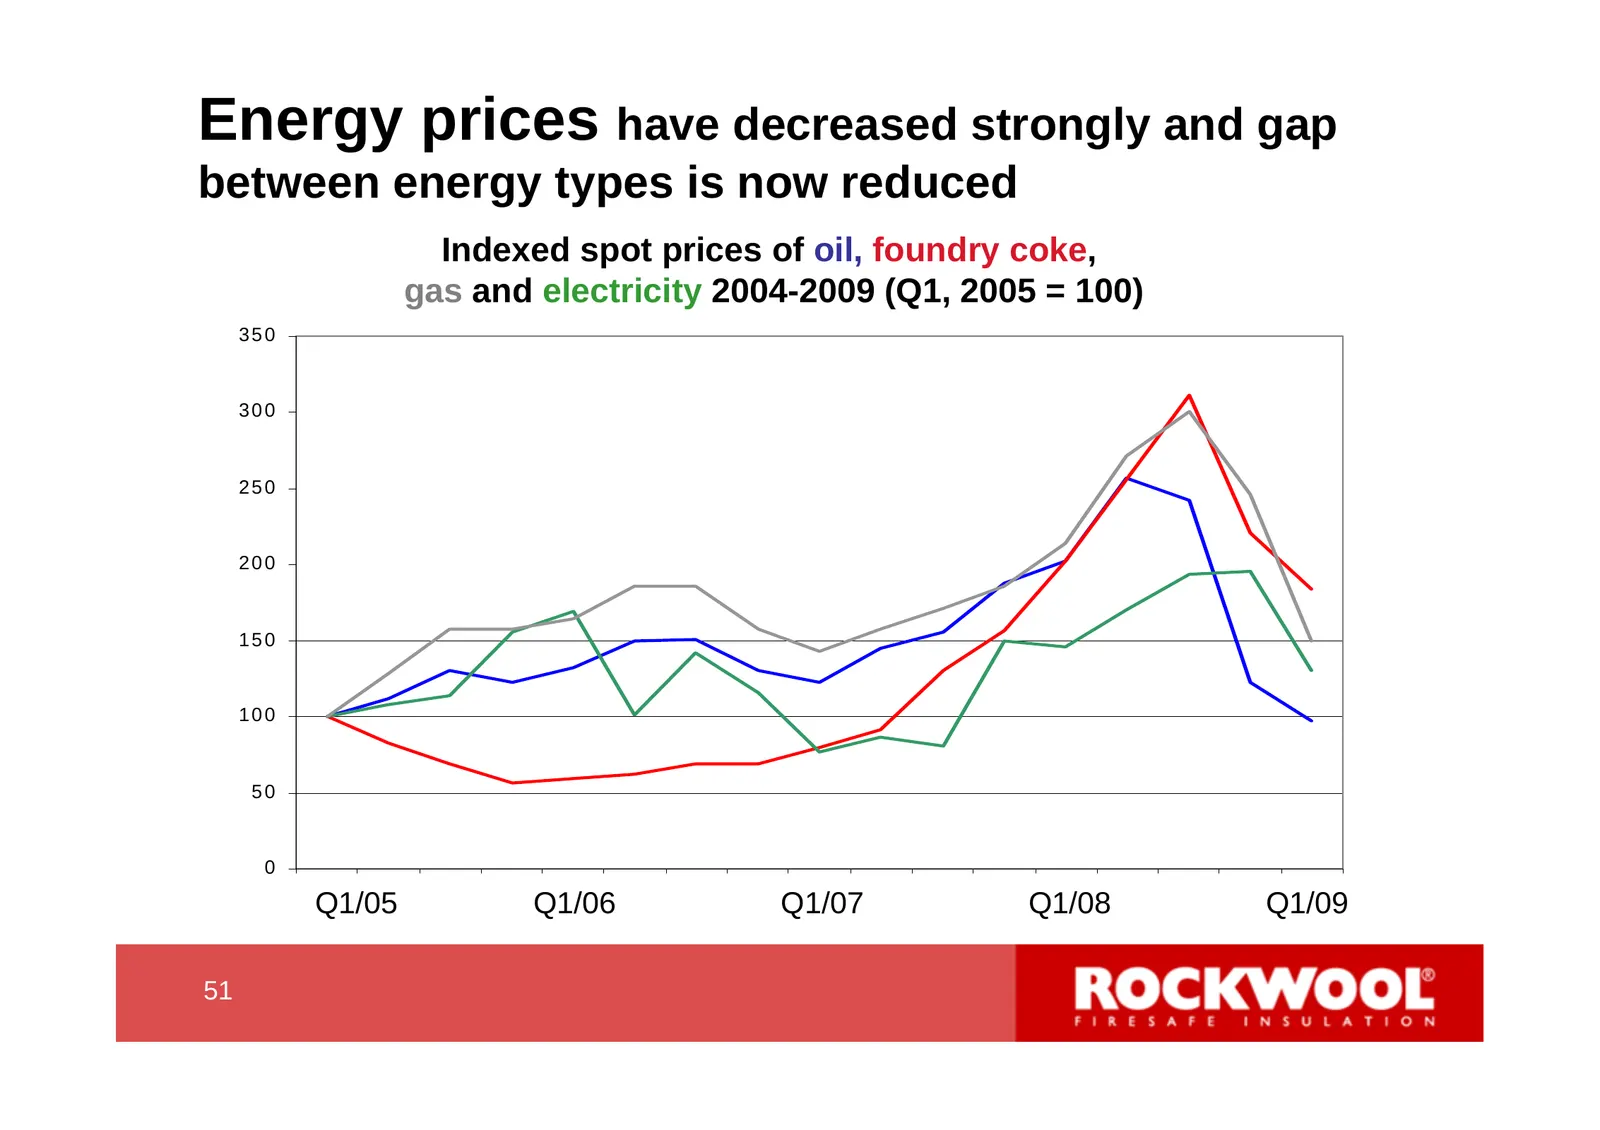
Slide 51: Energy prices have decreased strongly
Energy prices have decreased strongly and gap between energy types is now reduced Indexed spot prices of oil, foundry coke, gas and electricity 2004-2009 (Q1, 2005 = 100) 350 300 250 200 150 100 50 0 Q 1 /0 5 Q 1 /0 6 Q 1 /0 7 Q 1 /0 8 Q 1 /0 9 Q1/05 Q1/06 Q1/07 Q1/08 Q1/09 51 51
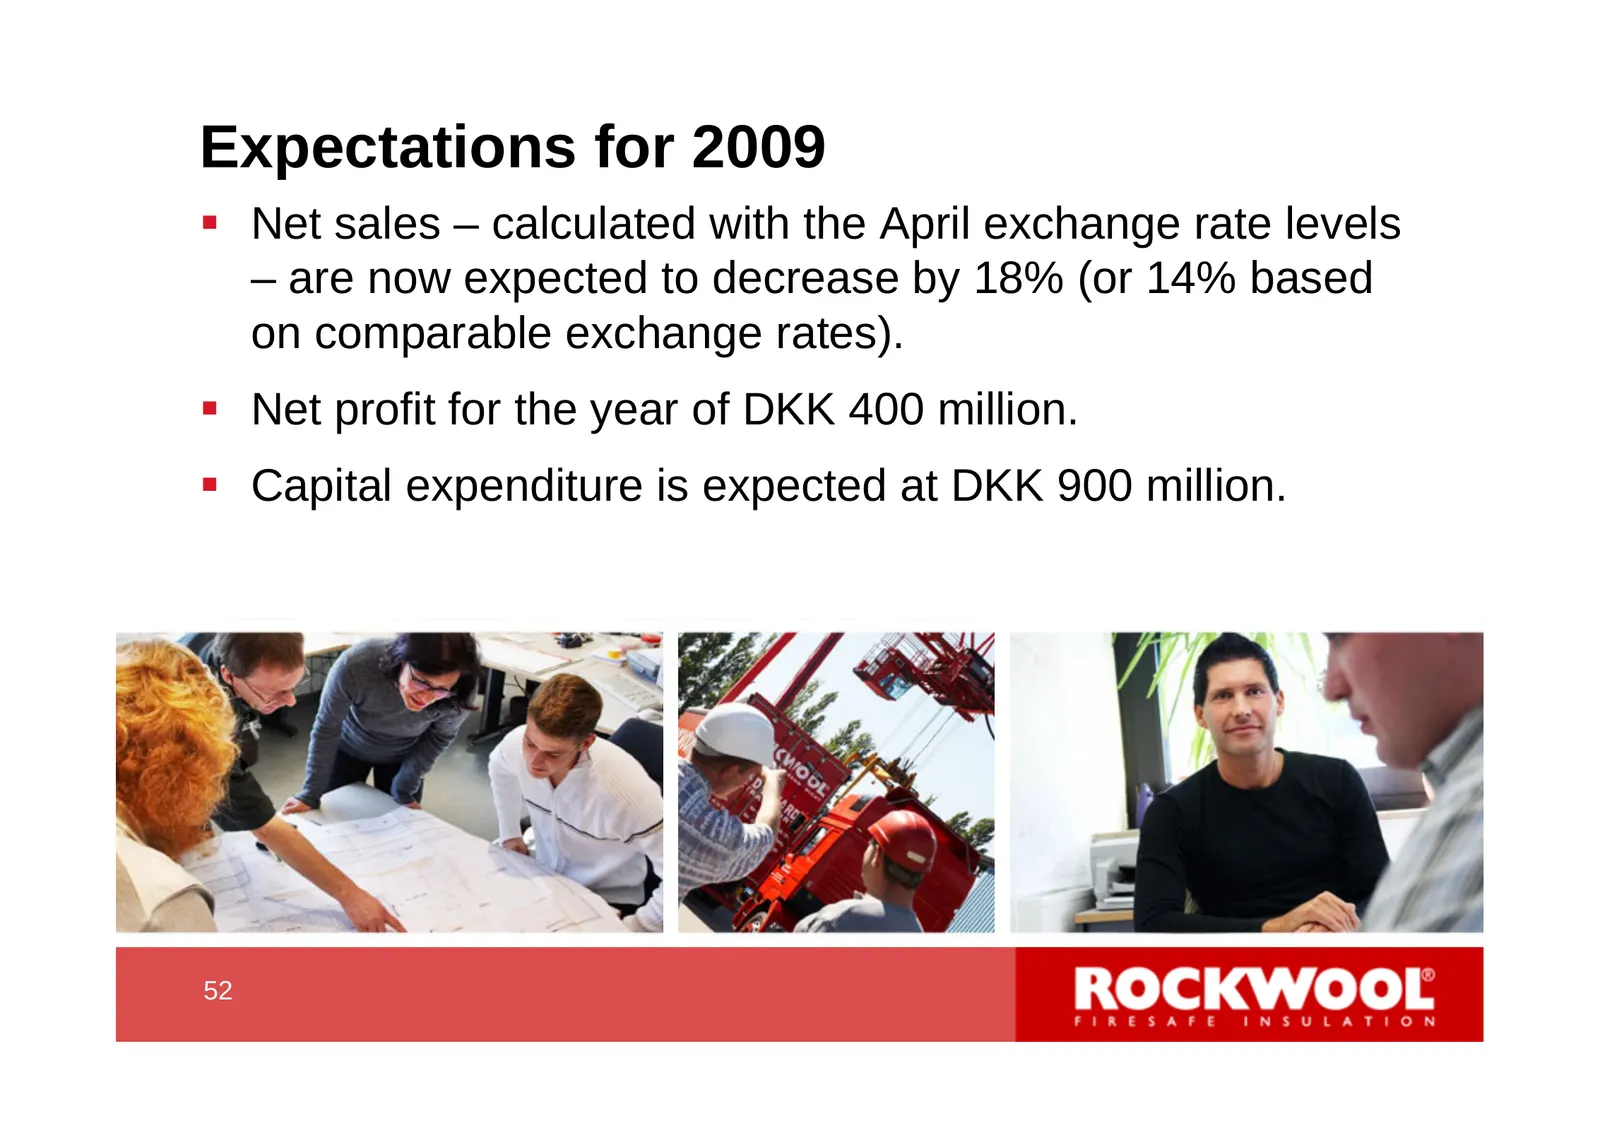
Slide 52: Expectations for 2009
Expectations for 2009 Net sales – calculated with the April exchange rate levels – are now expected to decrease by 18% (or 14% based on comparable exchange rates). Net profit for the year of DKK 400 million. Capital expenditure is expected at DKK 900 million. 52 52
Slide 53: Long-term energy efficiency need – acquisition opportunities
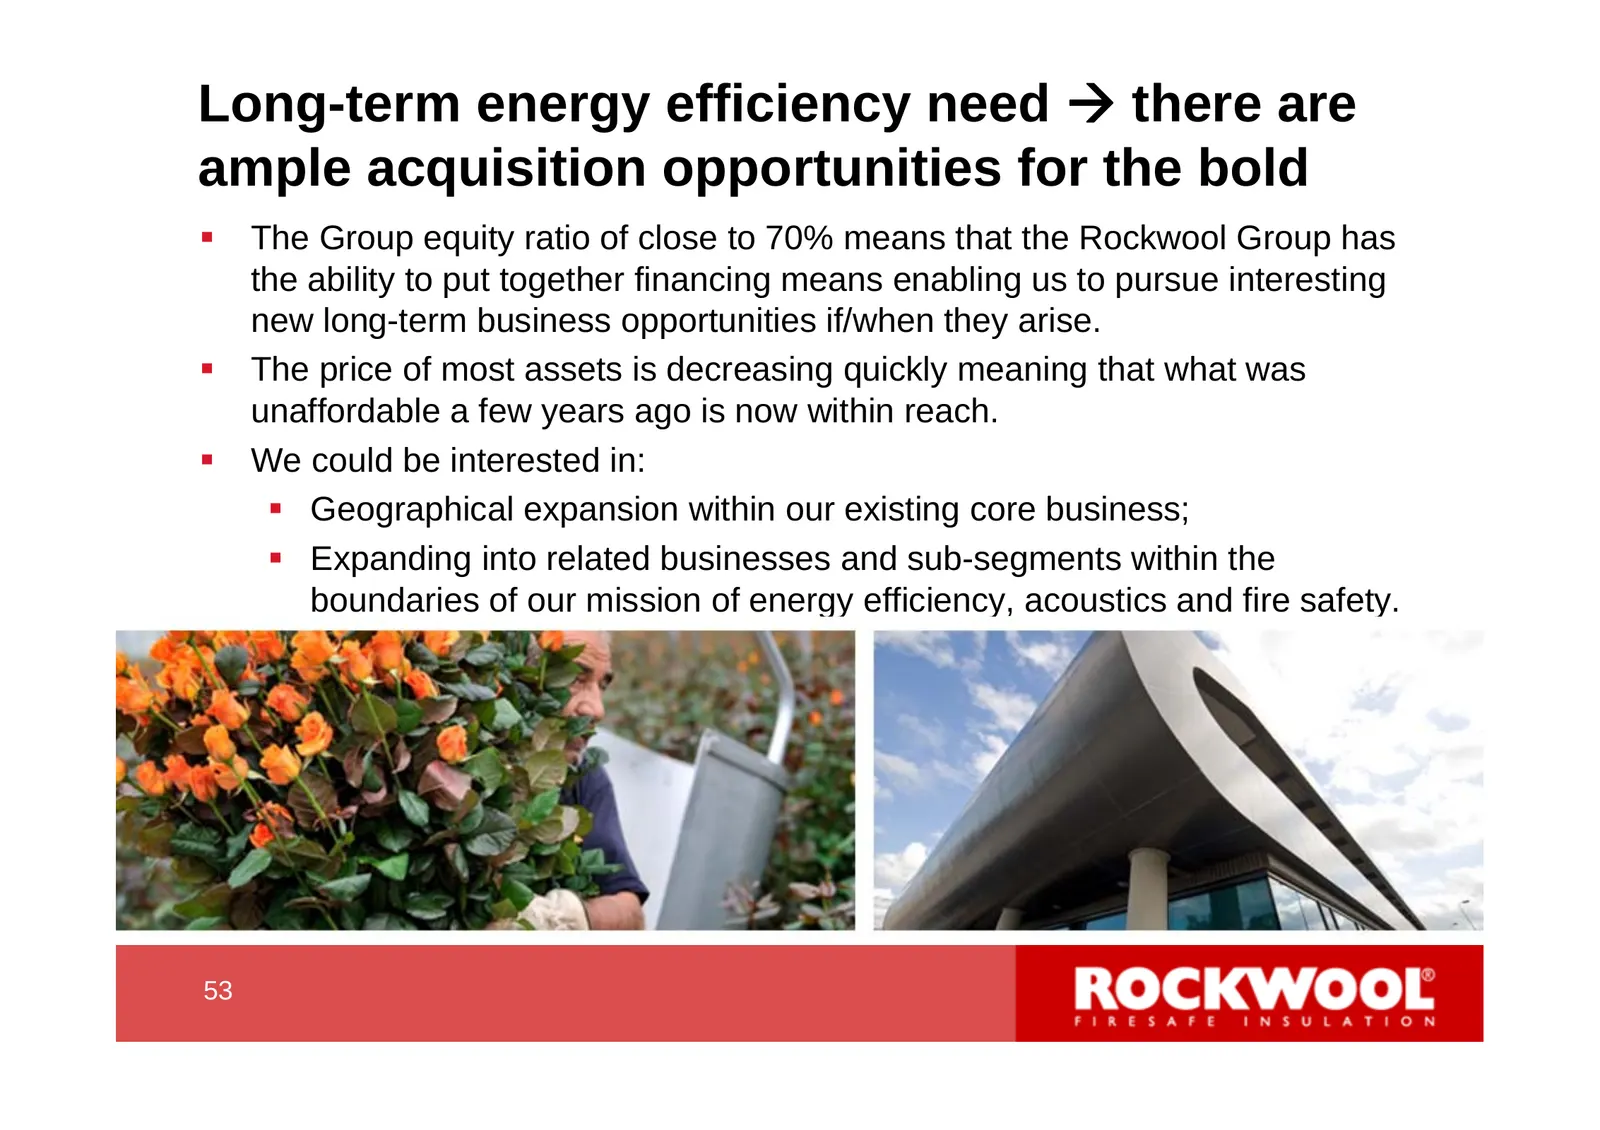
Long-term energy efficiency need Æ there are ample acquisition opportunities for the bold The Group equity ratio of close to 70% means that the Rockwool Group has the ability to put together financing means enabling us to pursue interesting new long-term business opportunities if/when they arise.
Slide 54: Long term sales development 1984-2009e
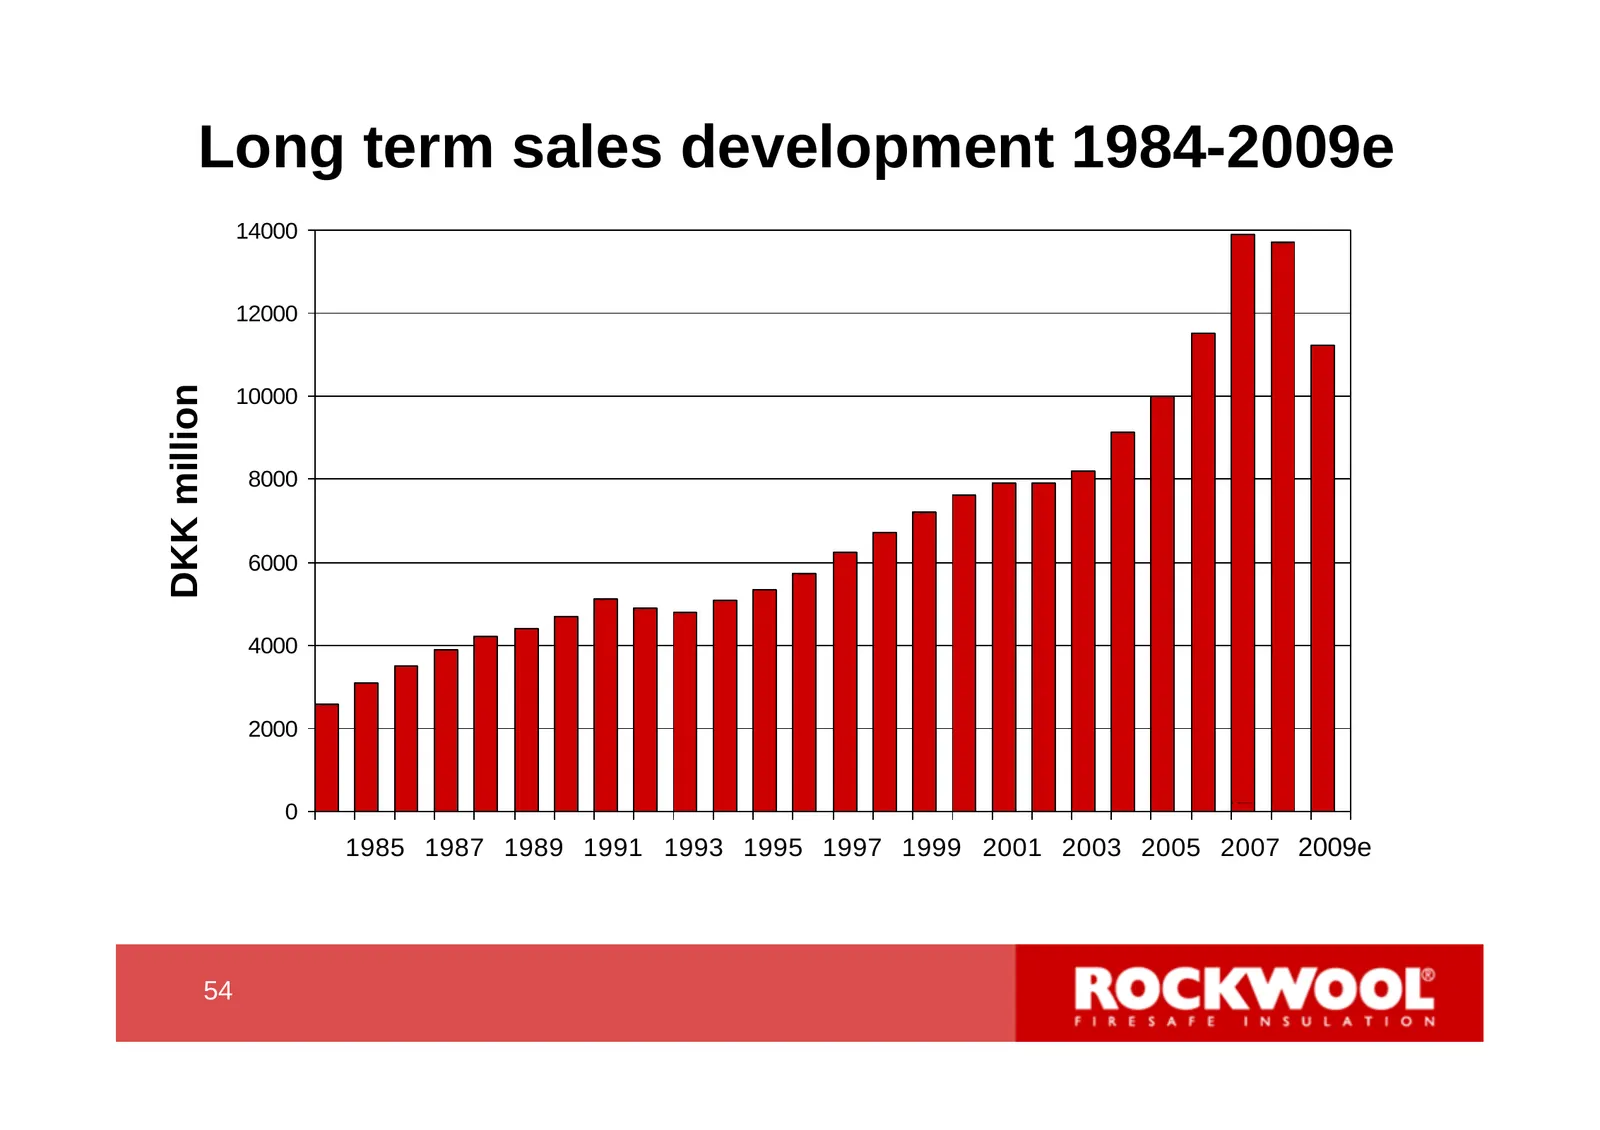
Long term sales development 1984-2009e 14000 12000 DKK million 10000 8000 6000 4000 2000 0 2009e 1985 1987 1989 1991 1993 1995 1997 1999 2001 2003 2005 2007 2009e 54 54
Slide 55: Long term EBITDA ratio 1984-2009e
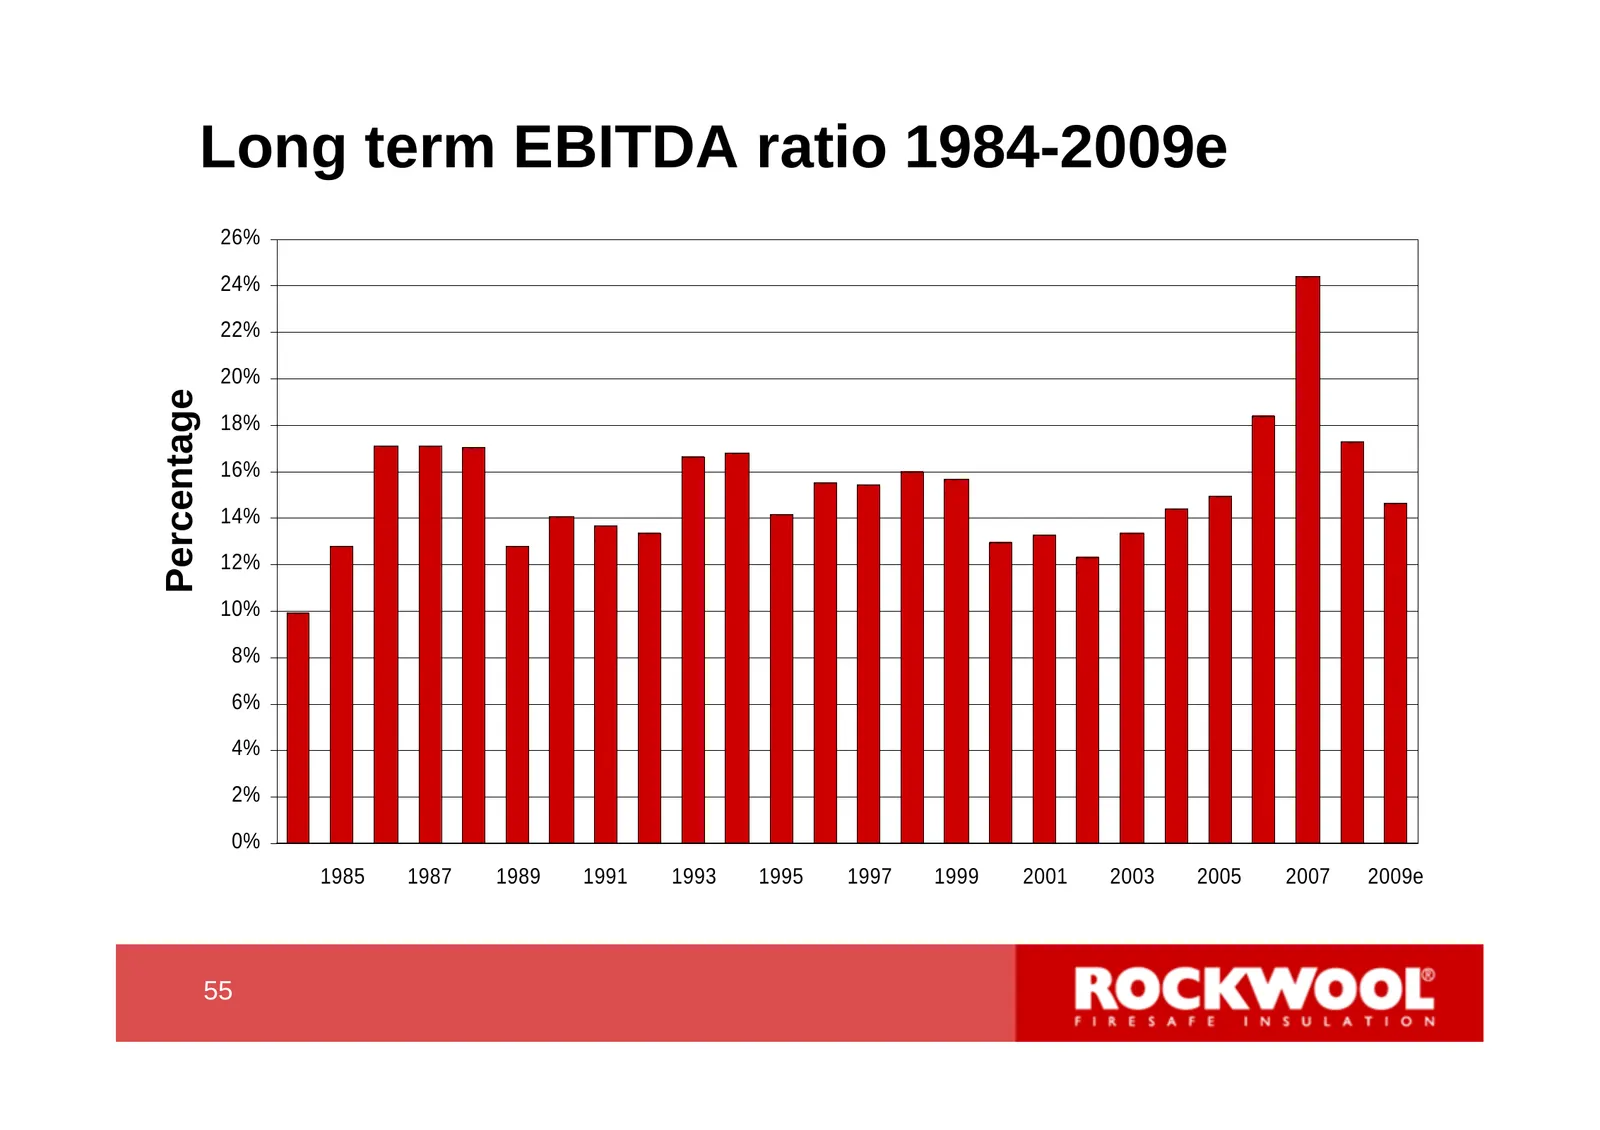
Long term EBITDA ratio 1984-2009e 26% 24% 22% 20% Percentage 18% 16% 14% 12% 10% 8% 6% 4% 2% 0% 1985 1987 1989 1991 1993 1995 1997 1999 2001 2003 2005 2007 2009e 55 55
Slide 56: Long term EBIT ratio 1984-2009e
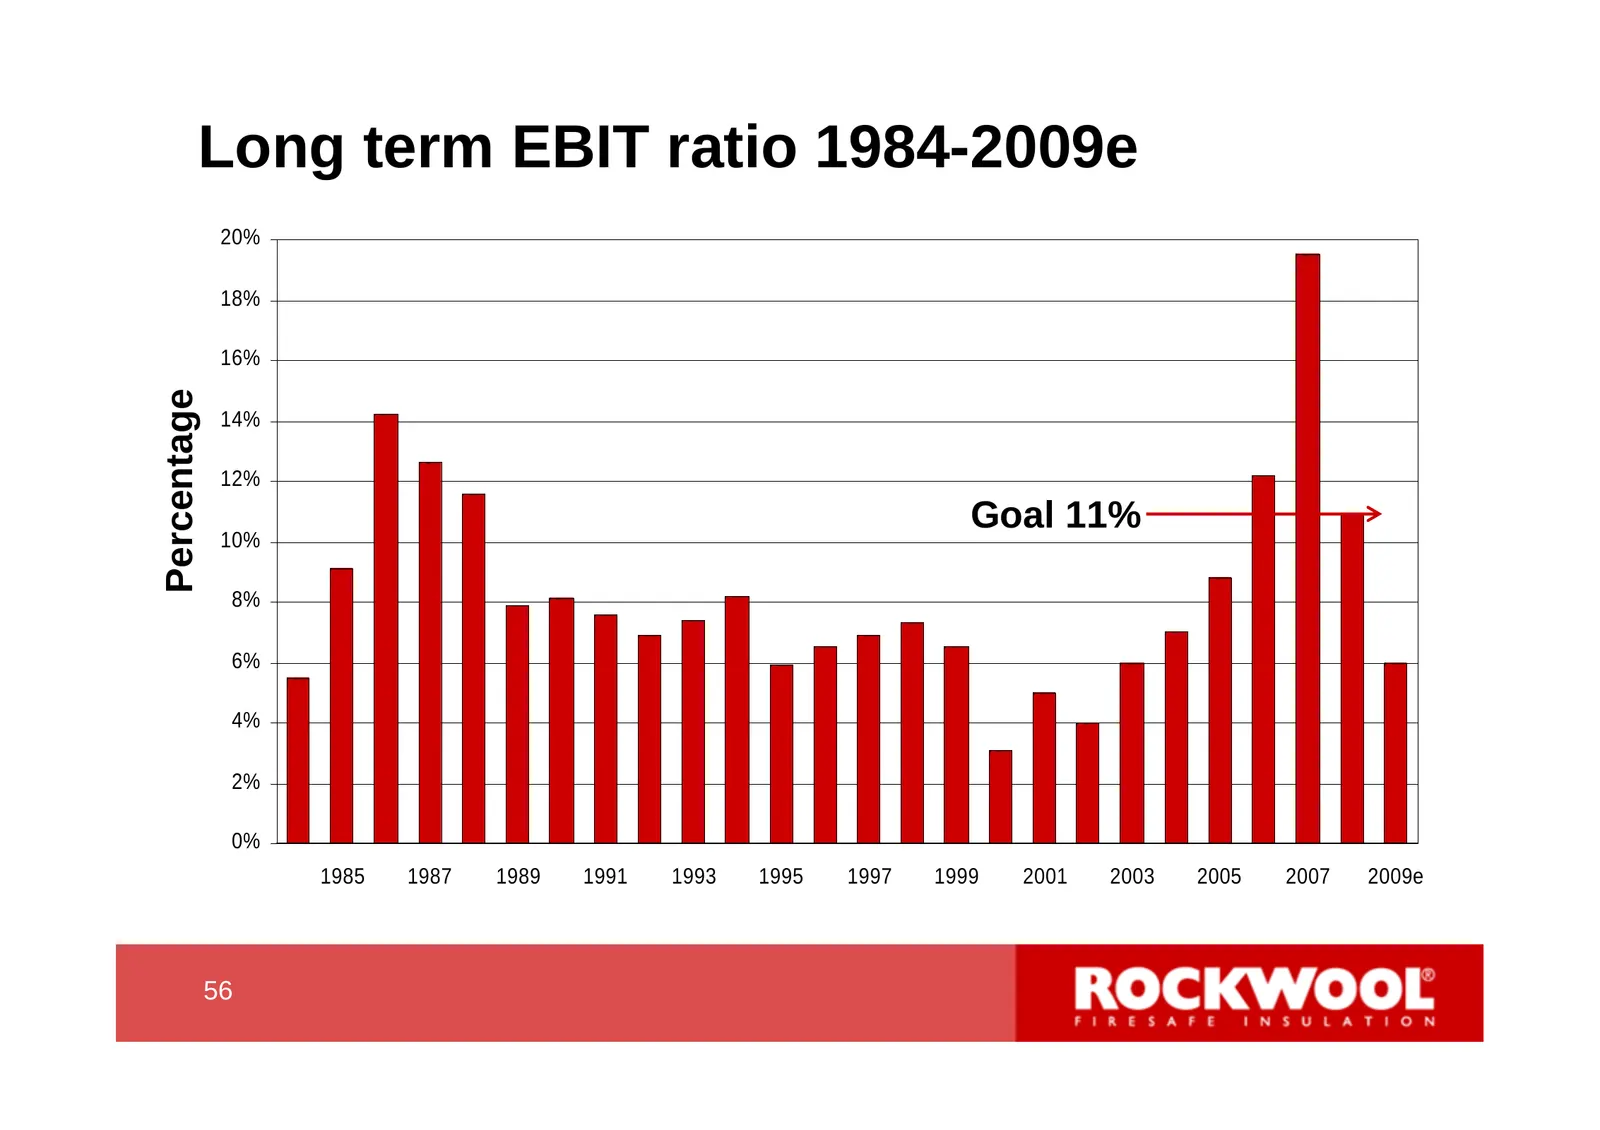
Long term EBIT ratio 1984-2009e 20% 18% 16% Percentage 14% 12% Goal 11% 10% 8% 6% 4% 2% 0% 1985 1987 1989 1991 1993 1995 1997 1999 2001 2003 2005 2007 2009e 56 56
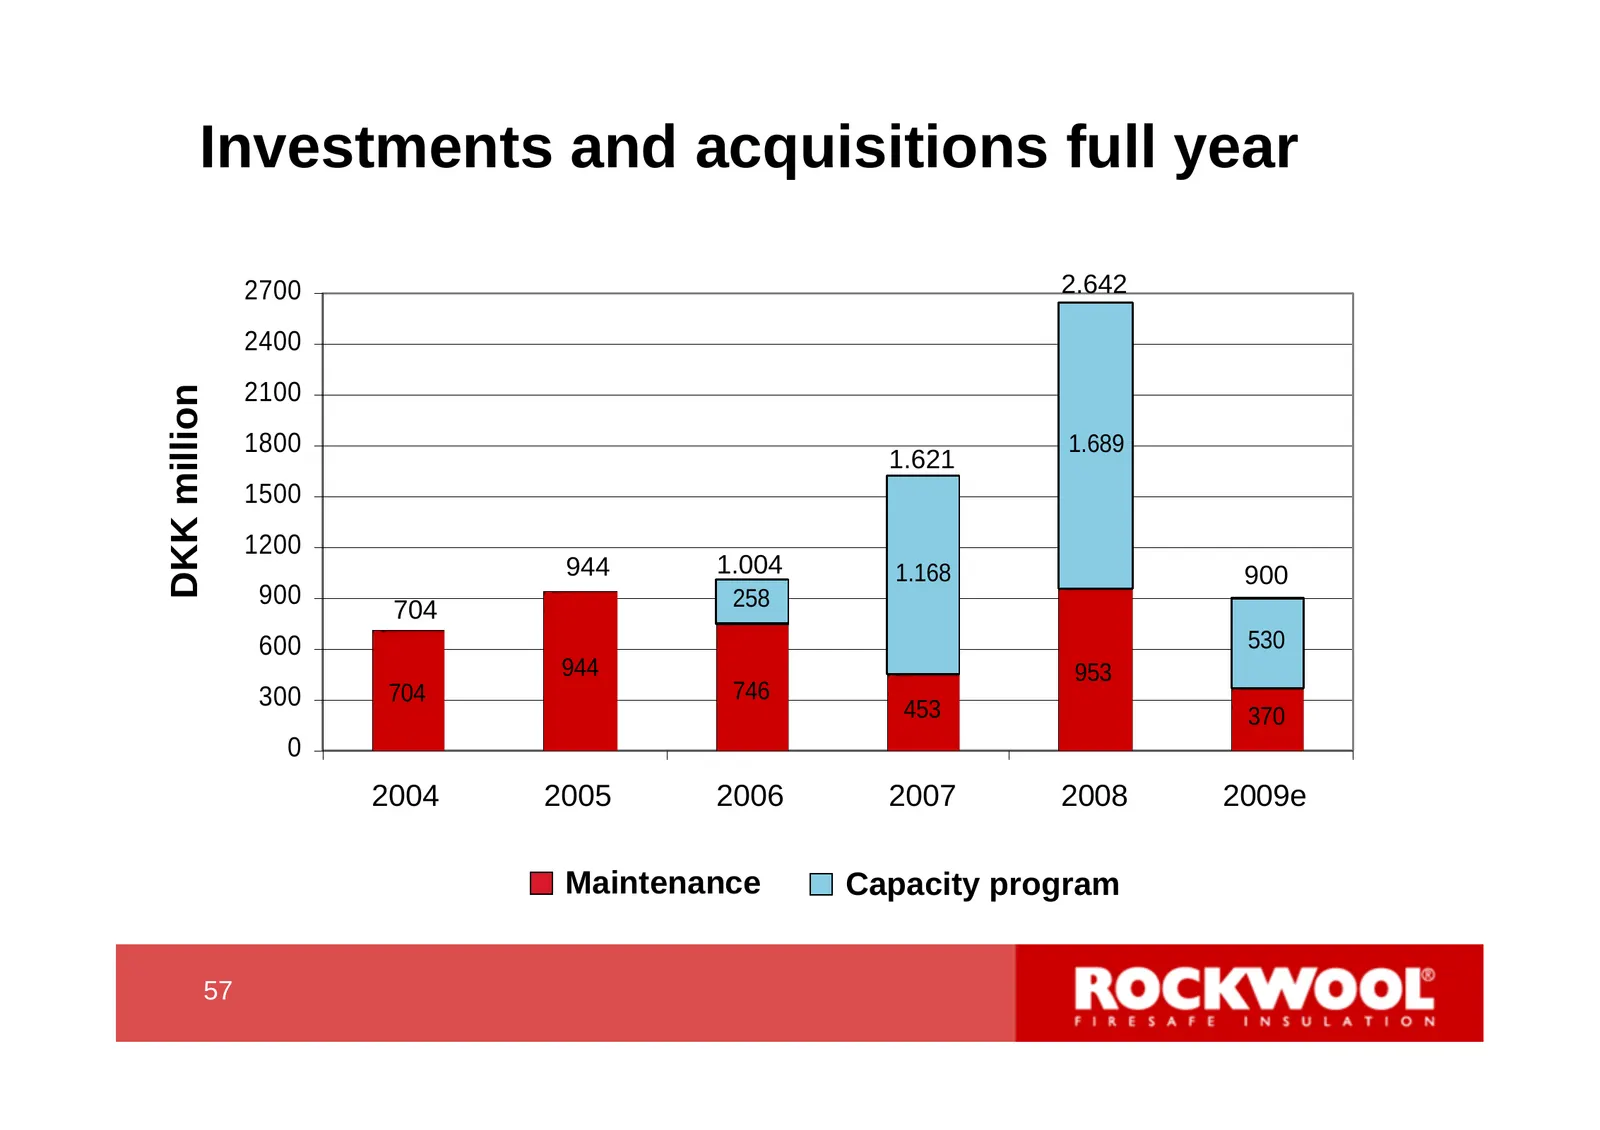
Slide 57: Investments and acquisitions full year
Investments and acquisitions full year 2700 2.642 2400 2100 DKK million 1800 1.689 1.621 1500 1200 944 1.004 1.168 900 900 258 704 600 530 944 953 300 704 746 453 370 0 1 2004 2 2005 3 2006 4 2007 5 2008 6 2009e Maintenance Capacity program 57 57
Slide 58: Questions
Questions CFO Gilles Maria Director Thorkild Diness Jensen 58 58
Source: Internet Archive copy of rockwool.com
More decks from Rockwool A/S Class A
 Q2 2026 Earnings Presentation19 slides · Aug 20, 2026
 Q1 2026 Earnings Presentation15 slides · May 20, 2026
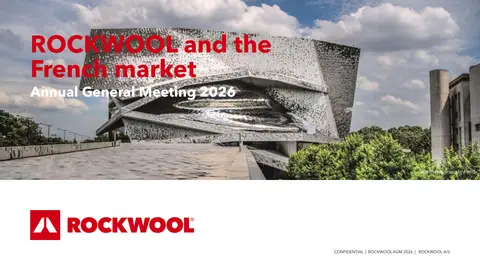 Shareholder Meeting (2026)10 slides · Apr 15, 2026
 Shareholder Meeting (April 2026)46 slides · Apr 15, 2026
 Q4 2025 Earnings Presentation19 slides · Feb 5, 2026
 Q2 2025 Earnings Presentation17 slides · Aug 21, 2025