Susquehanna Bancshares — Investor Presentation (July 2012)
34 slides from Susquehanna Bancshares's investor presentation, Jul 30, 2012

Slide 1: Susquehanna Bancshares Investor Presentation 2nd Quarter 2012
William J. Reuter Chairman & CEO Drew K. Hostetter Chief Financial Officer Susquehanna Bancshares, Inc. Investor Presentation 2 Quarter, 2012 Exhibit 99.1 nd
Slide 2: Susquehanna Profile
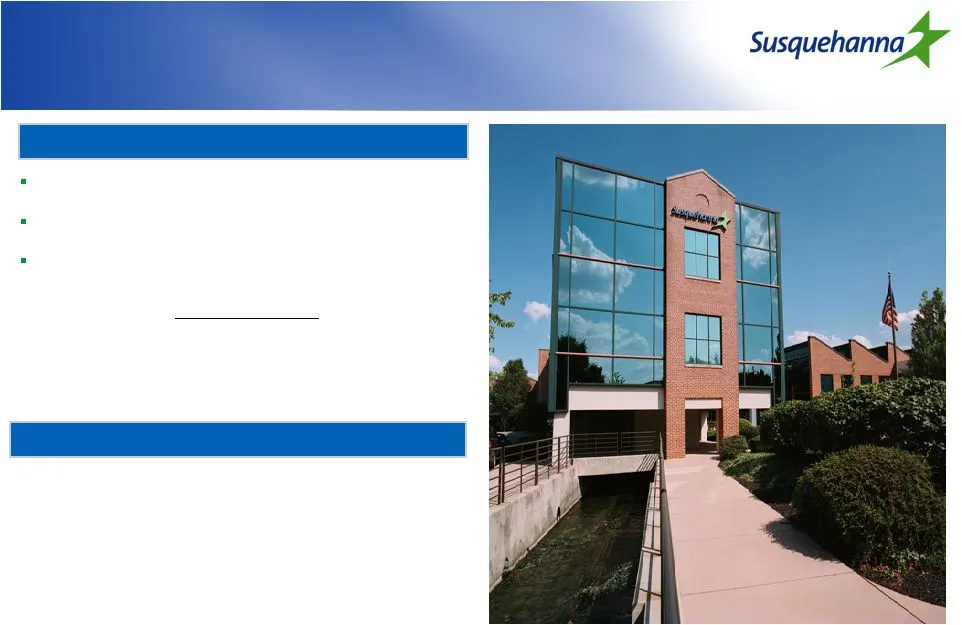
Susquehanna Profile Corporate Overview Financial Highlights 6/30/2012 Susquehanna Profile Super-Community Bank headquartered in Lititz, PA 260 banking offices located in PA, NJ, MD and WV th largest U.S. commercial bank based on asset size Assets: $18.0 billion Deposits: $12.7 billion Loans & Leases
Slide 3: Executive Leadership Team
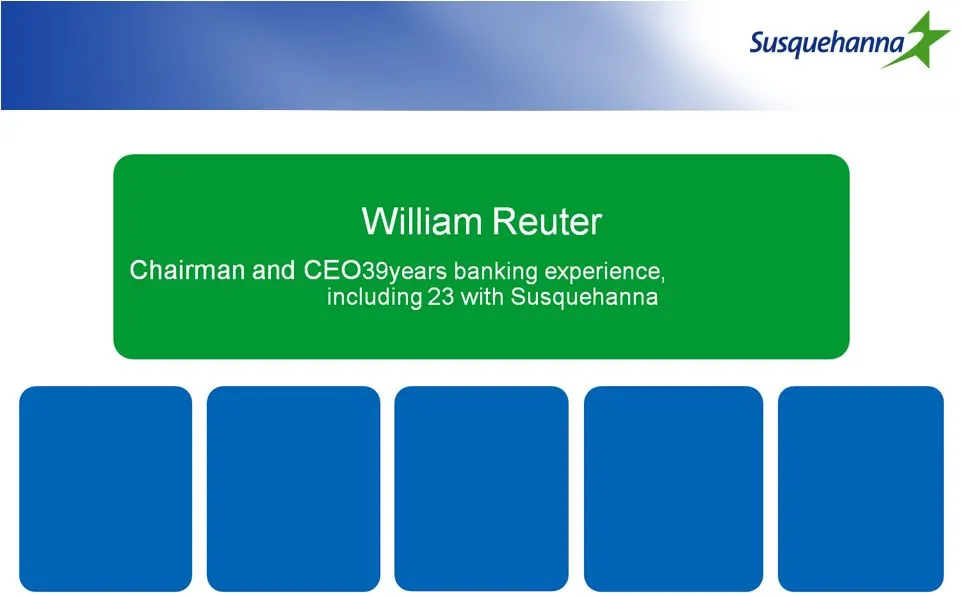
Executive Leadership Team Drew Hostetter Chief Financial Officer 30 years banking experience, including 18 with Susquehanna Michael Quick Chief Corporate Credit Officer 42 years banking experience, including 21 with Susquehanna Gregory Duncan Chief Operating Officer 29 years banking experience, incl
Slide 4: Top Market Share in Counties - Branch Map
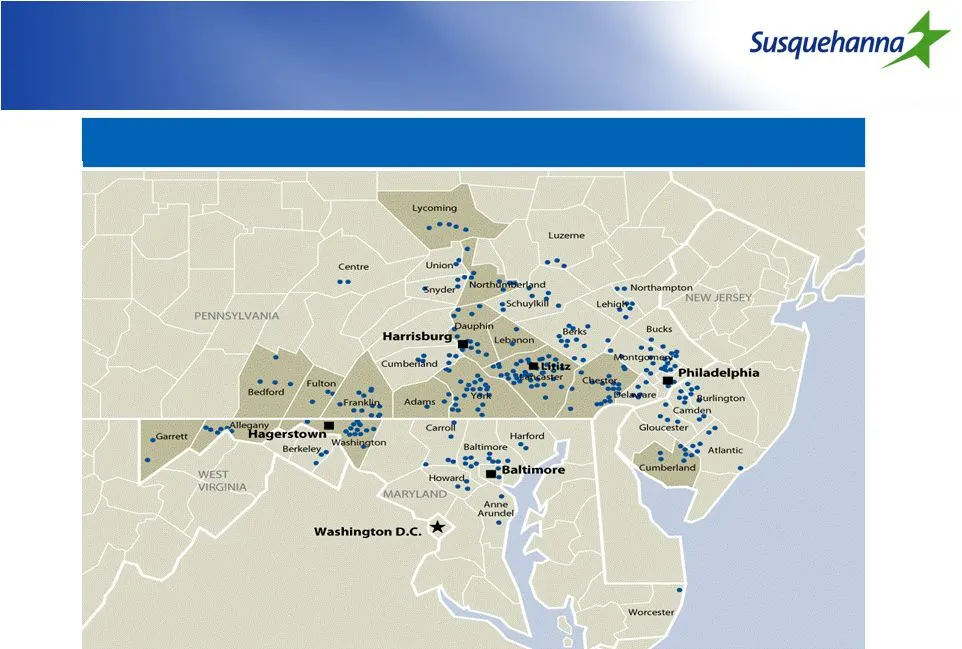
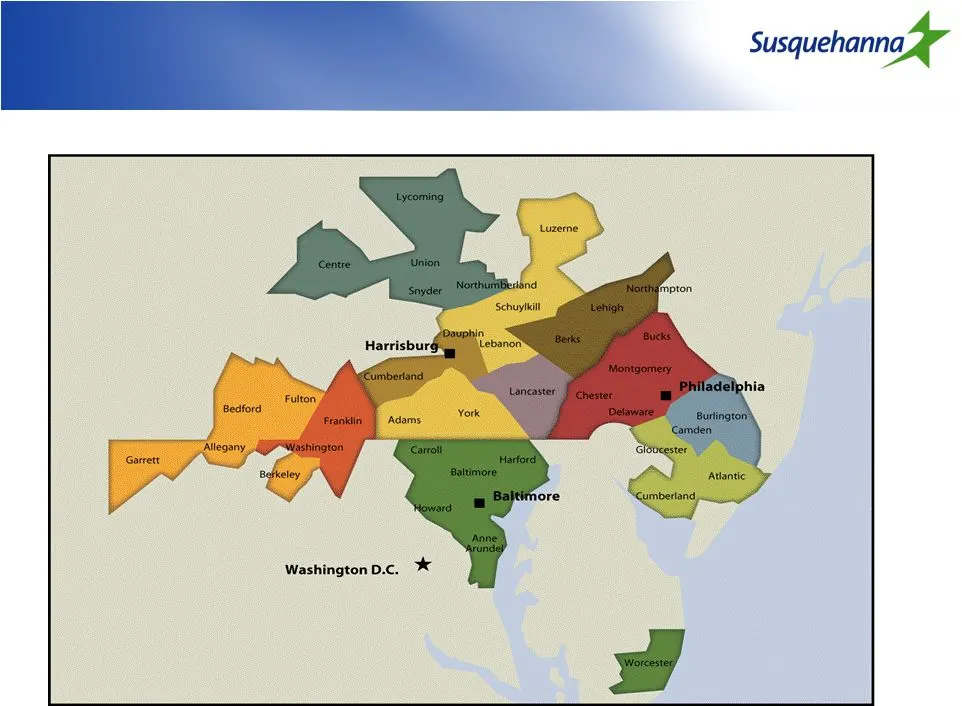
Top 3 Market Share in 14 Counties Susquehanna Bank Branch Map Top 3 Market Share in 14 Counties Source: SNL Financial Note: Shaded counties indicate those in which Susquehanna holds a top 3 market position
Slide 5: Attractive Footprint
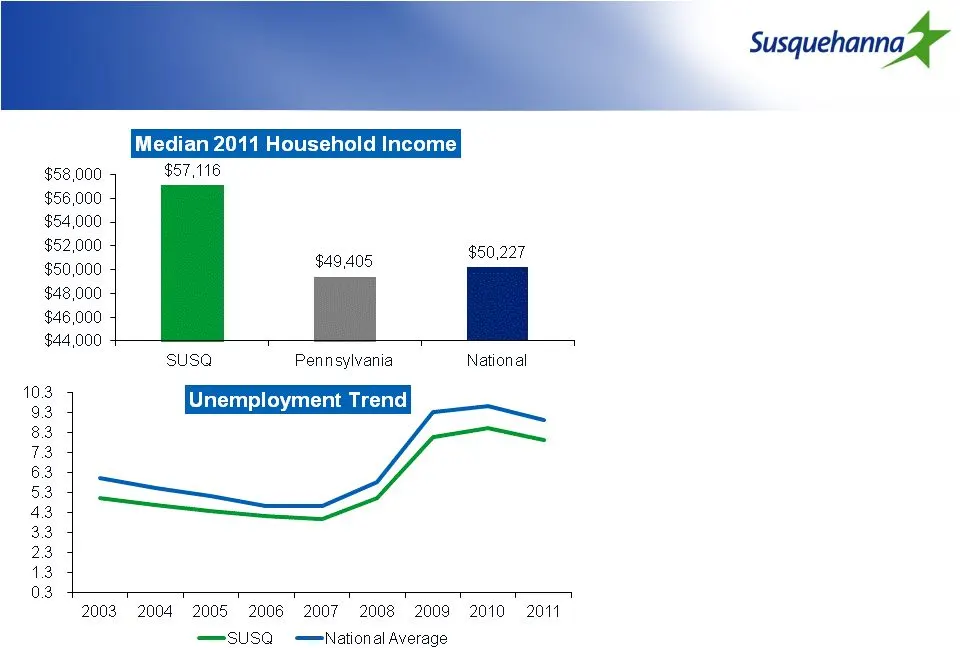
Attractive Footprint Source: SNL Financial and United States Department of Labor Susquehanna Bancorp Inc. weighted by county deposits Strong markets that are demographically and economically diverse SUSQ operates in 8 of the top 20 counties in PA, MD and NJ for median household income. Unemployment
Slide 6: Community Banking Opportunities
Community Banking Opportunities Deposit Market Share: Counties of Operation Community Banking Opportunities Source: SNL Financial Note: Regulatory branch and deposit data as of June 30, 2011; banks and thrifts with deposits in counties SUSQ operates in Pa/NJ/MD Tradition branches only, as defined by

Slide 7: Main Street Banking The Susquehanna Way
Main Street Banking The Susquehanna Way Main Street Banking The Susquehanna Way Personalized customer service of a local community bank, backed by the lending capacity and diverse expertise of a regional financial services company A focus on building enduring relationships Broad, diverse product off
Slide 8: Regional Banking Model
Regional Banking Model Regional Banking Model 12 Regions with local leadership teams
Slide 9: Regional Banking Model
Regional Banking Model Stress “ownership” of local markets by leadership teams Each region is led by a regional president and retail and commercial executives with strong community ties Customers have access to bank decision makers Line of business reporting for cash management, commercial real esta
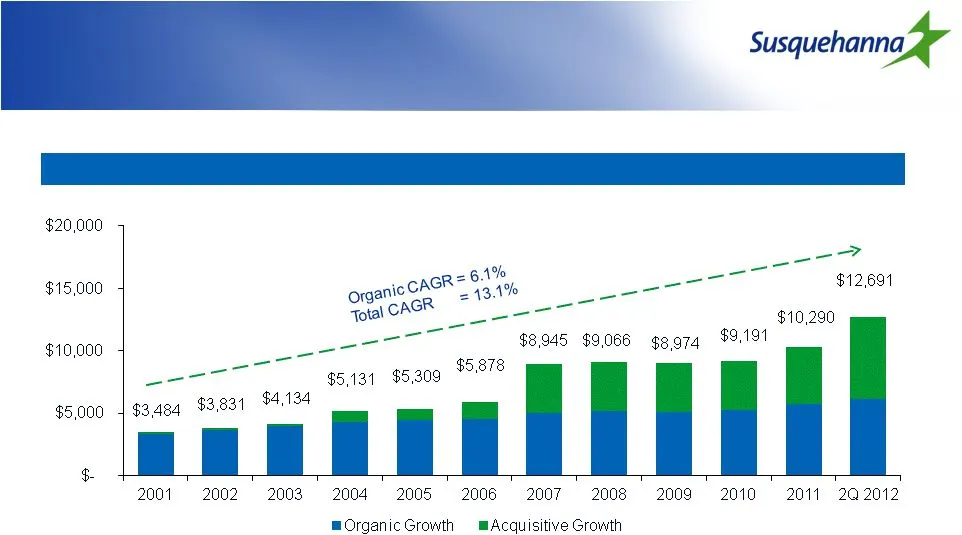
Slide 10: Organic growth supported by strategic acquisitions
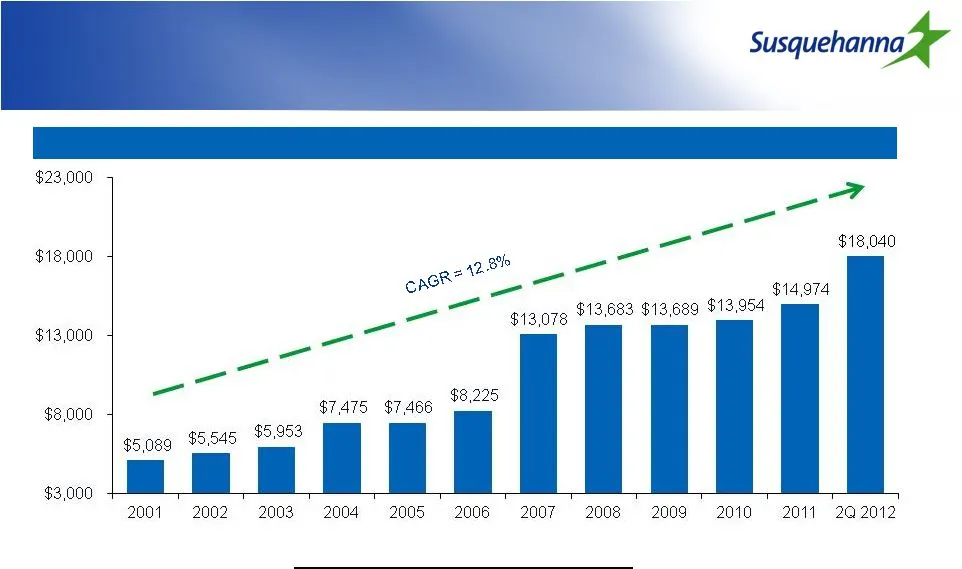
Organic growth supported by strategic acquisitions Assets ($ millions) Organic growth supported by strategic acquisitions Completed Bank Acquisitions 2003 –Patriot Bank Corp. 2005 –Minotola National Bank 2007 –Community Banks Inc. 2011 –Abington Bancorp, Inc. 2012 –Tower Bancorp, Inc.
Slide 11: Deposit Growth
Deposit Growth Deposits ($ millions) Deposit Growth
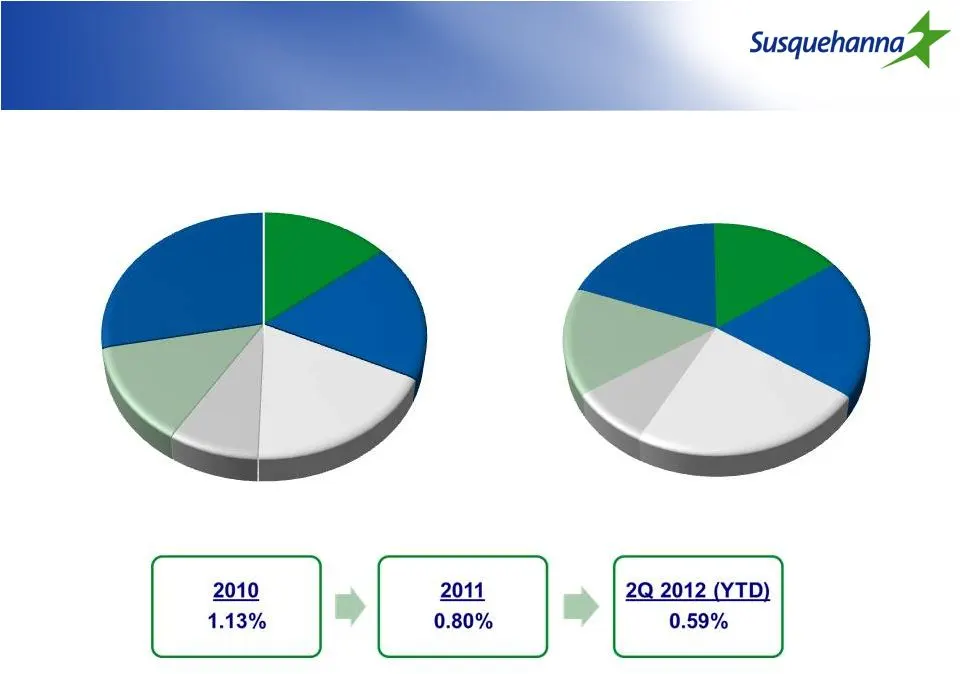
Slide 12: Deposit Composition
Deposit Composition Demand, 14% Interest Bearing Checking, 18% Time < $100K, 28% Demand Deposits, 15% Interest Bearing Checking, 20% Time < $100K, 19% Deposit Composition Average Cost of Deposits Money Market, 18% Savings, 8% Time of $100K or more, 13% 12/31/2009 Money Market, 23% Savings, 8% Time o
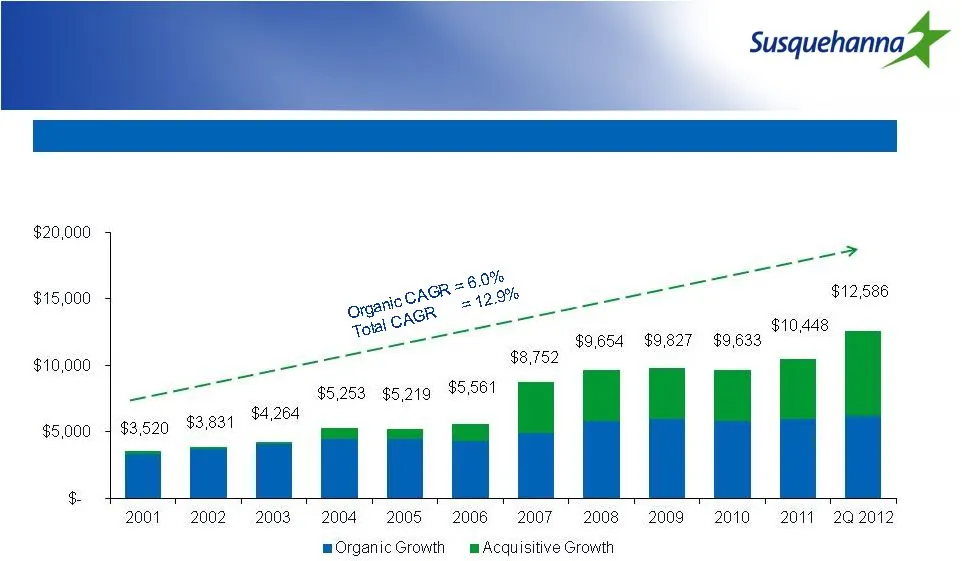
Slide 13: Loan Growth
Loan Growth Loans ($ millions) Loan Growth
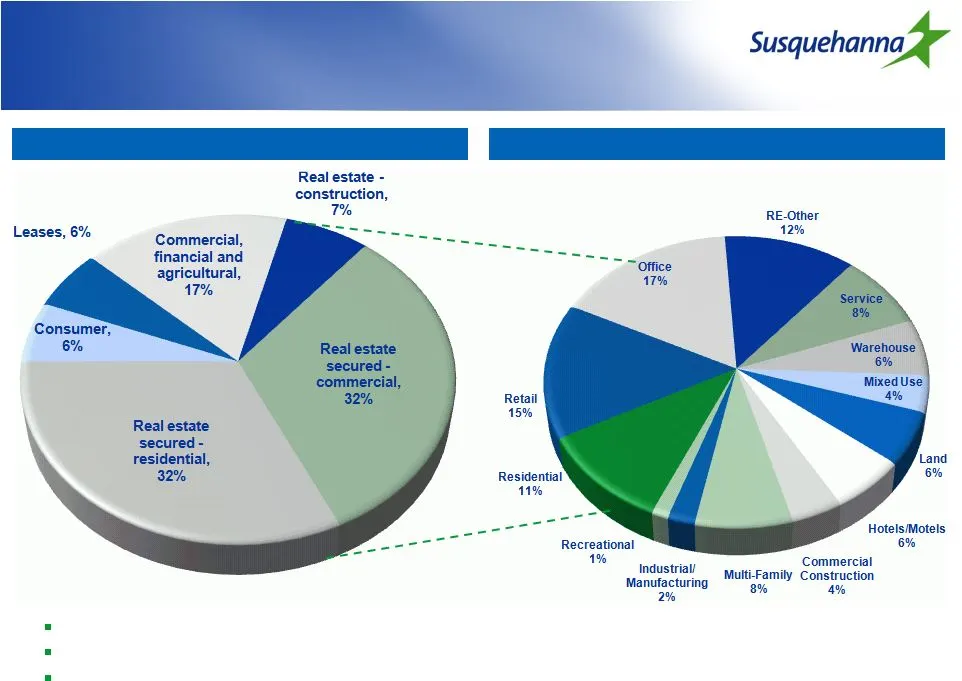
Slide 14: Loan Composition
Loan Composition Total Loans 6/30/2012 Total CRE & Construction Loans Loan Composition Diversified loan portfolio Construction and LAD composition decreased from 15% in 2007 to 7% at 6/30/2012 Continued focus on C&I lending
Slide 15: Asset Quality
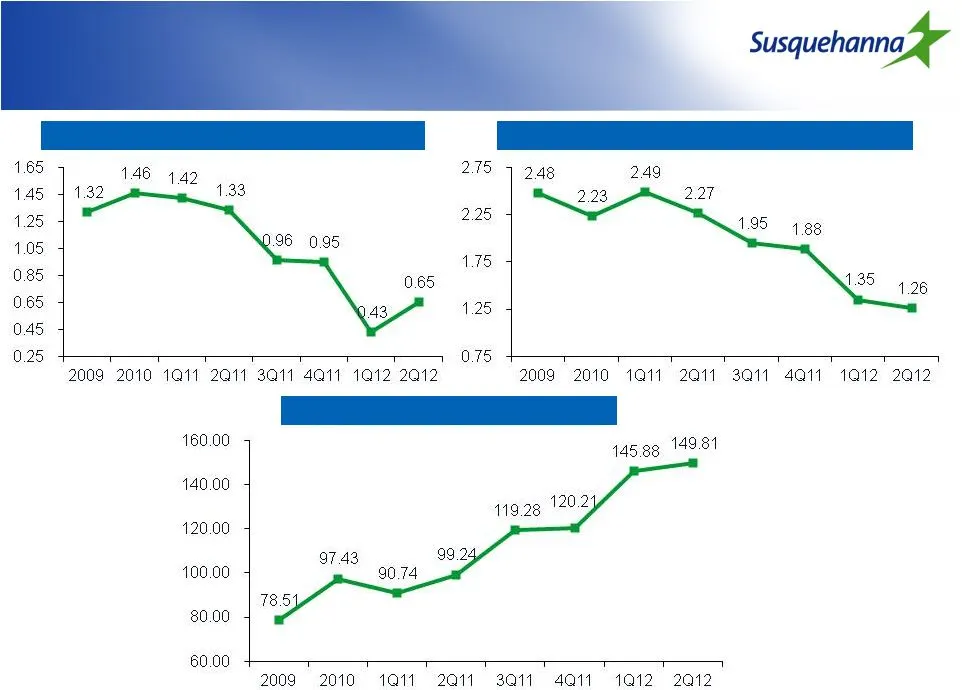
Asset Quality Net Charge-Offs / Average Loans & Leases (%) NPAs / Loans & leases + foreclosed real estate (%) ALLL / Nonaccrual loans & leases (%) Asset Quality
Slide 16: Quarterly Loan and Lease Originations
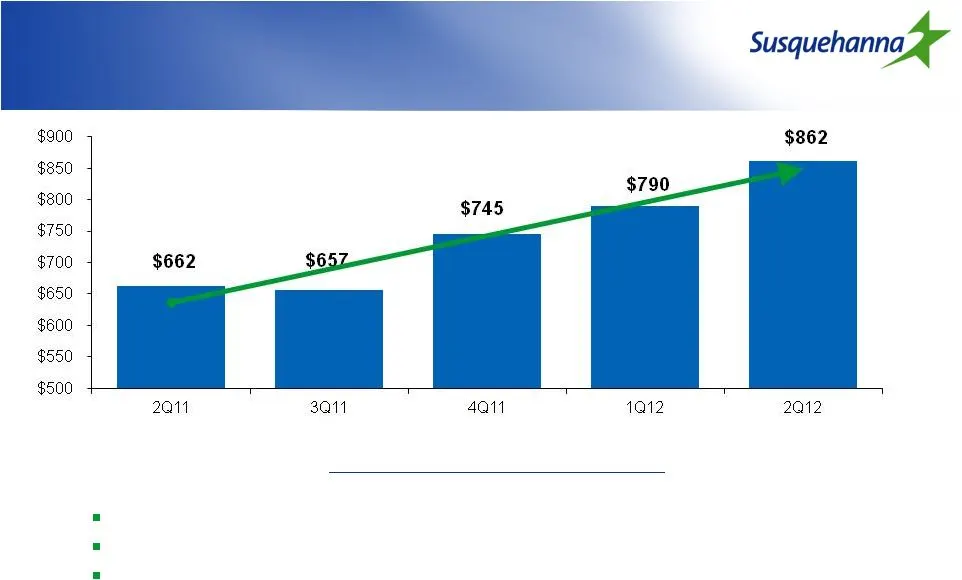
Quarterly Loan and Lease Originations ($ in Millions) Quarterly Loan and Lease Originations ($ in Millions) Loan and Lease Activity Trends Overall loan originations are up 30% from 2Q 2011 C&I originations are up 72% vs. 2Q 2011 HELOC originations are up 34% versus 2Q 2011
Slide 17: Net Income
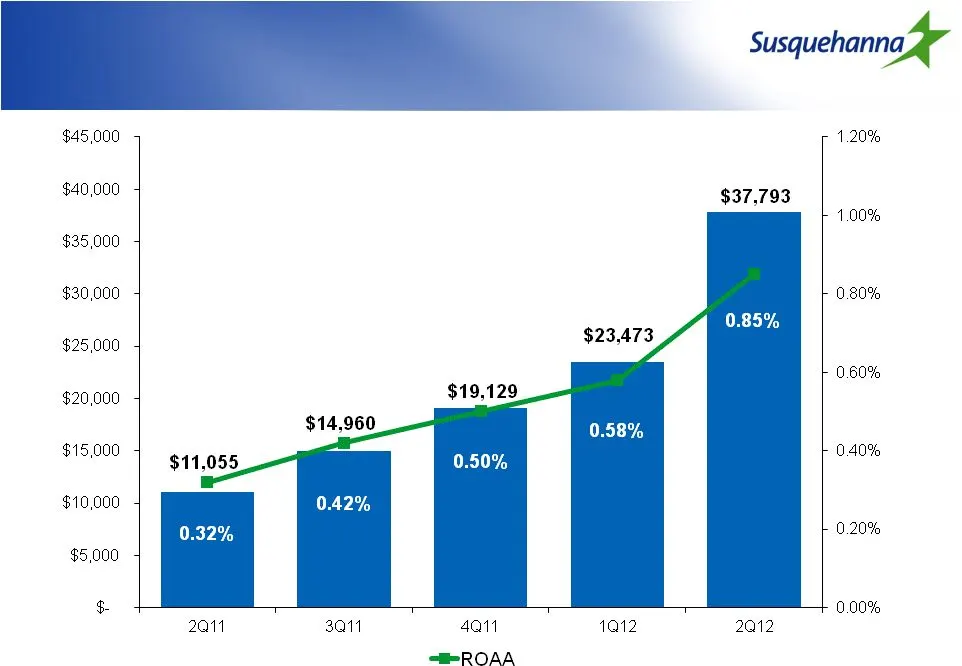
Net Income ($000s) Net Income ($000s)
Slide 18: Net Interest Margin
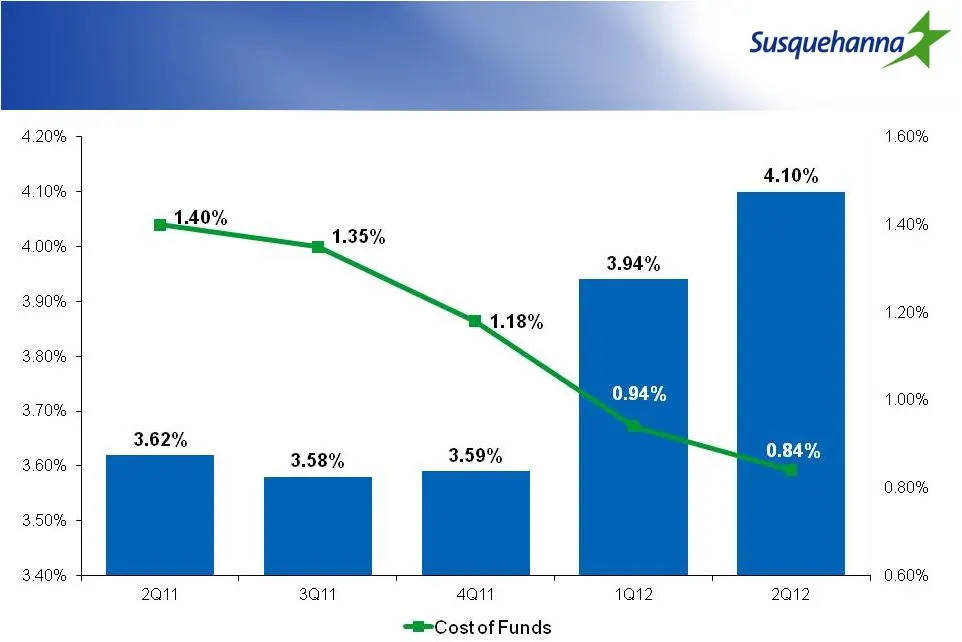
Net Interest Margin Net Interest Margin
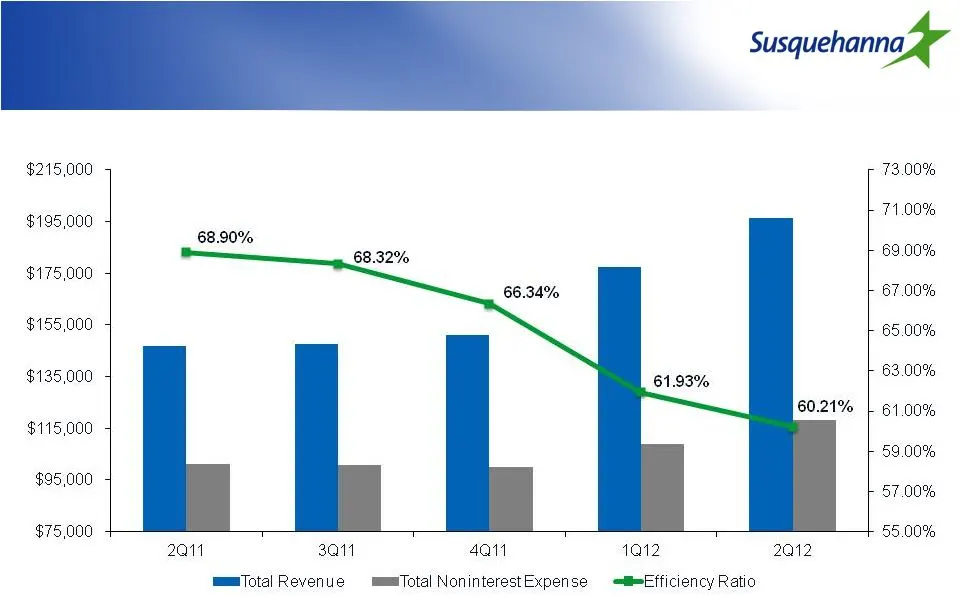
Slide 19: Efficiency Ratio
Efficiency Ratio * Efficiency Ratio *Efficiency ratio excludes net realized gain on acquisition, merger related expenses and loss on extinguishment of debt.
Slide 20: Capital Ratios
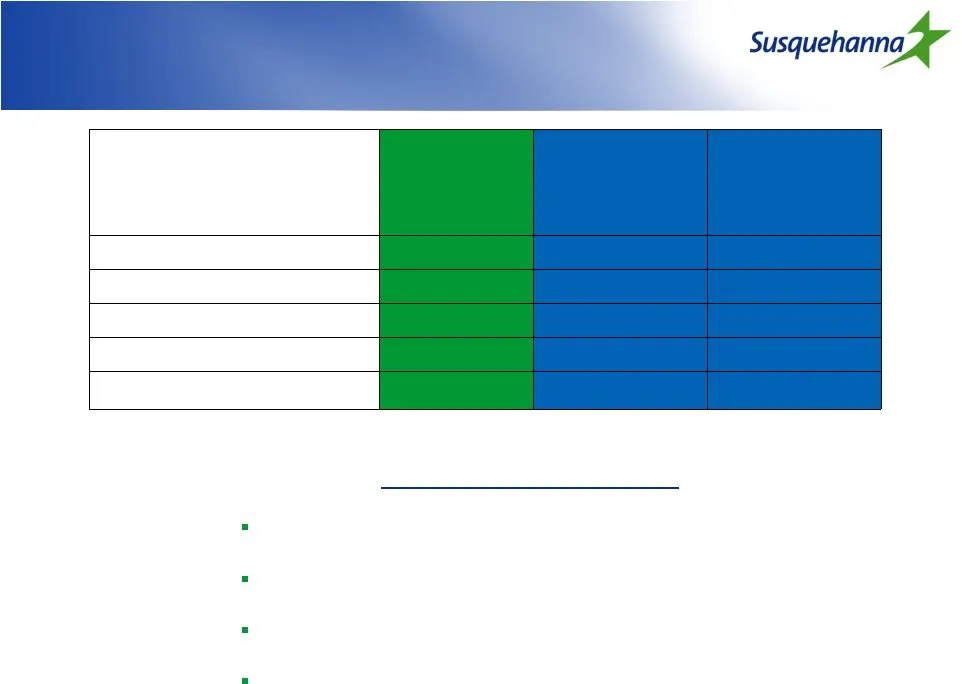
Capital Ratios 6/30/2012 Proposed Minimum Basel III Requirements* Management Minimum Targets 7.64%** N/A 7.50% 9.97% 7.00% 8.00% 9.95% 4.00% 6.00% 12.63% 8.50% 9.50% 14.38% 10.50% 11.50% Capital Ratios Tangible Common Equity Tier 1 Common/RWA Tier 1 Leverage Tier 1 Risk-Based Total Risk-Based Capita
Slide 21: Strategic Objectives for 2012
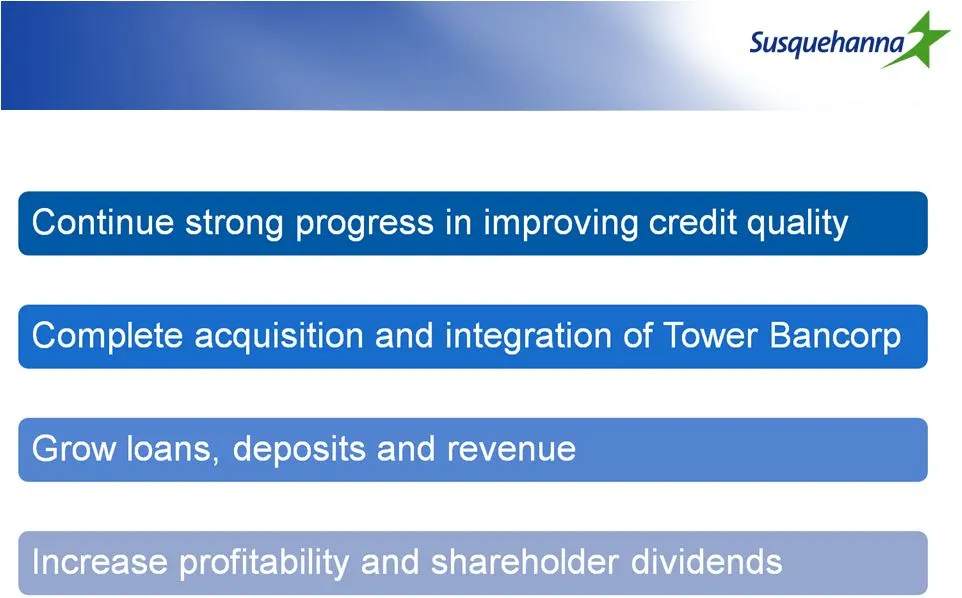
Strategic Objectives for 2012 Strategic Objectives for 2012
Slide 22: Shareholder Return
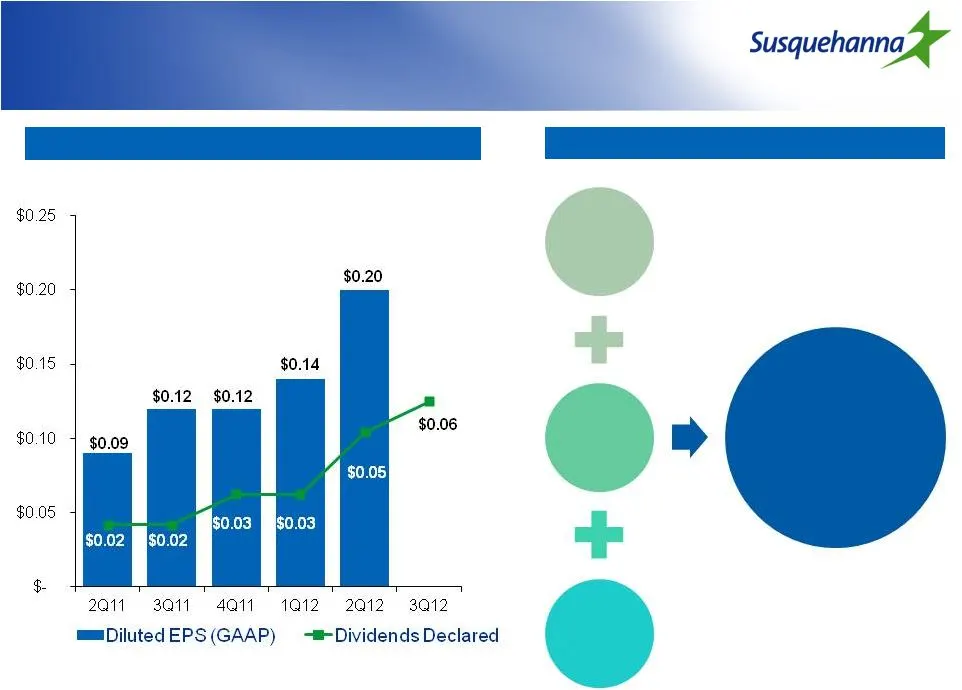
Shareholder Return Corporate Focus Improving Results Enhanced Return to Shareholders Shareholder Return Manage Credit Quality Grow Revenue Control Expenses

Slide 23: Susquehanna
Susquehanna |”

Slide 24: Additional Materials
Additional Materials
Slide 25: 2nd Quarter 2012 Financial Highlights
2 nd Quarter 2012 Financial Highlights Quarterly Performance Highlights nd Quarter Financial Highlights (Dollars in thousands, except earning per share data) 6/30/2012 3/31/2012 6/30/2011 Balance Sheet: Loans and Leases 12,585,912 $ 12,521,669 $ 9,636,187 $ Deposits 12,690,524 $ 12,563,541 $ 9,402,5
Slide 26: Improved Market Position in Focus Markets
Improved Market Position in Focus Markets Sorted by 2011 market rank Improved Market Position in Focus Markets MSA % Change Change Current Rank 1-3 Sunbury, PA 18.7% 21.7% 3.0% Flat Hagerstown-Martinsburg, MD-WV 19.0% 30.2% 11.2% Flat Lancaster, PA 12.9% 25.1% 12.2% + 2 Chambersburg, PA 13.4% 28.6%
Slide 27: —______ [i
—______ [i
Slide 28: Borrowing Mix & Cost
Borrowing Mix & Cost $ in millions Avg Bal QTR INT % QTR (excludes SWAP expense) 2Q11 3Q11 4Q11 2Q12 1Q12 Borrowing Mix & Cost Short-Term Borrowings 0.31% 0.32% 0.30% 0.27% 0.26% FHLB Advances 1,116 2.91% 1,115 2.90% 1,163 2.44% 0.21% 1,082 0.15% Long Term Debt 5.03% 4.78% 4.93% 5.11% 5.01% Total Bo

Slide 29: es
es
Slide 30: i
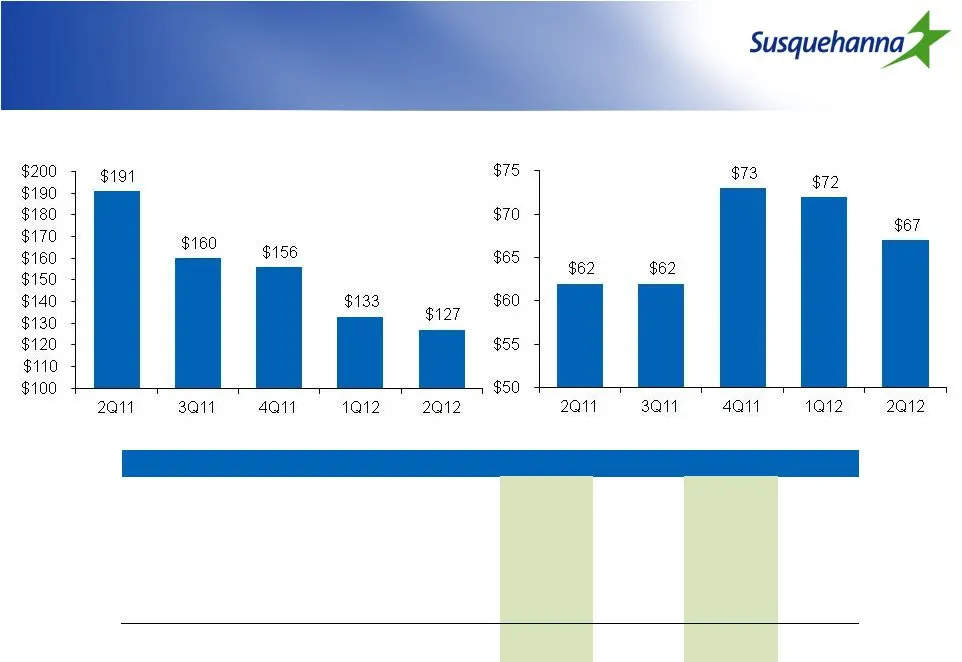
i
Slide 31: Asset Quality
Asset Quality ($ in Millions) ($ in million) 2Q11 3Q11 4Q11 1Q12 2Q12 Asset Quality ($ in Millions) NPL's Beginning of Period 212.9 $ 190.7 $ 160.1 $ 156.5 $ 133.5 $ New NonAccruals 23.4 $ 20.4 $ 43.8 $ 22.3 $ 34.5 $ Cure/Exits/Other (8.9) $ (27.4) $ (10.1) $ (28.8) $ (16.8) $ Gross Charge-Offs (26.
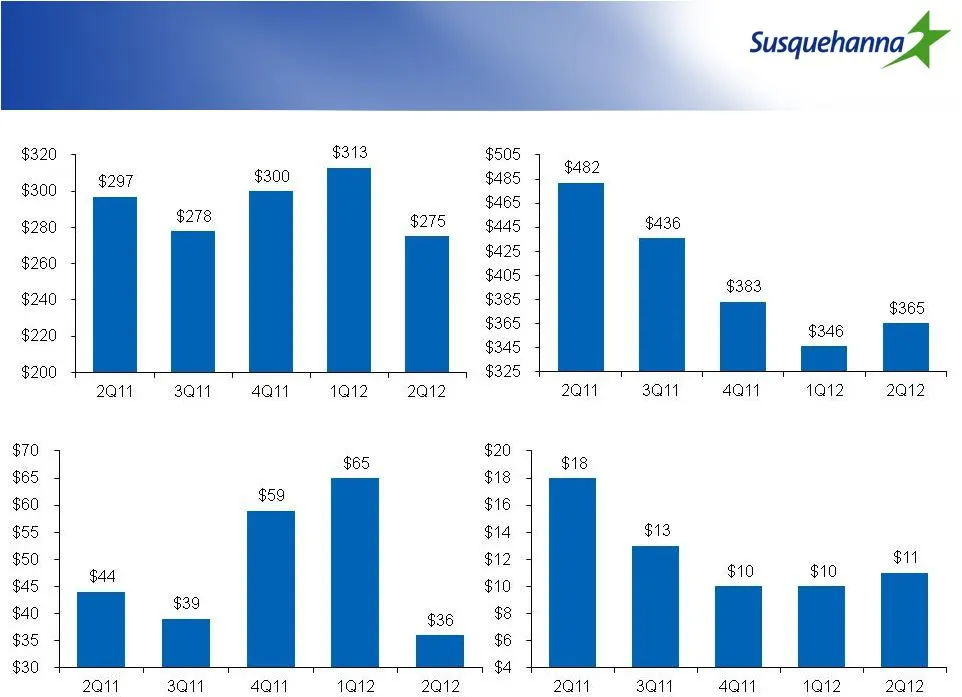
Slide 32: Asset Quality
Asset Quality ($ in Millions) Asset Quality ($ in Millions) *Legacy Susquehanna OAEM* Subtandard* Past Due 30-89 days Past due 90 days or more

Slide 33: ae “ii
ae “ii

Slide 34: Earnings Drivers
Earnings Drivers ($000) 2Q11 3Q11 4Q11 1Q12 2Q12 2013 Targets – Quarterly Average Earnings Drivers Avg. interest-earning assets 12,171,868 12,275,793 13,128,969 14,065,583 15,332,806 16,500,000 Net interest margin (FTE) 3.62% 3.58% 3.59% 3.94% 4.10% 3.85% Net interest income 106,086 106,839 115,201
Source: SEC EDGAR · 8-K filed Jul 30, 2012
More decks from Susquehanna Bancshares Inc
 Investor Presentation (December 2014)51 slides · Dec 3, 2014
 Merger or Acquisition (November 2014)28 slides · Nov 17, 2014
 Merger or Acquisition (November 2014)13 slides · Nov 12, 2014
 Q2 2014 Earnings Presentation46 slides · Aug 11, 2014
 Investor Presentation (May 2014)44 slides · May 5, 2014
 Shareholder Meeting (May 2014)35 slides · May 2, 2014