Amplify Energy Corp. · NYSE:AMPY
Amplify Energy — Investor Presentation (December 2020)
24 slides from Amplify Energy's investor presentation, December 2020
Slide 1: Amplify Energy Corp. Investor Presentation
Amplify Energy Corp. Investor Presentation December 2020
Slide 2: Forward Looking Statements
Forward Looking Statements This presentation and the oral statements made in connection therewith contain forward-looking statements. All statements, other than statements of historical facts, included in this presentation or made in connection therewith that address activities, events or developmen
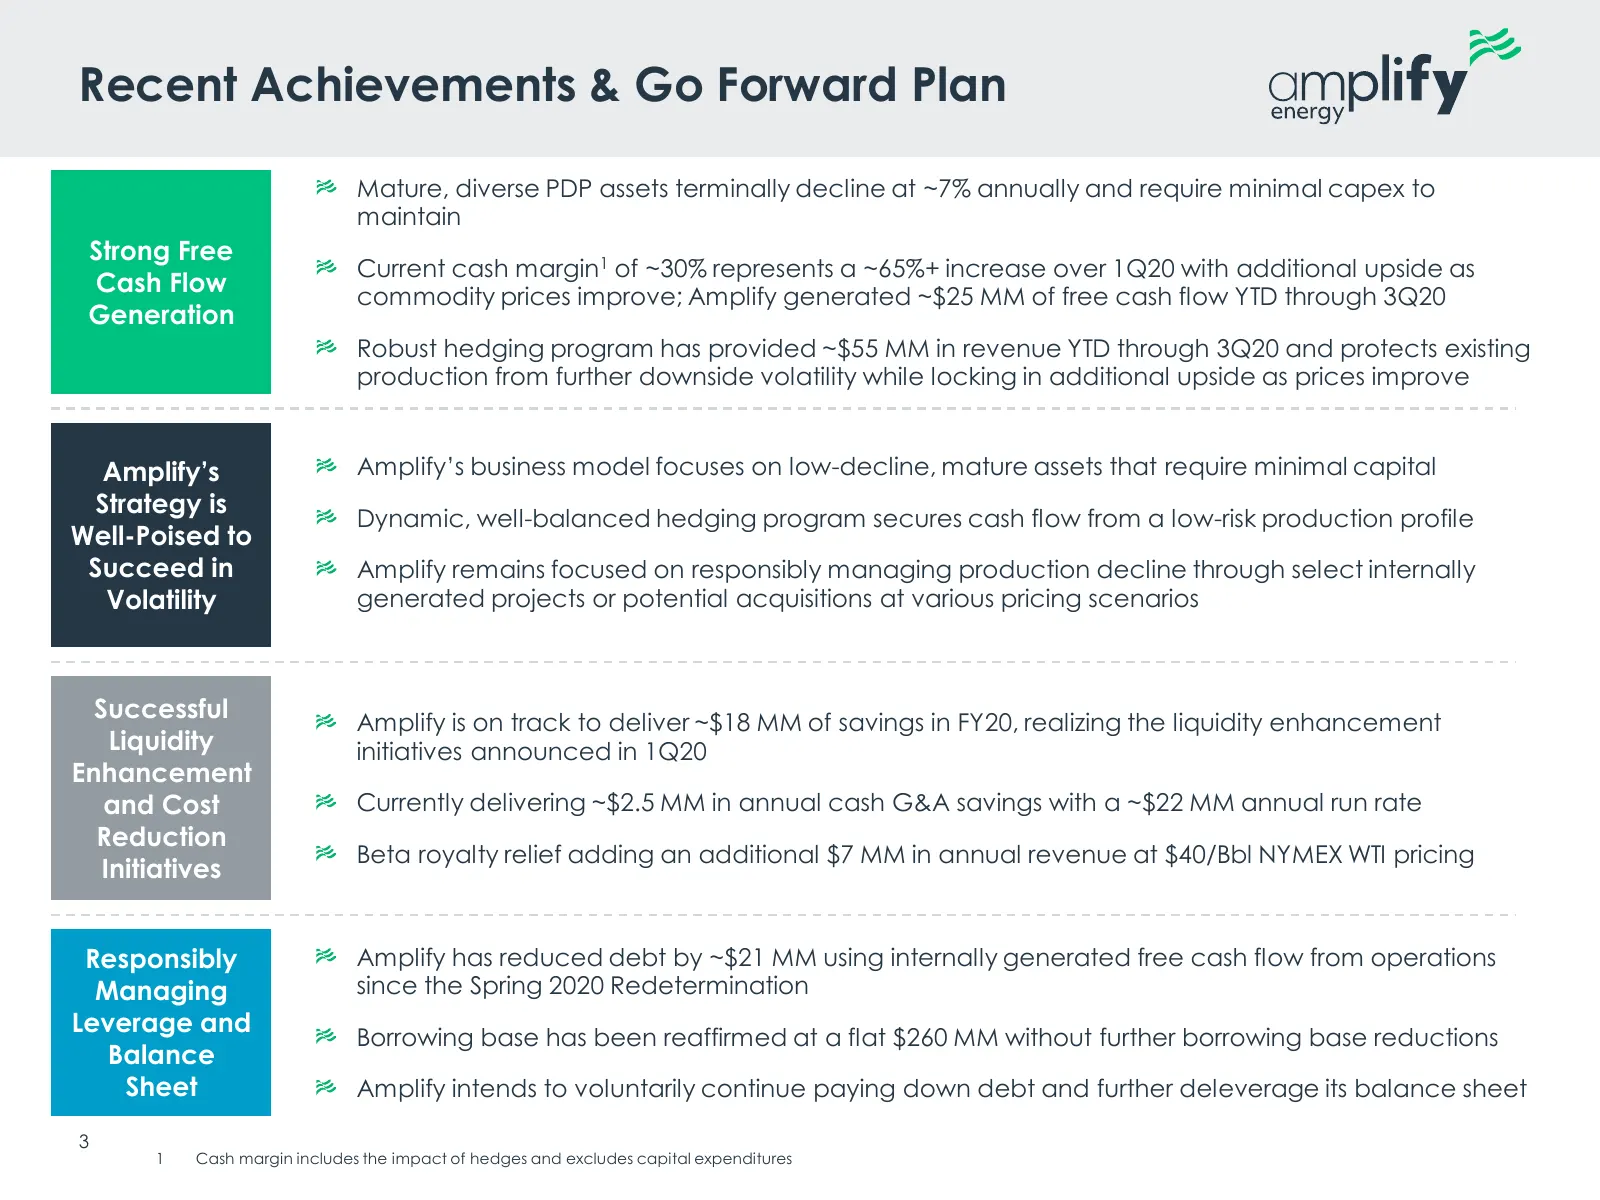
Slide 3: Recent Achievements & Go Forward Plan
Recent Achievements & Go Forward Plan Mature, diverse PDP assets terminally decline at ~7% annually and require minimal capex to maintain Strong Free Current cash margin1 of ~30% represents a ~65%+ increase over 1Q20 with additional upside as Cash Flow commodity prices improve; Amplify generated ~$2
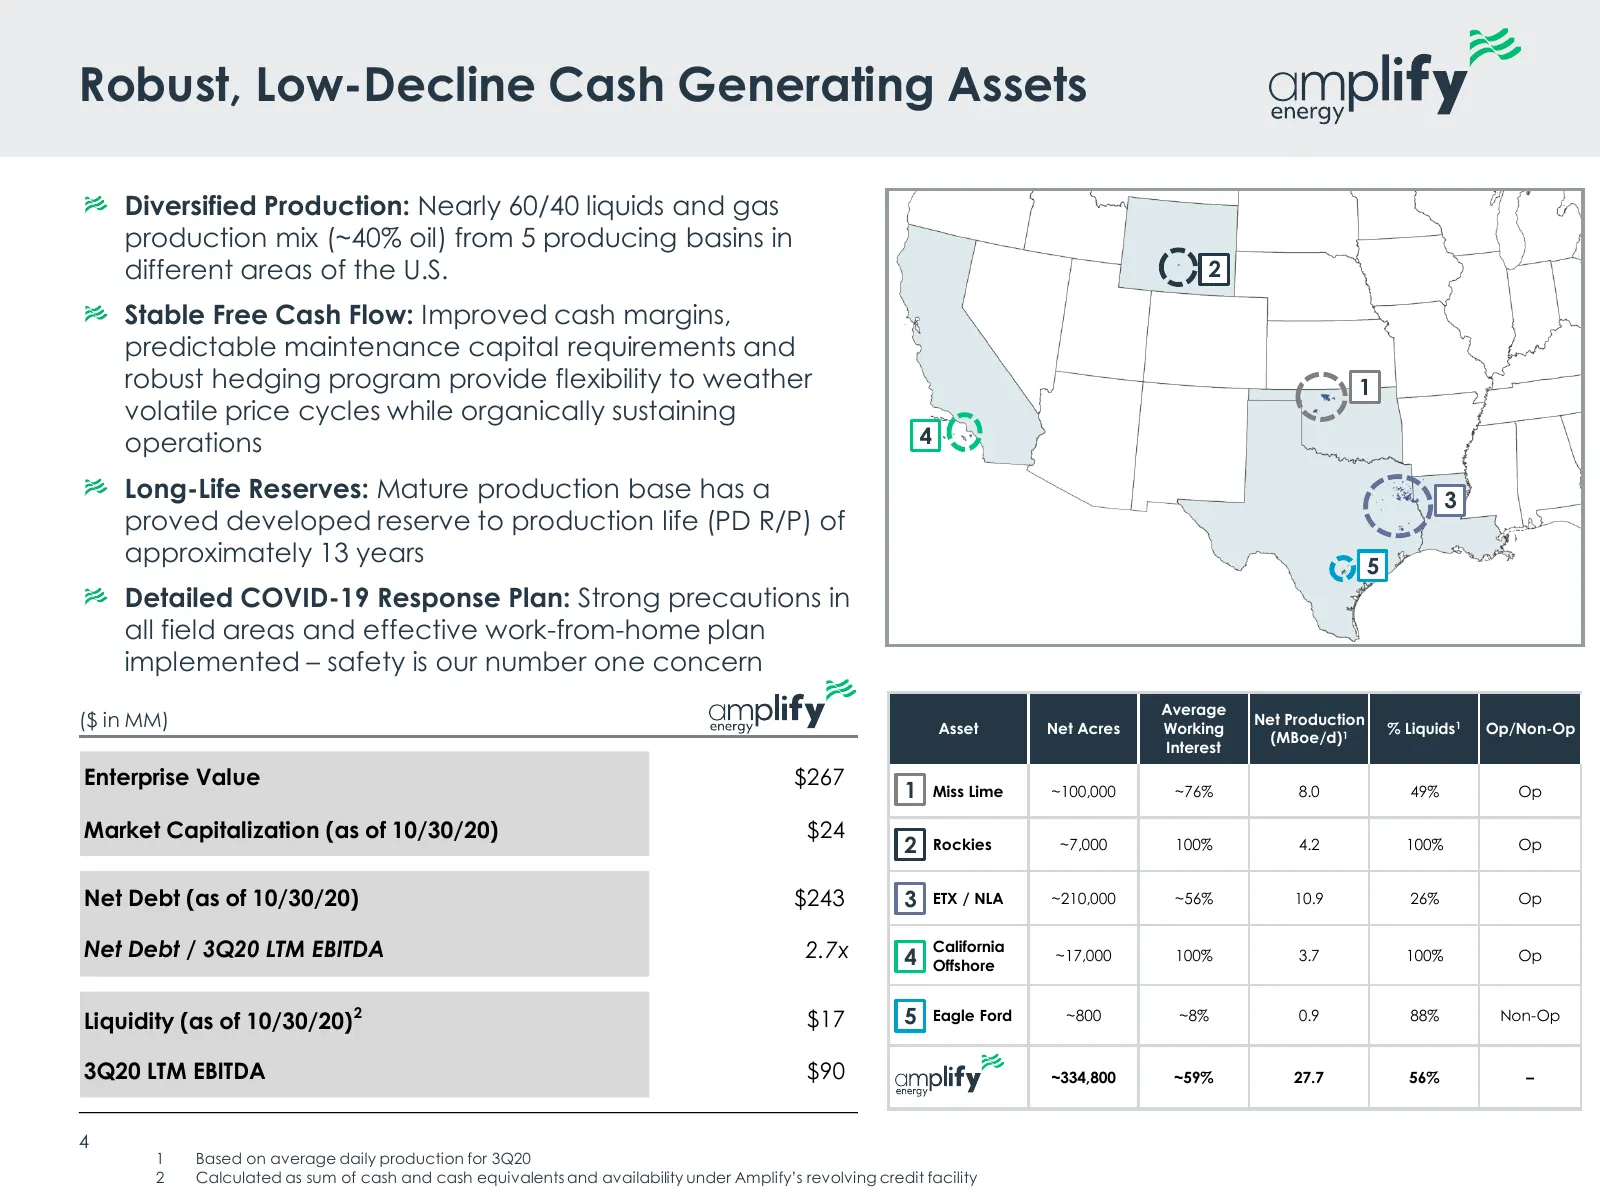
Slide 4: Robust, Low-Decline Cash Generating Assets
Robust, Low-Decline Cash Generating Assets Diversified Production: Nearly 60/40 liquids and gas production mix (~40% oil) from 5 producing basins in different areas of the U.S. 2 Stable Free Cash Flow: Improved cash margins, predictable maintenance capital requirements and robust hedging program pro
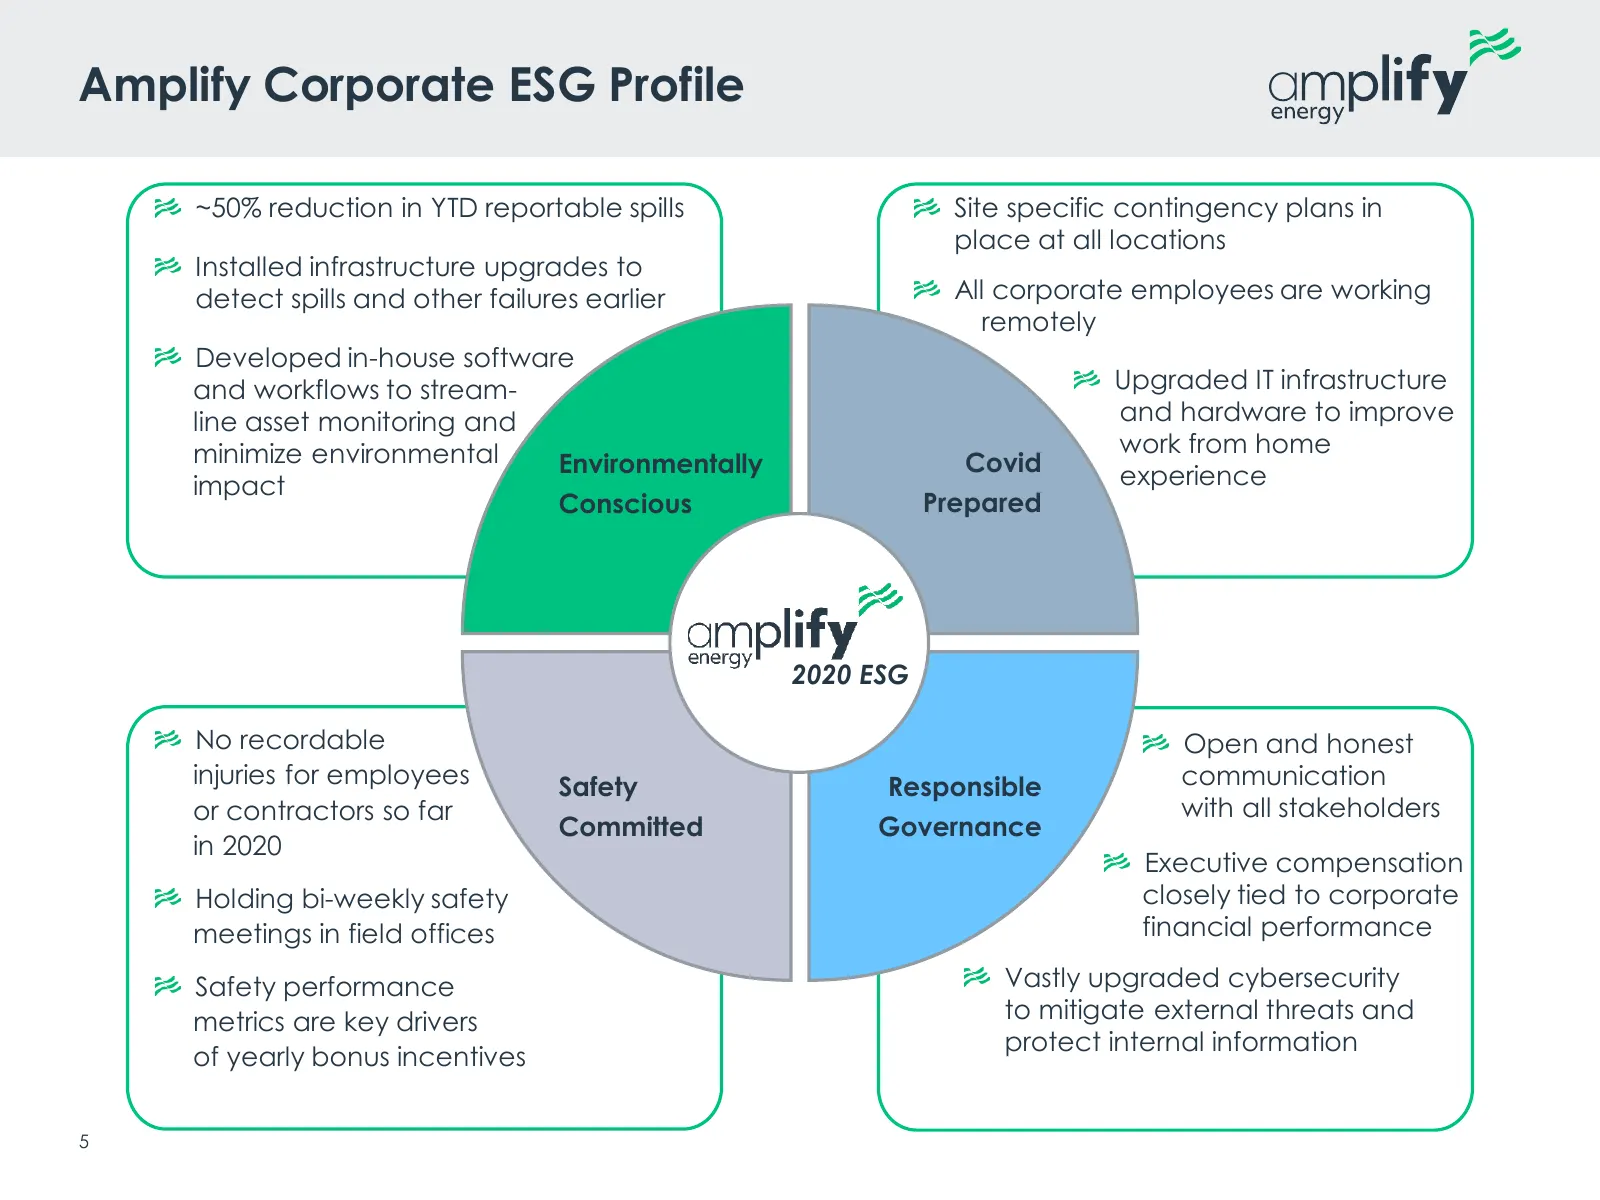
Slide 5: Amplify Corporate ESG Profile
Amplify Corporate ESG Profile ~50% reduction in YTD reportable spills Site specific contingency plans in place at all locations Installed infrastructure upgrades to detect spills and other failures earlier All corporate employees are working • remotely Developed in-house software • Upgraded IT infra
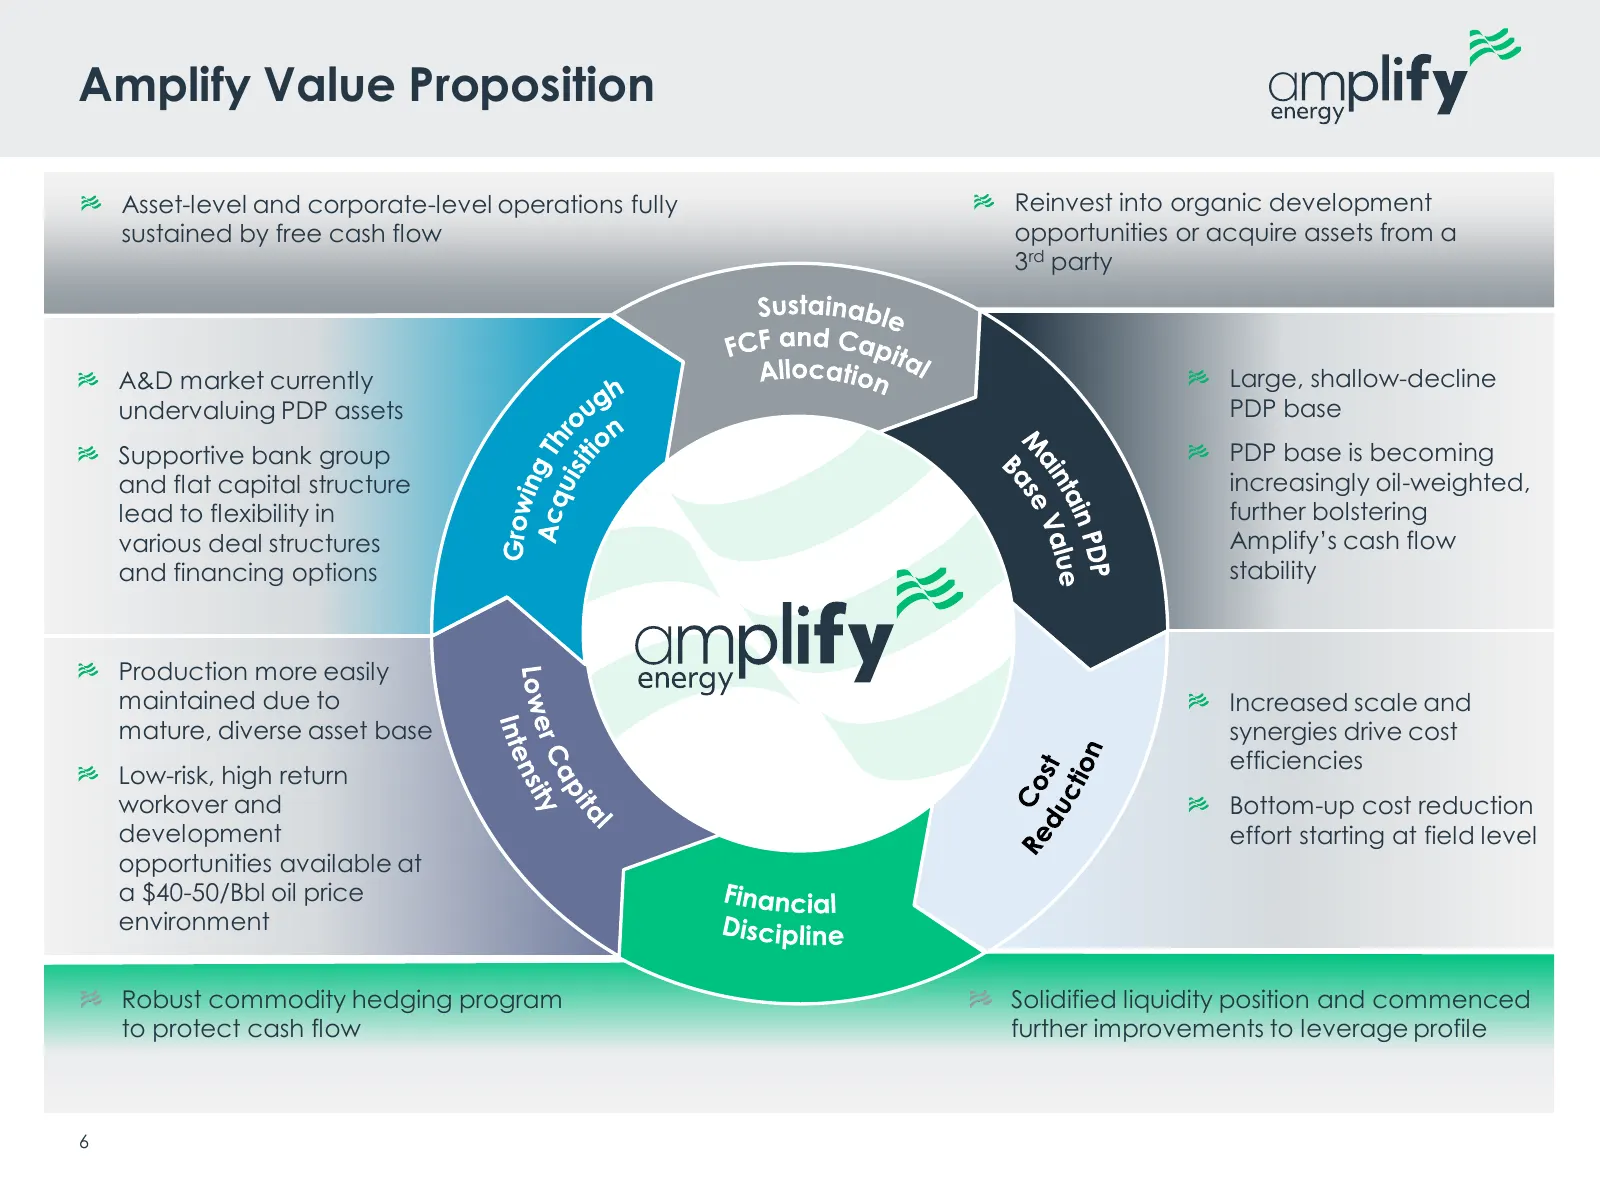
Slide 6: Amplify Value Proposition
Amplify Value Proposition Asset-level and corporate-level operations fully Reinvest into organic development sustained by free cash flow opportunities or acquire assets from a 3rd party A&D market currently Large, shallow-decline undervaluing PDP assets PDP base Supportive bank group PDP base is bec
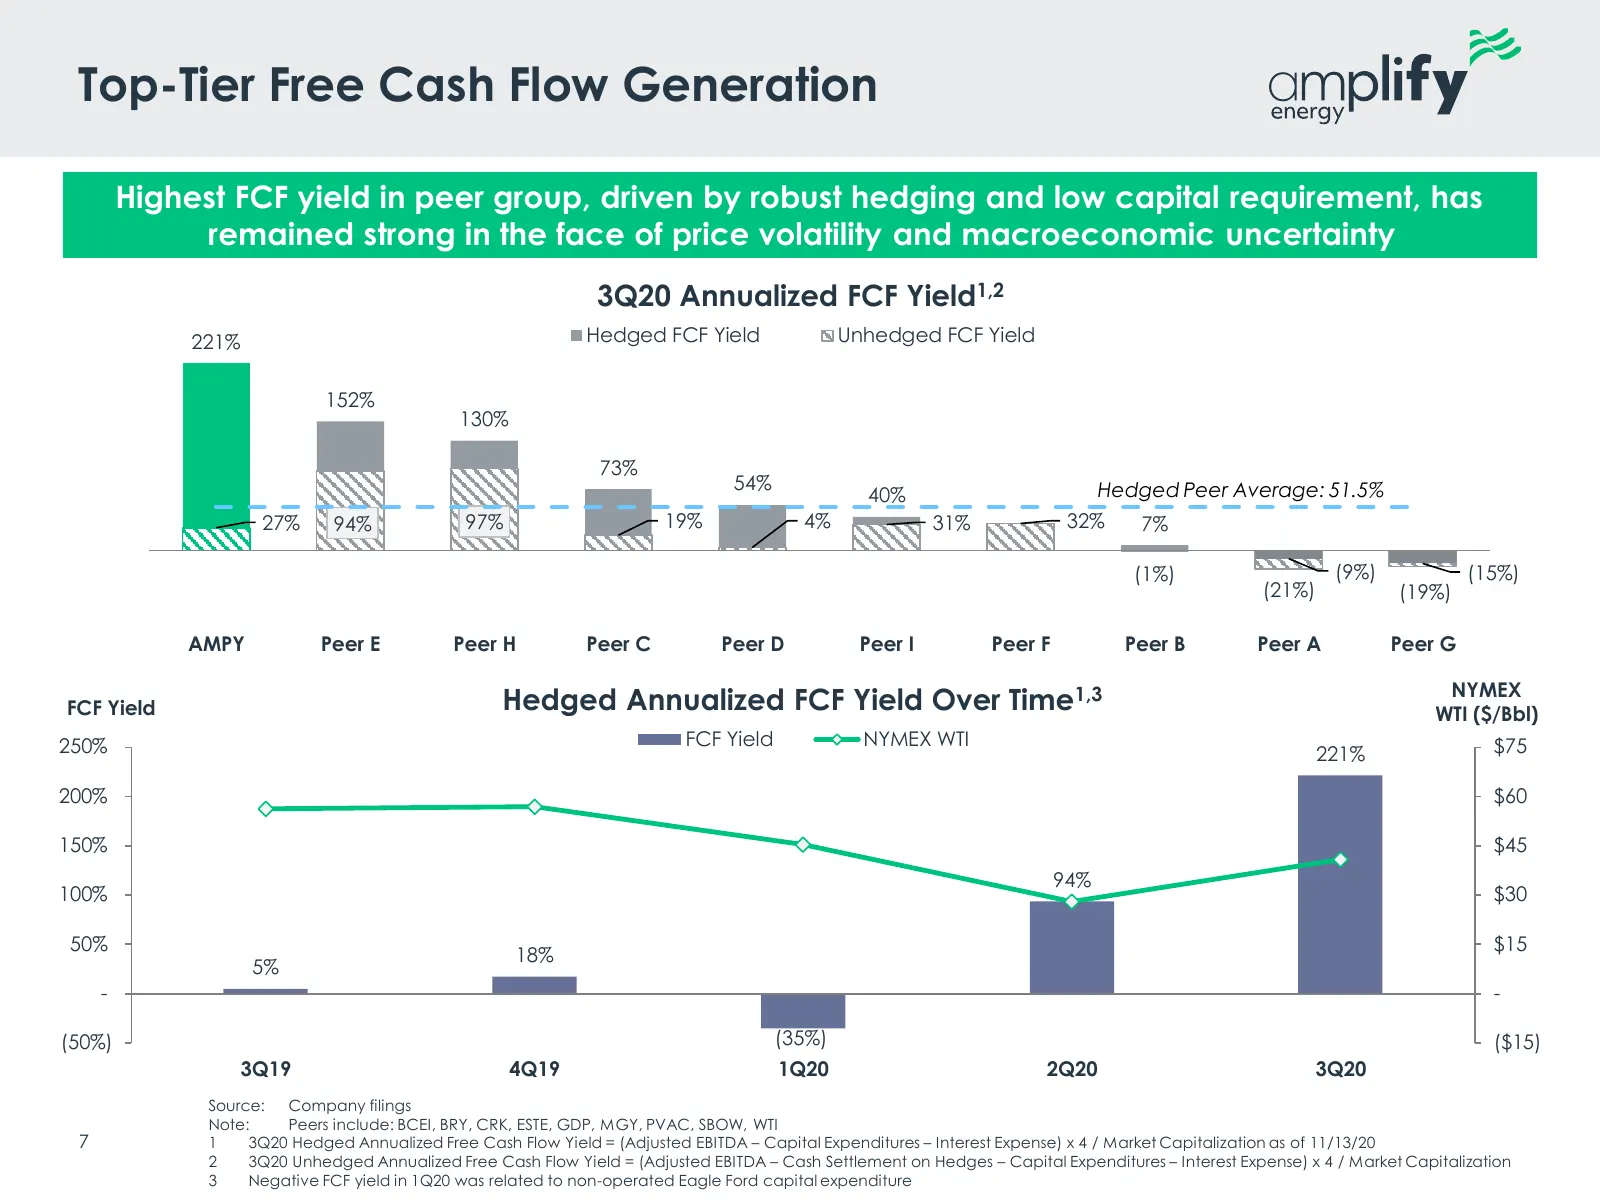
Slide 7: Top-Tier Free Cash Flow Generation
Top-Tier Free Cash Flow Generation Highest FCF yield in peer group, driven by robust hedging and low capital requirement, has remained strong in the face of price volatility and macroeconomic uncertainty 3Q20 Annualized FCF Yield1,2 221% Hedged FCF Yield Unhedged FCF Yield 152% 130% 73% 54% Hedged P
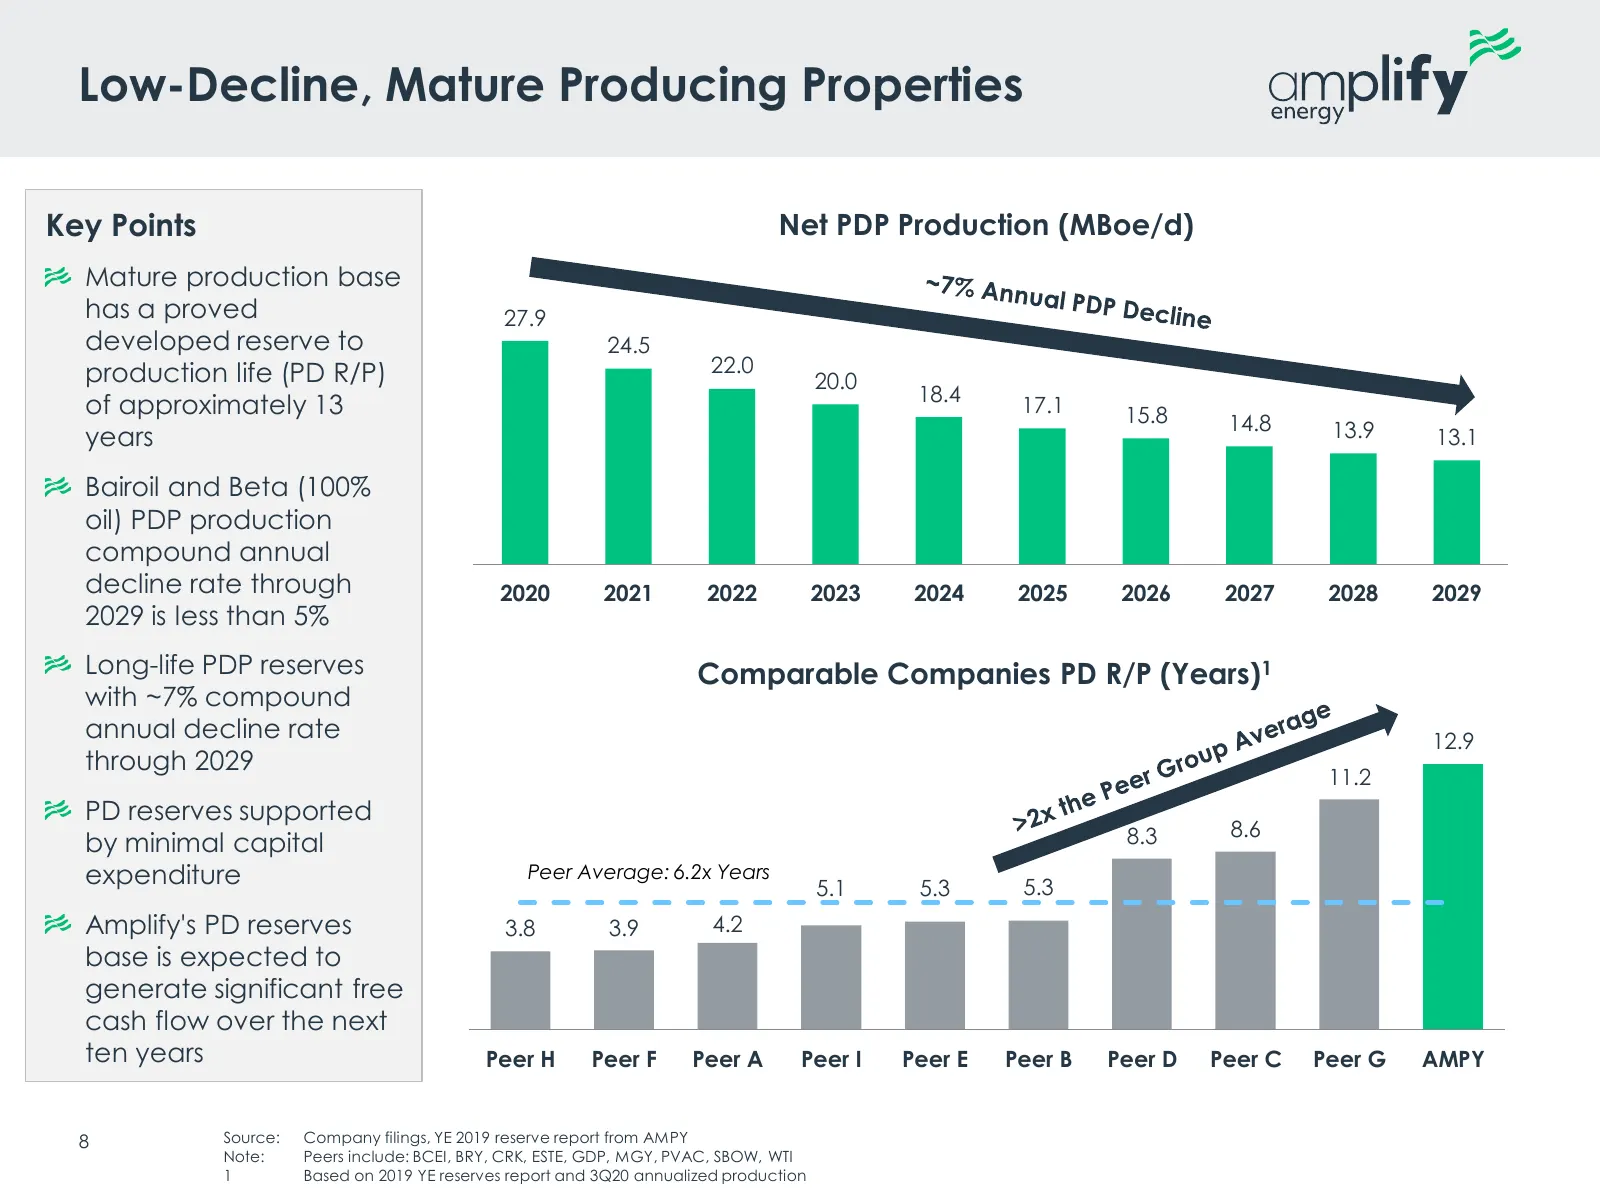
Slide 8: Low-Decline, Mature Producing Properties
Low-Decline, Mature Producing Properties Key Points Net PDP Production (MBoe/d) Mature production base has a proved 27.9 developed reserve to 24.5 production life (PD R/P) 22.0 20.0 18.4 of approximately 13 17.1 15.8 14.8 13.9 years 13.1 Bairoil and Beta (100% oil) PDP production compound annual dec
Slide 9: Successful Operating Cost Reduction Initiatives
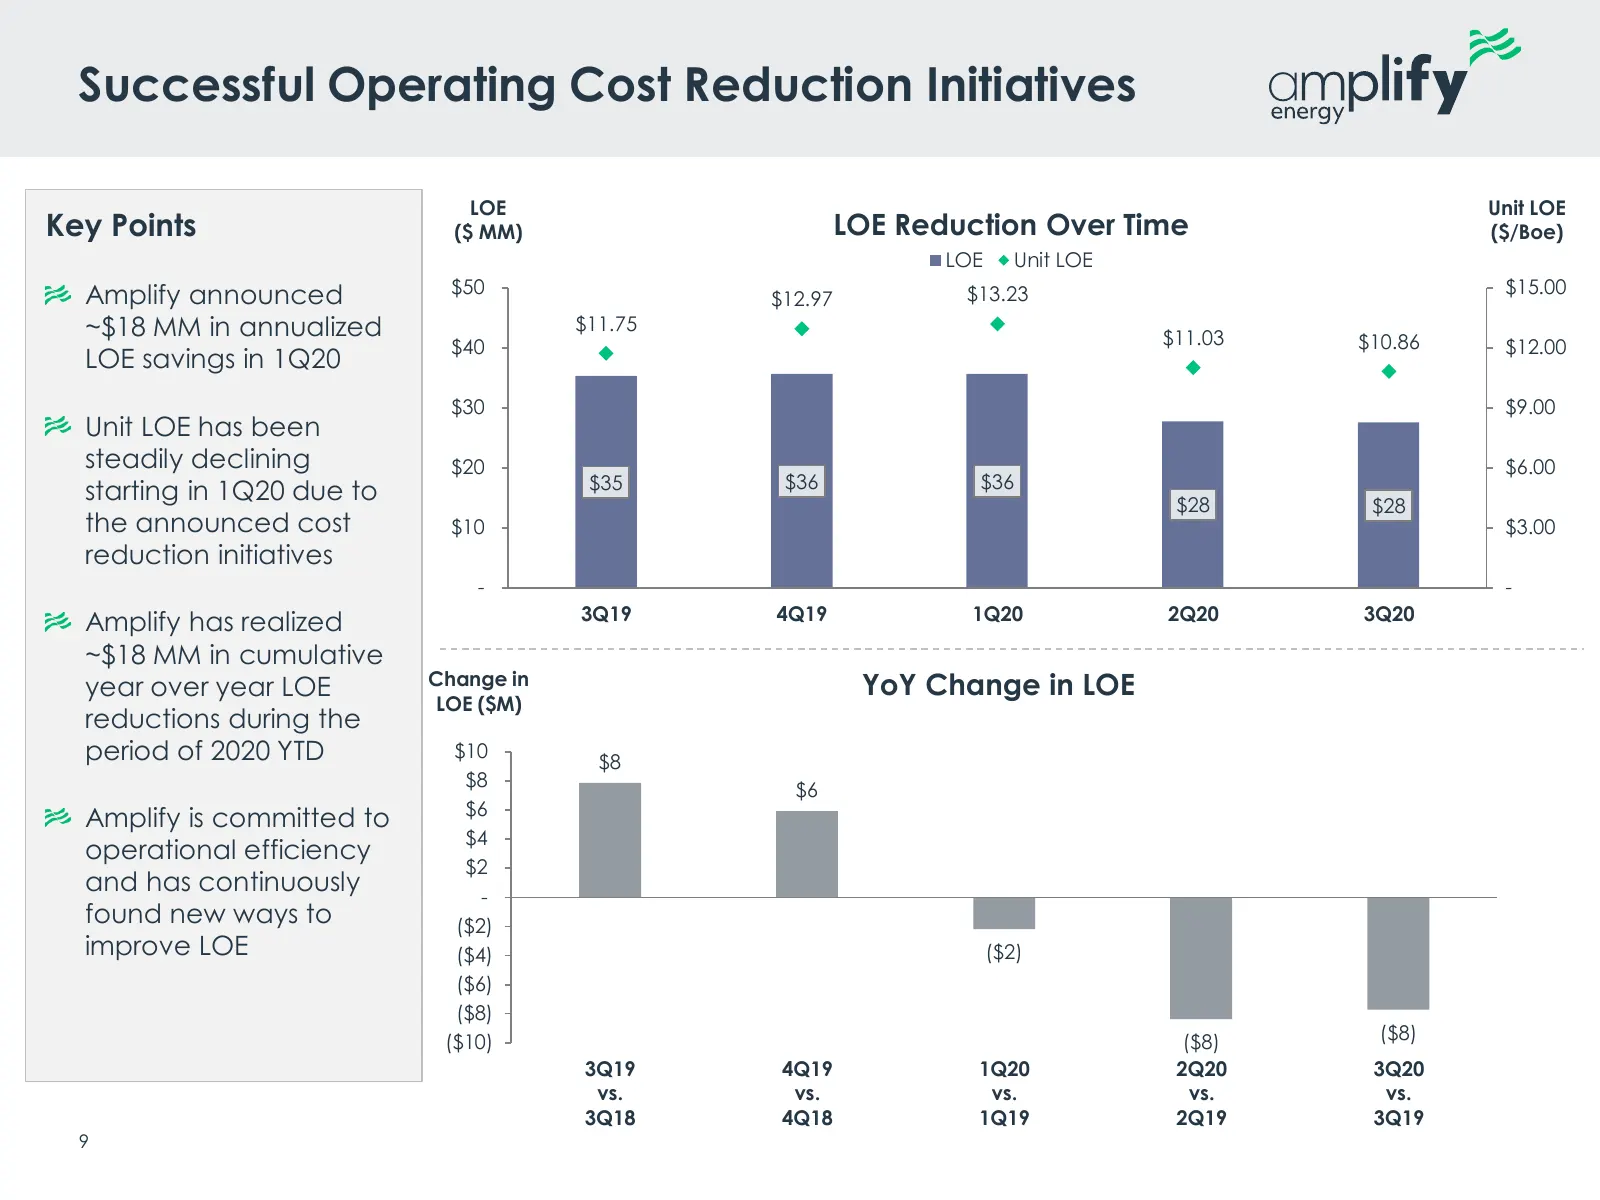
Successful Operating Cost Reduction Initiatives LOE Unit LOE Key Points ($ MM) LOE Reduction Over Time ($/Boe) LOE Unit LOE $50 $15.00 Amplify announced $12.97 $13.23 ~$18 MM in annualized $11.75 $11.03 $10.86 $40 $12.00 LOE savings in 1Q20 $30 $9.00 Unit LOE has been steadily declining $20 $6.00 $3
Slide 10: Scale & Synergies Enable G&A Efficiency
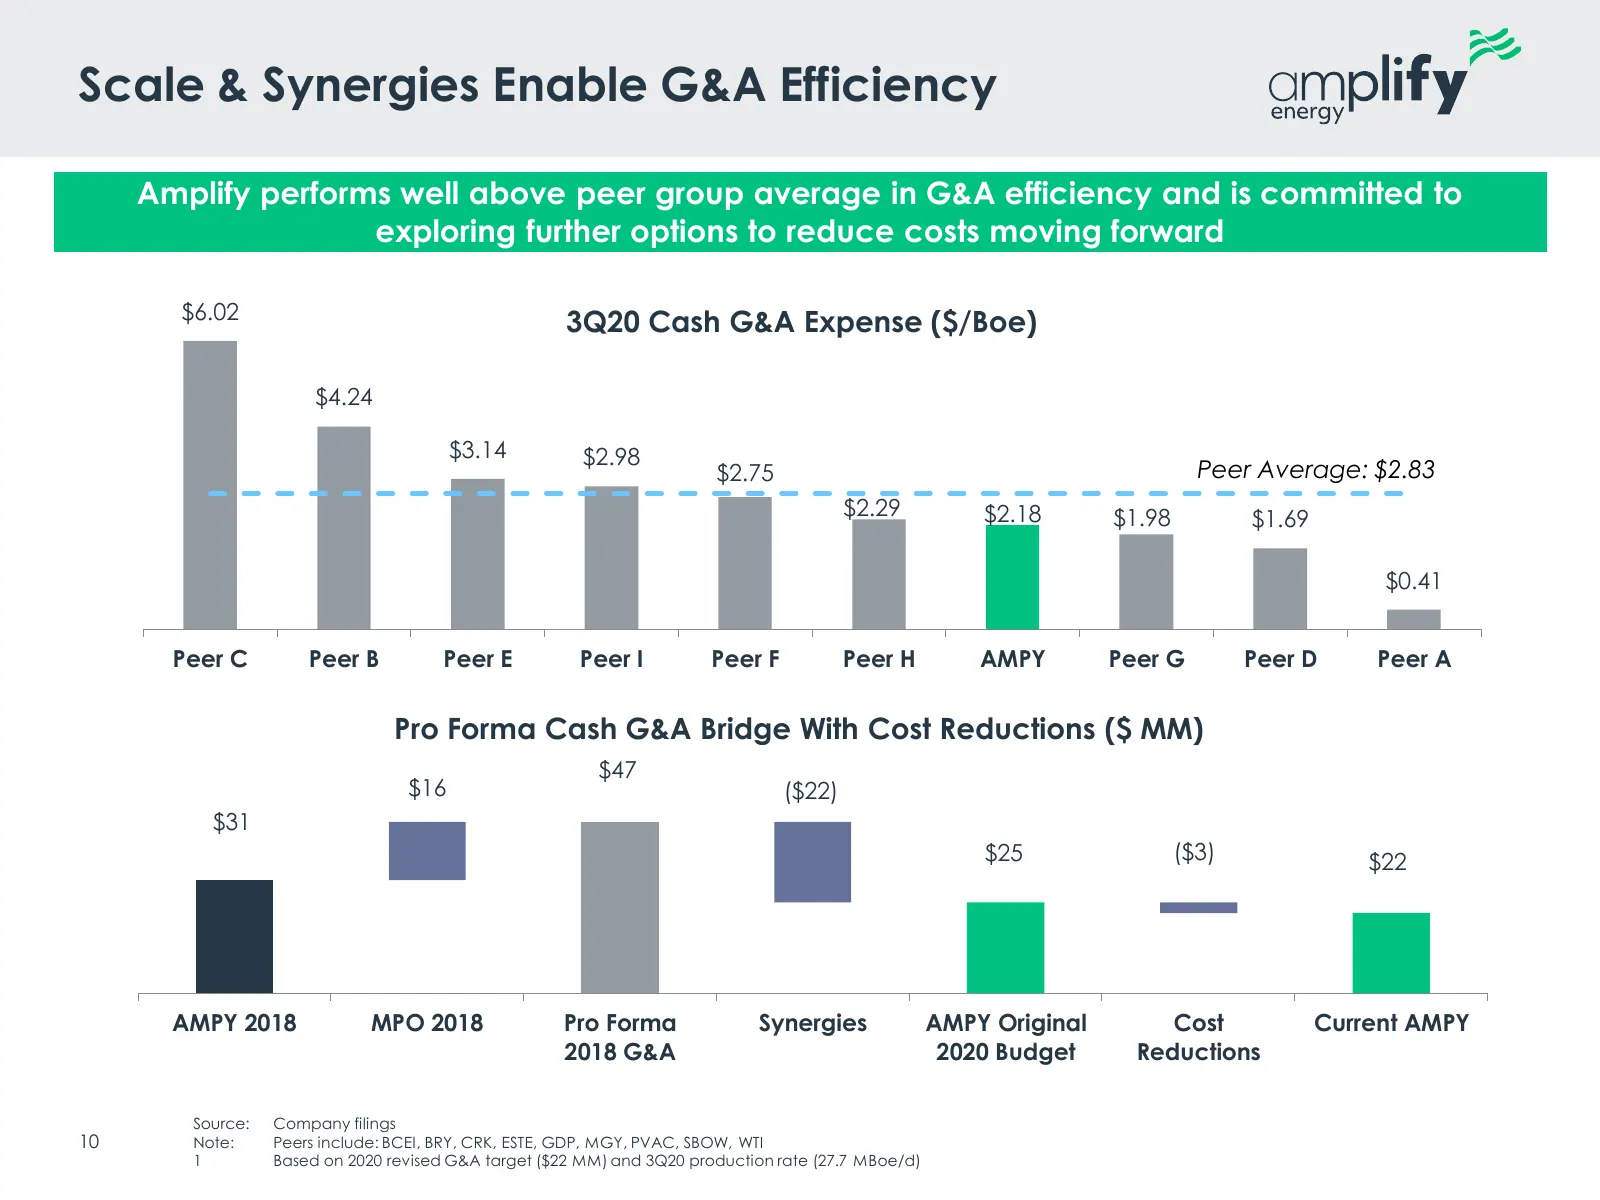
Scale & Synergies Enable G&A Efficiency Amplify performs well above peer group average in G&A efficiency and is committed to exploring further options to reduce costs moving forward $6.02 3Q20 Cash G&A Expense ($/Boe) $4.24 $3.14 $2.98 $2.75 Peer Average: $2.83 $2.29 $2.18 $1.98 $1.69 $0.41 Peer C P
Slide 11: Continued Focus on Improving Margins
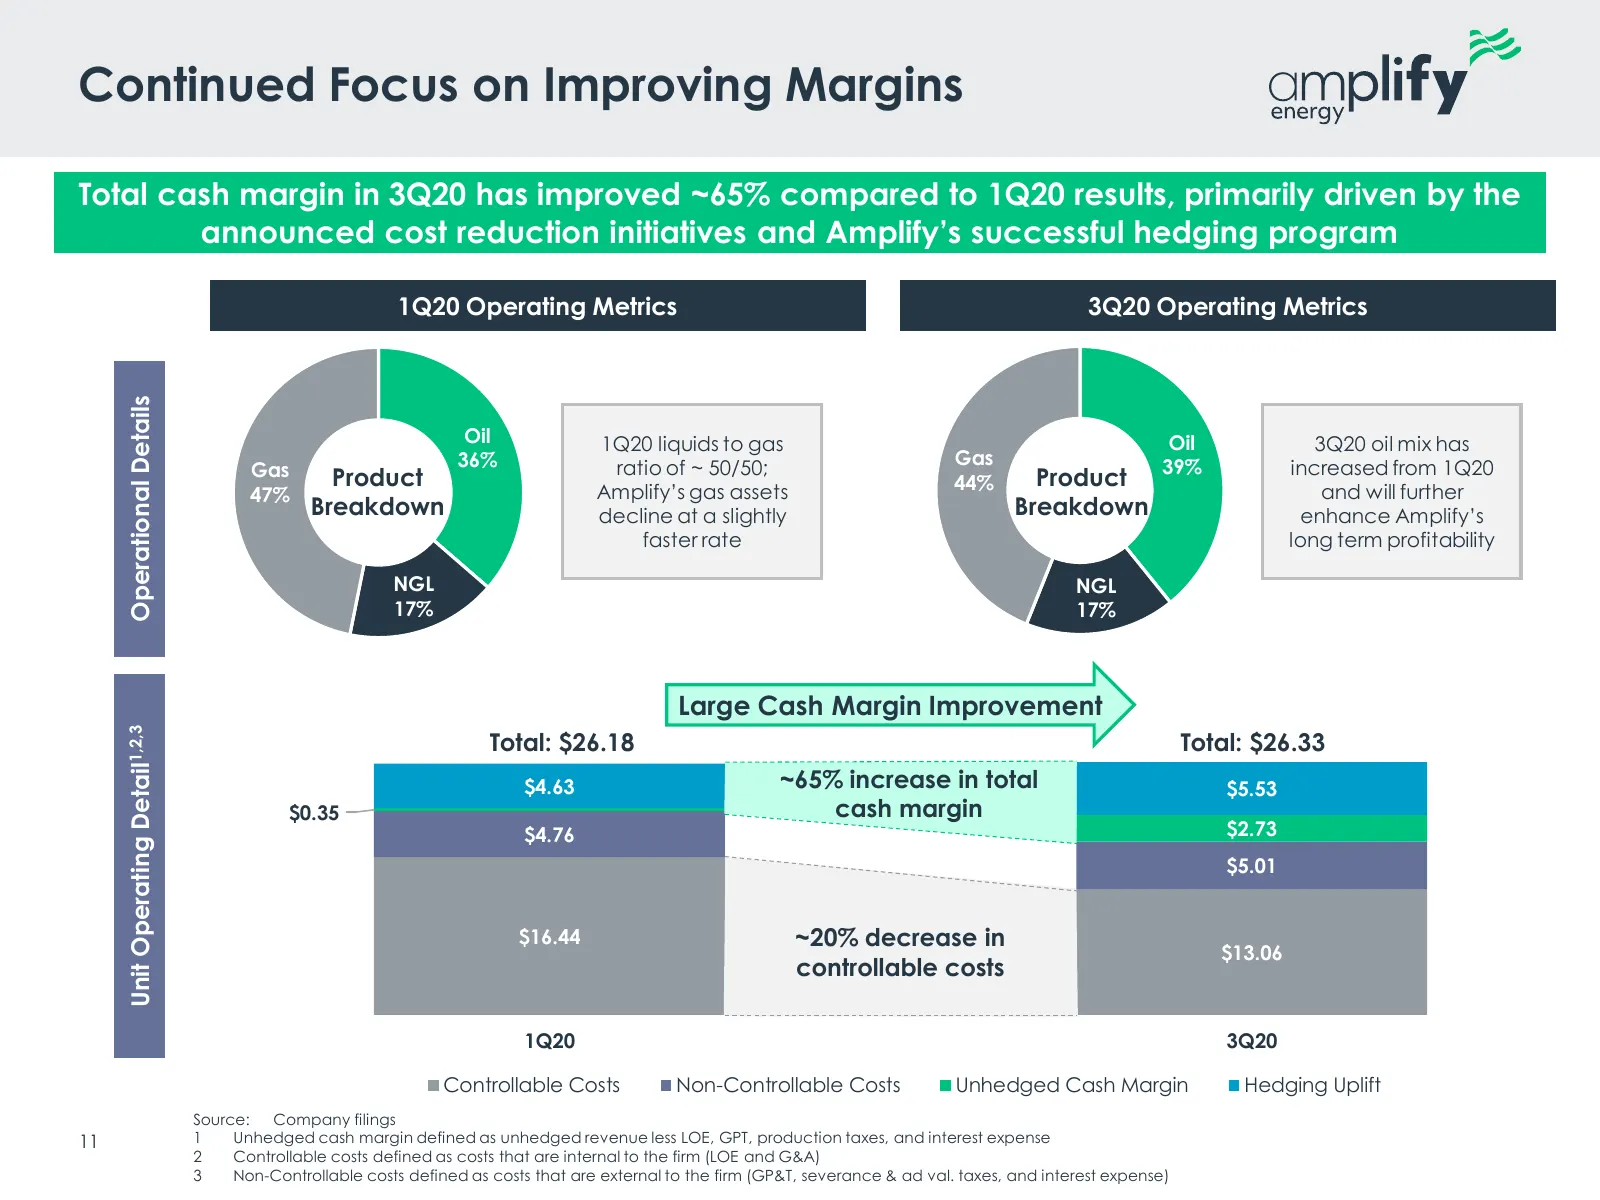
Continued Focus on Improving Margins Total cash margin in 3Q20 has improved ~65% compared to 1Q20 results, primarily driven by the announced cost reduction initiatives and Amplify’s successful hedging program 1Q20 Operating Metrics 3Q20 Operating Metrics Operational Details Oil 1Q20 liquids to gas O
Slide 12: Hedge Position Protects Stable Cash Flows
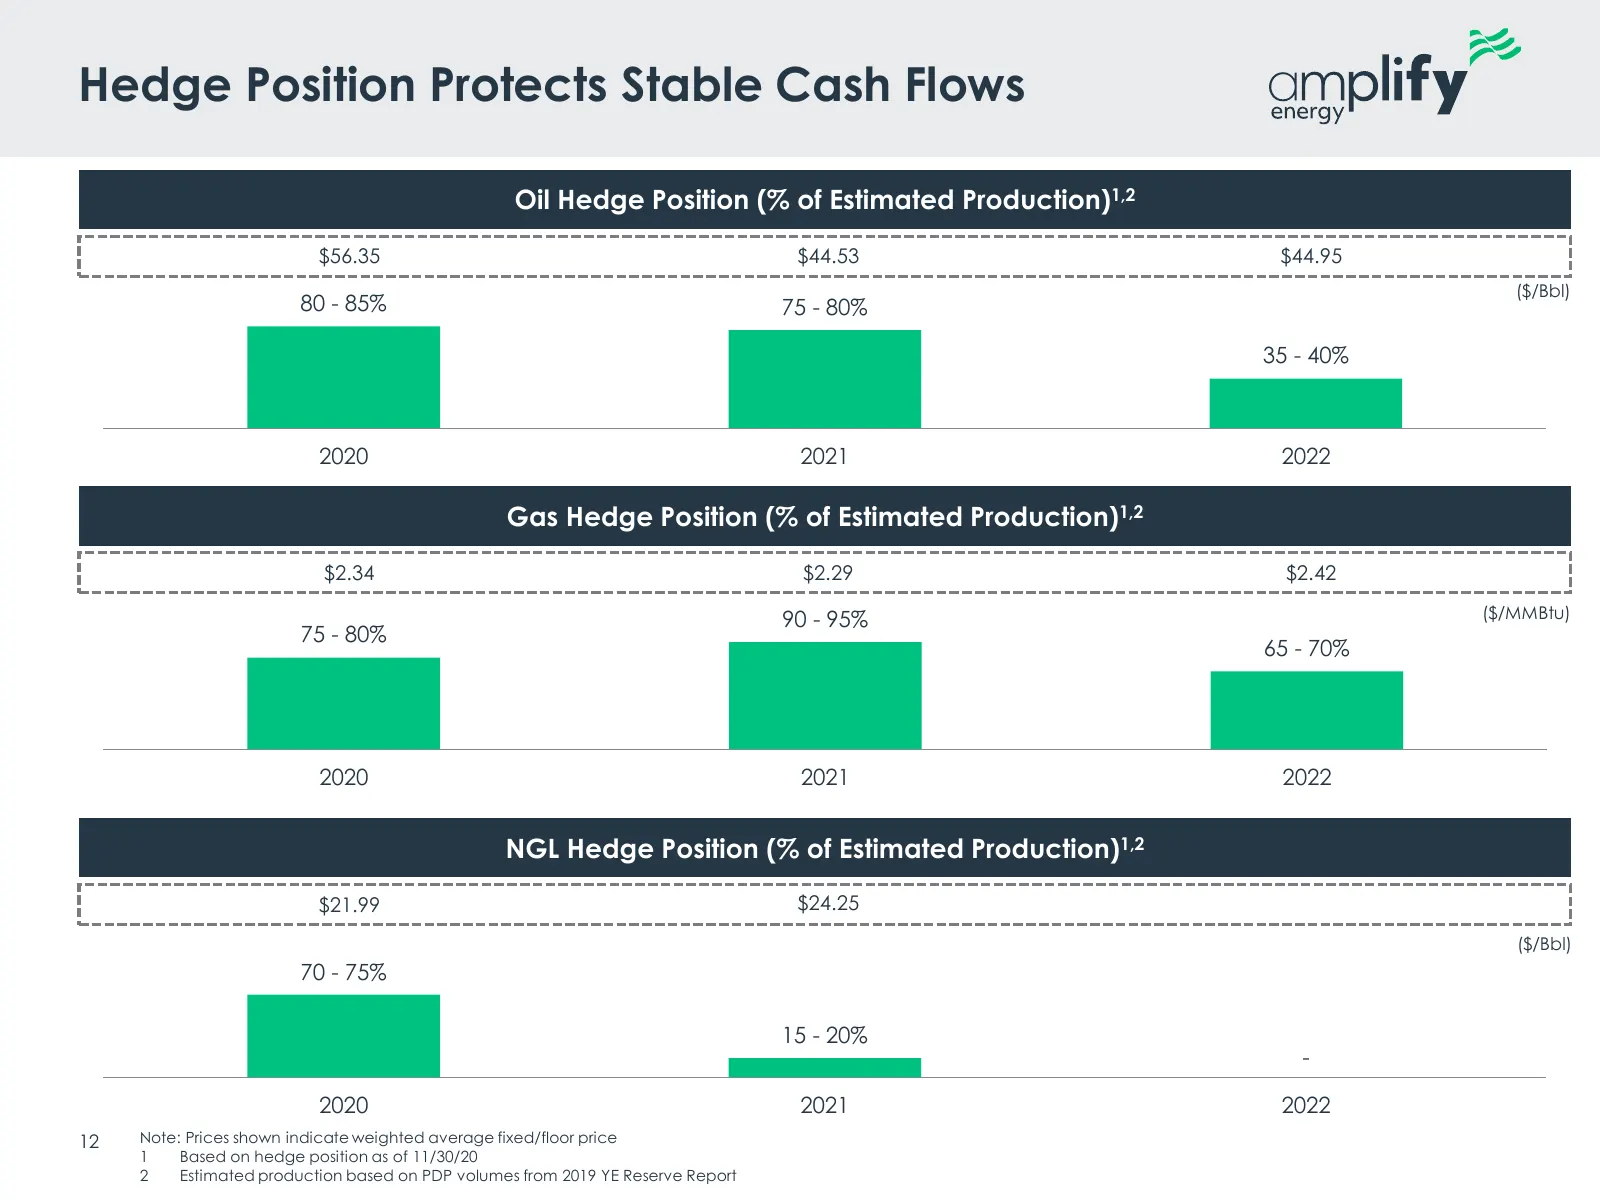
Hedge Position Protects Stable Cash Flows Oil Hedge Position (% of Estimated Production)1,2 $56.35 $44.53 $44.95 ($/Bbl) 80 - 85% 75 - 80% 35 - 40% 2020 2021 2022 Gas Hedge Position (% of Estimated Production)1,2 $2.34 $2.29 $2.42 90 - 95% ($/MMBtu) 75 - 80% 65 - 70% 2020 2021 2022 NGL Hedge Positio
Slide 13: Borrowing Base Reaffirmed at $260 Million
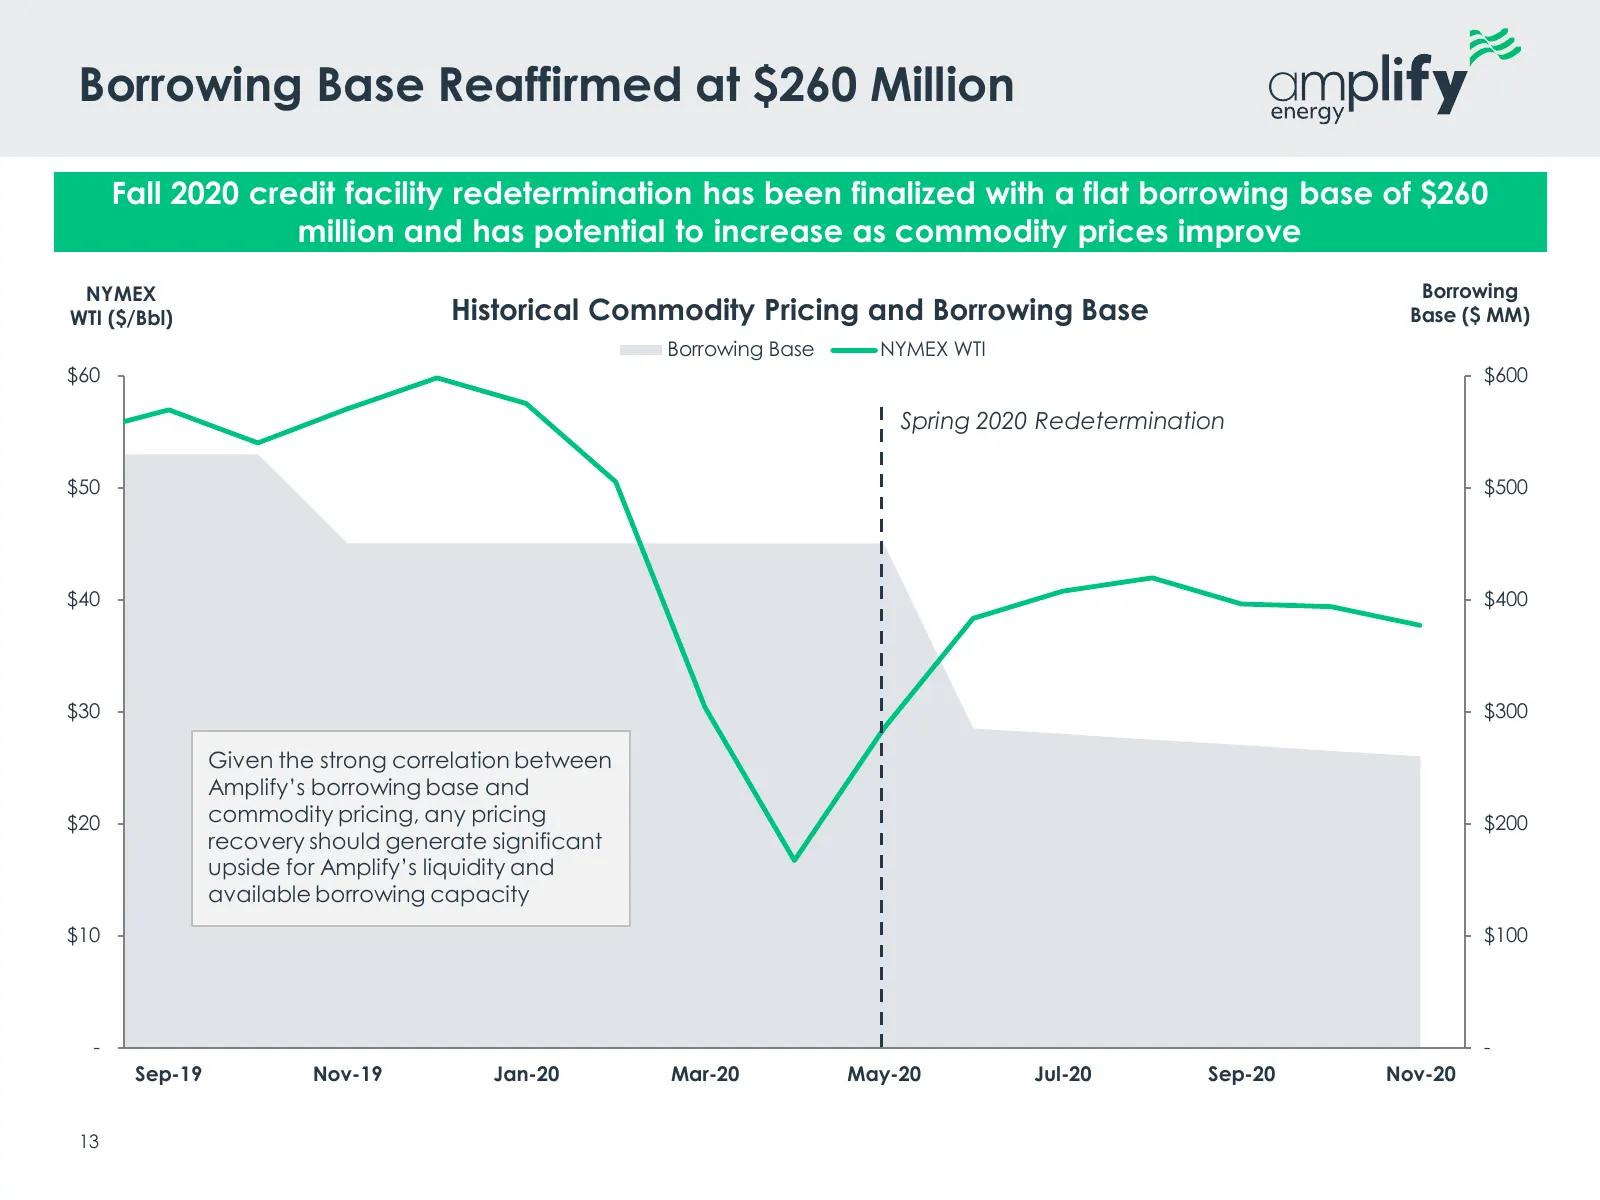
Borrowing Base Reaffirmed at $260 Million Fall 2020 credit facility redetermination has been finalized with a flat borrowing base of $260 million and has potential to increase as commodity prices improve NYMEX Borrowing WTI ($/Bbl) Historical Commodity Pricing and Borrowing Base Base ($ MM) Borrowin
Slide 14: Investment Highlights
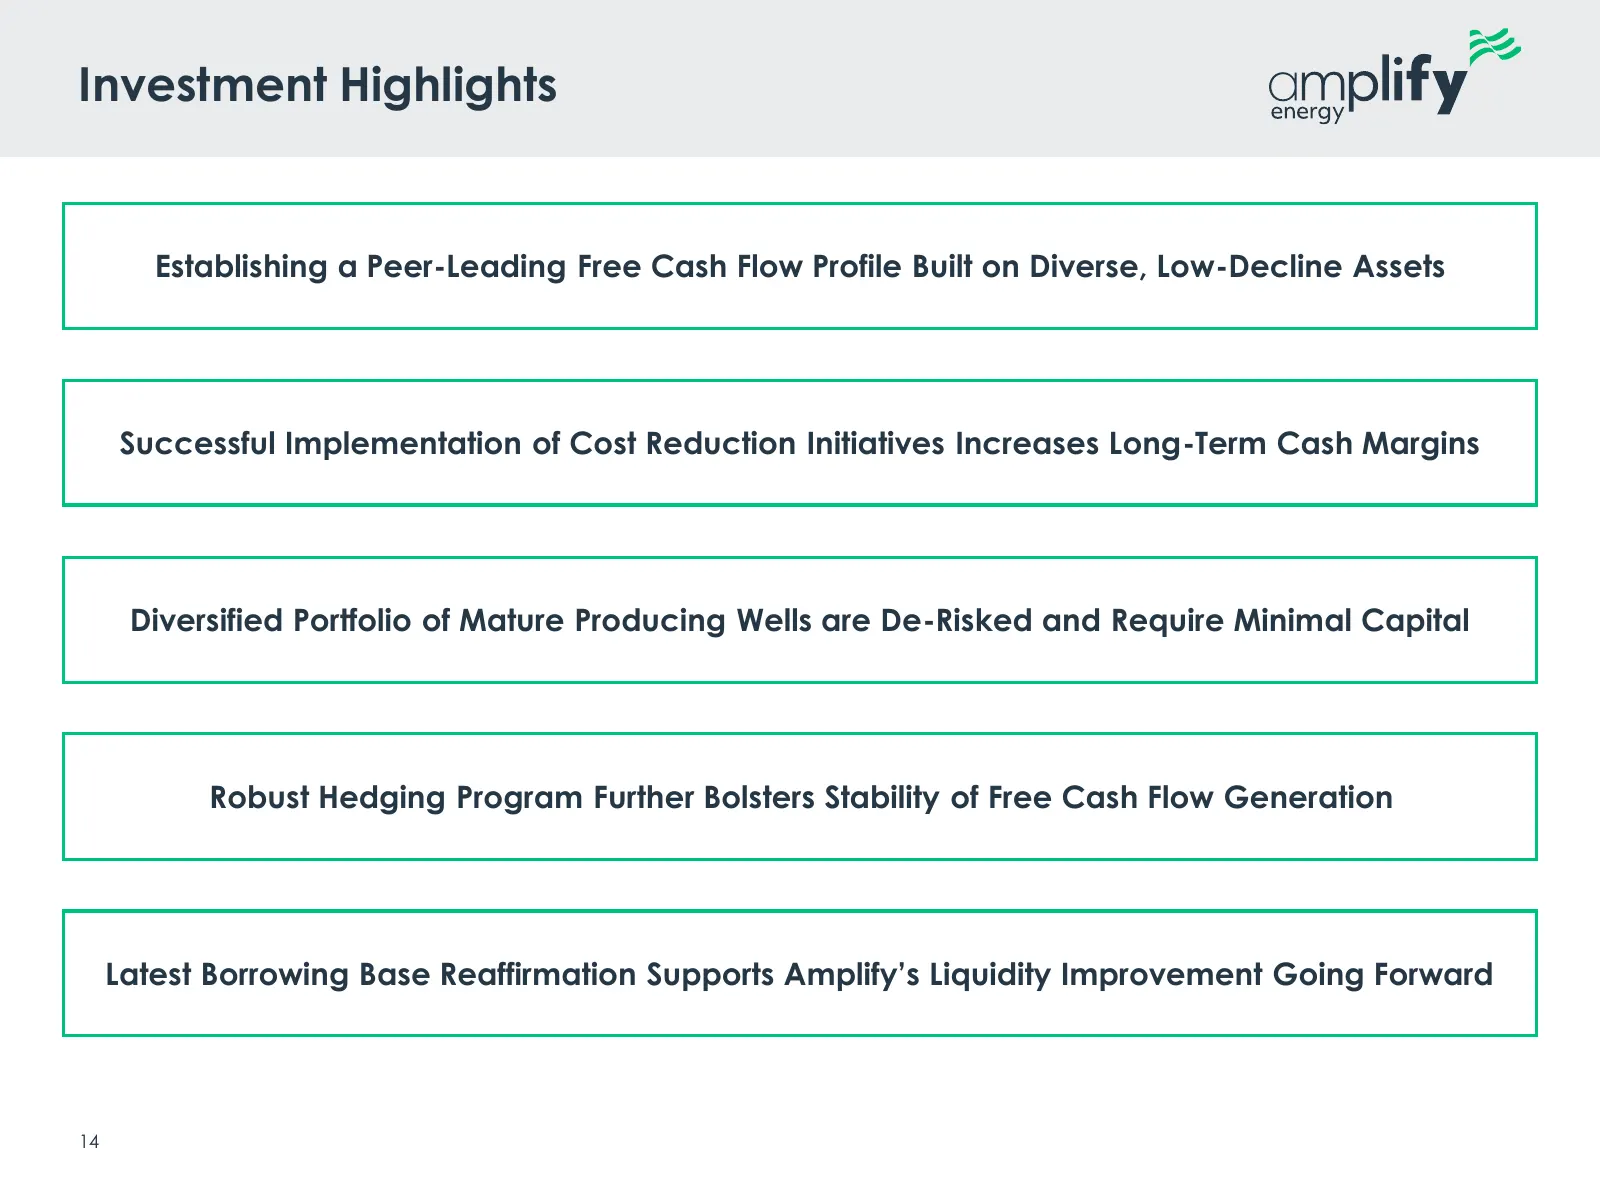
Investment Highlights Establishing a Peer-Leading Free Cash Flow Profile Built on Diverse, Low-Decline Assets Successful Implementation of Cost Reduction Initiatives Increases Long-Term Cash Margins Diversified Portfolio of Mature Producing Wells are De-Risked and Require Minimal Capital Robust Hedg
Slide 15: Appendix
Zz amplify” energy Appendix
Slide 16: Miss Lime Asset Overview
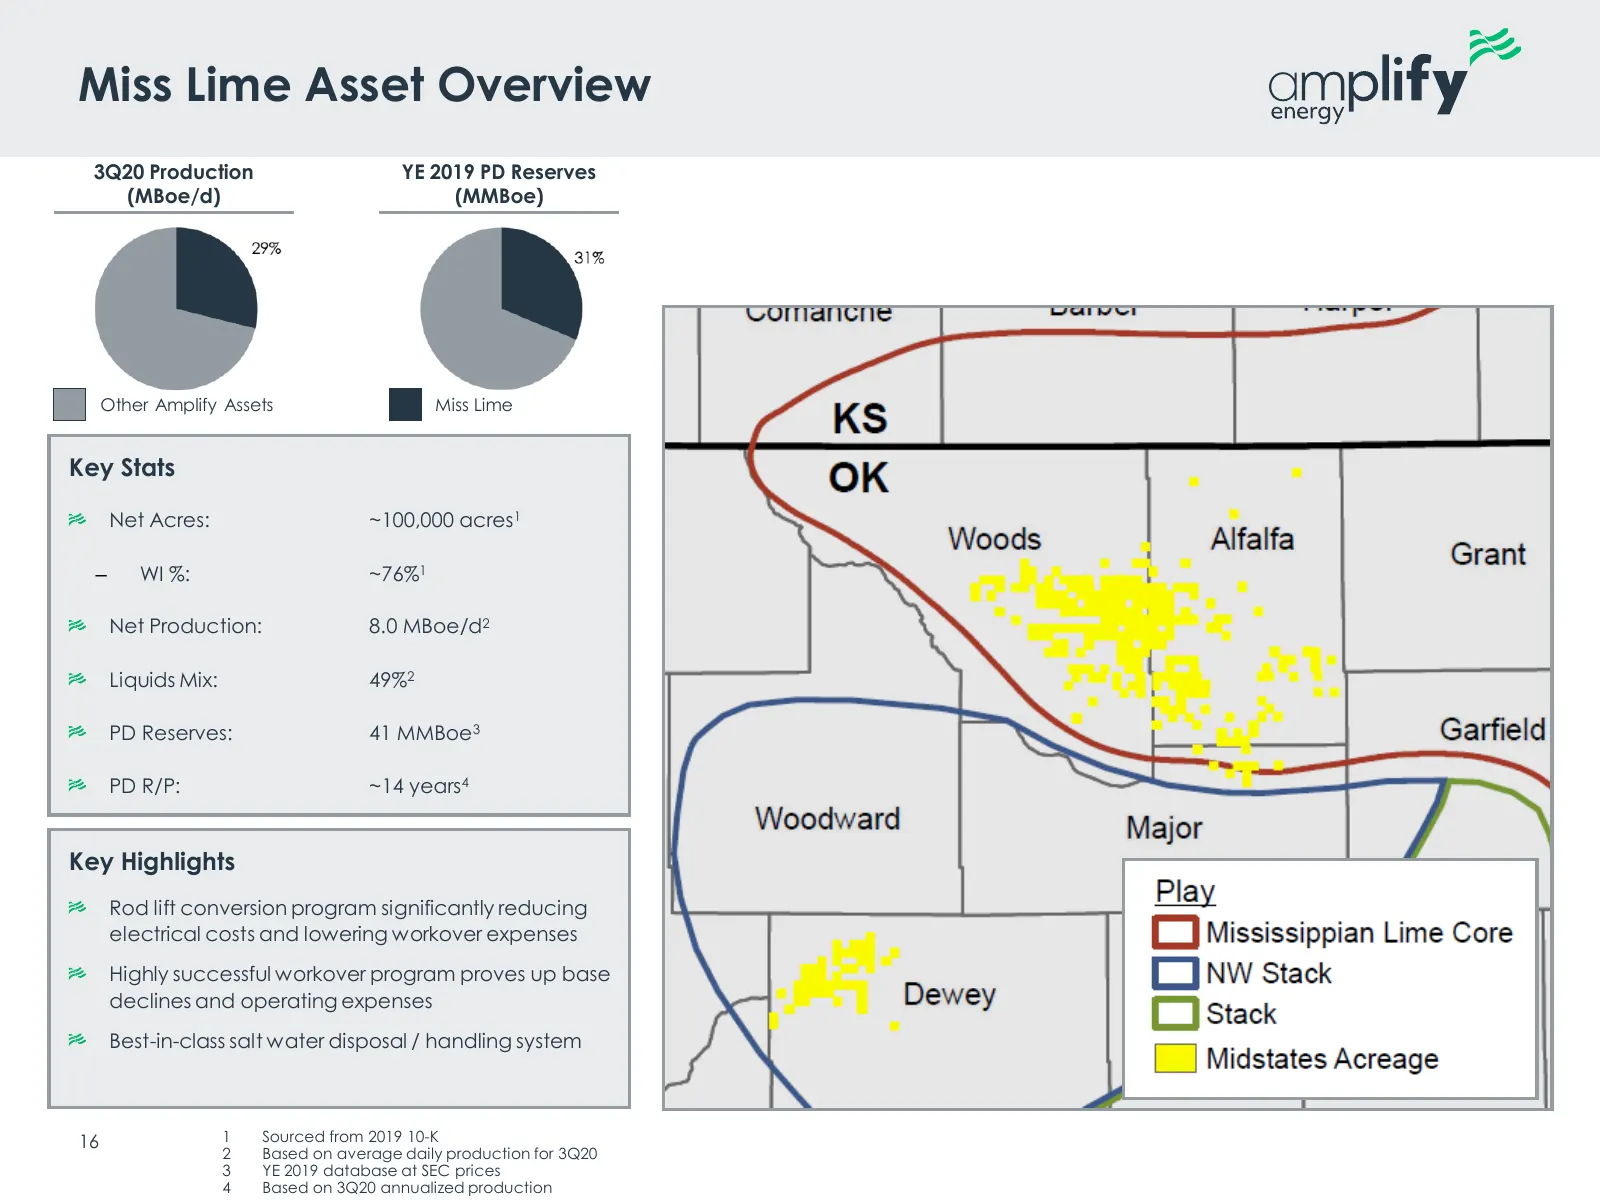
Miss Lime Asset Overview 3Q20 Production YE 2019 PD Reserves (MBoe/d) (MMBoe) Other Amplify Assets Miss Lime Key Stats Net Acres: ~100,000 acres1 ‒ WI %: ~76%1 Net Production: 8.0 MBoe/d2 Liquids Mix: 49%2 PD Reserves: 41 MMBoe3 PD R/P: ~14 years4 Key Highlights Rod lift conversion program significa
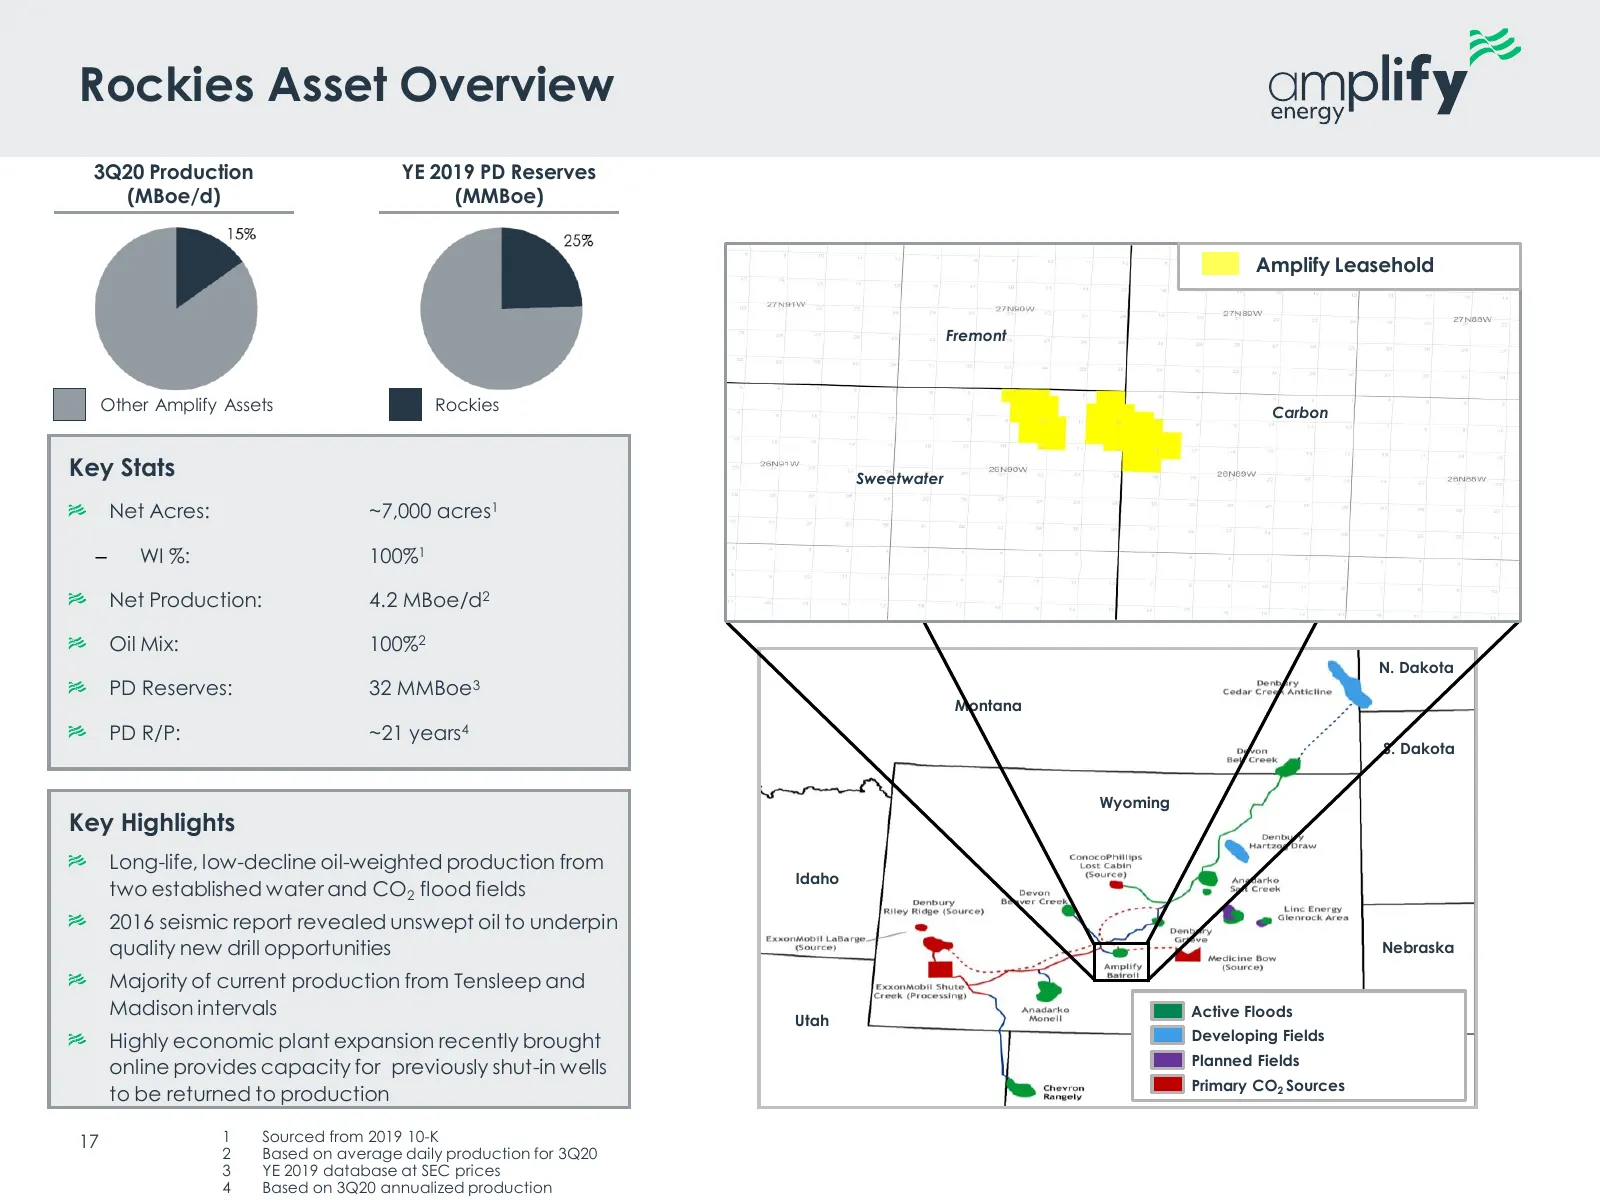
Slide 17: Rockies Asset Overview
Rockies Asset Overview 3Q20 Production YE 2019 PD Reserves (MBoe/d) (MMBoe) Amplify Leasehold Fremont Other Amplify Assets Rockies Carbon Key Stats Sweetwater Net Acres: ~7,000 acres1 ‒ WI %: 100%1 Net Production: 4.2 MBoe/d2 Oil Mix: 100%2 N. Dakota PD Reserves: 32 MMBoe3 Montana PD R/P: ~21 years4
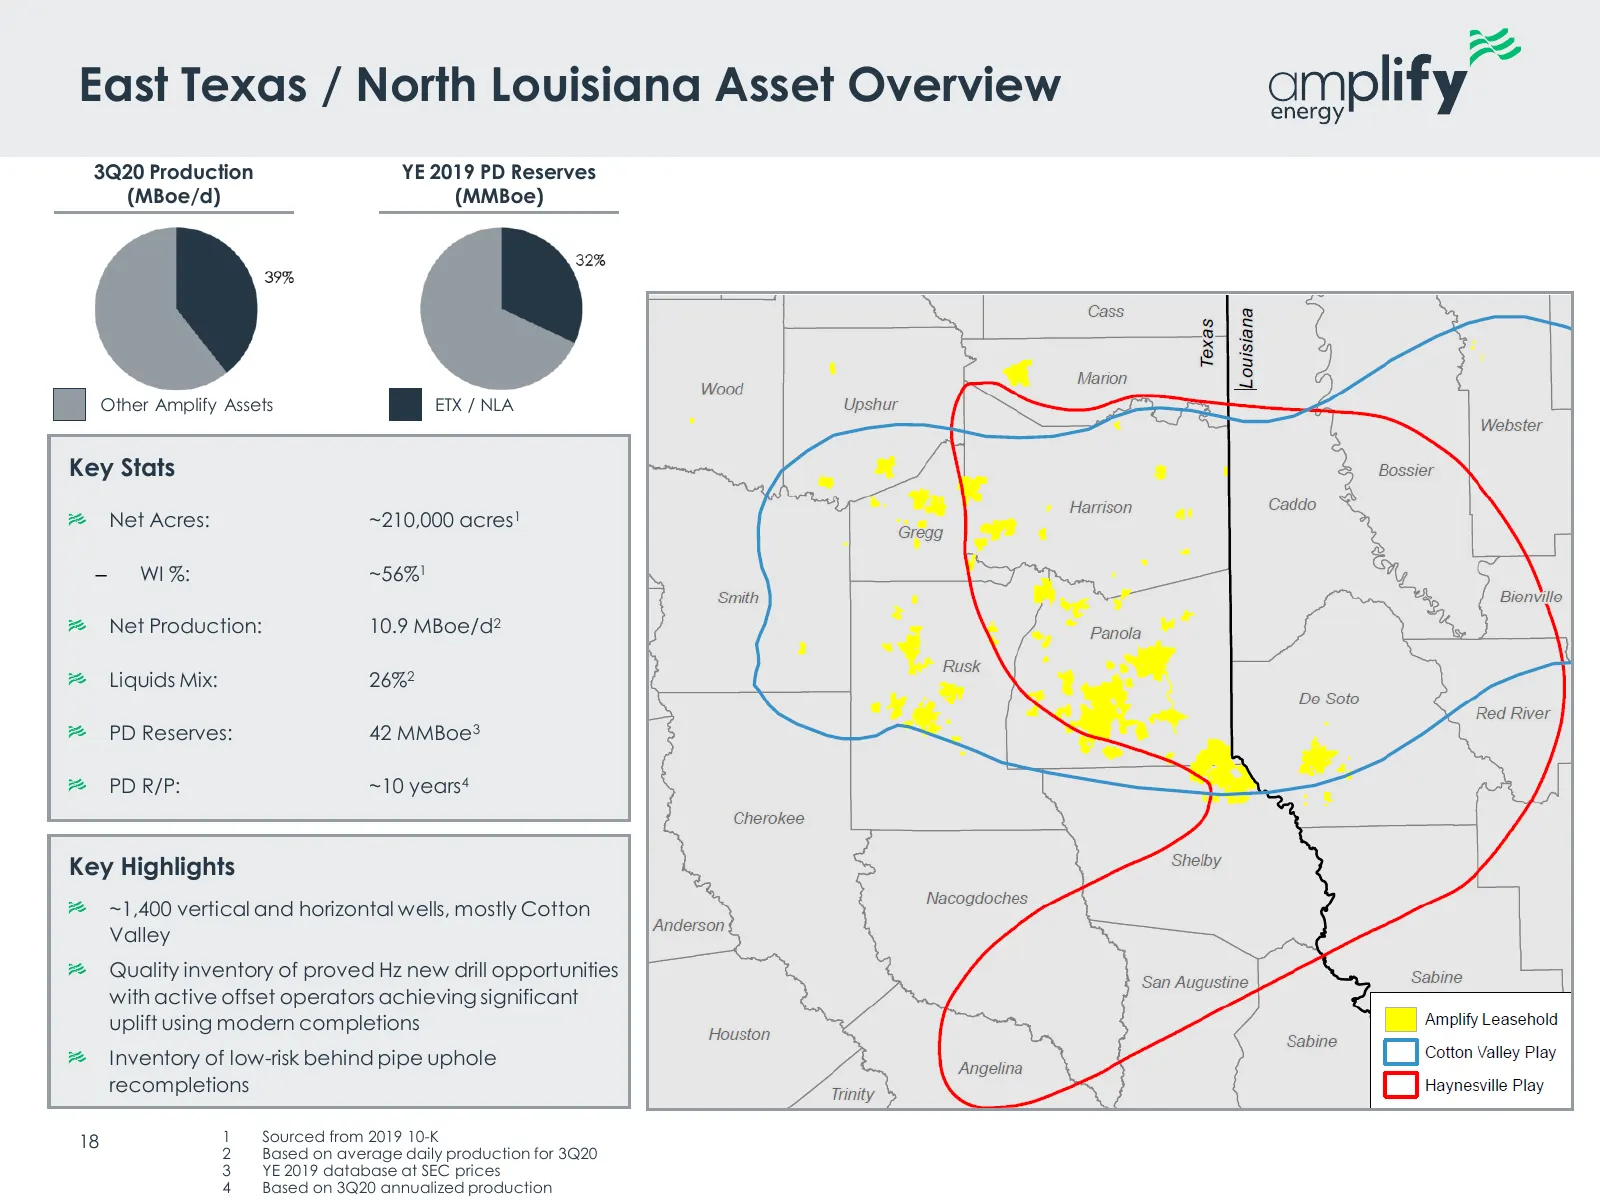
Slide 18: East Texas / North Louisiana Asset Overview
East Texas / North Louisiana Asset Overview 3Q20 Production YE 2019 PD Reserves (MBoe/d) (MMBoe) Other Amplify Assets ETX / NLA Key Stats Net Acres: ~210,000 acres1 ‒ WI %: ~56%1 Net Production: 10.9 MBoe/d2 Liquids Mix: 26%2 PD Reserves: 42 MMBoe3 PD R/P: ~10 years4 Key Highlights ~1,400 vertical a
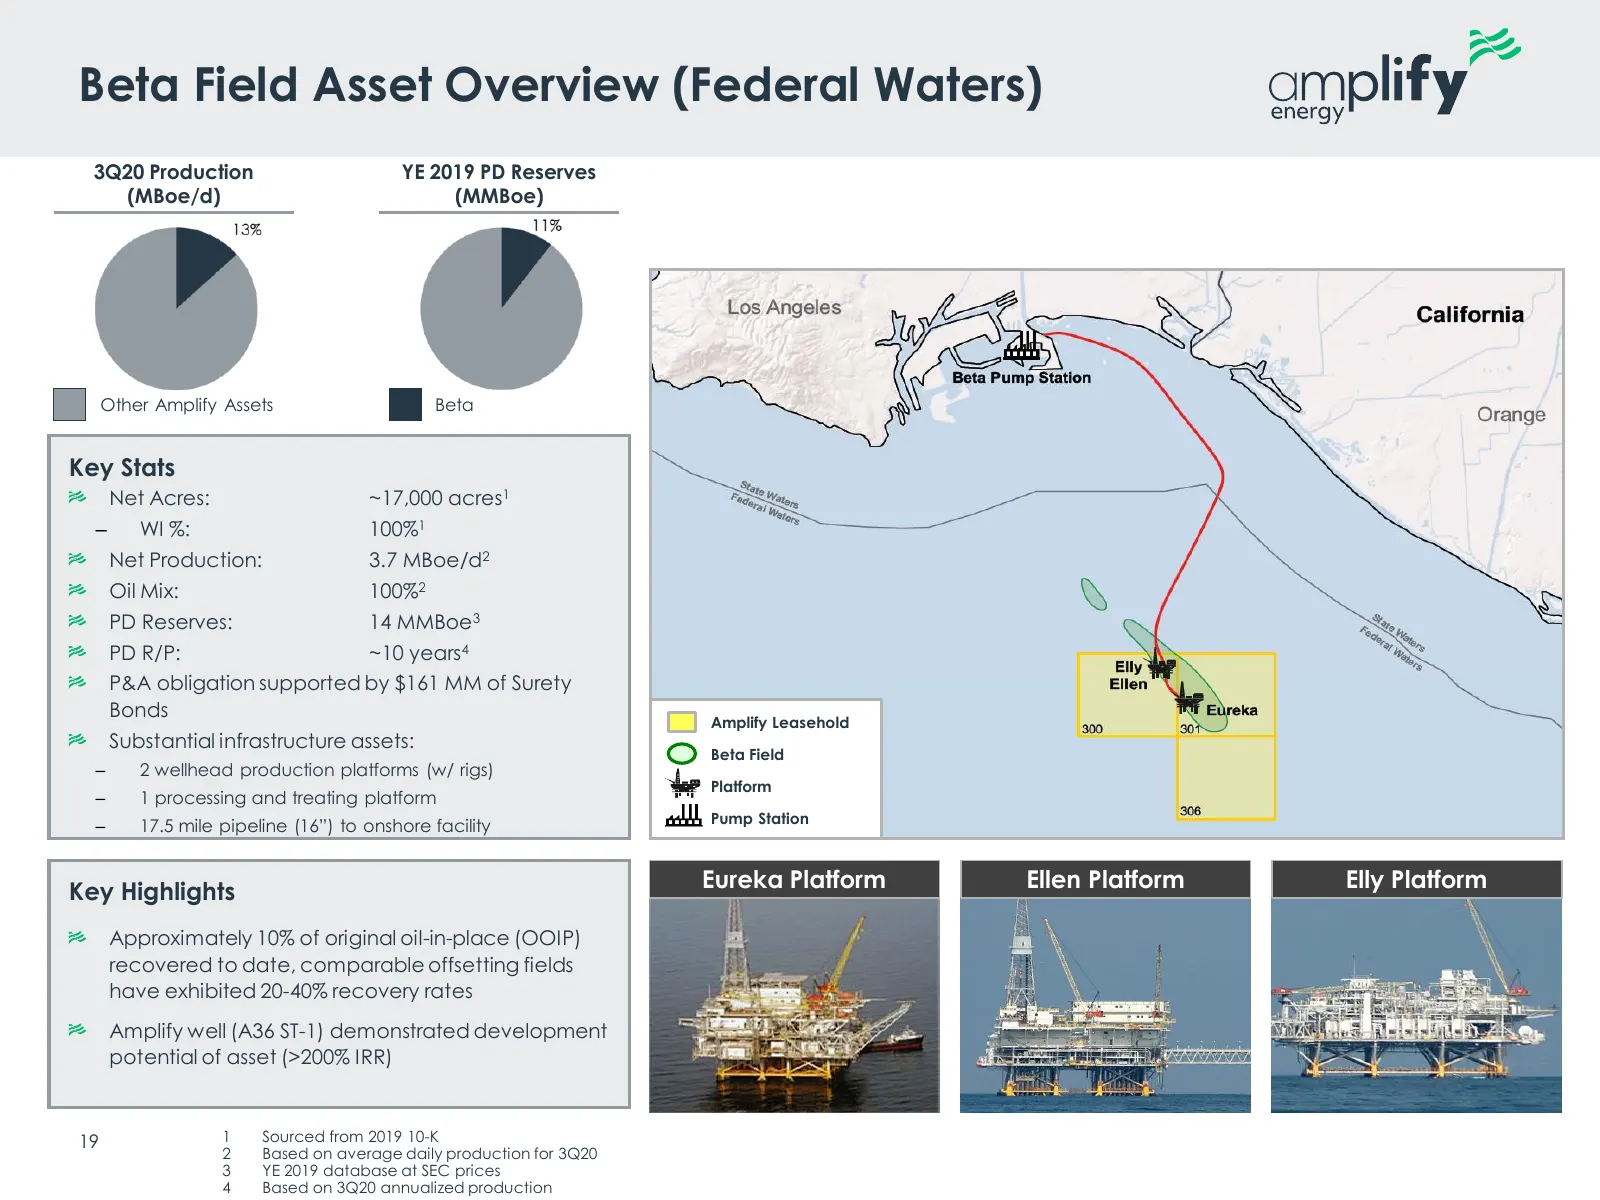
Slide 19: Beta Field Asset Overview (Federal Waters)
Beta Field Asset Overview (Federal Waters) 3Q20 Production YE 2019 PD Reserves (MBoe/d) (MMBoe) Other Amplify Assets Beta Key Stats Net Acres: ~17,000 acres1 ‒ WI %: 100%1 Net Production: 3.7 MBoe/d2 Oil Mix: 100%2 PD Reserves: 14 MMBoe3 PD R/P: ~10 years4 P&A obligation supported by $161 MM of Sure
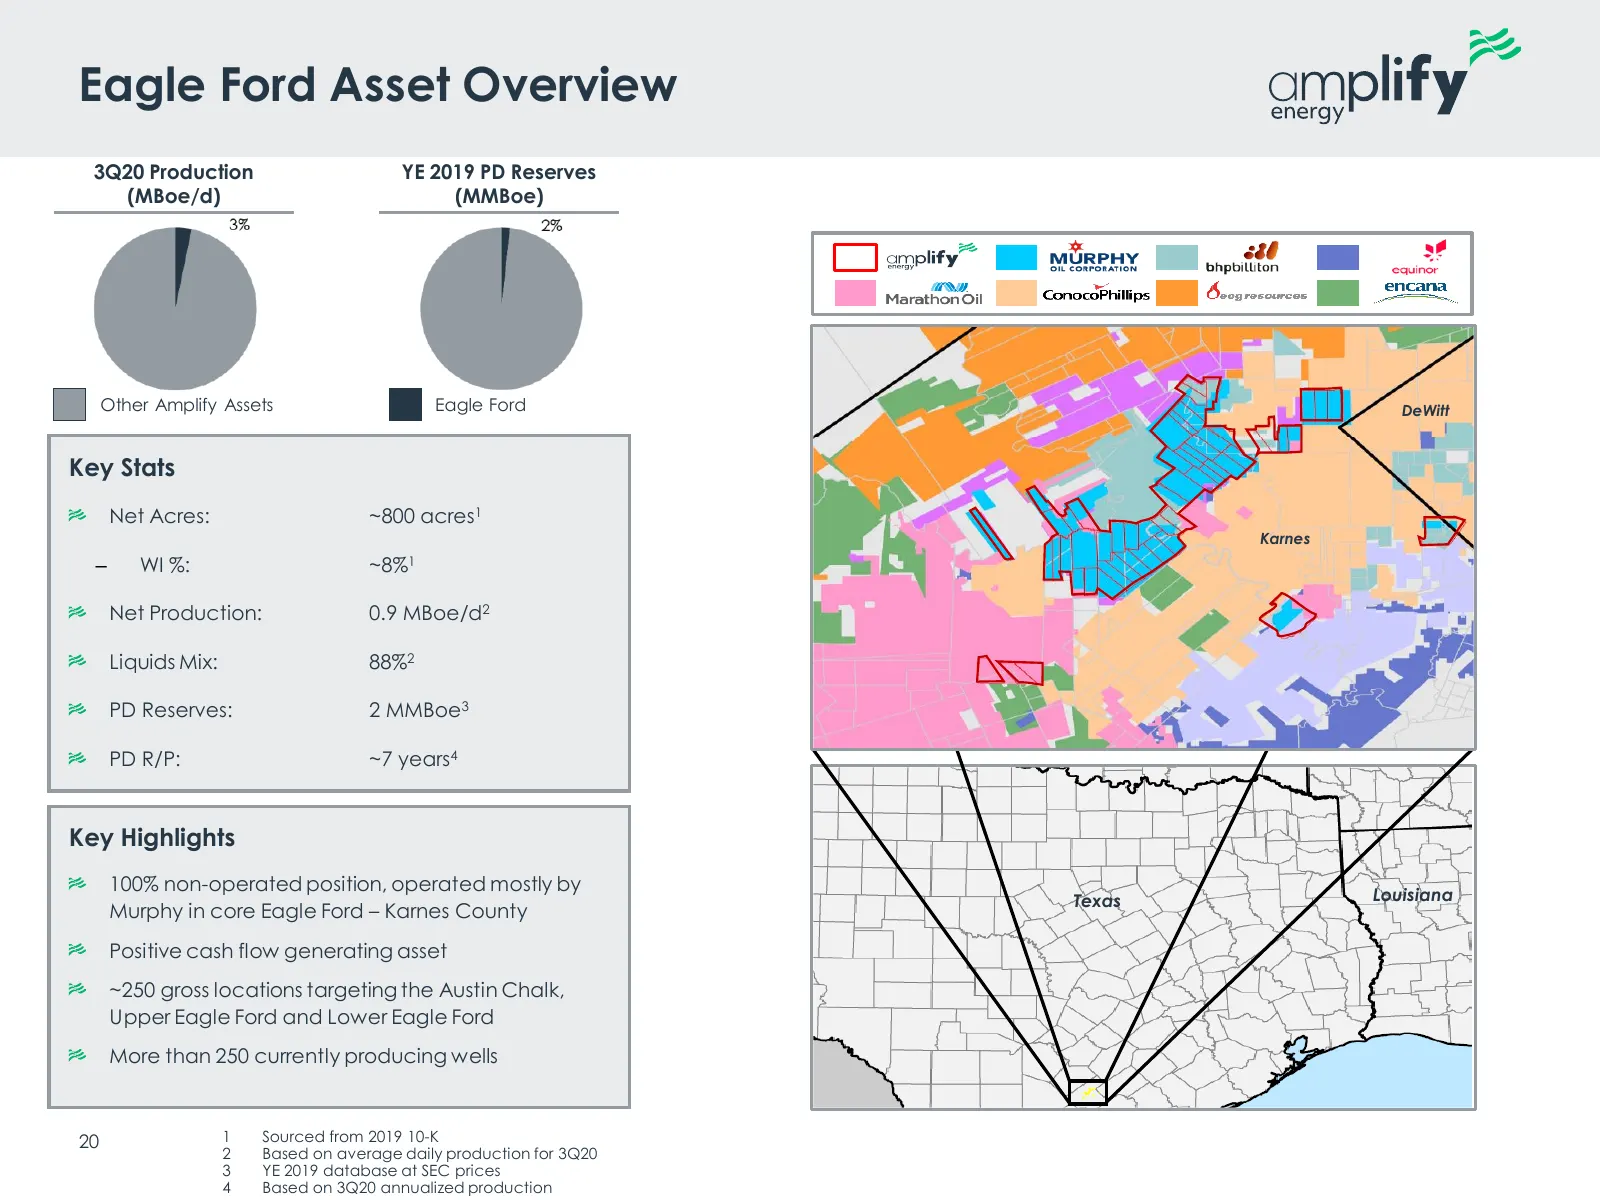
Slide 20: Eagle Ford Asset Overview
Eagle Ford Asset Overview 3Q20 Production YE 2019 PD Reserves (MBoe/d) (MMBoe) Other Amplify Assets Eagle Ford DeWitt Key Stats Net Acres: ~800 acres1 Karnes ‒ WI %: ~8%1 Net Production: 0.9 MBoe/d2 Liquids Mix: 88%2 PD Reserves: 2 MMBoe3 PD R/P: ~7 years4 Key Highlights 100% non-operated position,
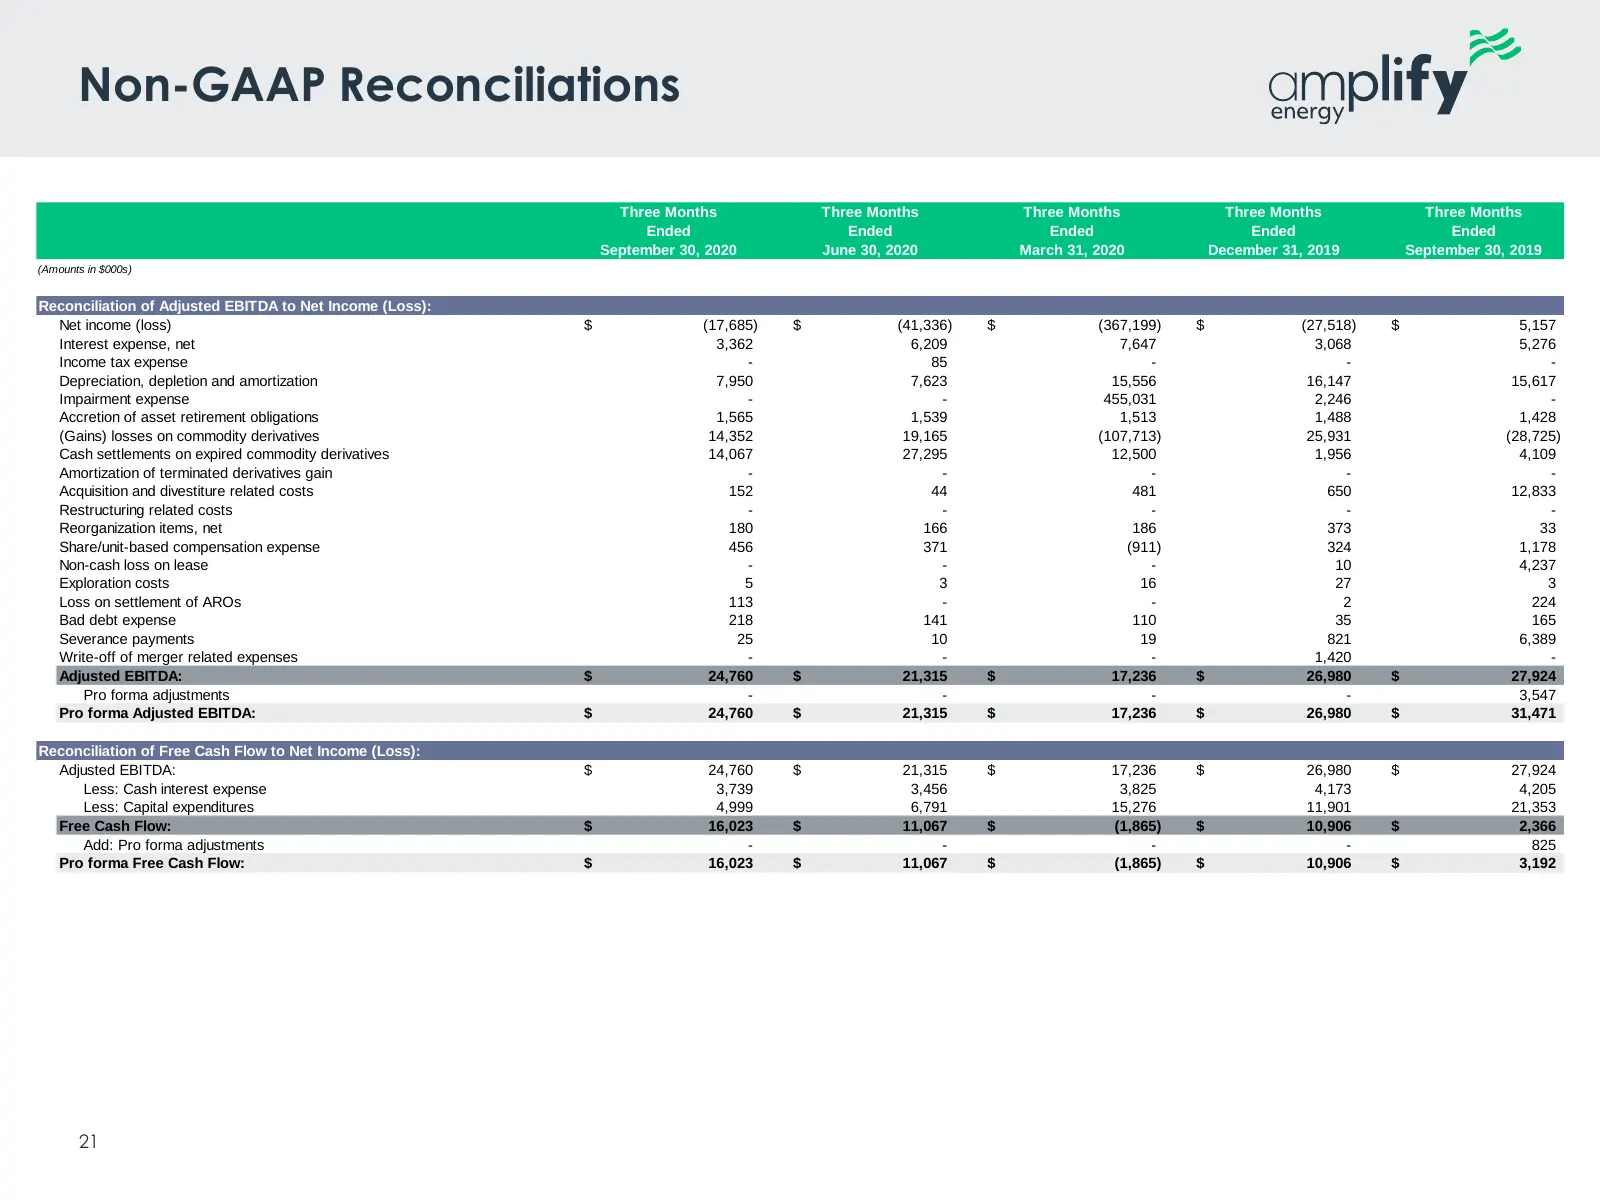
Slide 21: Non-GAAP Reconciliations
Non-GAAP Reconciliations Three Months Three Months Three Months Three Months Three Months Ended Ended Ended Ended Ended September 30, 2020 June 30, 2020 March 31, 2020 December 31, 2019 September 30, 2019 (Amounts in $000s) Reconciliation of Adjusted EBITDA to Net Income (Loss): Net income (loss) $
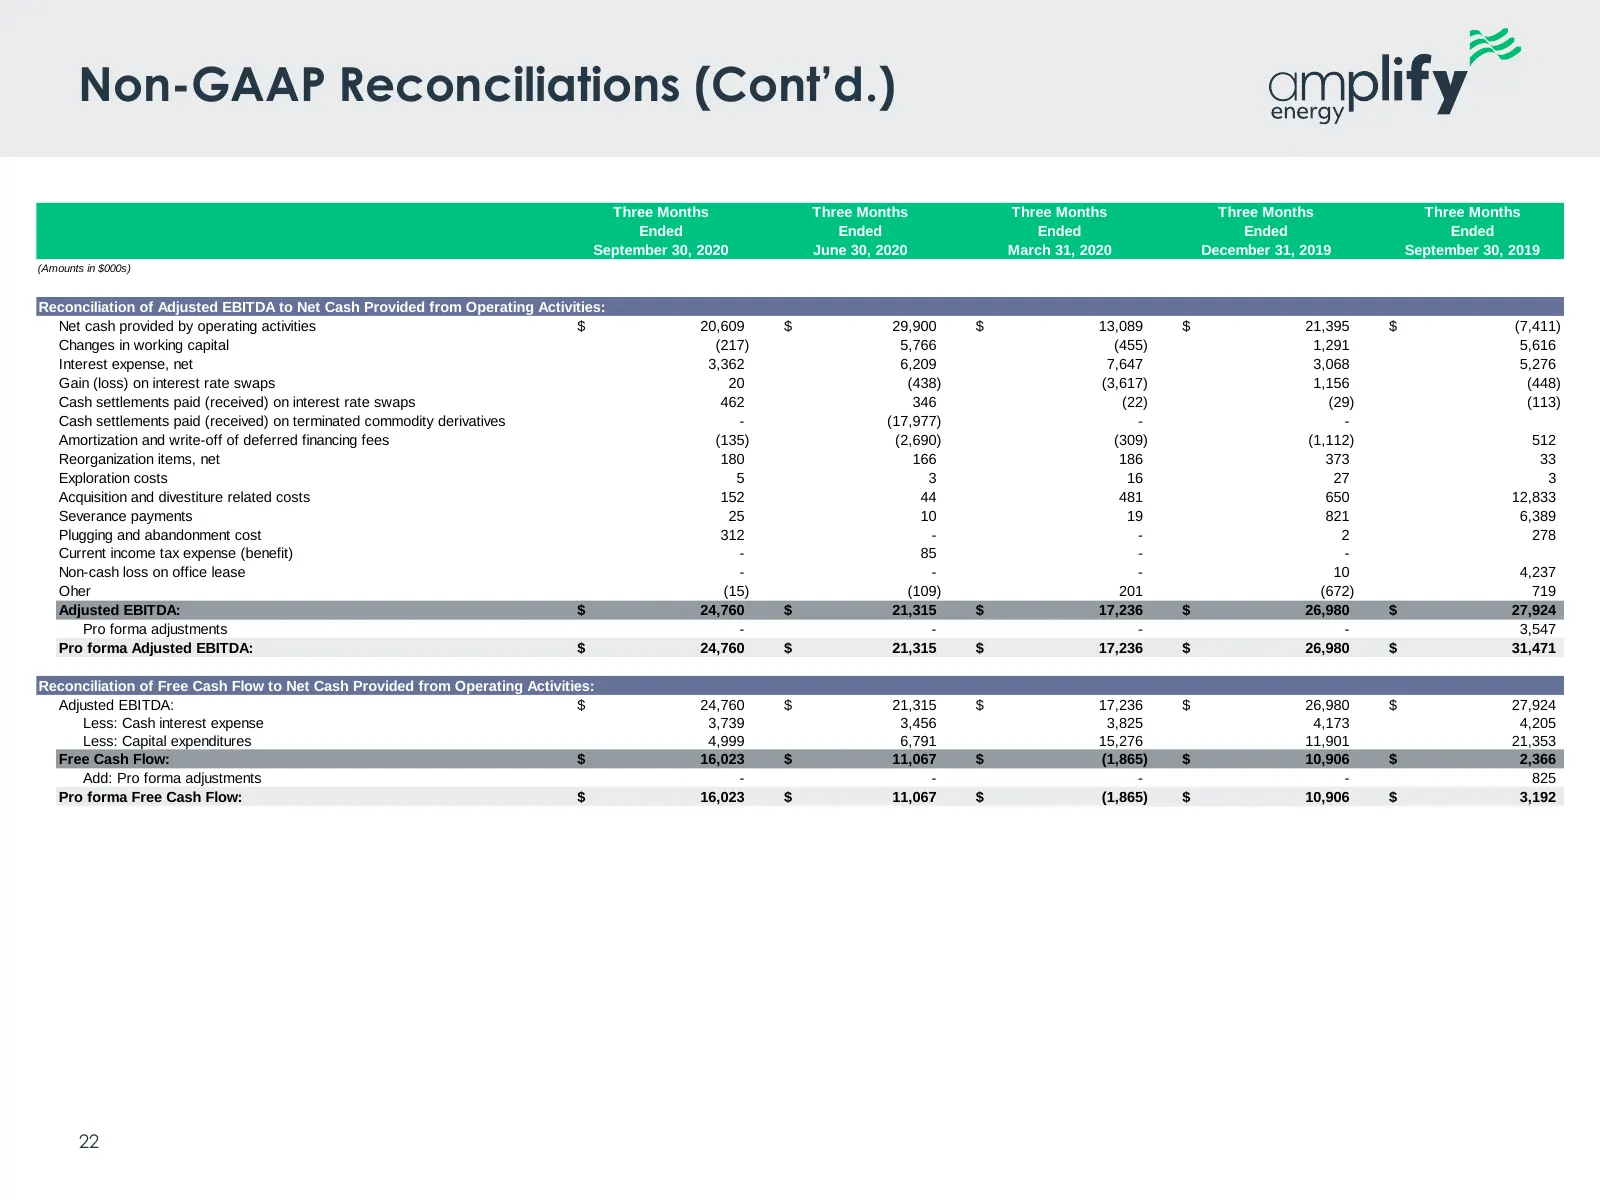
Slide 22: Non-GAAP Reconciliations (Cont'd.)
Non-GAAP Reconciliations (Cont’d.) Three Months Three Months Three Months Three Months Three Months Ended Ended Ended Ended Ended September 30, 2020 June 30, 2020 March 31, 2020 December 31, 2019 September 30, 2019 (Amounts in $000s) Reconciliation of Adjusted EBITDA to Net Cash Provided from Operat
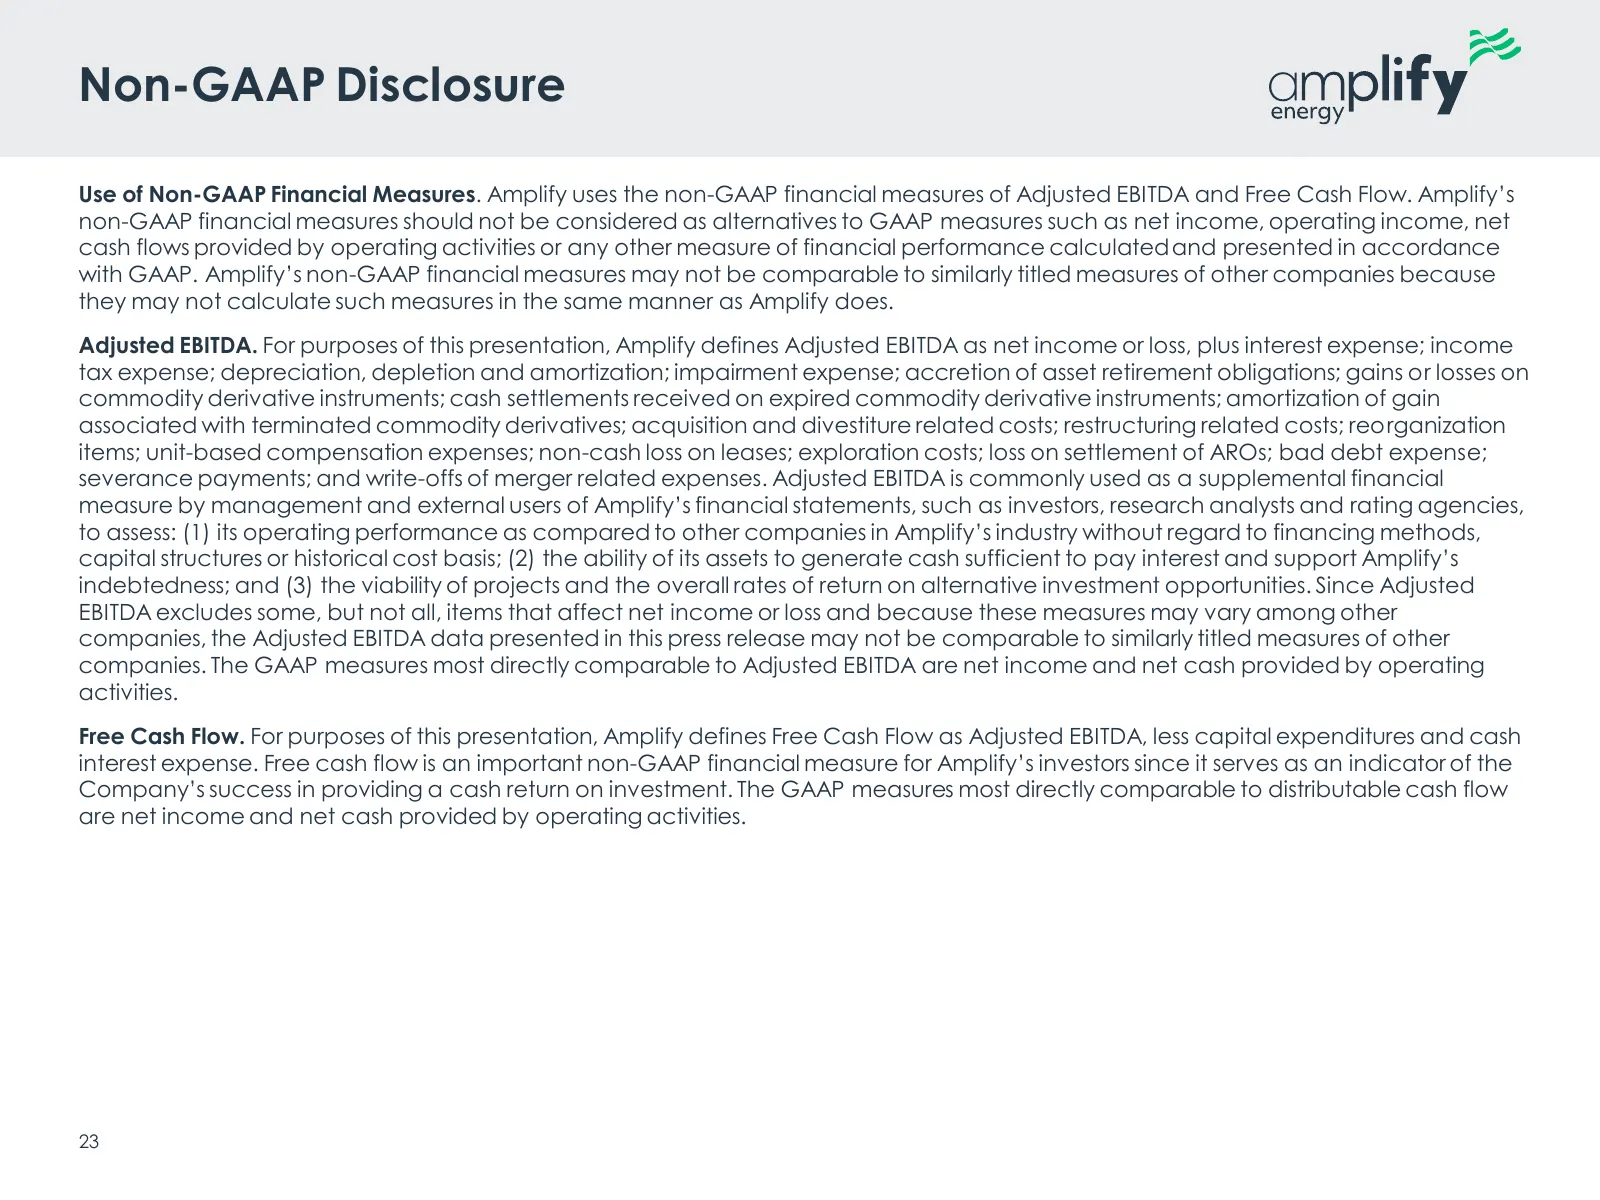
Slide 23: Non-GAAP Disclosure
Non-GAAP Disclosure Use of Non-GAAP Financial Measures. Amplify uses the non-GAAP financial measures of Adjusted EBITDA and Free Cash Flow. Amplify’s non-GAAP financial measures should not be considered as alternatives to GAAP measures such as net income, operating income, net cash flows provided by
Slide 24: lify
am lify e nergy \yY ws
Source: Internet Archive copy of s24.q4cdn.com
More decks from Amplify Energy Corp.
 Q3 2026 Earnings Presentation31 slides · Nov 9, 2026
 Q2 2026 Earnings Presentation31 slides · Aug 10, 2026
 Investor Presentation (May 2026)30 slides · May 11, 2026
 Investor Presentation (March 2026)28 slides · Mar 9, 2026
 Investor Presentation (August 2025)28 slides · Aug 6, 2025
 Q1 2025 Earnings Presentation33 slides · May 13, 2025