comScore, Inc. · NASDAQ:SCOR
comScore — CES 2010
39 slides from comScore's conference presentation, Jan 9, 2010

Slide 1: Using Consumer Insights to Uncover Opportunities in Next Generation Mobile Devices
Using Consumer Insights to Uncover Opportunities in Next Generation Mobile Devices Mark Donovan, SVP Mobile + Sr. Analyst Las Vegas, CES 2010 January 9, 2010
Slide 2: My Talk
My Talk OEM & Device Trends Mobile Media usage Trends Shifting device form factors and impact on media usage Emerging opportunities & business models Head to Head Smartphone comparisons Q&A © comScore, Inc. Proprietary and Confidential. 2
Slide 3: The Most Widely Owned Phone
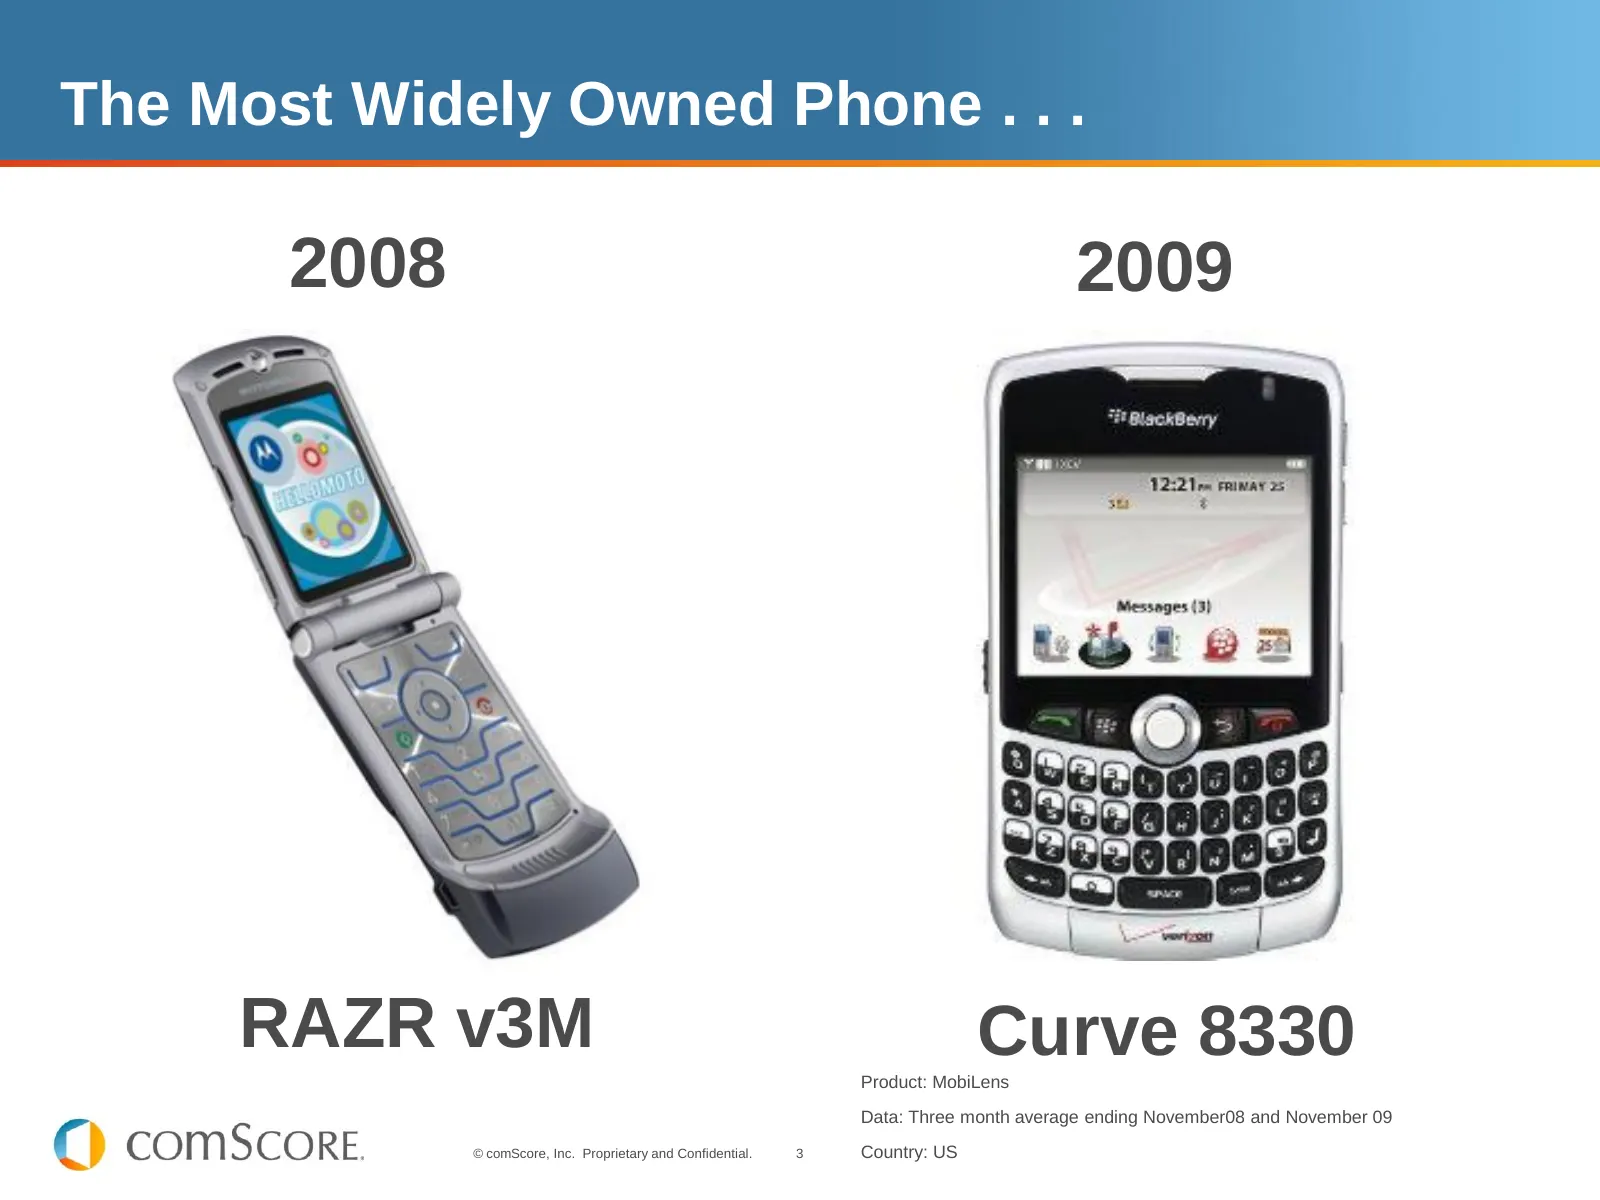
The Most Widely Owned Phone . . . 2008 2009 RAZR v3M Curve 8330 Product: MobiLens Data: Three month average ending November08 and November 09 © comScore, Inc. Proprietary and Confidential. 3 Country: US
Slide 4: Changing Fortunes of Device OEMs
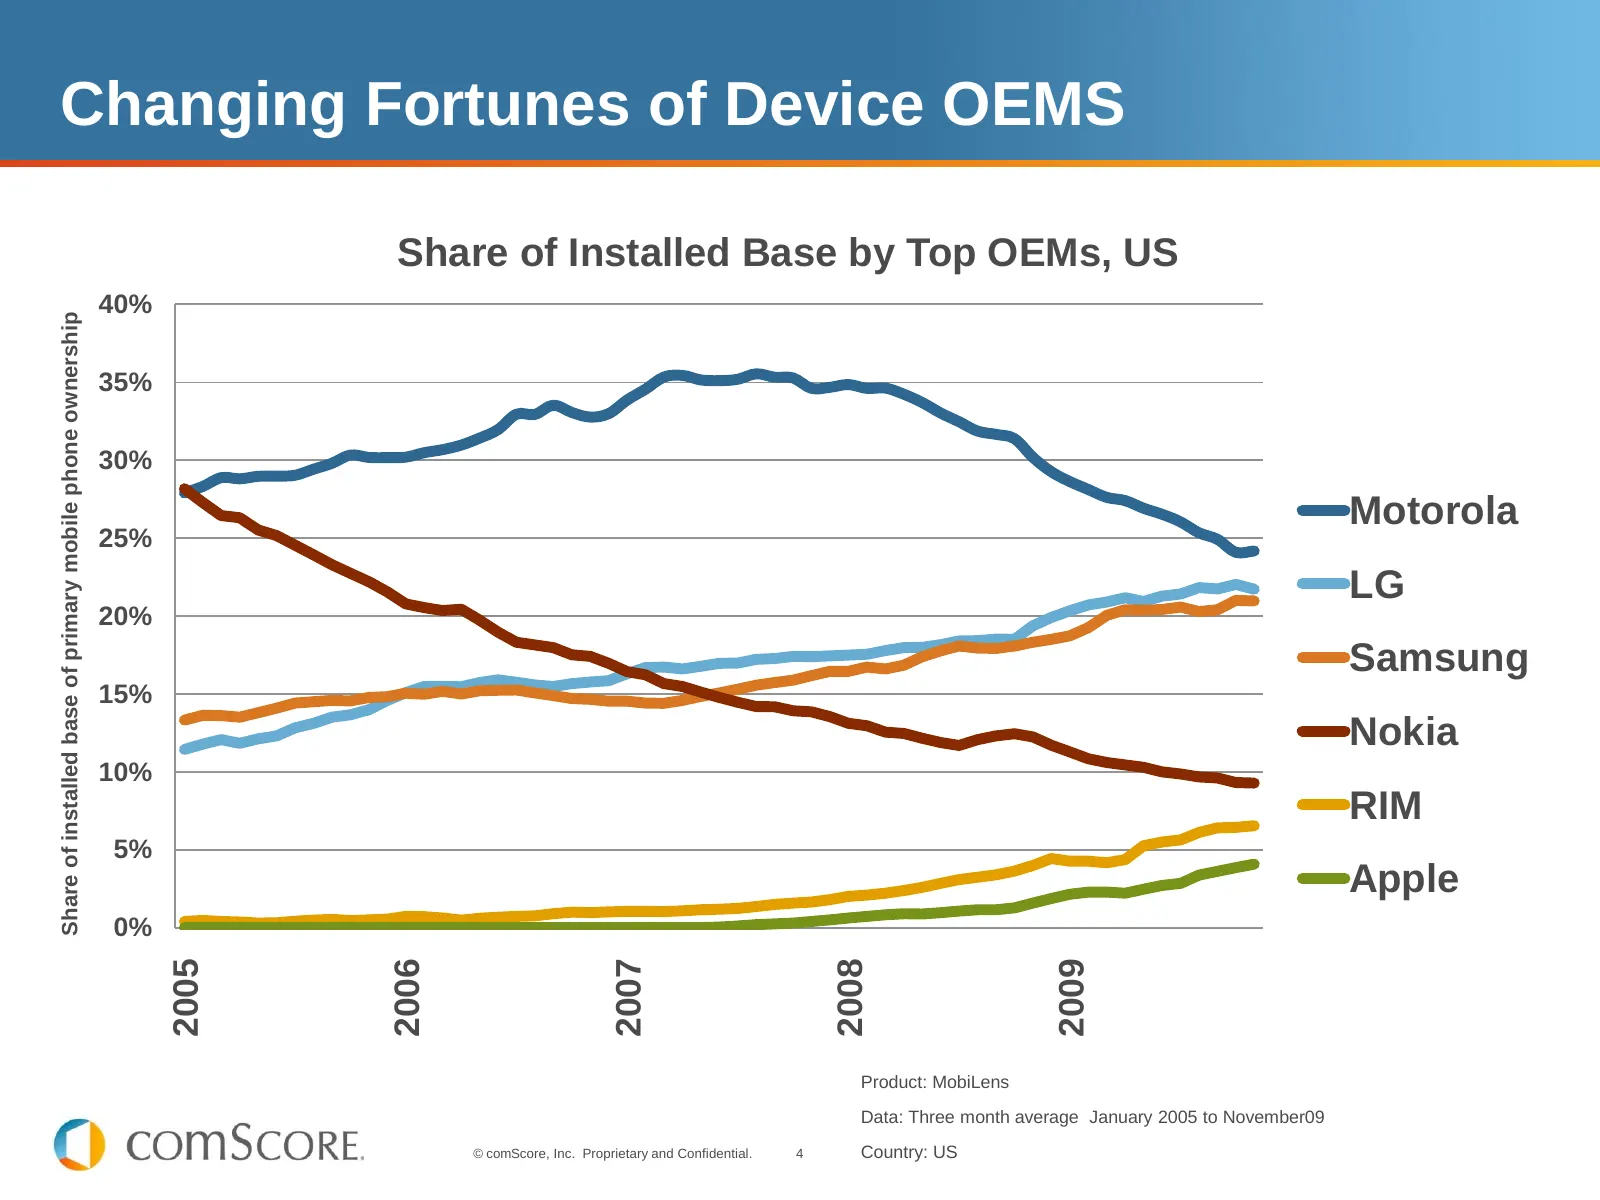
Changing Fortunes of Device OEMS Share of Installed Base by Top OEMs, US 40% Share of installed base of primary mobile phone ownership 35% 30% Motorola 25% LG 20% Samsung 15% Nokia 10% RIM 5% Apple 0% 2005 2006 2007 2008 Product: MobiLens 2009 Data: Three month average January 2005 to November09 © c
Slide 5: Different Landscape in Europe
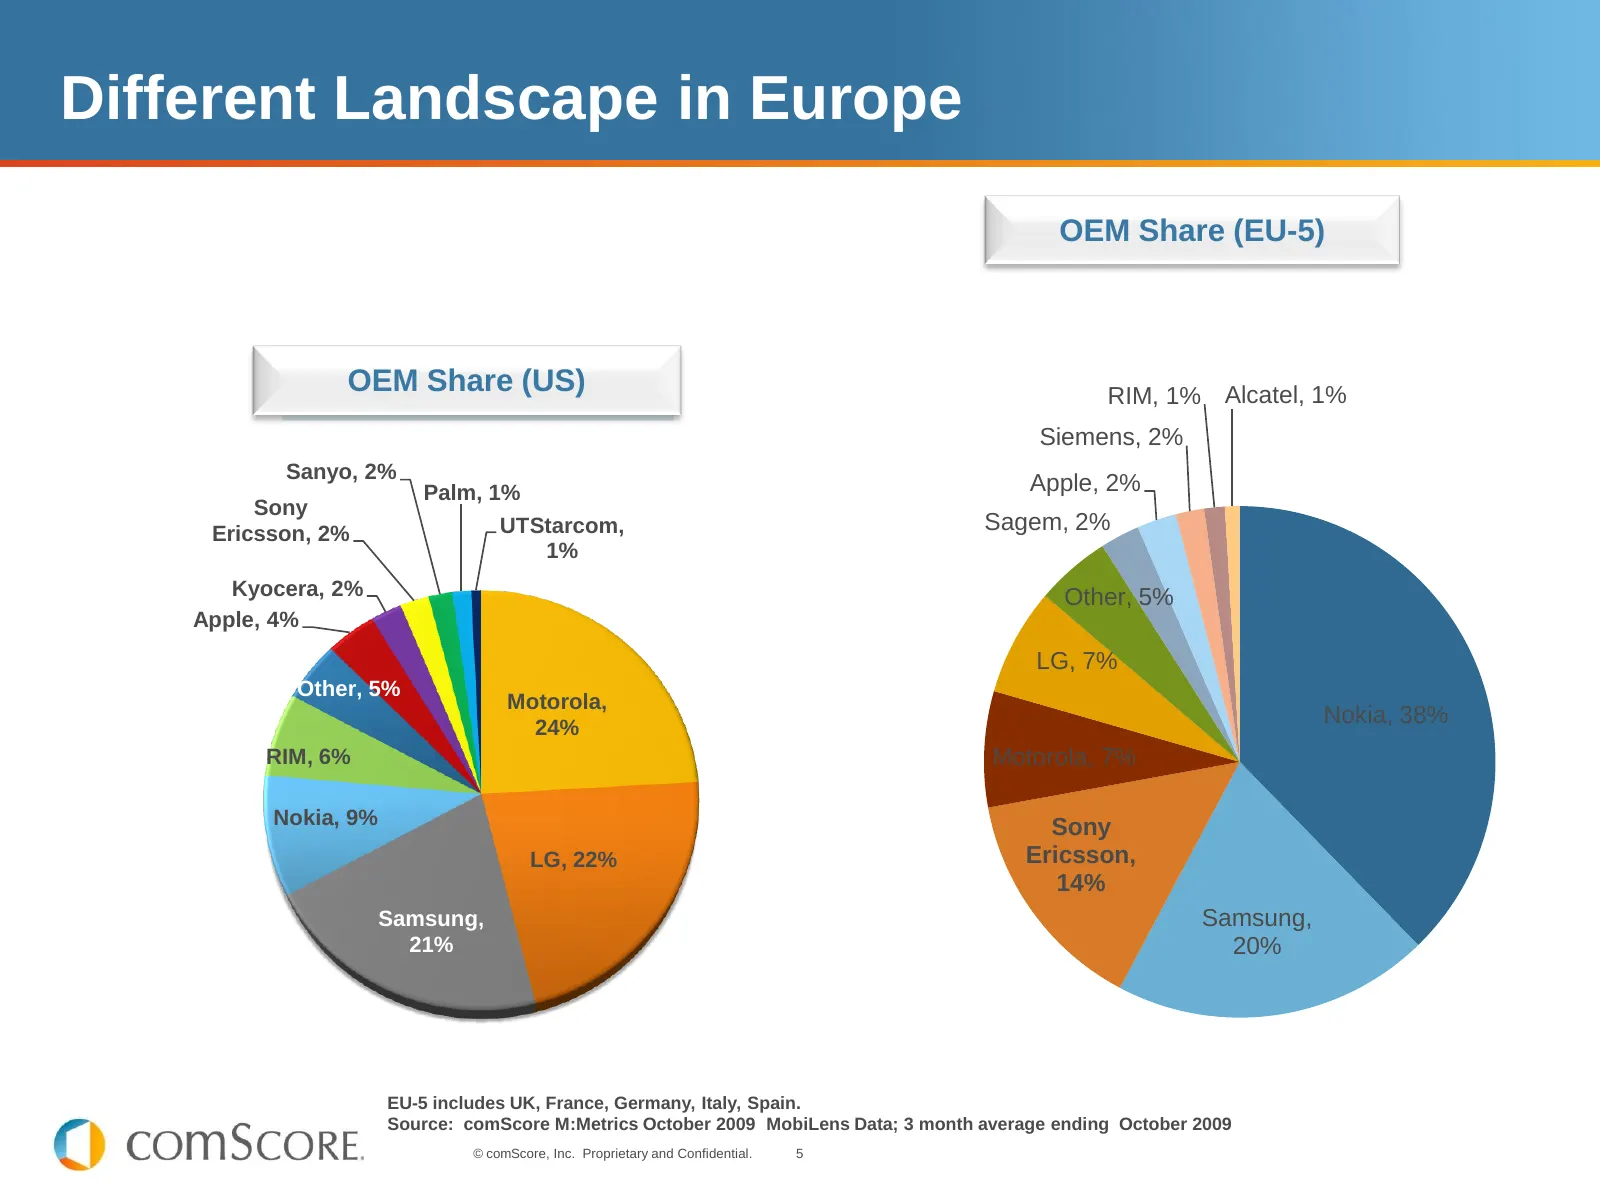
Different Landscape in Europe OEM Share (EU-5) Operator Share OEM Share (US)(US) RIM, 1% Alcatel, 1% Siemens, 2% Sanyo, 2% Palm, 1% Apple, 2% Sony Ericsson, 2% UTStarcom, Sagem, 2% 1% Kyocera, 2% Other, 5% Apple, 4% LG, 7% Other, 5% Motorola, 24% Nokia, 38% RIM, 6% Motorola, 7% Nokia, 9% Sony LG, 22
Slide 6: Three Secular Trends Driving Market
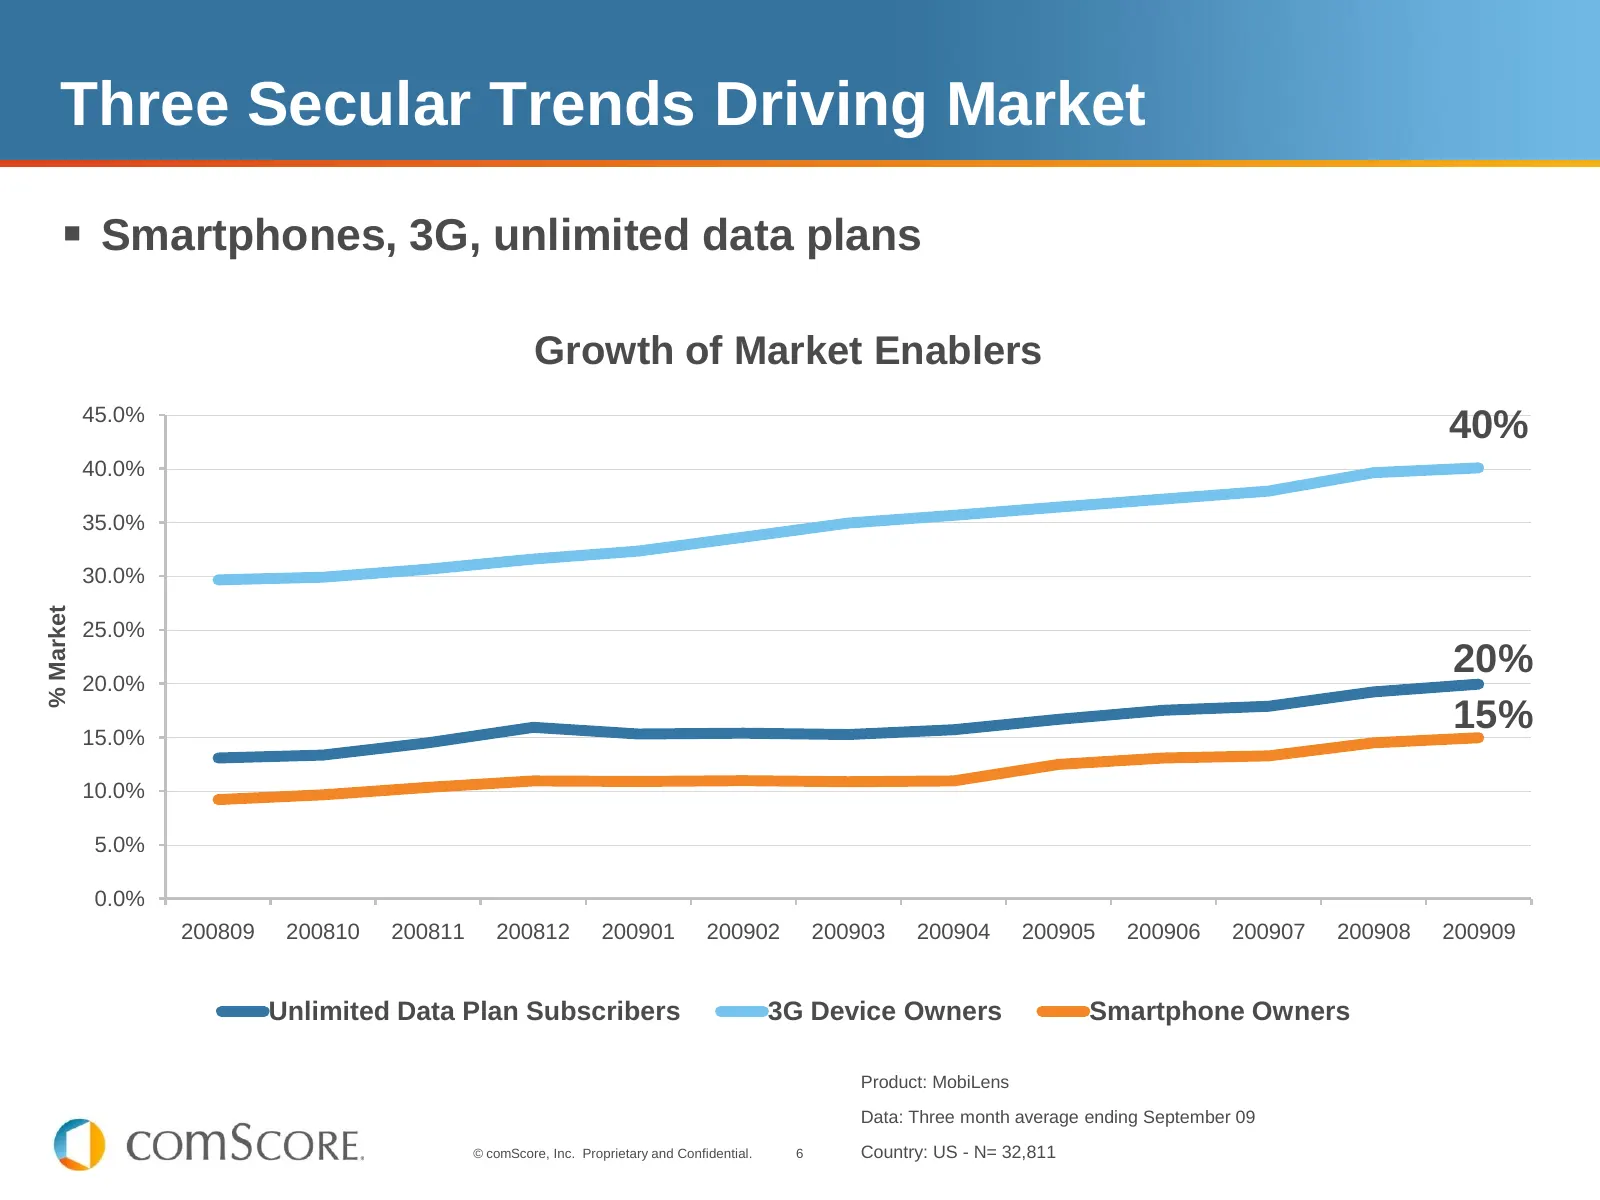
Three Secular Trends Driving Market Smartphones, 3G, unlimited data plans Growth of Market Enablers 45.0% 40% 40.0% 35.0% 30.0% % Market 25.0% 20.0% 20% 15.0% 15% 10.0% 5.0% 0.0% 200809 200810 200811 200812 200901 200902 200903 200904 200905 200906 200907 200908 200909 Unlimited Data Plan Subscrib
Slide 7: A 3G Majority by End of Year
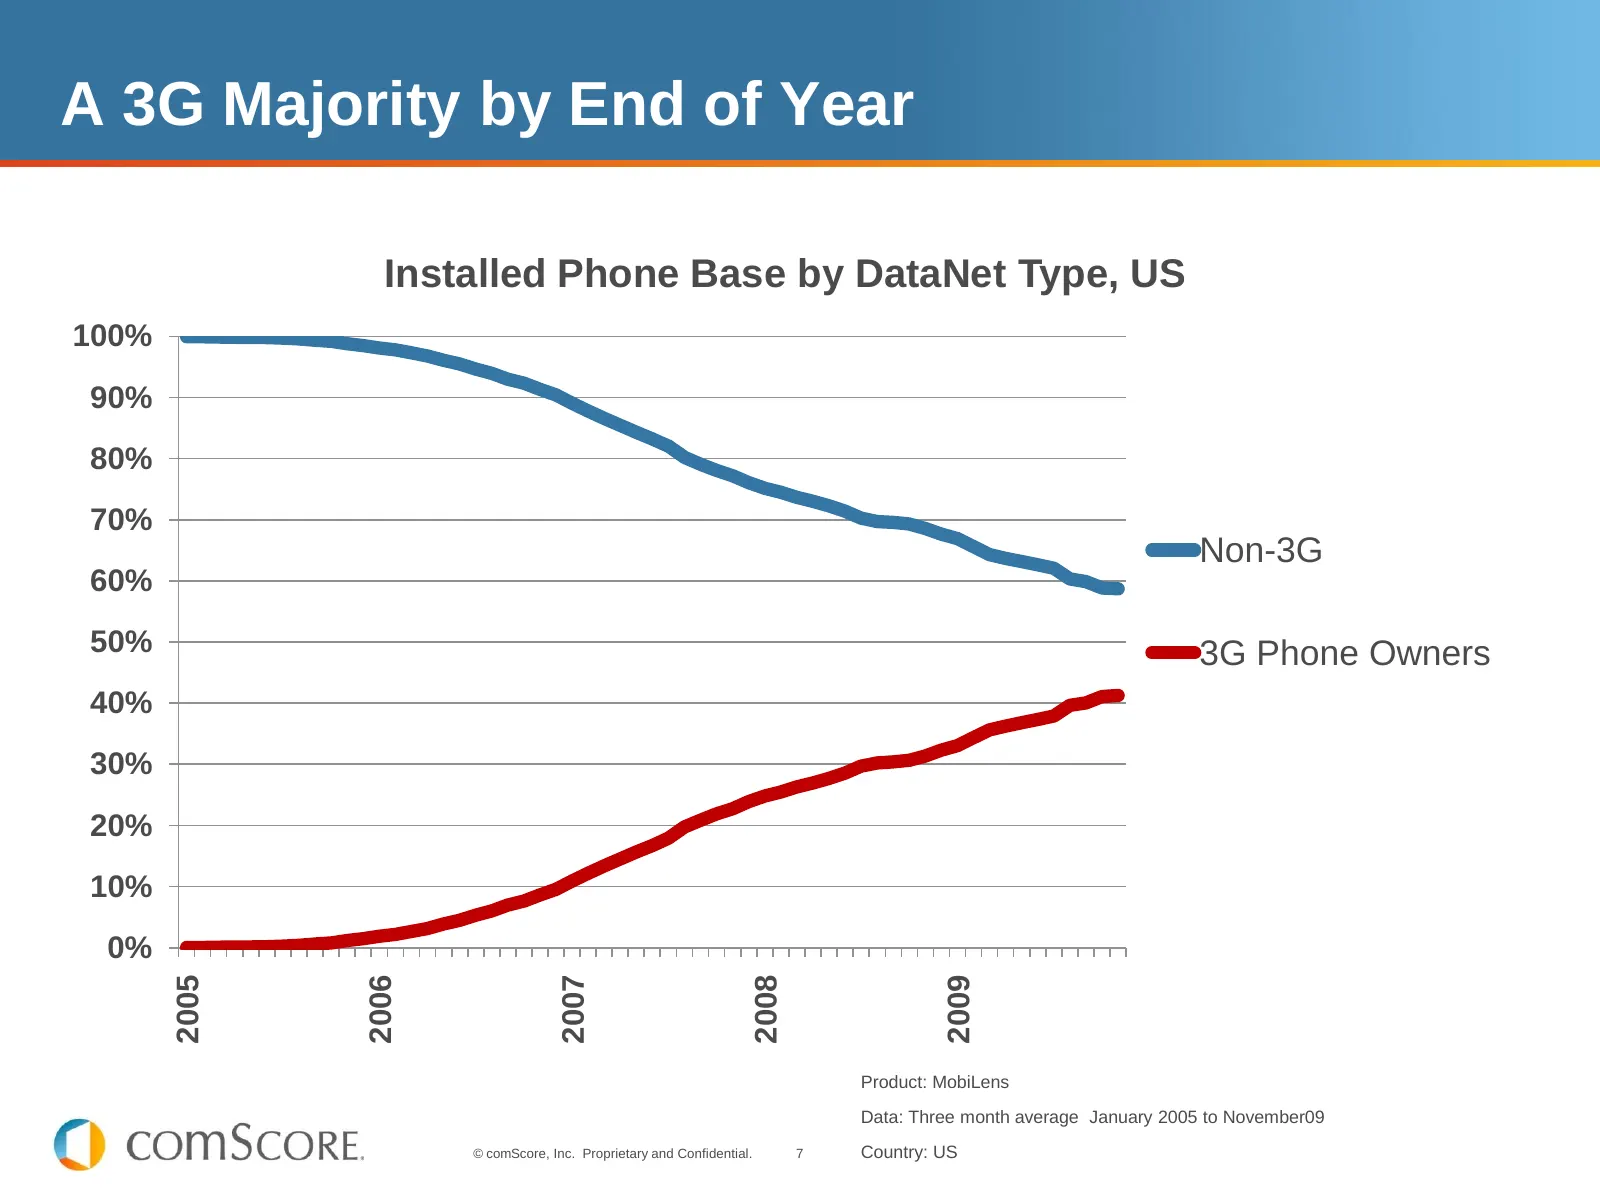
A 3G Majority by End of Year Installed Phone Base by DataNet Type, US 100% 90% 80% 70% Non-3G 60% 50% 3G Phone Owners 40% 30% 20% 10% 0% 2005 2006 2007 2008 2009 Product: MobiLens Data: Three month average January 2005 to November09 © comScore, Inc. Proprietary and Confidential. 7 Country: US
Slide 8: Soon, 1 in 3 Will Own a Smartphone
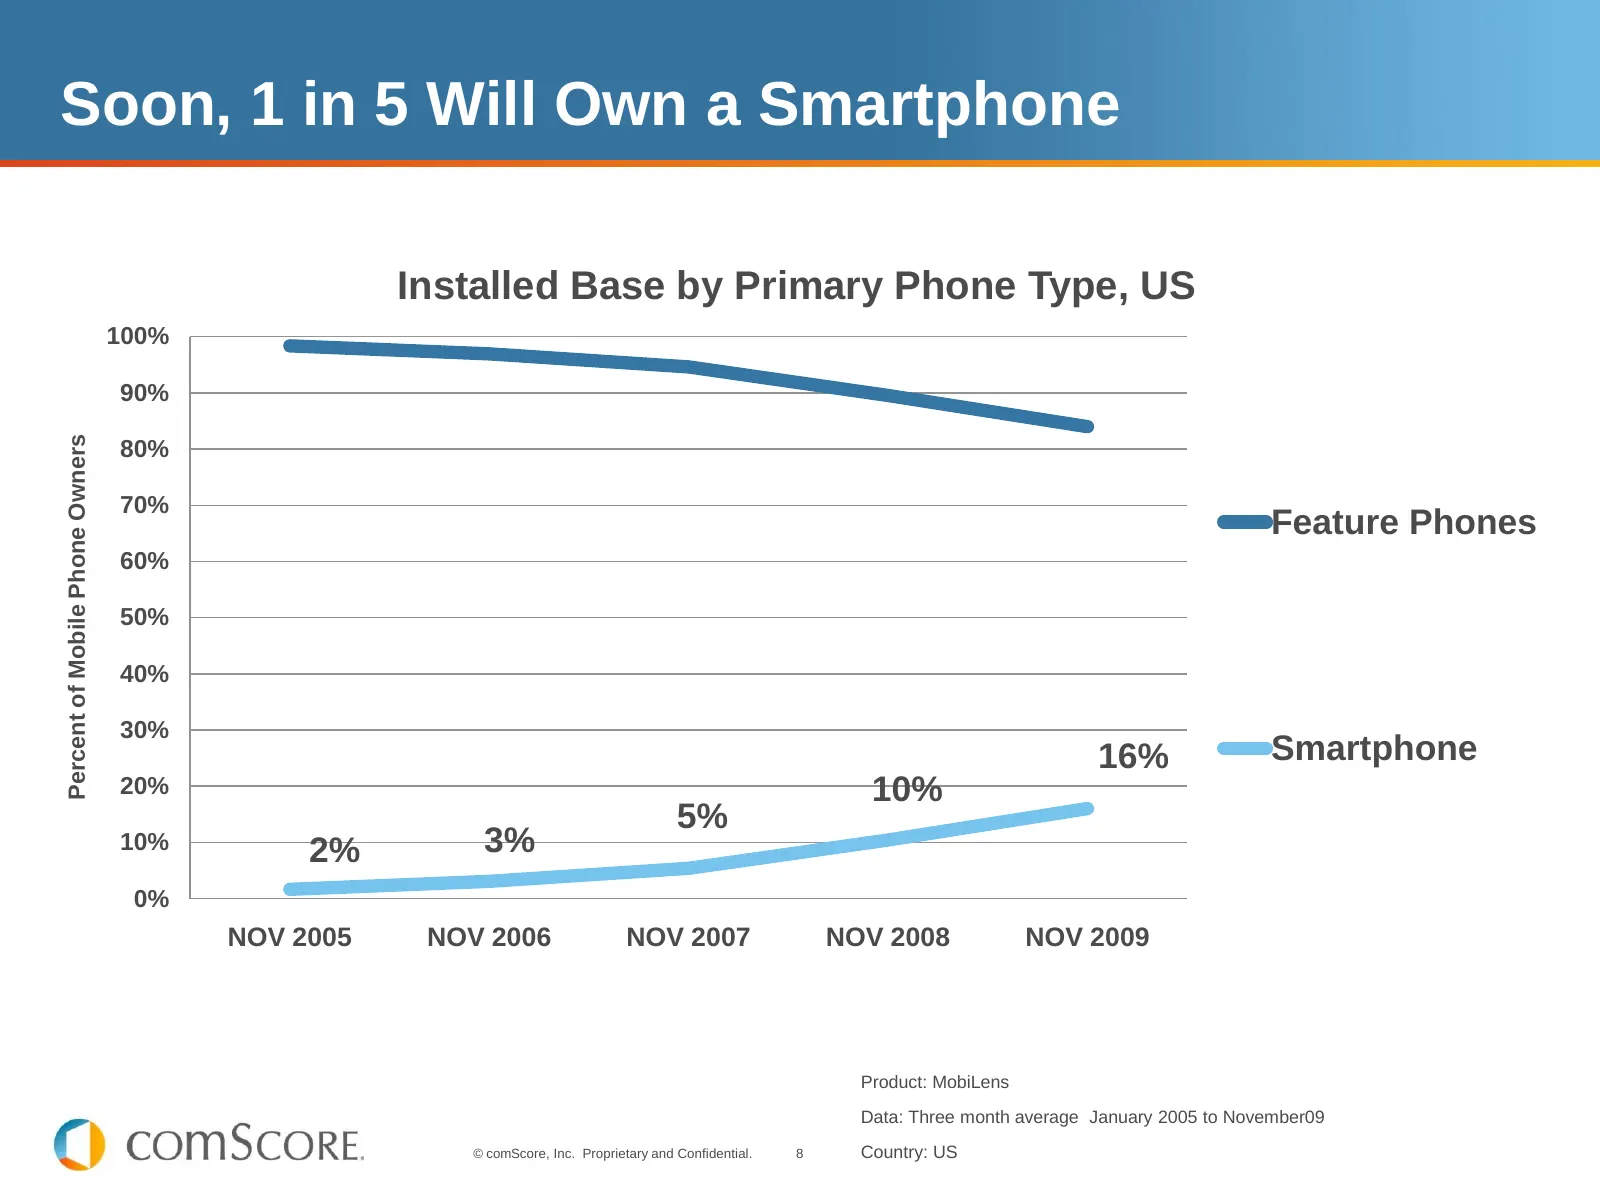
Soon, 1 in 5 Will Own a Smartphone Installed Base by Primary Phone Type, US 100% 90% Percent of Mobile Phone Owners 80% 70% Feature Phones 60% 50% 40% 30% 16% Smartphone 20% 10% 5% 10% 2% 3% 0% NOV 2005 NOV 2006 NOV 2007 NOV 2008 NOV 2009 Product: MobiLens Data: Three month average January 2005 to N
Slide 9: Mobile media is mainstreaming and core trends only moving up
Mobile media is mainstreaming and core trends only moving up. With this growth, understanding specific audiences becomes more and more important. © comScore, Inc. Proprietary and Confidential. 9
Slide 10: Mobile Media Has Become Mainstream
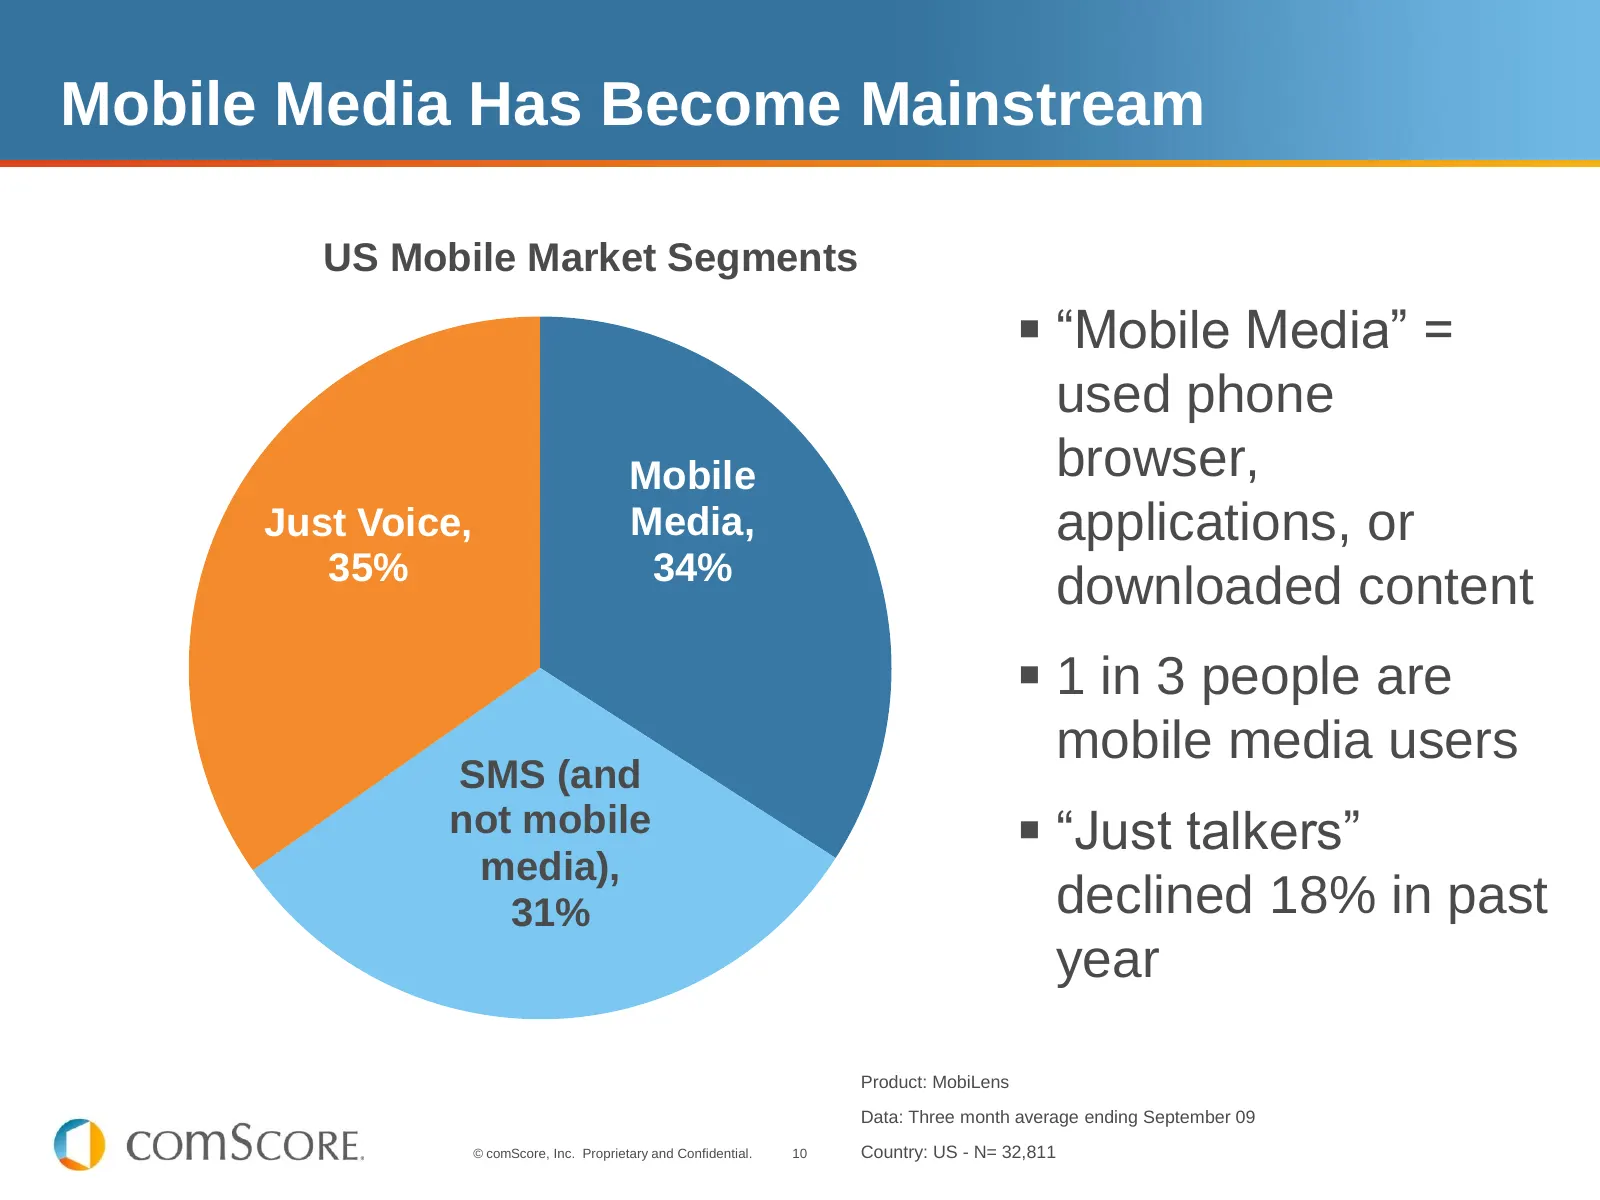
Mobile Media Has Become Mainstream US Mobile Market Segments “Mobile Media” = used phone Mobile browser, Just Voice, Media, applications, or 35% 34% downloaded content 1 in 3 people are mobile media users SMS (and not mobile media), “Just talkers” 31% declined 18% in past year Product: MobiLen
Slide 11: The Average Mobile Media User Is Almost as Likely to Be Male as Female
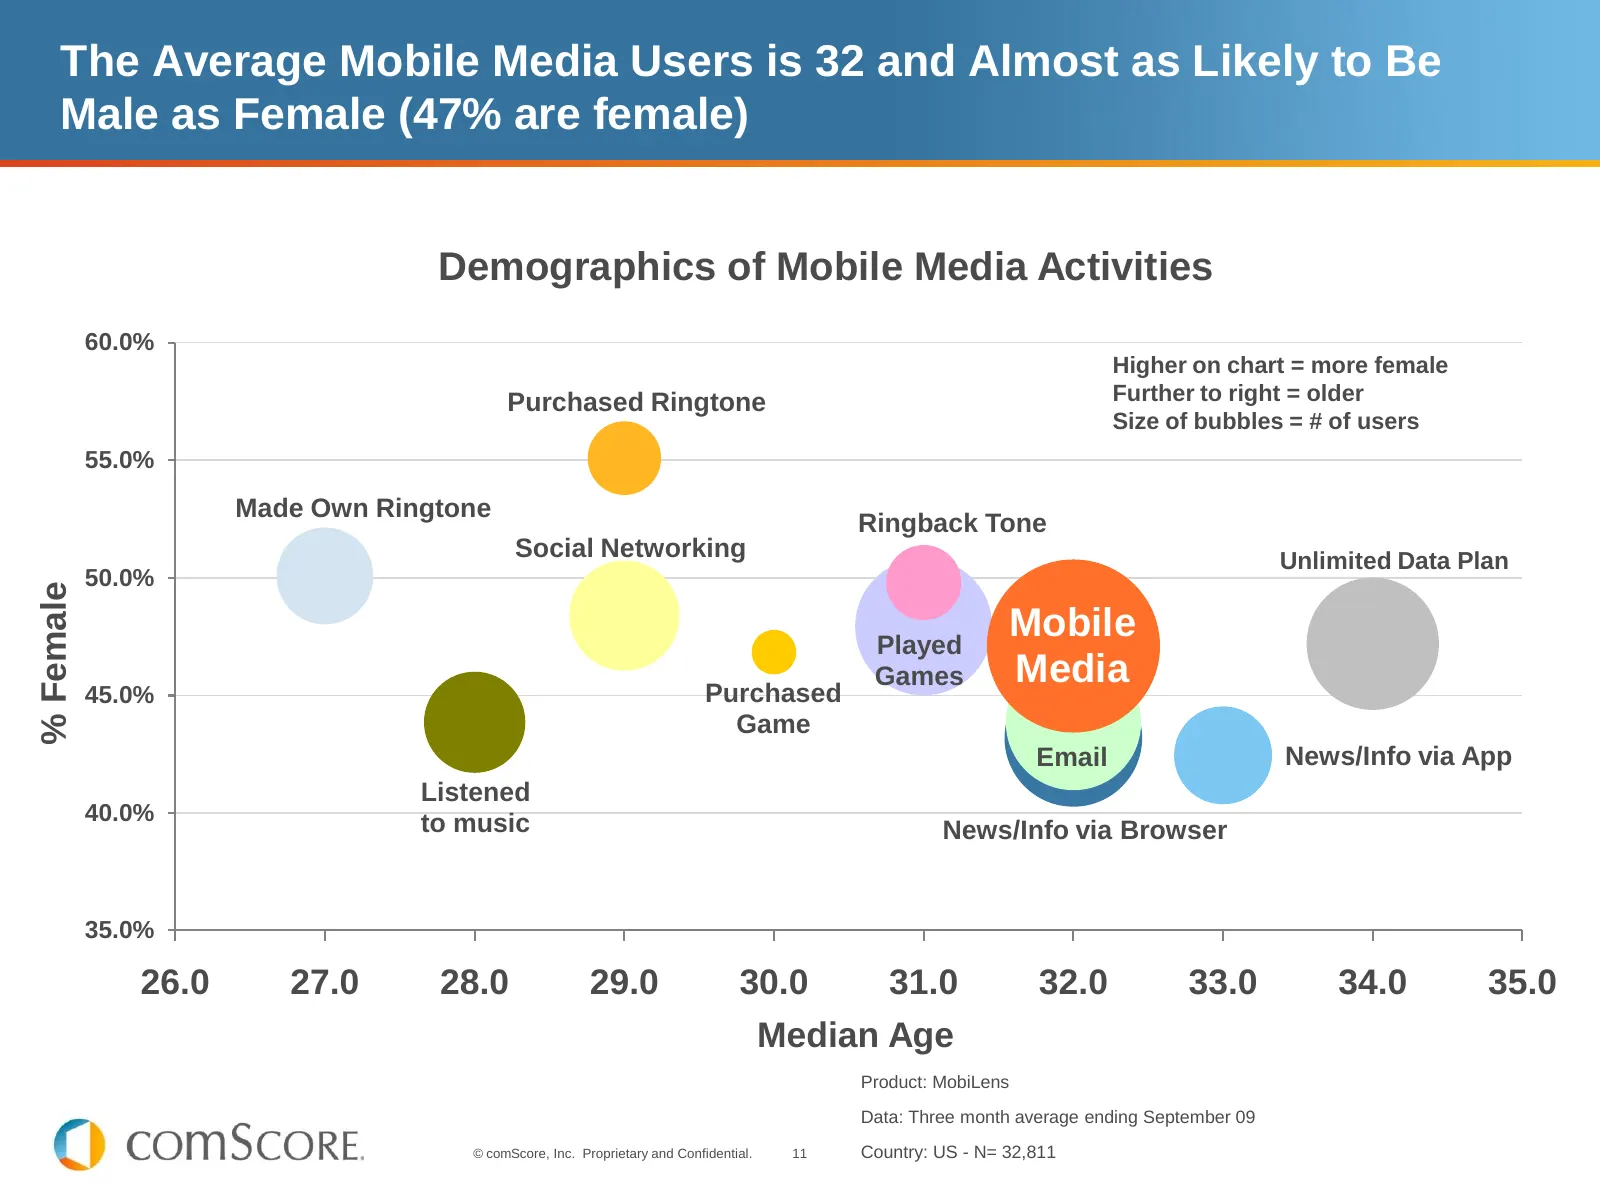
The Average Mobile Media Users is 32 and Almost as Likely to Be Male as Female (47% are female) Demographics of Mobile Media Activities 60.0% Higher on chart = more female Purchased Ringtone Further to right = older Size of bubbles = # of users 55.0% Made Own Ringtone Ringback Tone Social Networking
Slide 12: Mobile Internet Services Continue to Boom
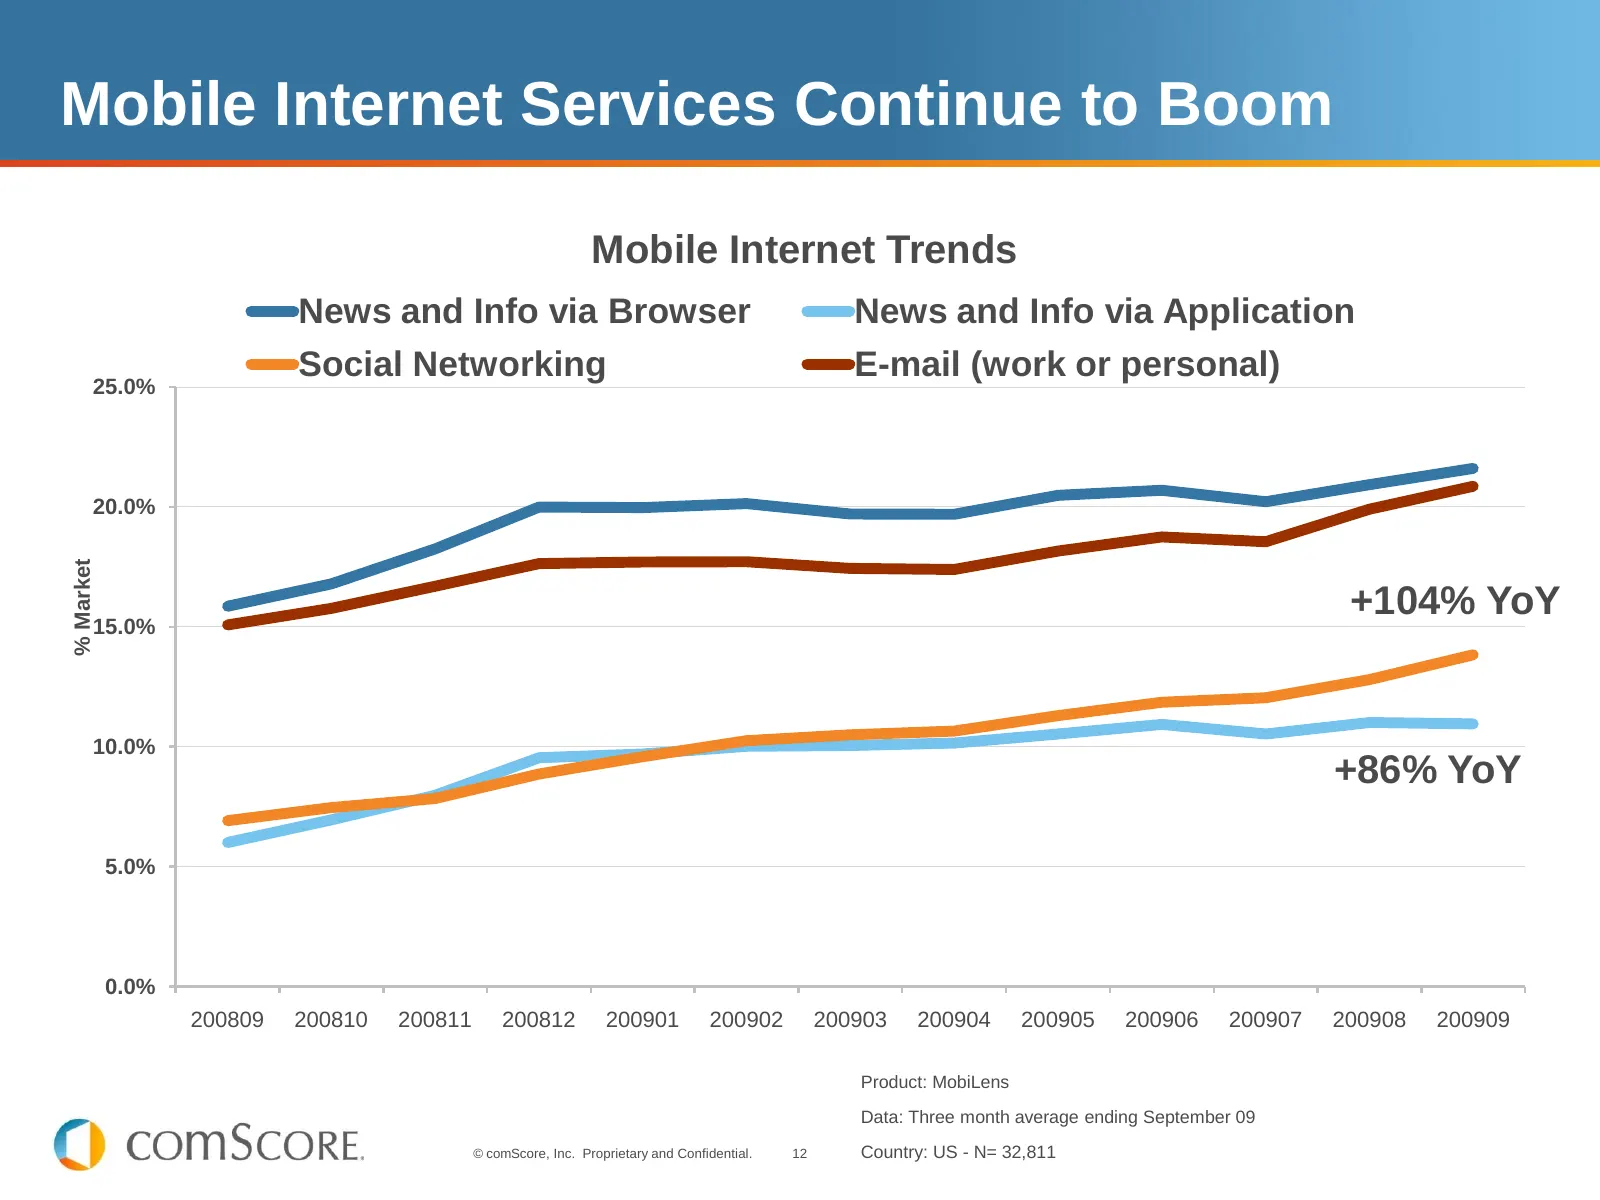
Mobile Internet Services Continue to Boom Mobile Internet Trends News and Info via Browser News and Info via Application Social Networking E-mail (work or personal) 25.0% 20.0% % Market 15.0% +104% YoY 10.0% +86% YoY 5.0% 0.0% 200809 200810 200811 200812 200901 200902 200903 200904 200905 200906 200
Slide 13: Nearly 1 in 5 Using Mobile Services Every Day
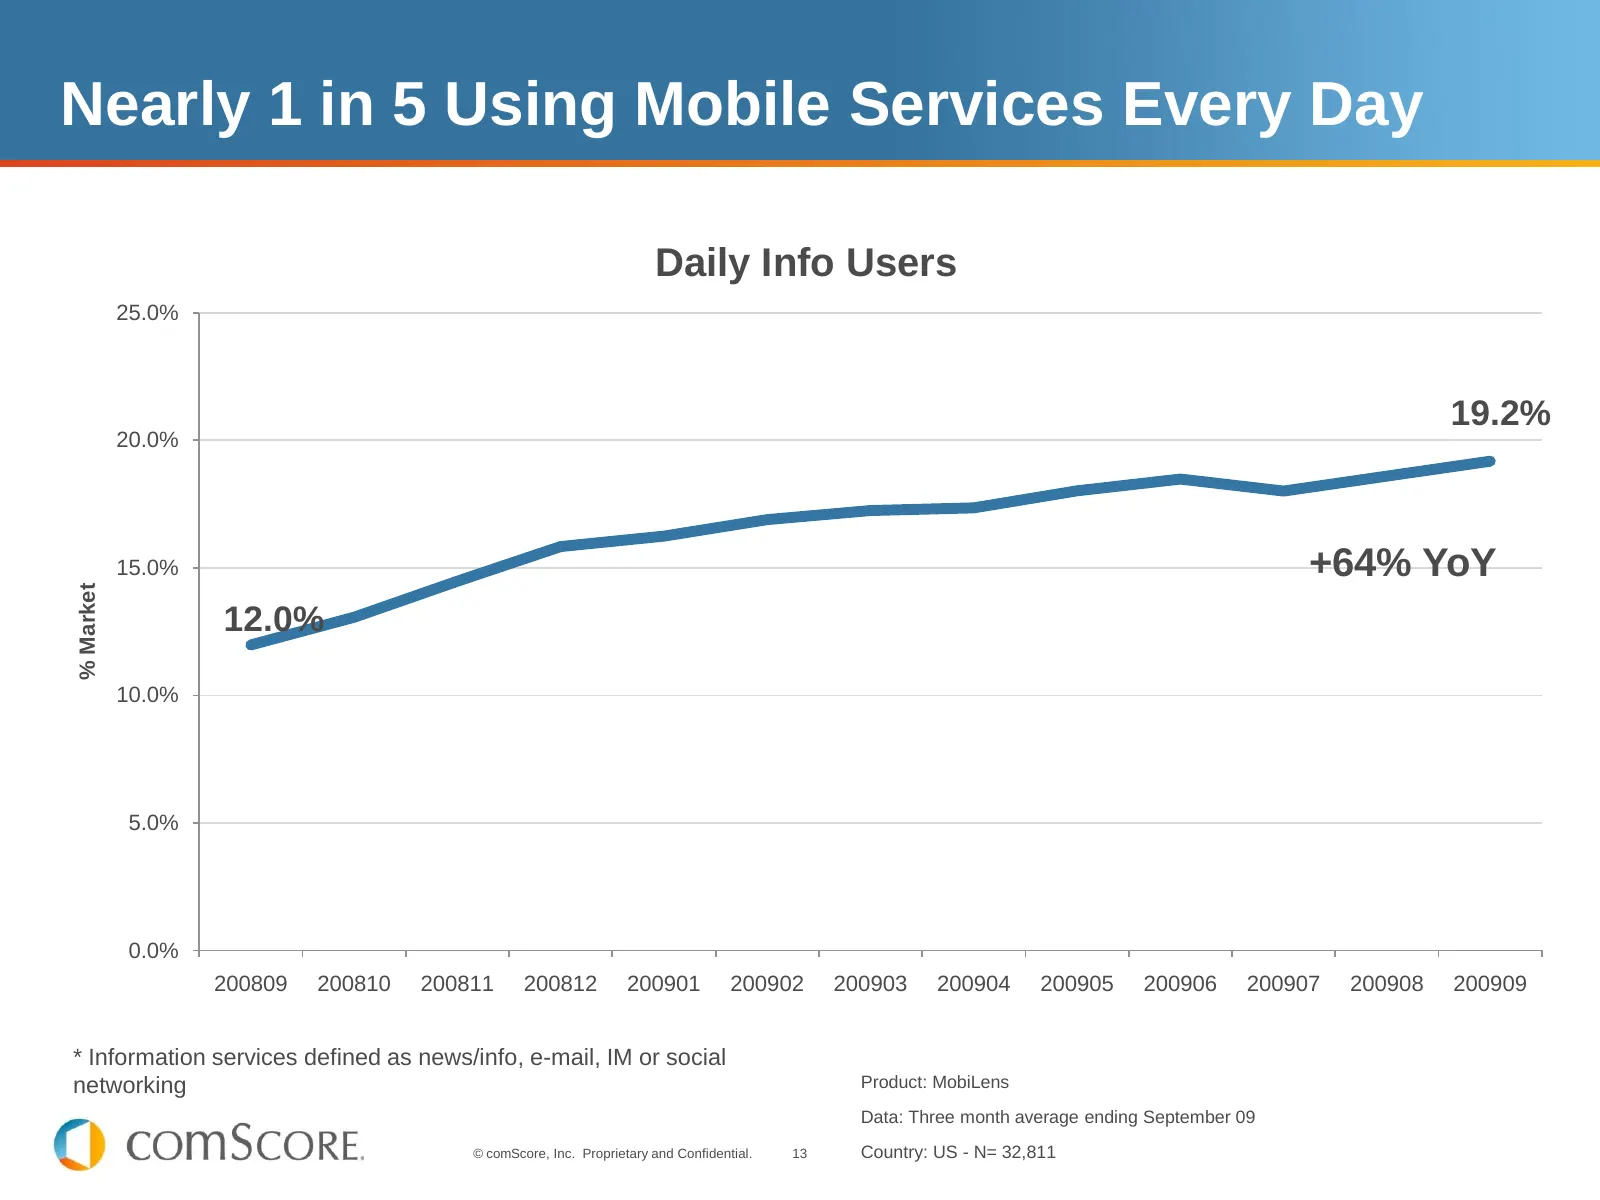
Nearly 1 in 5 Using Mobile Services Every Day Daily Info Users 25.0% 19.2% 20.0% 15.0% +64% YoY % Market 12.0% 10.0% 5.0% 0.0% 200809 200810 200811 200812 200901 200902 200903 200904 200905 200906 200907 200908 200909 * Information services defined as news/info, e-mail, IM or social networking Produ
Slide 14: Smartphone owners are 2 to 5 times more likely to use mobile media
Smartphone owners are 2 to 5 times more likely to use varying types of mobile media than feature phone owners. But there is still a large—often larger—audience of feature phone owners. © comScore, Inc. Proprietary and Confidential. 14
Slide 15: 69MM Mobile News & Info Users
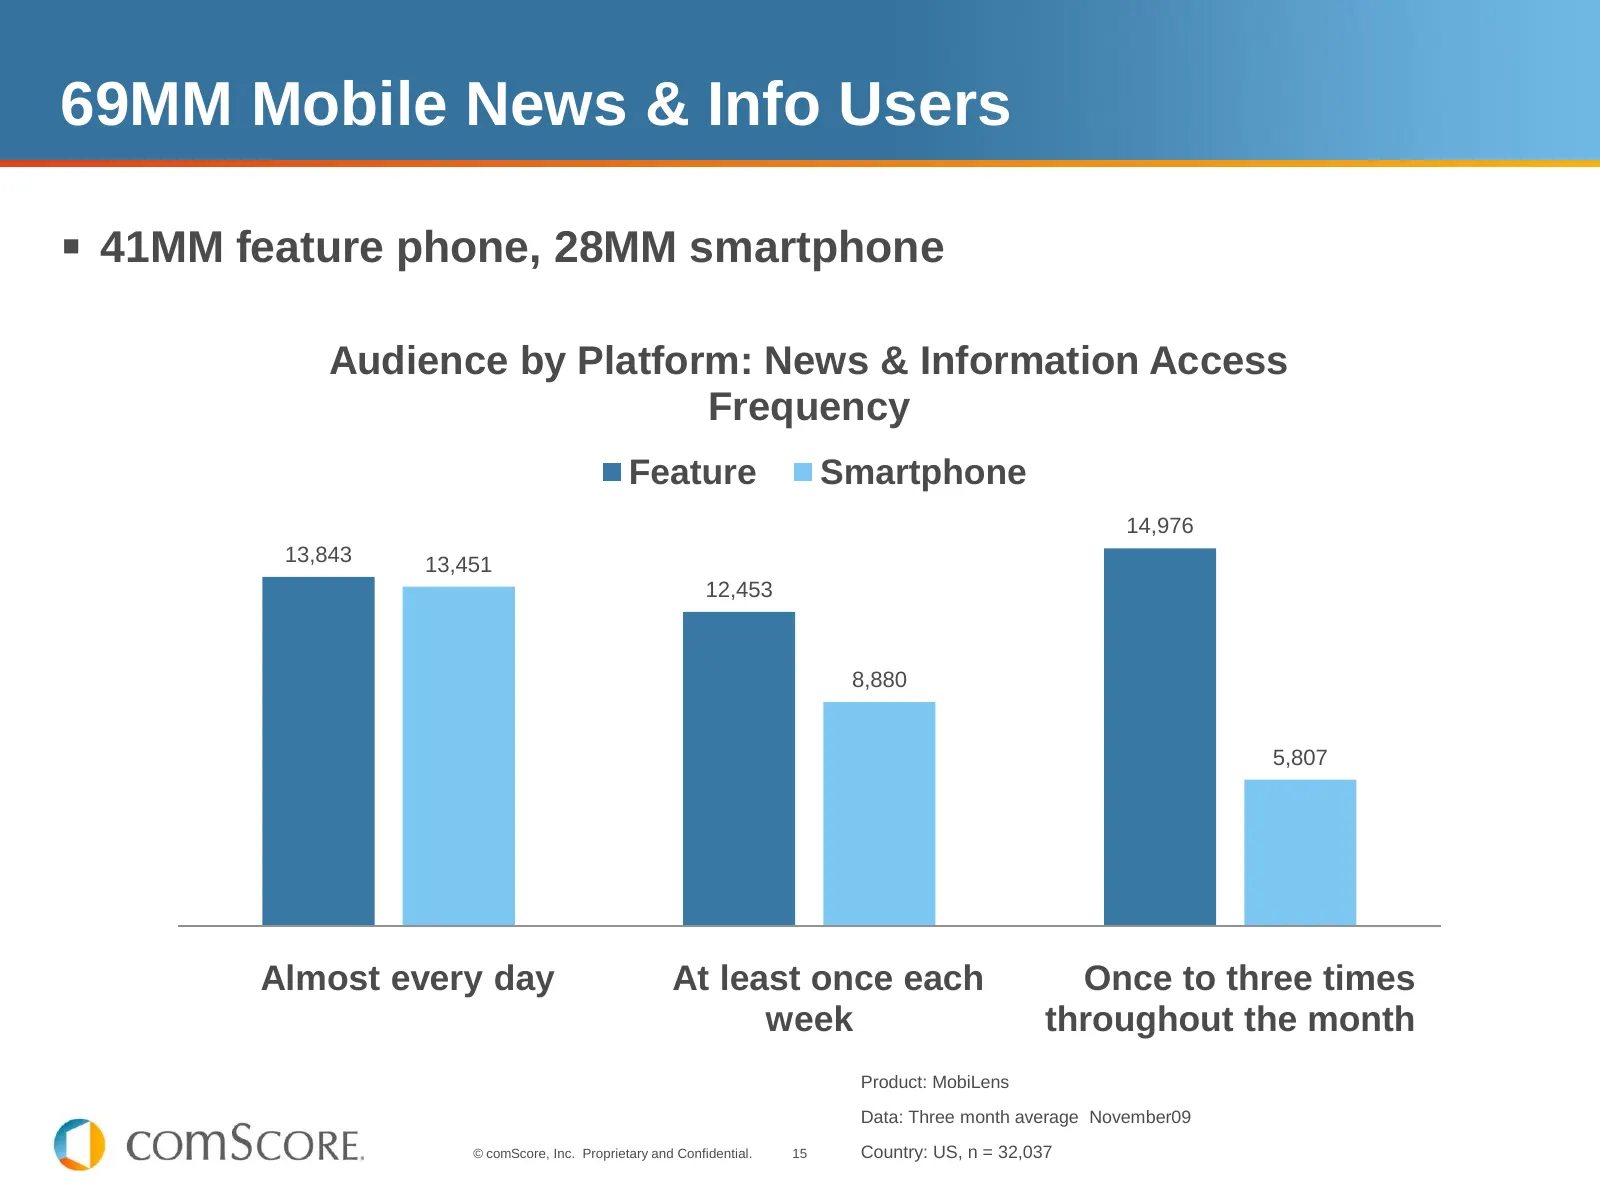
69MM Mobile News & Info Users 41MM feature phone, 28MM smartphone Audience by Platform: News & Information Access Frequency Feature Smartphone 14,976 13,843 13,451 12,453 8,880 5,807 Almost every day At least once each Once to three times week throughout the month Product: MobiLens Data: Three mon
Slide 16: News Penetration >3X with Smartphones
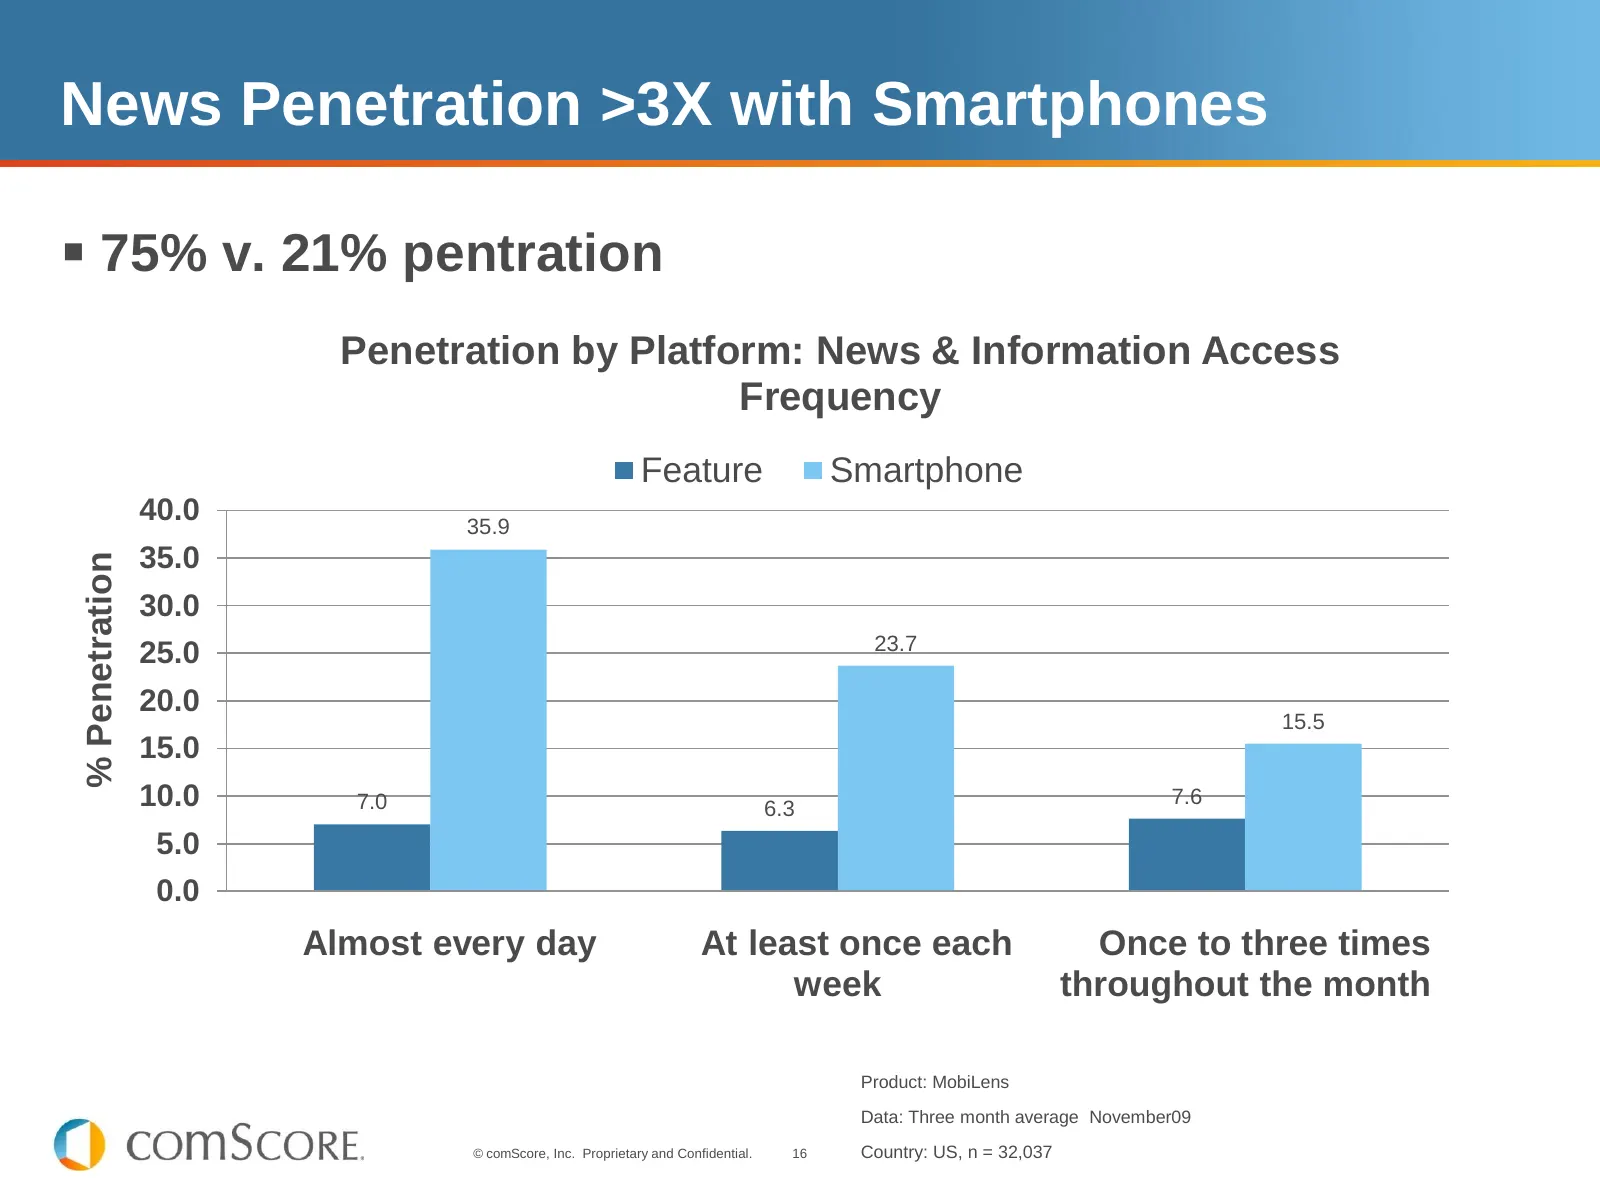
News Penetration >3X with Smartphones 75% v. 21% pentration Penetration by Platform: News & Information Access Frequency Feature Smartphone 40.0 35.9 35.0 % Penetration 30.0 23.7 25.0 20.0 15.5 15.0 10.0 7.0 6.3 7.6 5.0 0.0 Almost every day At least once each Once to three times week throughout th
Slide 17: Shifting device form factors and capabilities are stoking mobile media usage
Shifting device form factors and capabilities are stoking mobile media usage, and not just in smartphone segment. © comScore, Inc. Proprietary and Confidential. 17
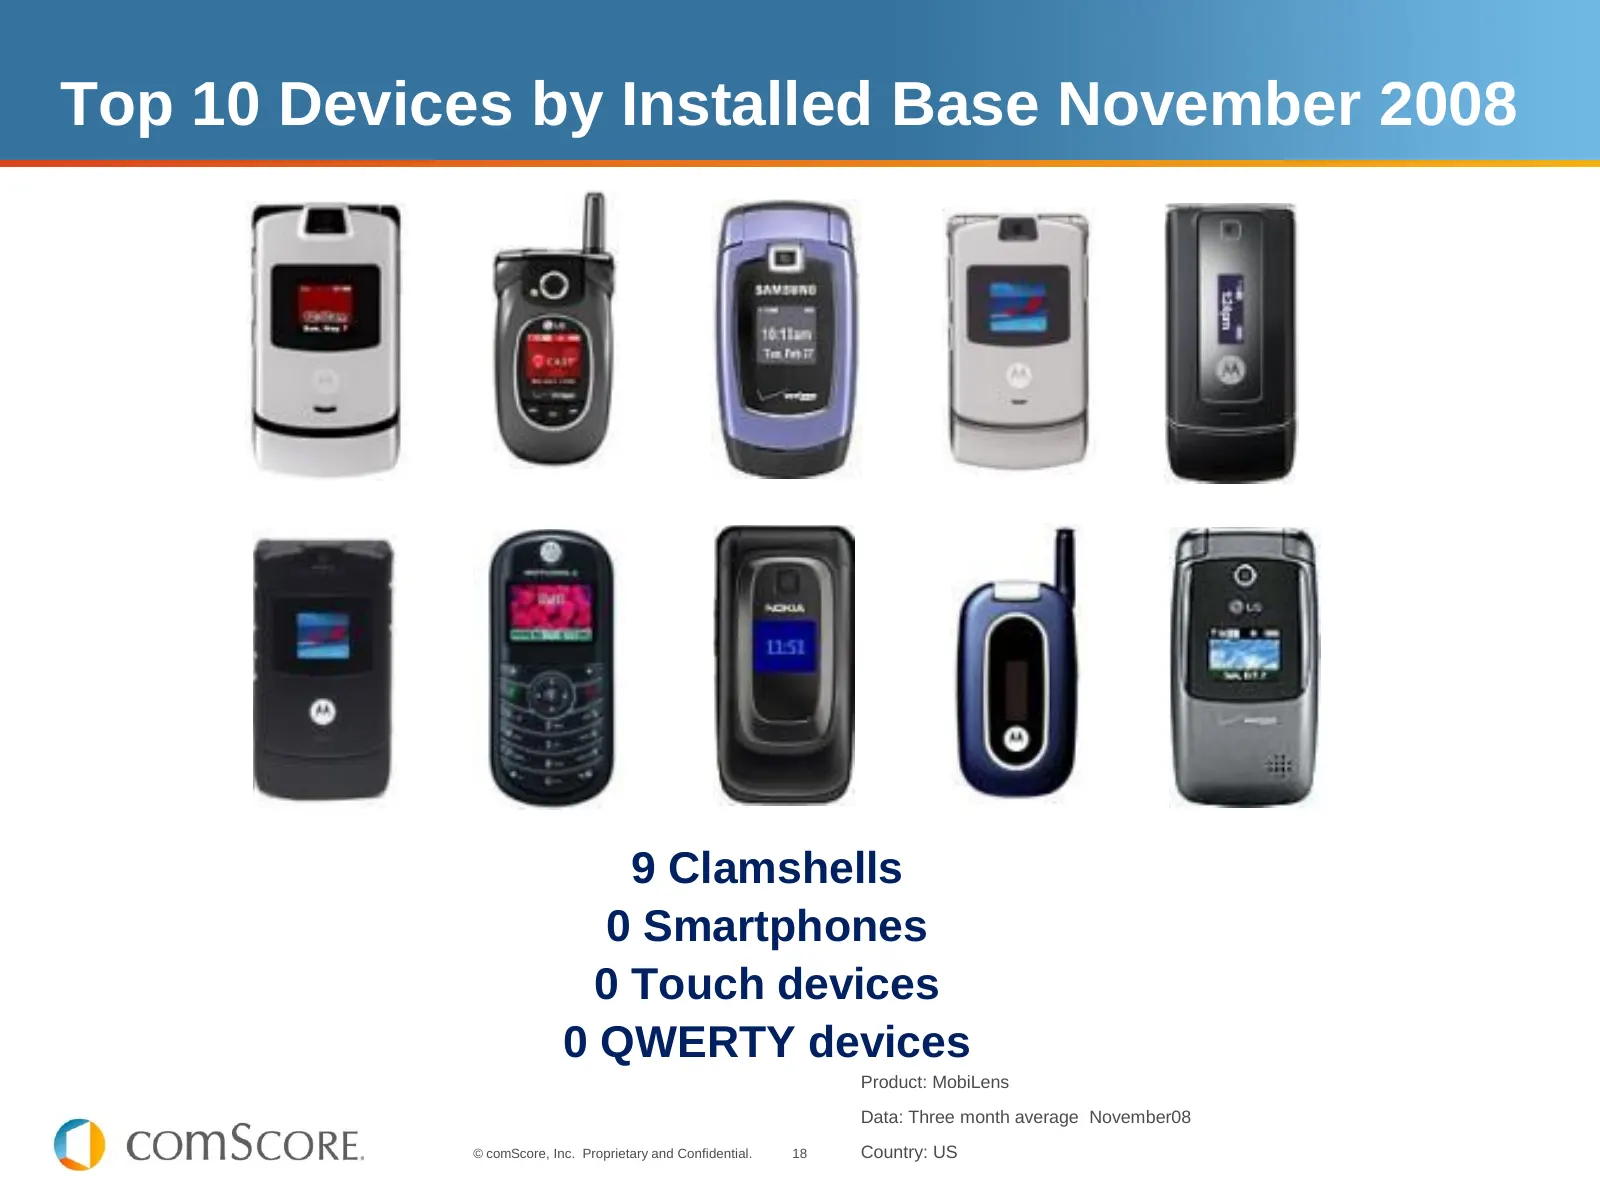
Slide 18: Top Devices by Installed Base November 2008
Top 10 Devices by Installed Base November 2008 9 Clamshells 0 Smartphones 0 Touch devices 0 QWERTY devices Product: MobiLens Data: Three month average November08 © comScore, Inc. Proprietary and Confidential. 18 Country: US
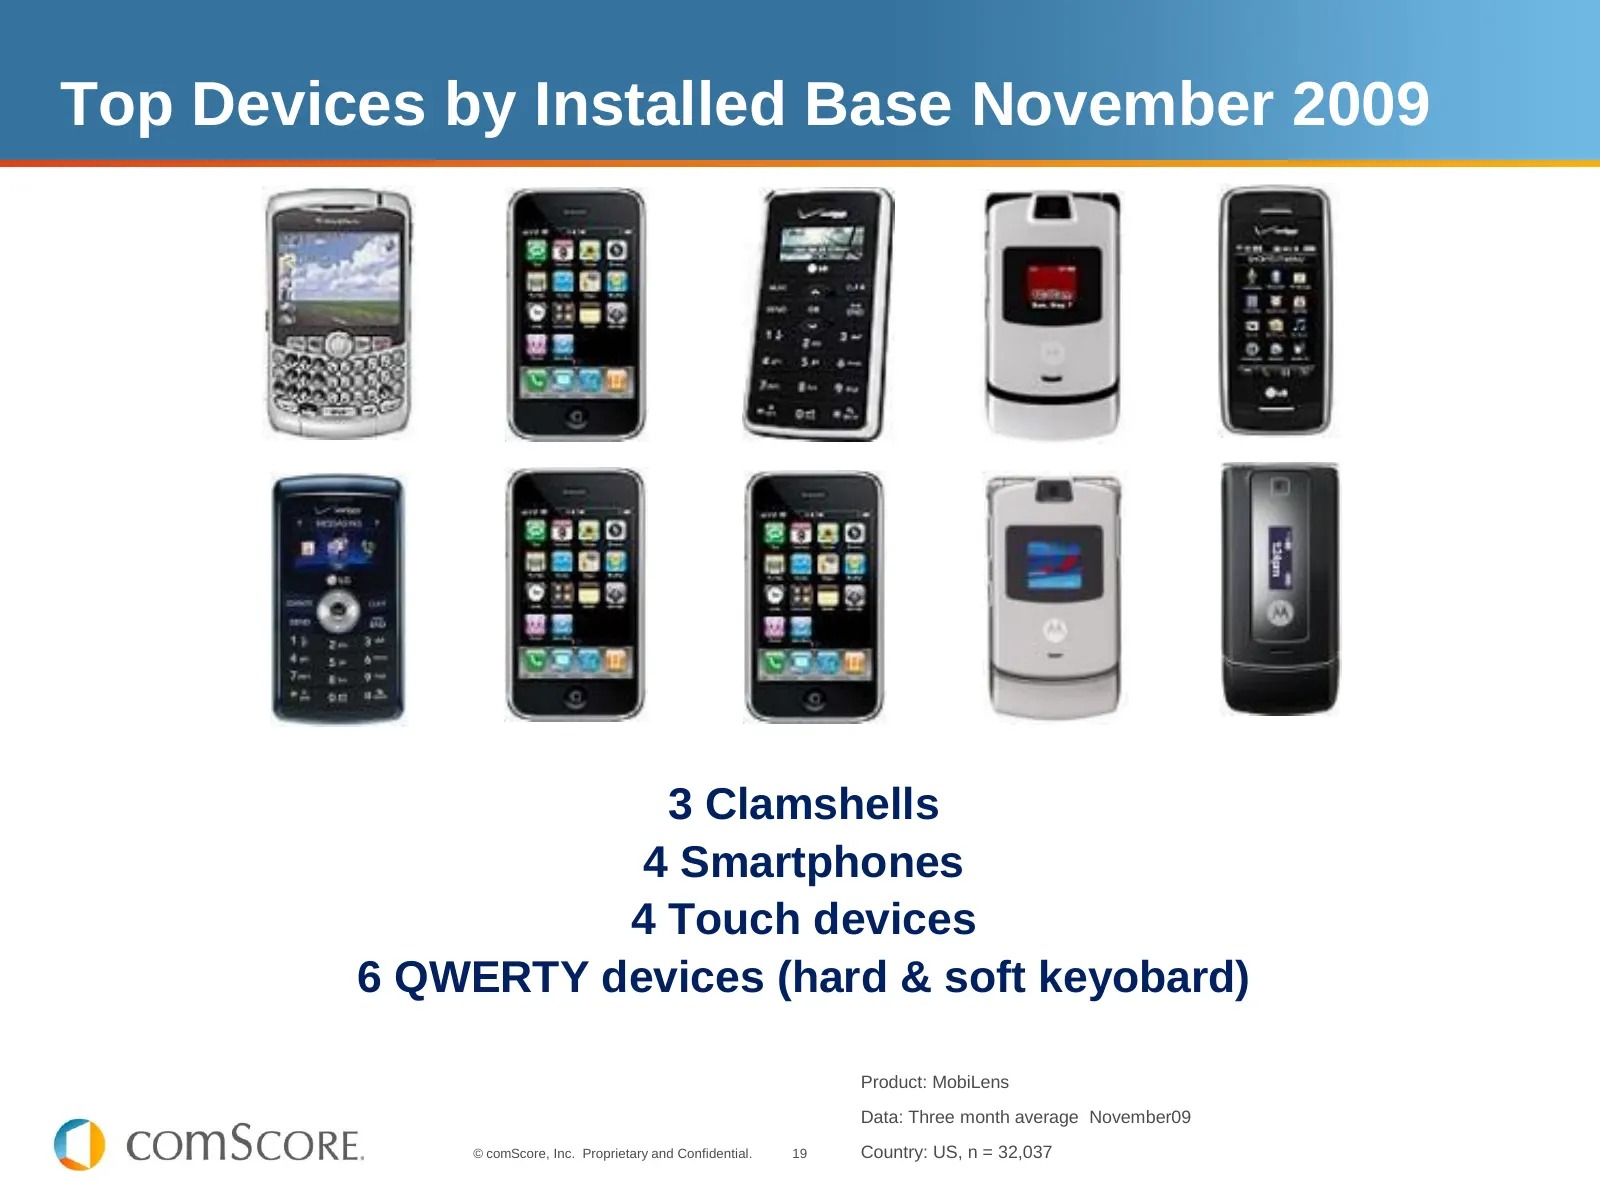
Slide 19: Top Devices by Installed Base November 2009
Top Devices by Installed Base November 2009 3 Clamshells 4 Smartphones 4 Touch devices 6 QWERTY devices (hard & soft keyobard) Product: MobiLens Data: Three month average November09 © comScore, Inc. Proprietary and Confidential. 19 Country: US, n = 32,037
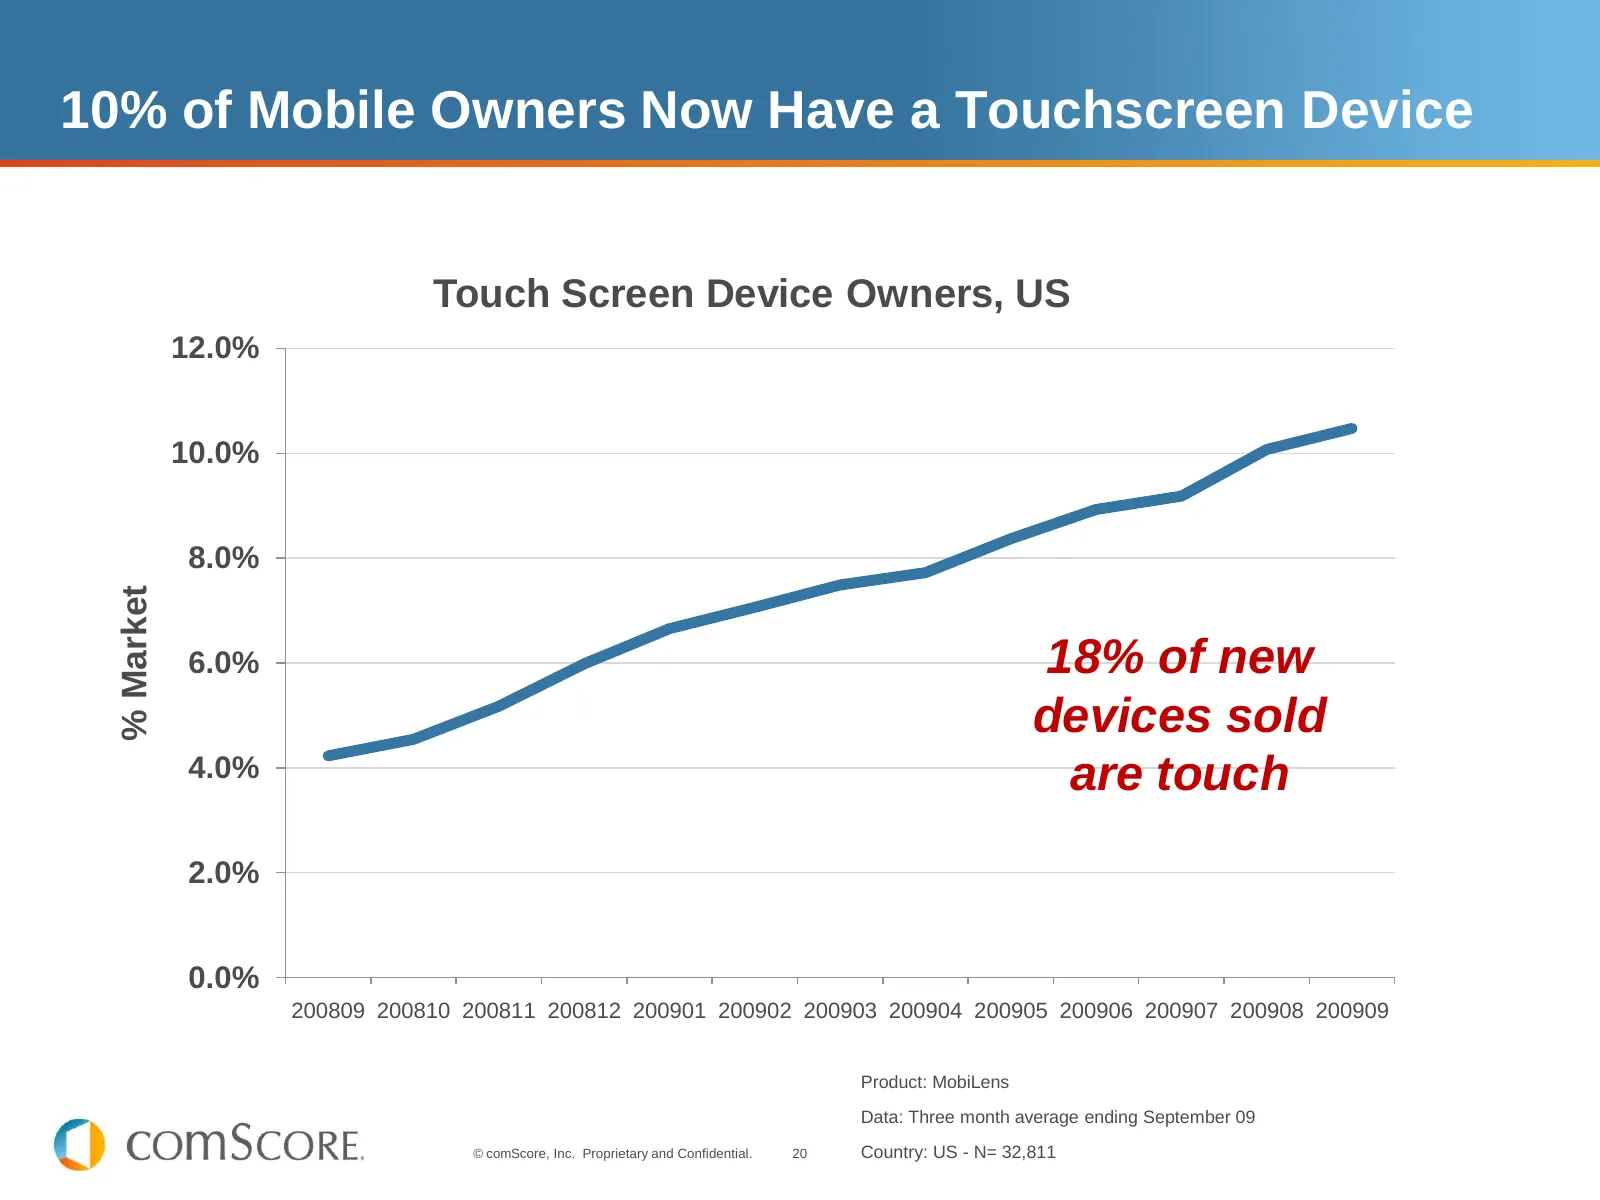
Slide 20: 10% of Mobile Owners Now Have a Touchscreen Device
10% of Mobile Owners Now Have a Touchscreen Device Touch Screen Device Owners, US 12.0% 10.0% 8.0% % Market 6.0% 18% of new devices sold 4.0% are touch 2.0% 0.0% 200809 200810 200811 200812 200901 200902 200903 200904 200905 200906 200907 200908 200909 Product: MobiLens Data: Three month average end
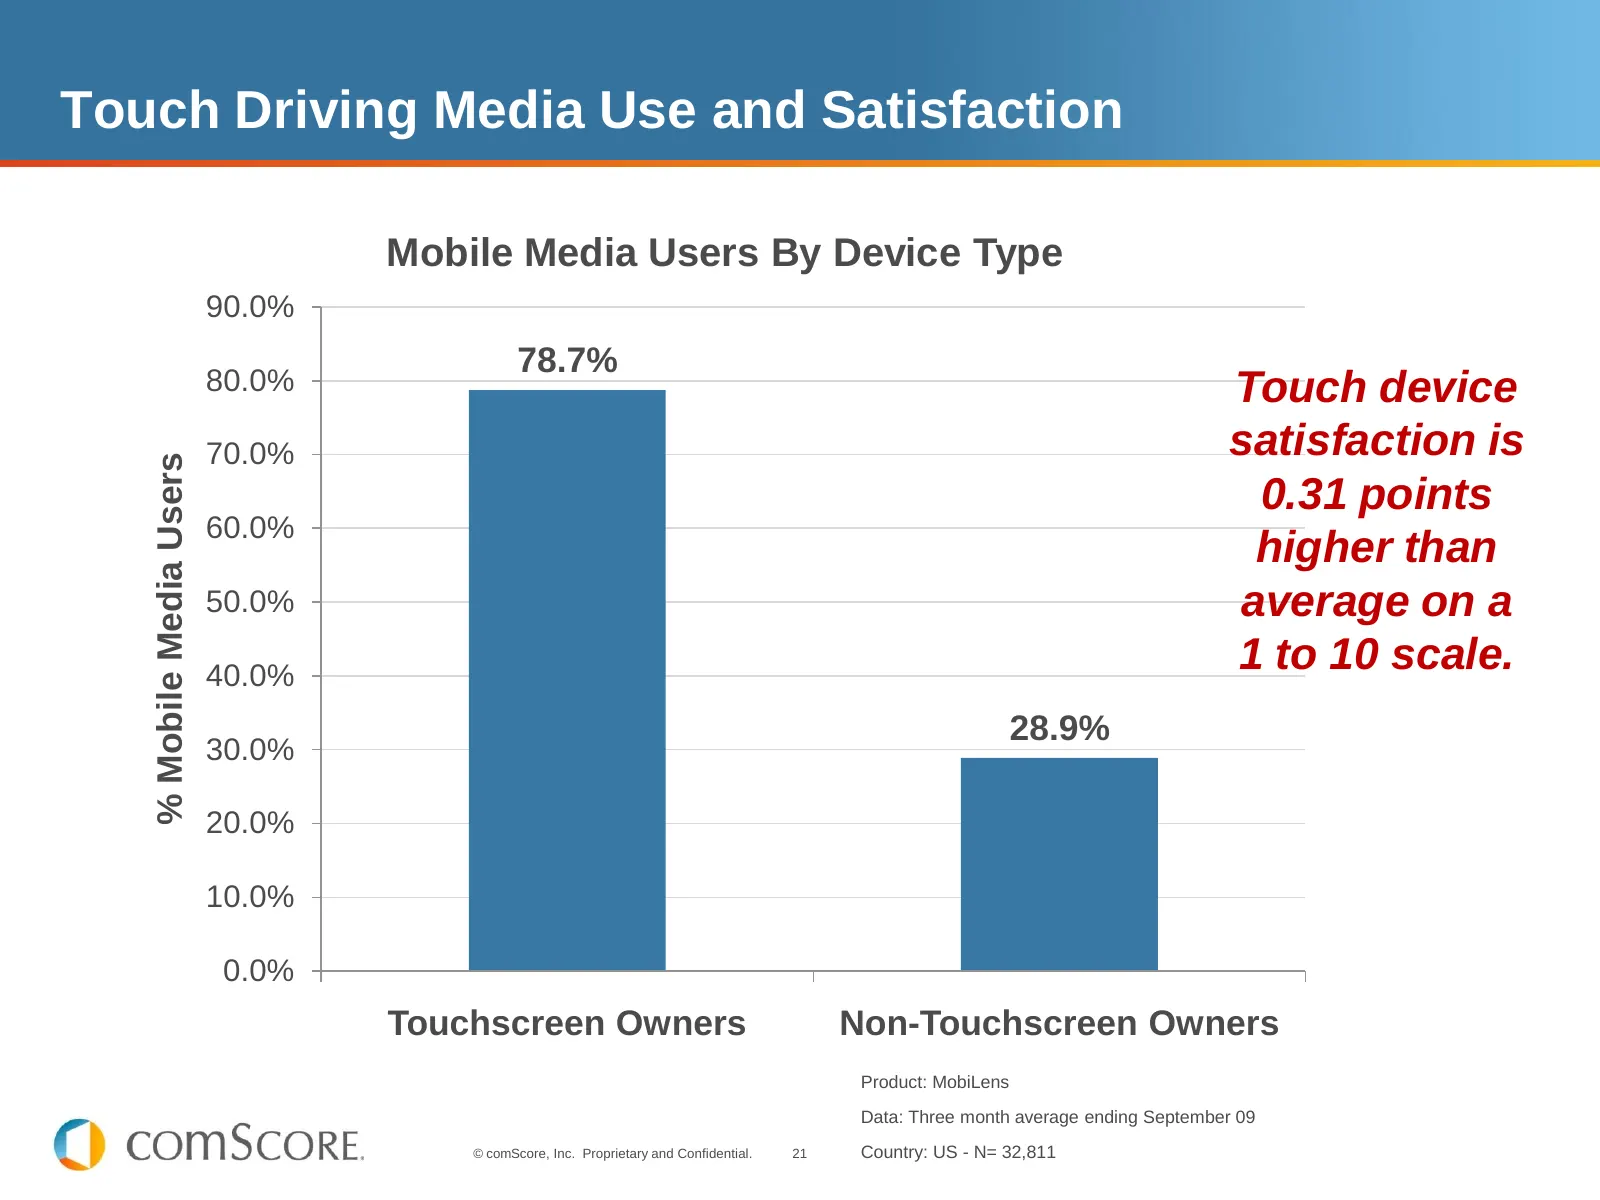
Slide 21: Touch Driving Media Use and Satisfaction
Touch Driving Media Use and Satisfaction Mobile Media Users By Device Type 90.0% 78.7% 80.0% Touch device 70.0% satisfaction is % Mobile Media Users 0.31 points 60.0% higher than 50.0% average on a 40.0% 1 to 10 scale. 28.9% 30.0% 20.0% 10.0% 0.0% Touchscreen Owners Non-Touchscreen Owners Product: M
Slide 22: Touch Moves Apps—and Not Just Smartphones
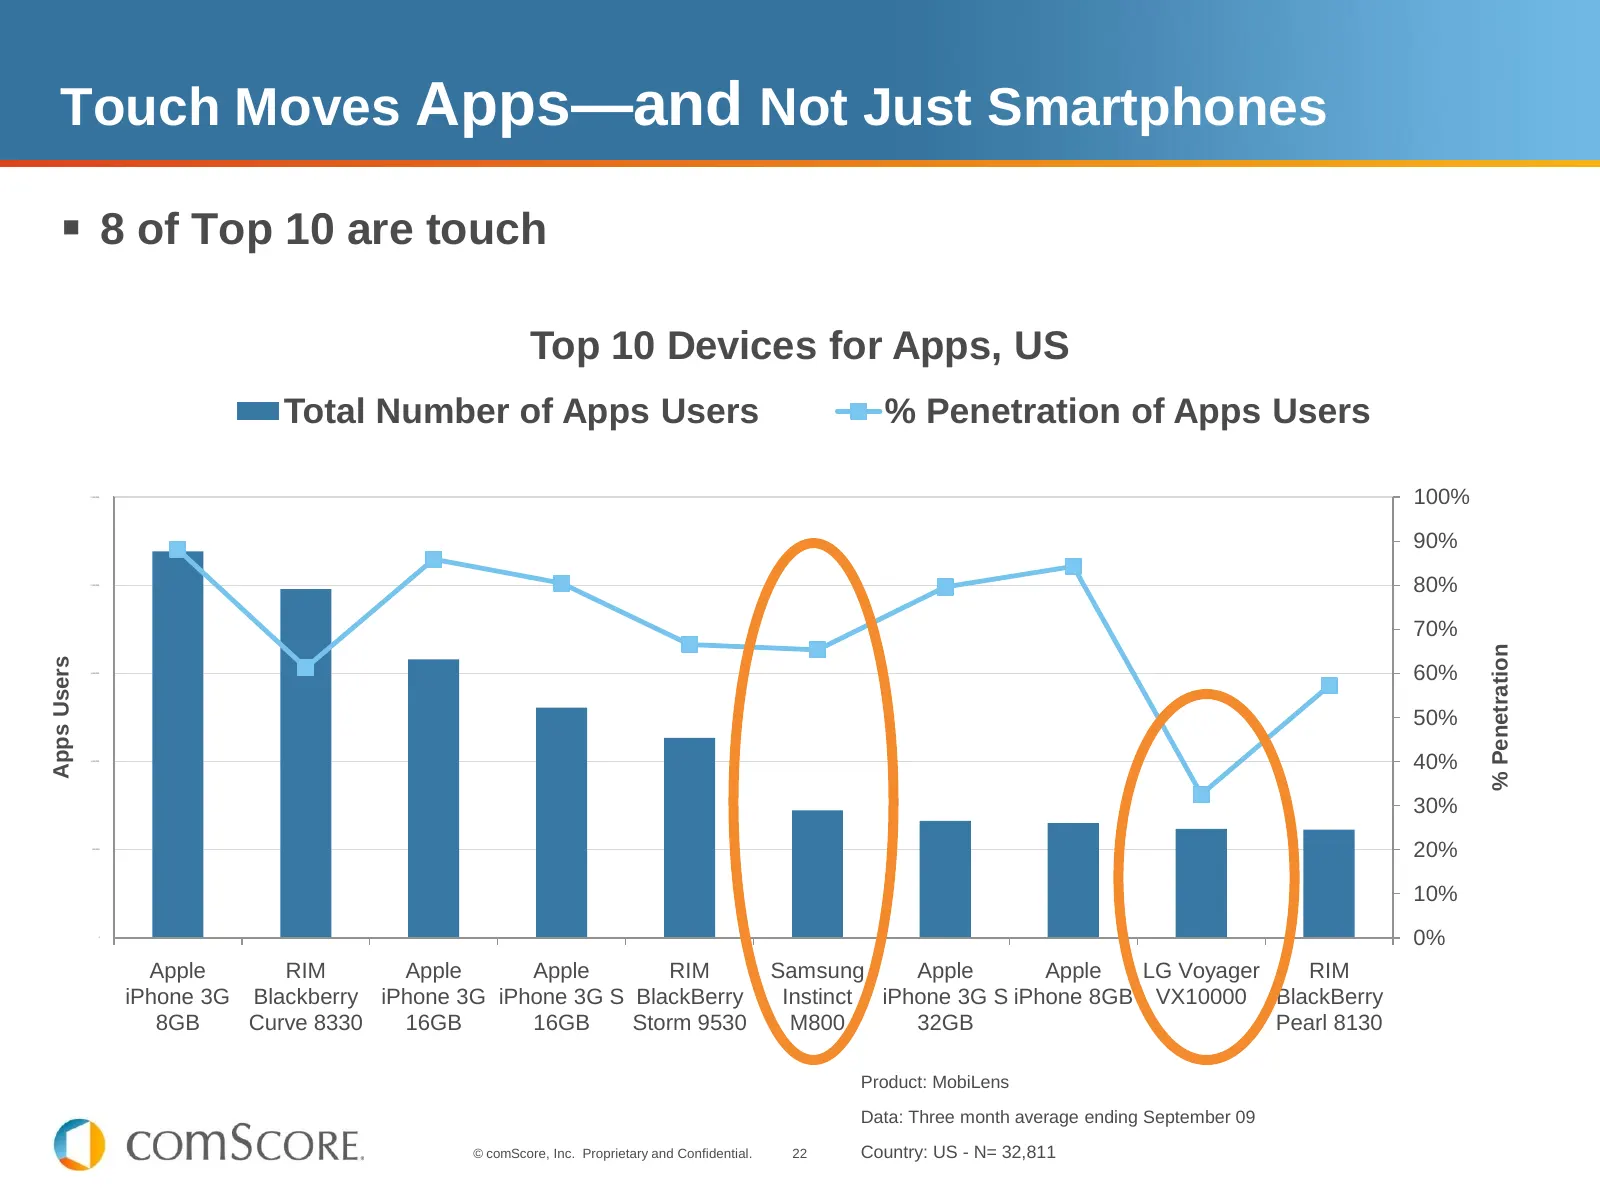
Touch Moves Apps—and Not Just Smartphones 8 of Top 10 are touch Top 10 Devices for Apps, US Total Number of Apps Users % Penetration of Apps Users 2,500,000 100% 90% 2,000,000 80% 70% % Penetration Apps Users 1,500,000 60% 50% 1,000,000 40% 30% 500,000 20% 10% 0 0% Apple RIM Apple Apple RIM Samsun
Slide 23: But Don't Necessarily Abandon Hard QWERTY
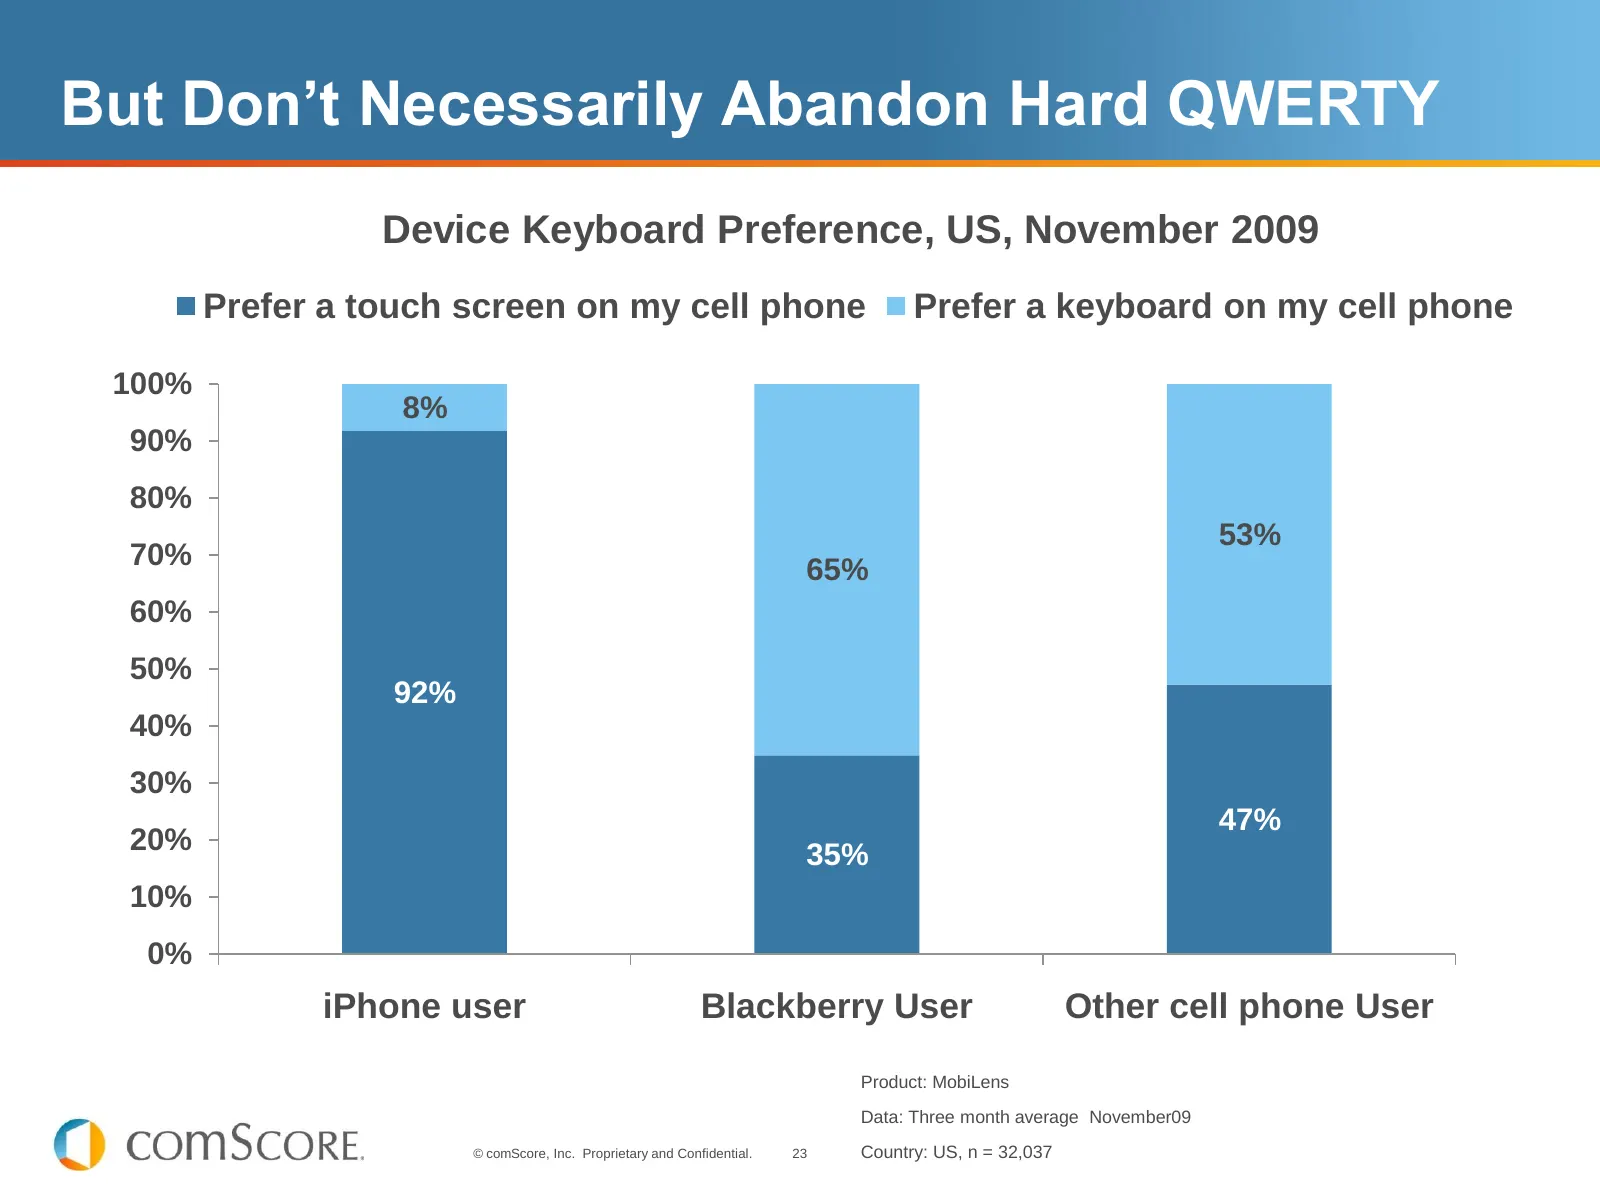
But Don’t Necessarily Abandon Hard QWERTY Device Keyboard Preference, US, November 2009 Prefer a touch screen on my cell phone Prefer a keyboard on my cell phone 100% 8% 90% 80% 53% 70% 65% 60% 50% 92% 40% 30% 47% 20% 35% 10% 0% iPhone user Blackberry User Other cell phone User Product: MobiLens Dat
Slide 24: Media usage patterns highlight emerging opportunities and business model trends
Media usage patterns highlight emerging opportunities and business model trends. © comScore, Inc. Proprietary and Confidential. 24
Slide 25: Games, Communication, Location Leading Apps
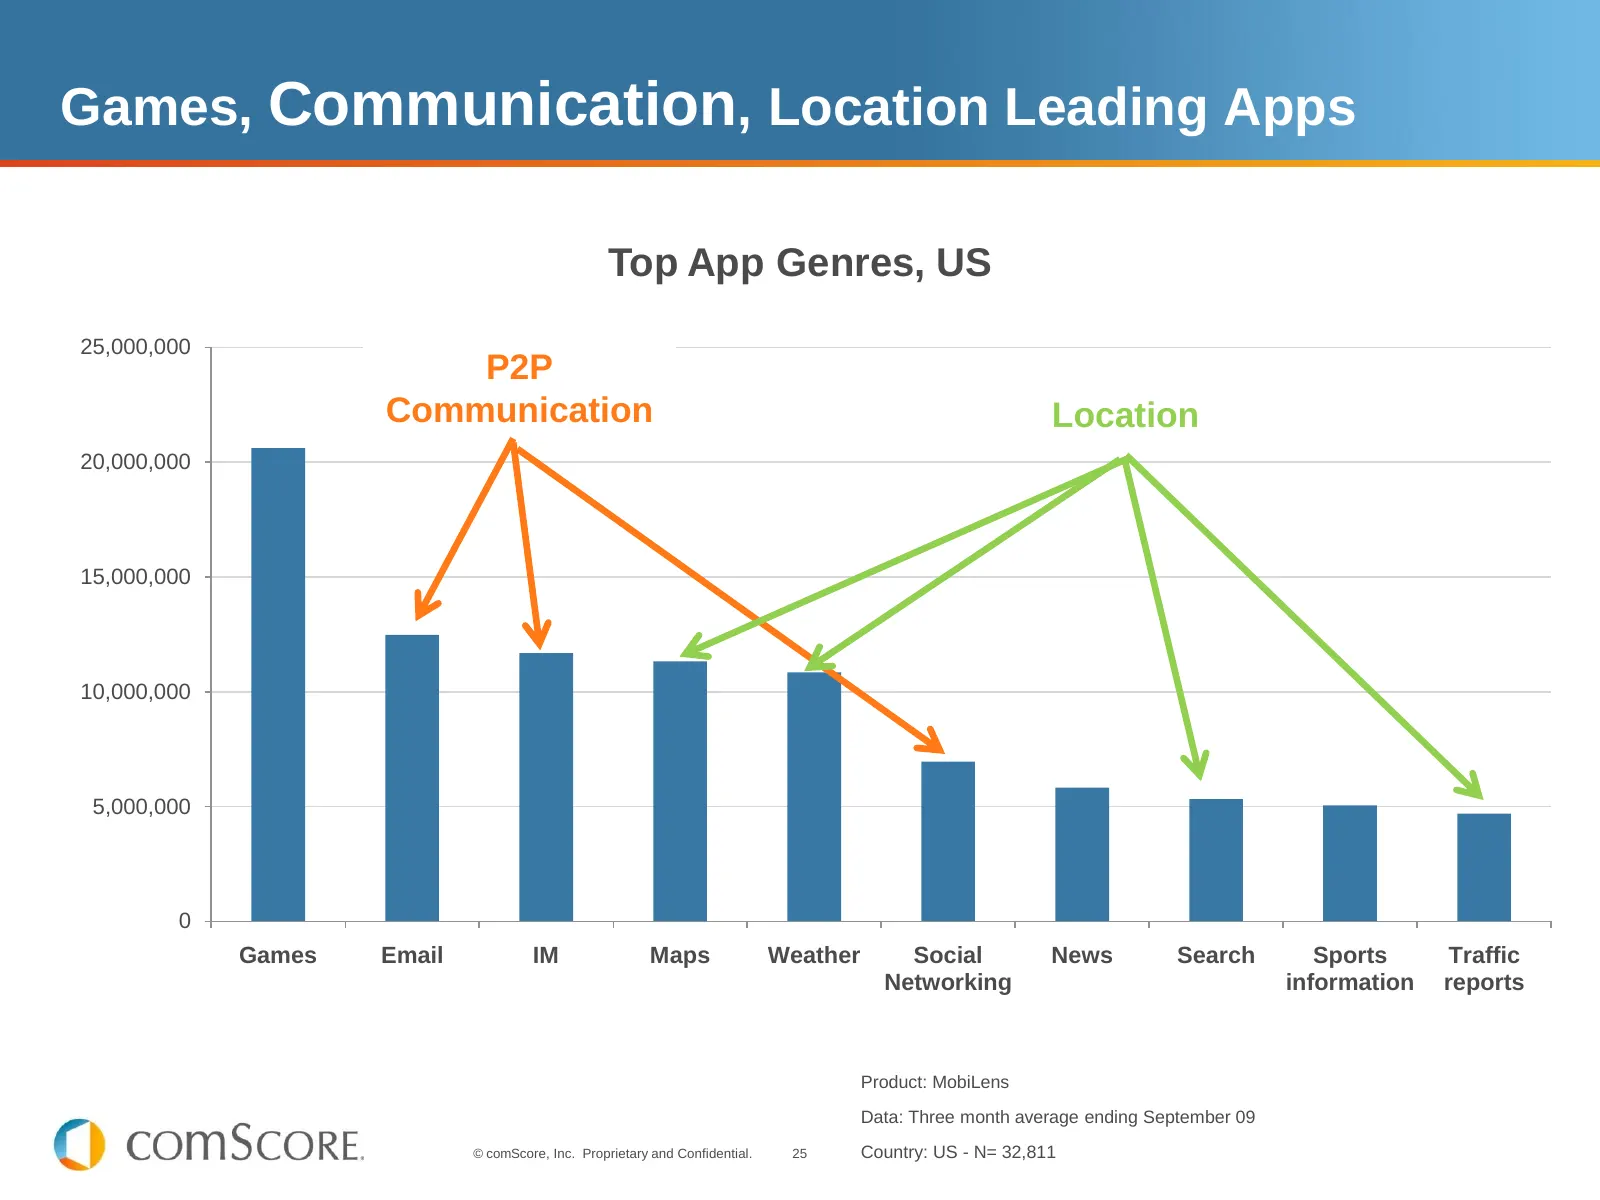
Games, Communication, Location Leading Apps Top App Genres, US 25,000,000 P2P Communication Location 20,000,000 15,000,000 10,000,000 5,000,000 0 Games Email IM Maps Weather Social News Search Sports Traffic Networking information reports Product: MobiLens Data: Three month average ending September
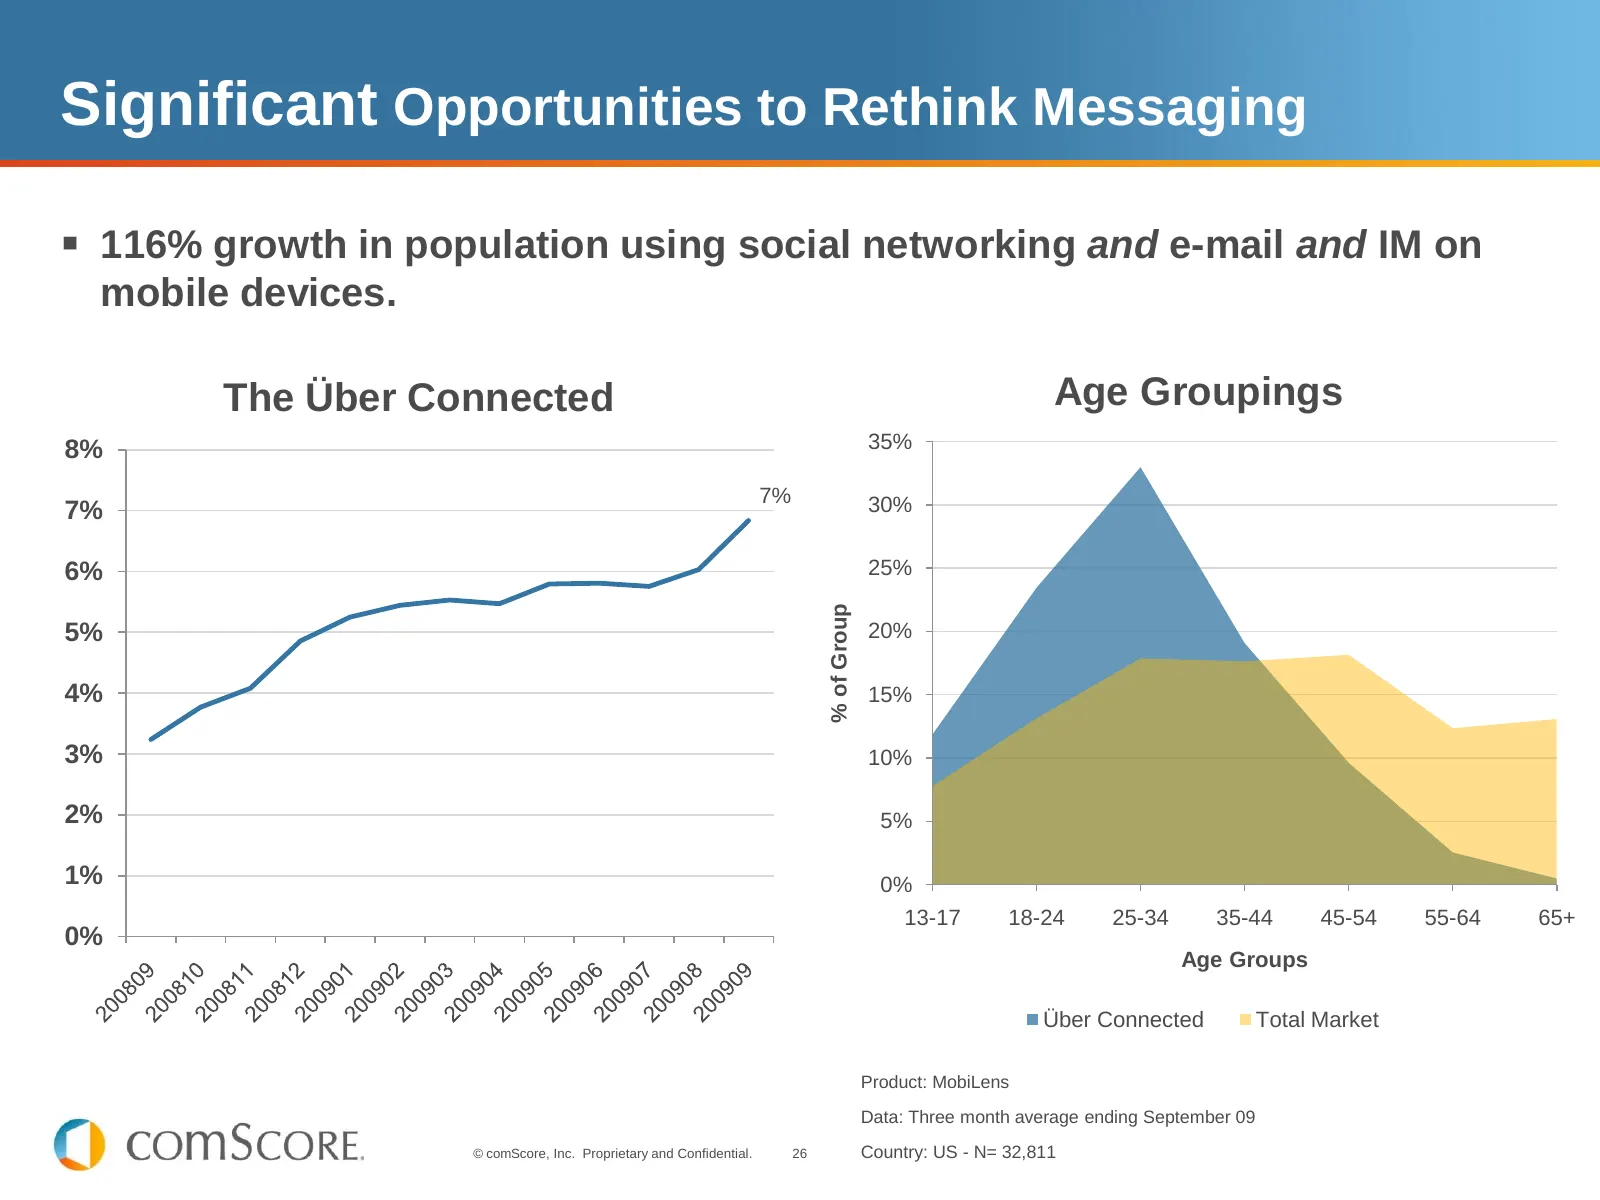
Slide 26: Significant Opportunities to Rethink Messaging
Significant Opportunities to Rethink Messaging 116% growth in population using social networking and e-mail and IM on mobile devices. The Über Connected Age Groupings 8% 35% 7% 30% 7% 6% 25% % of Group 5% 20% 4% 15% 3% 10% 2% 5% 1% 0% 13-17 18-24 25-34 35-44 45-54 55-64 65+ 0% Age Groups Über Conn
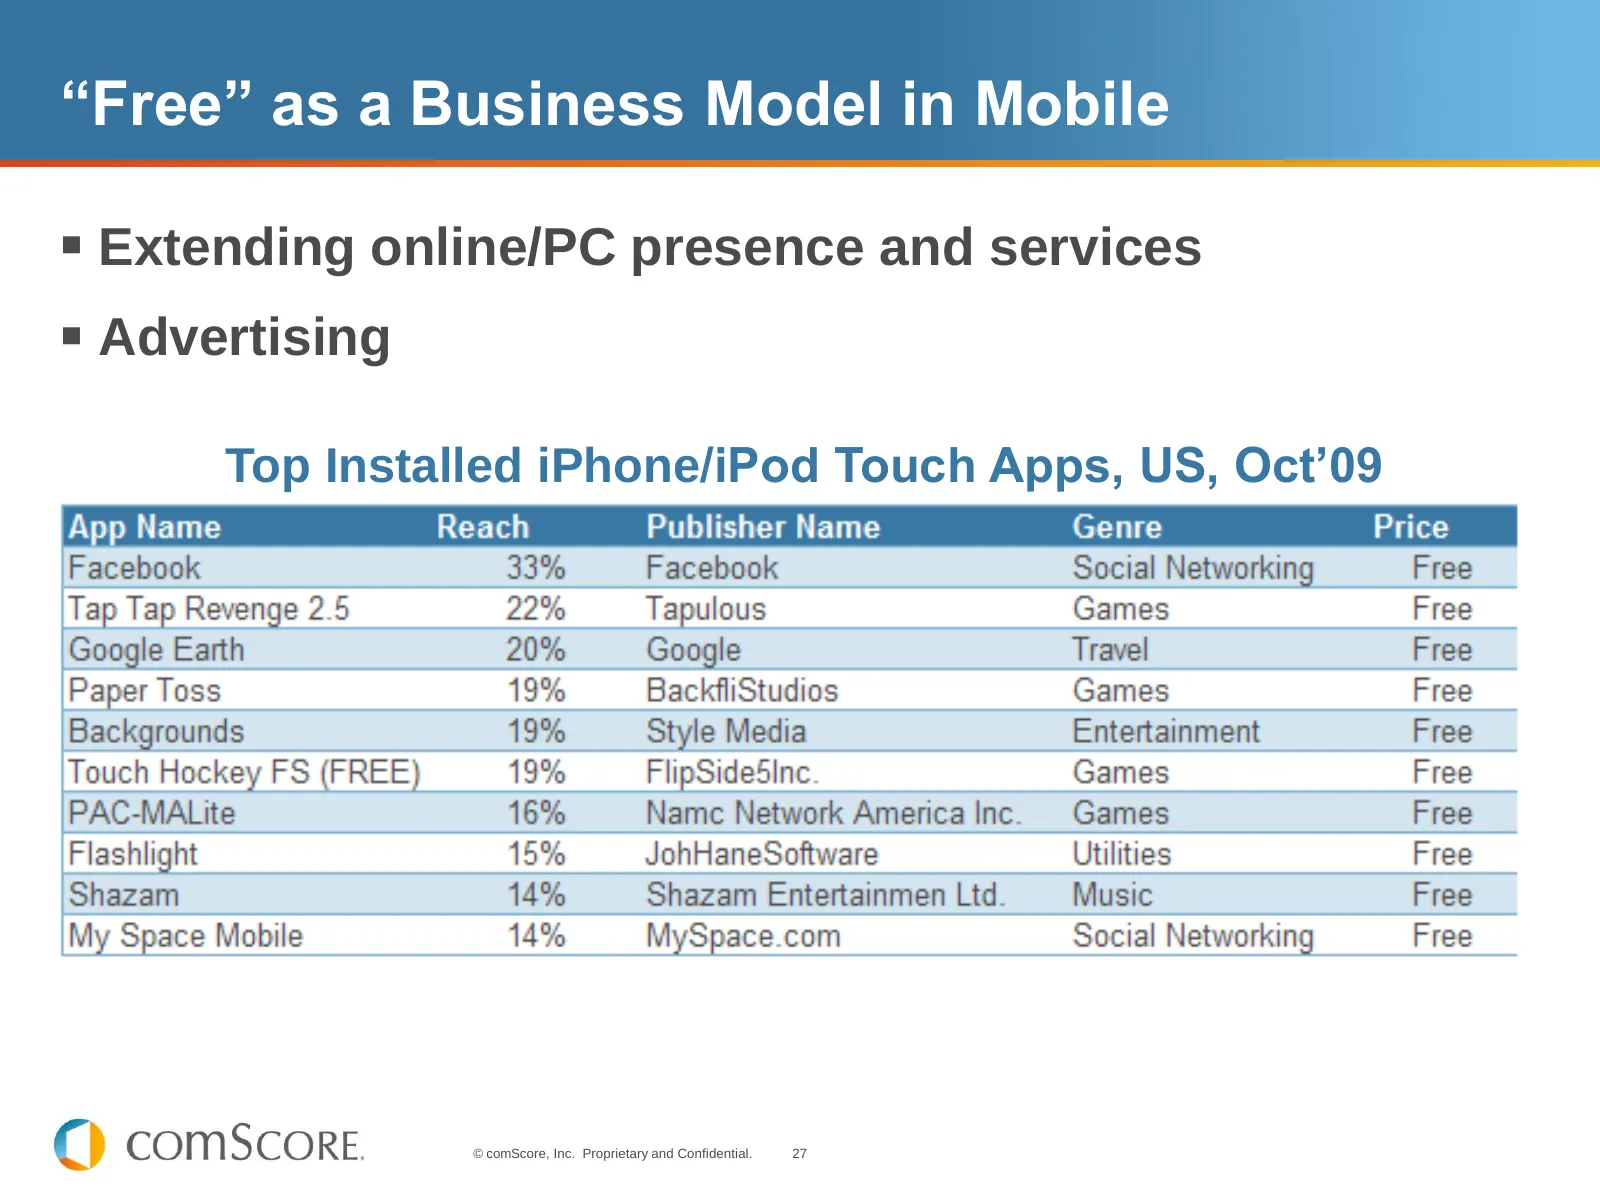
Slide 27: "Free" as a Business Model in Mobile
“Free” as a Business Model in Mobile Extending online/PC presence and services Advertising Top Installed iPhone/iPod Touch Apps, US, Oct’09 © comScore, Inc. Proprietary and Confidential. 27
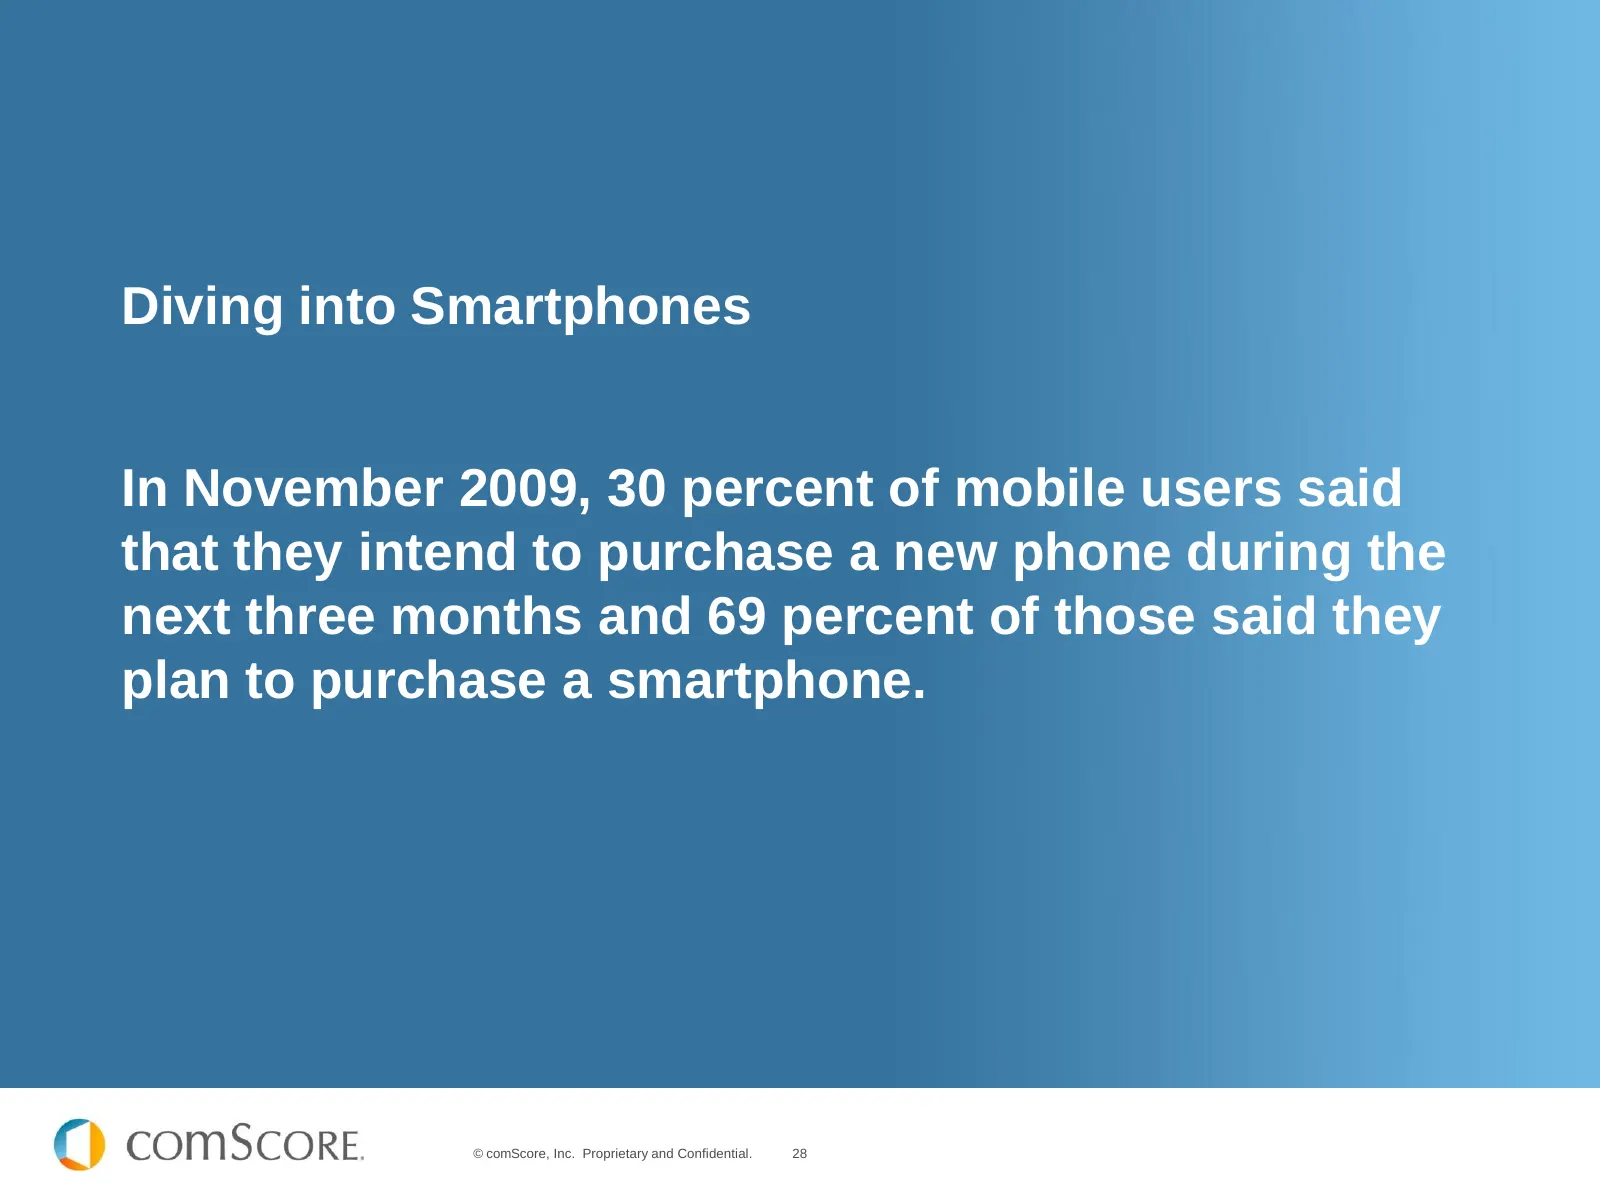
Slide 28: Diving into Smartphones
Diving into Smartphones In November 2009, 30 percent of mobile users said that they intend to purchase a new phone during the next three months and 69 percent of those said they plan to purchase a smartphone. © comScore, Inc. Proprietary and Confidential. 28
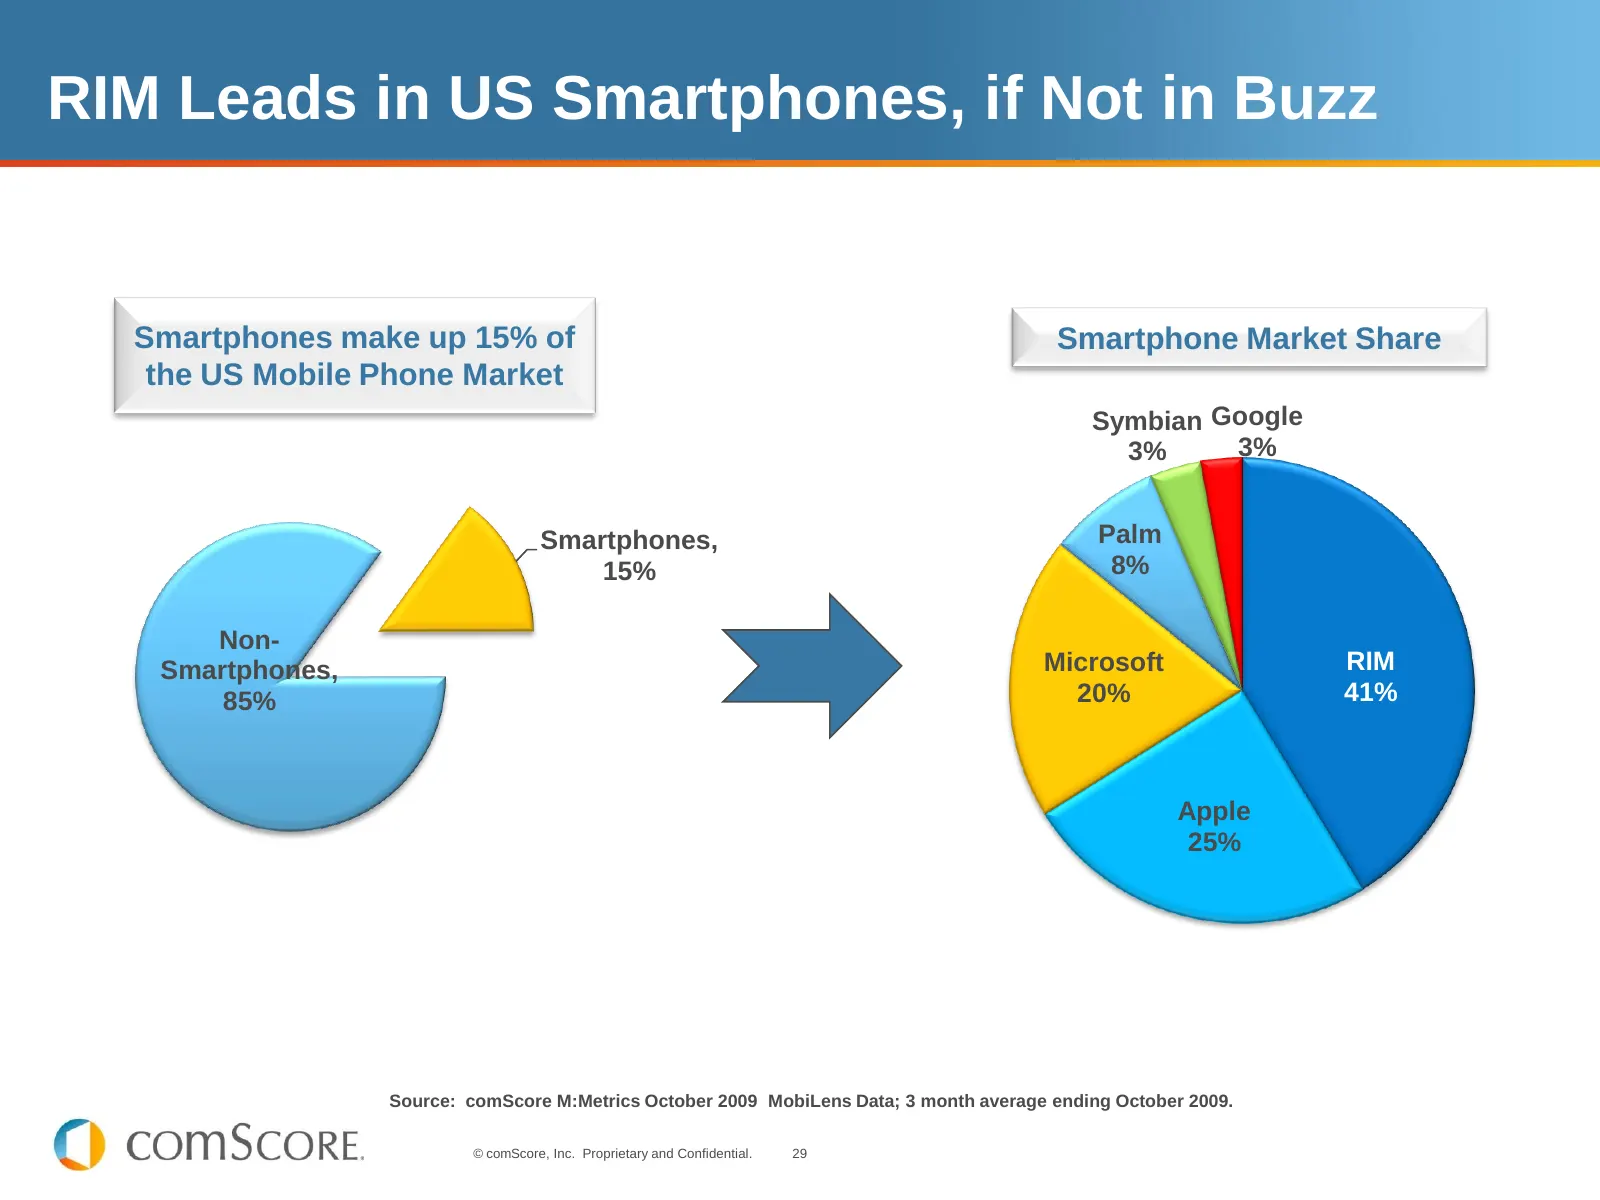
Slide 29: RIM Leads in US Smartphones, if Not in Buzz
RIM Leads in US Smartphones, if Not in Buzz Smartphones make up 15% of Smartphone Market Share the US Mobile Phone Market Symbian Google 3% 3% Smartphones, Palm 15% 8% Non- Smartphones, Microsoft RIM 85% 20% 41% Apple 25% Source: comScore M:Metrics October 2009 MobiLens Data; 3 month average ending
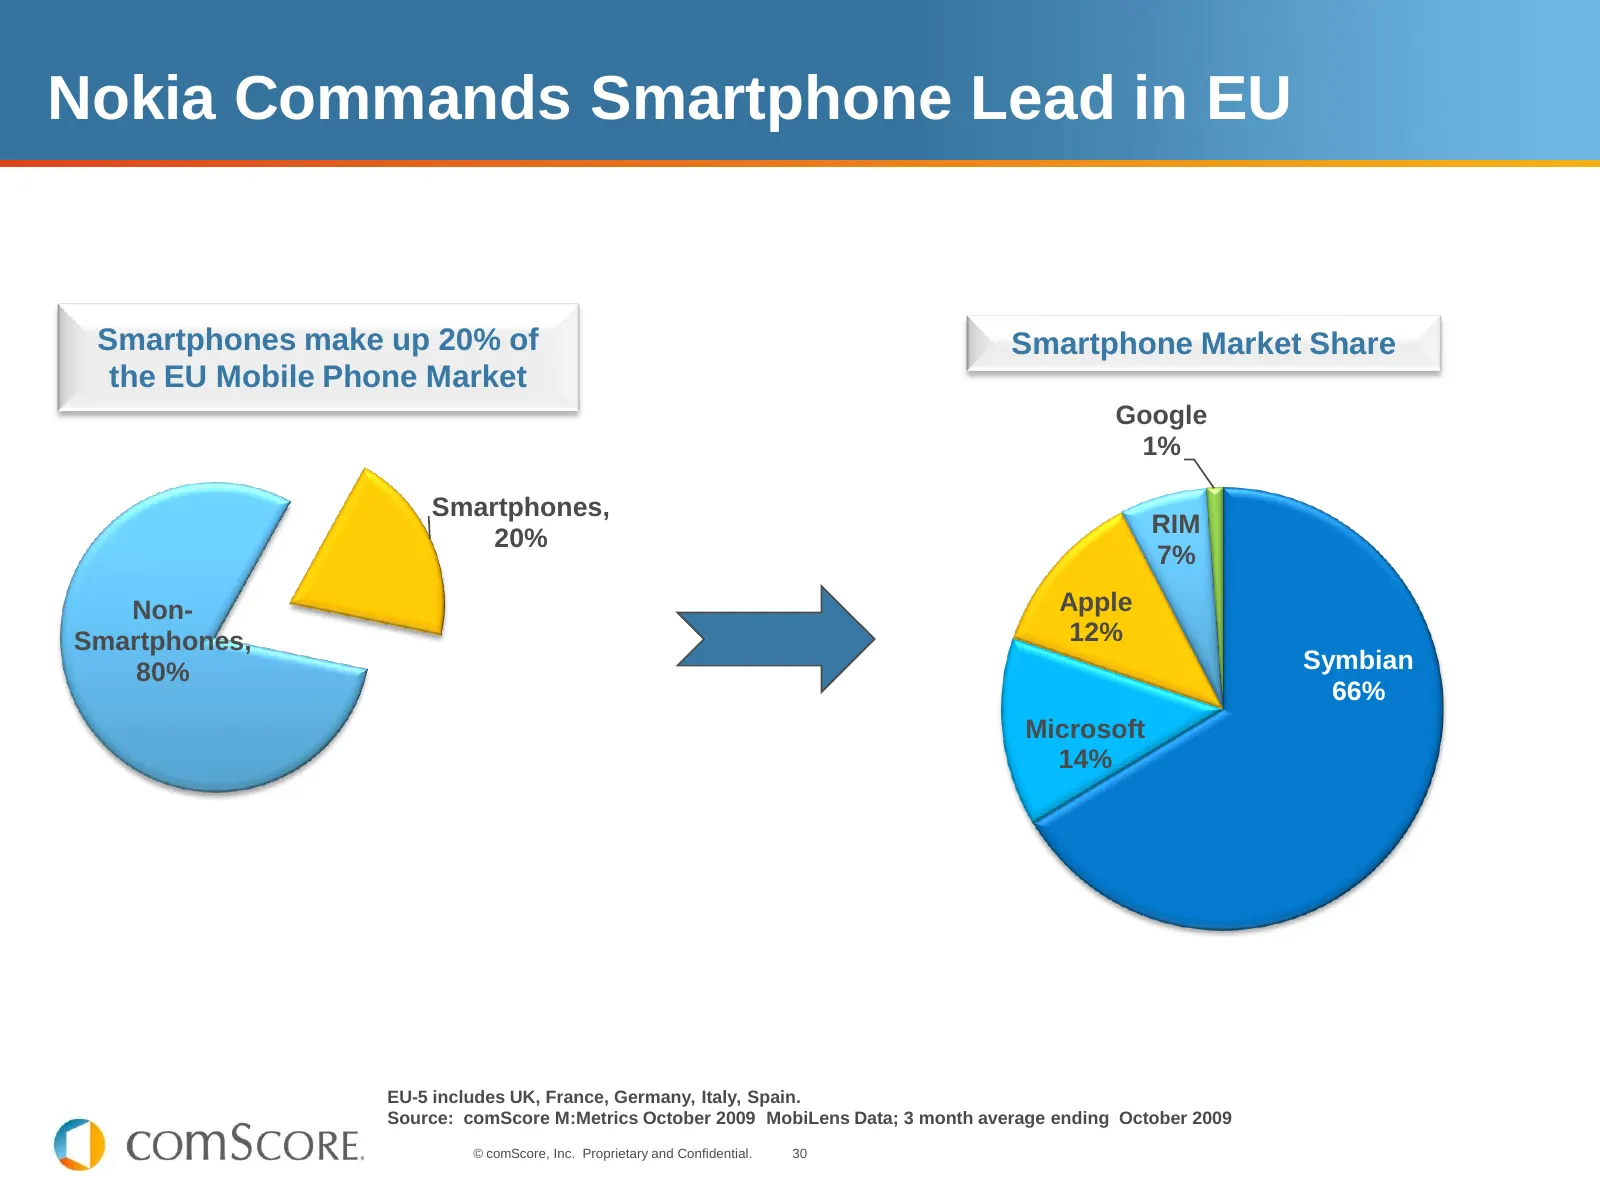
Slide 30: Nokia Commands Smartphone Lead in EU
Nokia Commands Smartphone Lead in EU Smartphones make up 20% of Smartphone Market Share the EU Mobile Phone Market Google 1% Smartphones, 20% RIM 7% Non- Apple Smartphones, 12% 80% Symbian 66% Microsoft 14% EU-5 includes UK, France, Germany, Italy, Spain. Source: comScore M:Metrics October 2009 Mobi
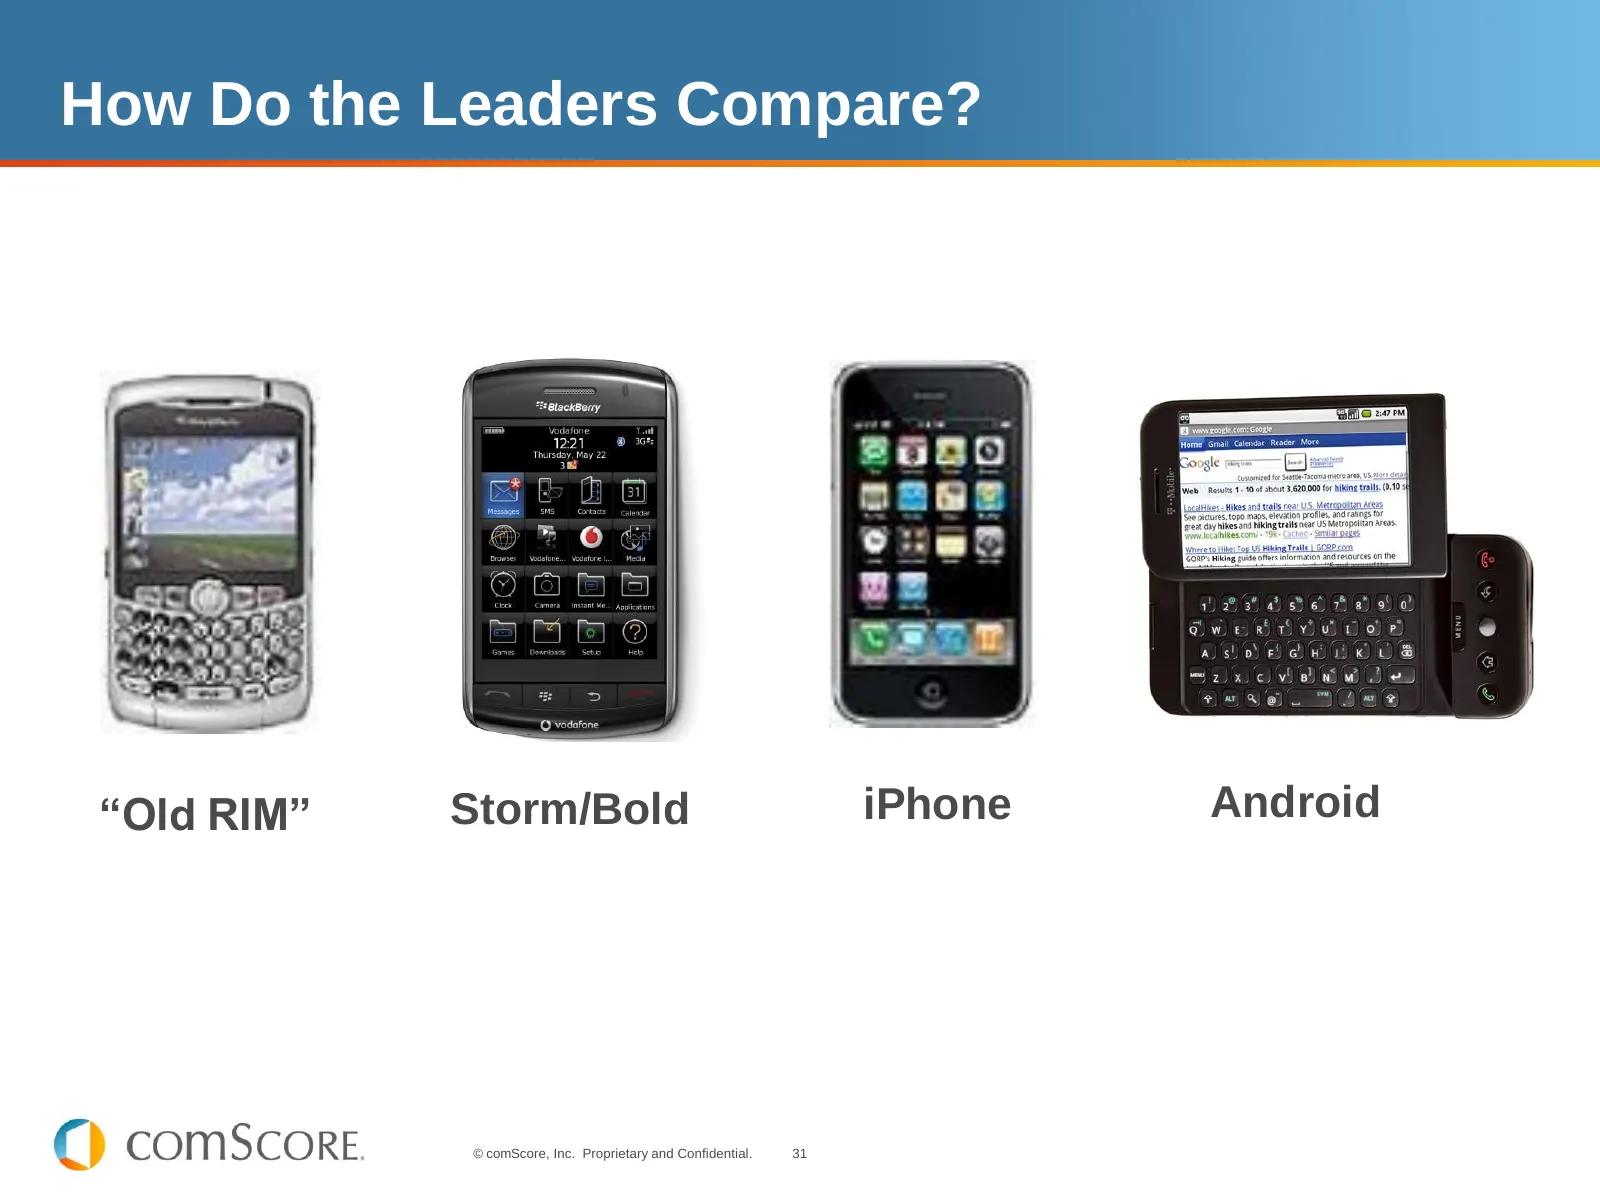
Slide 31: How Do the Leaders Compare?
How Do the Leaders Compare? “Old RIM” Storm/Bold iPhone Android © comScore, Inc. Proprietary and Confidential. 31
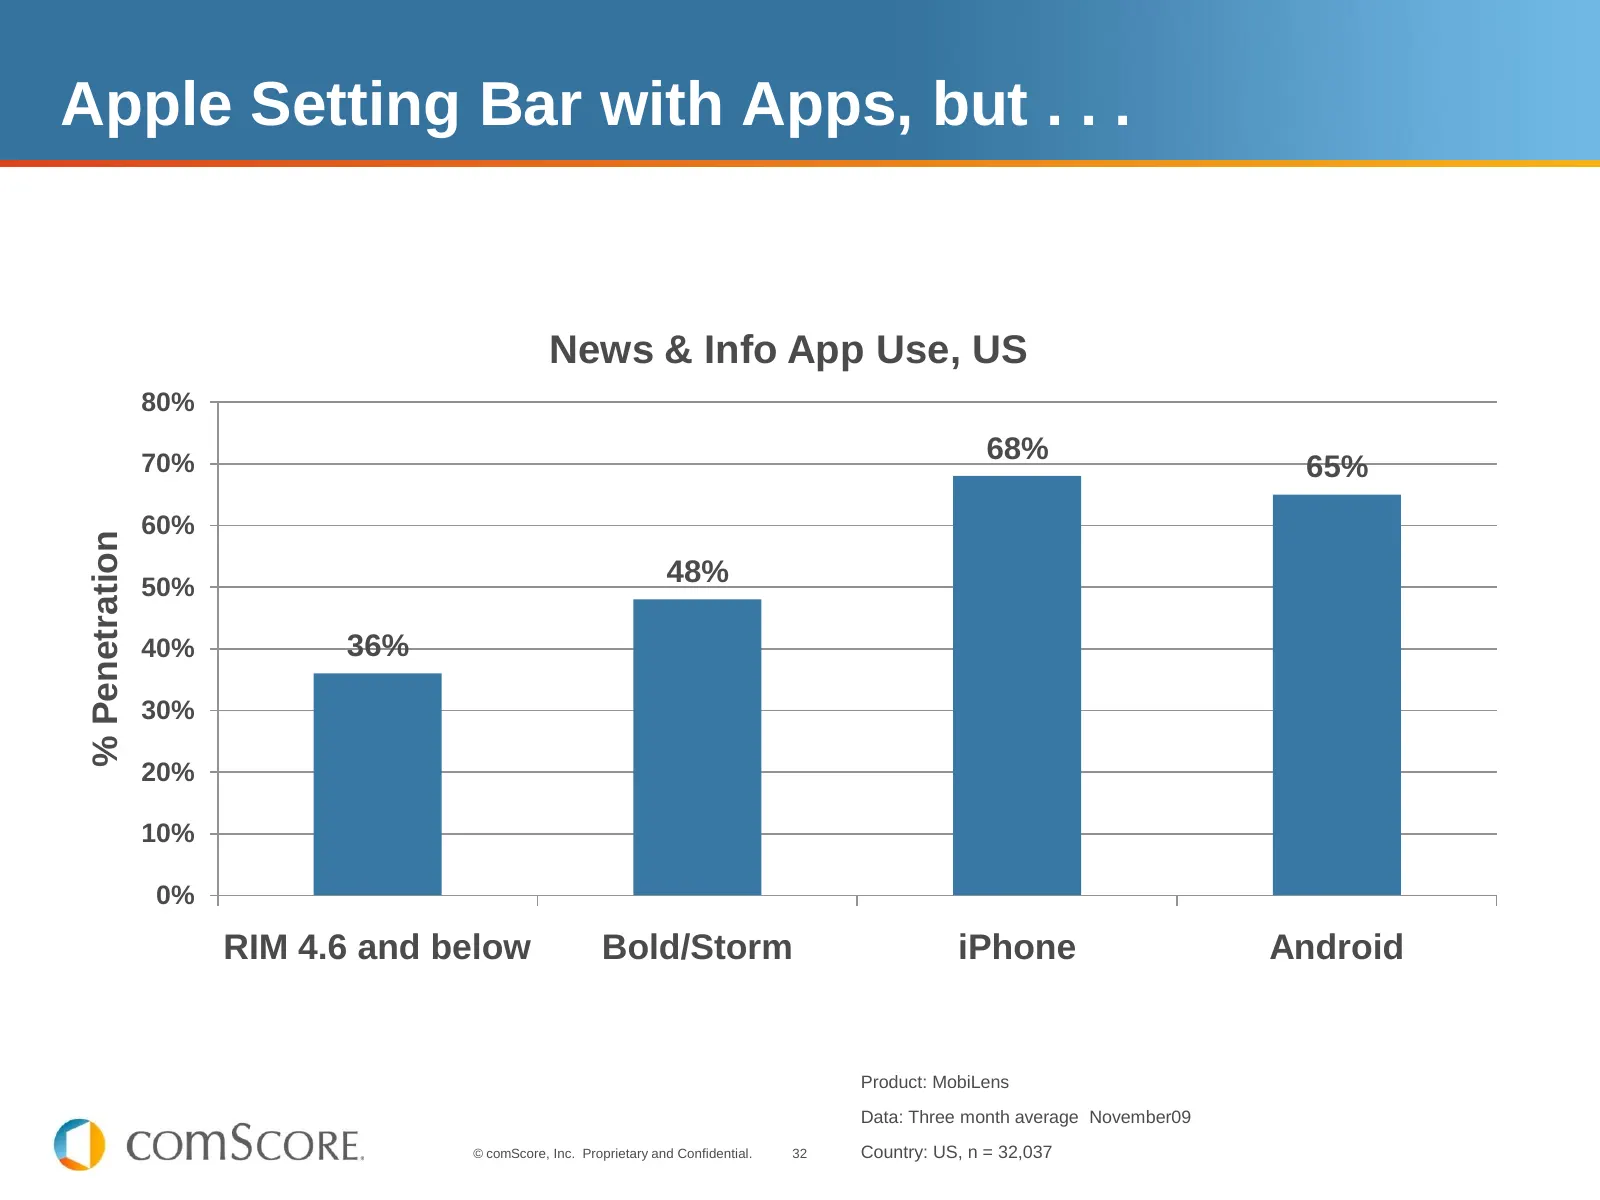
Slide 32: Apple Setting Bar with Apps, but...
Apple Setting Bar with Apps, but . . . News & Info App Use, US 80% 70% 68% 65% 60% % Penetration 50% 48% 40% 36% 30% 20% 10% 0% RIM 4.6 and below Bold/Storm iPhone Android Product: MobiLens Data: Three month average November09 © comScore, Inc. Proprietary and Confidential. 32 Country: US, n = 32,037
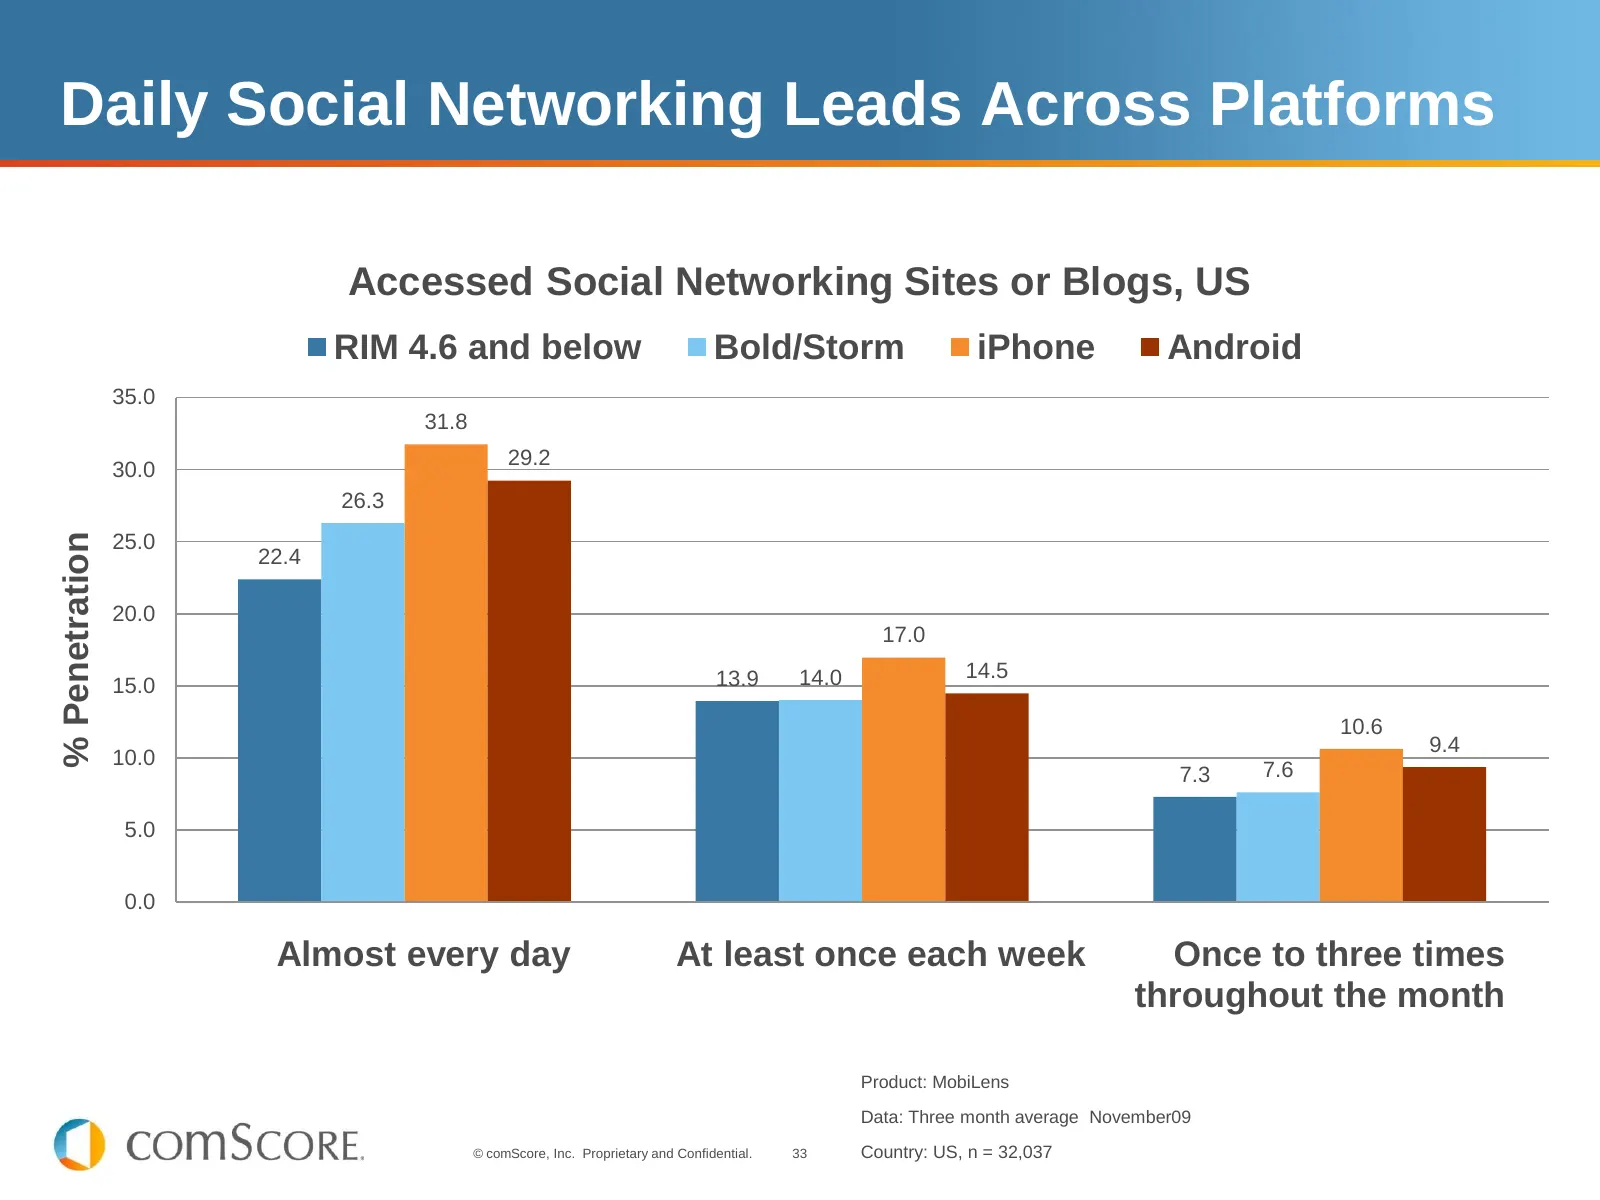
Slide 33: Daily Social Networking Leads Across Platforms
Daily Social Networking Leads Across Platforms Accessed Social Networking Sites or Blogs, US RIM 4.6 and below Bold/Storm iPhone Android 35.0 31.8 29.2 30.0 26.3 % Penetration 25.0 22.4 20.0 17.0 13.9 14.0 14.5 15.0 10.6 9.4 10.0 7.3 7.6 5.0 0.0 Almost every day At least once each week Once to three
Slide 34: Newer RIM Devices Strong on Multimedia
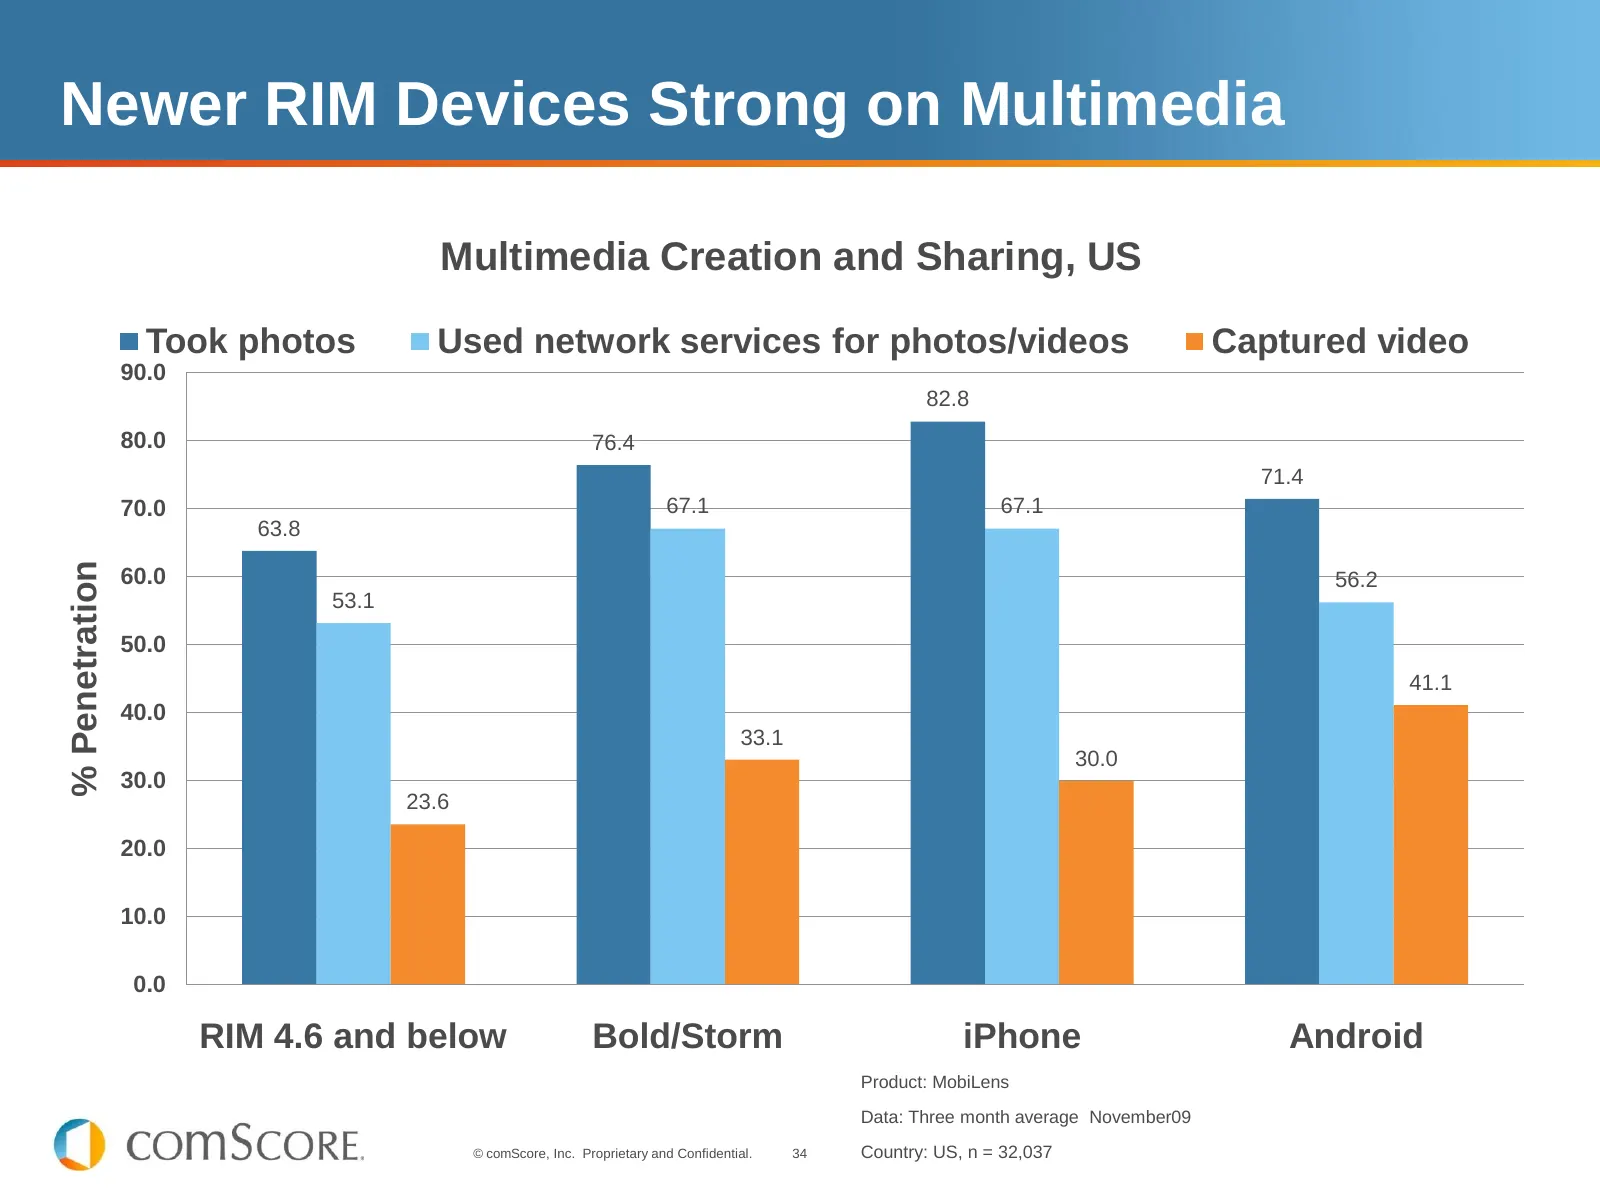
Newer RIM Devices Strong on Multimedia Multimedia Creation and Sharing, US Took photos Used network services for photos/videos Captured video 90.0 82.8 80.0 76.4 71.4 70.0 67.1 67.1 63.8 % Penetration 60.0 56.2 53.1 50.0 41.1 40.0 33.1 30.0 30.0 23.6 20.0 10.0 0.0 RIM 4.6 and below Bold/Storm iPhone

Slide 35: Purchase Consideration
Purchase Consideration © comScore, Inc. Proprietary and Confidential. 35
Slide 36: What Do Phone Buyers Want?
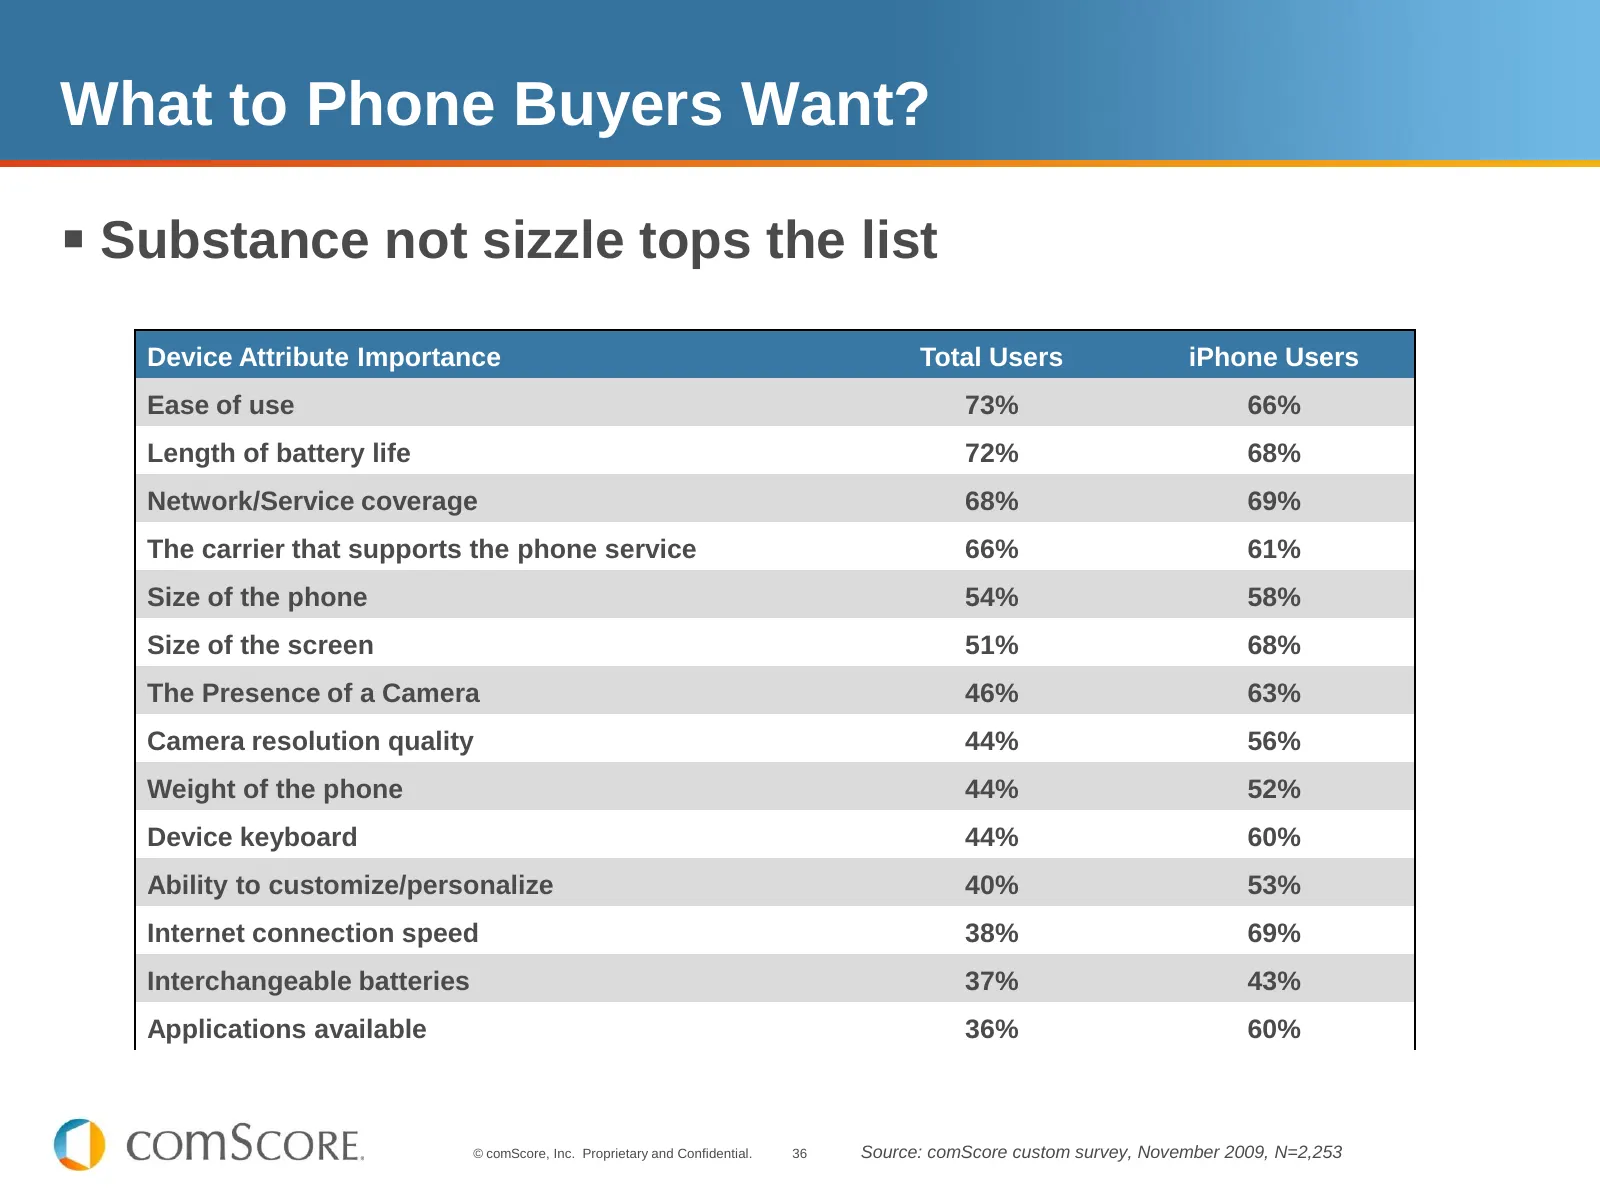
What to Phone Buyers Want? Substance not sizzle tops the list Device Attribute Importance Total Users iPhone Users Ease of use 73% 66% Length of battery life 72% 68% Network/Service coverage 68% 69% The carrier that supports the phone service 66% 61% Size of the phone 54% 58% Size of the screen 51
Slide 37: What Phones Are They Searching For
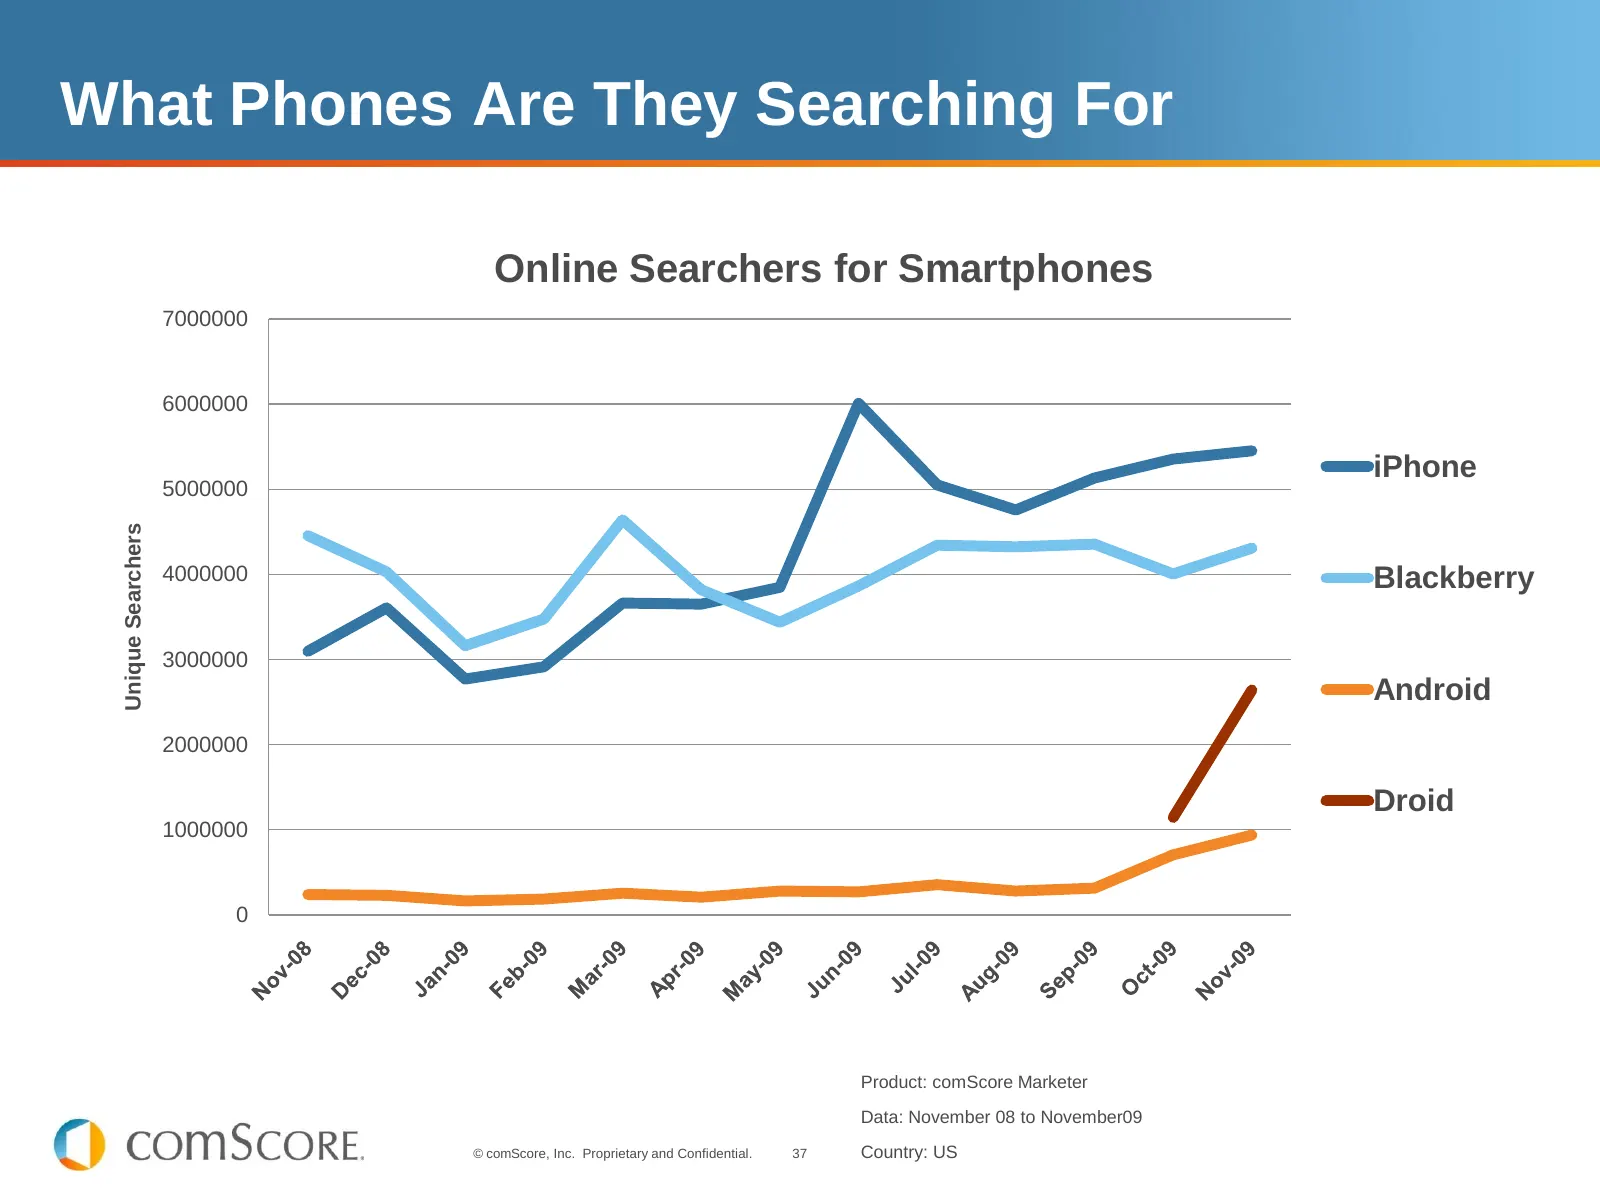
What Phones Are They Searching For Online Searchers for Smartphones 7000000 6000000 iPhone 5000000 Unique Searchers 4000000 Blackberry 3000000 Android 2000000 Droid 1000000 0 Product: comScore Marketer Data: November 08 to November09 © comScore, Inc. Proprietary and Confidential. 37 Country: US
Slide 38: Android Intenders Stand Out
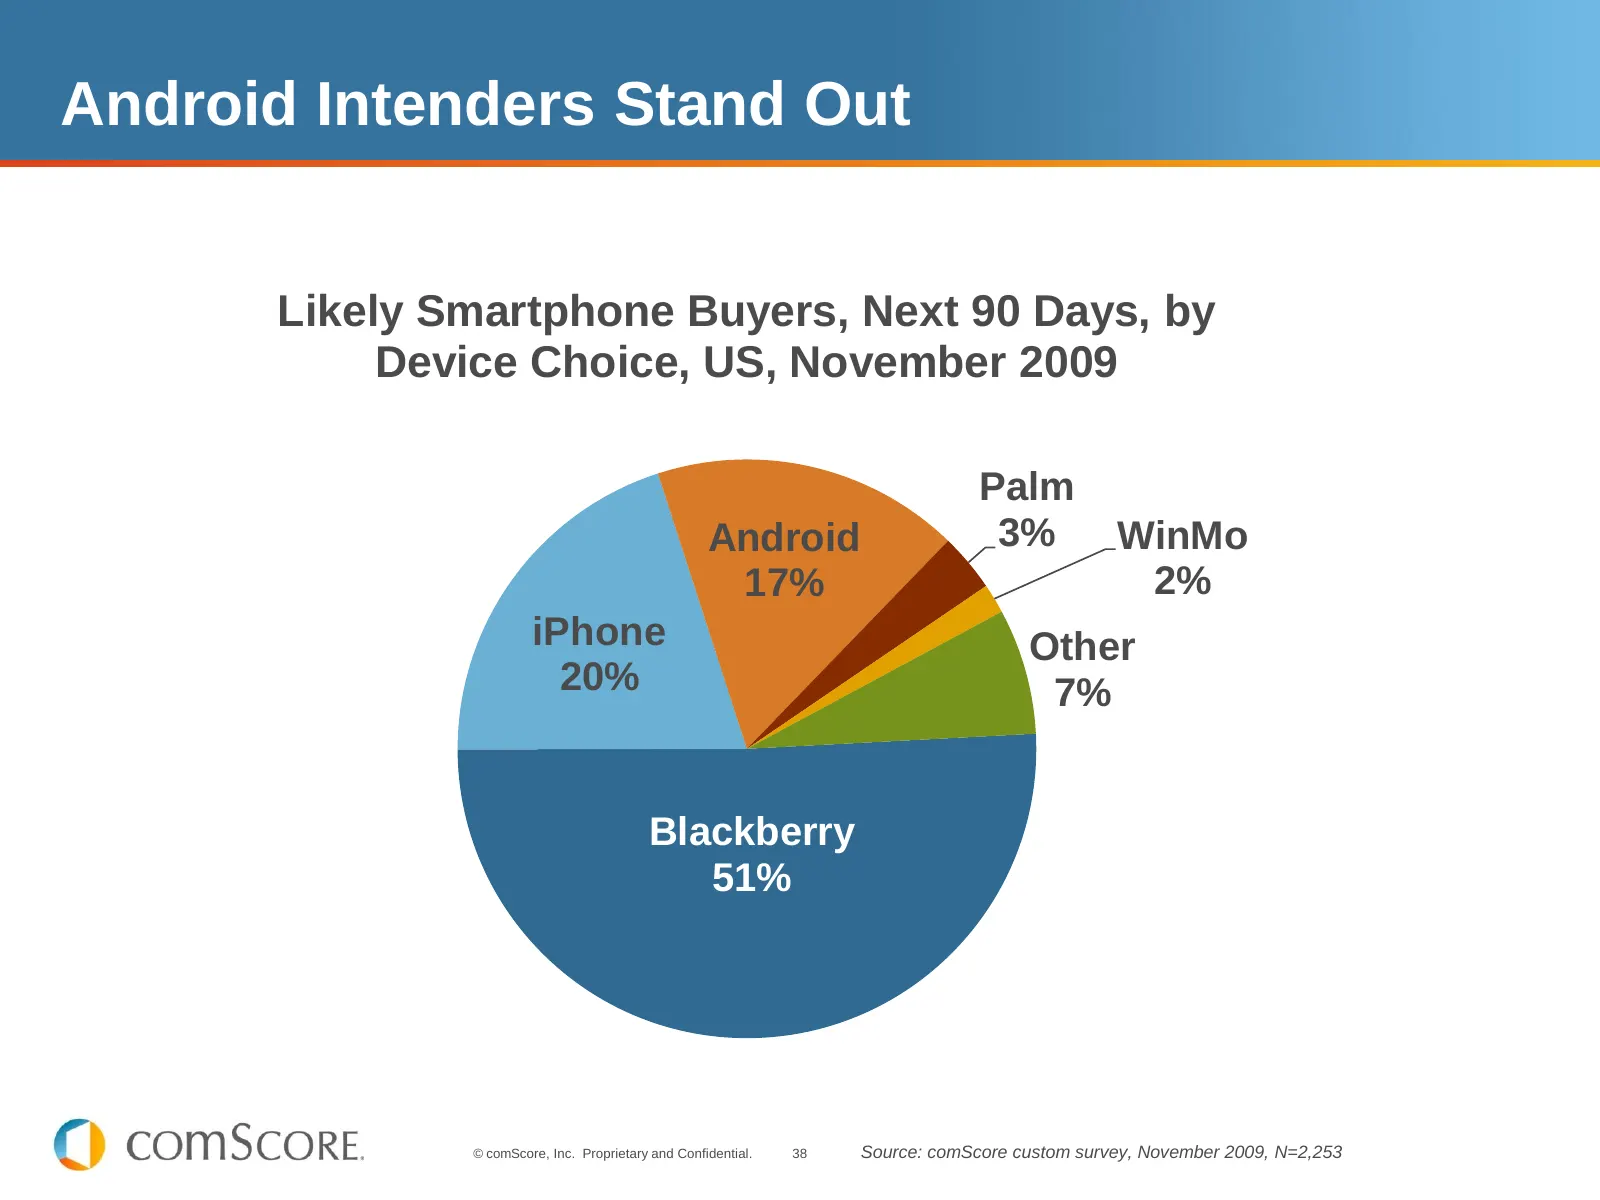
Android Intenders Stand Out Likely Smartphone Buyers, Next 90 Days, by Device Choice, US, November 2009 Palm Android 3% WinMo 17% 2% iPhone Other 20% 7% Blackberry 51% © comScore, Inc. Proprietary and Confidential. 38 Source: comScore custom survey, November 2009, N=2,253

Slide 39: Thank You! Questions?
Thank You! Questions? mdonovan@comscore.com © comScore, Inc. Proprietary and Confidential. 39
Source: Internet Archive copy of comscore.com
More decks from comScore, Inc.
 Q3 2026 Earnings Presentation17 slides · Nov 3, 2026
 Q2 2026 Earnings Presentation20 slides · Aug 12, 2026
 Investor Presentation (June 2026)27 slides · Jun 10, 2026
 Q4 2025 Earnings Presentation13 slides · Mar 17, 2026
 Q3 2025 Earnings Presentation15 slides · Nov 4, 2025
 Q2 2025 Earnings Presentation11 slides · Aug 5, 2025