Columbia Property Trust — Investor Day (September 2016)
68 slides from Columbia Property Trust's investor day presentation, Sep 12, 2016

Slide 1: 2016 Investor & Analyst Meeting
1 2016 INVESTOR & ANALYST MEETING
Slide 2: Forward-Looking Statements
2 FORWARD-LOOKING STATEMENTS Certain statements contained in this presentation other than historical facts may be considered forward-looking statements. Such statements include, in particular, statements about our plans, strategies, and prospects, and are subject to certain risks and uncertainties,
Slide 3: Key Drivers of a Top-Performing Office REIT
3 KEY DRIVERS OF A TOP-PERFORMING OFFICE REIT • Portfolio • Capital base • Team & platform
Slide 4: Portfolio
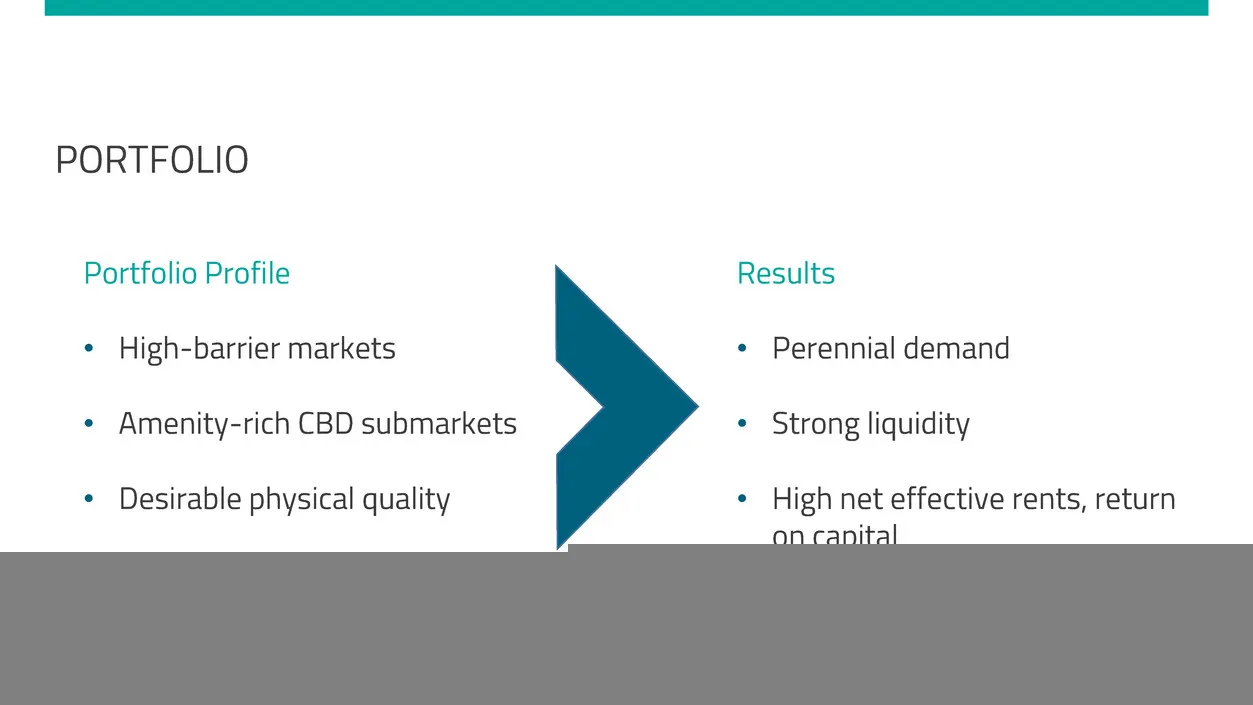
4 PORTFOLIO Portfolio Profile • High-barrier markets • Amenity-rich CBD submarkets • Desirable physical quality Results • Perennial demand • Strong liquidity • High net effective rents, return on capital
Slide 5: Capital Base
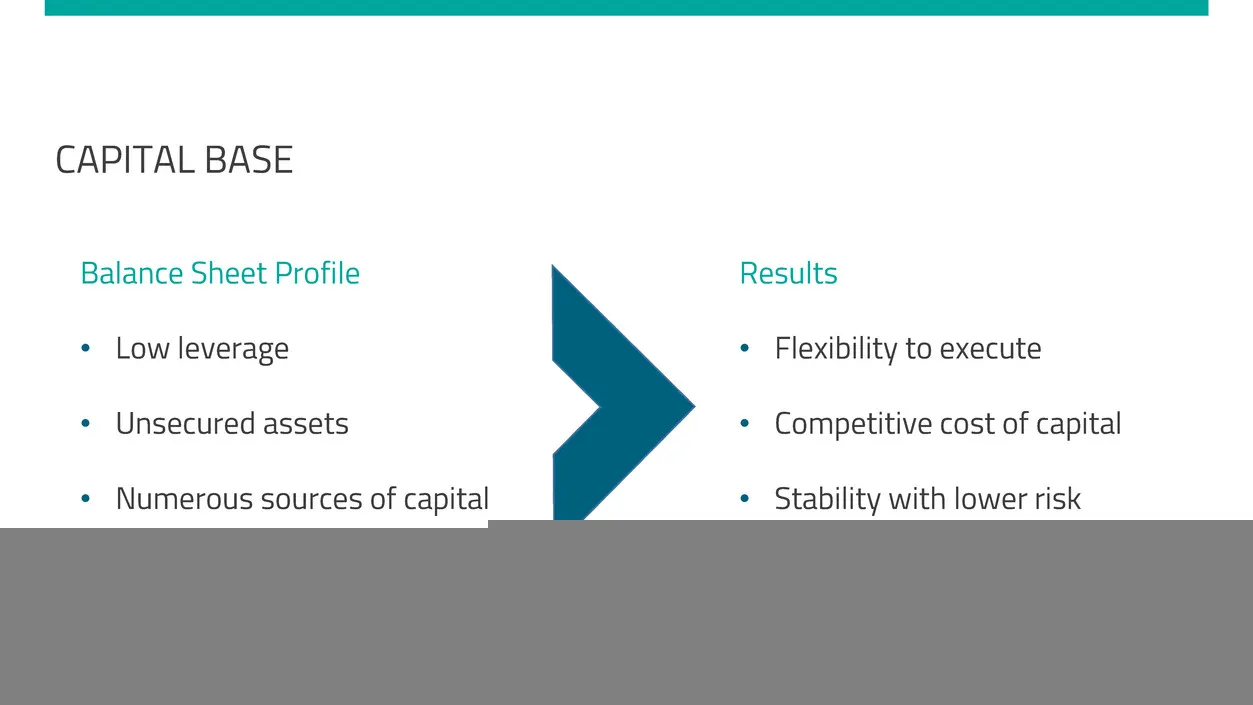
5 CAPITAL BASE Balance Sheet Profile • Low leverage • Unsecured assets • Numerous sources of capital Results • Flexibility to execute • Competitive cost of capital • Stability with lower risk
Slide 6: Team & Platform
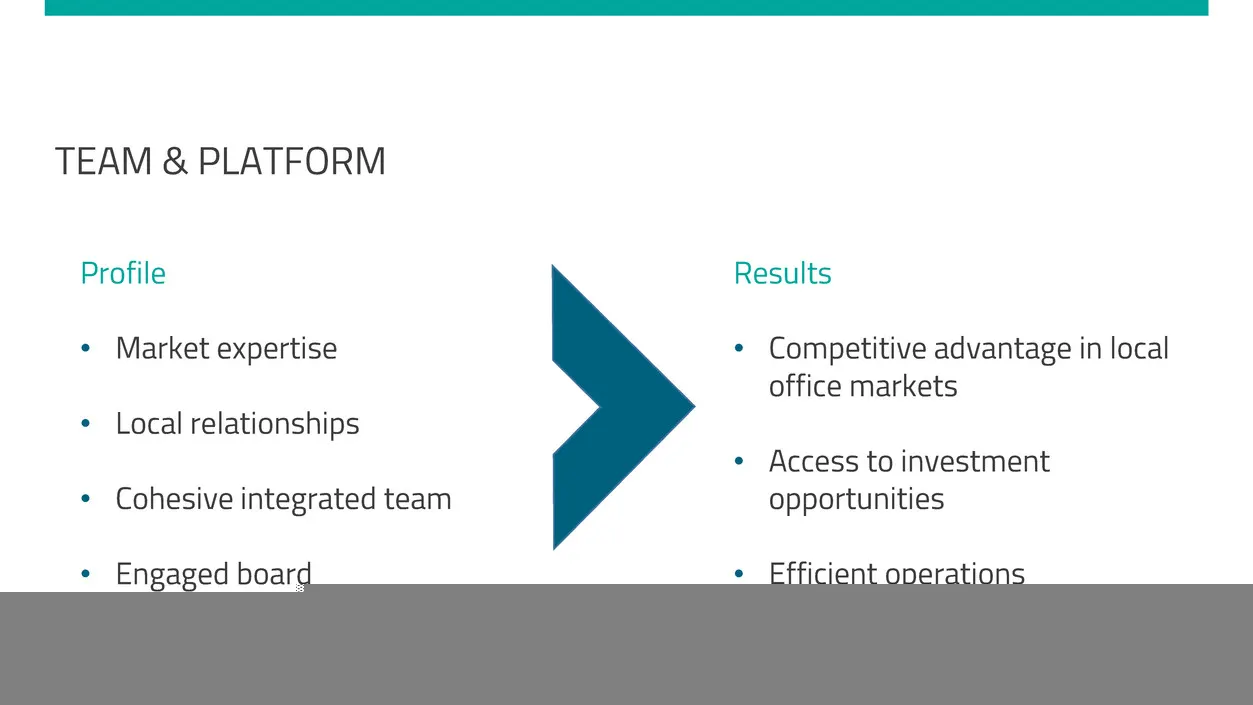
6 TEAM & PLATFORM Profile • Market expertise • Local relationships • Cohesive integrated team • Engaged board Results • Competitive advantage in local office markets • Access to investment opportunities • Efficient operations
Slide 7: Transformation
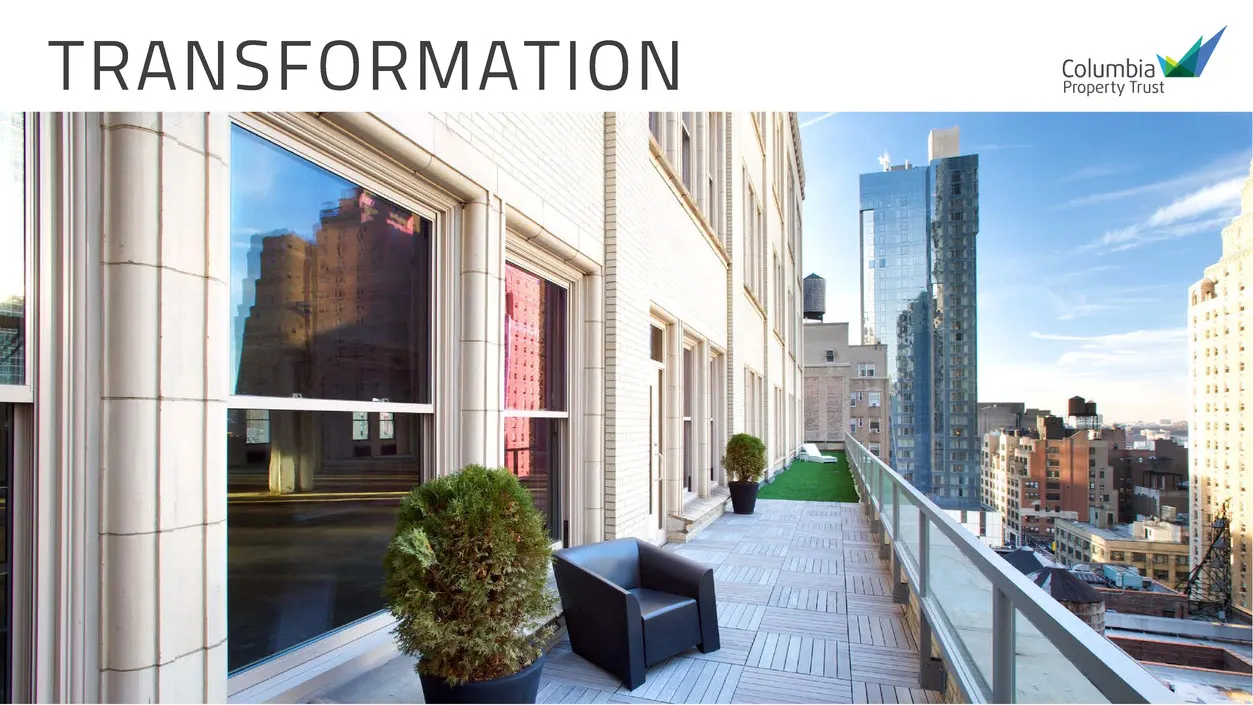
TRANSFORMATION cama
Slide 8: 50+ Buildings Sold, $2.5 Billion
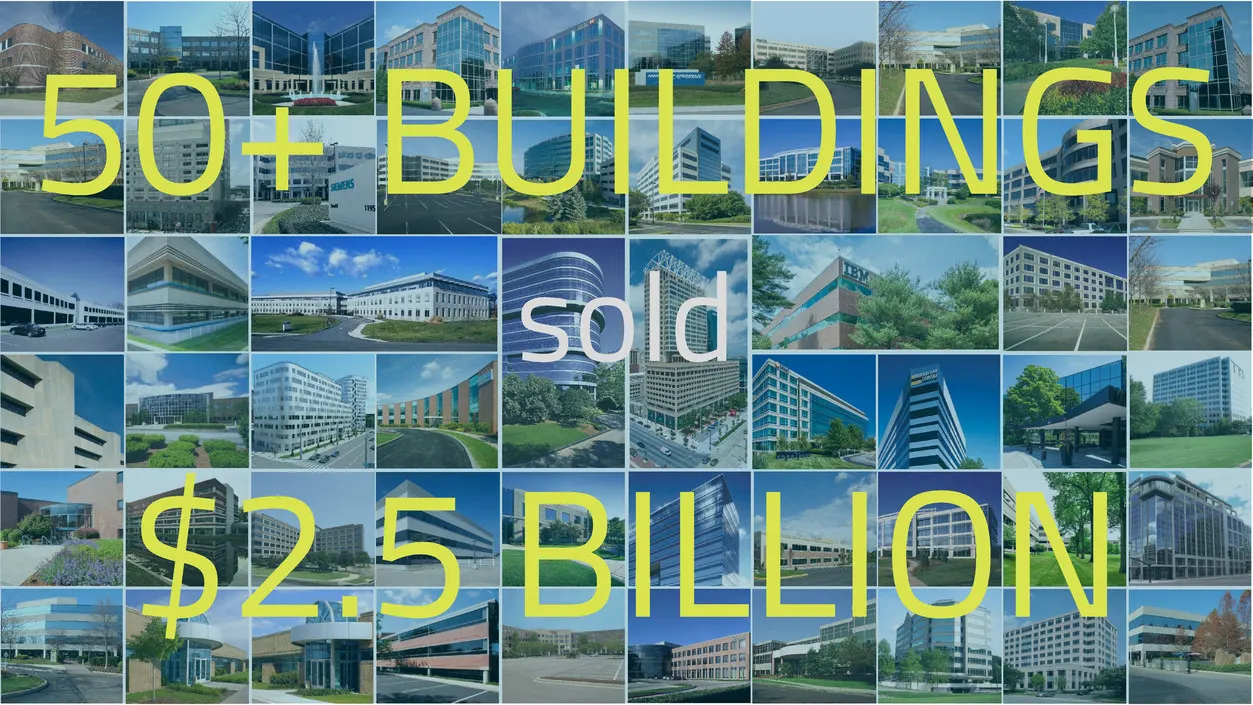
50+ BUILDINGS sold $2.5 BILLION
Slide 9: Premier Assets Invested In $2.6 B
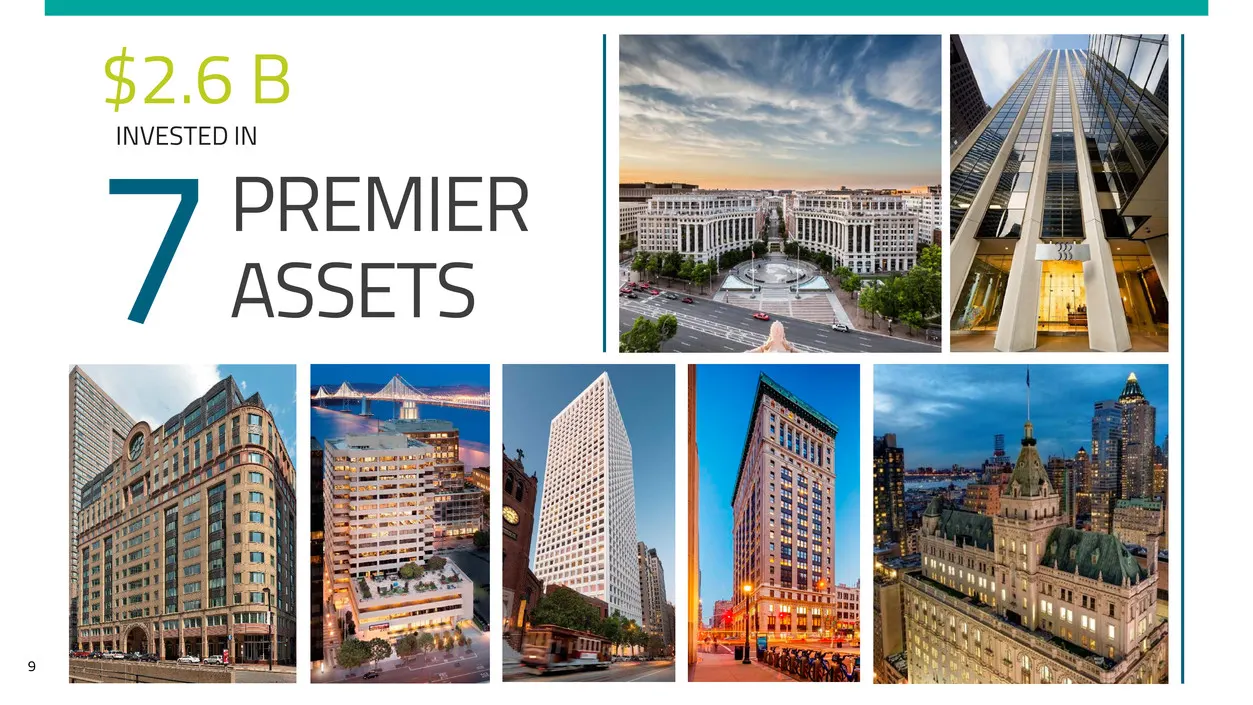
9 PREMIER ASSETS INVESTED IN $2.6 B 7
Slide 10: Market Concentration
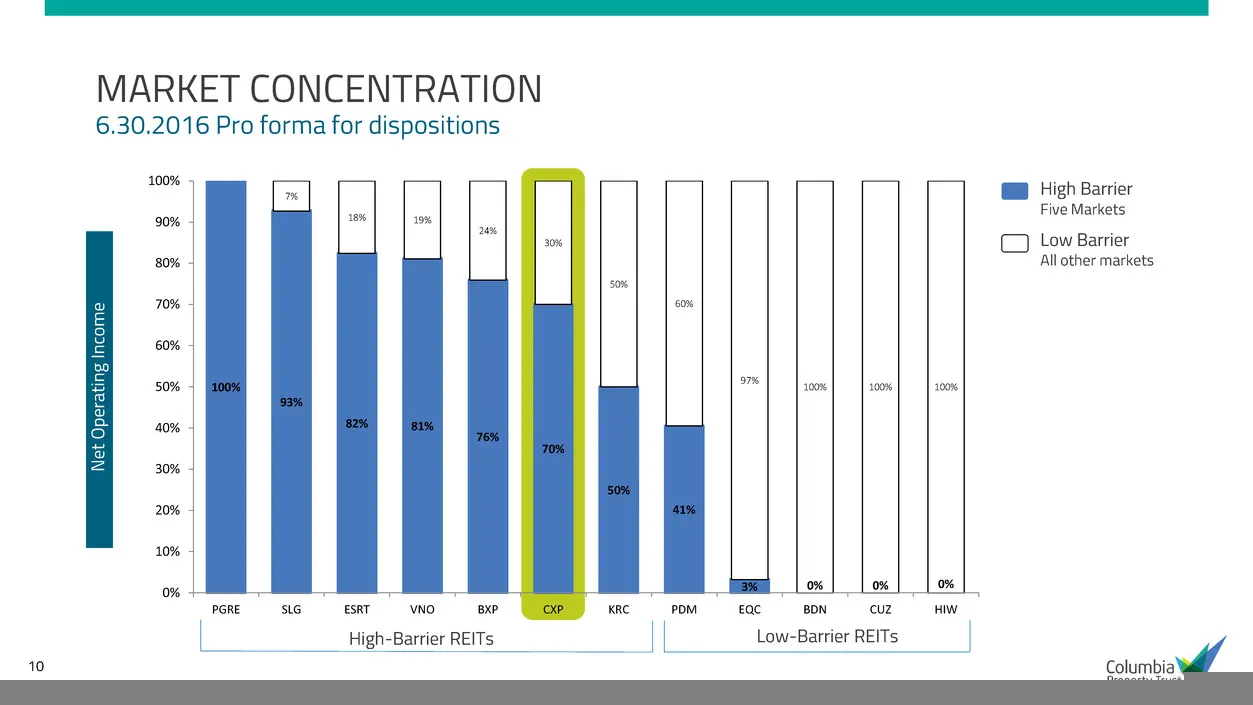
10 100% 93% 82% 81% 76% 70% 50% 41% 3% 0% 0% 0% 7% 18% 19% 24% 30% 50% 60% 97% 100% 100% 100% 0% 10% 20% 30% 40% 50% 60% 70% 80% 90% 100% PGRE SLG ESRT VNO BXP CXP KRC PDM EQC BDN CUZ HIW High-Barrier REITs Low-Barrier REITs N et O pe ra tin g In co m e MARKET CONCENTRATION 6.30.2016 Pro forma for d
Slide 11: Portfolio Quality
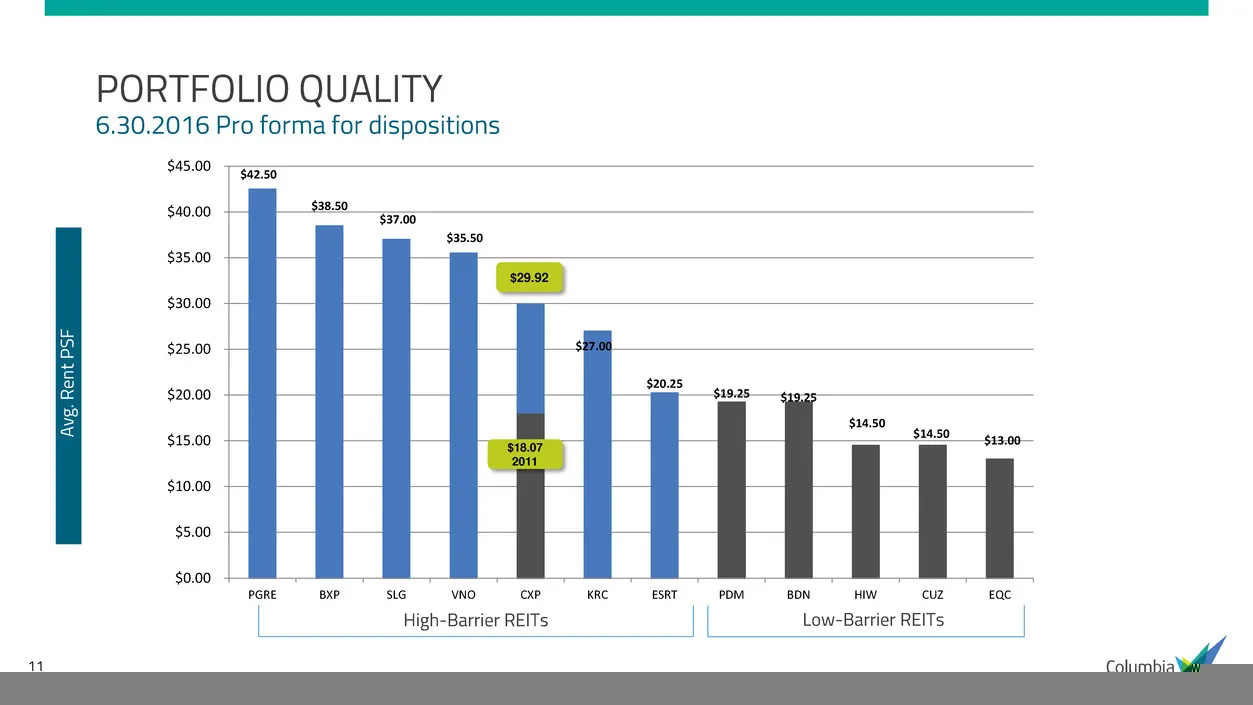
11 $42.50 $38.50 $37.00 $35.50 $27.00 $20.25 $19.25 $19.25 $14.50 $14.50 $13.00 $0.00 $5.00 $10.00 $15.00 $20.00 $25.00 $30.00 $35.00 $40.00 $45.00 PGRE BXP SLG VNO CXP KRC ESRT PDM BDN HIW CUZ EQC $18.07 2011 $29.92 PORTFOLIO QUALITY 6.30.2016 Pro forma for dispositions High-Barrier REITs Low-Barri
Slide 12: Debt Maturities
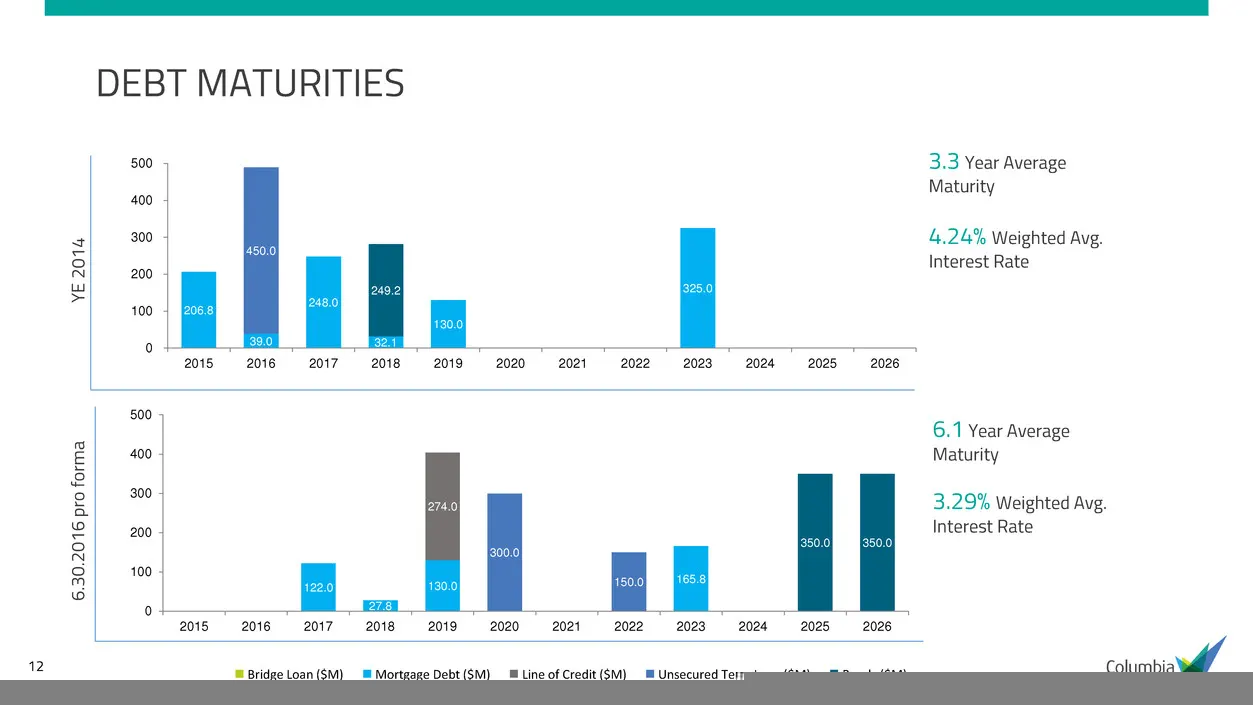
12 206.8 39.0 248.0 32.1 130.0 325.0 450.0 249.2 0 100 200 300 400 500 2015 2016 2017 2018 2019 2020 2021 2022 2023 2024 2025 2026 122.0 27.8 130.0 165.8 274.0 300.0 150.0 350.0 350.0 0 100 200 300 400 500 2015 2016 2017 2018 2019 2020 2021 2022 2023 2024 2025 2026 6. 30 .2 01 6 pr o fo rm a YE 2 01
Slide 13: Team & Platform
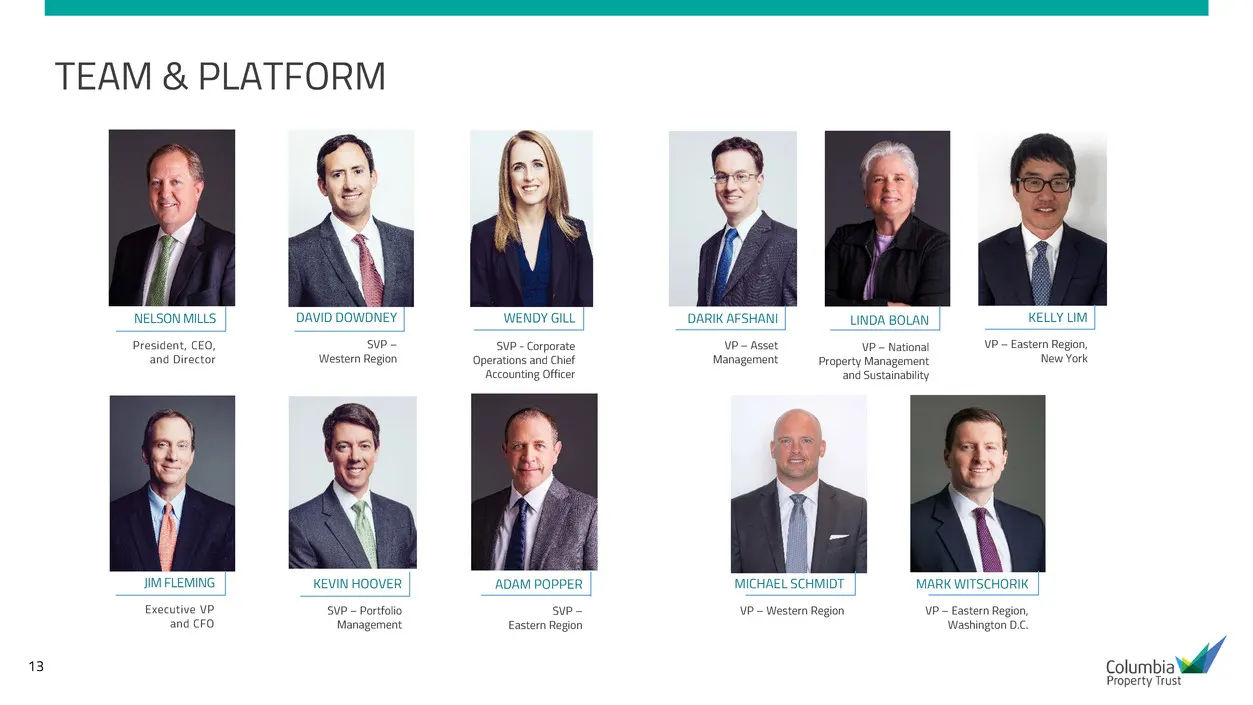
13 KEVIN HOOVER SVP – Portfolio Management DARIK AFSHANI VP – Asset Management MICHAEL SCHMIDT VP – Western Region KELLY LIM VP – Eastern Region, New York LINDA BOLAN VP – National Property Management and Sustainability MARK WITSCHORIK VP – Eastern Region, Washington D.C. TEAM & PLATFORM NELSON MILL
Slide 14: San Francisco Market Overview
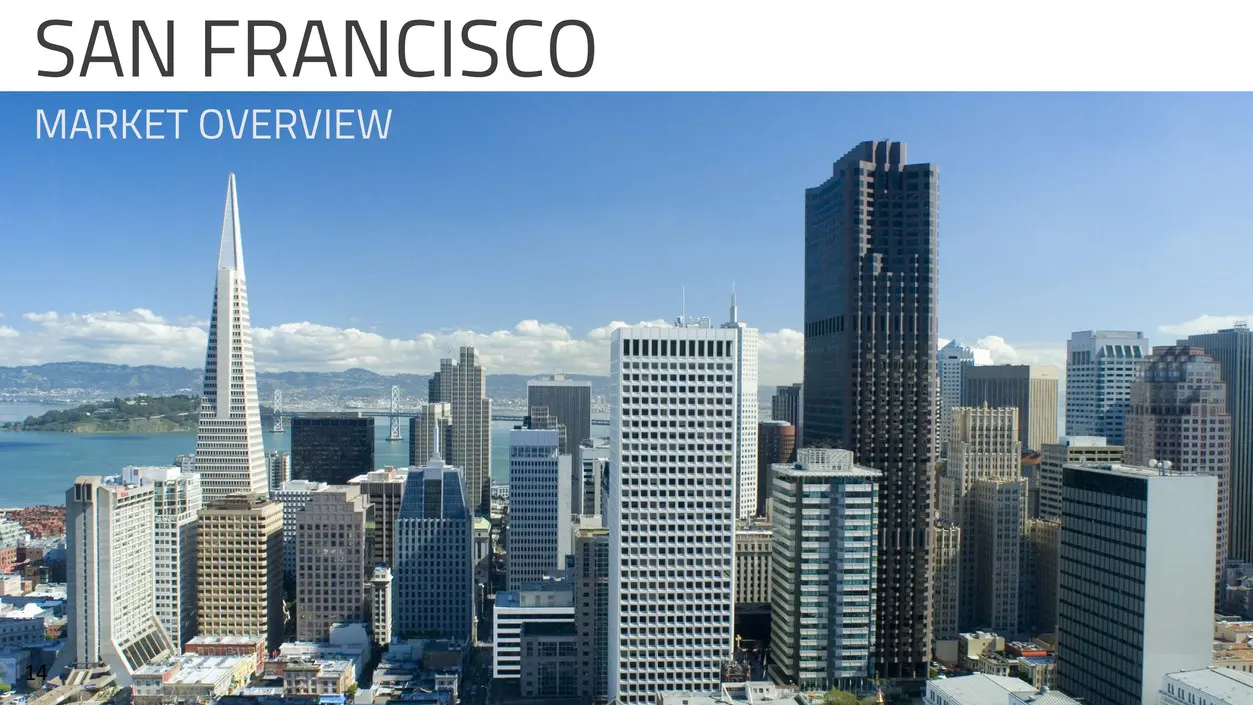
14 SAN FRANCISCO MARKET OVERVIEW 14
Slide 15: Mixed Signals on the Market
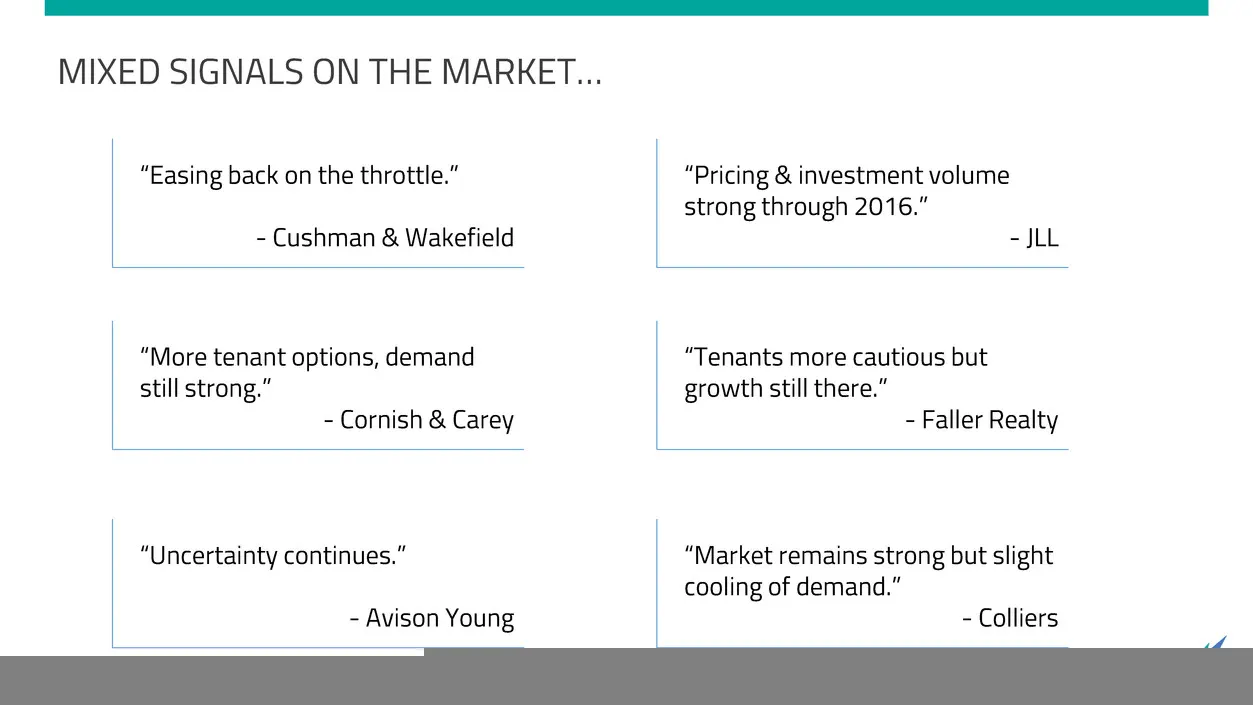
15 MIXED SIGNALS ON THE MARKET… “Easing back on the throttle.” - Cushman & Wakefield “Pricing & investment volume strong through 2016.” - JLL “More tenant options, demand still strong.” - Cornish & Carey “Tenants more cautious but growth still there.” - Faller Realty “Uncertainty continues.” - Aviso
Slide 16: Historical Rental Rates vs. Vacancy
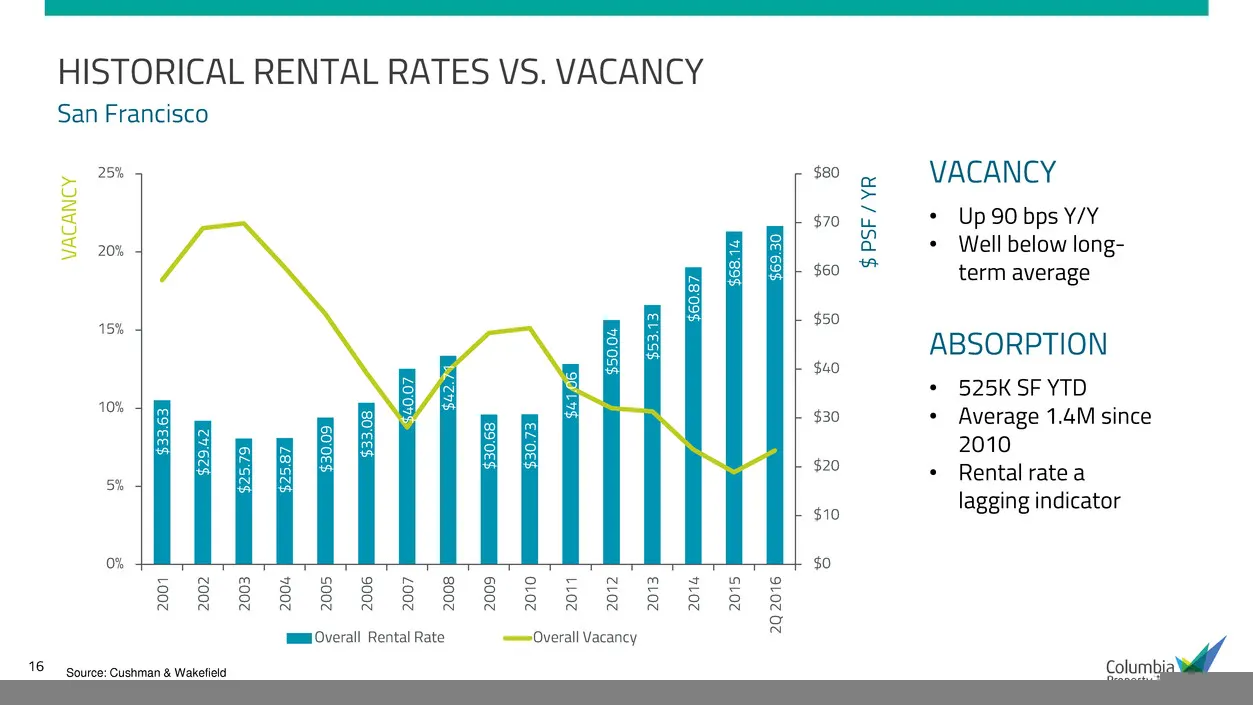
16 HISTORICAL RENTAL RATES VS. VACANCY San Francisco VACANCY • Up 90 bps Y/Y • Well below long- term average ABSORPTION • 525K SF YTD • Average 1.4M since 2010 • Rental rate a lagging indicator Source: Cushman & Wakefield $33 .6 3 $29 .4 2 $25 .7 9 $25 .8 7 $30 .0 9 $33 .0 8 $40 .0 7 $42 .7 1 $30 .6
Slide 17: Historical Tenant Demand
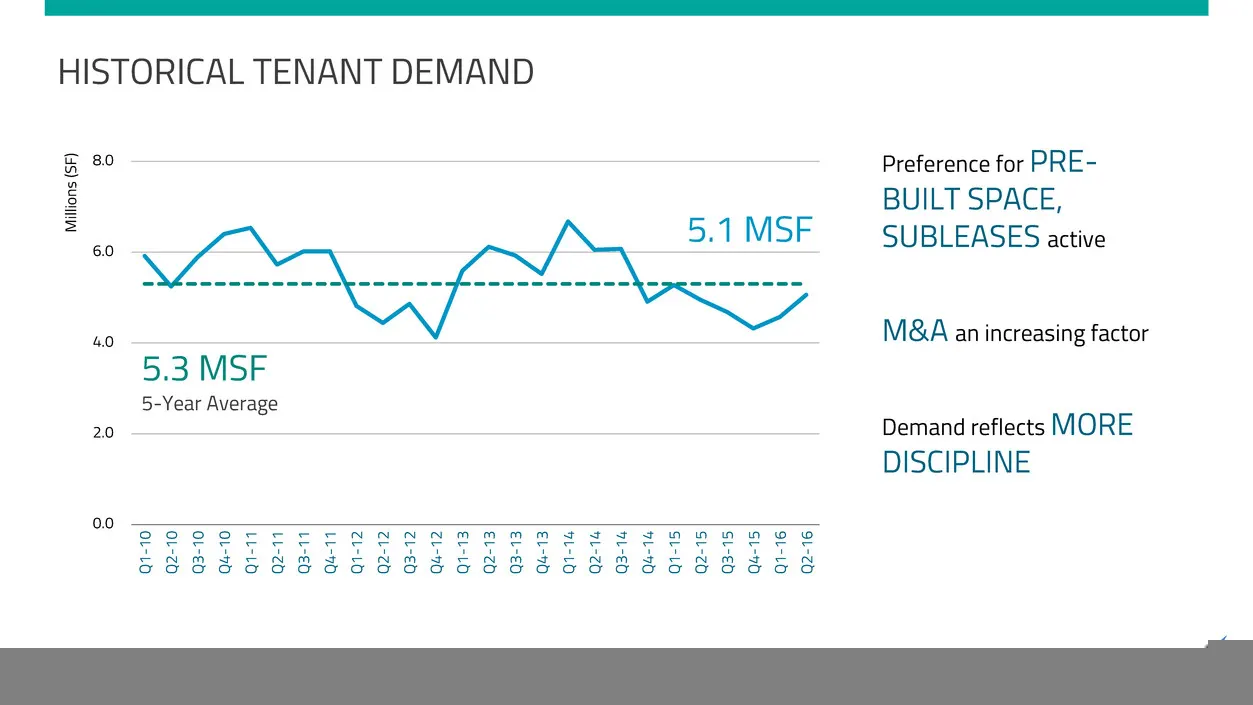
17 HISTORICAL TENANT DEMAND Preference for PRE- BUILT SPACE, SUBLEASES active M&A an increasing factor Demand reflects MORE DISCIPLINE Source: CBRE 5.1 MSF 0.0 2.0 4.0 6.0 8.0 Q1 -1 0 Q2 -1 0 Q3 -1 0 Q4 -1 0 Q1 -1 1 Q2 -1 1 Q3 -1 1 Q4 -1 1 Q1 -1 2 Q2 -1 2 Q3 -1 2 Q4 -1 2 Q1 -1 3 Q2 -1 3 Q3 -1 3 Q4 -
Slide 18: New Development Pipeline
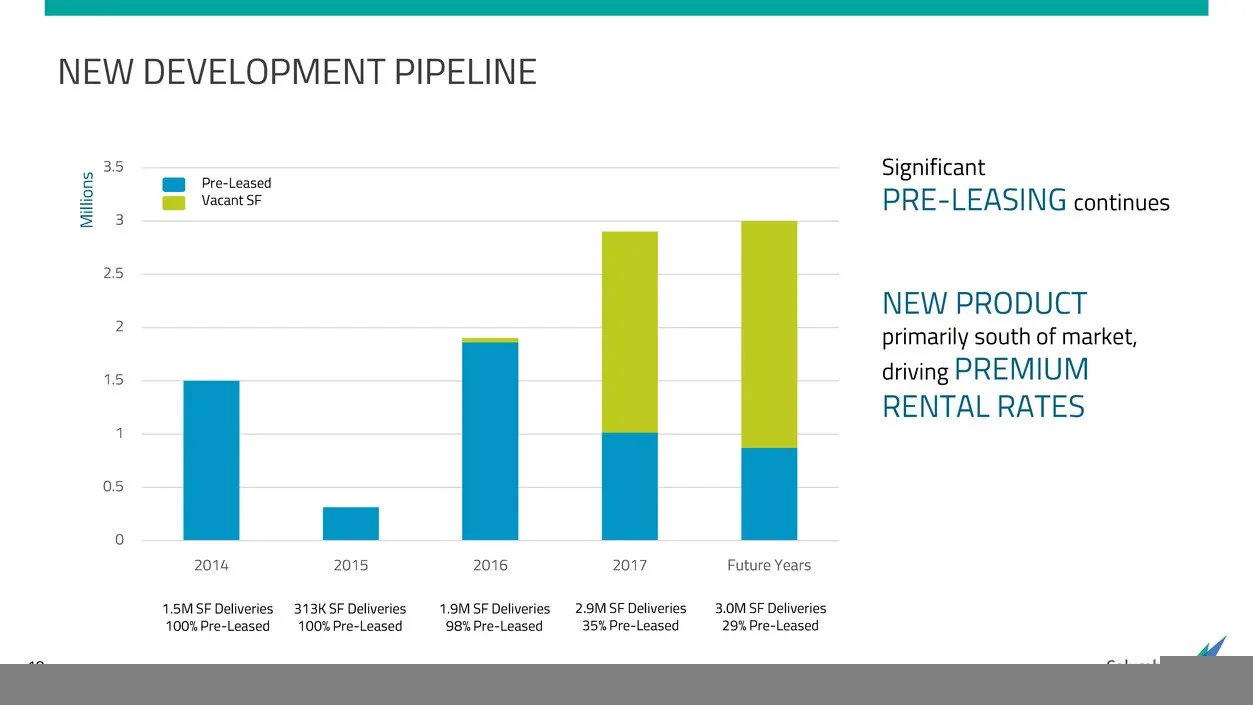
18 NEW DEVELOPMENT PIPELINE Significant PRE-LEASING continues NEW PRODUCT primarily south of market, driving PREMIUM RENTAL RATES 0 0.5 1 1.5 2 2.5 3 3.5 2014 2015 2016 2017 Future Years M ill io ns 1.5M SF Deliveries 100% Pre-Leased 313K SF Deliveries 100% Pre-Leased 1.9M SF Deliveries 98% Pre-Leas
Slide 19: Columbia Presence: San Francisco
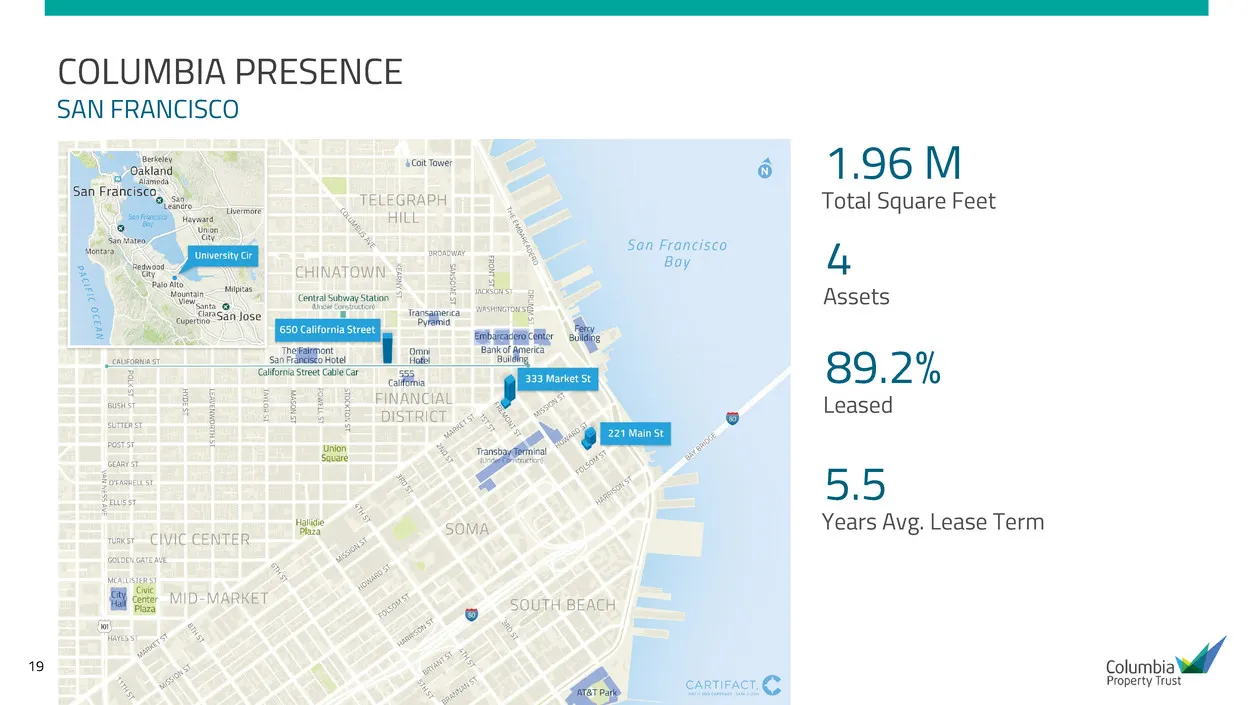
19 COLUMBIA PRESENCE 1.96 M Total Square Feet SAN FRANCISCO 4 Assets 89.2% Leased 5.5 Years Avg. Lease Term
Slide 20: Columbia Tenant Industry Mix: San Francisco
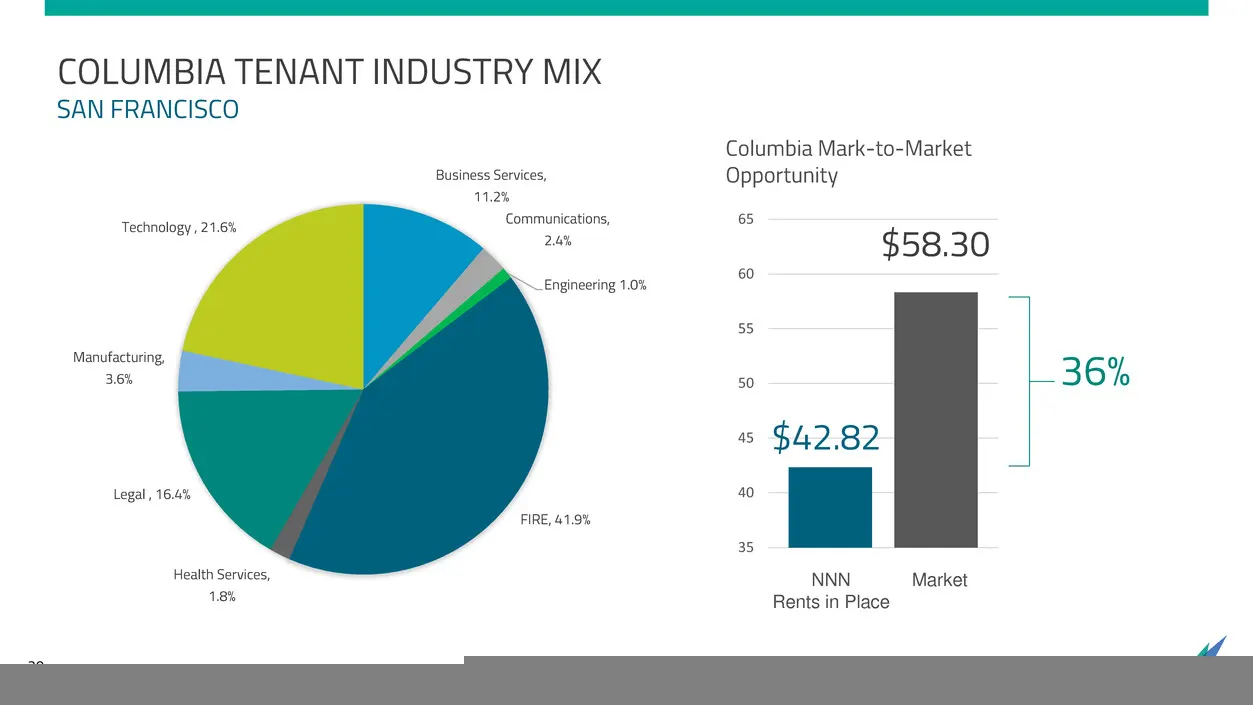
20 COLUMBIA TENANT INDUSTRY MIX SAN FRANCISCO 35 40 45 50 55 60 65 Columbia Mark-to-Market Opportunity NNN Rents in Place Market $42.82 $58.30 36% Business Services, 11.2% Communications, 2.4% Engineering 1.0% FIRE, 41.9% Health Services, 1.8% Legal , 16.4% Manufacturing, 3.6% Technology , 21.6%
Slide 21: Main Street San Francisco
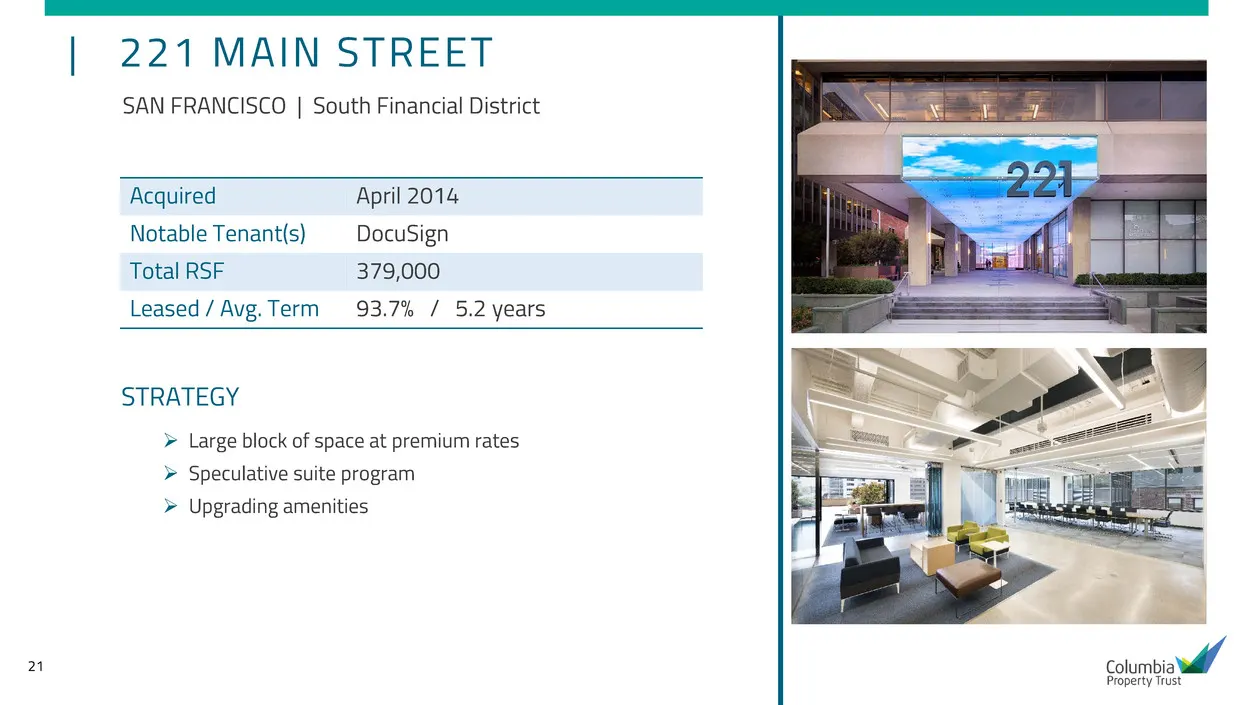
21 | 221 MAIN STREET SAN FRANCISCO | South Financial District Acquired April 2014 Notable Tenant(s) DocuSign Total RSF 379,000 Leased / Avg. Term 93.7% / 5.2 years STRATEGY Large block of space at premium rates Speculative suite program Upgrading amenities
Slide 22: California Street San Francisco
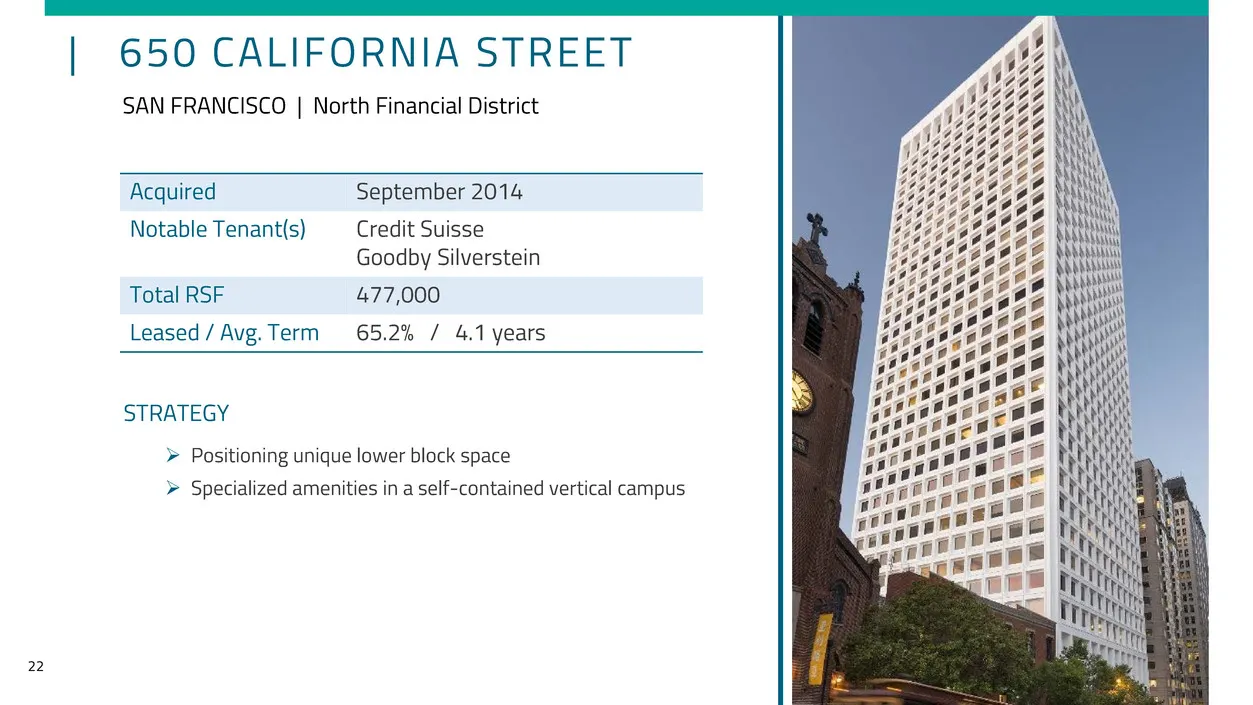
22 | 650 CALIFORNIA STREET SAN FRANCISCO | North Financial District Acquired September 2014 Notable Tenant(s) Credit Suisse Goodby Silverstein Total RSF 477,000 Leased / Avg. Term 65.2% / 4.1 years STRATEGY Positioning unique lower block space Specialized amenities in a self-contained vertical c
Slide 23: Market San Francisco
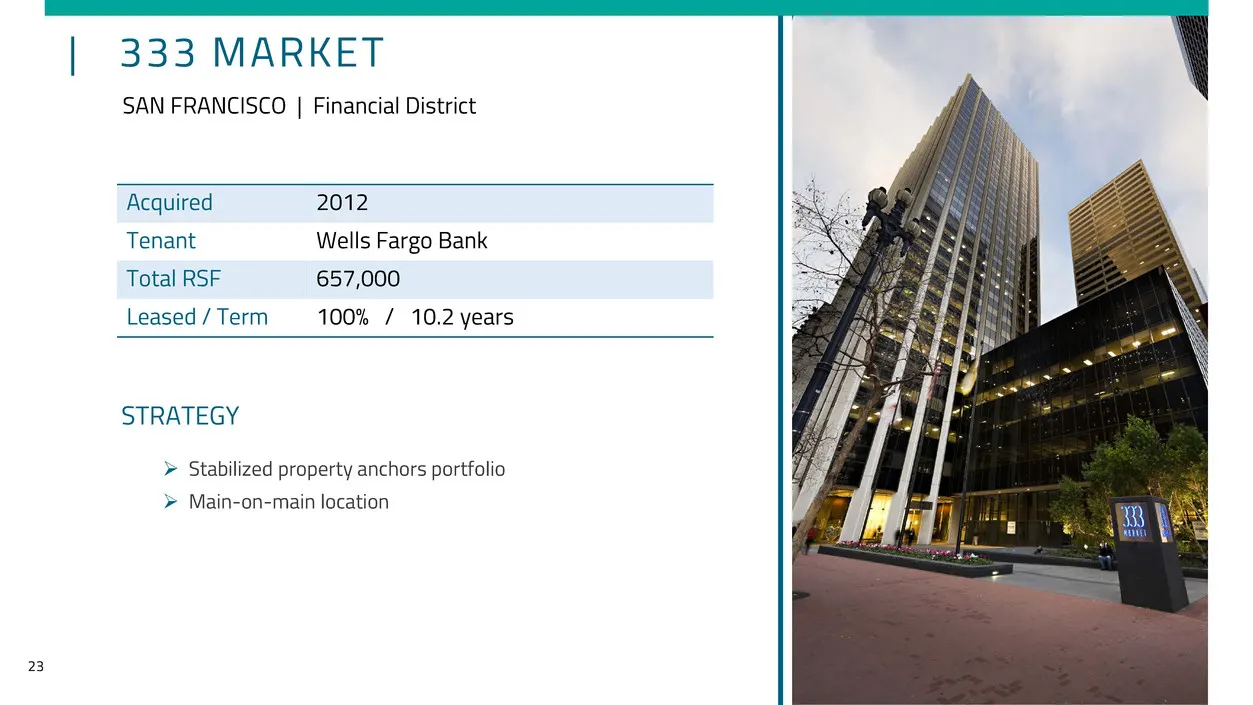
23 | 333 MARKET SAN FRANCISCO | Financial District Acquired 2012 Tenant Wells Fargo Bank Total RSF 657,000 Leased / Term 100% / 10.2 years STRATEGY Stabilized property anchors portfolio Main-on-main location
Slide 24: University Circle San Francisco
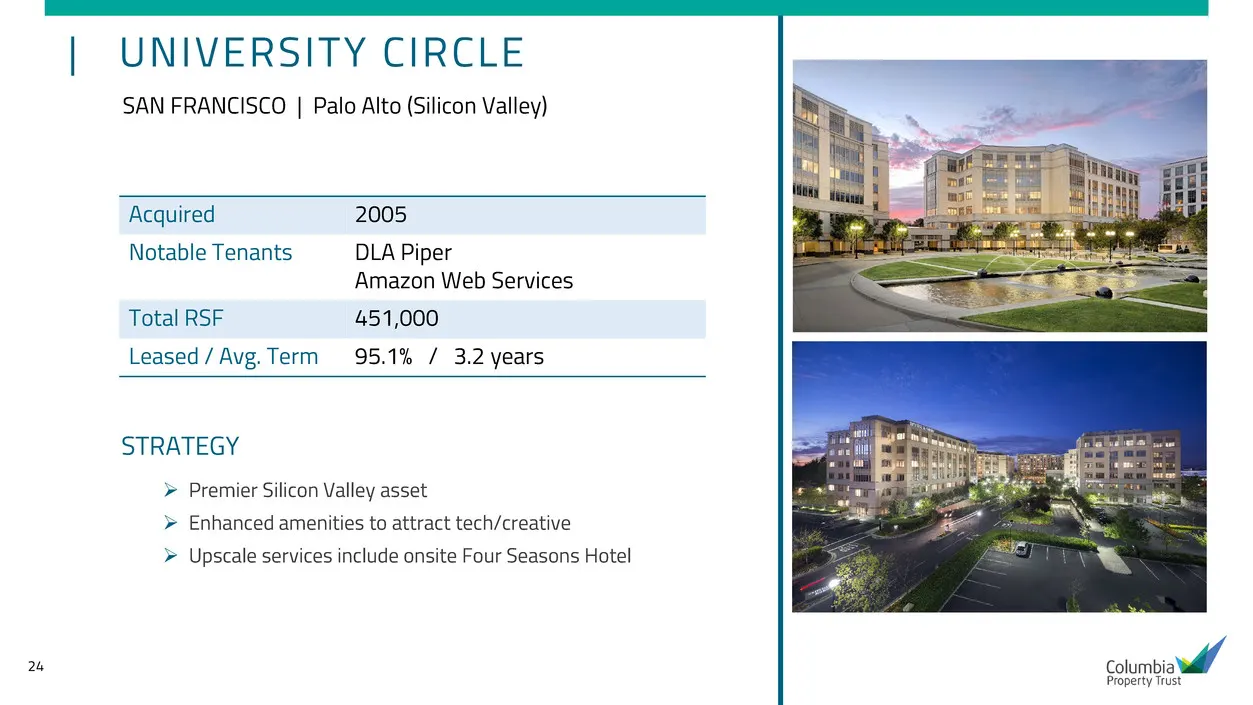
24 | UNIVERSITY CIRCLE SAN FRANCISCO | Palo Alto (Silicon Valley) Acquired 2005 Notable Tenants DLA Piper Amazon Web Services Total RSF 451,000 Leased / Avg. Term 95.1% / 3.2 years STRATEGY Premier Silicon Valley asset Enhanced amenities to attract tech/creative Upscale services include onsite
Slide 25: Washington, D.C. Market Overview
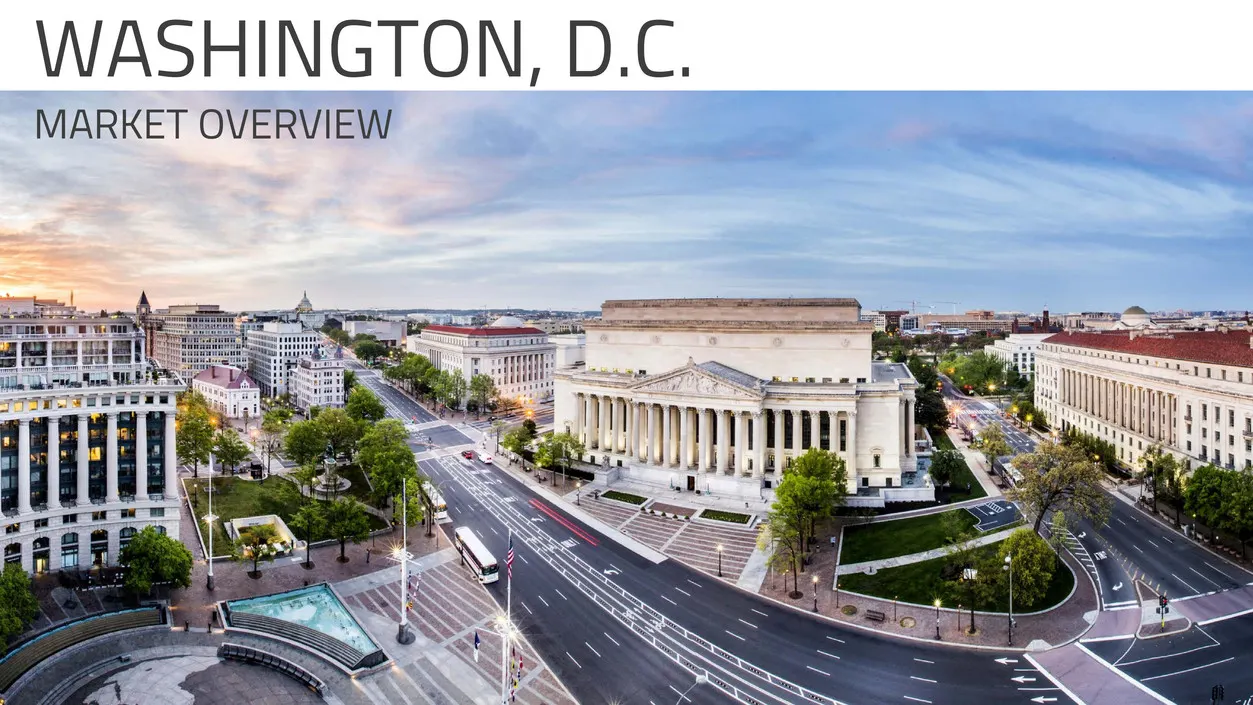
25 WASHINGTON, D.C. MARKET OVERVIEW
Slide 26: Historical Vacancy vs. Rental Rates: Washington, D.C.
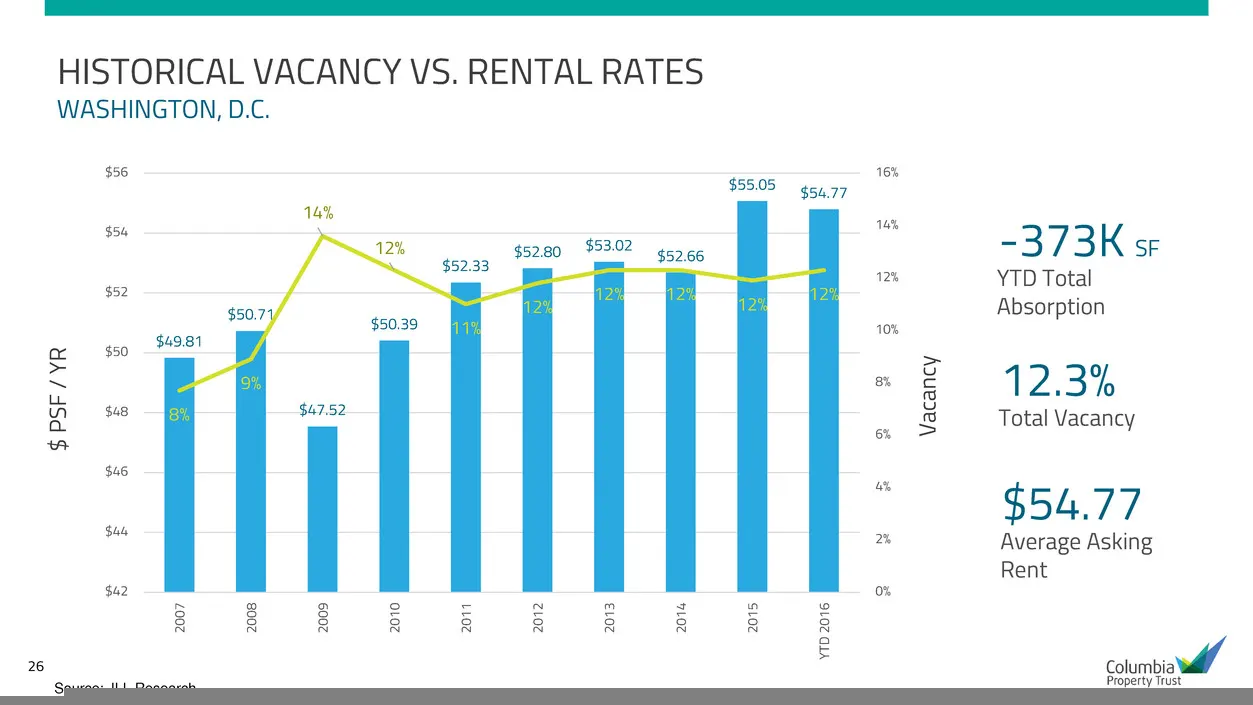
26 HISTORICAL VACANCY VS. RENTAL RATES WASHINGTON, D.C. $49.81 $50.71 $47.52 $50.39 $52.33 $52.80 $53.02 $52.66 $55.05 $54.77 8% 9% 14% 12% 11% 12% 12% 12% 12% 12% 0% 2% 4% 6% 8% 10% 12% 14% 16% $42 $44 $46 $48 $50 $52 $54 $56 20 07 20 08 20 09 20 10 20 11 20 12 20 13 20 14 20 15 YT D 2 01 6 Source:
Slide 27: Class-A Supply: Washington, D.C.
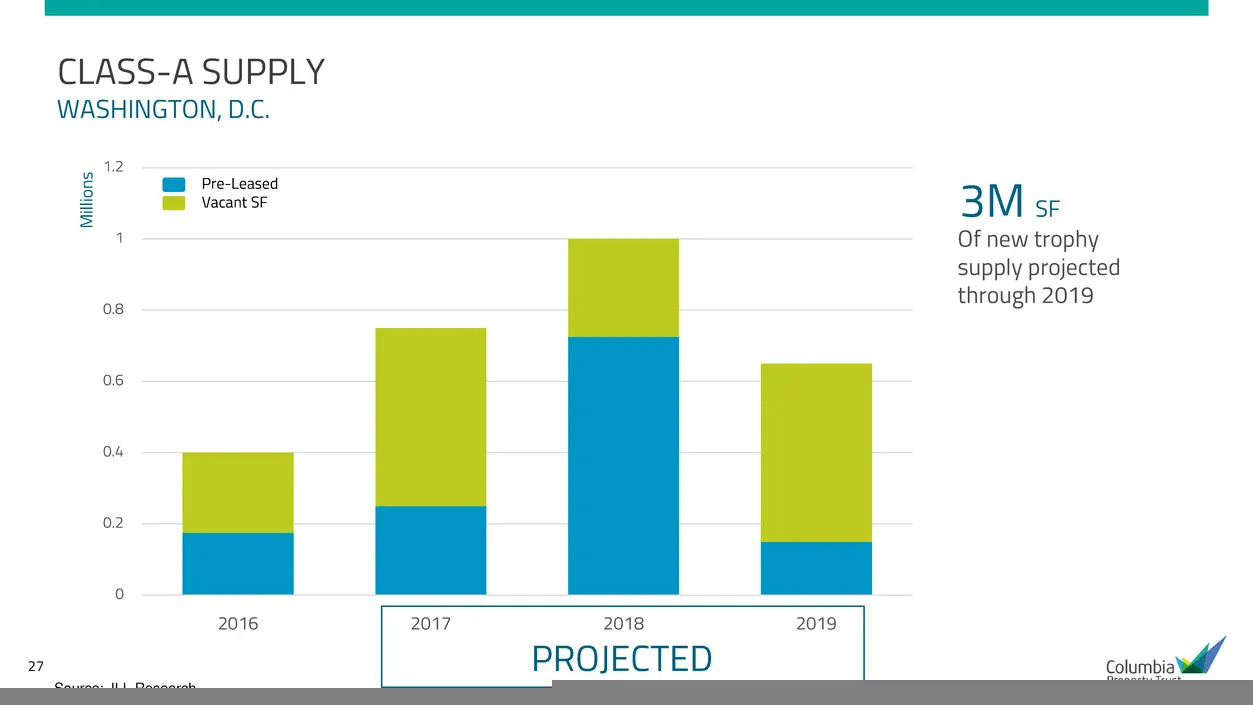
27 CLASS-A SUPPLY WASHINGTON, D.C. 3M SF Of new trophy supply projected through 2019 0 0.2 0.4 0.6 0.8 1 1.2 2016 2017 2018 2019 M ill io ns Pre-Leased Vacant SF PROJECTED Source: JLL Research
Slide 28: Columbia Presence: Washington, D.C.
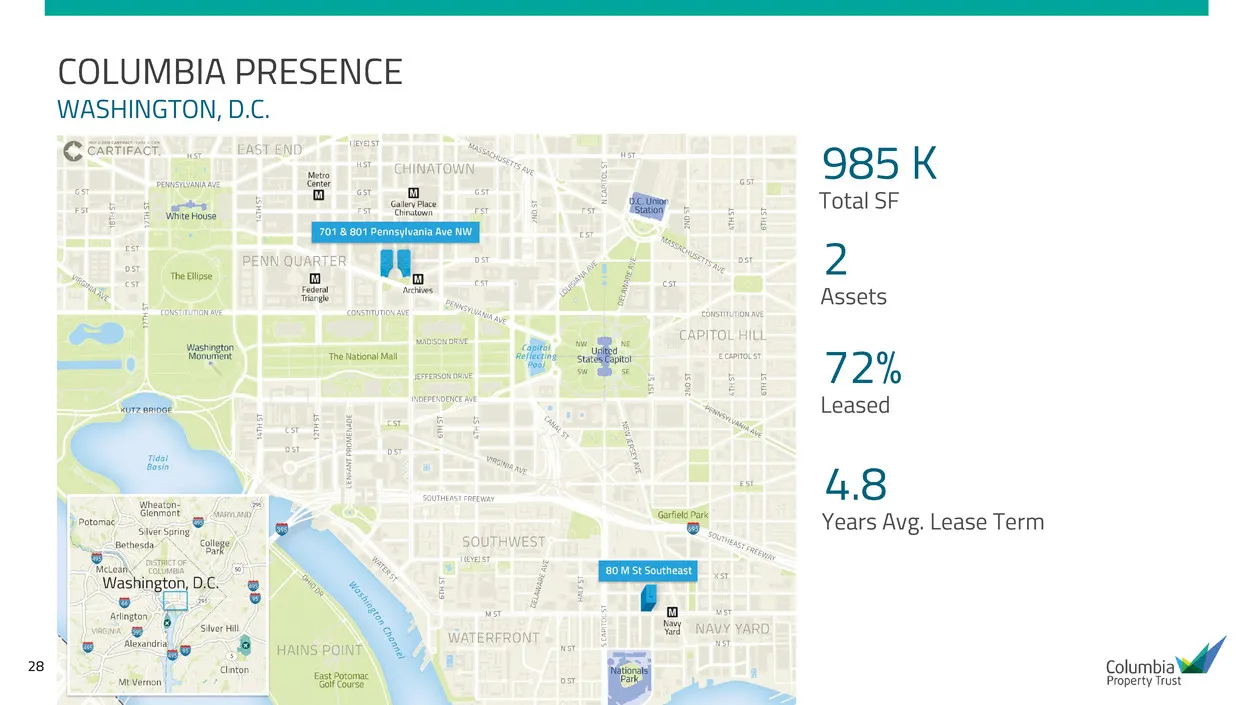
28 COLUMBIA PRESENCE 985 K Total SF WASHINGTON, D.C. 2 Assets 72% Leased 4.8 Years Avg. Lease Term
Slide 29: Columbia Tenant Industry Mix: Washington, D.C.
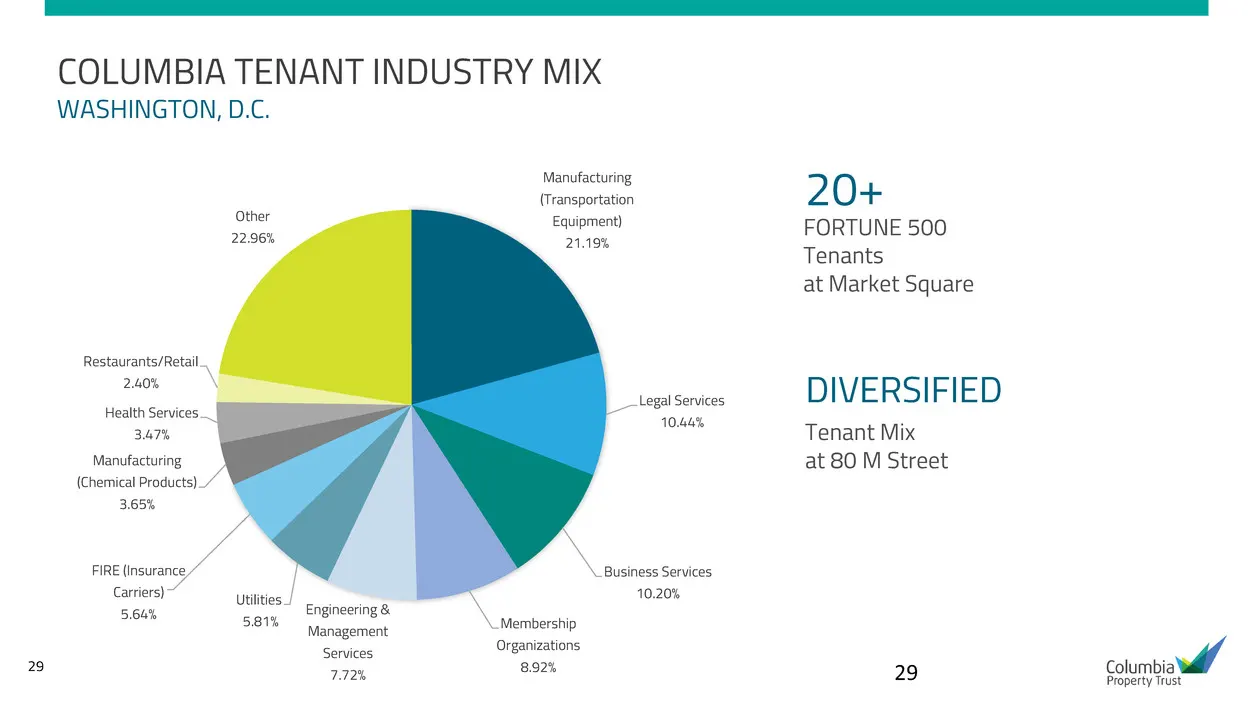
29 COLUMBIA TENANT INDUSTRY MIX WASHINGTON, D.C. Manufacturing (Transportation Equipment) 21.19% Legal Services 10.44% Business Services 10.20% Membership Organizations 8.92% Engineering & Management Services 7.72% Utilities 5.81% FIRE (Insurance Carriers) 5.64% Manufacturing (Chemical Products) 3.6
Slide 30: Market Square Washington, D.C.
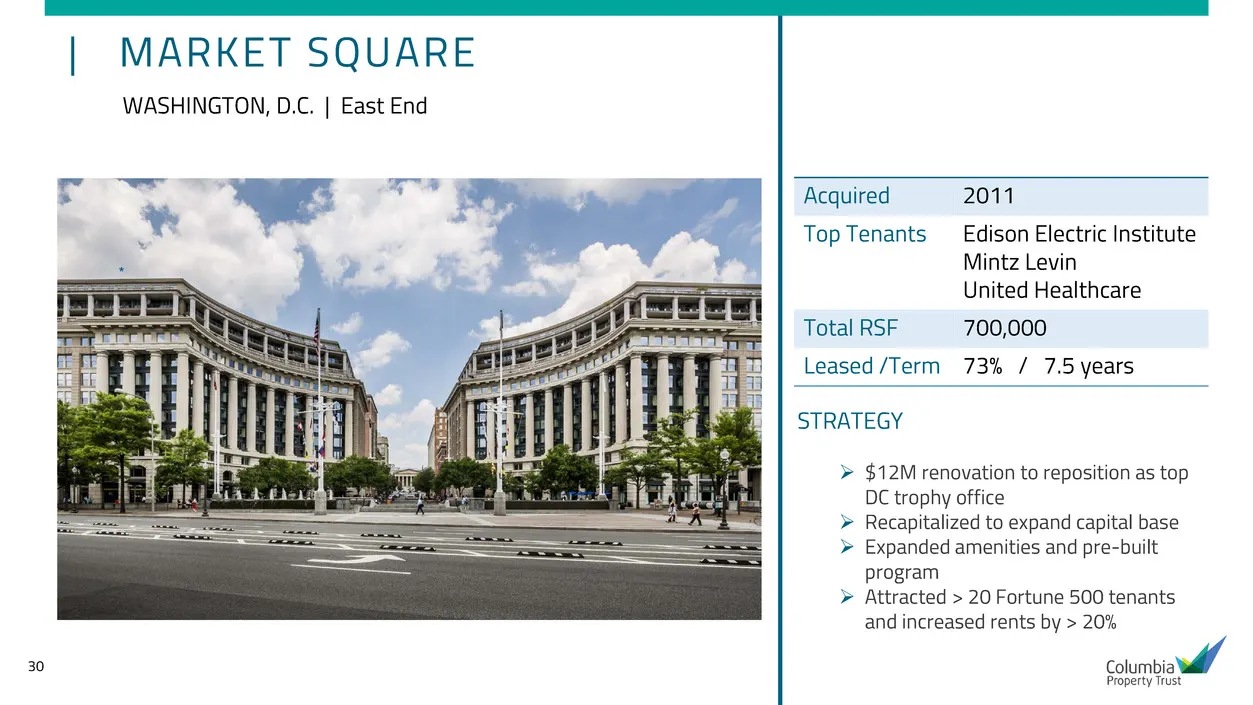
30 | MARKET SQUARE WASHINGTON, D.C. | East End Acquired 2011 Top Tenants Edison Electric Institute Mintz Levin United Healthcare Total RSF 700,000 Leased /Term 73% / 7.5 years * STRATEGY $12M renovation to reposition as top DC trophy office Recapitalized to expand capital base Expanded ameniti
Slide 31: Market Square Renovations
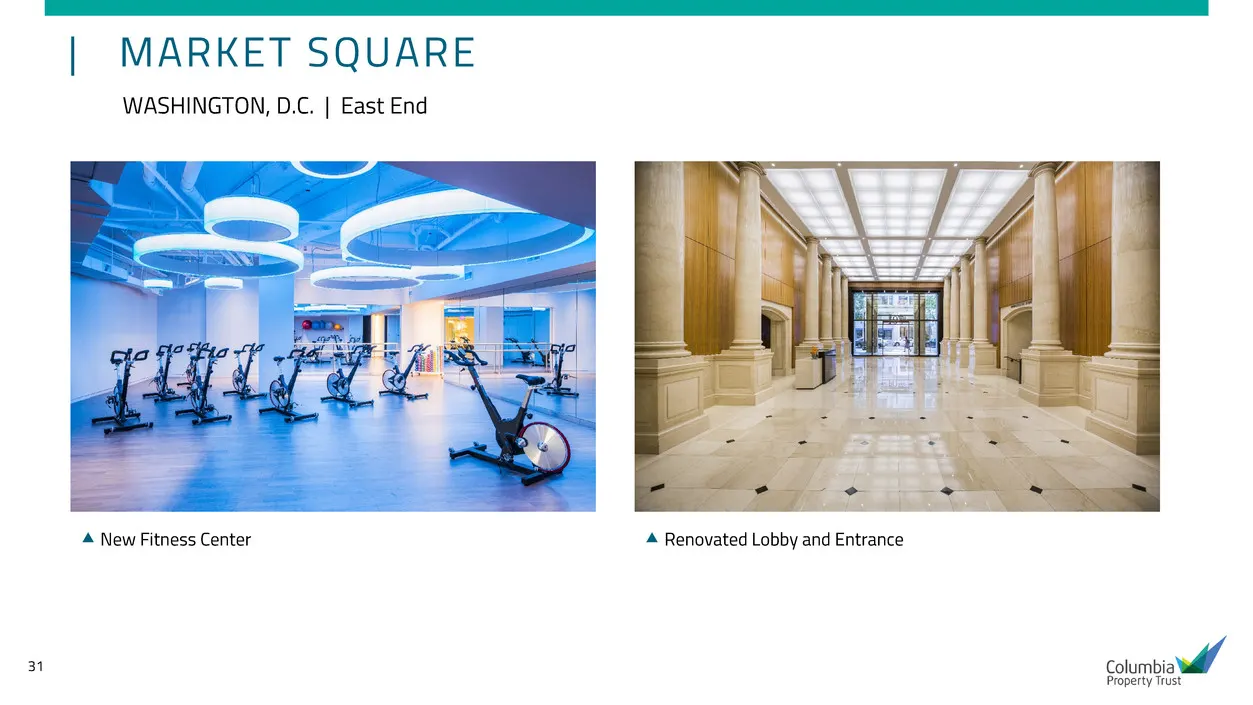
31 | MARKET SQUARE WASHINGTON, D.C. | East End New Fitness Center Renovated Lobby and Entrance
Slide 32: M Street
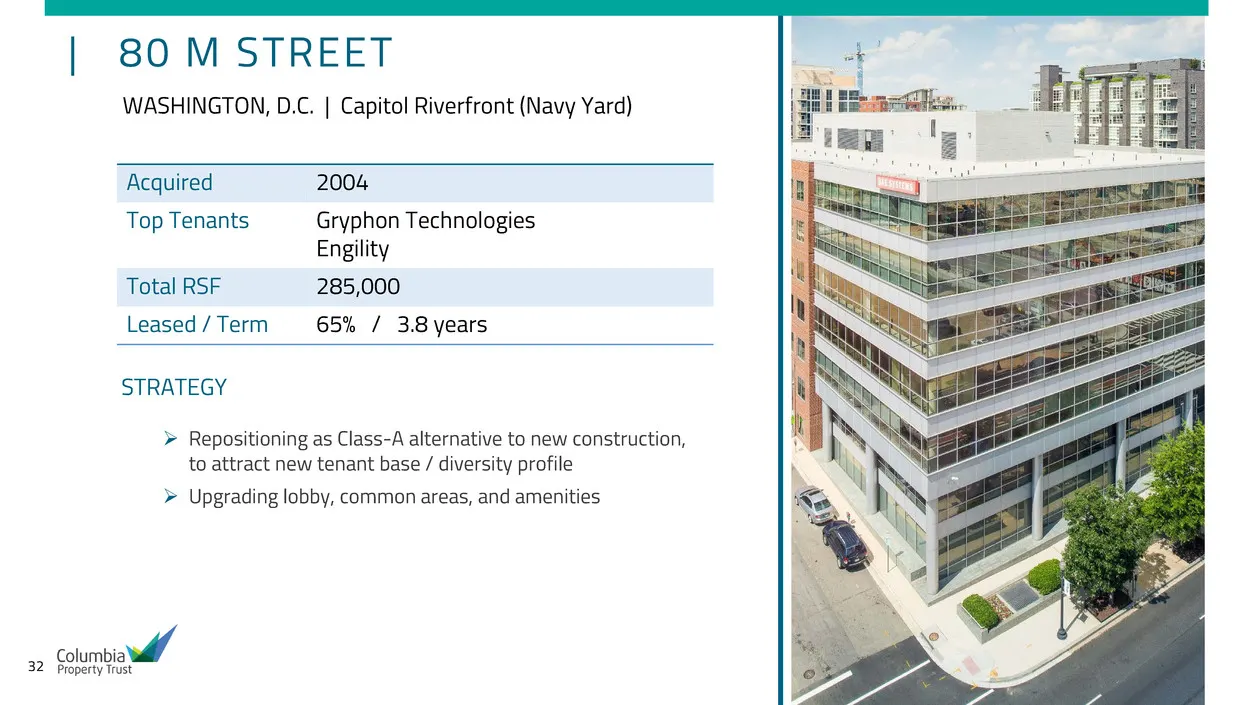
32 | 80 M STREET Acquired 2004 Top Tenants Gryphon Technologies Engility Total RSF 285,000 Leased / Term 65% / 3.8 years WASHINGTON, D.C. | Capitol Riverfront (Navy Yard) STRATEGY Repositioning as Class-A alternative to new construction, to attract new tenant base / diversity profile Upgrading l
Slide 33: M Street Renovations
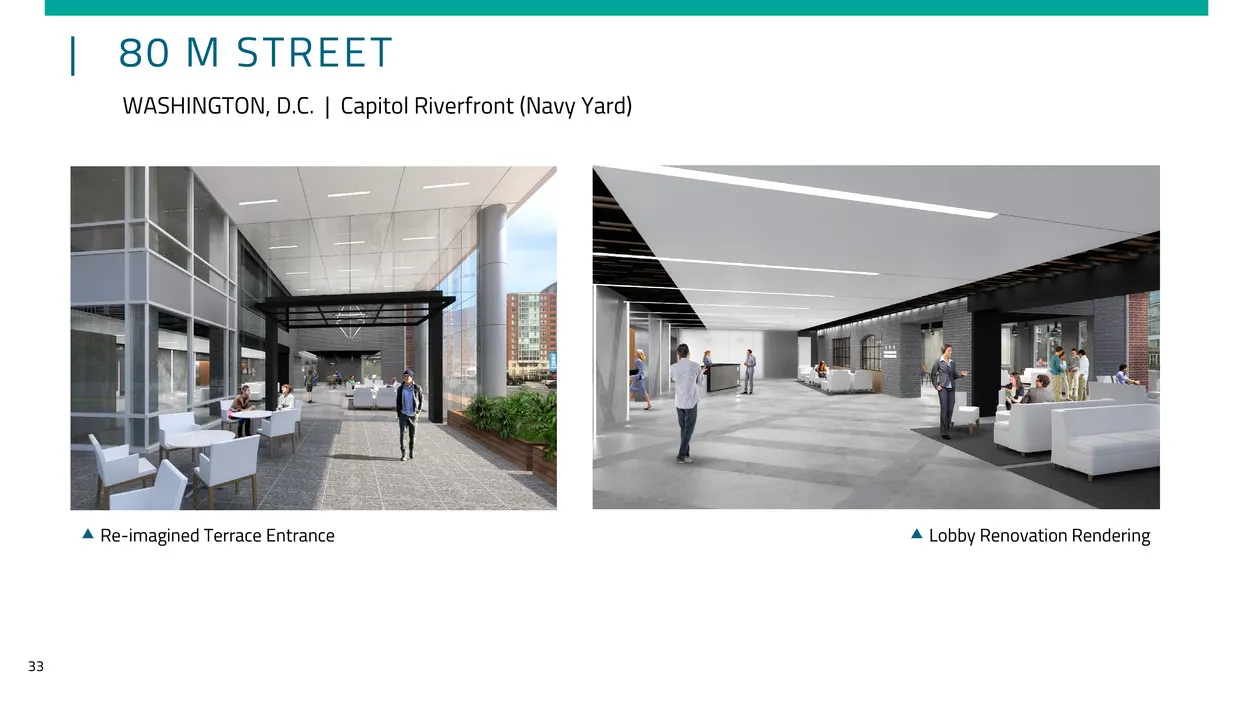
33 | 80 M STREET WASHINGTON, D.C. | Capitol Riverfront (Navy Yard) Re-imagined Terrace Entrance Lobby Renovation Rendering
Slide 34: New York Market Overview
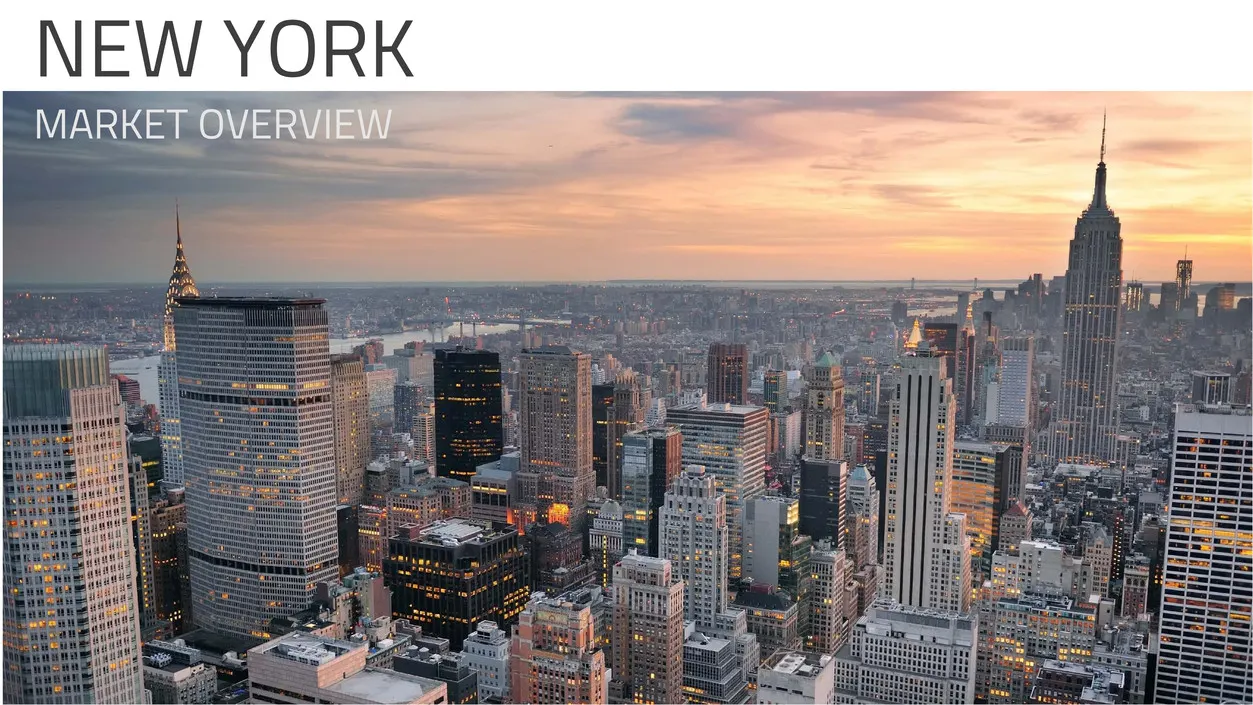
34 NEW YORK MARKET OVERVIEW
Slide 35: Historical Vacancy vs. Rental Rates: New York
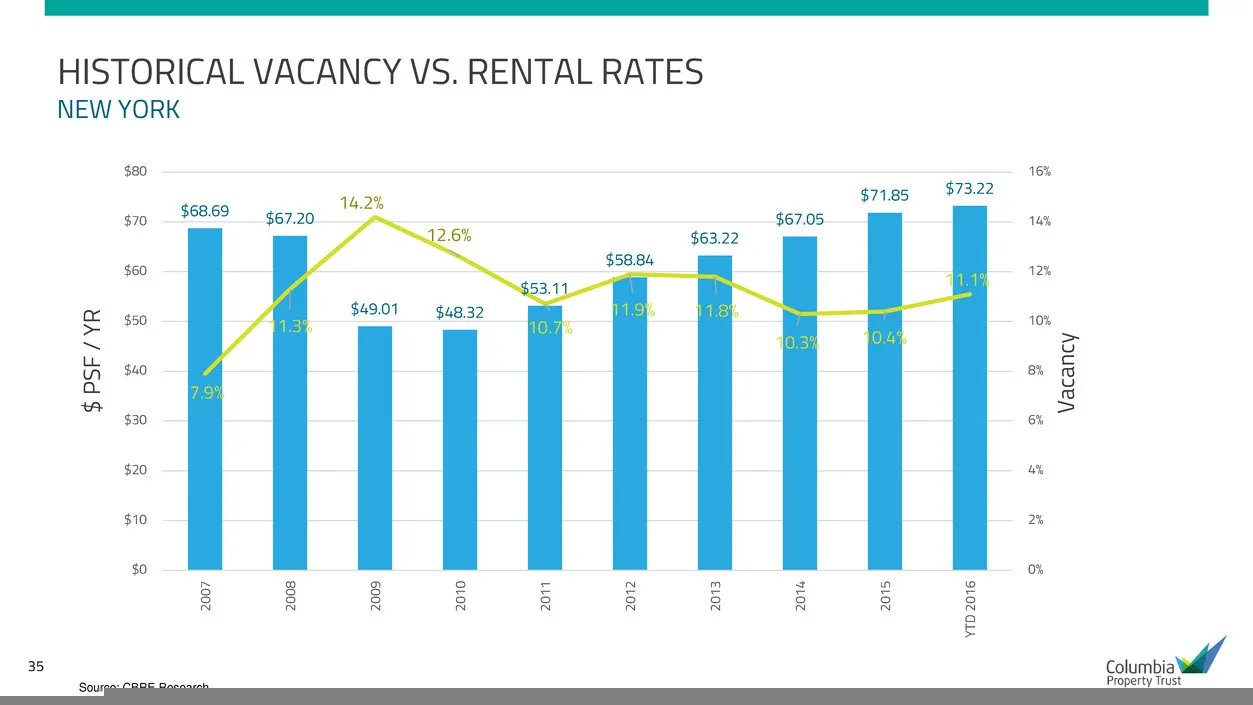
35 HISTORICAL VACANCY VS. RENTAL RATES NEW YORK Source: CBRE Research $68.69 $67.20 $49.01 $48.32 $53.11 $58.84 $63.22 $67.05 $71.85 $73.22 7.9% 11.3% 14.2% 12.6% 10.7% 11.9% 11.8% 10.3% 10.4% 11.1% 0% 2% 4% 6% 8% 10% 12% 14% 16% $0 $10 $20 $30 $40 $50 $60 $70 $80 20 07 20 08 20 09 20 10 20 11 20 12
Slide 36: New Development Pipeline 2016-2021
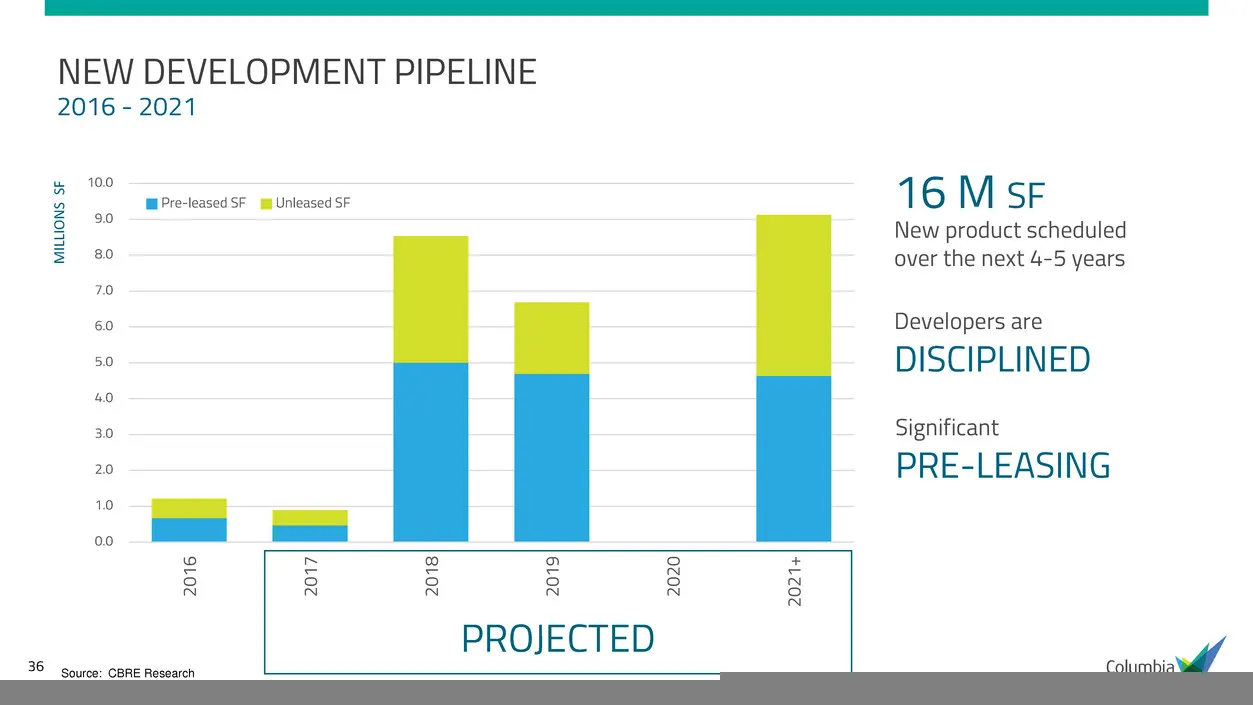
36 NEW DEVELOPMENT PIPELINE 2016 - 2021 0.0 1.0 2.0 3.0 4.0 5.0 6.0 7.0 8.0 9.0 10.0 20 16 20 17 20 18 20 19 20 20 20 21 + Pre-leased SF Unleased SF M IL LI O N S S F Source: CBRE Research 16 M SF New product scheduled over the next 4-5 years DISCIPLINED Developers are PRE-LEASING Significant PROJEC
Slide 37: Occupancy by Industry: Manhattan
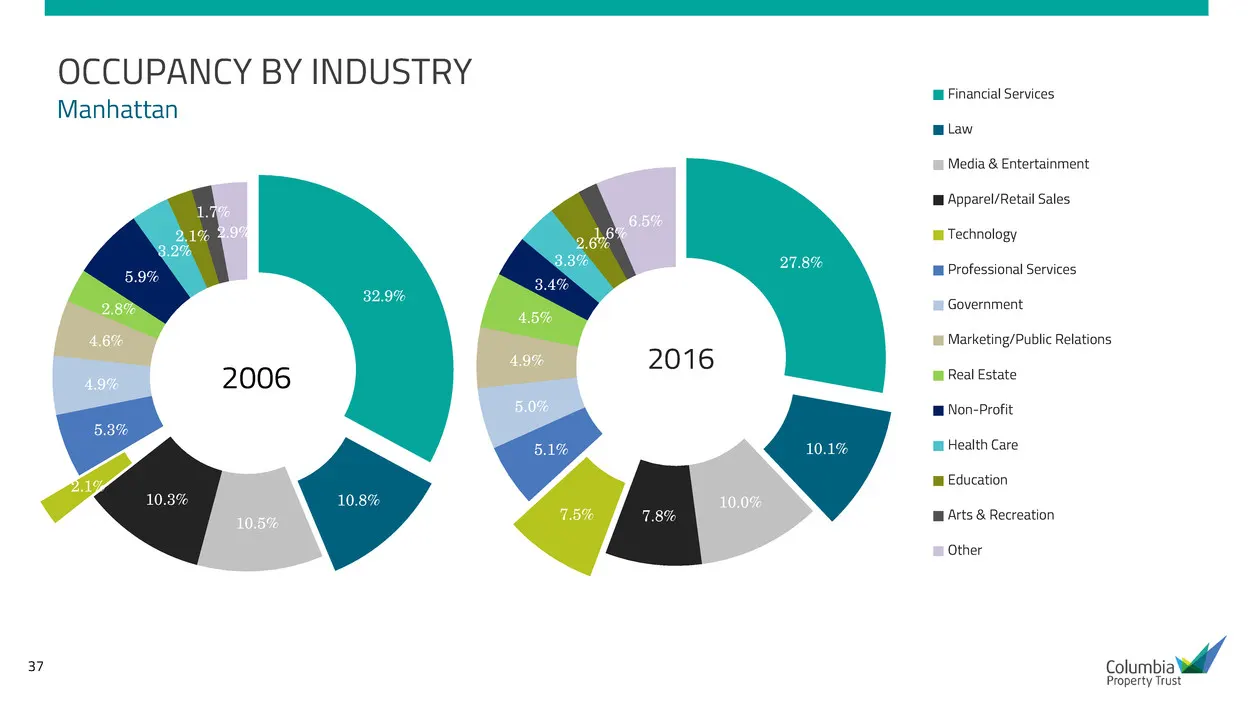
37 32.9% 10.8% 10.5% 10.3% 2.1% 5.3% 4.9% 4.6% 2.8% 5.9% 3.2% 2.1% 1.7% 2.9% Financial Services Law Media & Entertainment Apparel/Retail Sales Technology Professional Services Government Marketing/Public Relations Real Estate Non-Profit Health Care Education Arts & Recreation Other 2006 OCCUPANCY BY
Slide 38: Columbia Presence: New York
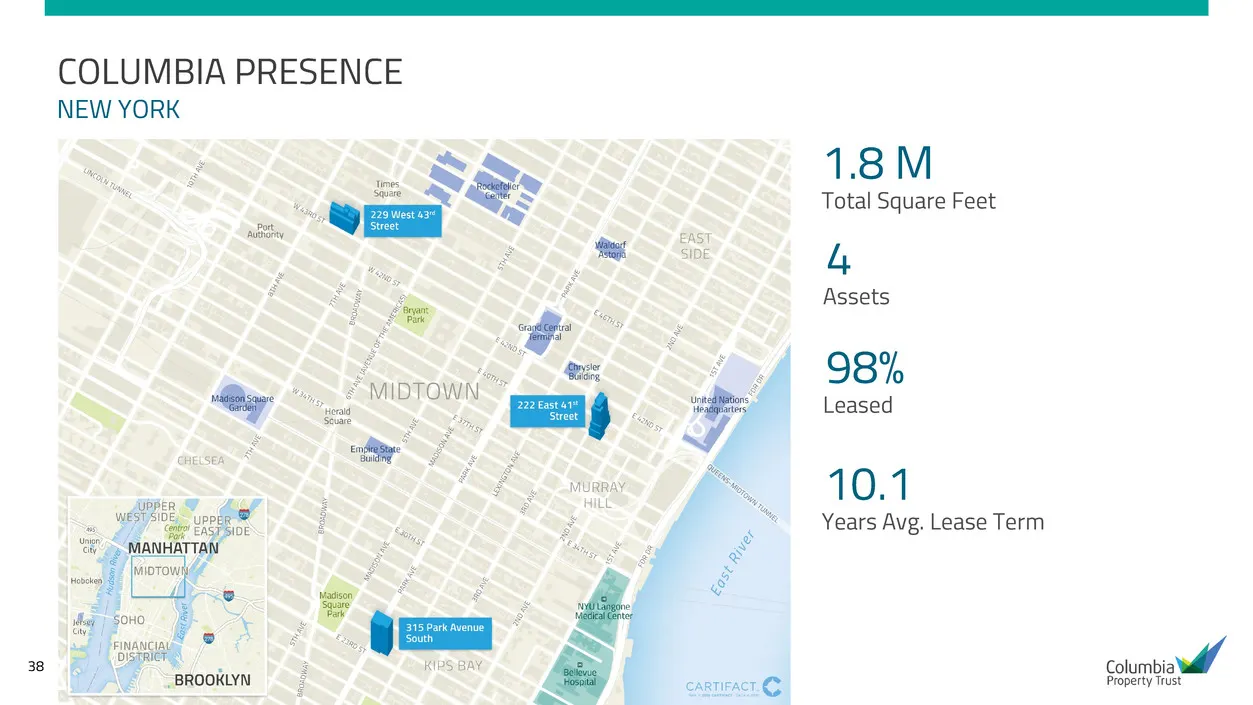
38 COLUMBIA PRESENCE 1.8 M Total Square Feet NEW YORK 4 Assets 98% Leased 10.1 Years Avg. Lease Term
Slide 39: West 43rd Street New York
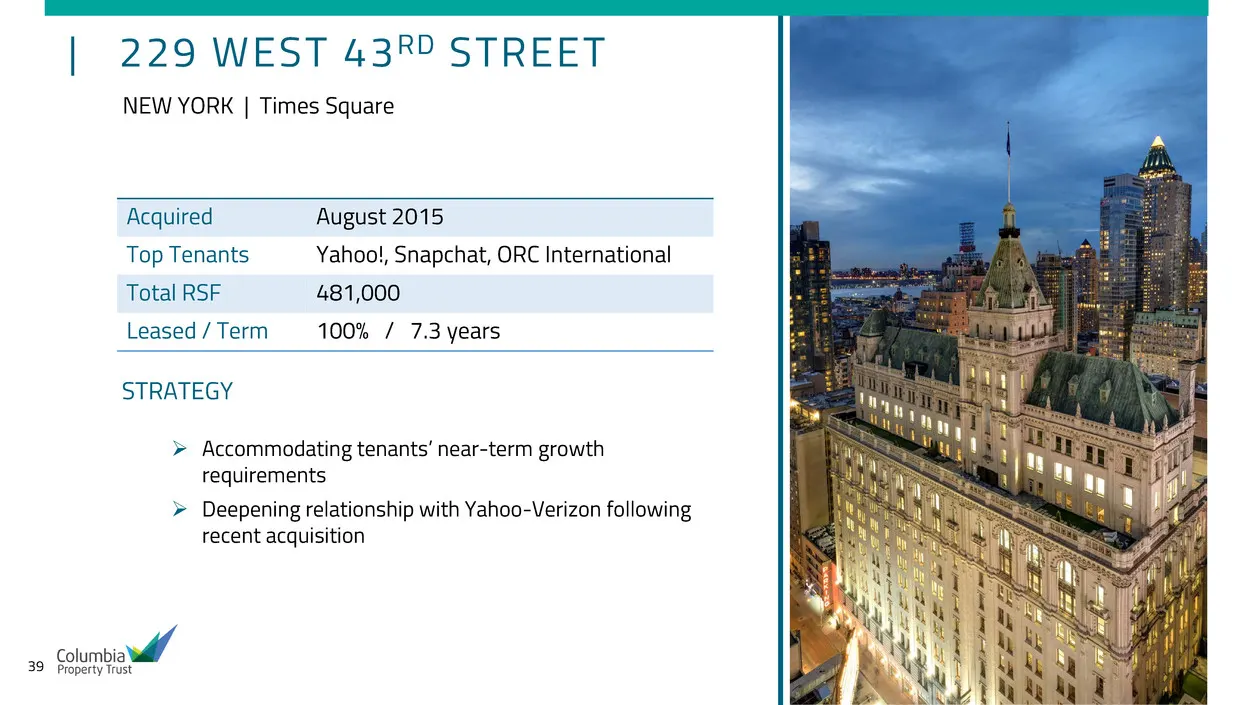
39 | 229 WEST 43RD STREET NEW YORK | Times Square Acquired August 2015 Top Tenants Yahoo!, Snapchat, ORC International Total RSF 481,000 Leased / Term 100% / 7.3 years STRATEGY Accommodating tenants’ near-term growth requirements Deepening relationship with Yahoo-Verizon following recent acquisi
Slide 40: Park Avenue South New York
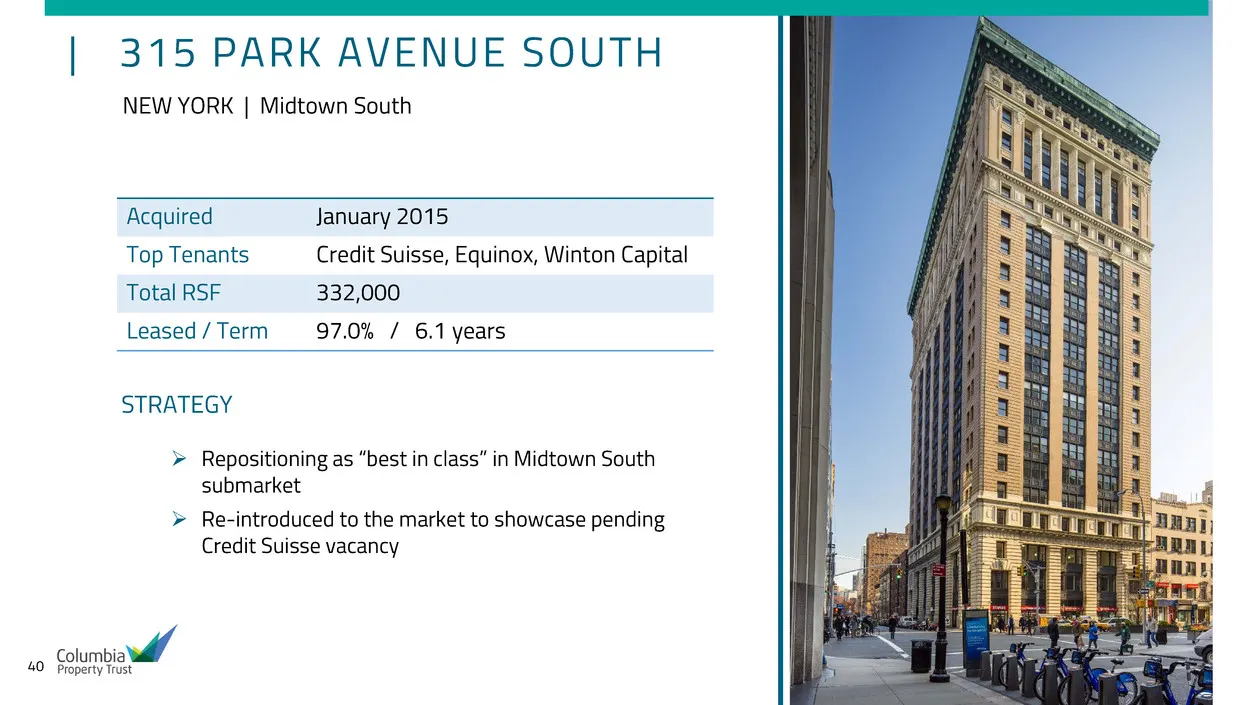
40 | 315 PARK AVENUE SOUTH NEW YORK | Midtown South Acquired January 2015 Top Tenants Credit Suisse, Equinox, Winton Capital Total RSF 332,000 Leased / Term 97.0% / 6.1 years STRATEGY Repositioning as “best in class” in Midtown South submarket Re-introduced to the market to showcase pending Cred
Slide 41: Park Avenue South Lobby Before and After
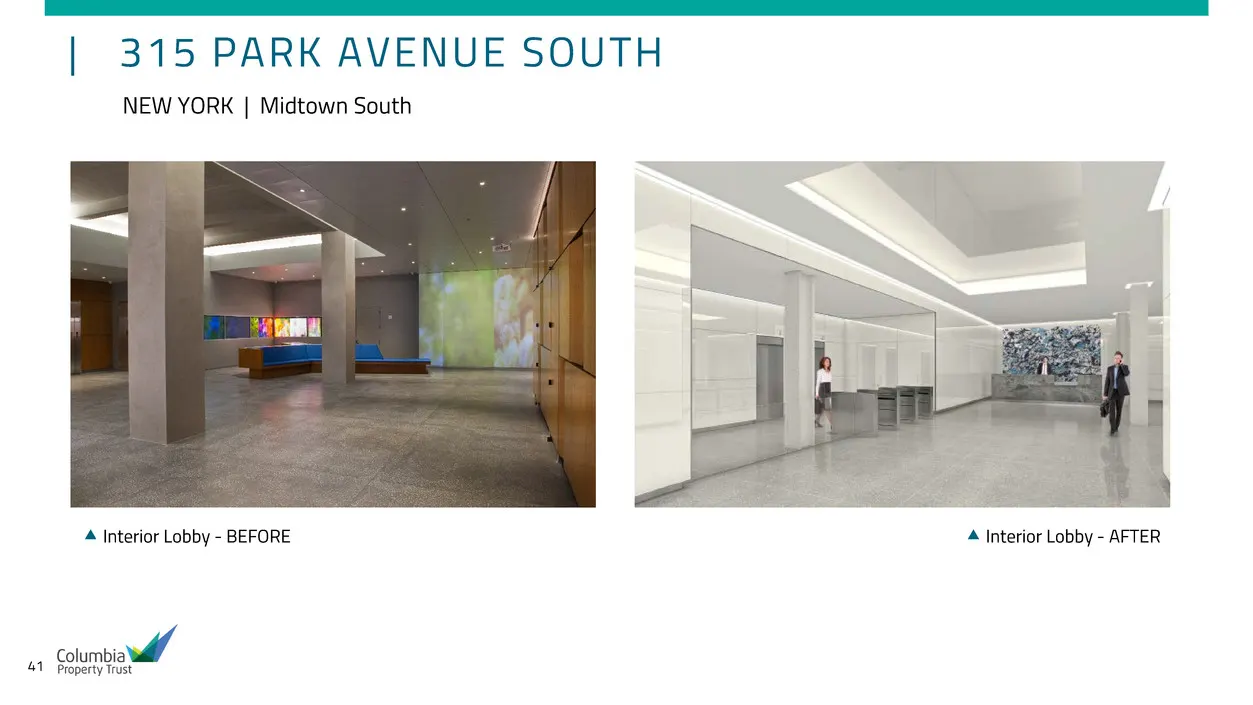
41 | 315 PARK AVENUE SOUTH NEW YORK | Midtown South Interior Lobby - BEFORE Interior Lobby - AFTER
Slide 42: East 41st Street New York
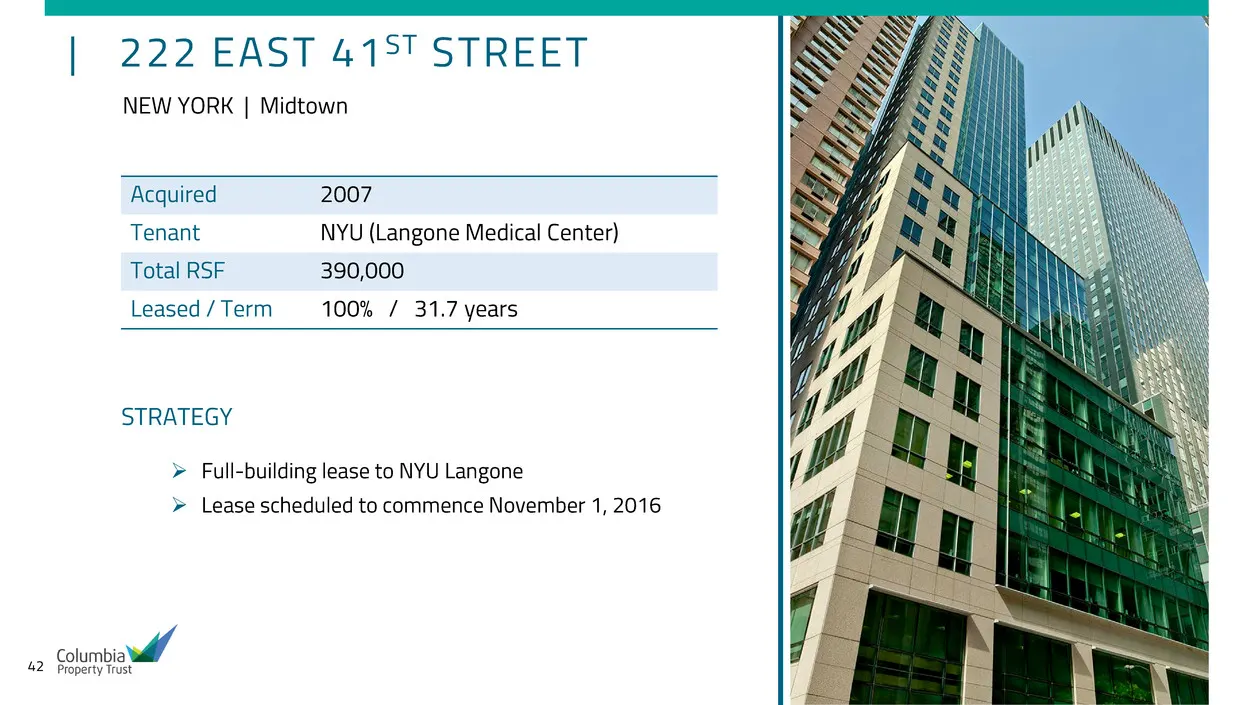
42 | 222 EAST 41ST STREET NEW YORK | Midtown Acquired 2007 Tenant NYU (Langone Medical Center) Total RSF 390,000 Leased / Term 100% / 31.7 years STRATEGY Full-building lease to NYU Langone Lease scheduled to commence November 1, 2016
Slide 43: Columbus New York
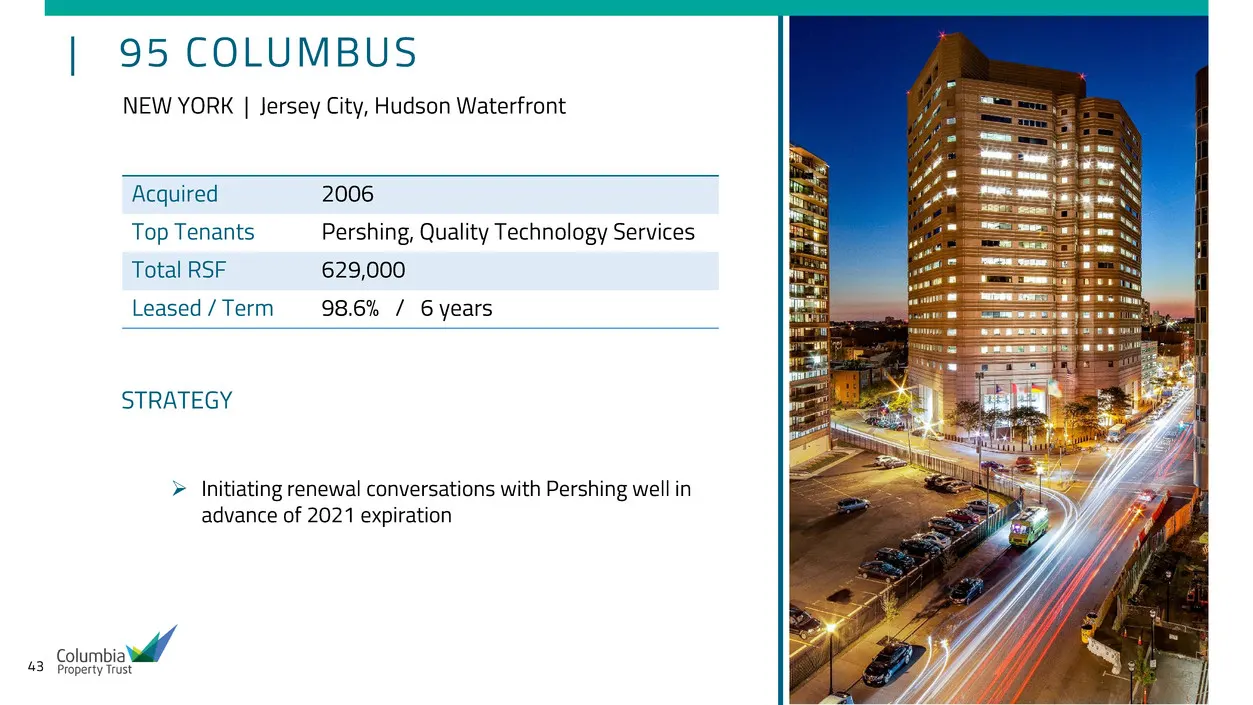
43 | 95 COLUMBUS NEW YORK | Jersey City, Hudson Waterfront Acquired 2006 Top Tenants Pershing, Quality Technology Services Total RSF 629,000 Leased / Term 98.6% / 6 years STRATEGY Initiating renewal conversations with Pershing well in advance of 2021 expiration

Slide 44: Portfolio & Transactions
44 PORTFOLIO & TRANSACTIONS 44
Slide 45: Pending Sales
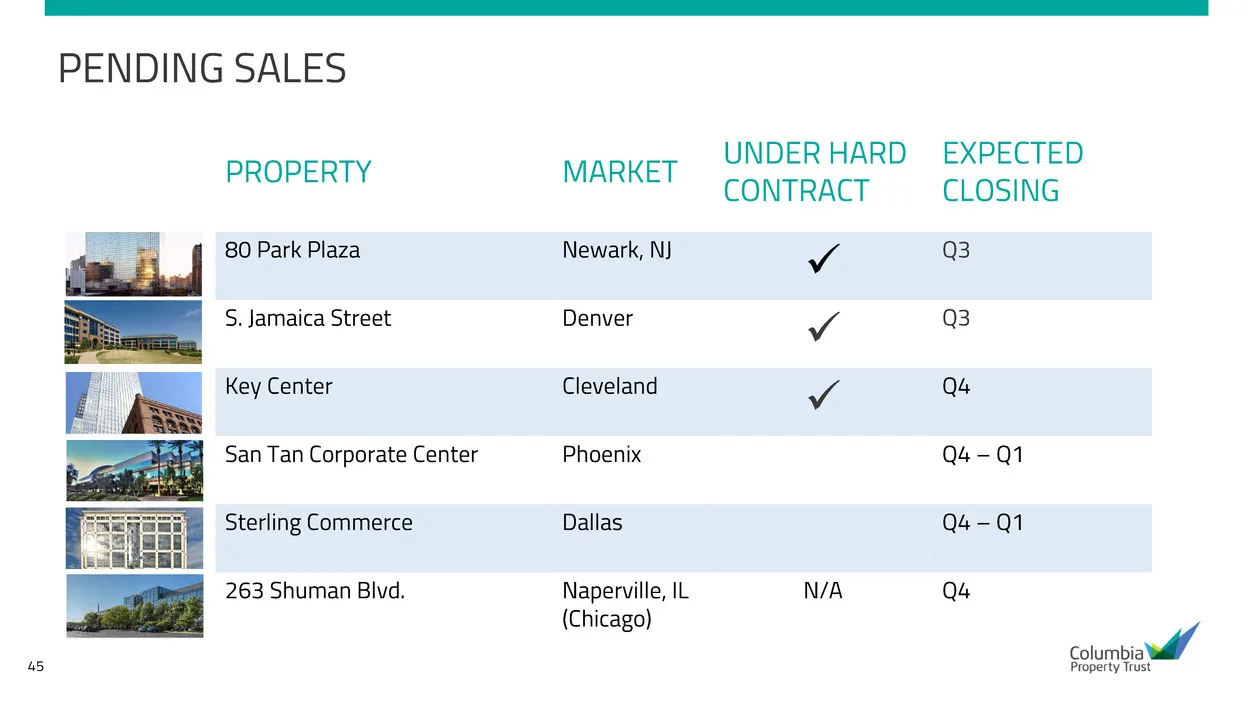
45 PENDING SALES PROPERTY MARKET UNDER HARD CONTRACT EXPECTED CLOSING 80 Park Plaza Newark, NJ Q3 S. Jamaica Street Denver Q3 Key Center Cleveland Q4 San Tan Corporate Center Phoenix Q4 – Q1 Sterling Commerce Dallas Q4 – Q1 263 Shuman Blvd. Naperville, IL (Chicago) N/A Q4
Slide 46: Maximizing Value Before Exit
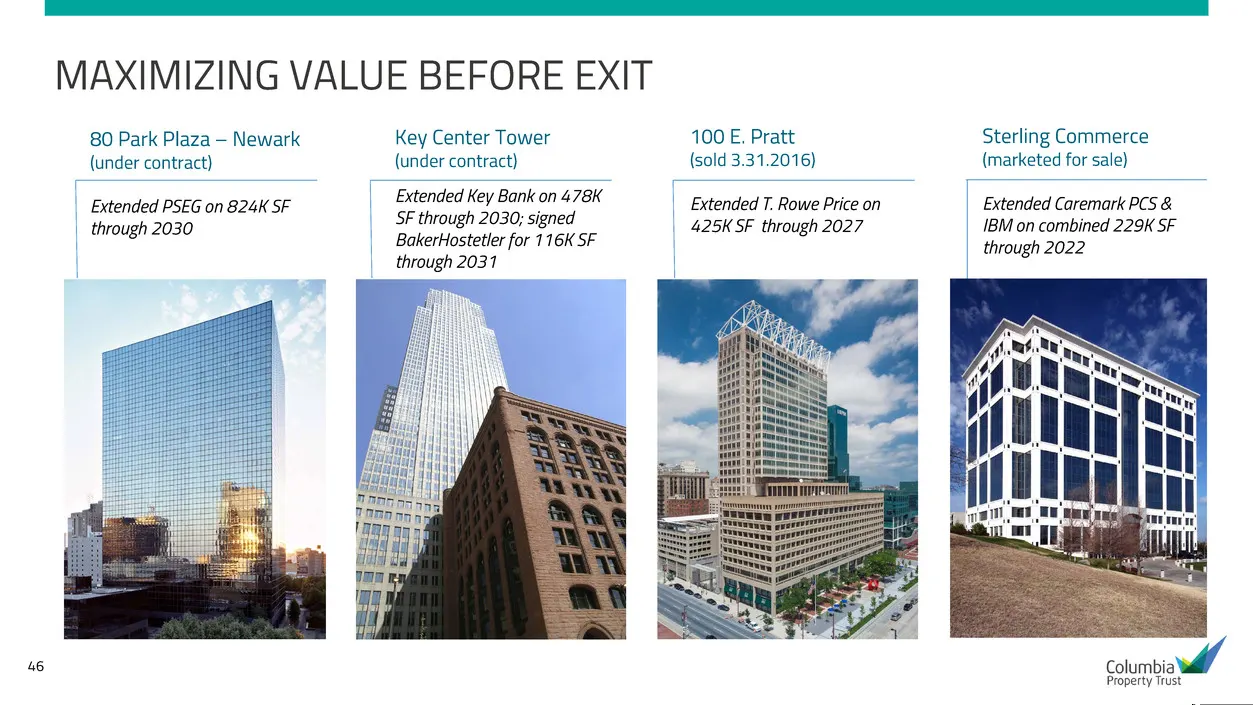
46 Sterling Commerce (marketed for sale) Extended Caremark PCS & IBM on combined 229K SF through 2022 80 Park Plaza – Newark (under contract) Extended PSEG on 824K SF through 2030 Key Center Tower (under contract) Extended Key Bank on 478K SF through 2030; signed BakerHostetler for 116K SF through 2
Slide 47: Maximizing Value Before Exit
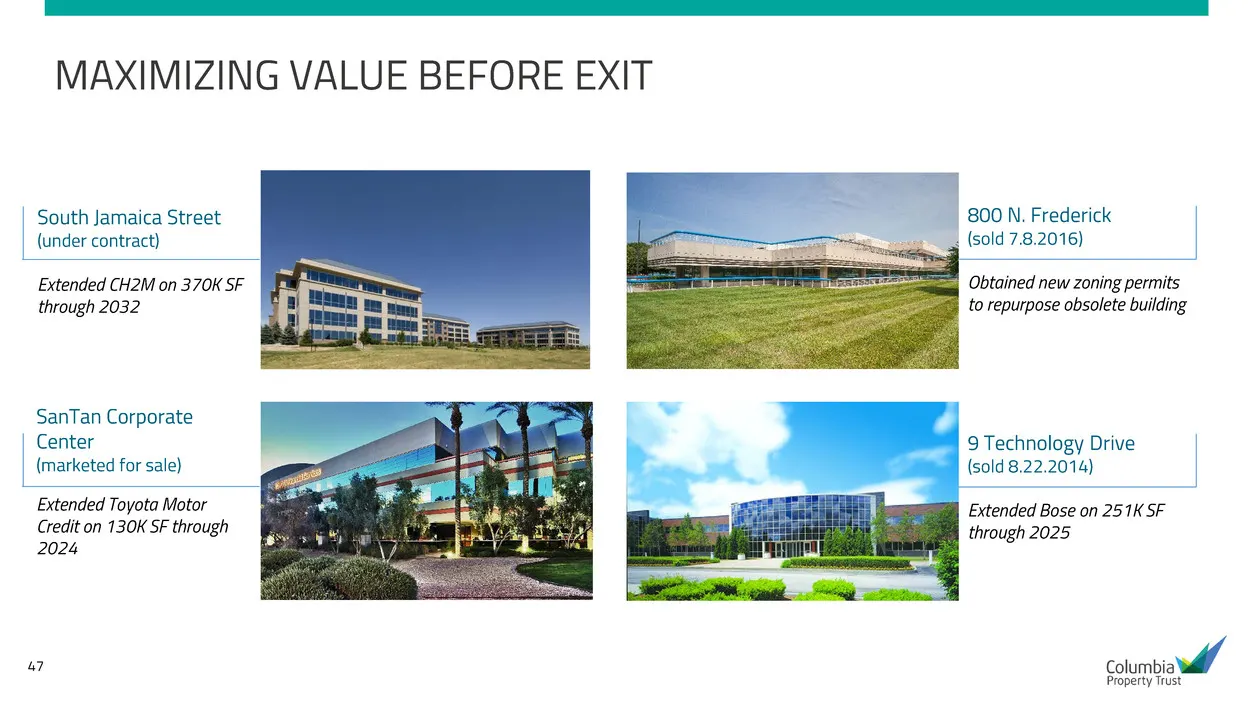
47 800 N. Frederick (sold 7.8.2016) Obtained new zoning permits to repurpose obsolete building SanTan Corporate Center (marketed for sale) Extended Toyota Motor Credit on 130K SF through 2024 South Jamaica Street (under contract) Extended CH2M on 370K SF through 2032 MAXIMIZING VALUE BEFORE EXIT 9 T
Slide 48: Embedded Growth from Signed Leases
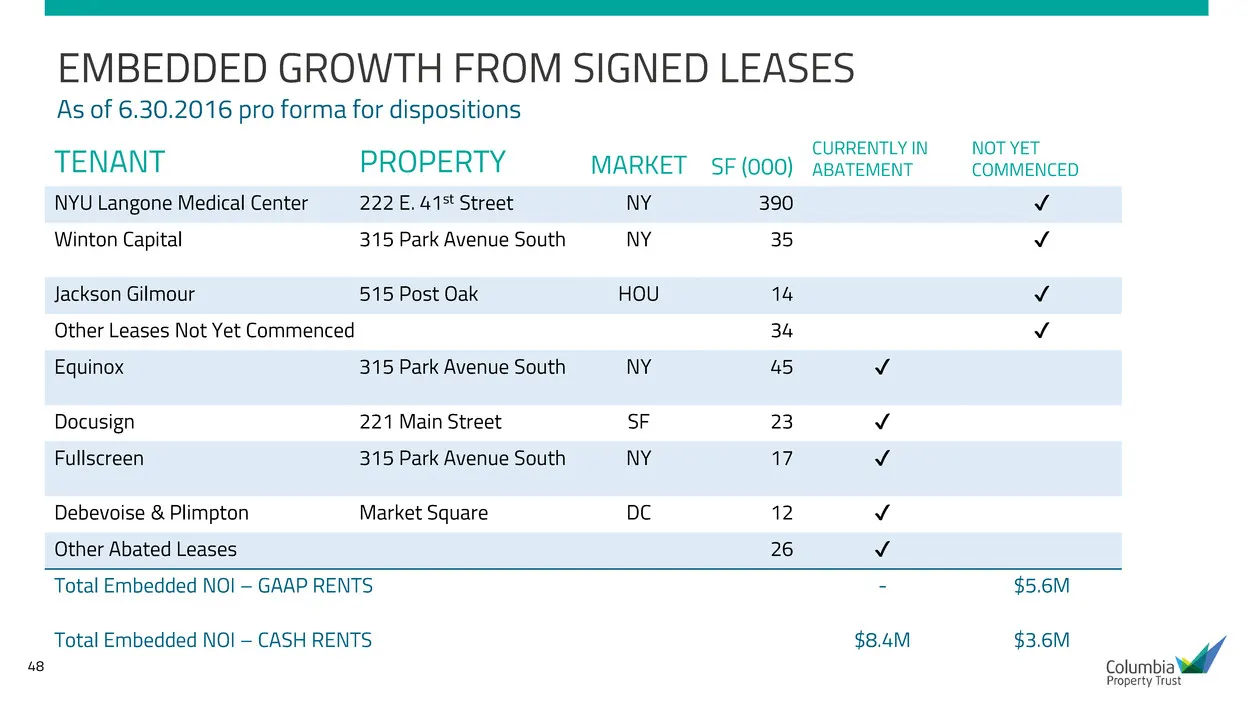
48 EMBEDDED GROWTH FROM SIGNED LEASES TENANT PROPERTY MARKET SF (000) CURRENTLY IN ABATEMENT NOT YET COMMENCED NYU Langone Medical Center 222 E. 41st Street NY 390 ✔ Winton Capital 315 Park Avenue South NY 35 ✔ Jackson Gilmour 515 Post Oak HOU 14 ✔ Other Leases Not Yet Commenced 34 ✔ Equinox 315 Par
Slide 49: Vacancy
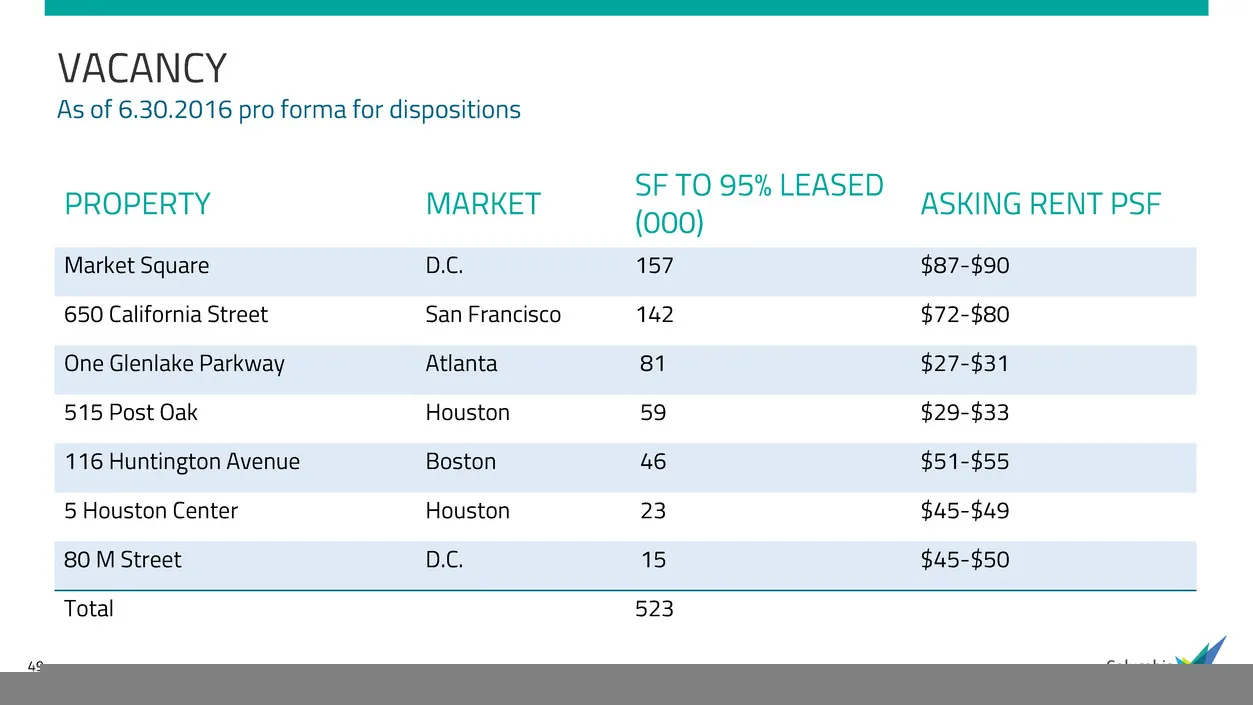
49 VACANCY PROPERTY MARKET SF TO 95% LEASED (000) ASKING RENT PSF Market Square D.C. 157 $87-$90 650 California Street San Francisco 142 $72-$80 One Glenlake Parkway Atlanta 81 $27-$31 515 Post Oak Houston 59 $29-$33 116 Huntington Avenue Boston 46 $51-$55 5 Houston Center Houston 23 $45-$49 80 M St
Slide 50: Expirations Through 2018
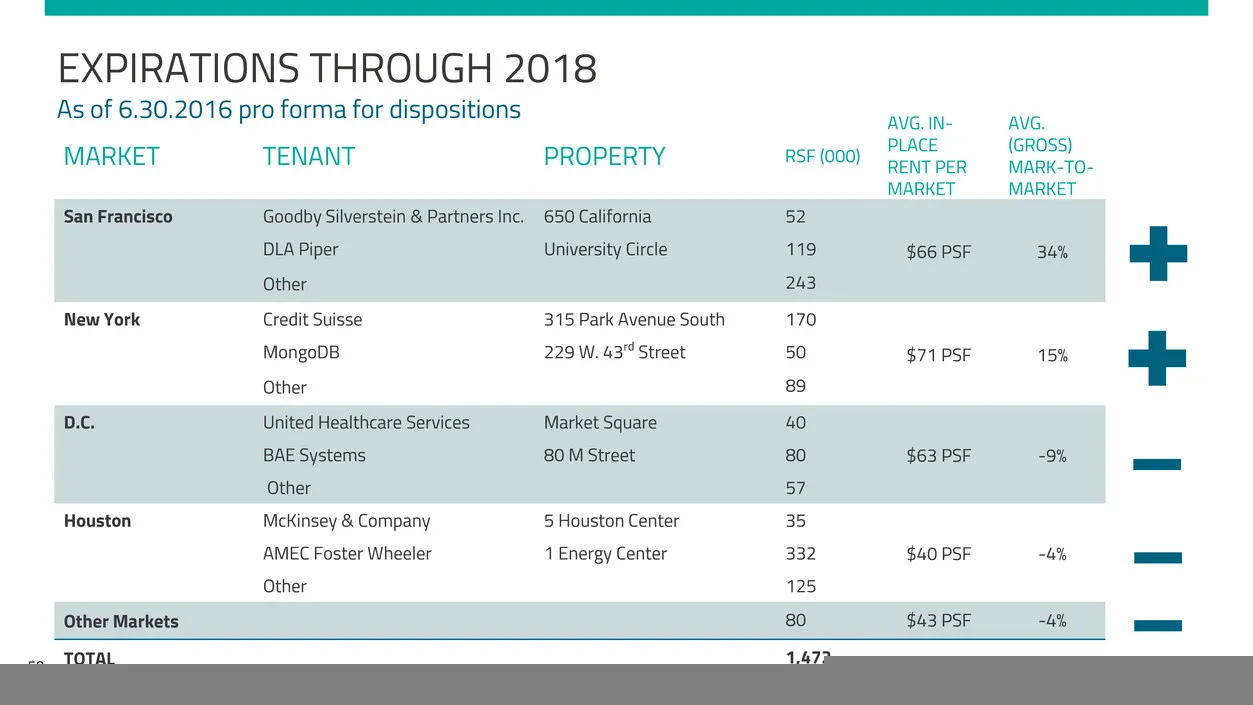
50 EXPIRATIONS THROUGH 2018 MARKET TENANT PROPERTY RSF (000) AVG. IN- PLACE RENT PER MARKET AVG. (GROSS) MARK-TO- MARKET San Francisco Goodby Silverstein & Partners Inc. 650 California 52 $66 PSF 34%DLA Piper University Circle 119 Other 243 New York Credit Suisse 315 Park Avenue South 170 $71 PSF 15

Slide 51: Future Plans
FUTURE PLANS | sein
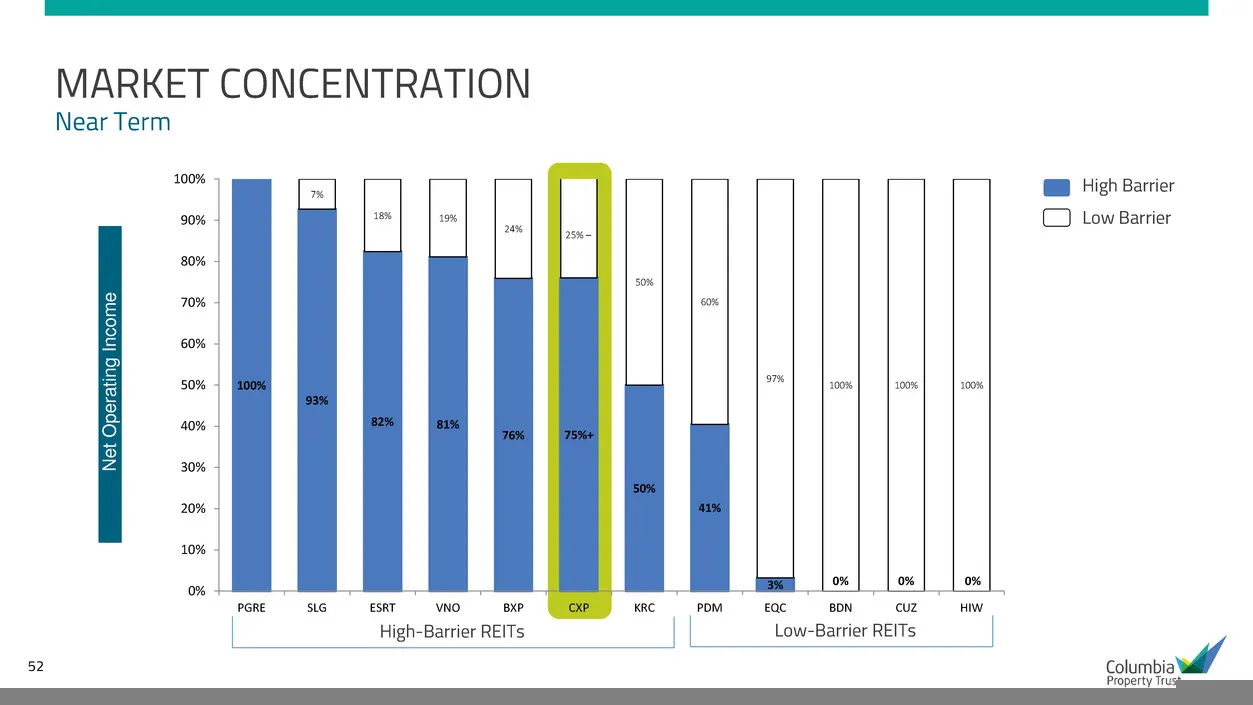
Slide 52: Market Concentration: Near Term
52 100% 93% 82% 81% 76% 75%+ 50% 41% 3% 0% 0% 0% 7% 18% 19% 24% 25% – 50% 60% 97% 100% 100% 100% 0% 10% 20% 30% 40% 50% 60% 70% 80% 90% 100% PGRE SLG ESRT VNO BXP CXP KRC PDM EQC BDN CUZ HIW N et O pe ra tin g In co m e High-Barrier REITs Low-Barrier REITs High Barrier Low Barrier MARKET CONCENTRATI
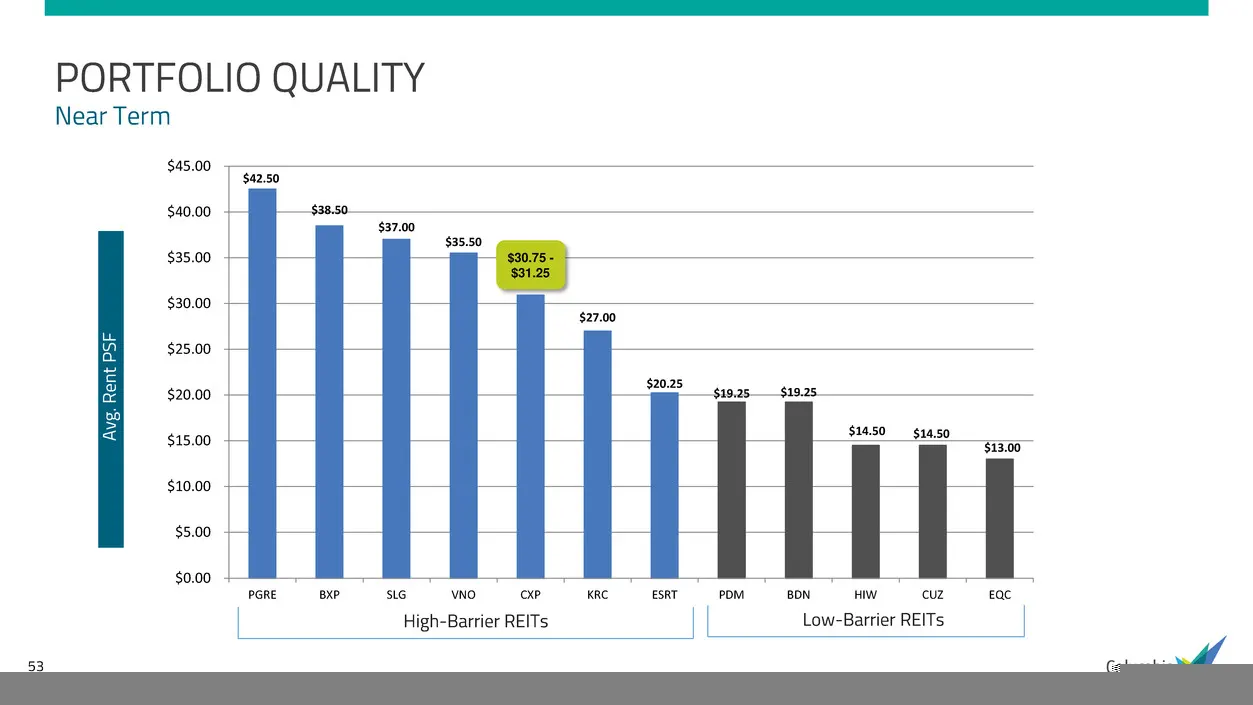
Slide 53: Portfolio Quality: Near Term
53 $42.50 $38.50 $37.00 $35.50 $27.00 $20.25 $19.25 $19.25 $14.50 $14.50 $13.00 $0.00 $5.00 $10.00 $15.00 $20.00 $25.00 $30.00 $35.00 $40.00 $45.00 PGRE BXP SLG VNO CXP KRC ESRT PDM BDN HIW CUZ EQC $30.75 - $31.25 PORTFOLIO QUALITY Near Term High-Barrier REITs Low-Barrier REITs A vg . R en t P SF
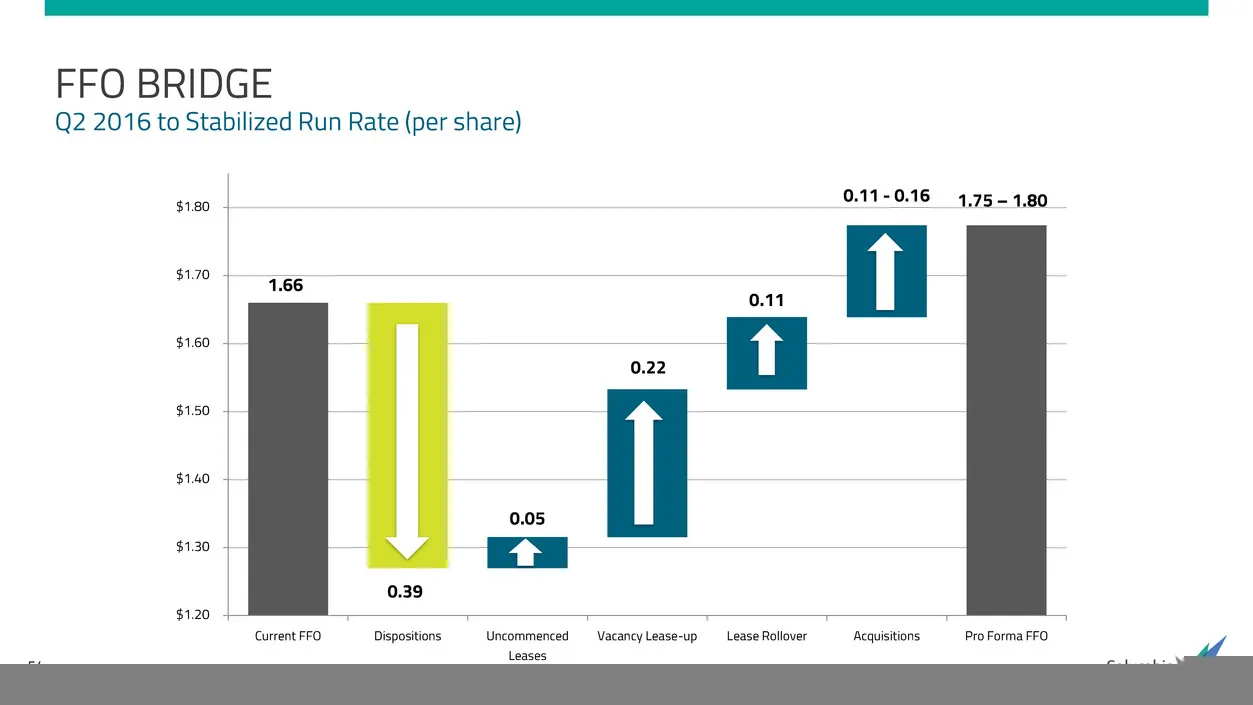
Slide 54: FFO Bridge
54 1.66 1.75 – 1.80 0.05 0.22 0.11 0.11 - 0.16 0.39 $1.20 $1.30 $1.40 $1.50 $1.60 $1.70 $1.80 Current FFO Dispositions Uncommenced Leases Vacancy Lease-up Lease Rollover Acquisitions Pro Forma FFO FFO BRIDGE Q2 2016 to Stabilized Run Rate (per share)
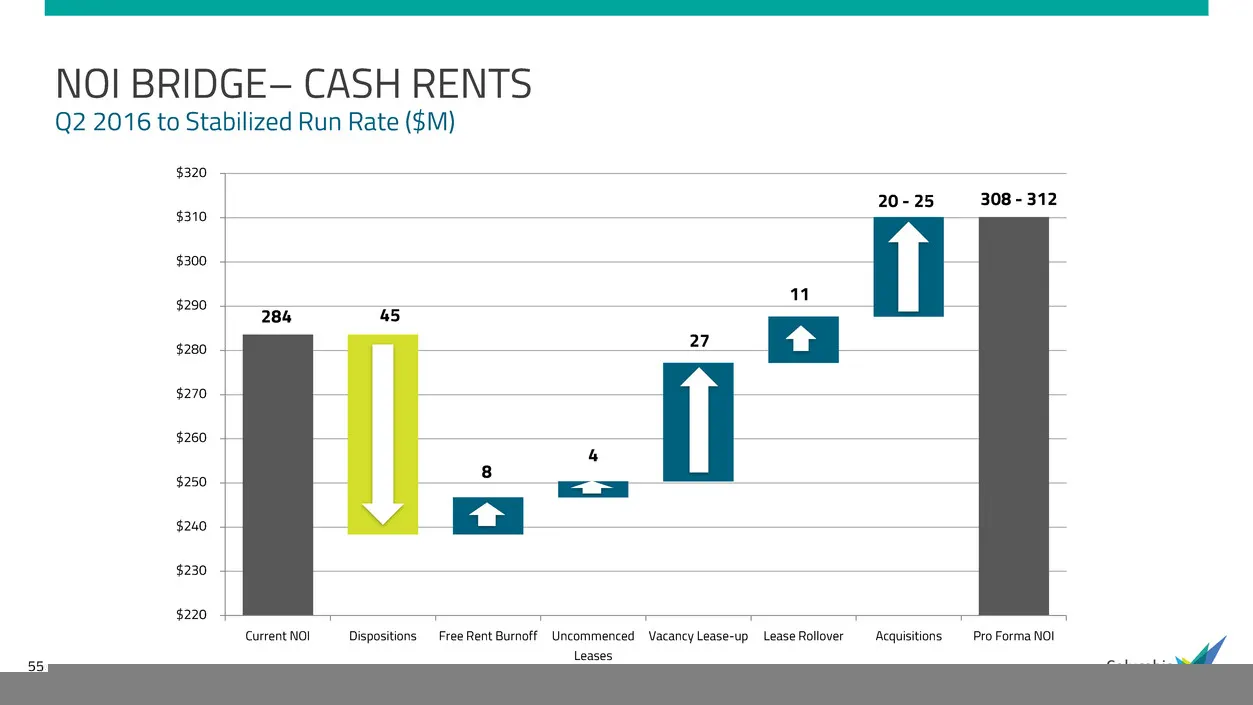
Slide 55: NOI Bridge – Cash Rents
55 284 308 - 312 8 4 27 11 20 - 25 45 $220 $230 $240 $250 $260 $270 $280 $290 $300 $310 $320 Current NOI Dispositions Free Rent Burnoff Uncommenced Leases Vacancy Lease-up Lease Rollover Acquisitions Pro Forma NOI NOI BRIDGE– CASH RENTS Q2 2016 to Stabilized Run Rate ($M)
Slide 56: Pro Forma AFFO Coverage
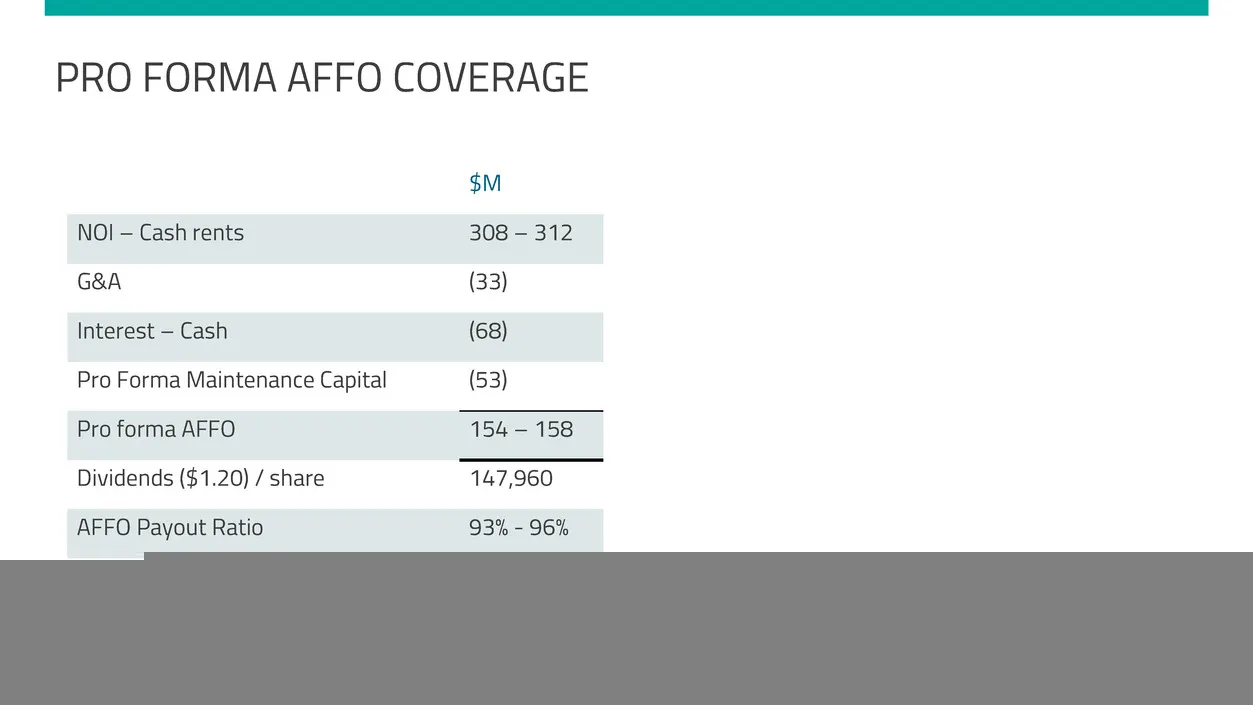
56 PRO FORMA AFFO COVERAGE $M NOI – Cash rents 308 – 312 G&A (33) Interest – Cash (68) Pro Forma Maintenance Capital (53) Pro forma AFFO 154 – 158 Dividends ($1.20) / share 147,960 AFFO Payout Ratio 93% - 96%
Slide 57: CXP Implied NAV Based on Market Cap Rates
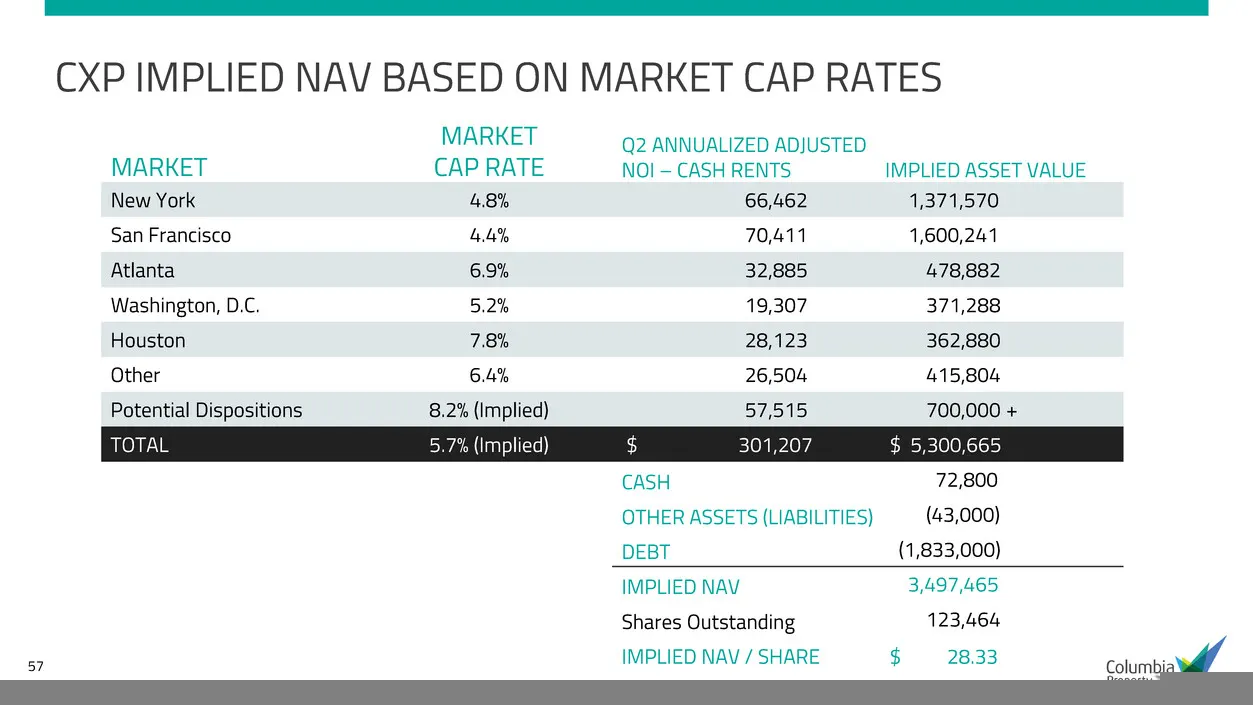
57 CXP IMPLIED NAV BASED ON MARKET CAP RATES MARKET MARKET CAP RATE Q2 ANNUALIZED ADJUSTED NOI – CASH RENTS IMPLIED ASSET VALUE New York 4.8% 66,462 1,371,570 San Francisco 4.4% 70,411 1,600,241 Atlanta 6.9% 32,885 478,882 Washington, D.C. 5.2% 19,307 371,288 Houston 7.8% 28,123 362,880 Other 6.4% 2
Slide 58: Future Opportunities for Investment & Sources of Capital
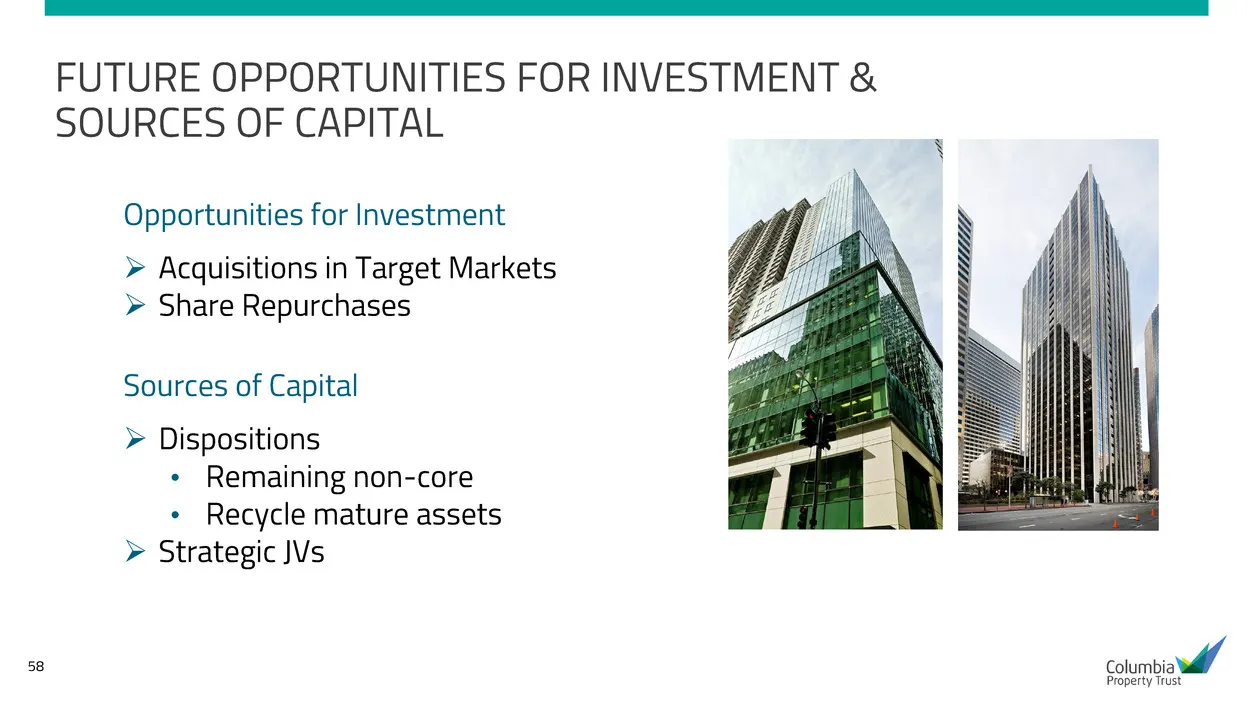
58 FUTURE OPPORTUNITIES FOR INVESTMENT & SOURCES OF CAPITAL Opportunities for Investment Acquisitions in Target Markets Share Repurchases Sources of Capital Dispositions • Remaining non-core • Recycle mature assets Strategic JVs
Slide 59: Key Objectives
59 KEY OBJECTIVES Complete dispositions Maintain strong balance sheet Additional investment opportunities Dividend policy
Slide 60: Questions
QUESTIONS Columbian smn sn) ra umn ® 3 i aa FE ace ri
Slide 61: Definitions
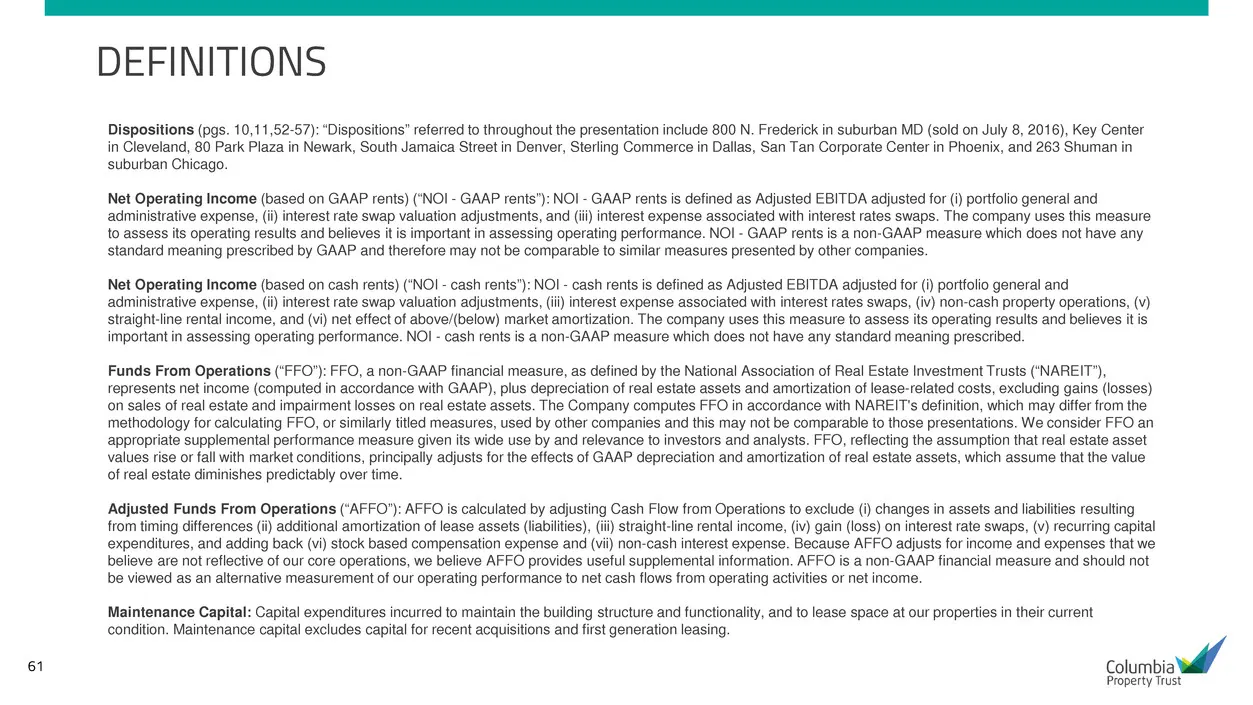
61 DEFINITIONS Dispositions (pgs. 10,11,52-57): “Dispositions” referred to throughout the presentation include 800 N. Frederick in suburban MD (sold on July 8, 2016), Key Center in Cleveland, 80 Park Plaza in Newark, South Jamaica Street in Denver, Sterling Commerce in Dallas, San Tan Corporate Cent
Slide 62: Endnotes
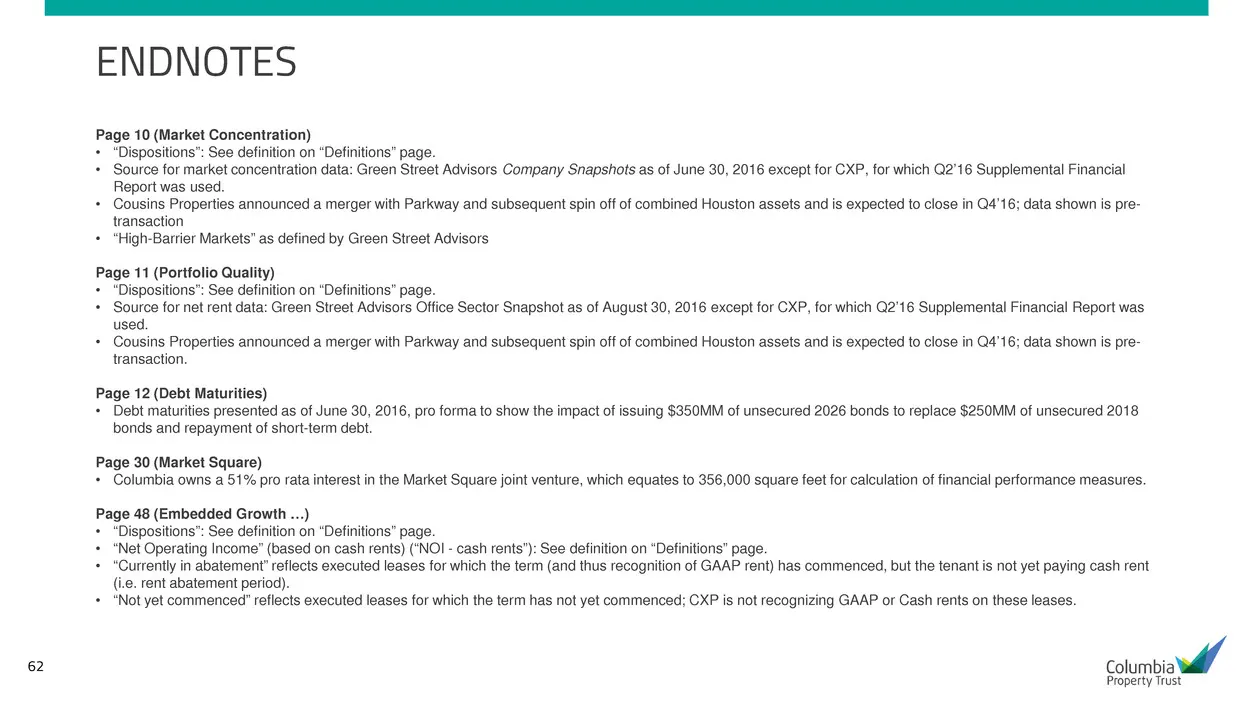
62 ENDNOTES Page 10 (Market Concentration) • “Dispositions”: See definition on “Definitions” page. • Source for market concentration data: Green Street Advisors Company Snapshots as of June 30, 2016 except for CXP, for which Q2’16 Supplemental Financial Report was used. • Cousins Properties announce
Slide 63: Endnotes (continued)
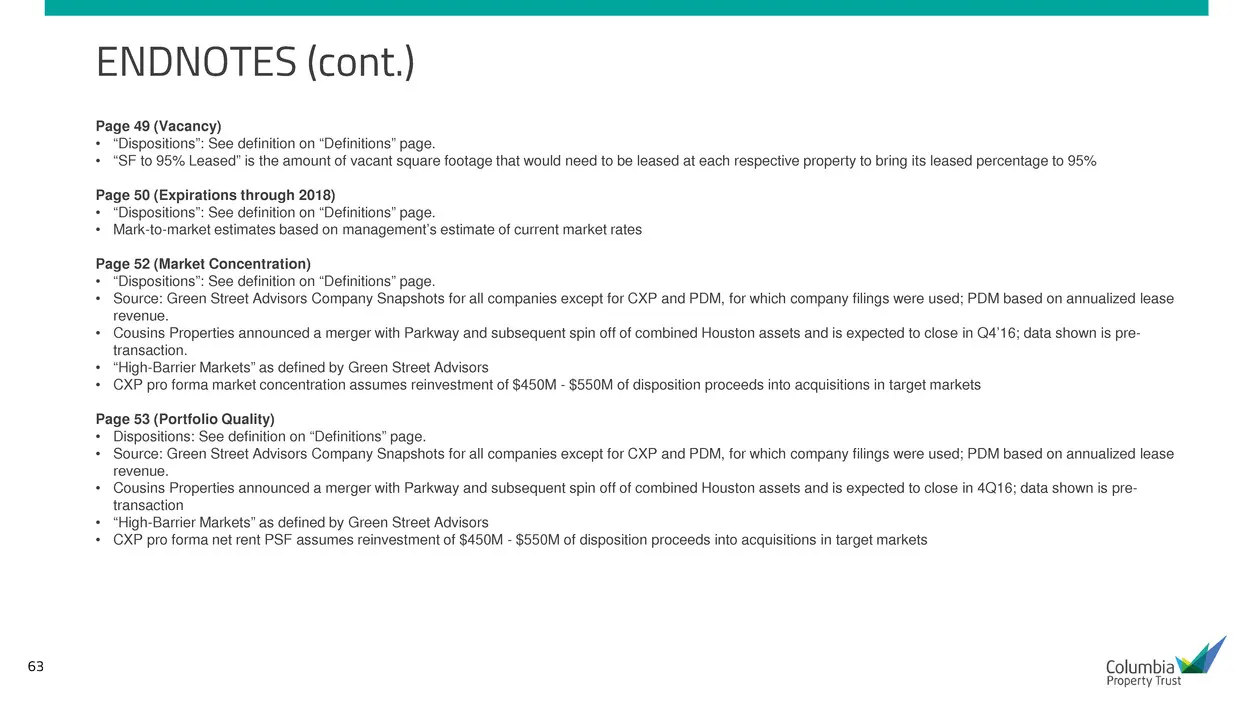
63 Page 49 (Vacancy) • “Dispositions”: See definition on “Definitions” page. • “SF to 95% Leased” is the amount of vacant square footage that would need to be leased at each respective property to bring its leased percentage to 95% Page 50 (Expirations through 2018) • “Dispositions”: See definition
Slide 64: Endnotes (FFO Bridge)
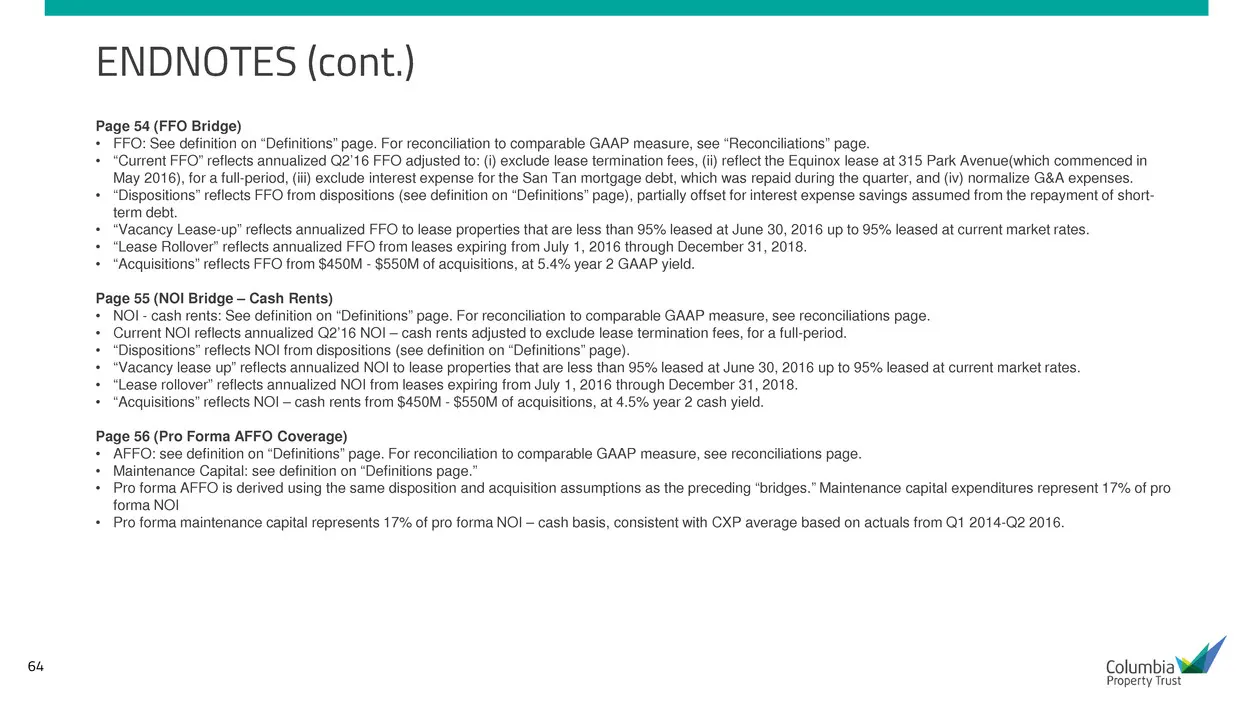
64 Page 54 (FFO Bridge) • FFO: See definition on “Definitions” page. For reconciliation to comparable GAAP measure, see “Reconciliations” page. • “Current FFO” reflects annualized Q2’16 FFO adjusted to: (i) exclude lease termination fees, (ii) reflect the Equinox lease at 315 Park Avenue(which comme
Slide 65: Endnotes (CXP Implied NAV)
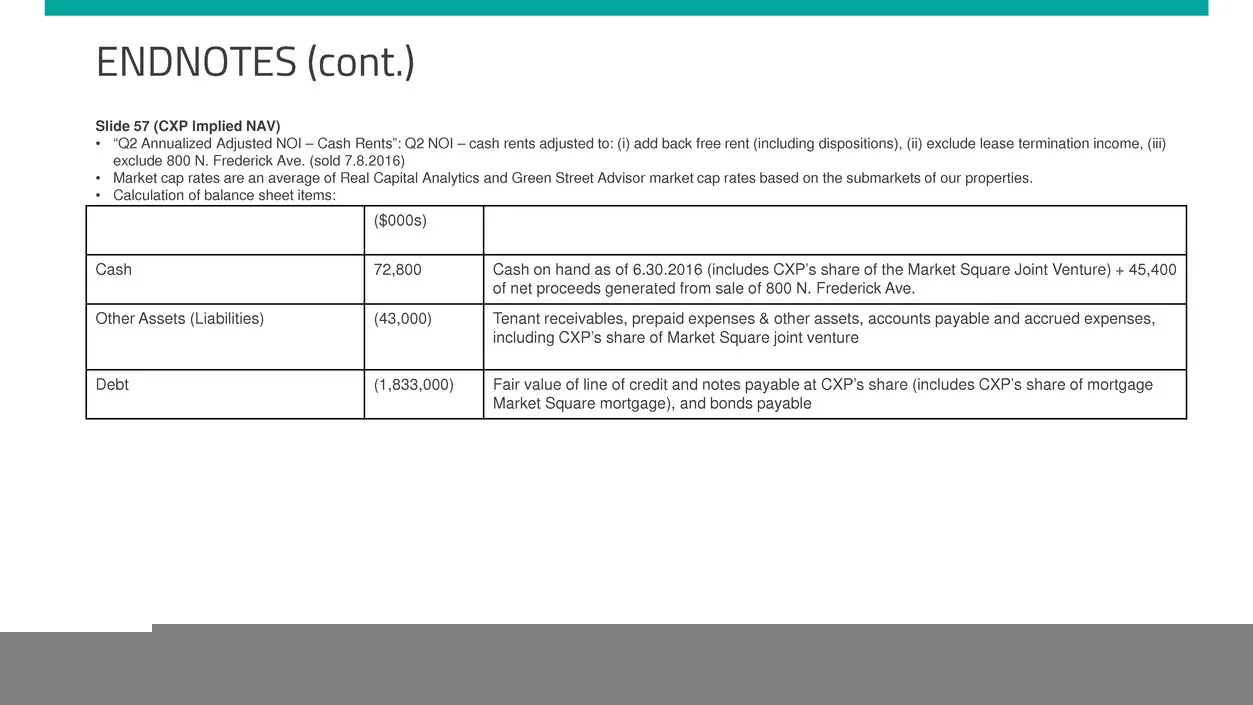
65 Slide 57 (CXP Implied NAV) • “Q2 Annualized Adjusted NOI – Cash Rents”: Q2 NOI – cash rents adjusted to: (i) add back free rent (including dispositions), (ii) exclude lease termination income, (iii) exclude 800 N. Frederick Ave. (sold 7.8.2016) • Market cap rates are an average of Real Capital An
Slide 66: Reconciliations: Non-GAAP to Comparable GAAP Measures
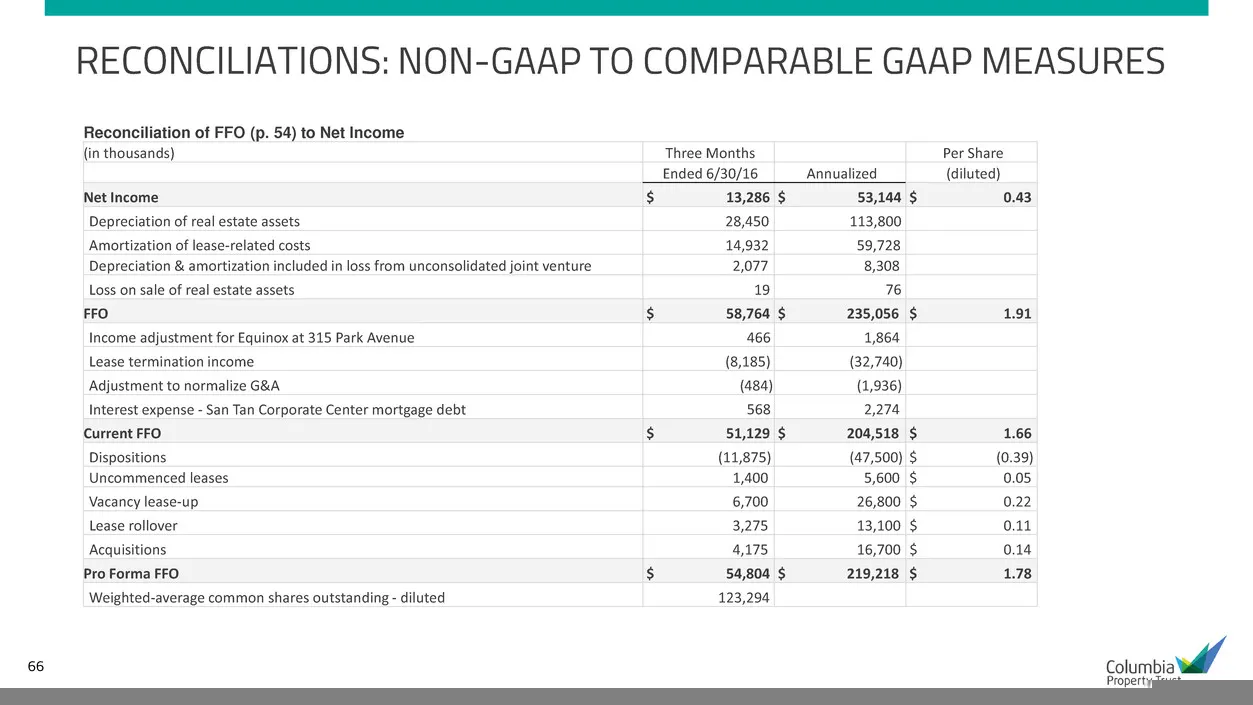
66 RECONCILIATIONS: NON-GAAP TO COMPARABLE GAAP MEASURES Reconciliation of FFO (p. 54) to Net Income (in thousands) Three Months Per Share Ended 6/30/16 Annualized (diluted) Net Income $ 13,286 $ 53,144 $ 0.43 Depreciation of real estate assets 28,450 113,800 Amortization of lease-related costs 14,9
Slide 67: Reconciliations: Cash NOI & AFFO
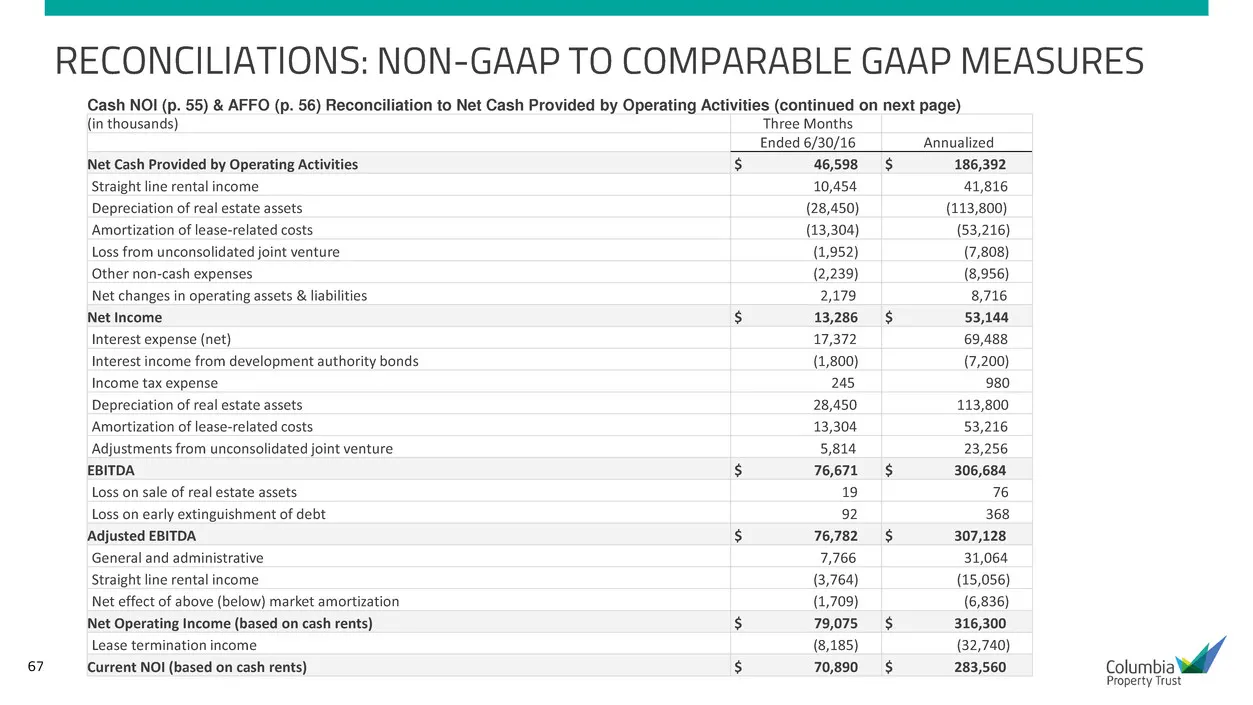
67 RECONCILIATIONS: NON-GAAP TO COMPARABLE GAAP MEASURES Cash NOI (p. 55) & AFFO (p. 56) Reconciliation to Net Cash Provided by Operating Activities (continued on next page) (in thousands) Three Months Ended 6/30/16 Annualized Net Cash Provided by Operating Activities $ 46,598 $ 186,392 Straight lin
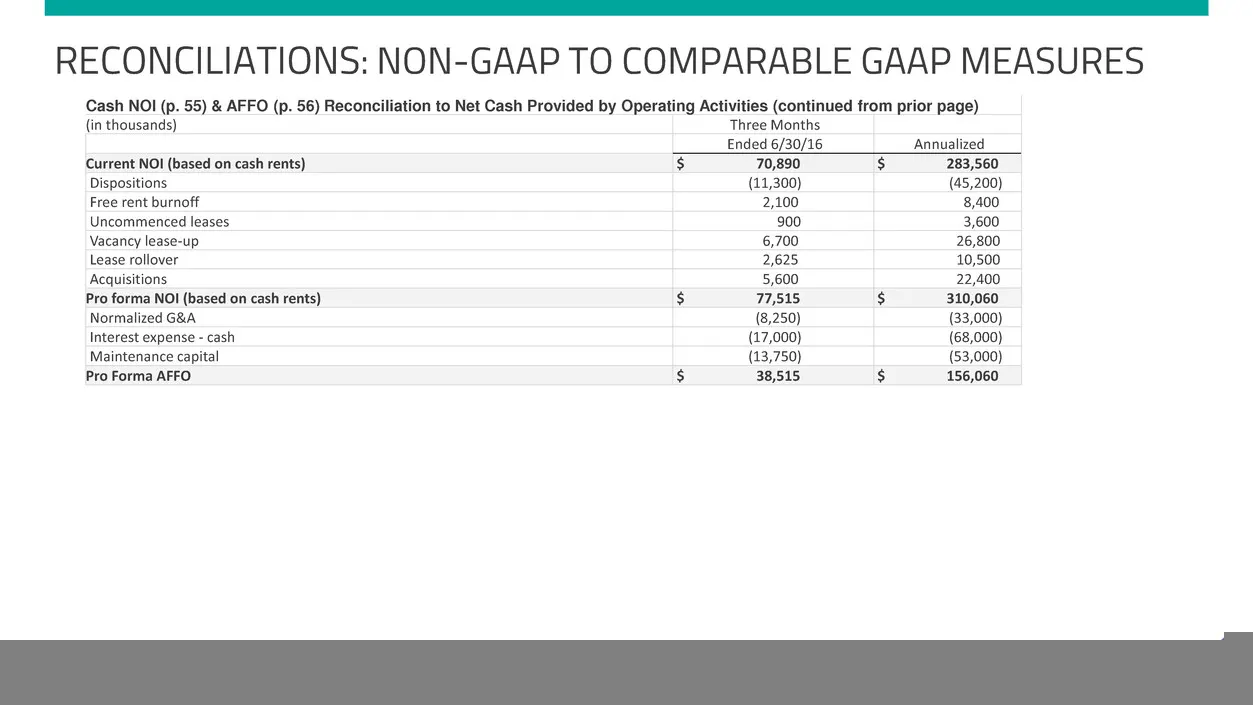
Slide 68: Reconciliations: Cash NOI & AFFO (continued)
68 RECONCILIATIONS: NON-GAAP TO COMPARABLE GAAP MEASURES Cash NOI (p. 55) & AFFO (p. 56) Reconciliation to Net Cash Provided by Operating Activities (continued from prior page) (in thousands) Three Months Ended 6/30/16 Annualized Current NOI (based on cash rents) $ 70,890 $ 283,560 Dispositions (11,
Source: SEC EDGAR · 8-K filed Sep 12, 2016
More decks from Columbia Property Trust Inc
 Investor Presentation (November 2020)33 slides · Nov 17, 2020
 Investor Presentation (August 2020)34 slides · Aug 31, 2020
 Investor Presentation (June 2020)34 slides · Jun 1, 2020
 Investor Presentation (February 2020)29 slides · Feb 26, 2020
 Corporate Update (December 2019)12 slides · Dec 3, 2019
 Investor Presentation (November 2019)28 slides · Nov 12, 2019