Columbia Property Trust — Investor Presentation (November 2019)
28 slides from Columbia Property Trust's investor presentation, Nov 12, 2019

Slide 1: Columbia Property Trust Investor Presentation 11.2019
COLUMBIA PROPERTY TRUST INVESTOR PRESENTATION 11.2019 1
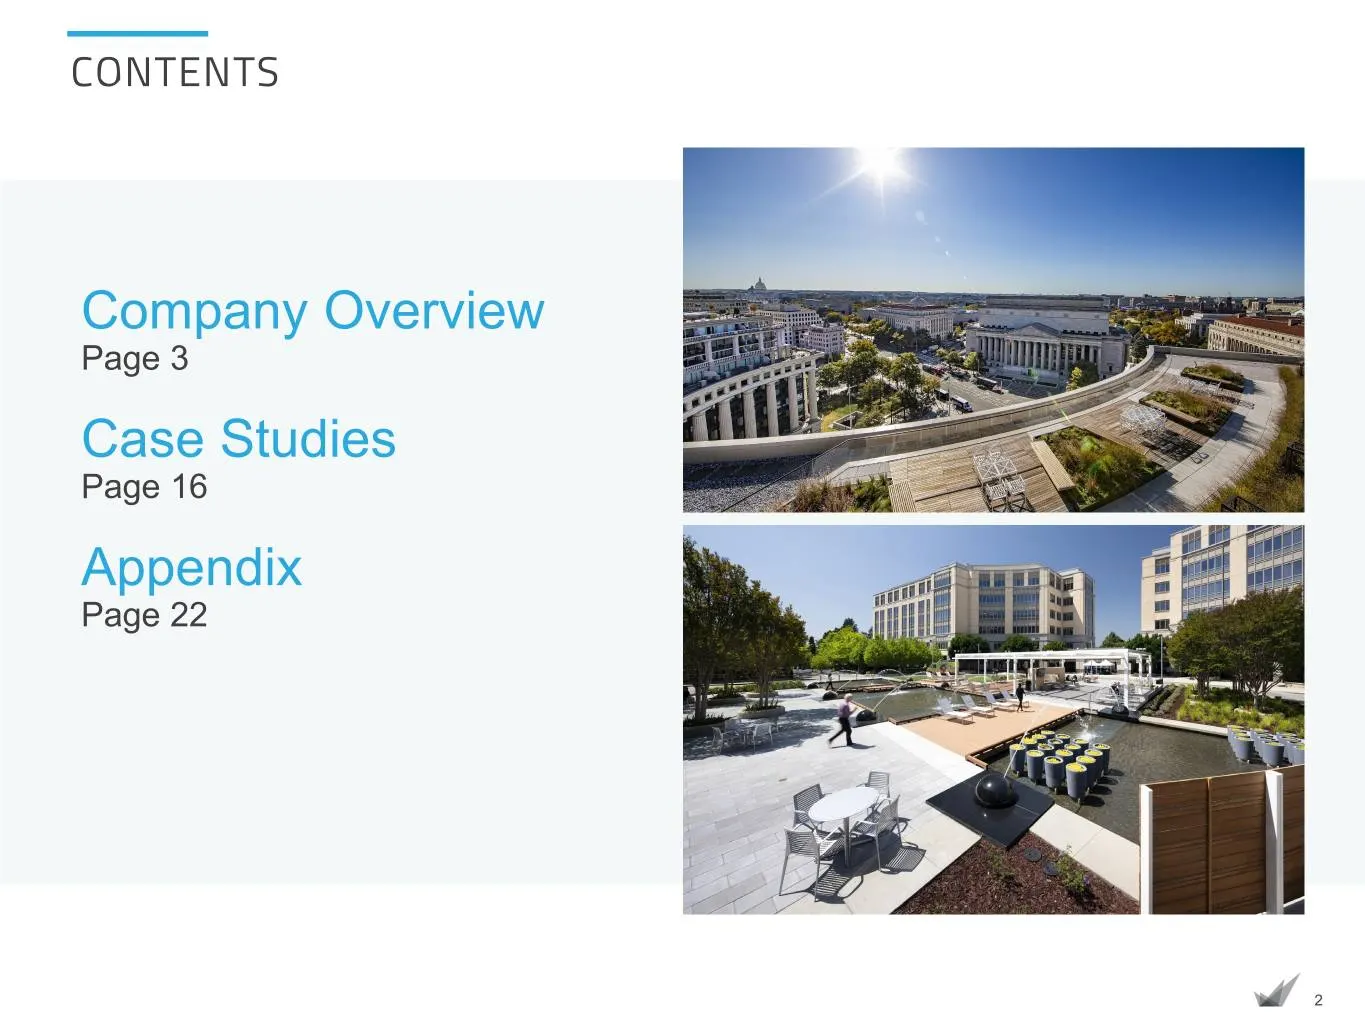
Slide 2: Contents
CONTENTS Company Overview Page 3 Case Studies Page 16 Appendix Page 22 2
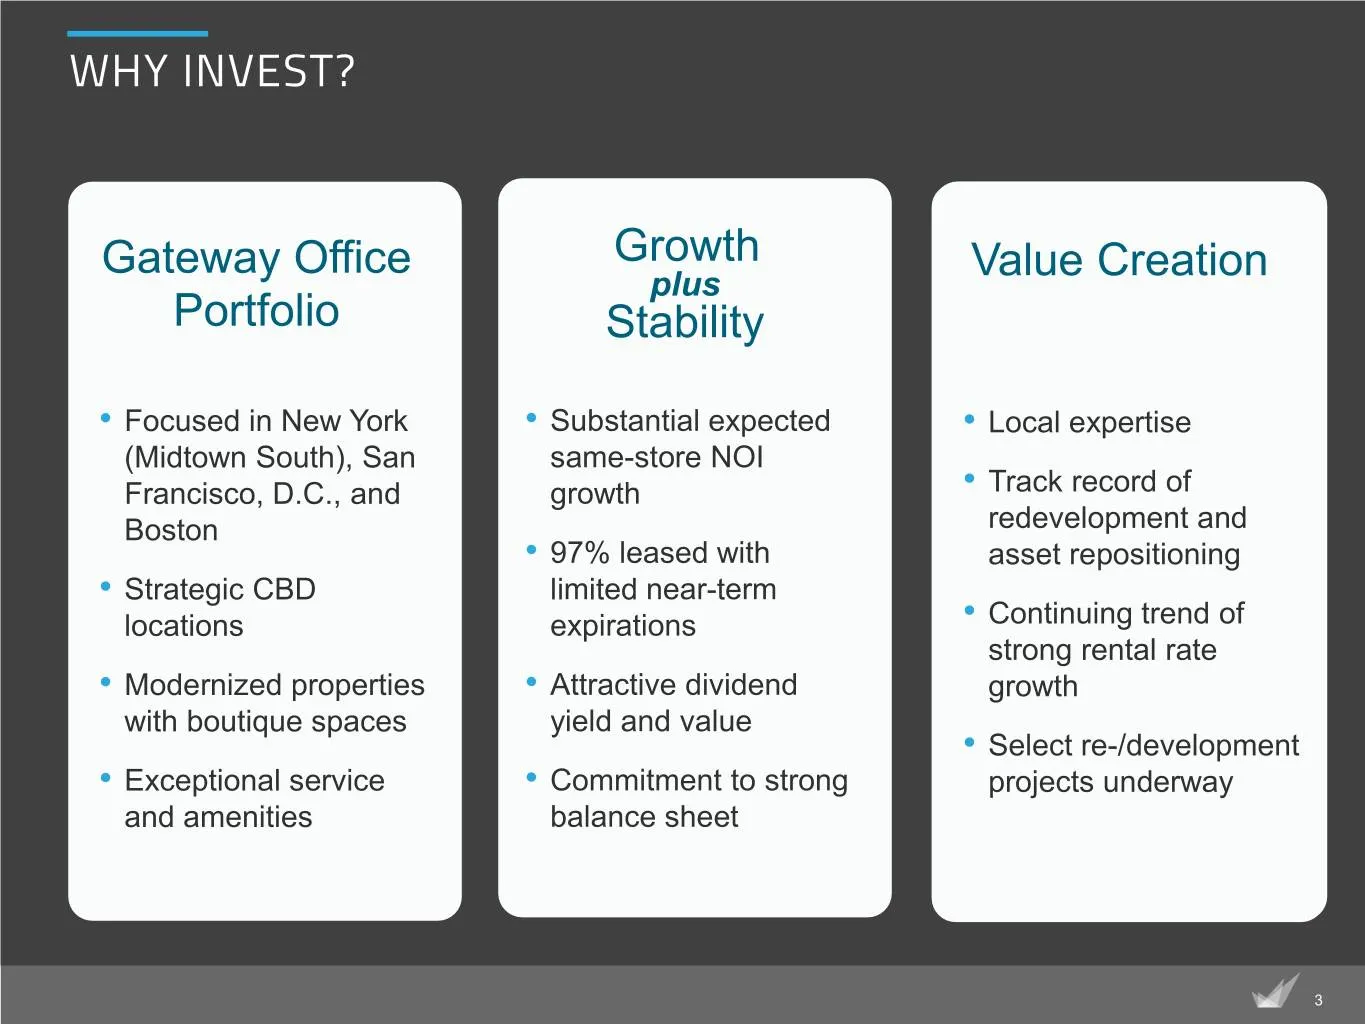
Slide 3: Why Invest?
WHY INVEST? Gateway Office Growth Value Creation plus Portfolio Stability • Focused in New York • Substantial expected • Local expertise (Midtown South), San same-store NOI Francisco, D.C., and growth • Track record of Boston redevelopment and • 97% leased with asset repositioning • Strategic CBD li
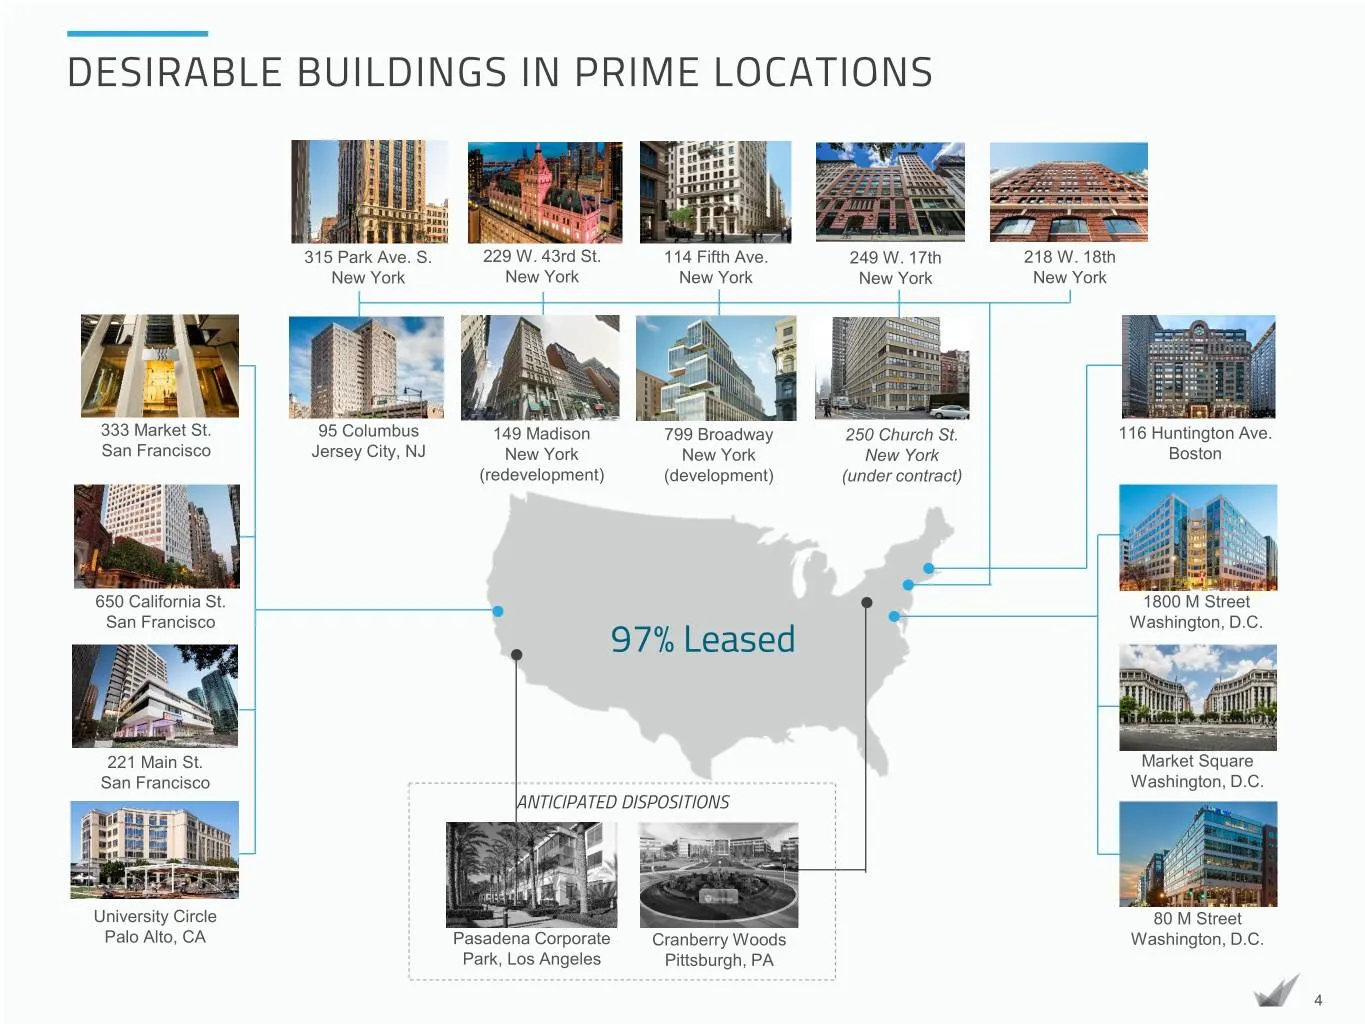
Slide 4: Desirable Buildings in Prime Locations
DESIRABLE BUILDINGS IN PRIME LOCATIONS 315 Park Ave. S. 229 W. 43rd St. 114 Fifth Ave. 249 W. 17th 218 W. 18th New York New York New York New York New York 333 Market St. 95 Columbus 149 Madison 799 Broadway 250 Church St. 116 Huntington Ave. San Francisco Jersey City, NJ New York New York New York
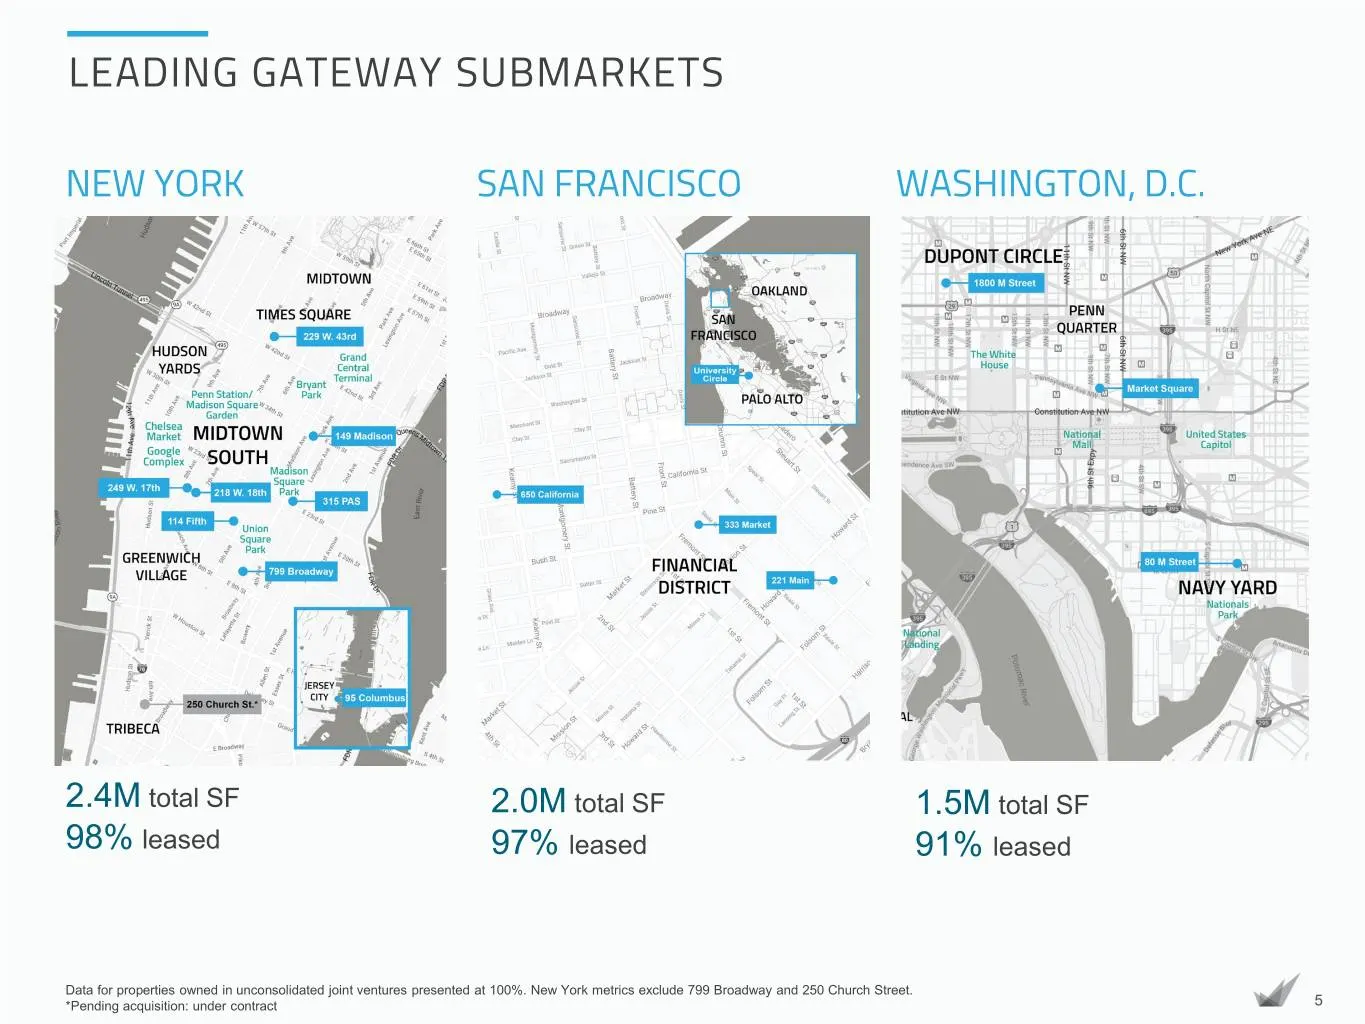
Slide 5: Leading Gateway Submarkets
LEADING GATEWAY SUBMARKETS NEW YORK SAN FRANCISCO WASHINGTON, D.C. 2.4M total SF 2.0M total SF 1.5M total SF 98% leased 97% leased 91% leased Data for properties owned in unconsolidated joint ventures presented at 100%. New York metrics exclude 799 Broadway and 250 Church Street. *Pending acquisitio
Slide 6: A Proven Approach
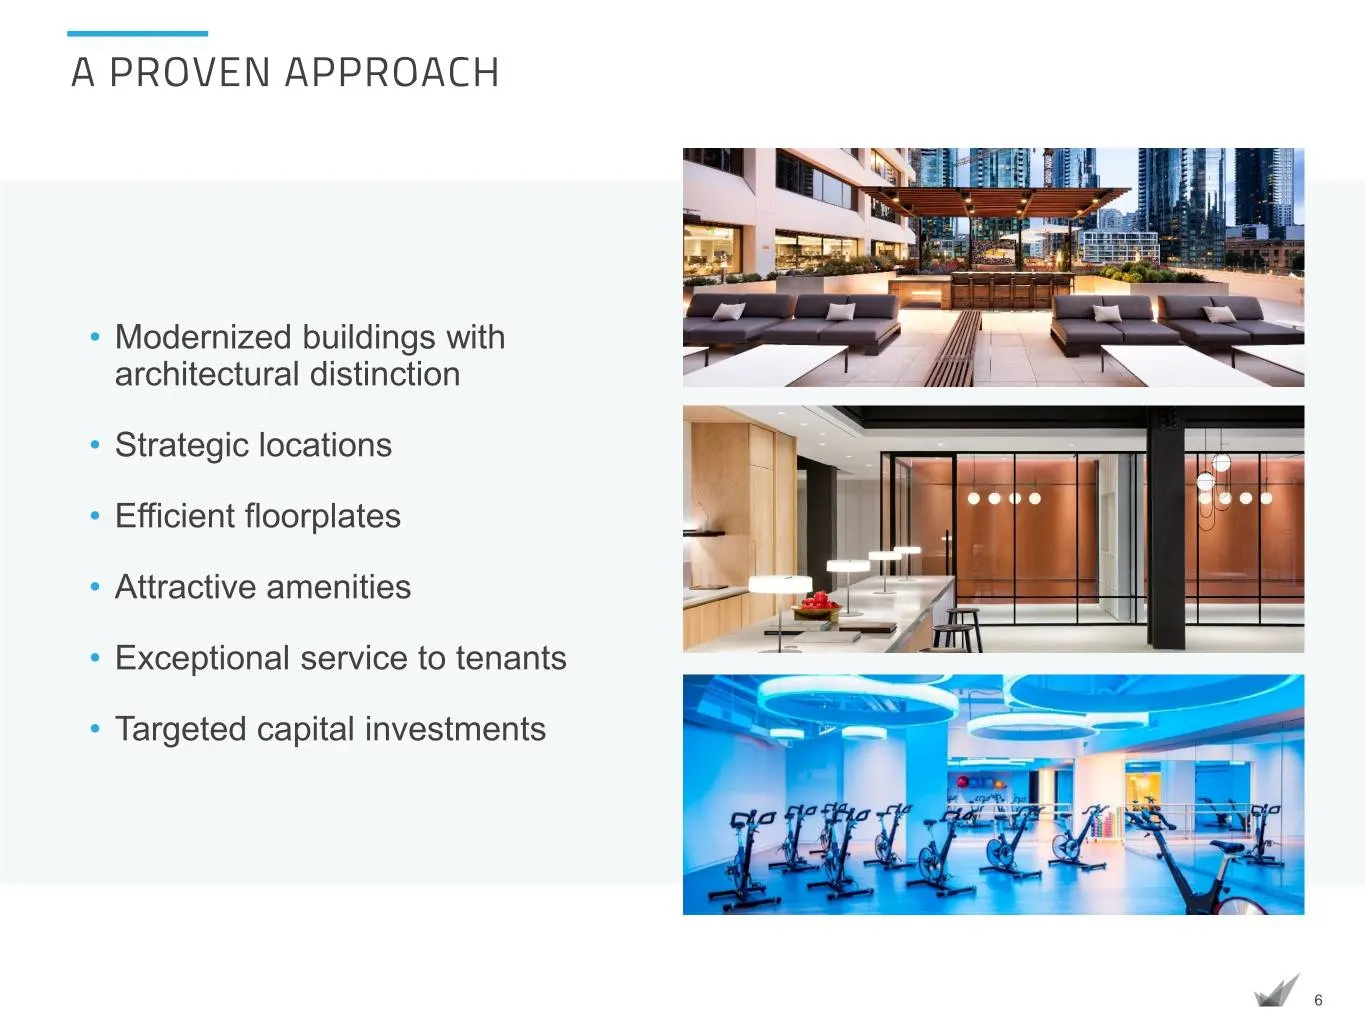
A PROVEN APPROACH • Modernized buildings with architectural distinction • Strategic locations • Efficient floorplates • Attractive amenities • Exceptional service to tenants • Targeted capital investments 6
Slide 7: Sector-Leading Same-Store NOI Growth
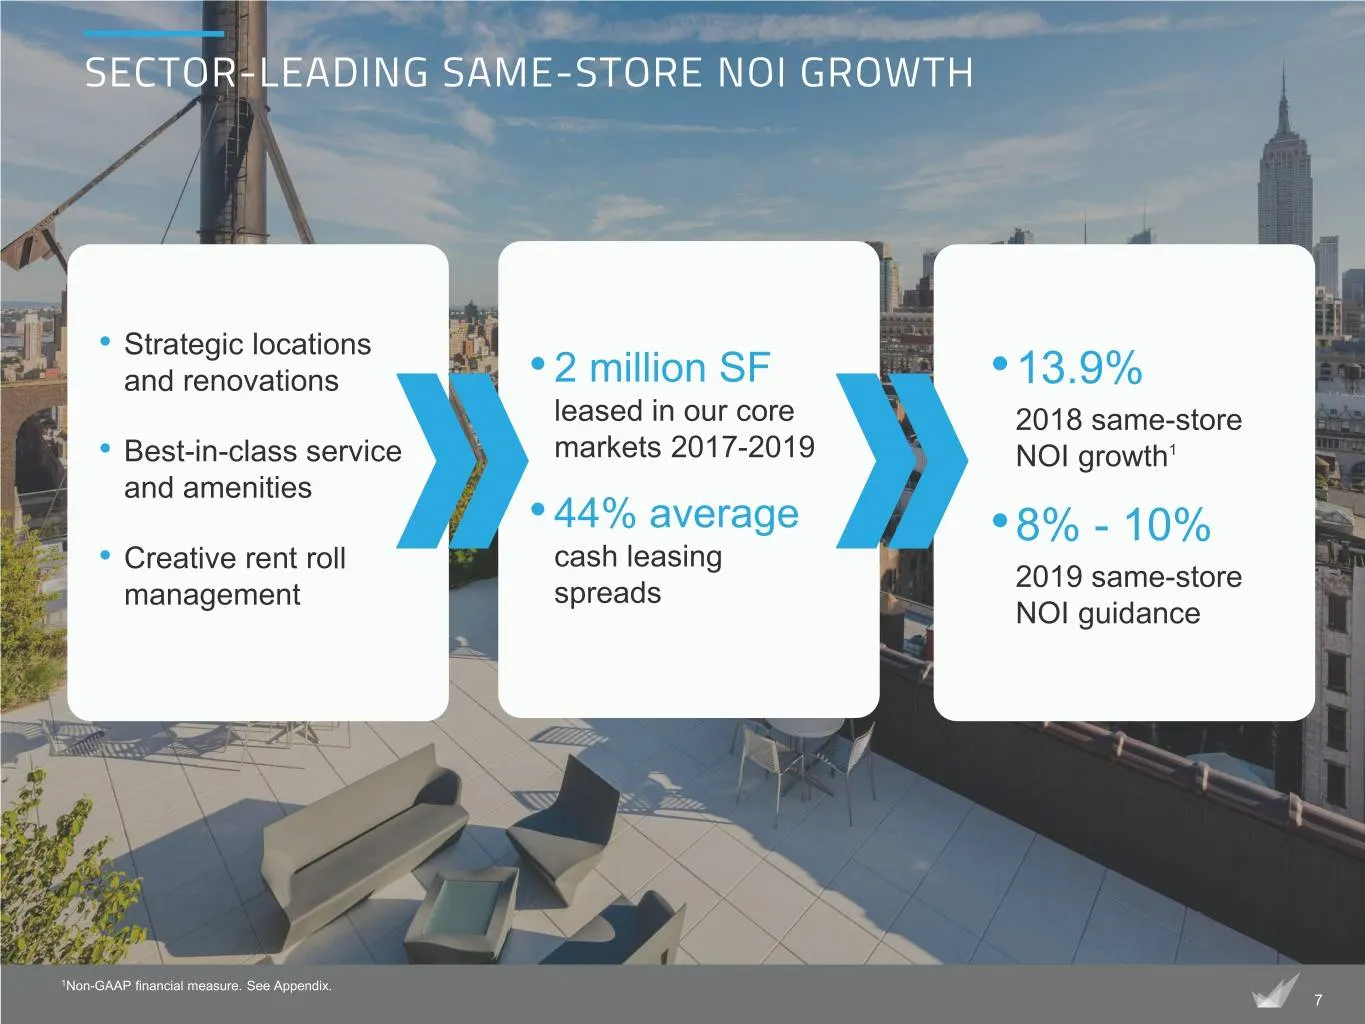
SECTOR-LEADING SAME-STORE NOI GROWTH • Strategic locations and renovations • 2 million SF •13.9% leased in our core 2018 same-store • Best-in-class service markets 2017-2019 NOI growth1 and amenities • 44% average •8% - 10% • Creative rent roll cash leasing 2019 same-store management spreads NOI gui
Slide 8: Illustrative Net Asset Value Analysis
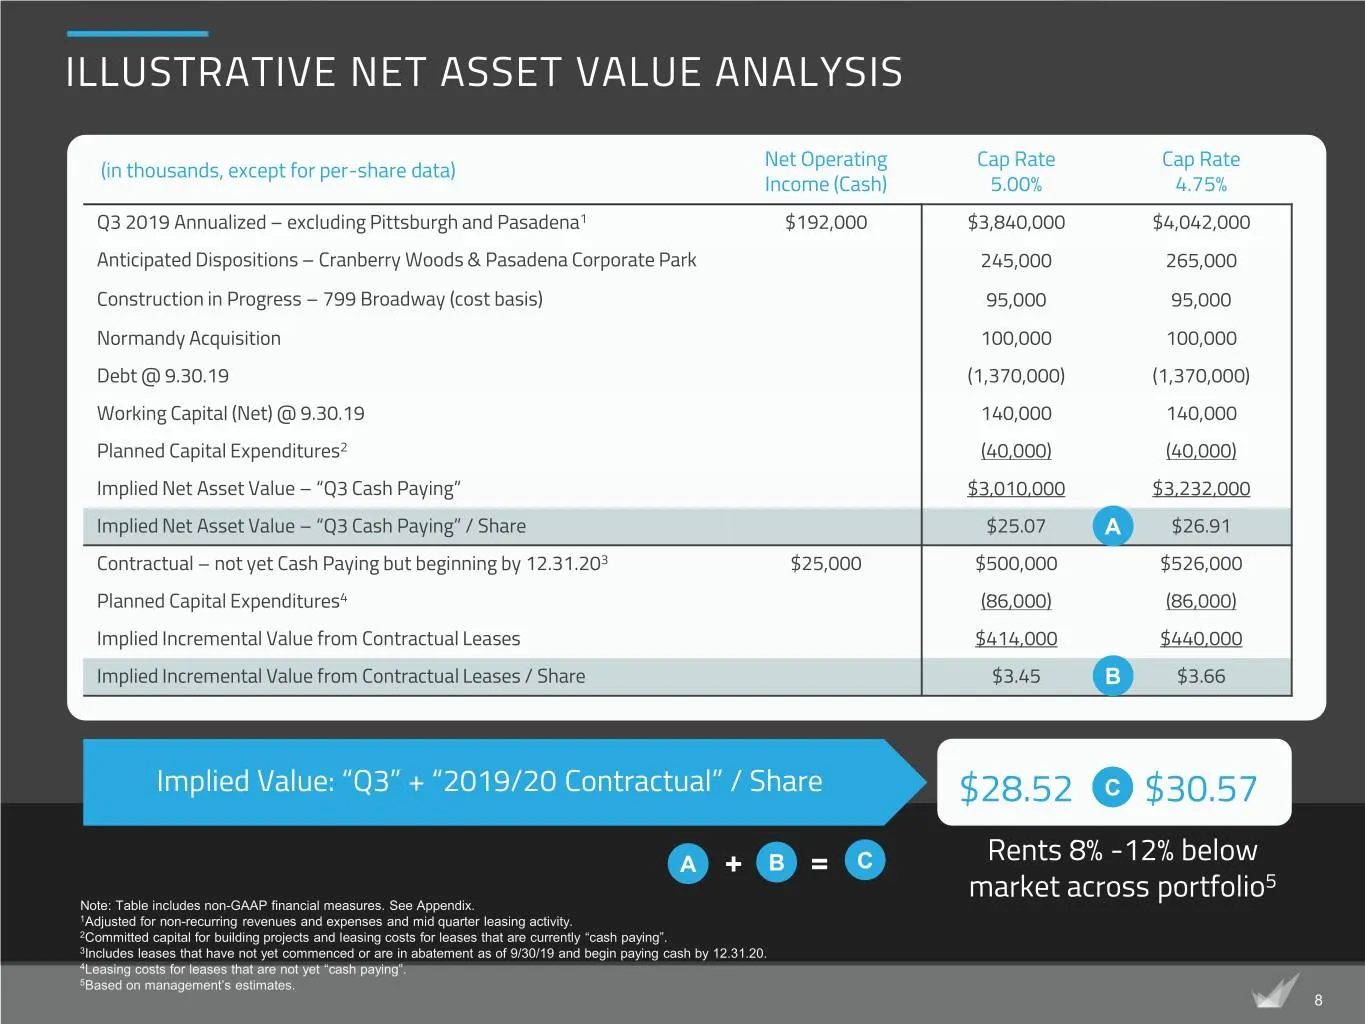
ILLUSTRATIVE NET ASSET VALUE ANALYSIS Net Operating Cap Rate Cap Rate (in thousands, except for per-share data) Income (Cash) 5.00% 4.75% Q3 2019 Annualized – excluding Pittsburgh and Pasadena1 $192,000 $3,840,000 $4,042,000 Anticipated Dispositions – Cranberry Woods & Pasadena Corporate Park 245,00
Slide 9: Embedded Growth from Signed Leases
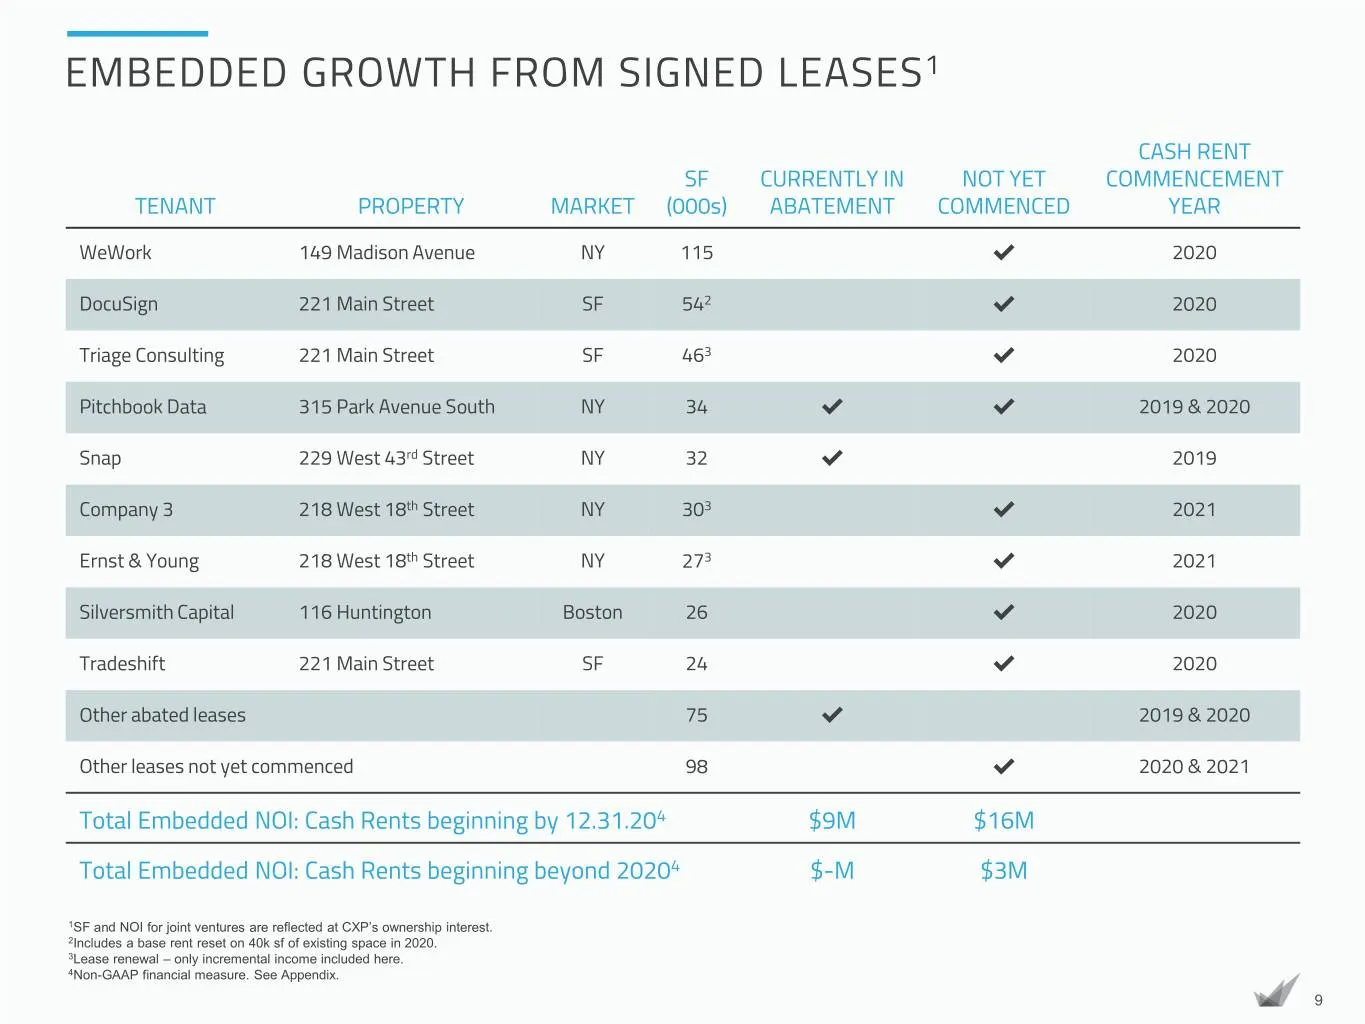
EMBEDDED GROWTH FROM SIGNED LEASES1 CASH RENT SF CURRENTLY IN NOT YET COMMENCEMENT TENANT PROPERTY MARKET (000s) ABATEMENT COMMENCED YEAR WeWork 149 Madison Avenue NY 115 ✔ 2020 DocuSign 221 Main Street SF 542 ✔ 2020 Triage Consulting 221 Main Street SF 463 ✔ 2020 Pitchbook Data 315 Park Avenue Sout
Slide 10: Attractive Dividend Yield
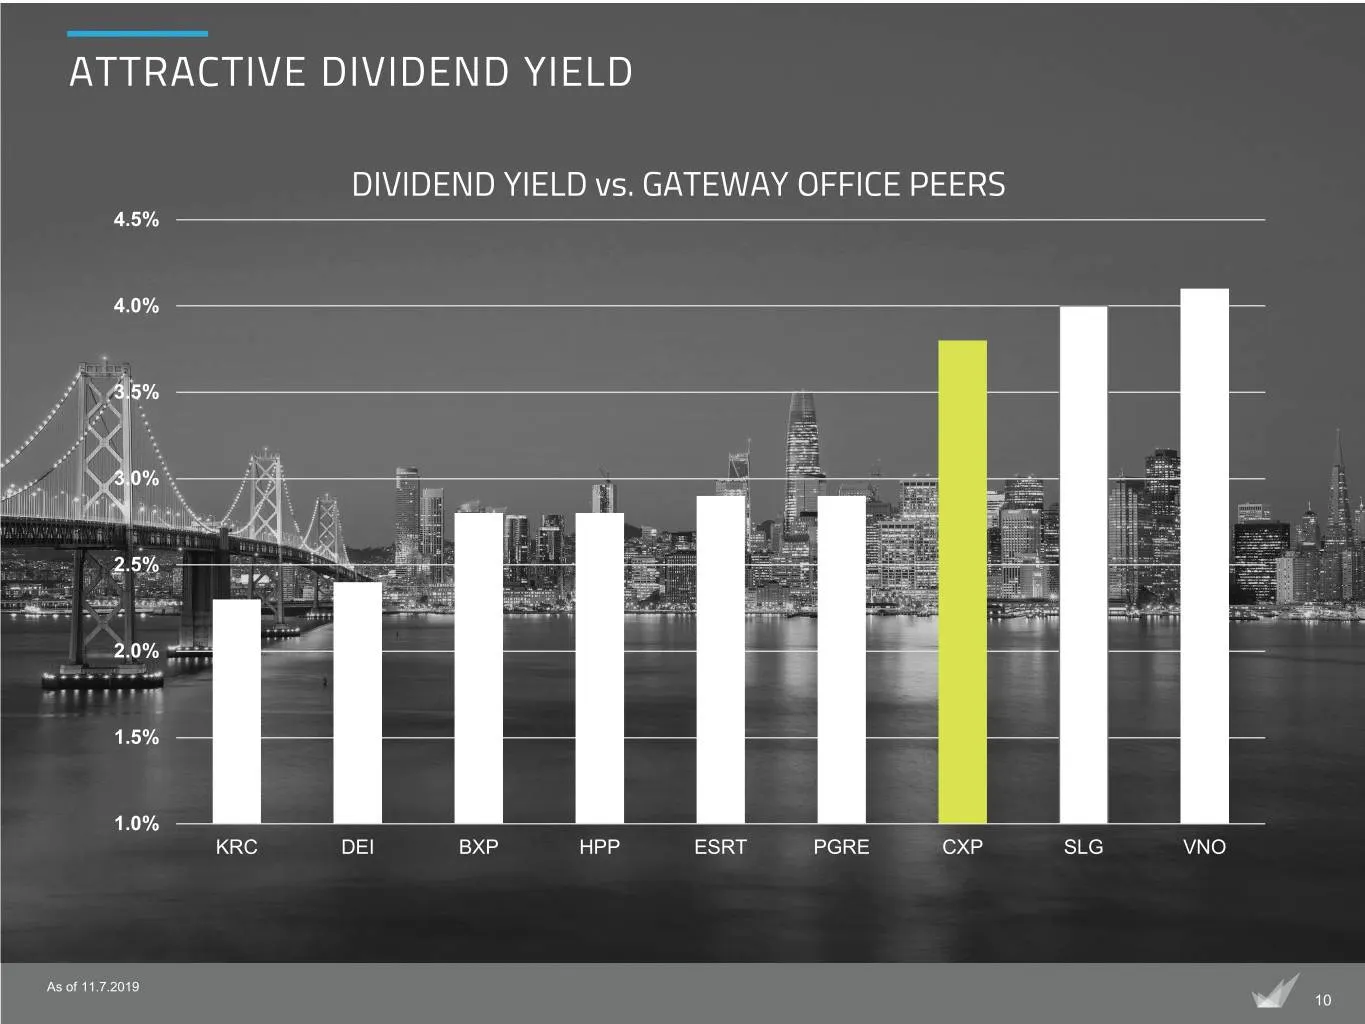
ATTRACTIVE DIVIDEND YIELD DIVIDEND YIELD vs. GATEWAY OFFICE PEERS 4.5% 4.0% 3.5% 3.0% 2.5% 2.0% 1.5% 1.0% KRC DEI BXP HPP ESRT PGRE CXP SLG VNO As of 11.7.2019 10
Slide 11: Limited Near-Term Rollover
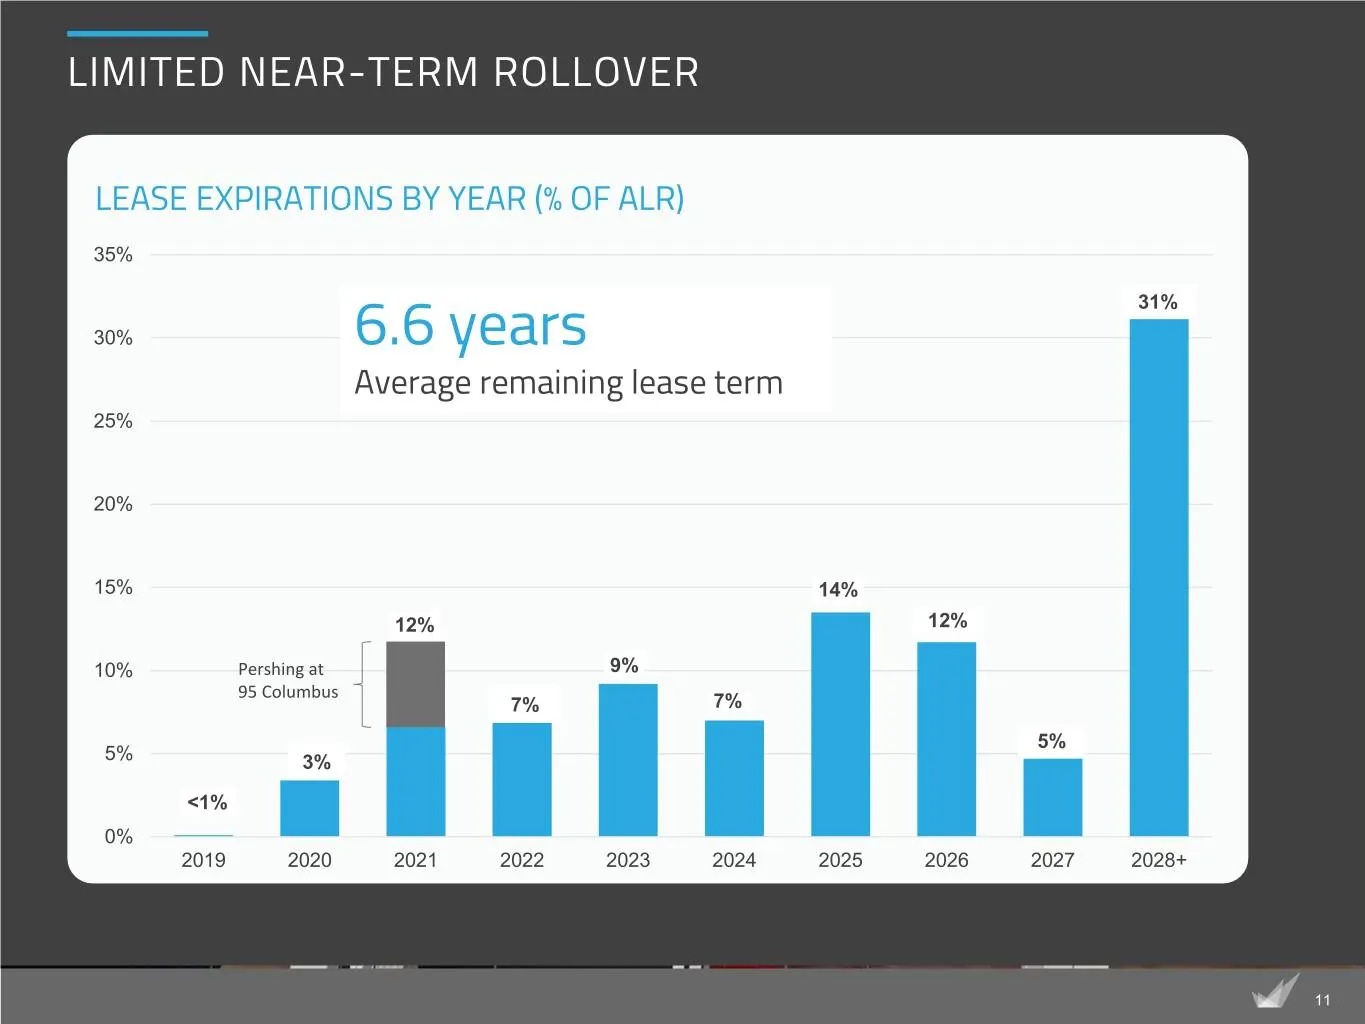
LIMITED NEAR-TERM ROLLOVER LEASE EXPIRATIONS BY YEAR (% OF ALR) 35% 31% 30% 6.6 years Average remaining lease term 25% 20% 15% 14% 12% 12% 10% Pershing at 9% 95 Columbus 7% 7% 5% 5% 3% <1% 0% 2019 2020 2021 2022 2023 2024 2025 2026 2027 2028+ 11
Slide 12: Strong & Flexible Balance Sheet
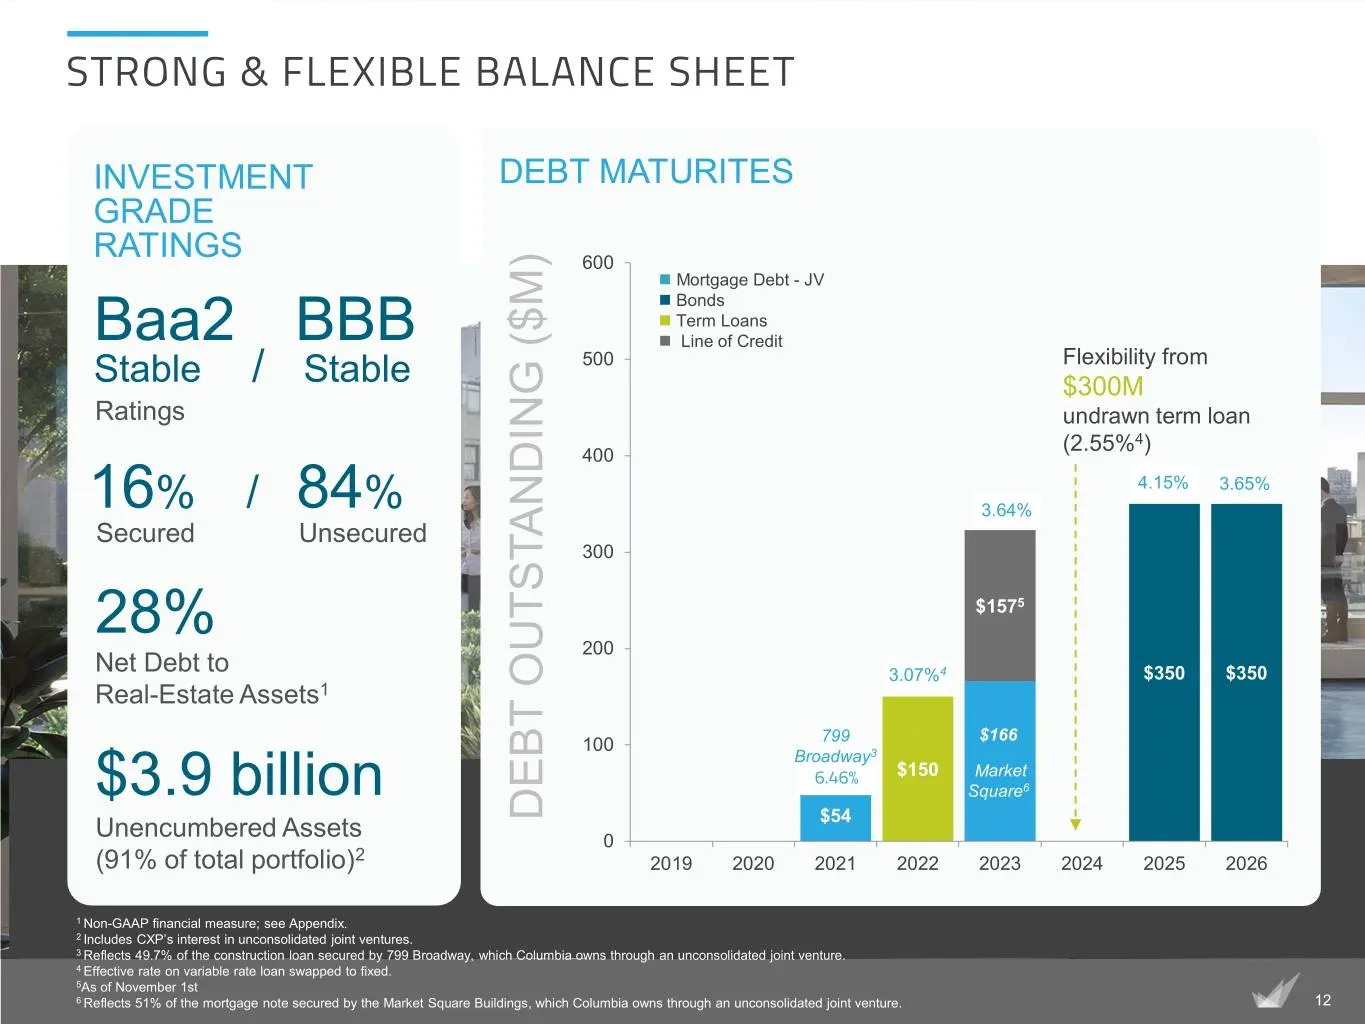
STRONG & FLEXIBLE BALANCE SHEET INVESTMENT DEBT MATURITES GRADE RATINGS 600 Mortgage Debt - JV Bonds Term Loans Baa2 BBB Line of Credit 500 Flexibility from Stable / Stable $300M Ratings undrawn term loan (2.55%4) 400 4.15% 3.65% 16% / 84% 3.64% Secured Unsecured 300 28% $1575 200 Net Debt t

Slide 13: Redeveloped Portfolio
REDEVELOPED PORTFOLIO Modest capital needs going forward Portfolio has recently received substantial renovations Properties now positioned among best-in-class for competitive sets 13
Slide 14: Commitment to Corporate Responsibility
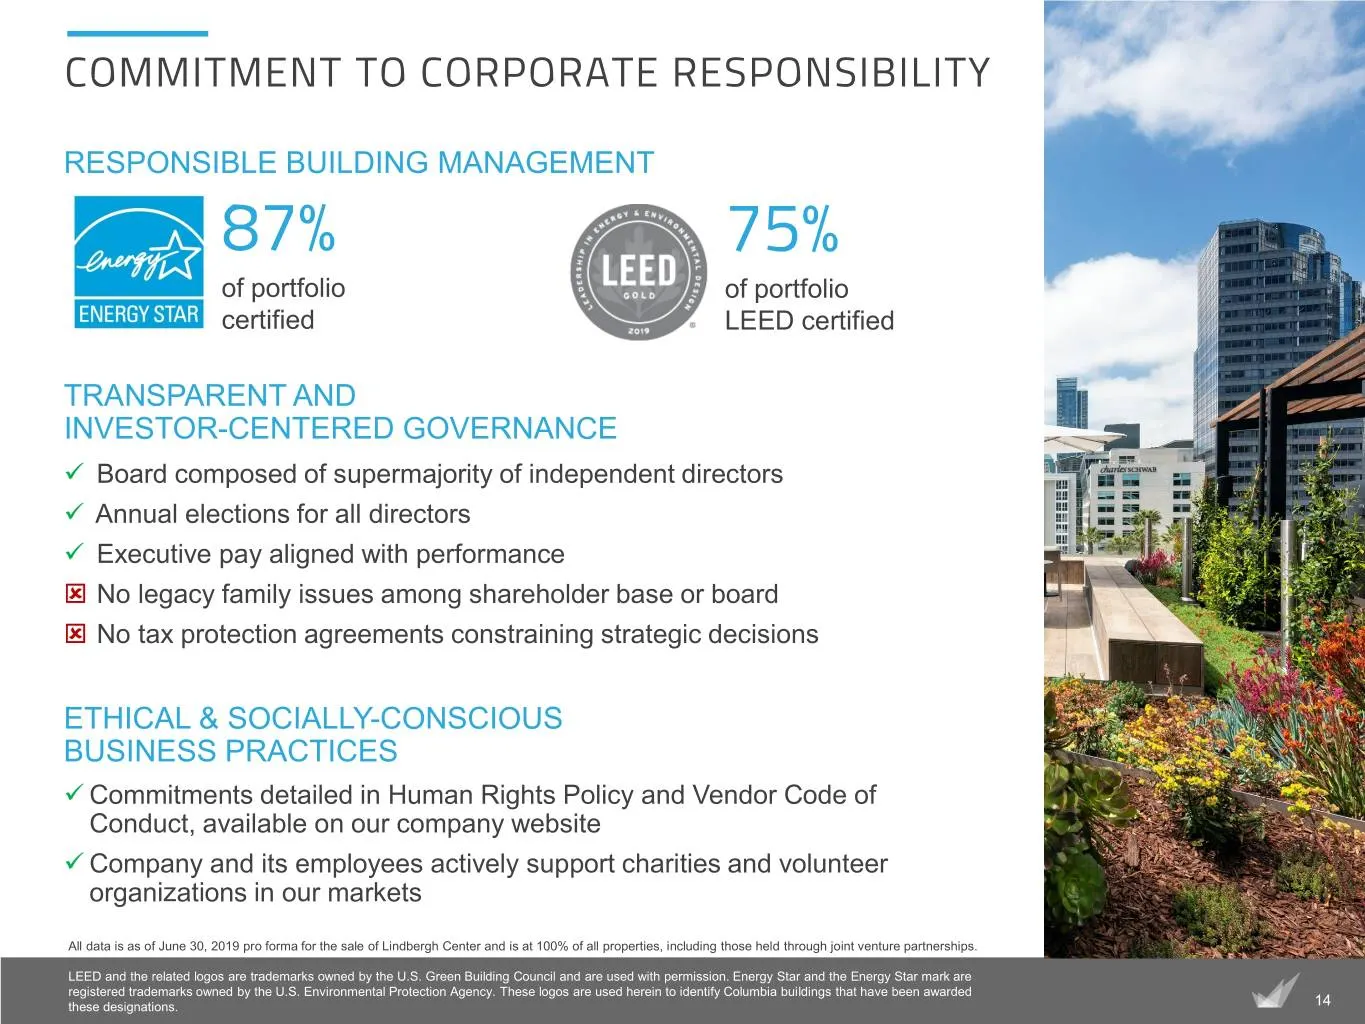
COMMITMENT TO CORPORATE RESPONSIBILITY RESPONSIBLE BUILDING MANAGEMENT 87% 75% of portfolio of portfolio certified LEED certified TRANSPARENT AND INVESTOR-CENTERED GOVERNANCE Board composed of supermajority of independent directors Annual elections for all directors Executive pay aligned with
Slide 15: Enhancing the Platform: Acquisition of Normandy Real Estate Partners
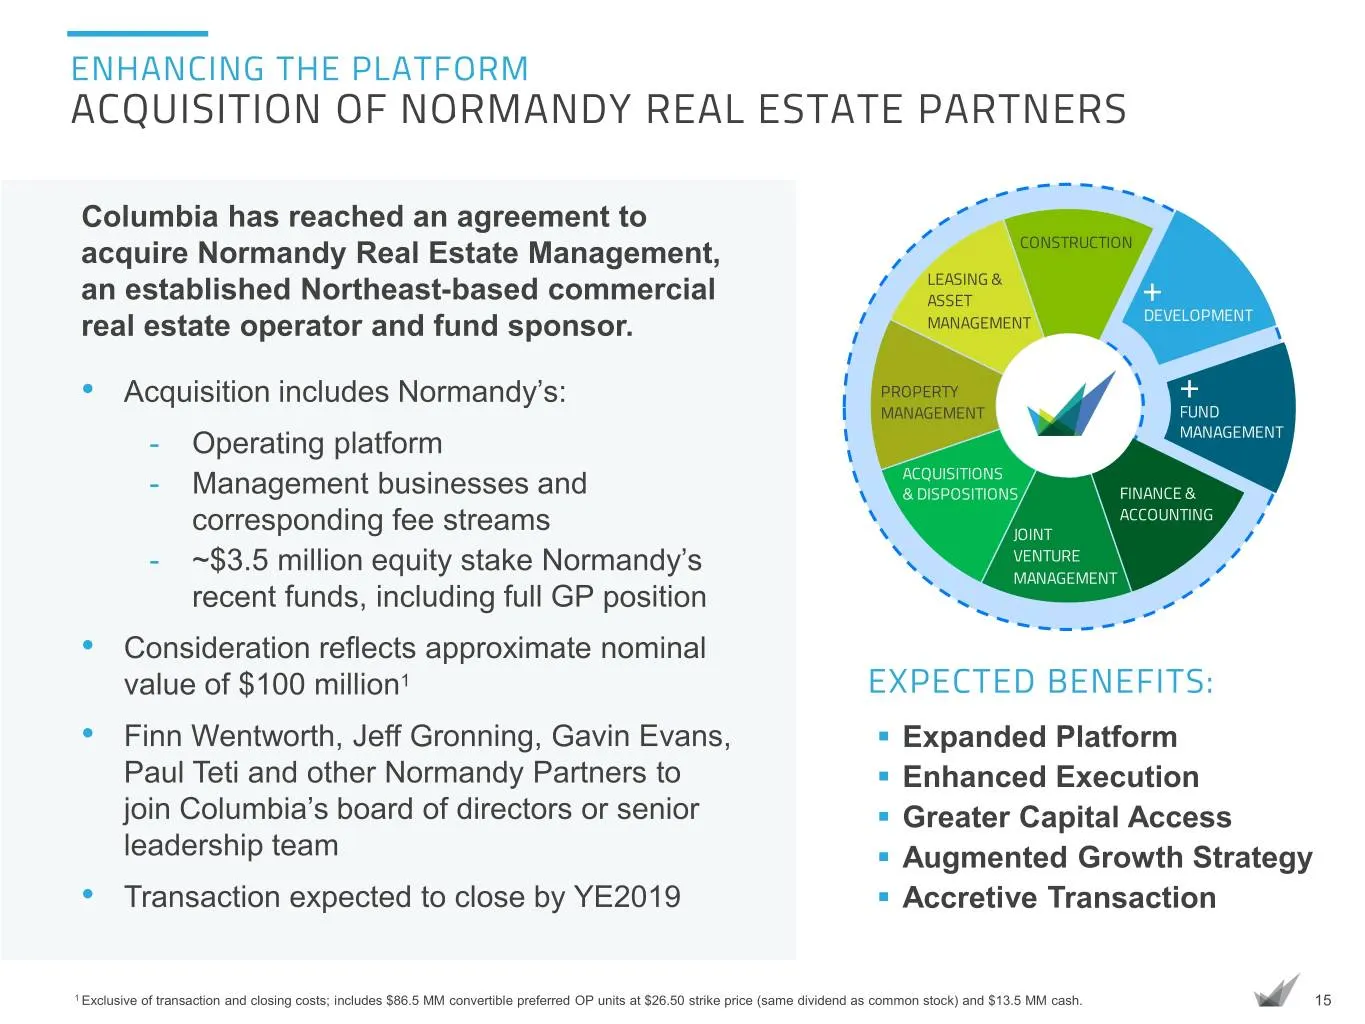
ENHANCING THE PLATFORM ACQUISITION OF NORMANDY REAL ESTATE PARTNERS Columbia has reached an agreement to acquire Normandy Real Estate Management, CONSTRUCTION LEASING & + an established Northeast-based commercial ASSET + real estate operator and fund sponsor. MANAGEMENT DEVELOPMENT + • Acquisition i

Slide 16: Case Studies
CASE STUDIES 16
Slide 17: Park Avenue South
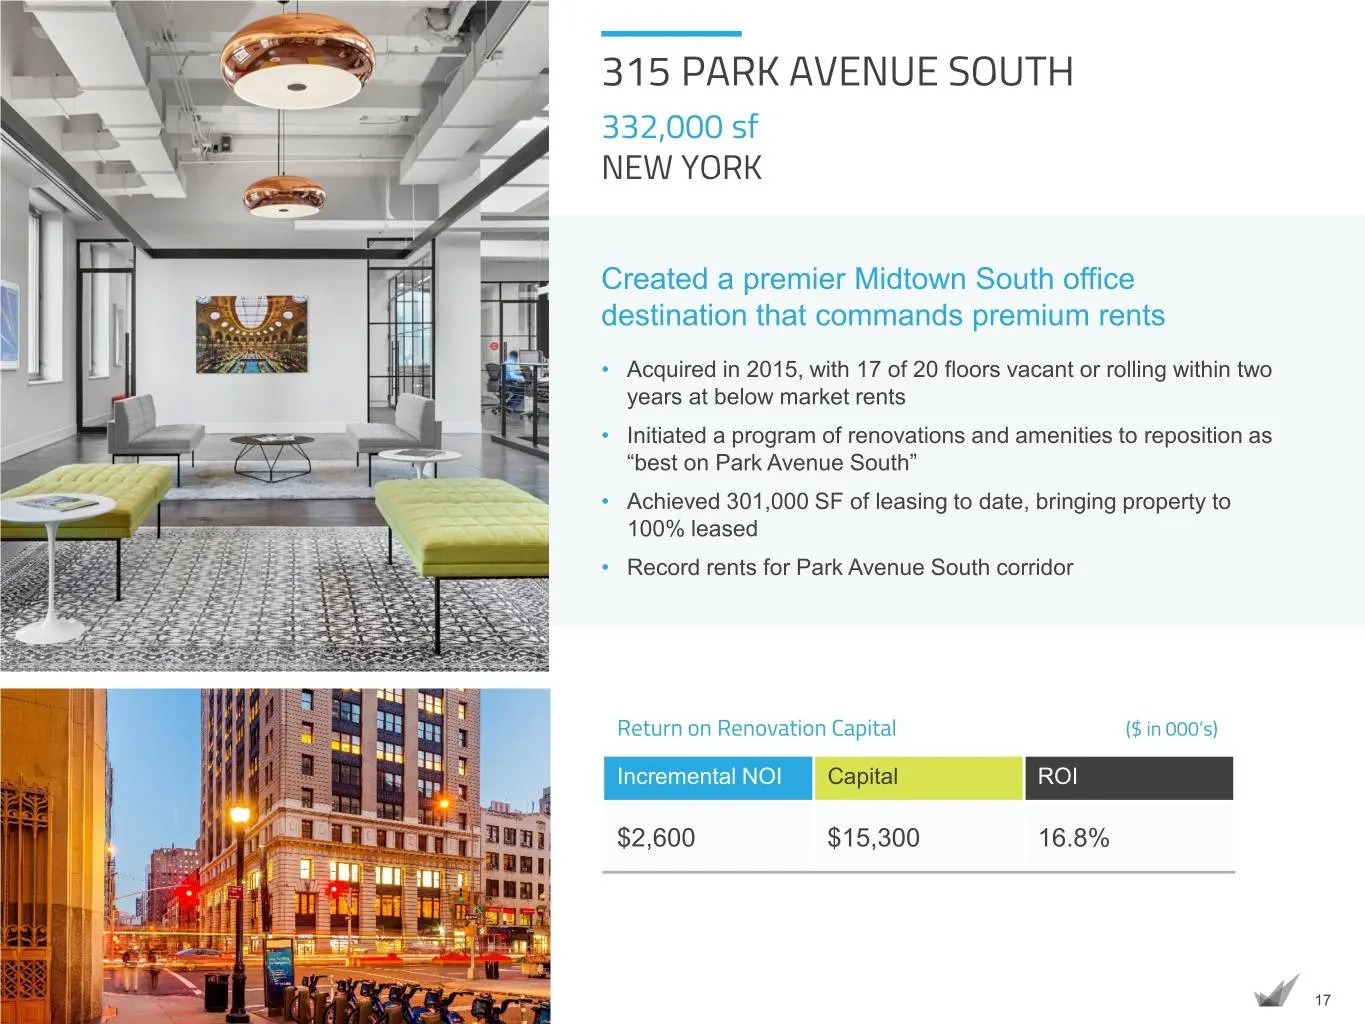
APPENDIX: Case Studies 315 PARK AVENUE SOUTH 332,000 sf NEW YORK Created a premier Midtown South office destination that commands premium rents • Acquired in 2015, with 17 of 20 floors vacant or rolling within two years at below market rents • Initiated a program of renovations and amenities to repo
Slide 18: M Street
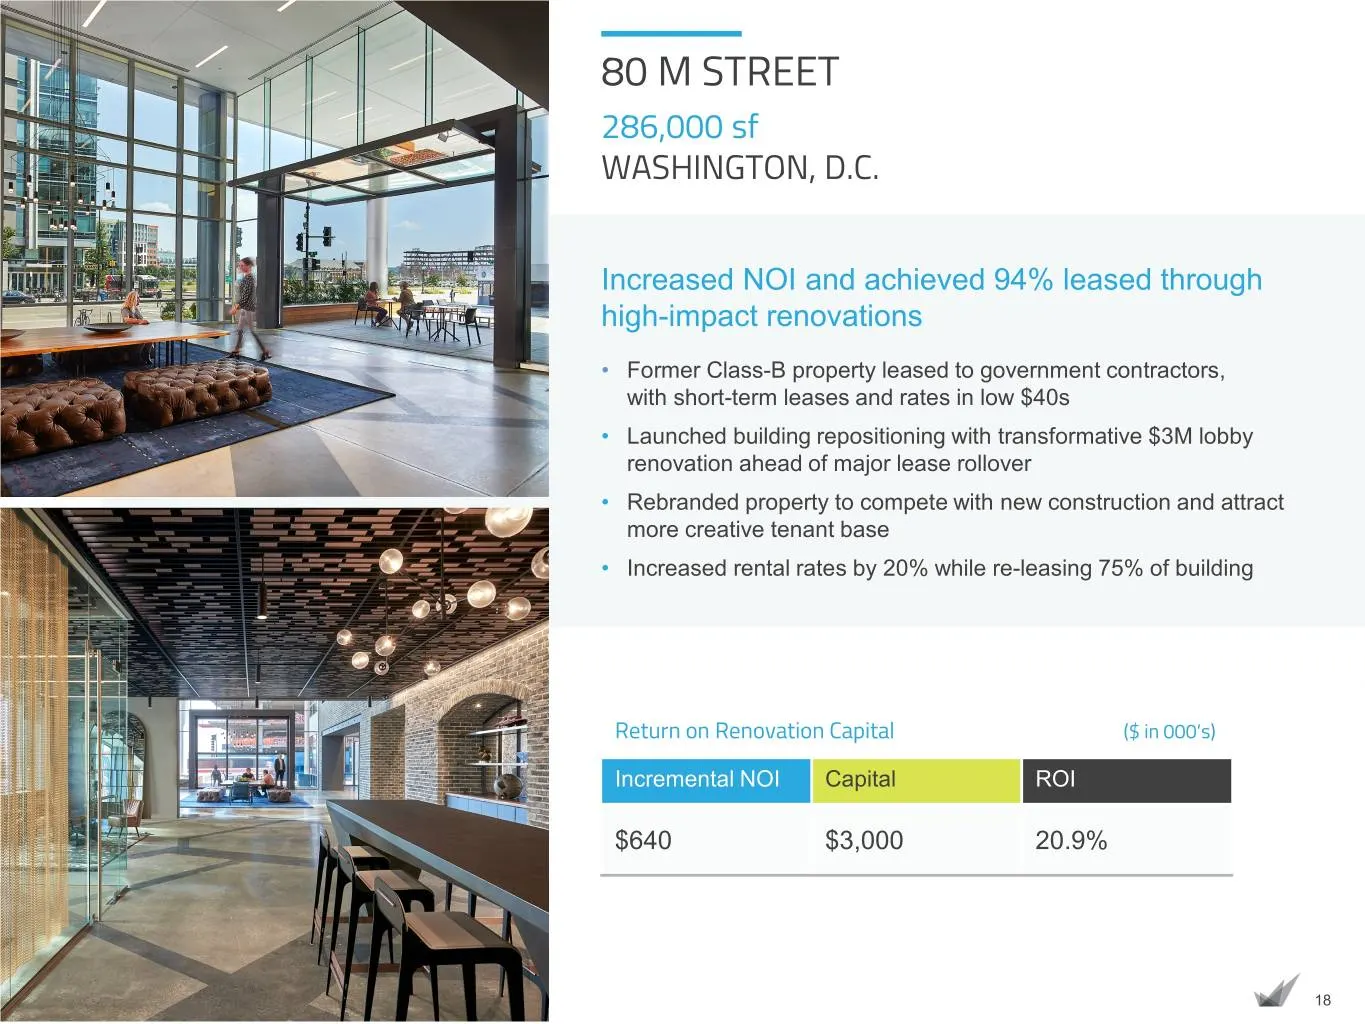
80 M STREET 286,000 sf WASHINGTON, D.C. Increased NOI and achieved 94% leased through high-impact renovations • Former Class-B property leased to government contractors, with short-term leases and rates in low $40s • Launched building repositioning with transformative $3M lobby renovation ahead of m
Slide 19: Main Street
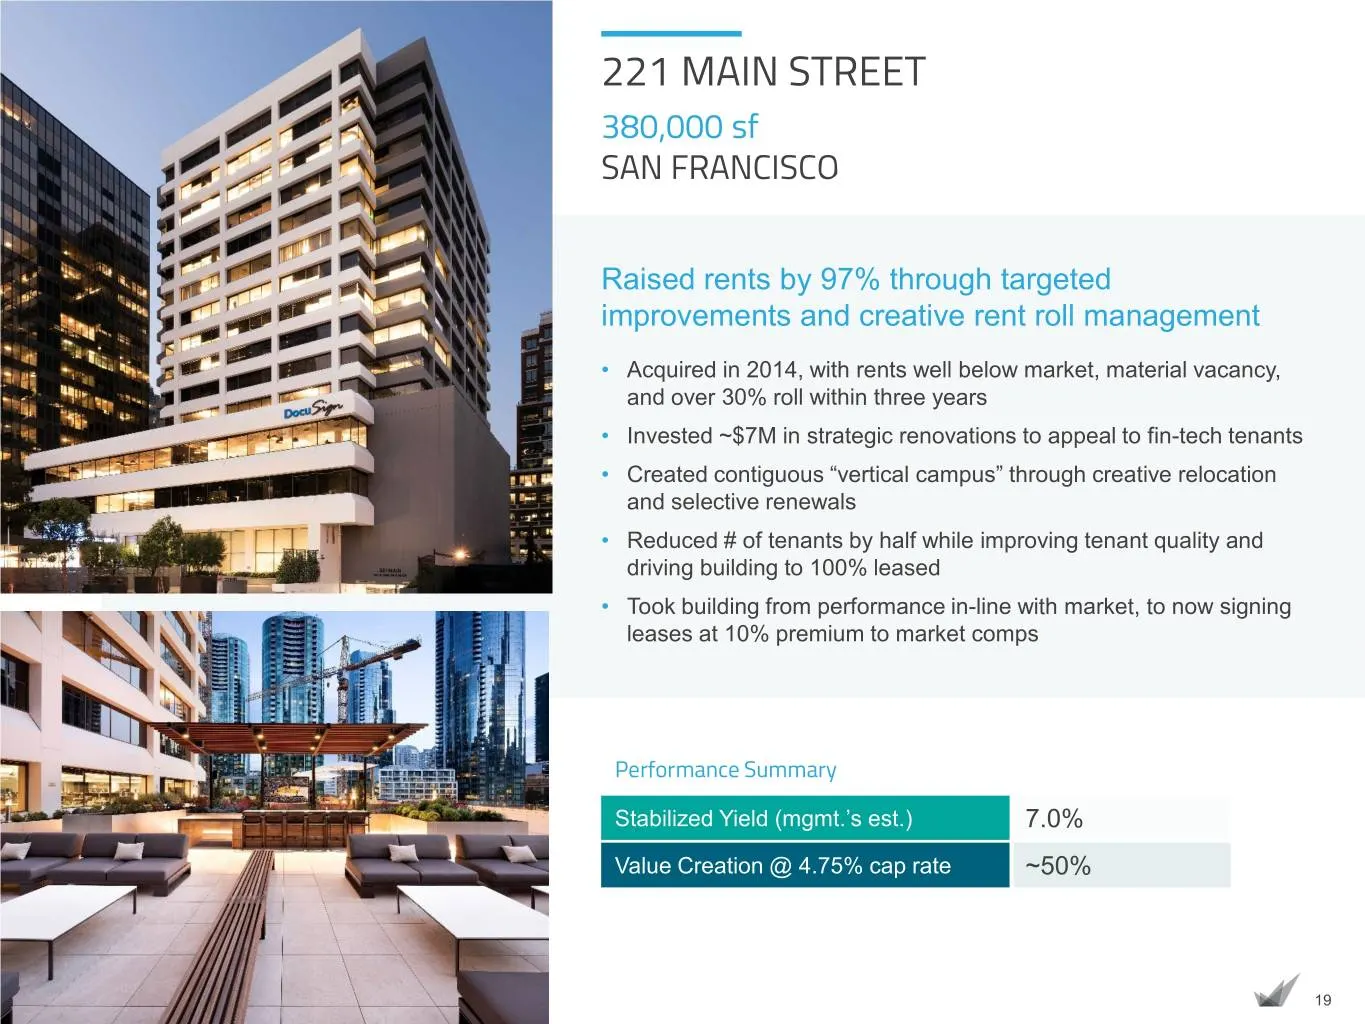
221 MAIN STREET 380,000 sf SAN FRANCISCO Raised rents by 97% through targeted improvements and creative rent roll management • Acquired in 2014, with rents well below market, material vacancy, and over 30% roll within three years • Invested ~$7M in strategic renovations to appeal to fin-tech tenants
Slide 20: Broadway
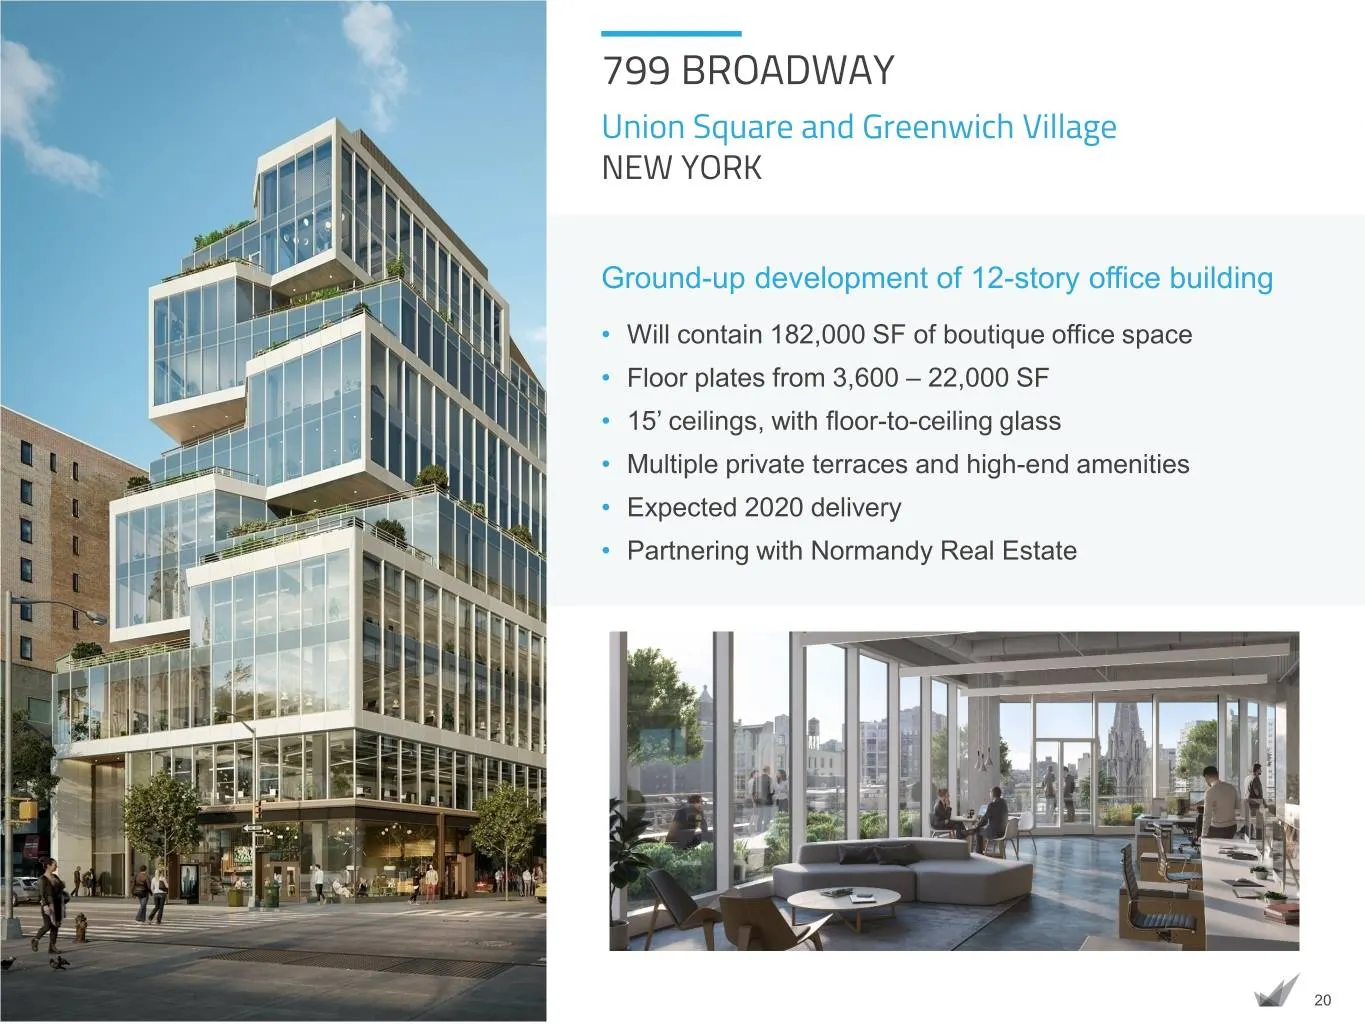
799 BROADWAY Union Square and Greenwich Village NEW YORK Ground-up development of 12-story office building • Will contain 182,000 SF of boutique office space • Floor plates from 3,600 – 22,000 SF • 15’ ceilings, with floor-to-ceiling glass • Multiple private terraces and high-end amenities • Expecte
Slide 21: Church Street
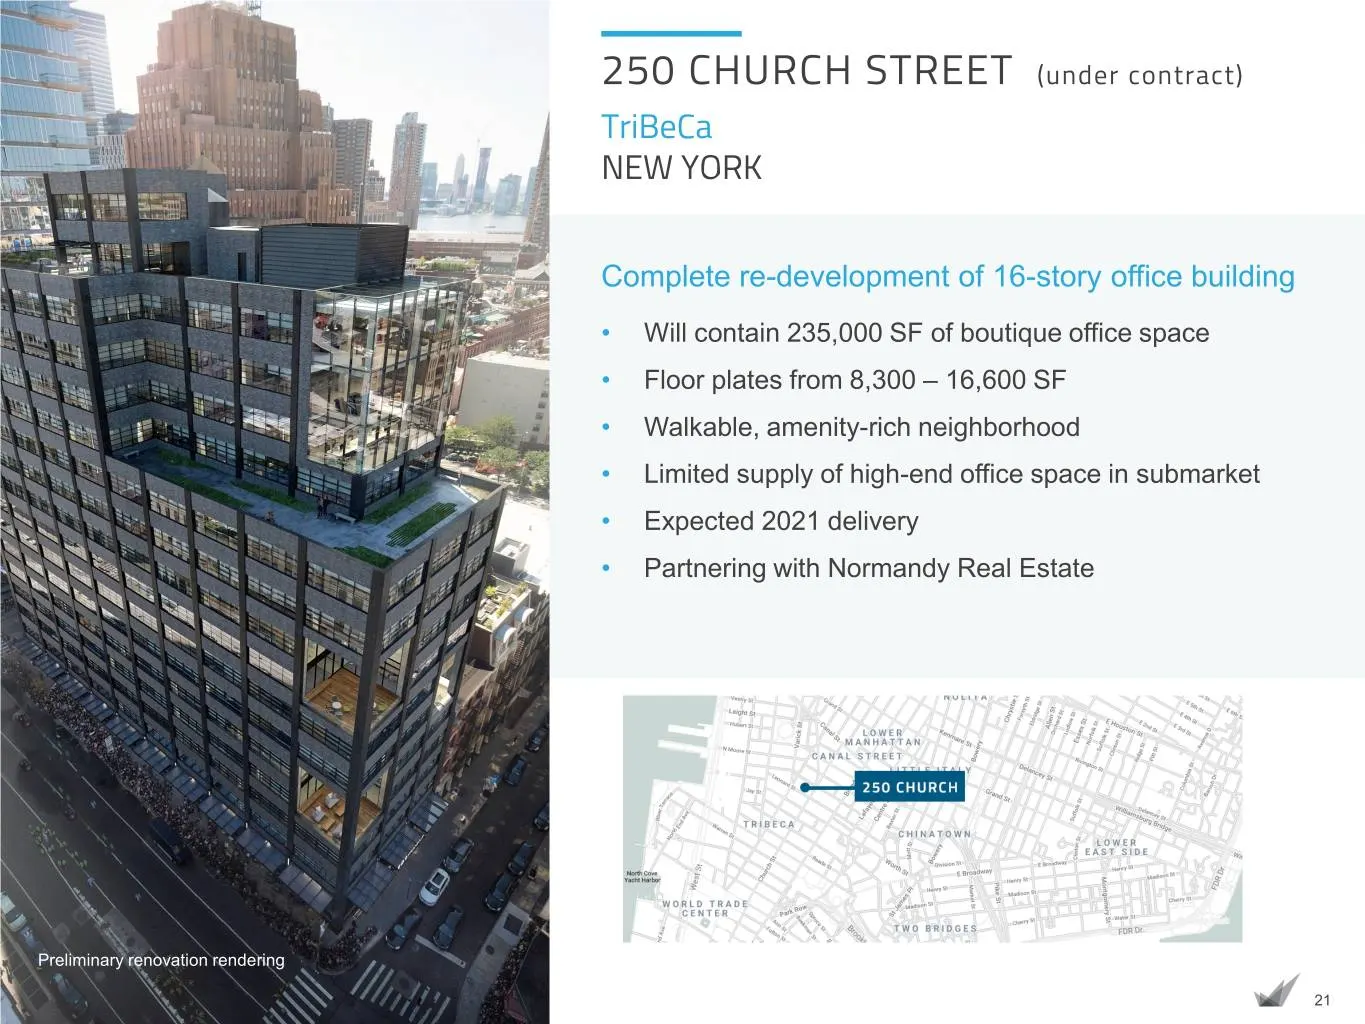
250 CHURCH STREET (under contract) TriBeCa NEW YORK Complete re-development of 16-story office building • Will contain 235,000 SF of boutique office space • Floor plates from 8,300 – 16,600 SF • Walkable, amenity-rich neighborhood • Limited supply of high-end office space in submarket • Expected 202

Slide 22: Appendix: For More Information
APPENDIX FOR MORE INFORMATION Columbia Property Trust INVESTOR RELATIONS 404.465.2227 www.columbia.reit ir@columbia.reit 22
Slide 23: Dramatic Rent Roll-Ups Driving Growth
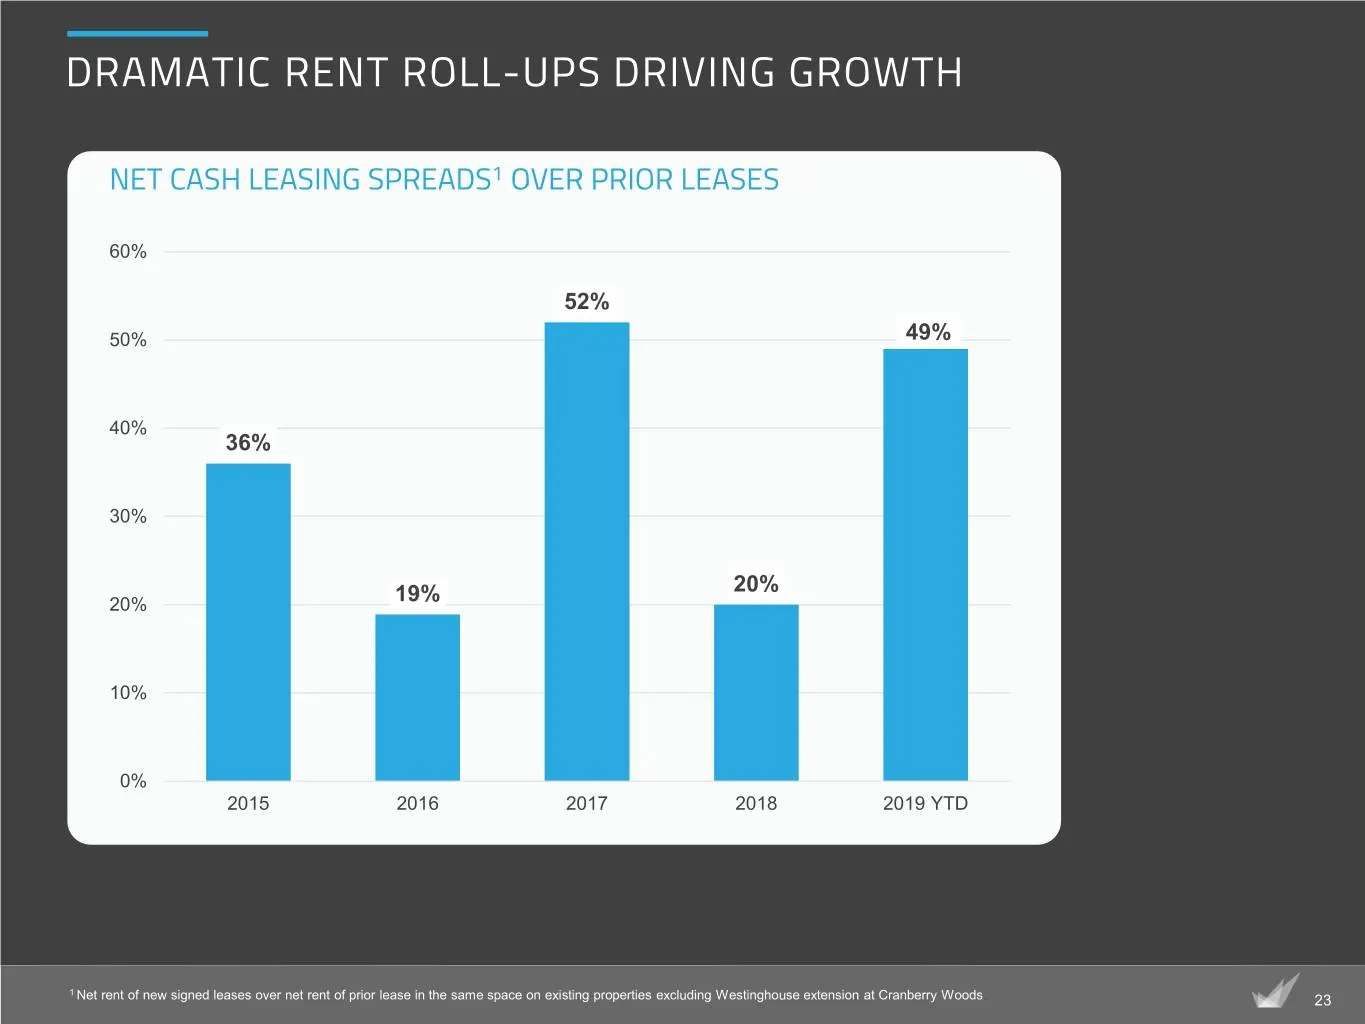
DRAMATIC RENT ROLL-UPS DRIVING GROWTH NET CASH LEASING SPREADS1 OVER PRIOR LEASES 60% 52% 50% 49% 40% 36% 30% 20% 20% 19% 10% 0% 2015 2016 2017 2018 2019 YTD 1 Net rent of new signed leases over net rent of prior lease in the same space on existing properties excluding Westinghouse extension at Cran
Slide 24: Joint Ventures
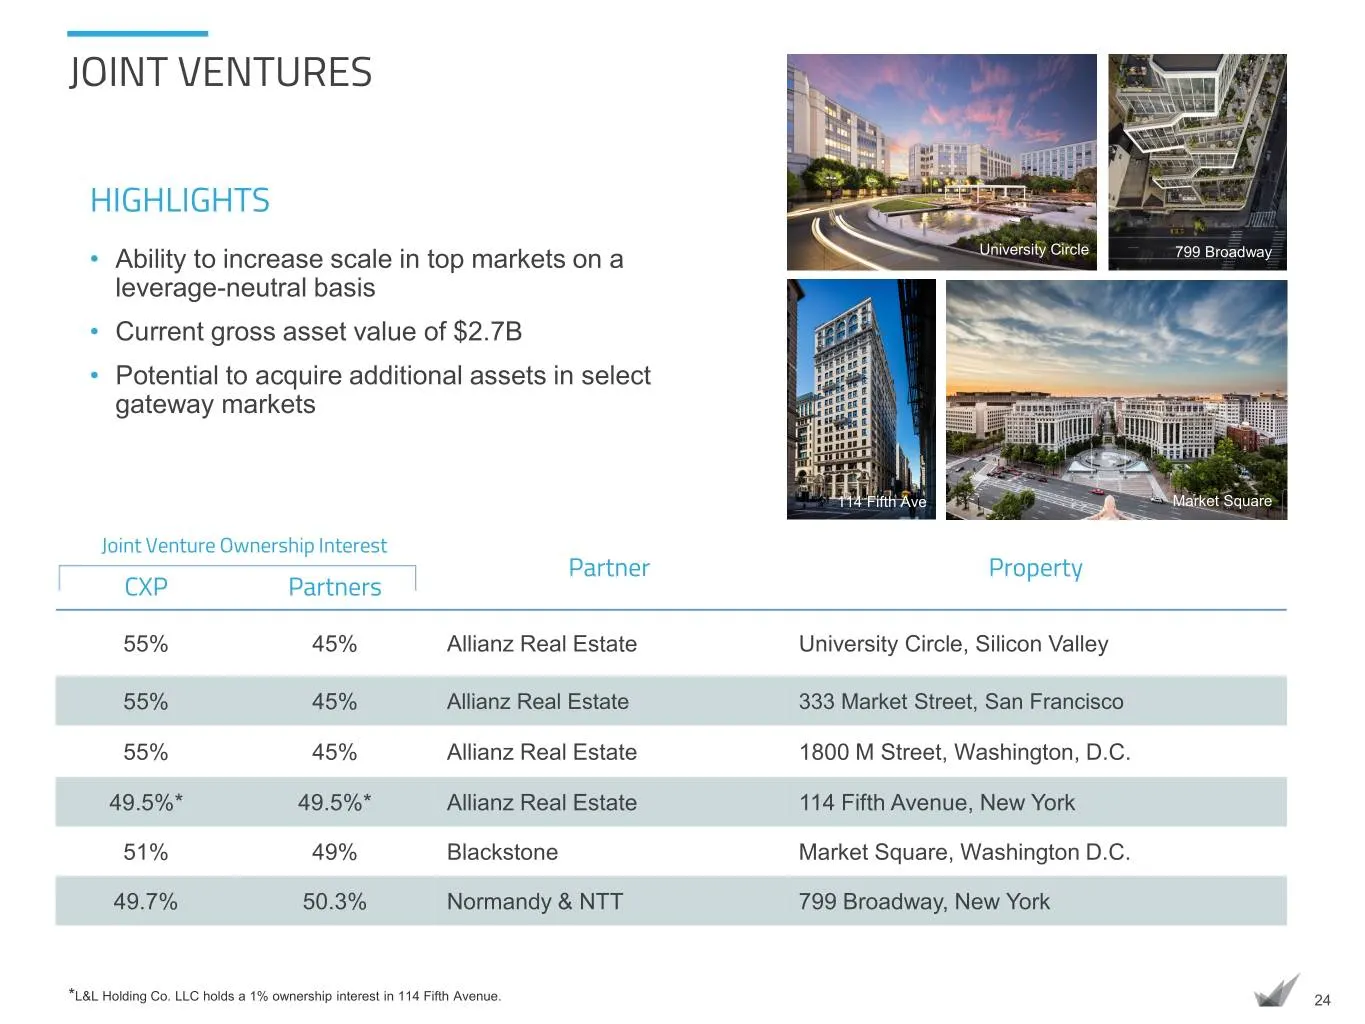
JOINT VENTURES HIGHLIGHTS • Ability to increase scale in top markets on a University Circle 799 Broadway leverage-neutral basis • Current gross asset value of $2.7B • Potential to acquire additional assets in select gateway markets 114 Fifth Ave Market Square Joint Venture Ownership Interest Partner

Slide 25: Leadership Team
LEADERSHIP TEAM NELSON MILLS JIM FLEMING LINDA BOLAN DAVID CHEIKIN BILL CAMPBELL KELLY LIM DOUG MCDONALD MICHAEL SCHMIDT President and CEO Executive VP and CFO SVP, Property SVP, Strategic Real VP, Construction VP, Asset VP, Finance VP, Asset Management and Estate Initiatives Management Management S
Slide 26: Forward-Looking Statements
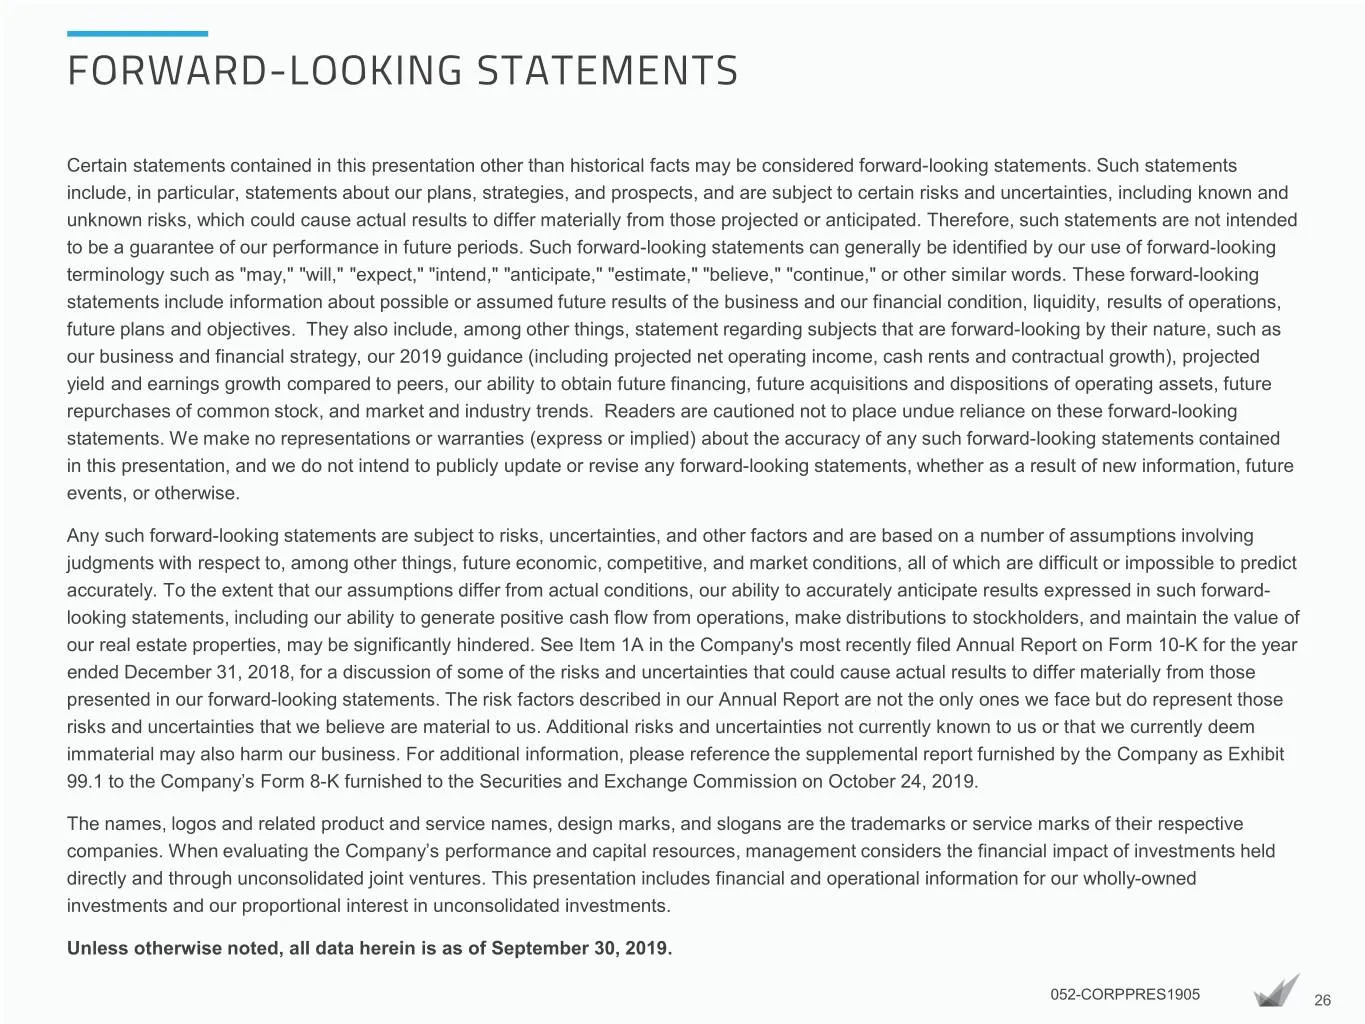
FORWARD-LOOKING STATEMENTS Certain statements contained in this presentation other than historical facts may be considered forward-looking statements. Such statements include, in particular, statements about our plans, strategies, and prospects, and are subject to certain risks and uncertainties, in
Slide 27: Reconciliations: Non-GAAP to Comparable GAAP Measures
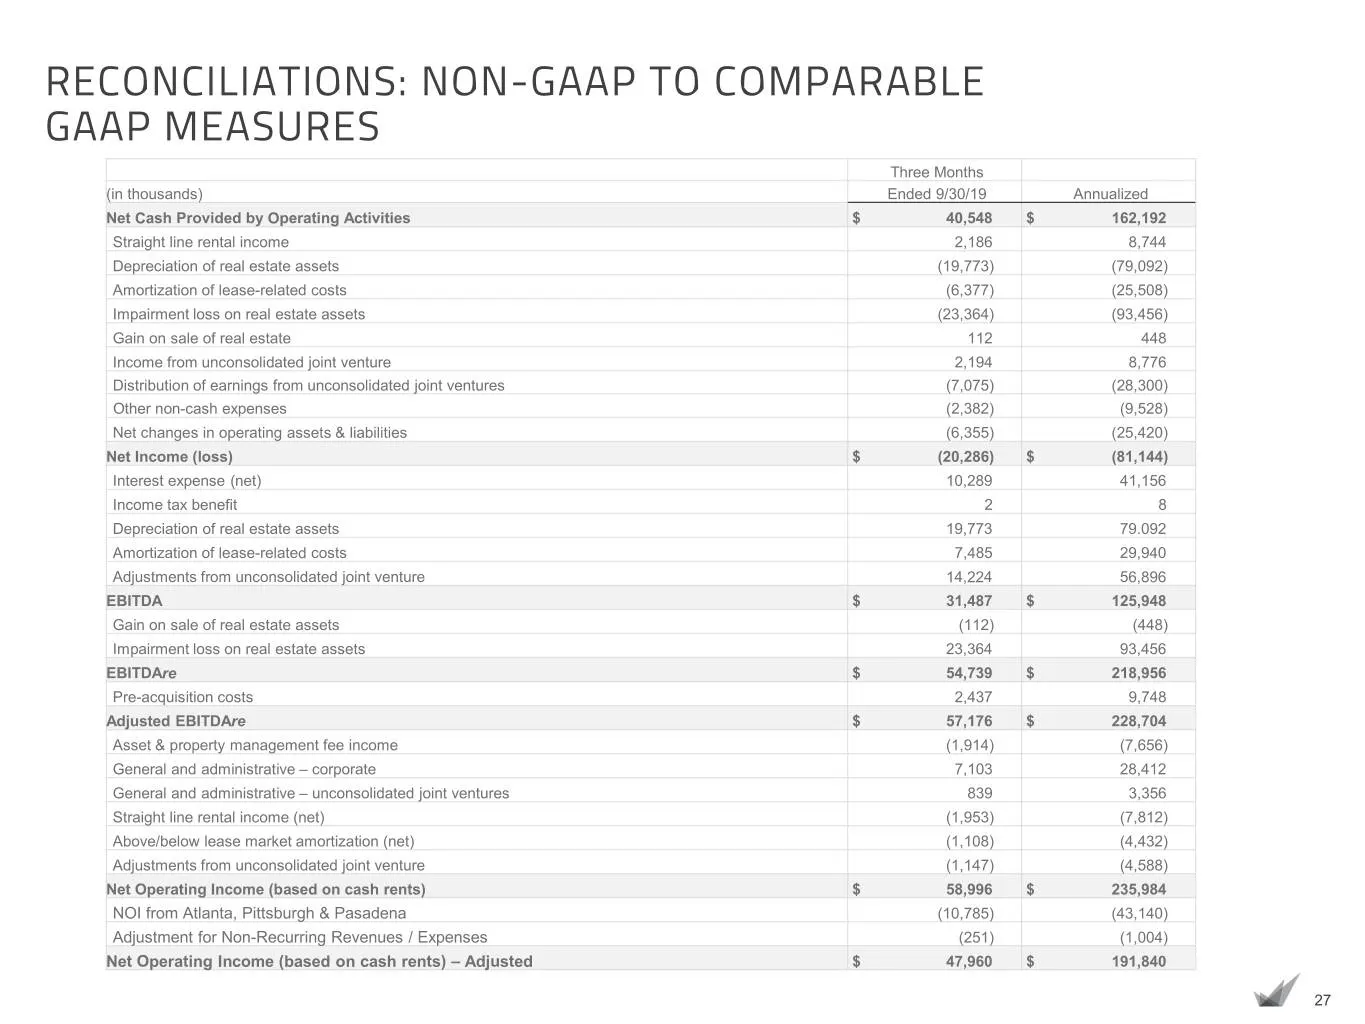
RECONCILIATIONS: NON-GAAP TO COMPARABLE GAAP MEASURES Three Months (in thousands) Ended 9/30/19 Annualized Net Cash Provided by Operating Activities $ 40,548 $ 162,192 Straight line rental income 2,186 8,744 Depreciation of real estate assets (19,773) (79,092) Amortization of lease-related costs (6,
Slide 28: Reconciliations: Non-GAAP to Comparable GAAP Measures
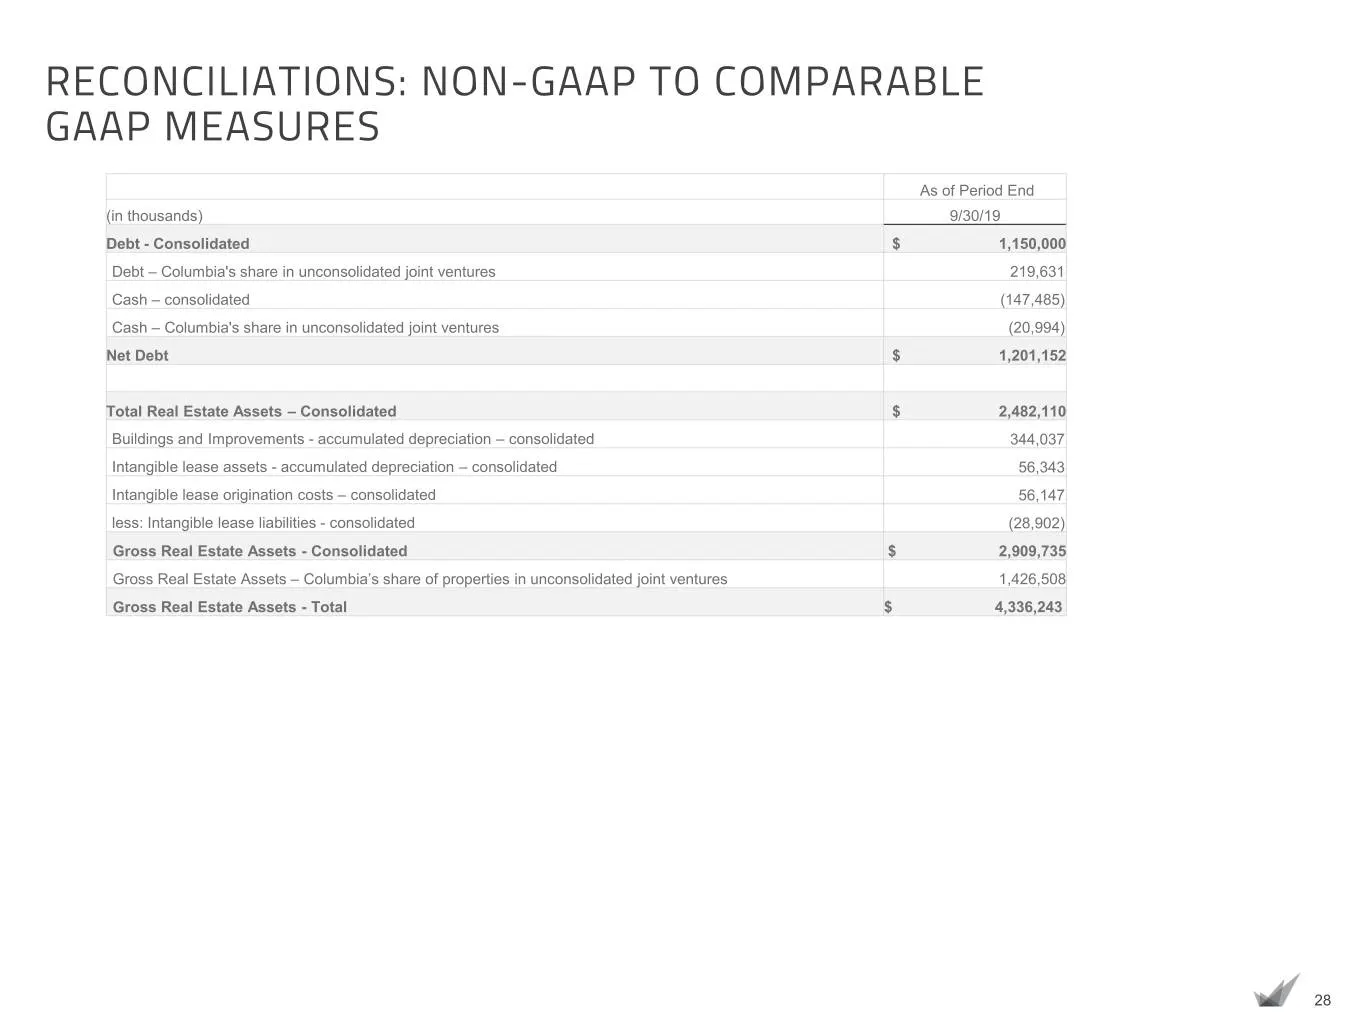
RECONCILIATIONS: NON-GAAP TO COMPARABLE GAAP MEASURES As of Period End (in thousands) 9/30/19 Debt - Consolidated $ 1,150,000 Debt – Columbia's share in unconsolidated joint ventures 219,631 Cash – consolidated (147,485) Cash – Columbia's share in unconsolidated joint ventures (20,994) Net Debt $ 1,
Source: SEC EDGAR · 8-K filed Nov 12, 2019
More decks from Columbia Property Trust Inc
 Investor Presentation (November 2020)33 slides · Nov 17, 2020
 Investor Presentation (August 2020)34 slides · Aug 31, 2020
 Investor Presentation (June 2020)34 slides · Jun 1, 2020
 Investor Presentation (February 2020)29 slides · Feb 26, 2020
 Corporate Update (December 2019)12 slides · Dec 3, 2019
 Merger or Acquisition (October 2019)10 slides · Oct 16, 2019