Evoqua Water Technologies — Credit Suisse Industrials Conference 2019
15 slides from Evoqua Water Technologies's conference presentation, Dec 4, 2019

Slide 1: Credit Suisse Industrials Conference December 5, 2019
Credit Suisse Industrials Conference December 5, 2019 TRANSFORMING WATER. ENRICHING LIFE.TM ©2019 Evoqua Water Technologies
Slide 2: Forward-Looking Statement Safe Harbor
Forward-Looking Statement Safe Harbor This presentation contains forward-looking statements within the meaning of the Private Securities Litigation Reform Act of 1995. All of these forward-looking statements are based on our current expectations, assumptions, estimates and projections. While we beli
Slide 3: Helping Solve the World's Most Pressing Water Issues
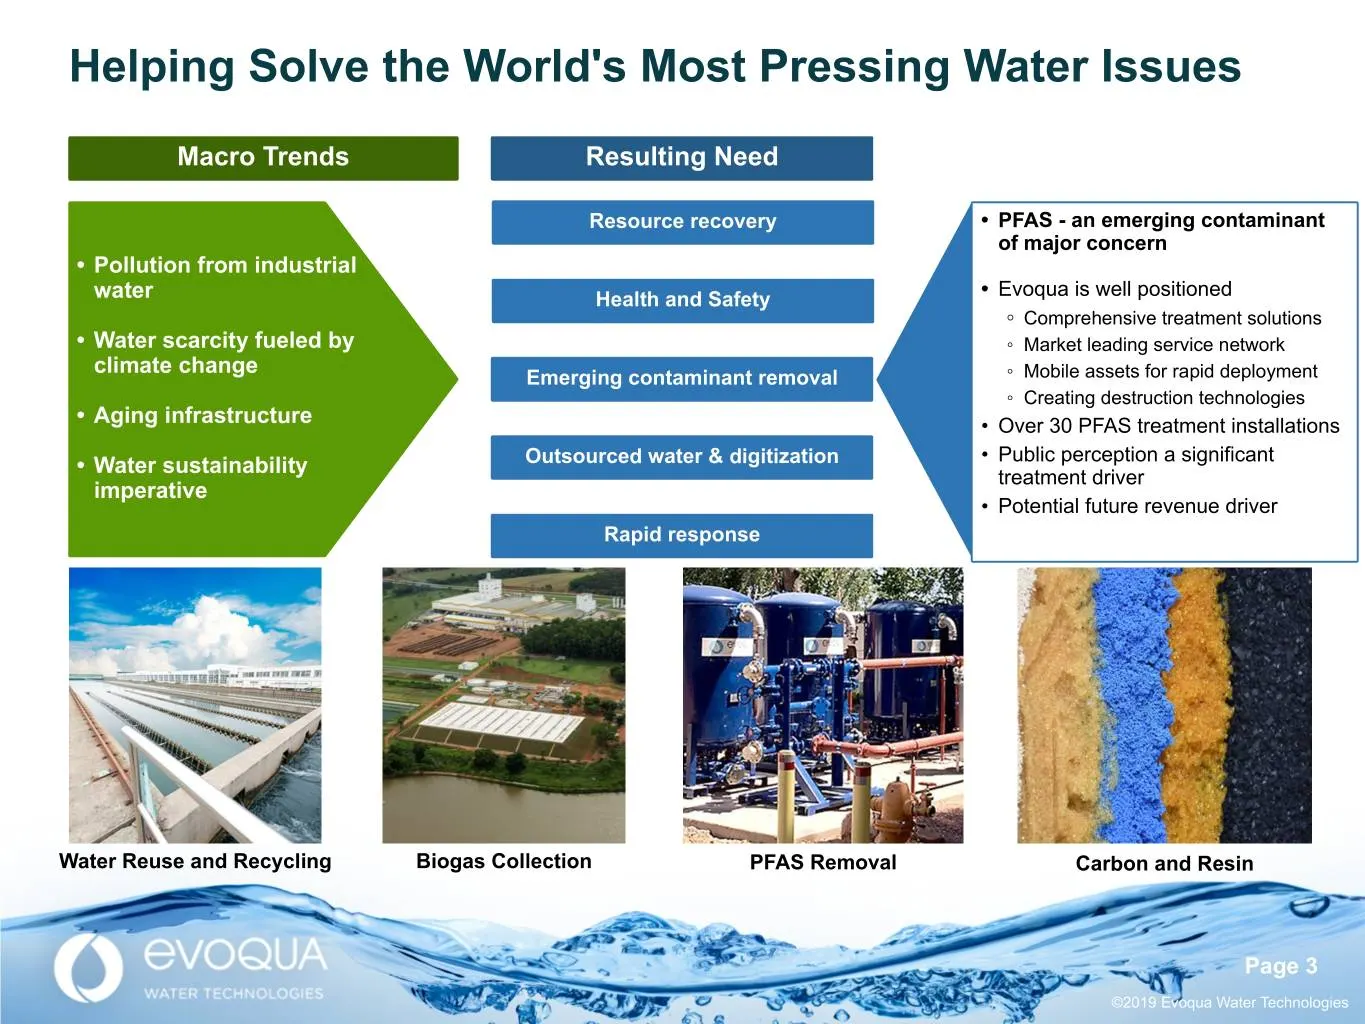
Helping Solve the World's Most Pressing Water Issues Macro Trends Resulting Need Resource recovery • PFAS - an emerging contaminant of major concern • Pollution from industrial • Evoqua is well positioned water Health and Safety ◦ Comprehensive treatment solutions • Water scarcity fueled by ◦ Market
Slide 4: Evoqua's digitally enabled go-to-market approach
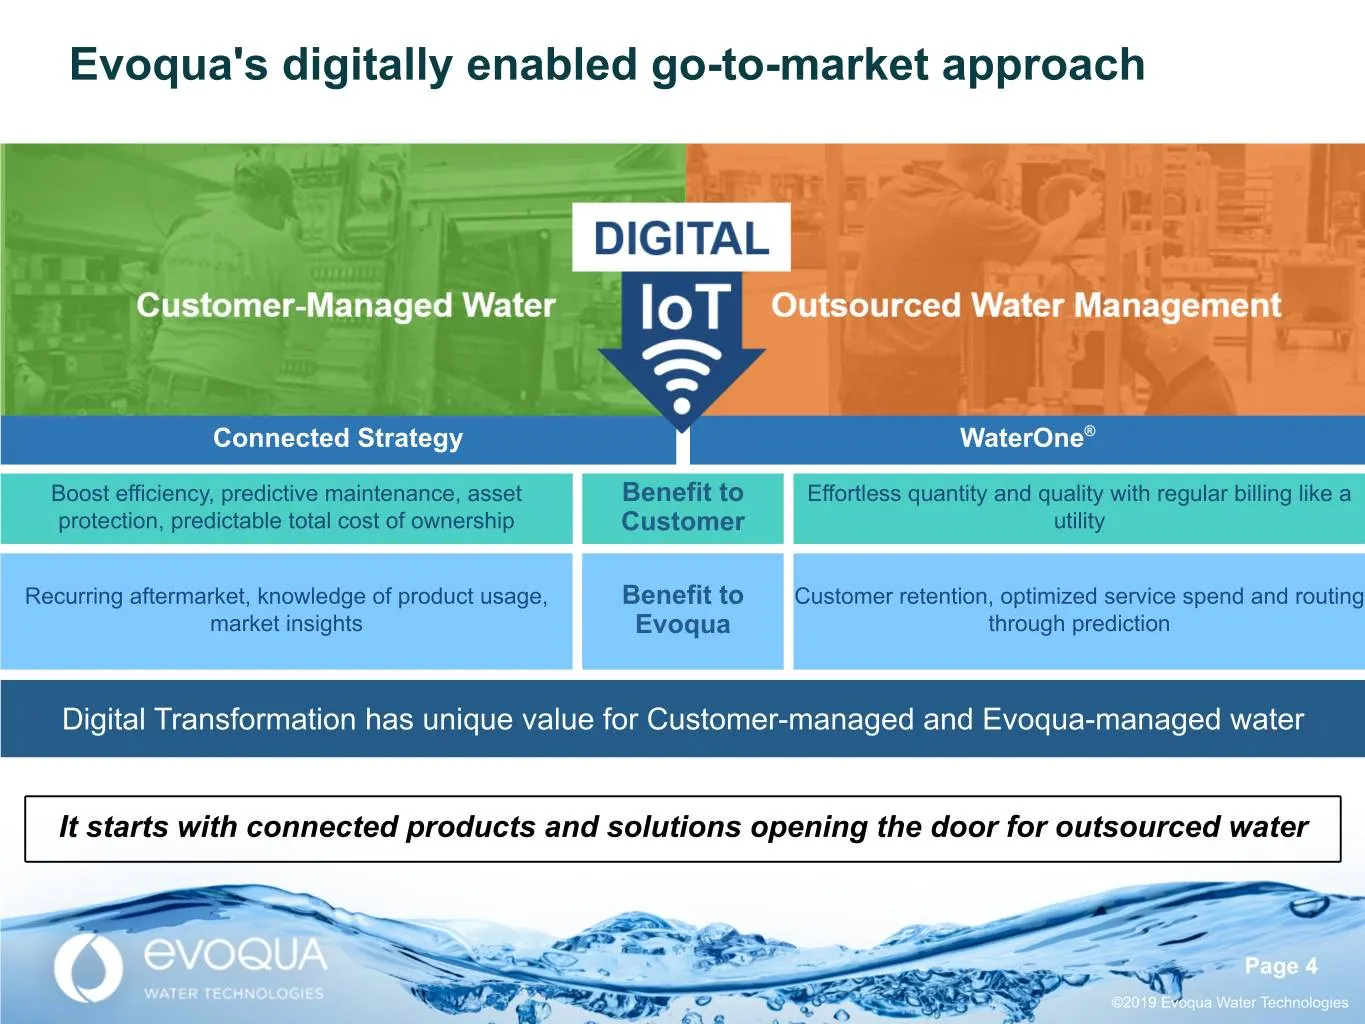
Evoqua's digitally enabled go-to-market approach Connected Strategy WaterOne® Boost efficiency, predictive maintenance, asset Benefit to Effortless quantity and quality with regular billing like a protection, predictable total cost of ownership Customer utility Recurring aftermarket, knowledge of pr
Slide 5: LTM revenue and profitability development
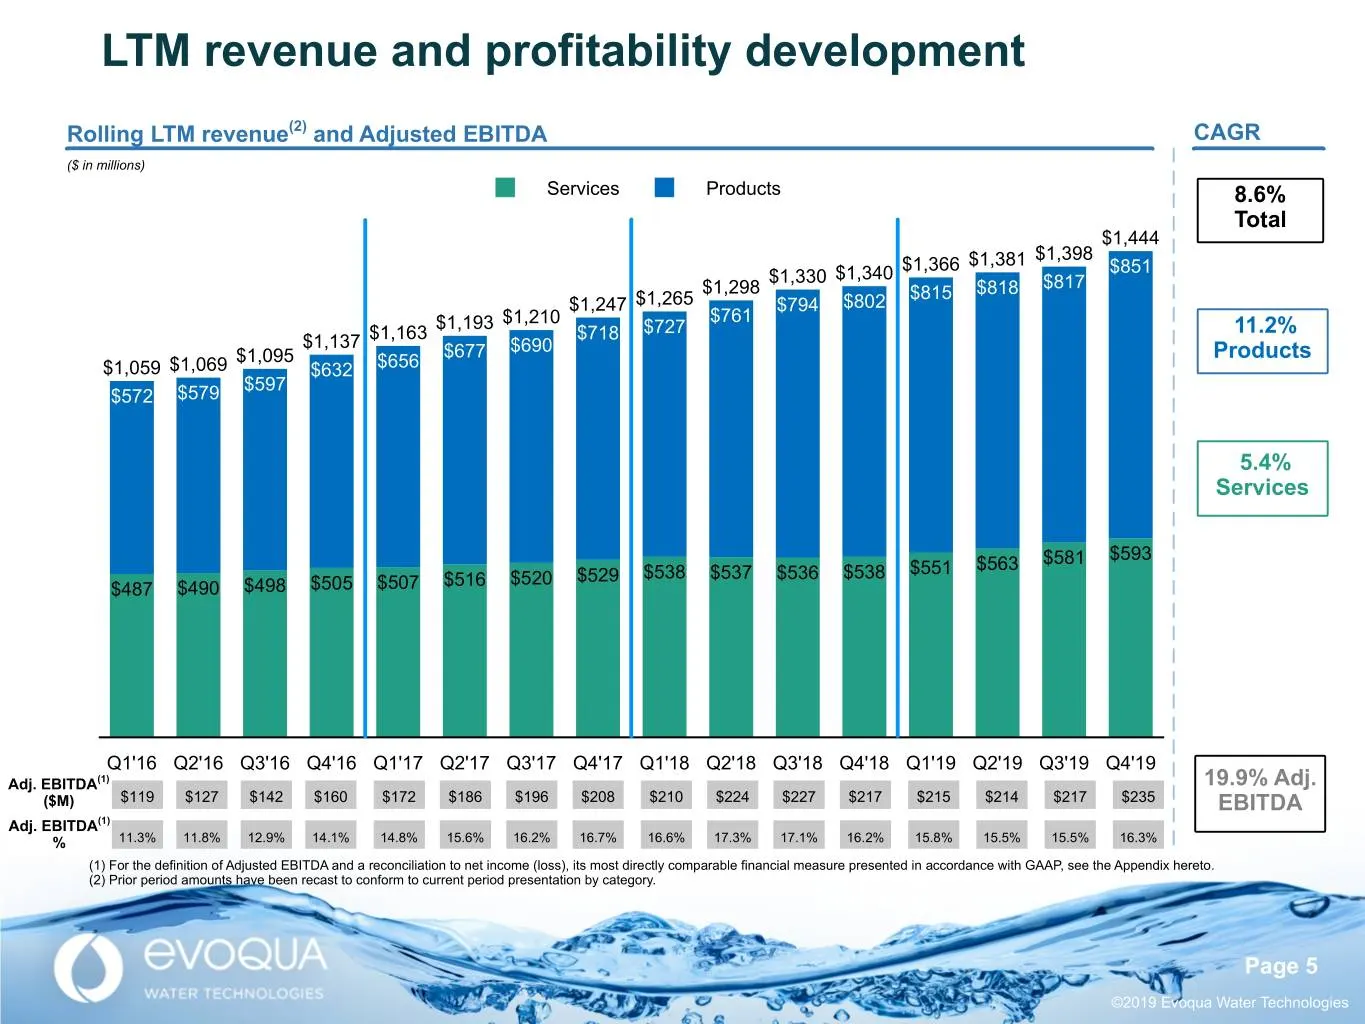
LTM revenue and profitability development xx Rolling LTM revenue(2) and Adjusted EBITDA CAGR% ($ in millions) Services Products 8.6% Total $1,444 $1,398 $1,366 $1,381 $851 $1,330 $1,340 $817 $1,298 $815 $818 $1,247 $1,265 $794 $802 $1,193 $1,210 $761 $1,163 $718 $727 11.2% $1,137 $690 $1,095 $677 Pr
Slide 6: Recent Portfolio Activity
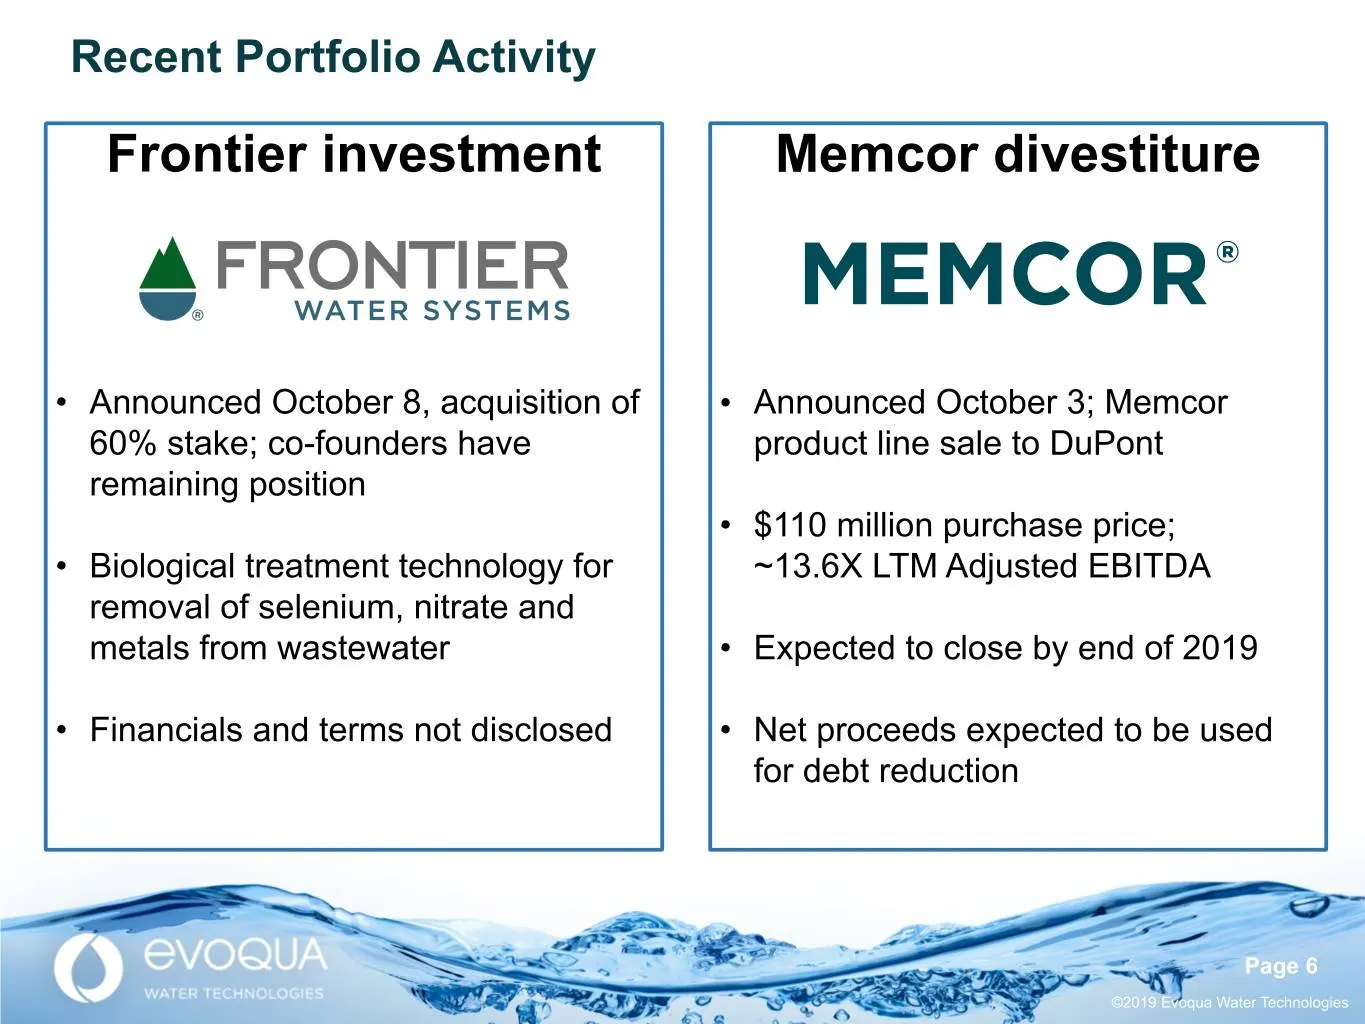
Recent Portfolio Activity Frontier investment Memcor divestiture • Announced October 8, acquisition of • Announced October 3; Memcor 60% stake; co-founders have product line sale to DuPont remaining position • $110 million purchase price; • Biological treatment technology for ~13.6X LTM Adjusted EBI
Slide 7: Quarterly revenue and profitability results
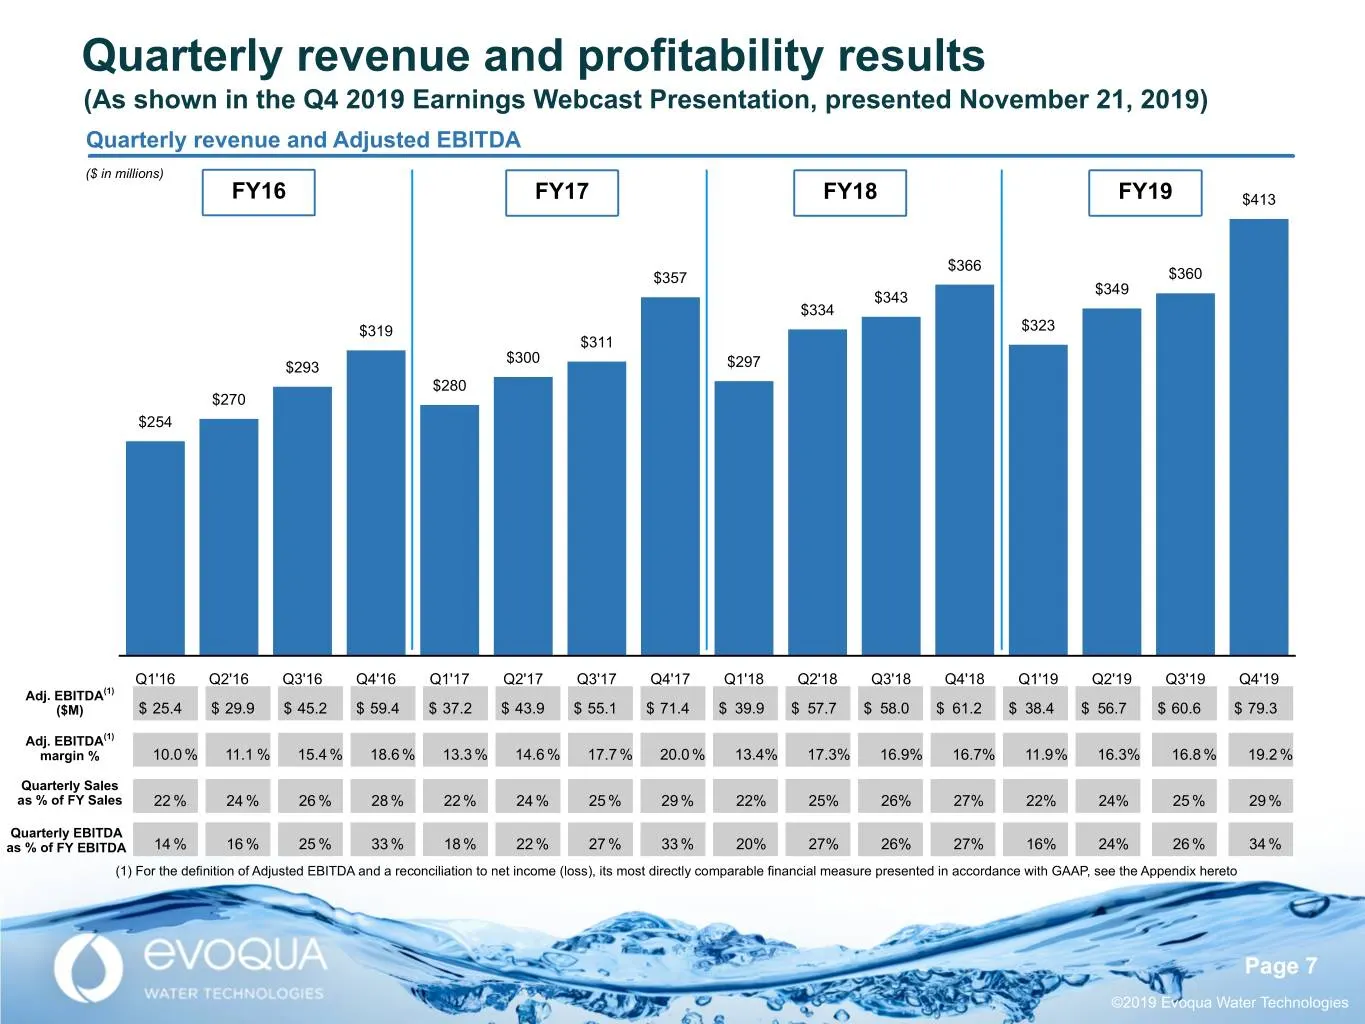
Quarterly revenue and profitability results (As shown in the Q4 2019 Earnings Webcast Presentation, presented November 21, 2019) Quarterly revenue and Adjusted EBITDA ($ in millions) FY16 FY17 FY18 FY19 $413 $367 $366 $357 $360 $349 $343 $334 $319 $323 $311 $300 $293 $297 $280 $270 $254 Q1'16 Q2'16
Slide 8: 2020 Full-Year Outlook
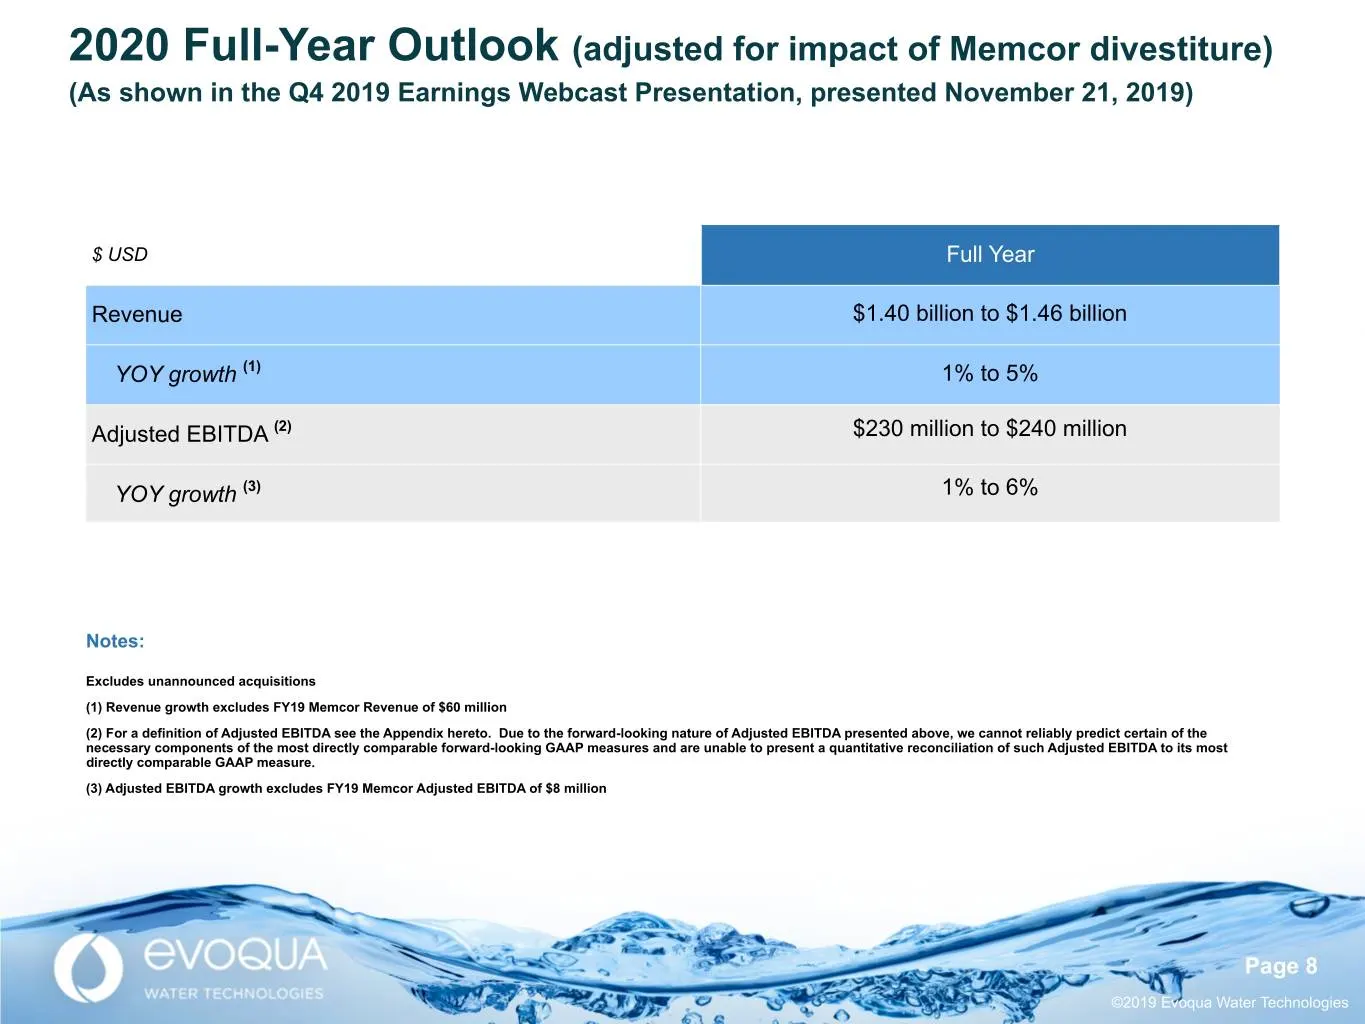
2020 Full-Year Outlook (adjusted for impact of Memcor divestiture) (As shown in the Q4 2019 Earnings Webcast Presentation, presented November 21, 2019) $ USD Full Year Revenue $1.40 billion to $1.46 billion YOY growth (1) 1% to 5% Adjusted EBITDA (2) $230 million to $240 million YOY growth (3) 1% to
Slide 9: Appendix
Appendix Page 9 ©2019 Evoqua Water Technologies
Slide 10: Non-GAAP measures
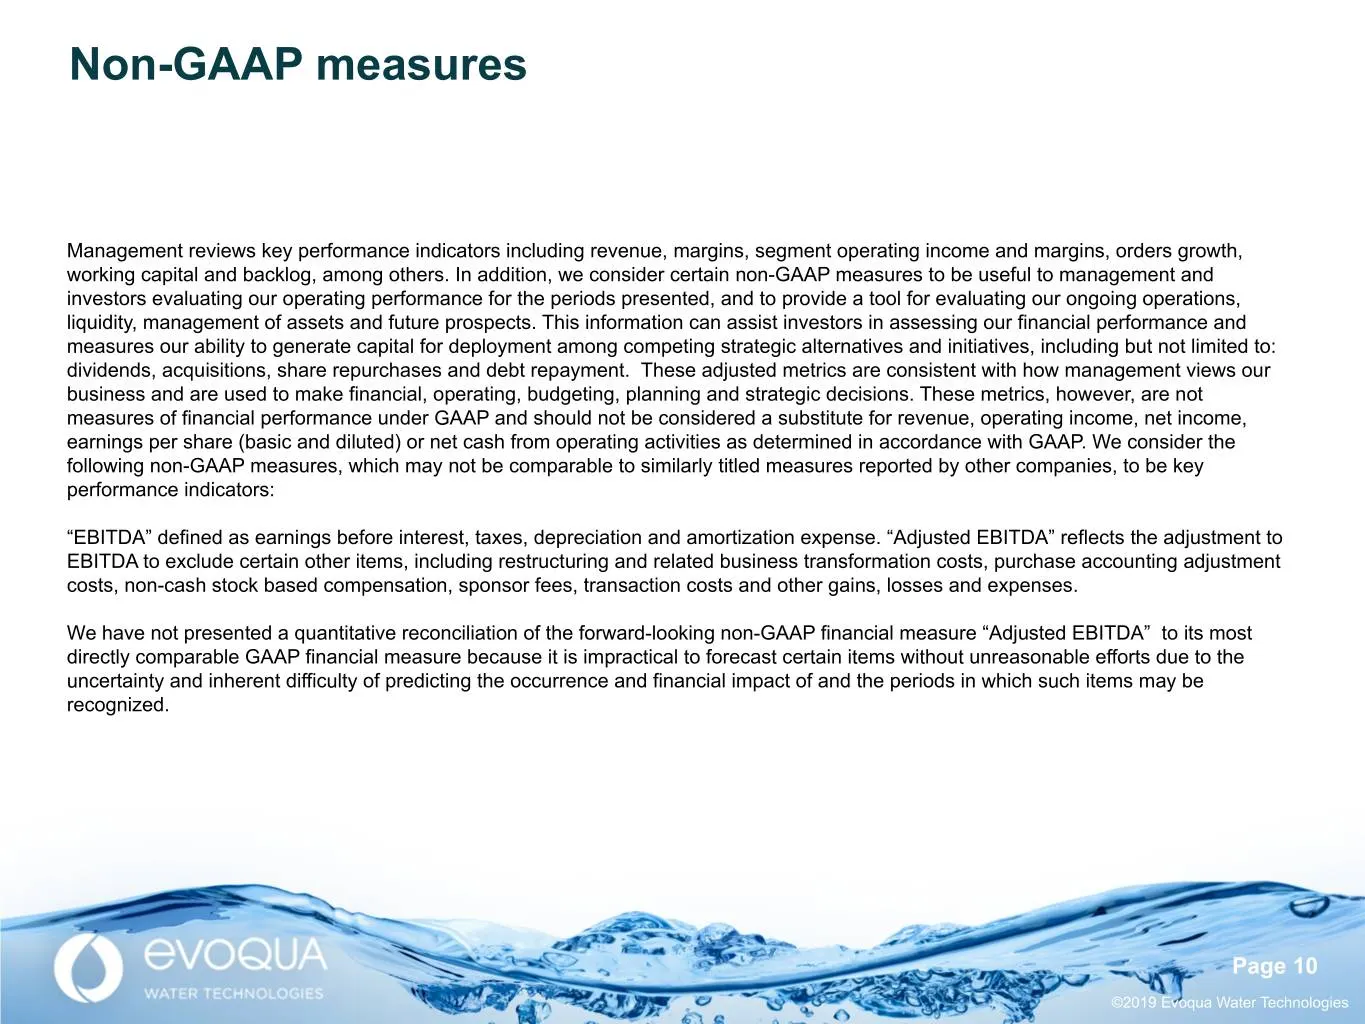
Non-GAAP measures Management reviews key performance indicators including revenue, margins, segment operating income and margins, orders growth, working capital and backlog, among others. In addition, we consider certain non-GAAP measures to be useful to management and investors evaluating our opera
Slide 11: Adjusted EBITDA reconciliation - 2019
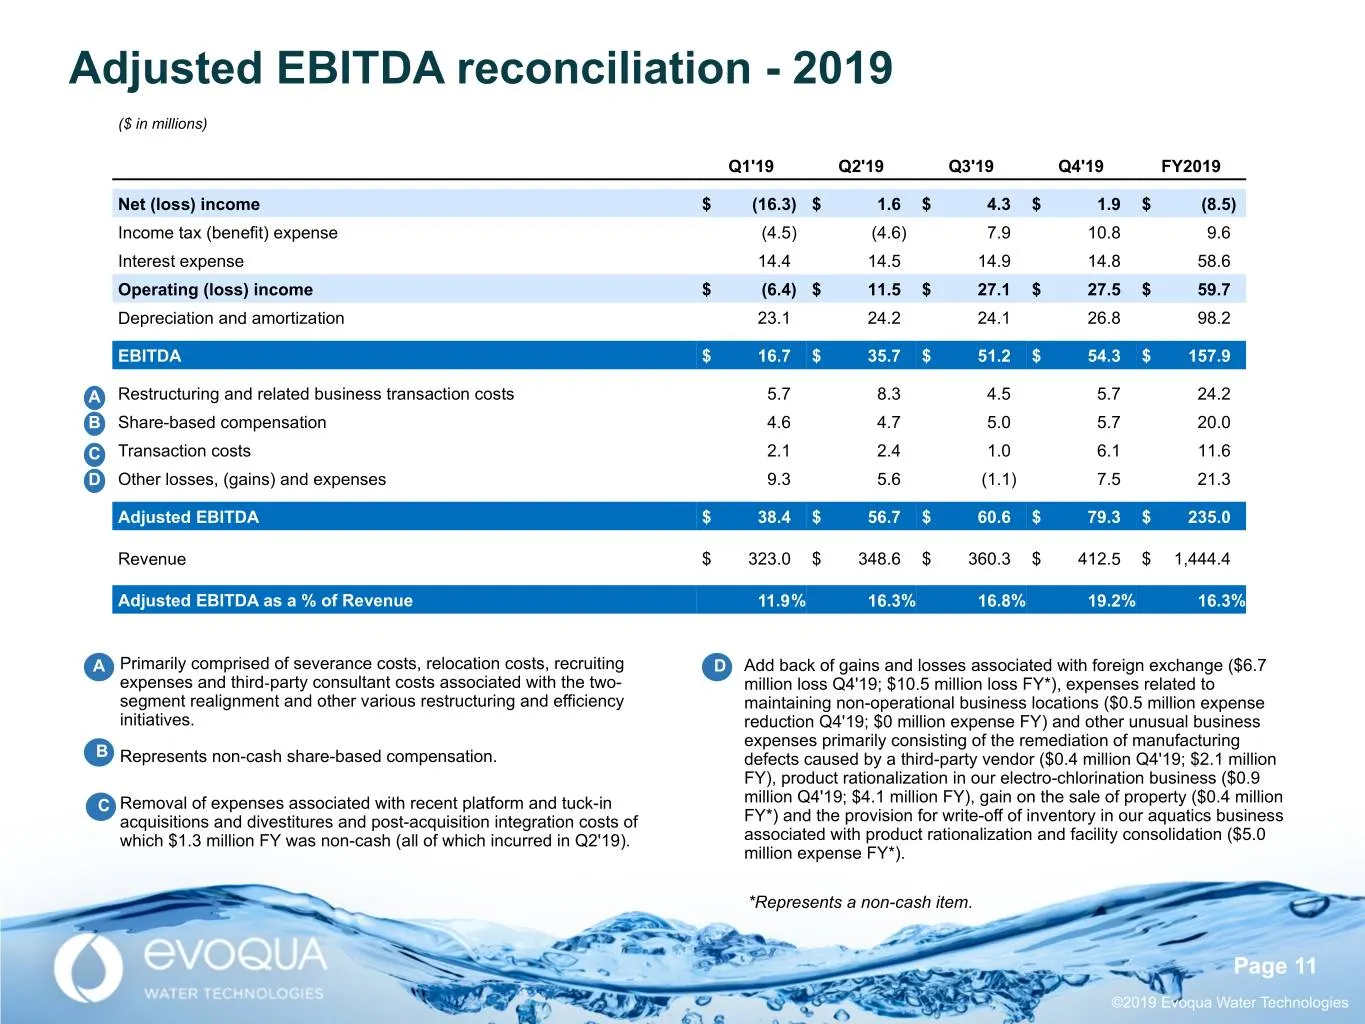
Adjusted EBITDA reconciliation - 2019 ($ in millions) Q1'19 Q2'19 Q3'19 Q4'19 FY2019 Net (loss) income $ (16.3) $ 1.6 $ 4.3 $ 1.9 $ (8.5) Income tax (benefit) expense (4.5) (4.6) 7.9 10.8 9.6 Interest expense 14.4 14.5 14.9 14.8 58.6 Operating (loss) income $ (6.4) $ 11.5 $ 27.1 $ 27.5 $ 59.7 Deprec
Slide 12: Adjusted EBITDA reconciliation - 2018
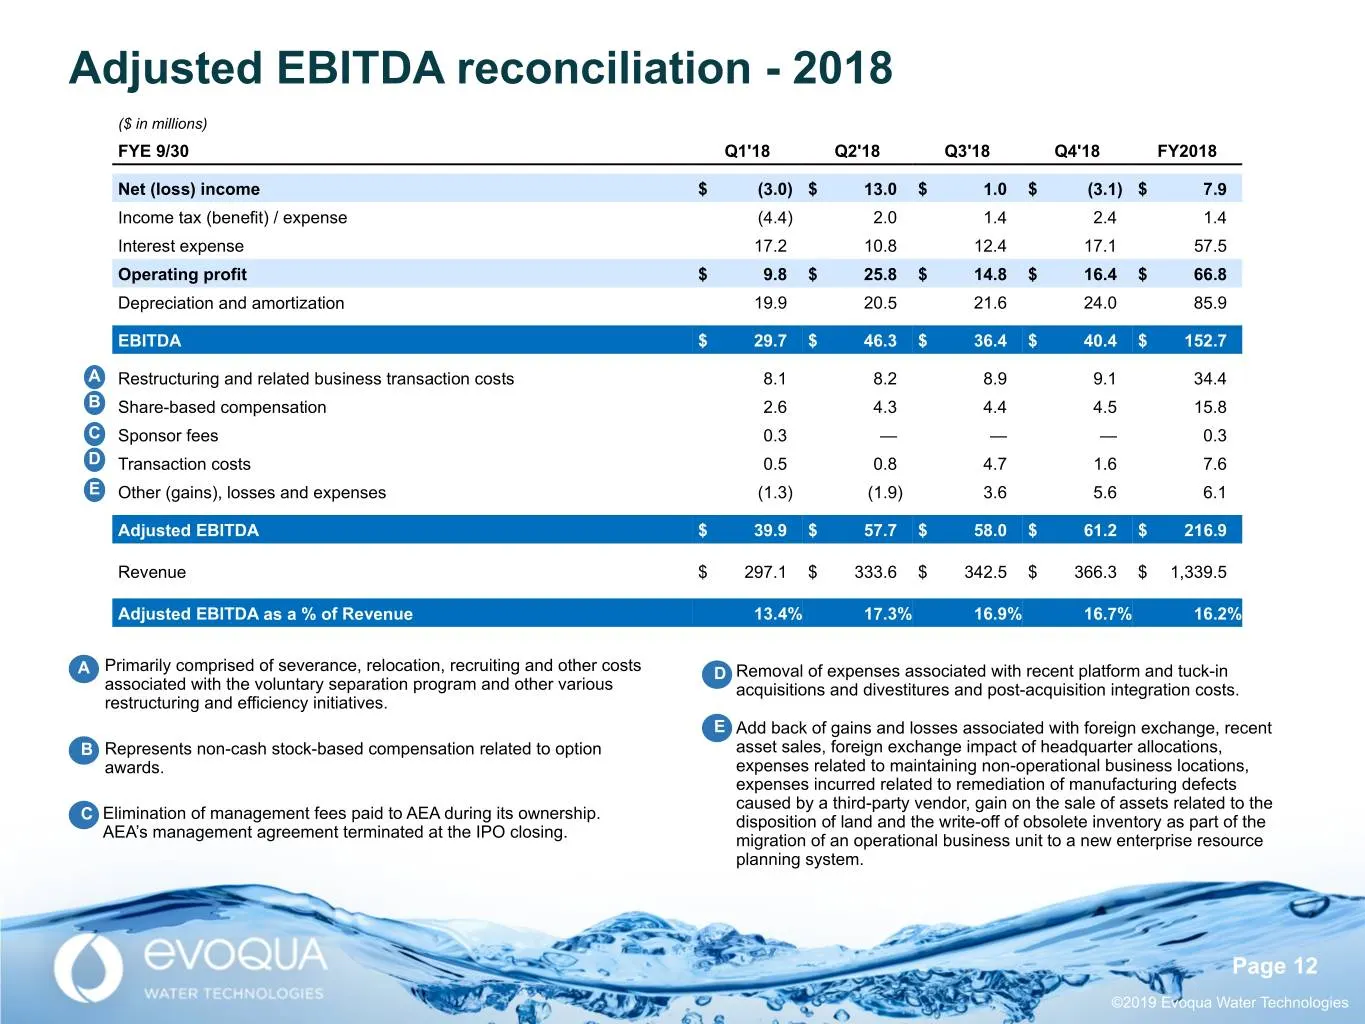
Adjusted EBITDA reconciliation - 2018 ($ in millions) FYE 9/30 Q1'18 Q2'18 Q3'18 Q4'18 FY2018 Net (loss) income $ (3.0) $ 13.0 $ 1.0 $ (3.1) $ 7.9 Income tax (benefit) / expense (4.4) 2.0 1.4 2.4 1.4 Interest expense 17.2 10.8 12.4 17.1 57.5 Operating profit $ 9.8 $ 25.8 $ 14.8 $ 16.4 $ 66.8 Depreci
Slide 13: Adjusted EBITDA reconciliation - 2017
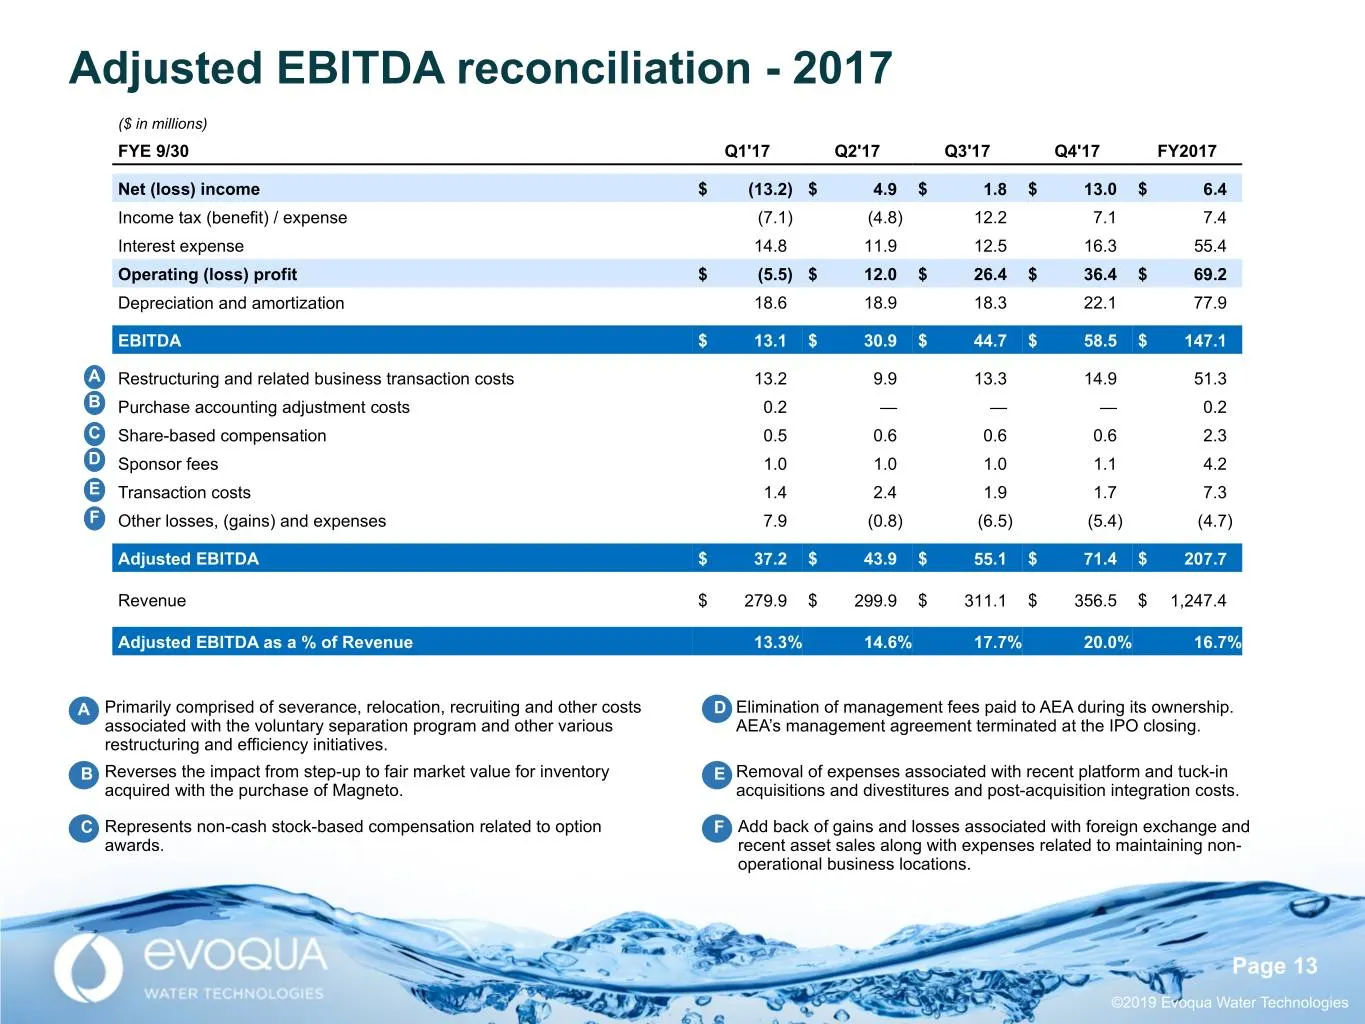
Adjusted EBITDA reconciliation - 2017 ($ in millions) FYE 9/30 Q1'17 Q2'17 Q3'17 Q4'17 FY2017 Net (loss) income $ (13.2) $ 4.9 $ 1.8 $ 13.0 $ 6.4 Income tax (benefit) / expense (7.1) (4.8) 12.2 7.1 7.4 Interest expense 14.8 11.9 12.5 16.3 55.4 Operating (loss) profit $ (5.5) $ 12.0 $ 26.4 $ 36.4 $ 6
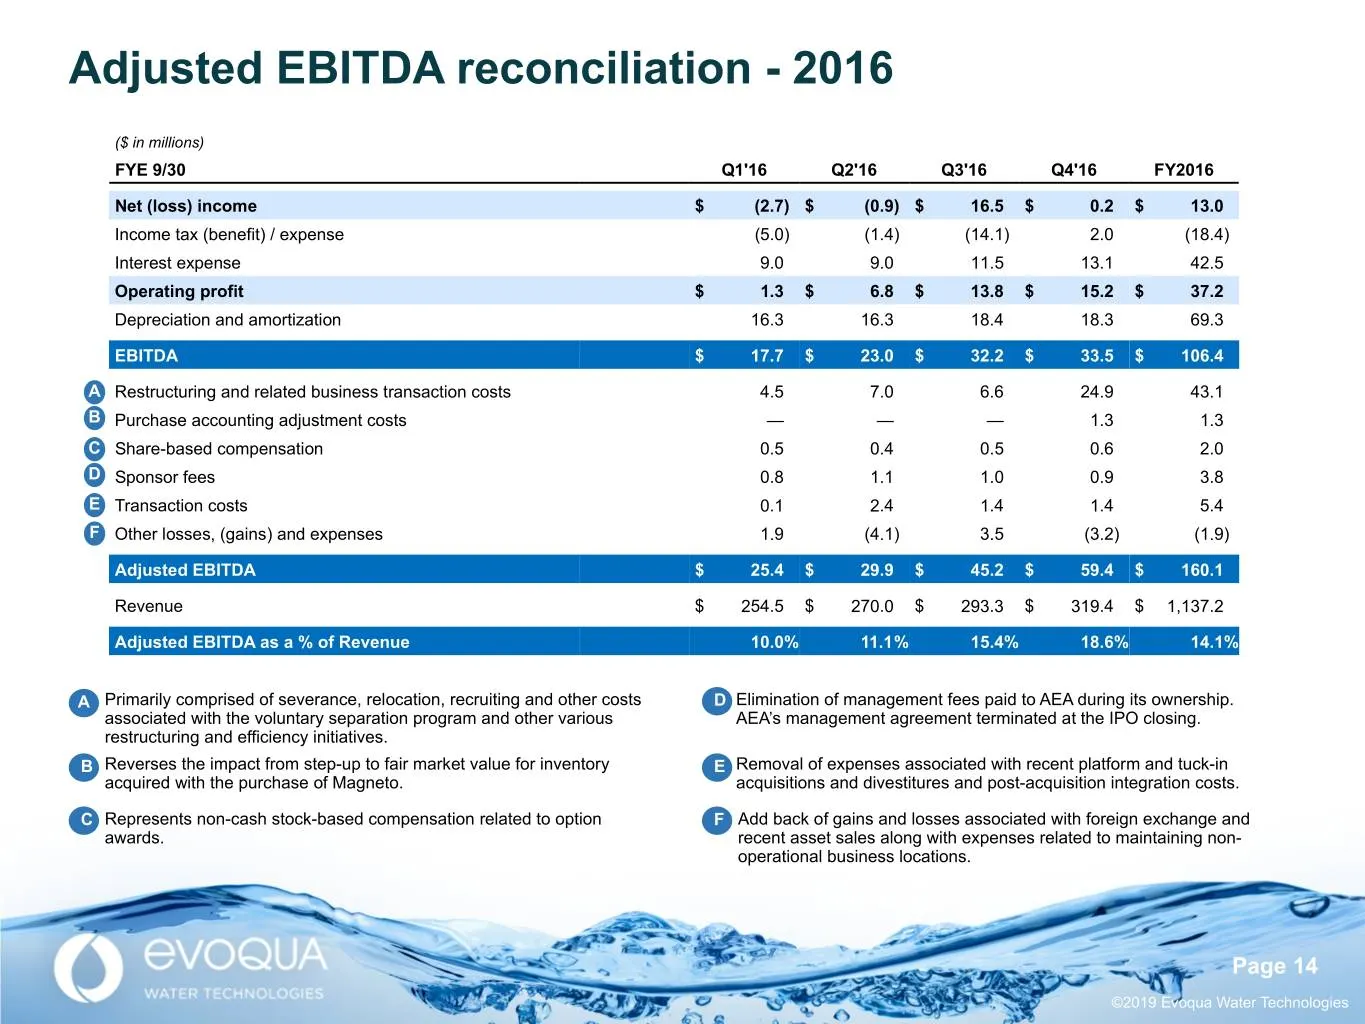
Slide 14: Adjusted EBITDA reconciliation - 2016
Adjusted EBITDA reconciliation - 2016 ($ in millions) FYE 9/30 Q1'16 Q2'16 Q3'16 Q4'16 FY2016 Net (loss) income $ (2.7) $ (0.9) $ 16.5 $ 0.2 $ 13.0 Income tax (benefit) / expense (5.0) (1.4) (14.1) 2.0 (18.4) Interest expense 9.0 9.0 11.5 13.1 42.5 Operating profit $ 1.3 $ 6.8 $ 13.8 $ 15.2 $ 37.2 D
Slide 15: Transforming Water. Enriching Life.
TRANSFORMING WATER. ENRICHING LIFE.TM ©2019 Evoqua Water Technologies
Source: SEC EDGAR · 8-K filed Dec 4, 2019
More decks from Evoqua Water Technologies
 Merger or Acquisition (January 2023)20 slides · Jan 25, 2023
 Investor Presentation (September 2021)22 slides · Sep 28, 2021
 J.P. Morgan Global High Yield & Leveraged Finance Conference 202138 slides · Mar 2, 2021
 Investor Day (February 2019)28 slides · Feb 26, 2019
 Q4 2018 Earnings Presentation31 slides · Nov 27, 2018
 Q3 2018 Earnings Presentation31 slides · Aug 7, 2018