Evoqua Water Technologies — J.P. Morgan Global High Yield & Leveraged Finance Conference 2021
38 slides from Evoqua Water Technologies's conference presentation, Mar 2, 2021
Slide 1: J.P. Morgan Global High Yield & Leveraged Finance Conference
J.P. Morgan Global High Yield & Leveraged Finance Conference March 2, 2021 Ben Stas Chief Financial Officer
Slide 2: Forward-looking statements
© 2021 EVOQUA WATER TECHNOLOGIES | 2 This presentation contains forward-looking statements within the meaning of the Private Securities Litigation Reform Act of 1995. All of these forward-looking statements are based on our current expectations, assumptions, estimates and projections. While we belie
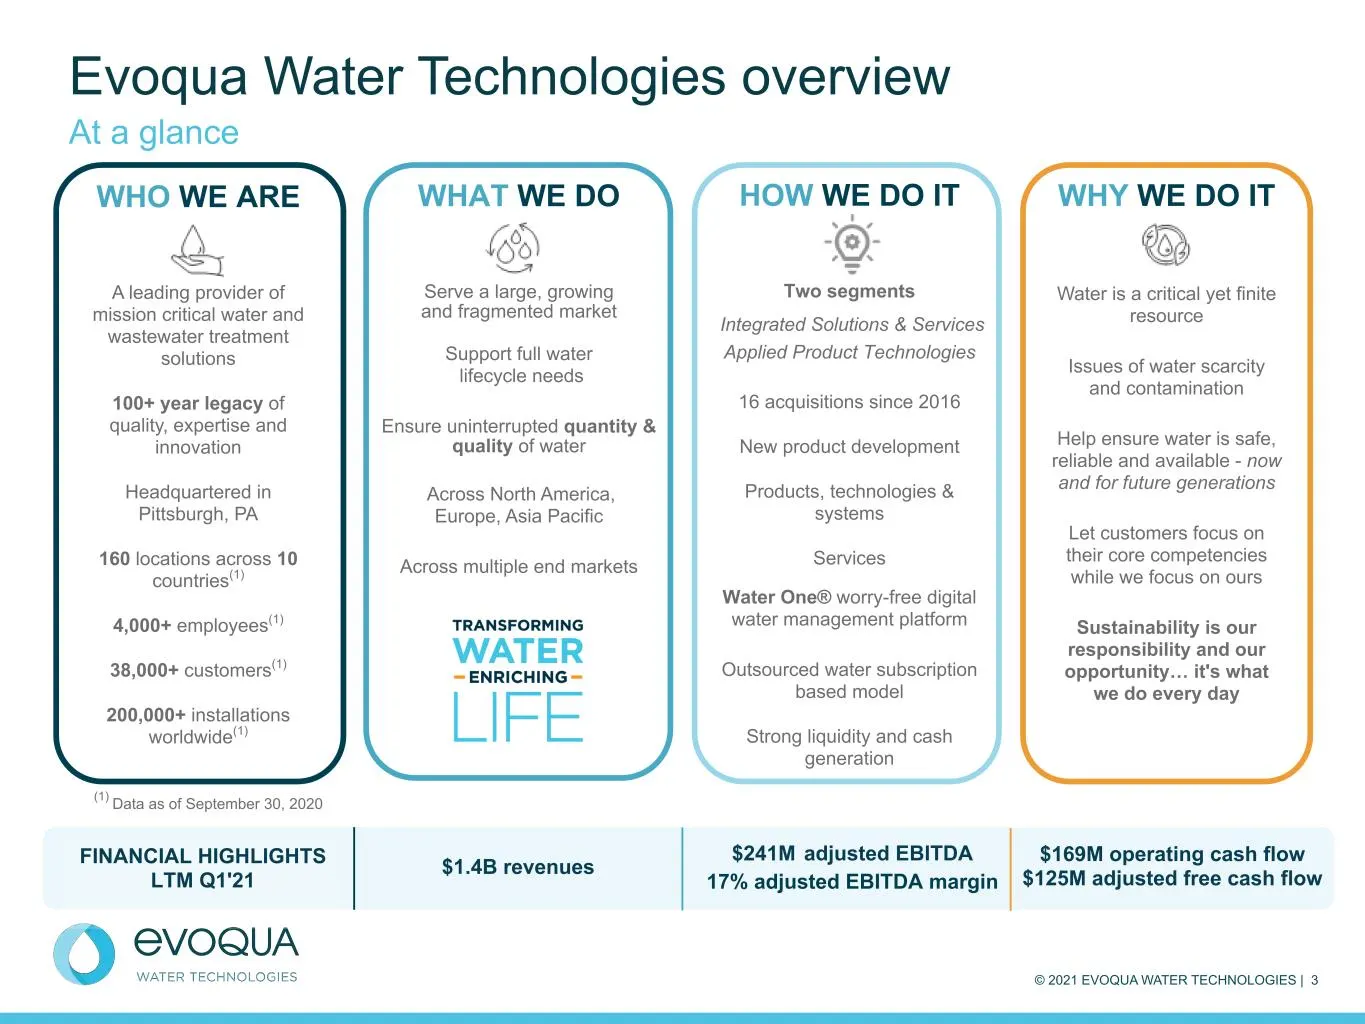
Slide 3: Evoqua Water Technologies overview
© 2021 EVOQUA WATER TECHNOLOGIES | 3 FINANCIAL HIGHLIGHTS LTM Q1'21 Evoqua Water Technologies overview At a glance $1.4B revenues $241M adjusted EBITDA 17% adjusted EBITDA margin WHAT WE DO Serve a large, growing and fragmented market Support full water lifecycle needs Ensure uninterrupted quantity
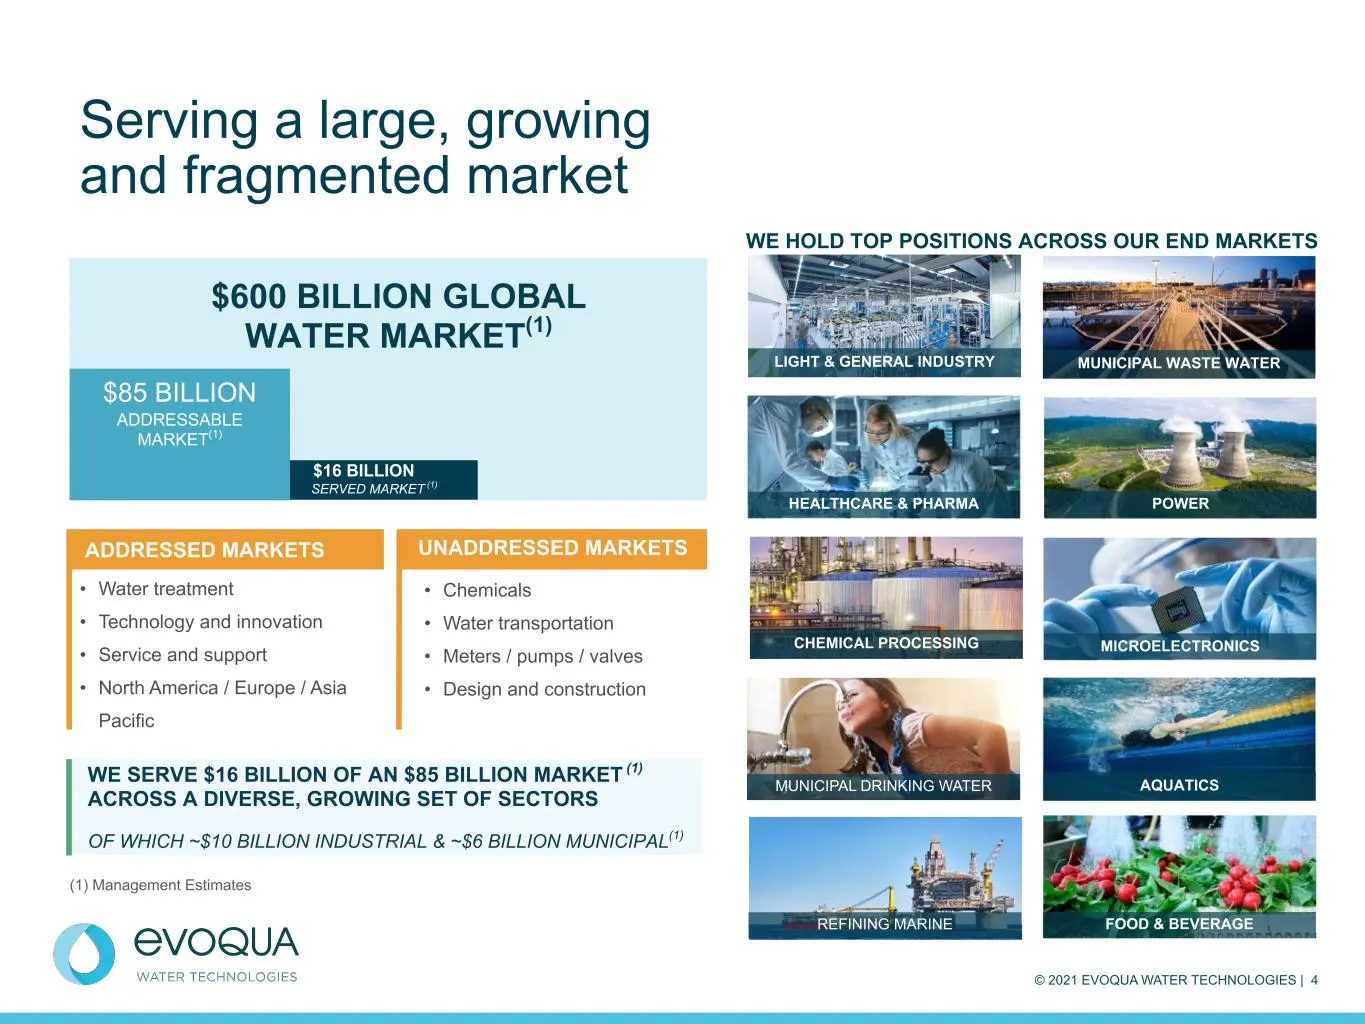
Slide 4: Serving a large, growing and fragmented market
© 2021 EVOQUA WATER TECHNOLOGIES | 4 $85 BILLION ADDRESSABLE MARKET(1) $16 BILLION SERVED MARKET (1) $600 BILLION GLOBAL WATER MARKET(1) (1) Management Estimates • Water treatment • Technology and innovation • Service and support • North America / Europe / Asia Pacific • Chemicals • Water transporta
Slide 5: Priorities in a COVID-19 impacted world
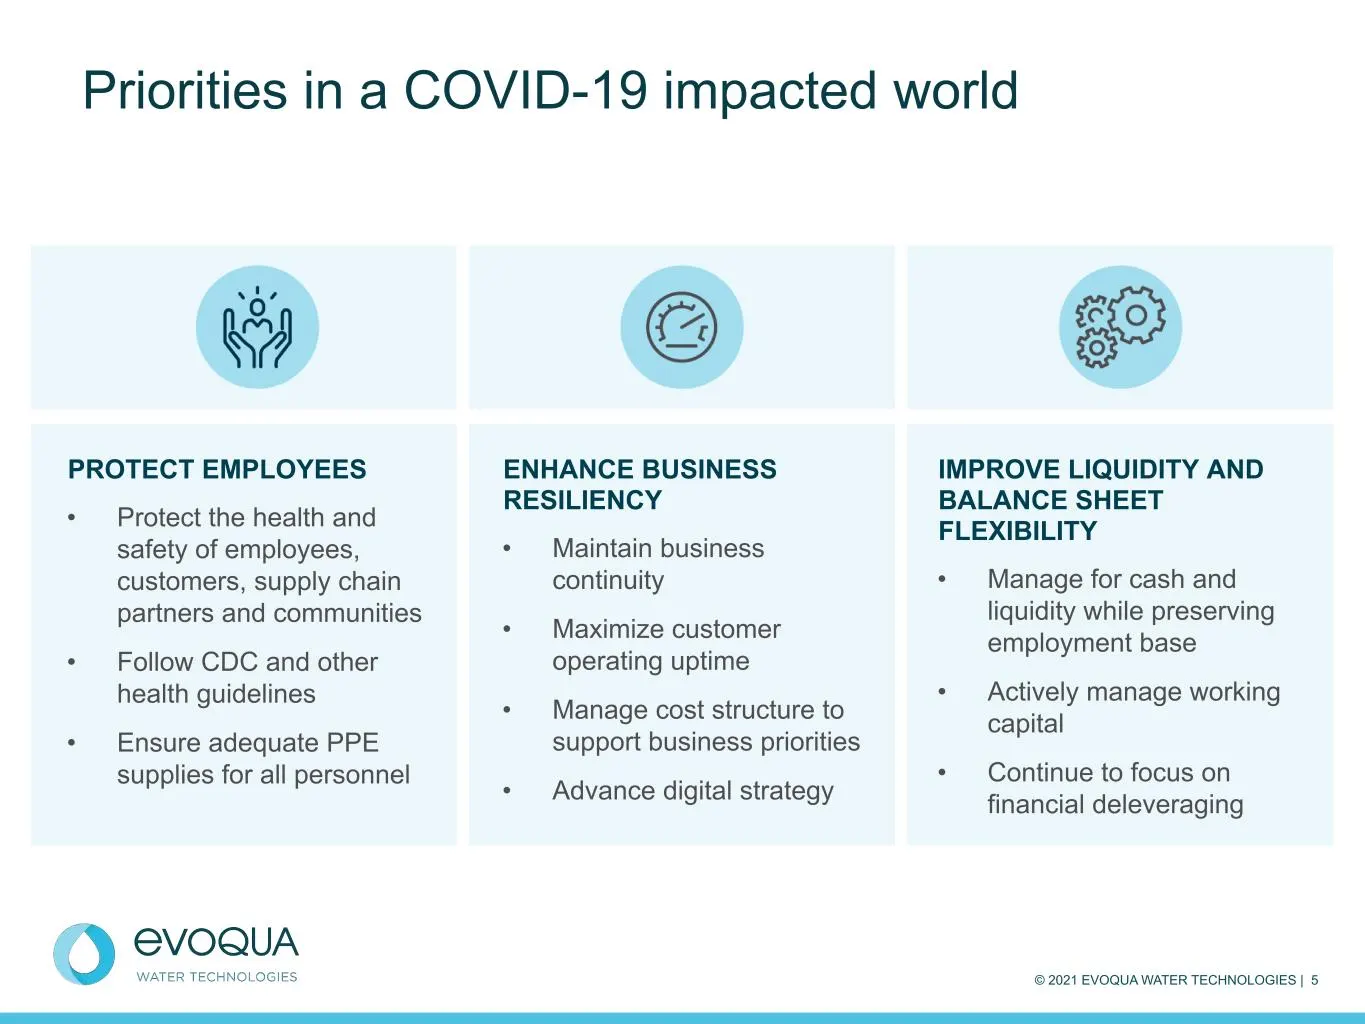
© 2021 EVOQUA WATER TECHNOLOGIES | 5 Priorities in a COVID-19 impacted world PROTECT EMPLOYEES • Protect the health and safety of employees, customers, supply chain partners and communities • Follow CDC and other health guidelines • Ensure adequate PPE supplies for all personnel ENHANCE BUSINESS RES
Slide 6: Sustainability: Our responsibility and our opportunity
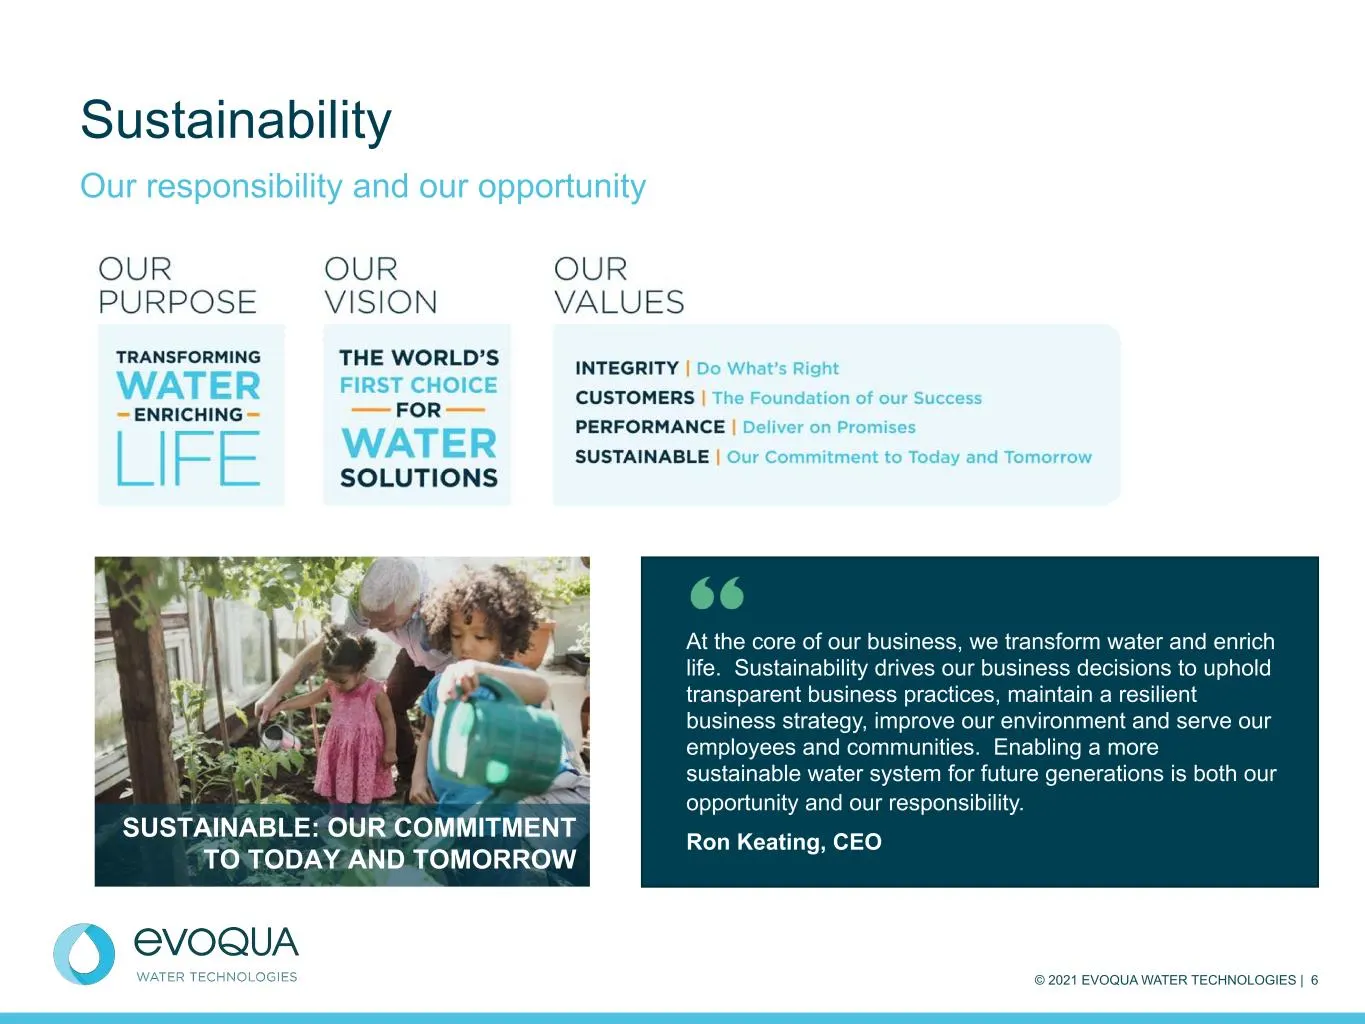
© 2021 EVOQUA WATER TECHNOLOGIES | 6 Sustainability Our responsibility and our opportunity At the core of our business, we transform water and enrich life. Sustainability drives our business decisions to uphold transparent business practices, maintain a resilient business strategy, improve our envir
Slide 7: Evoqua provides pure water for COVID-19 test vials
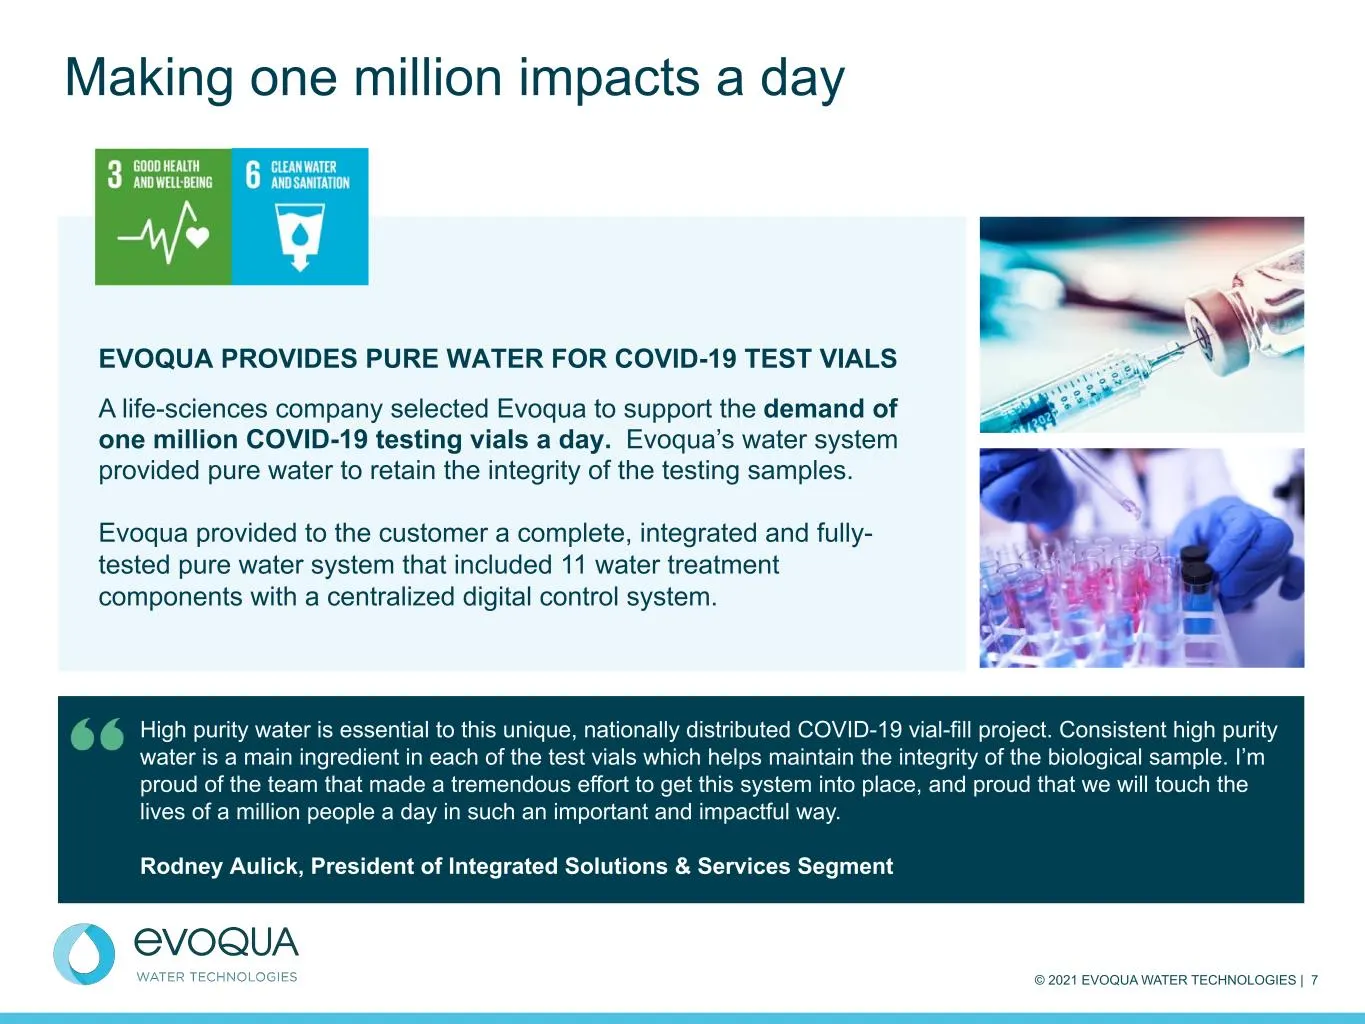
© 2021 EVOQUA WATER TECHNOLOGIES | 7 EVOQUA PROVIDES PURE WATER FOR COVID-19 TEST VIALS A life-sciences company selected Evoqua to support the demand of one million COVID-19 testing vials a day. Evoqua’s water system provided pure water to retain the integrity of the testing samples. Evoqua provided
Slide 8: LTM revenue and profitability development
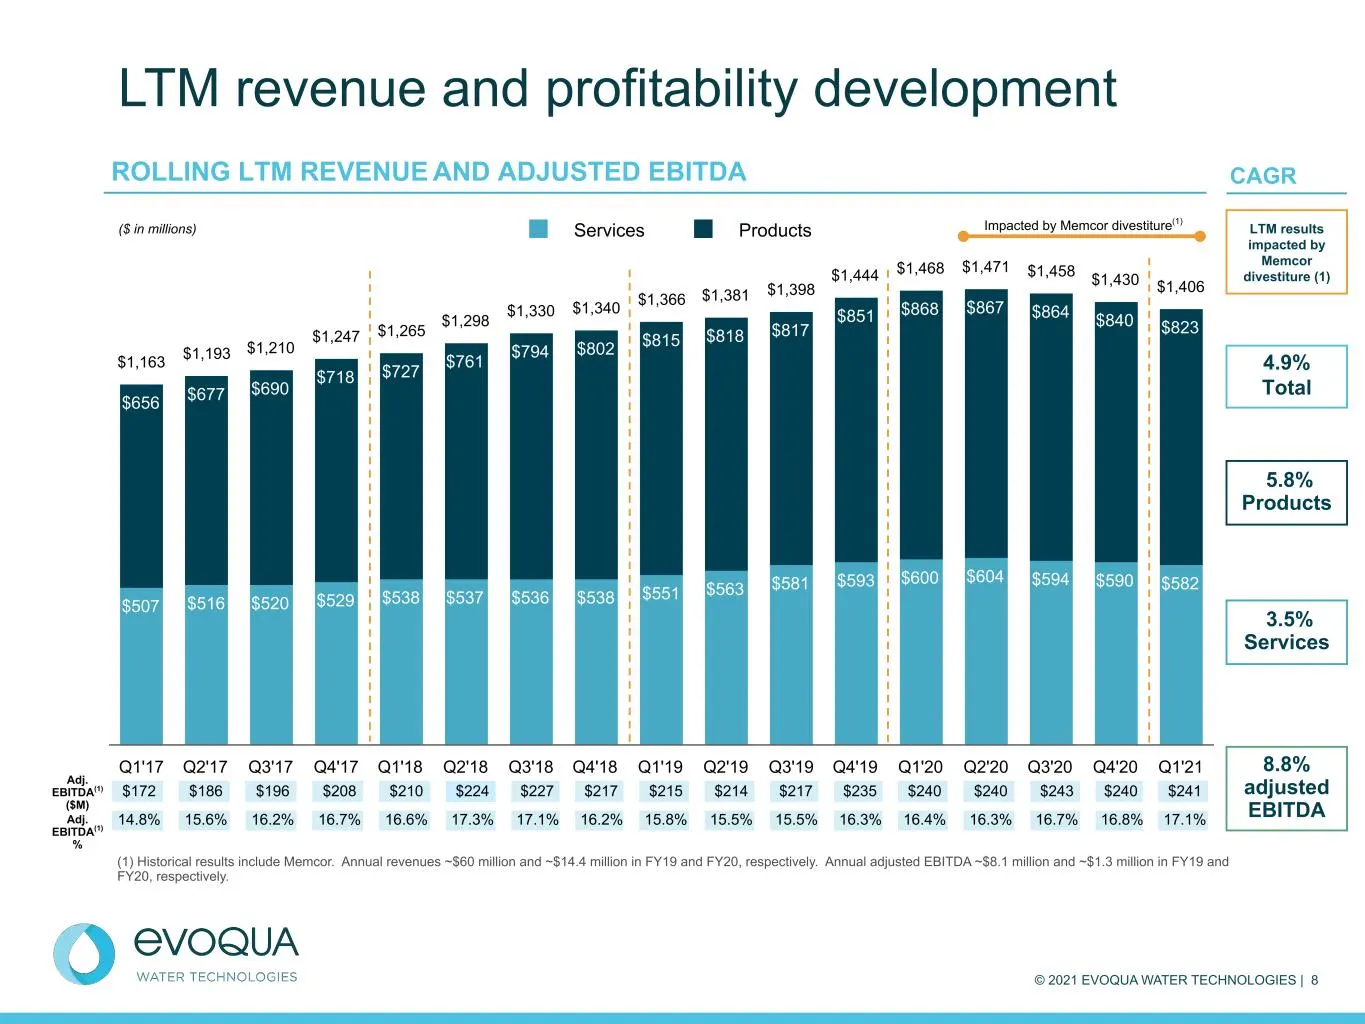
© 2021 EVOQUA WATER TECHNOLOGIES | 8 $507 $516 $520 $529 $538 $537 $536 $538 $551 $563 $581 $593 $600 $604 $594 $590 $582 $656 $677 $690 $718 $727 $761 $794 $802 $815 $818 $817 $851 $868 $867 $864 $840 $823 $1,163 $1,193 $1,210 $1,247 $1,265 $1,298 $1,330 $1,340 $1,366 $1,381 $1,398 $1,444 $1,468 $1
Slide 9: Integrated Solutions and Services Overview
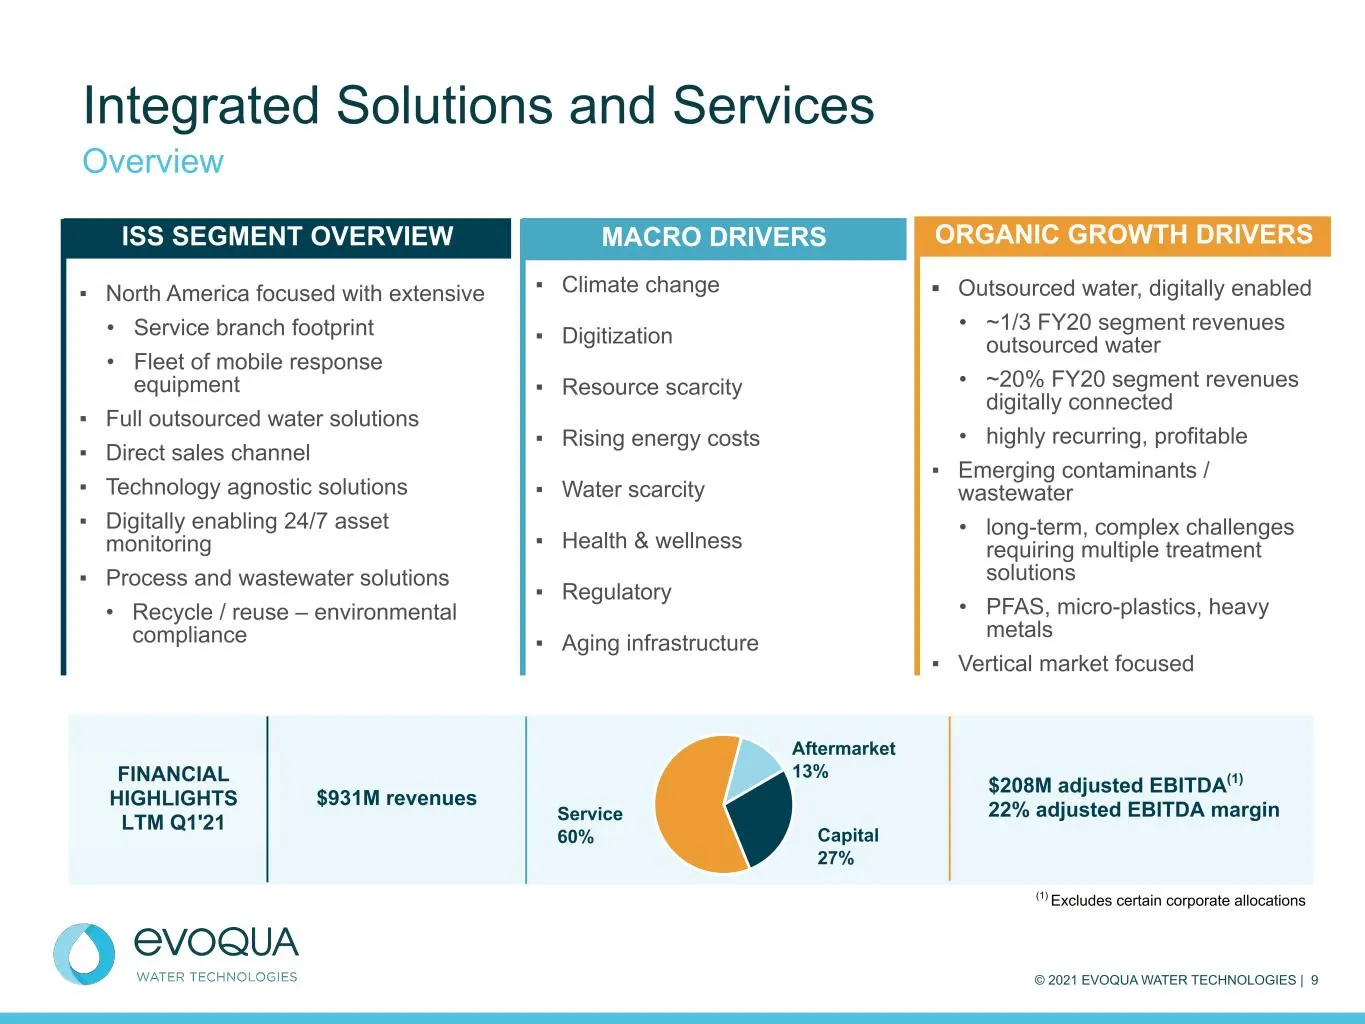
© 2021 EVOQUA WATER TECHNOLOGIES | 9 Integrated Solutions and Services Overview ▪ North America focused with extensive • Service branch footprint • Fleet of mobile response equipment ▪ Full outsourced water solutions ▪ Direct sales channel ▪ Technology agnostic solutions ▪ Digitally enabling 24/7 as
Slide 10: Integrated Solutions and Services: Unmatched service and support network
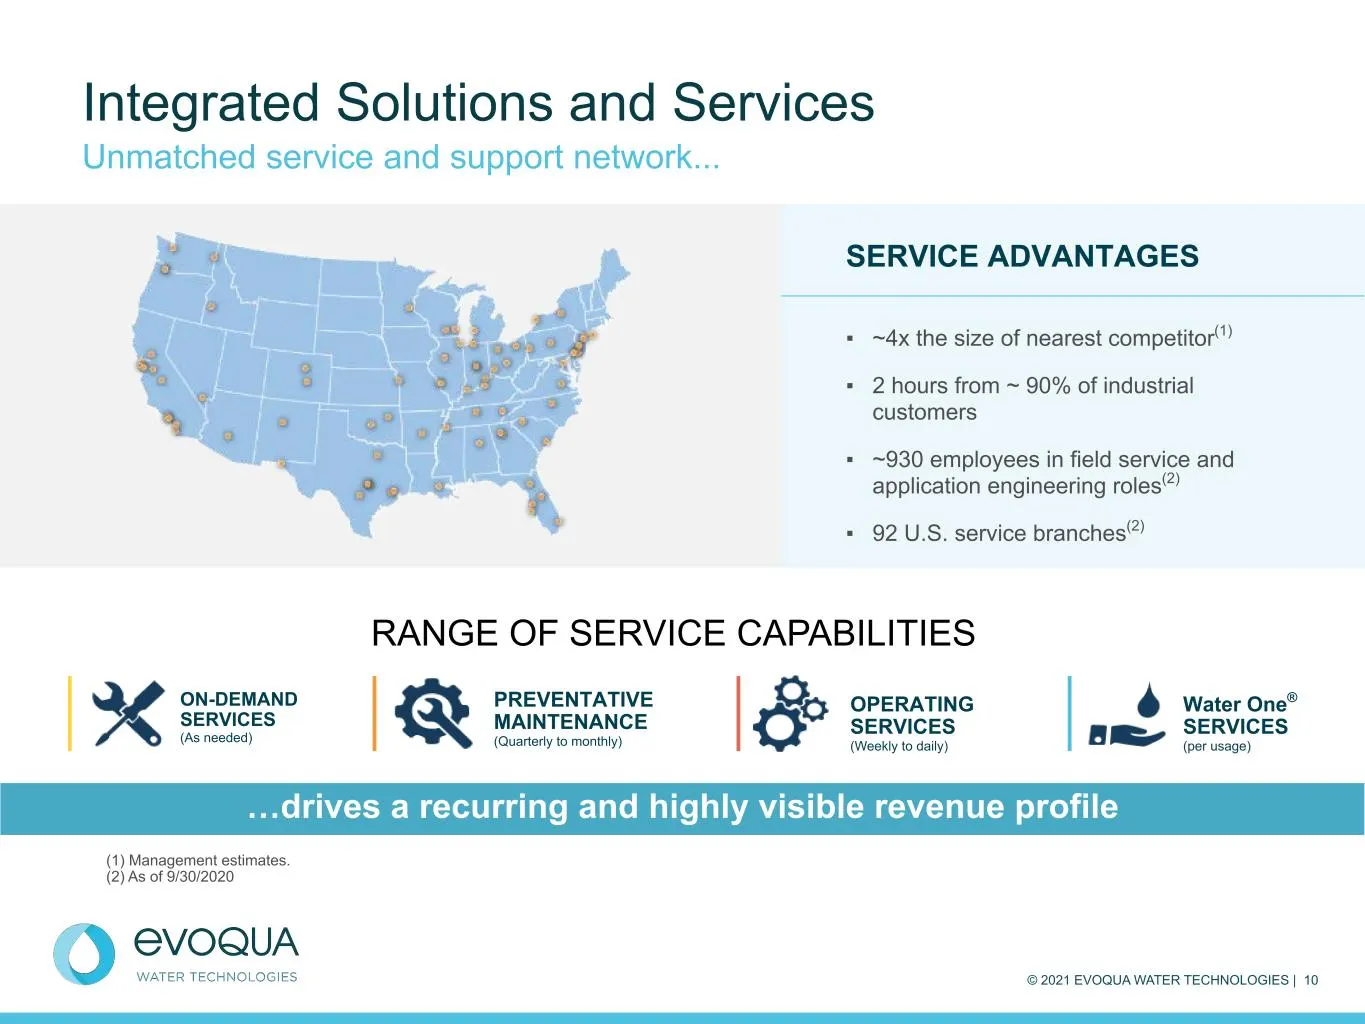
© 2021 EVOQUA WATER TECHNOLOGIES | 10 Integrated Solutions and Services Unmatched service and support network... RANGE OF SERVICE CAPABILITIES …drives a recurring and highly visible revenue profile SERVICE ADVANTAGES ▪ ~4x the size of nearest competitor(1) ▪ 2 hours from ~ 90% of industrial customer
Slide 11: Outsourced water at a glance
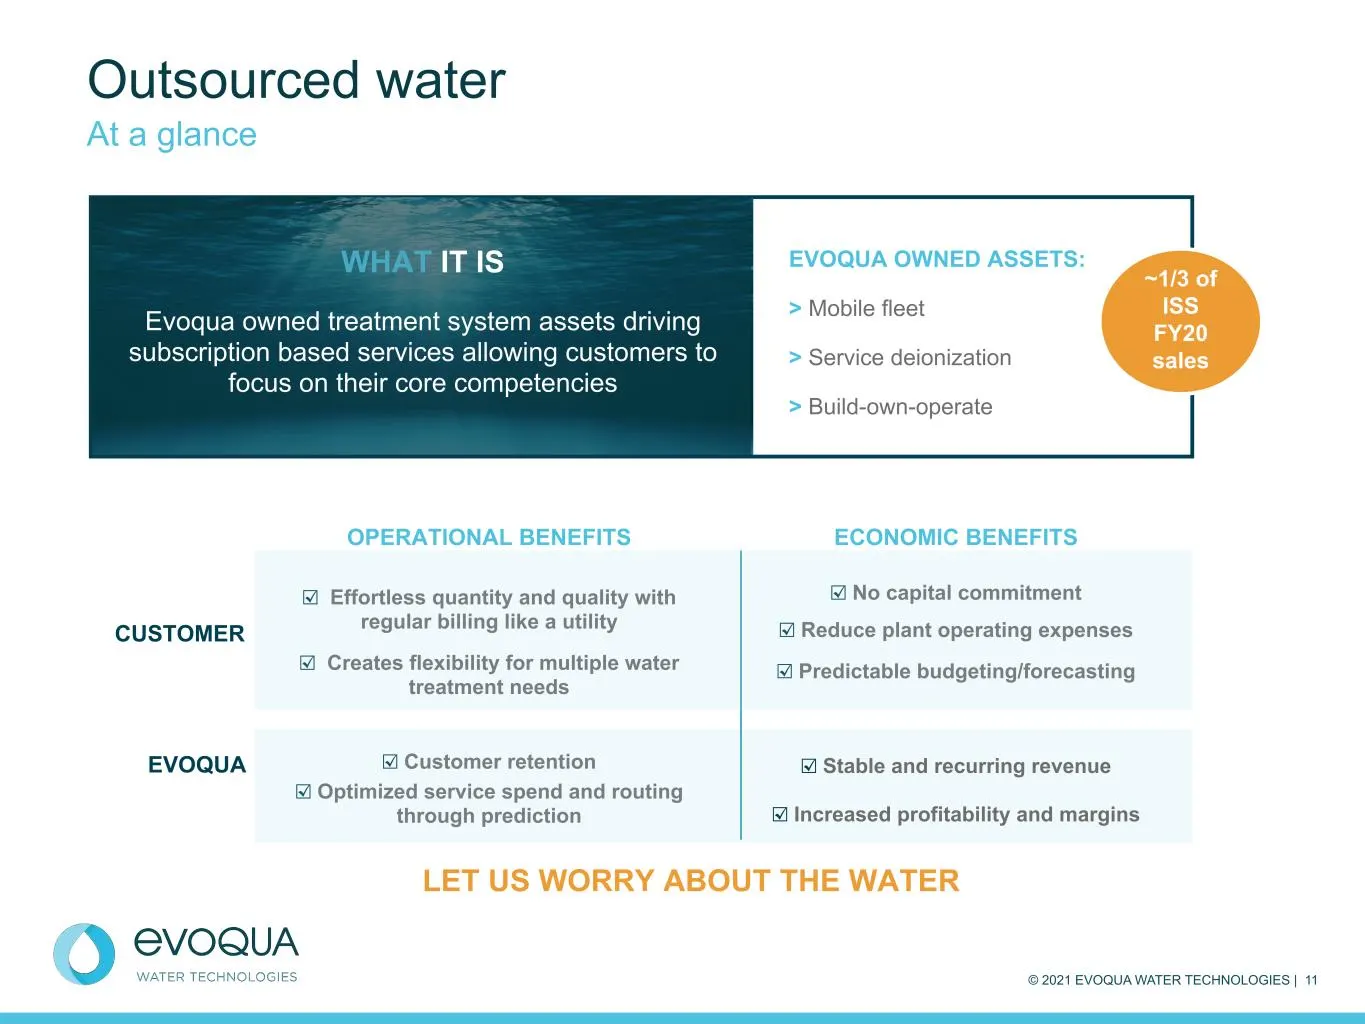
© 2021 EVOQUA WATER TECHNOLOGIES | 11 OPERATIONAL BENEFITS ☑ Effortless quantity and quality with regular billing like a utility ☑ Creates flexibility for multiple water treatment needs ☑ Customer retention ☑ Optimized service spend and routing through prediction ECONOMIC BENEFITS ☑ No capital commi
Slide 12: Capital order lifecycle
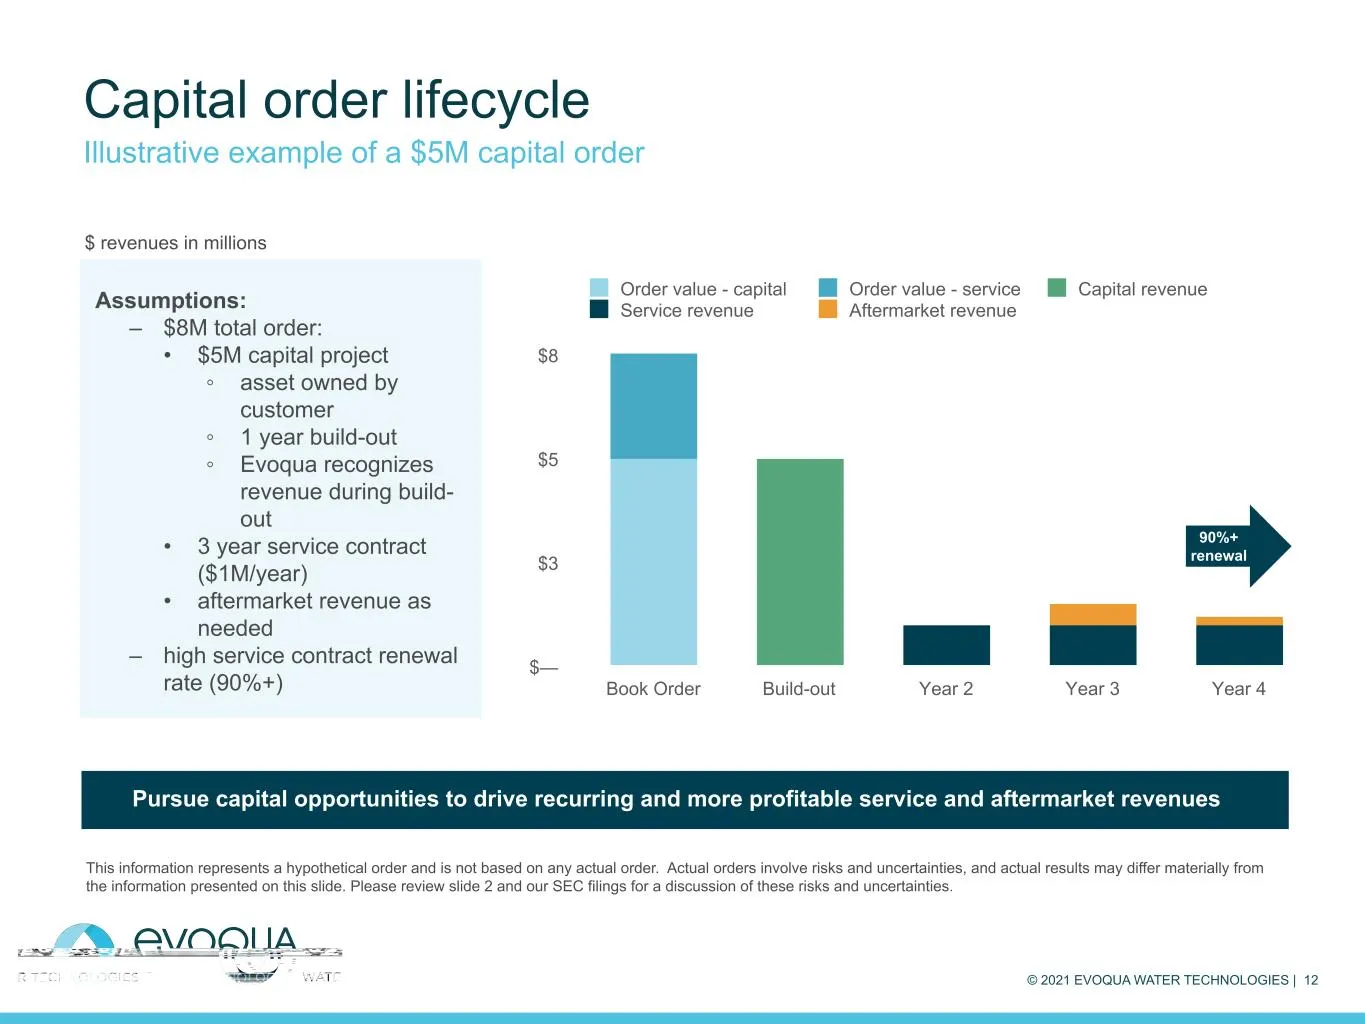
© 2021 EVOQUA WATER TECHNOLOGIES | 12 Order value - capital Order value - service Capital revenue Service revenue Aftermarket revenue Book Order Build-out Year 2 Year 3 Year 4 $— $3 $5 $8 Capital order lifecycle Illustrative example of a $5M capital order This information represents a hypothetical o
Slide 13: Outsourced water order lifecycle
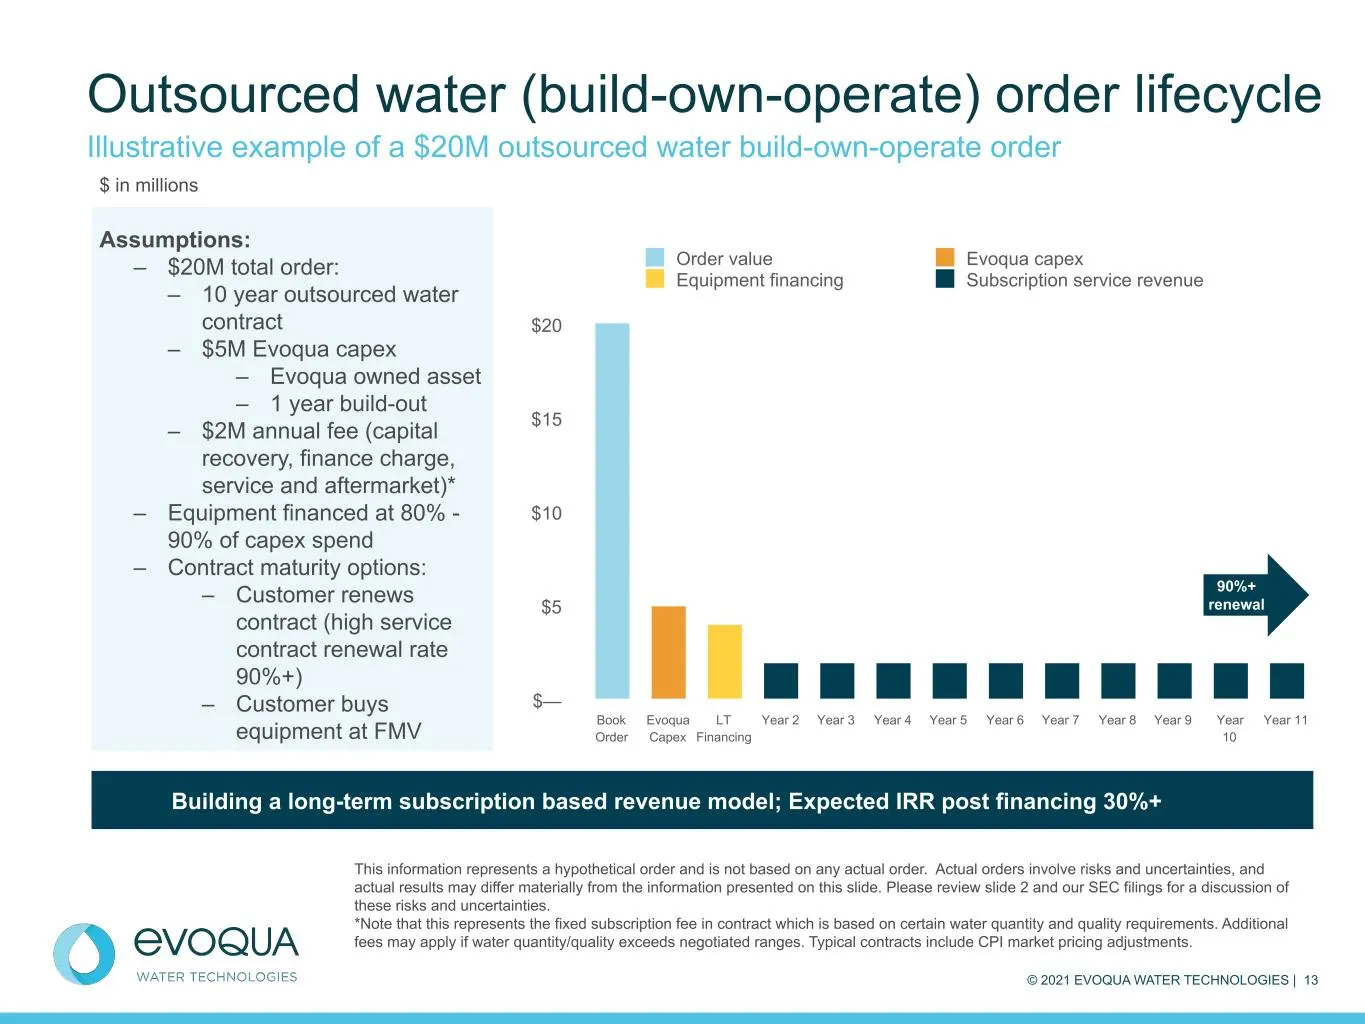
© 2021 EVOQUA WATER TECHNOLOGIES | 13 Order value Evoqua capex Equipment financing Subscription service revenue Book Order Evoqua Capex LT Financing Year 2 Year 3 Year 4 Year 5 Year 6 Year 7 Year 8 Year 9 Year 10 Year 11 $— $5 $10 $15 $20 Outsourced water (build-own-operate) order lifecycle Illustra
Slide 14: Applied Product Technologies Overview
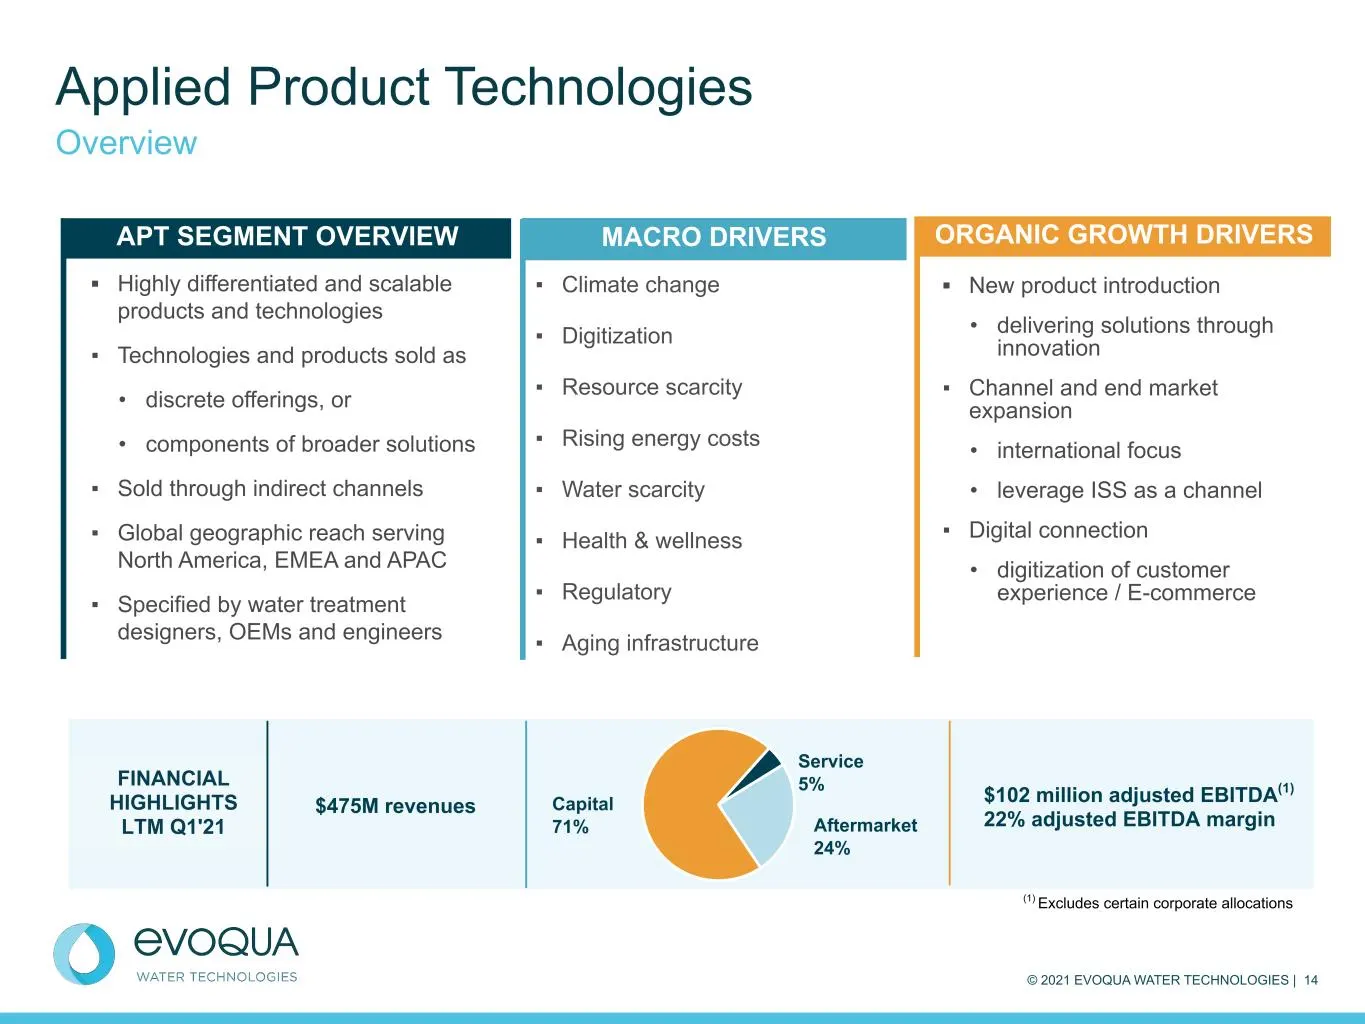
© 2021 EVOQUA WATER TECHNOLOGIES | 14 Applied Product Technologies Overview ▪ Highly differentiated and scalable products and technologies ▪ Technologies and products sold as • discrete offerings, or • components of broader solutions ▪ Sold through indirect channels ▪ Global geographic reach serving
Slide 15: Applied Product Technologies divisional structure by product line
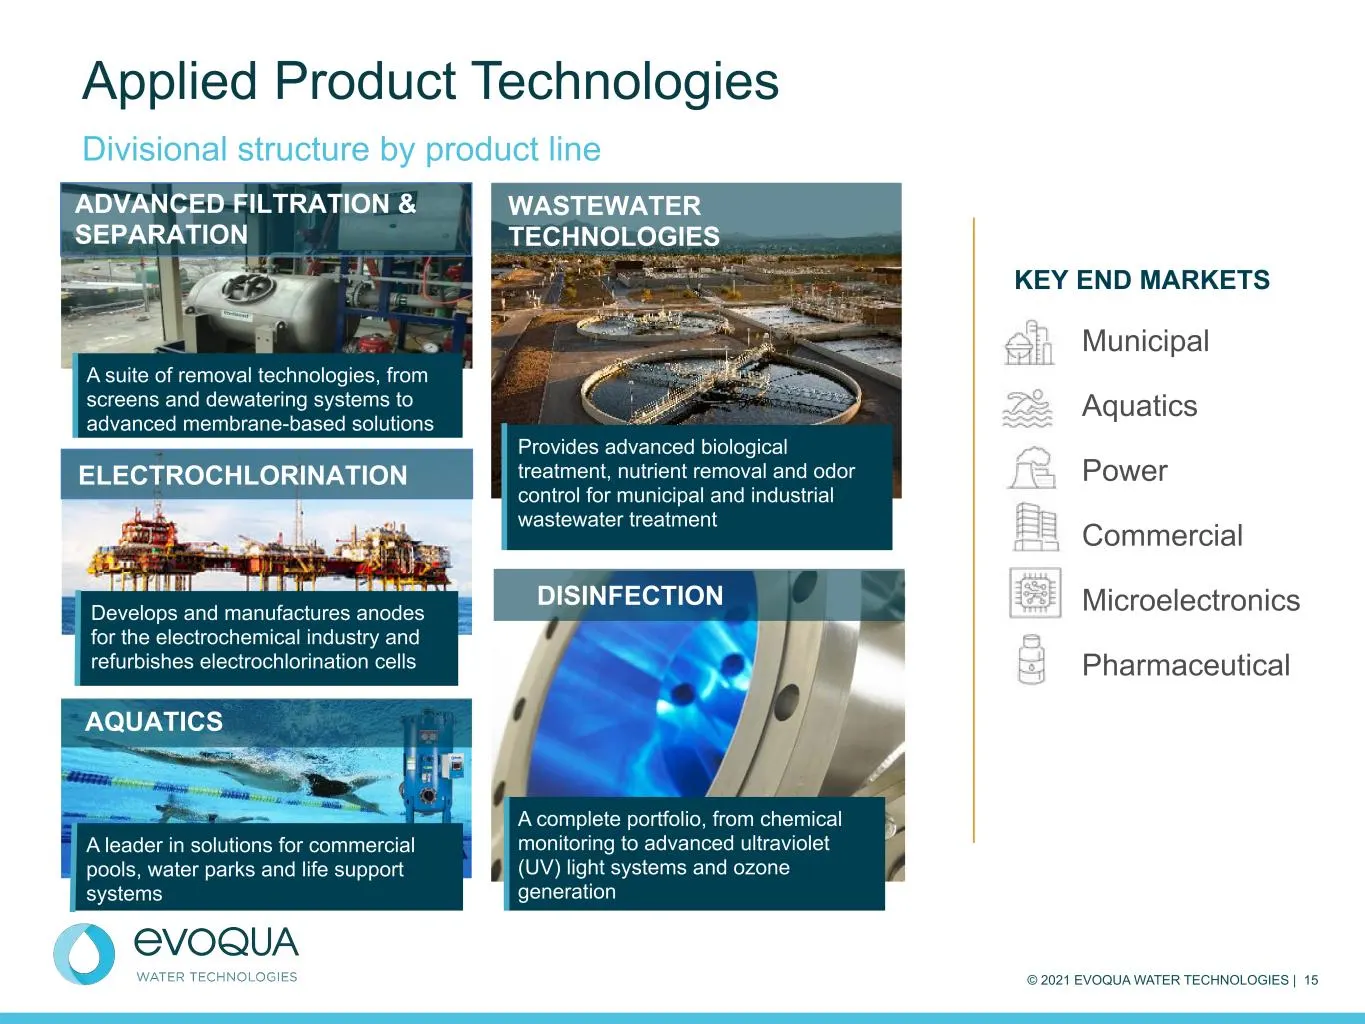
© 2021 EVOQUA WATER TECHNOLOGIES | 15 Applied Product Technologies Divisional structure by product line AQUATICS A leader in solutions for commercial pools, water parks and life support systems DISINFECTION A complete portfolio, from chemical monitoring to advanced ultraviolet (UV) light systems and
Slide 16: Acquisitions by fiscal year
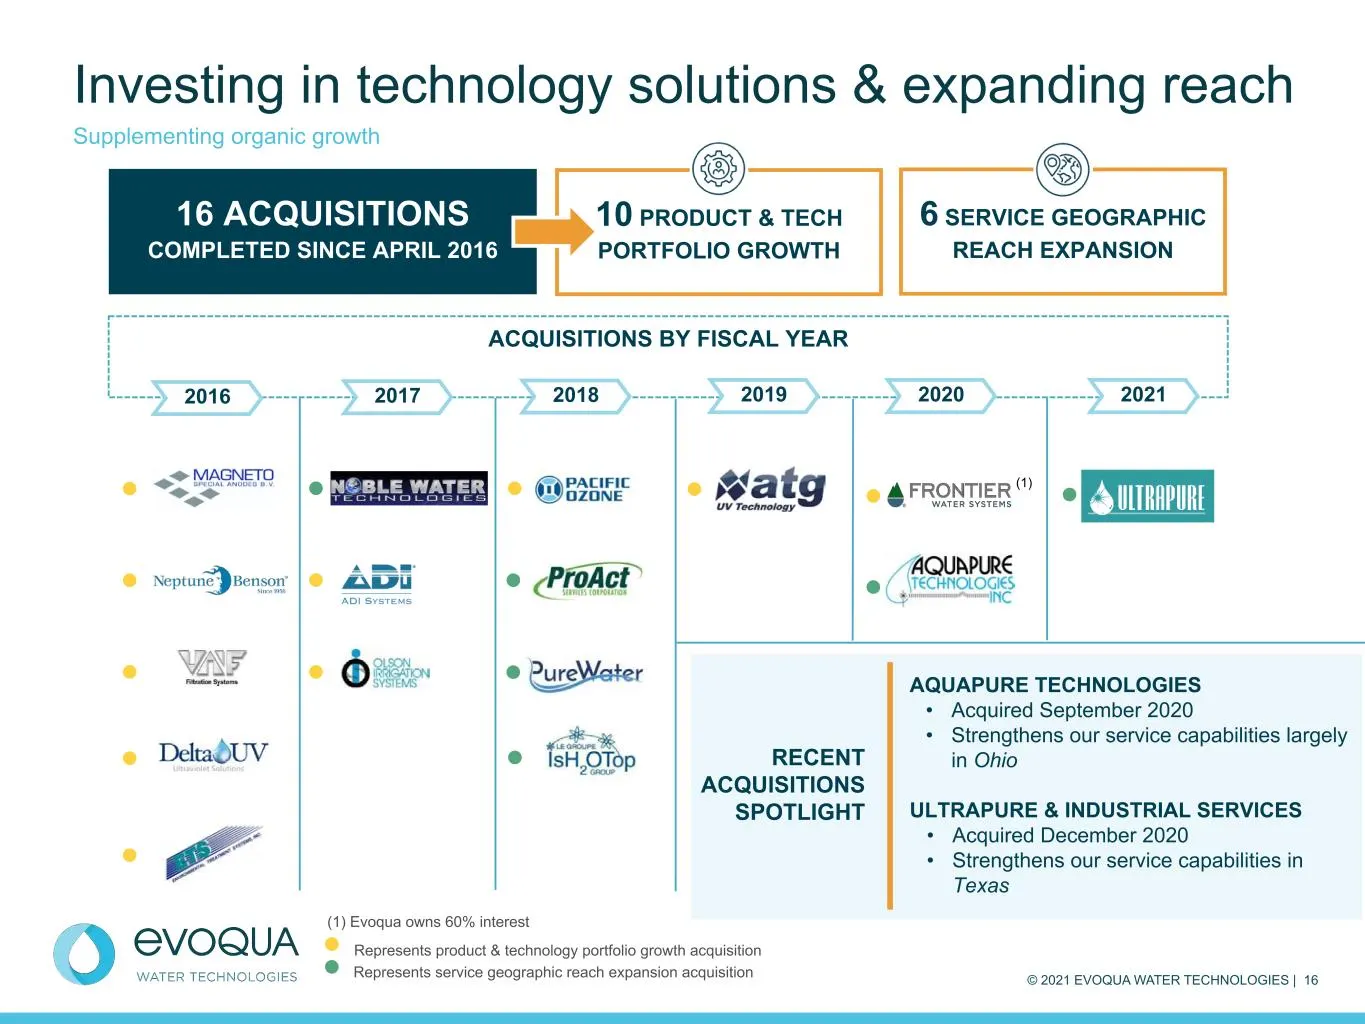
© 2021 EVOQUA WATER TECHNOLOGIES | 16 ACQUISITIONS BY FISCAL YEAR 10 PRODUCT & TECH PORTFOLIO GROWTH (1) (1) Evoqua owns 60% interest Investing in technology solutions & expanding reach Supplementing organic growth 16 ACQUISITIONS COMPLETED SINCE APRIL 2016 6 SERVICE GEOGRAPHIC REACH EXPANSION 2016
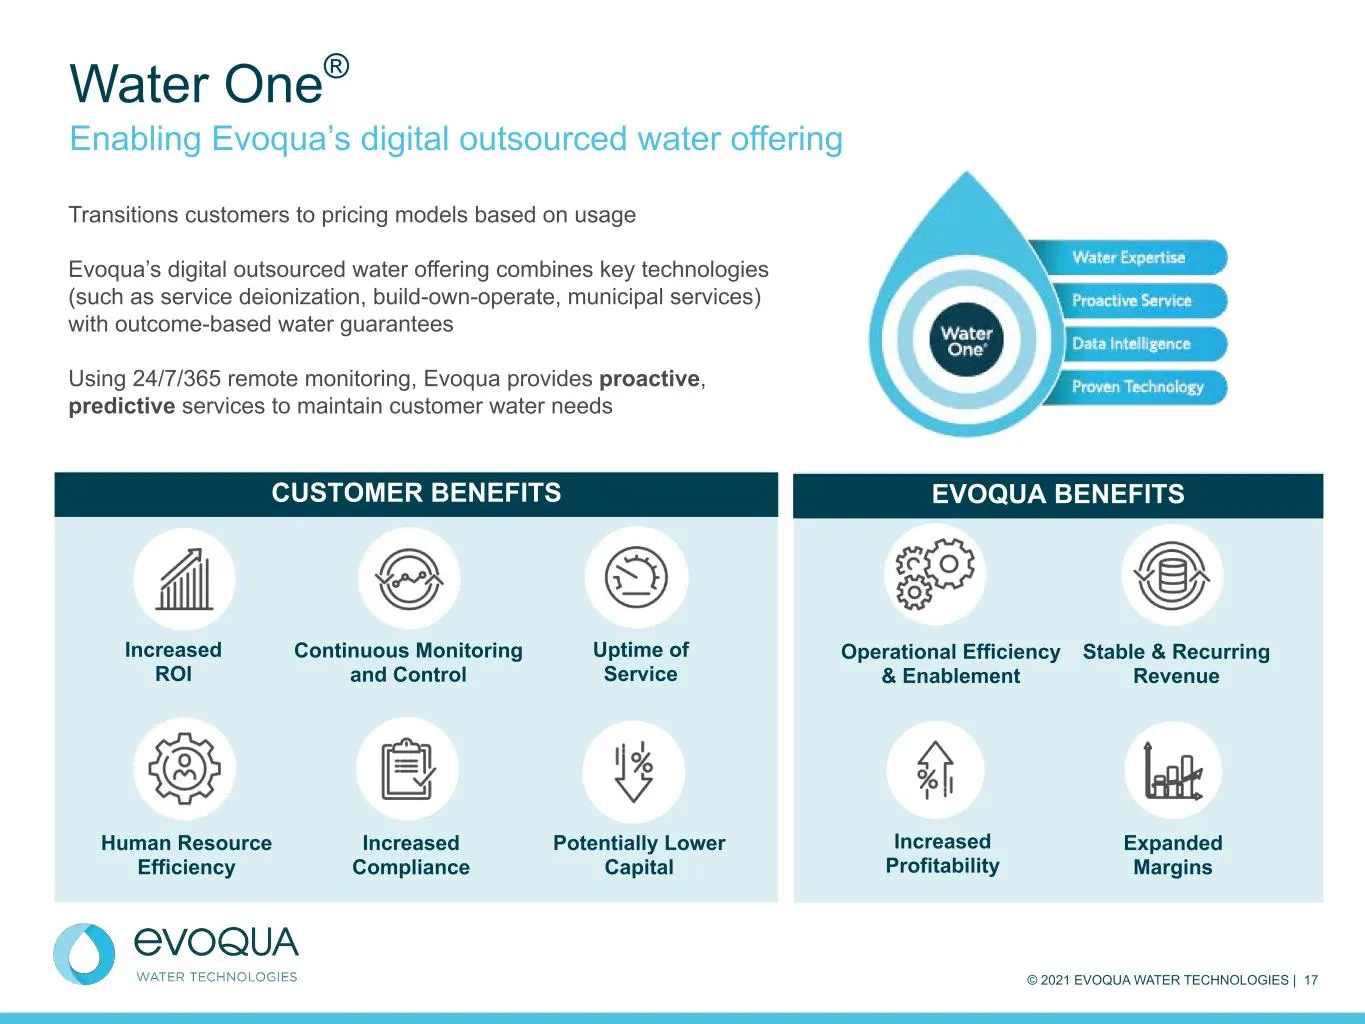
Slide 17: Water One enabling digital outsourced water
© 2021 EVOQUA WATER TECHNOLOGIES | 17 CUSTOMER BENEFITS EVOQUA BENEFITS Increased ROI Continuous Monitoring and Control Human Resource Efficiency Increased Compliance Potentially Lower Capital Increased Profitability Stable & Recurring Revenue Expanded Margins Uptime of Service Operational Efficienc
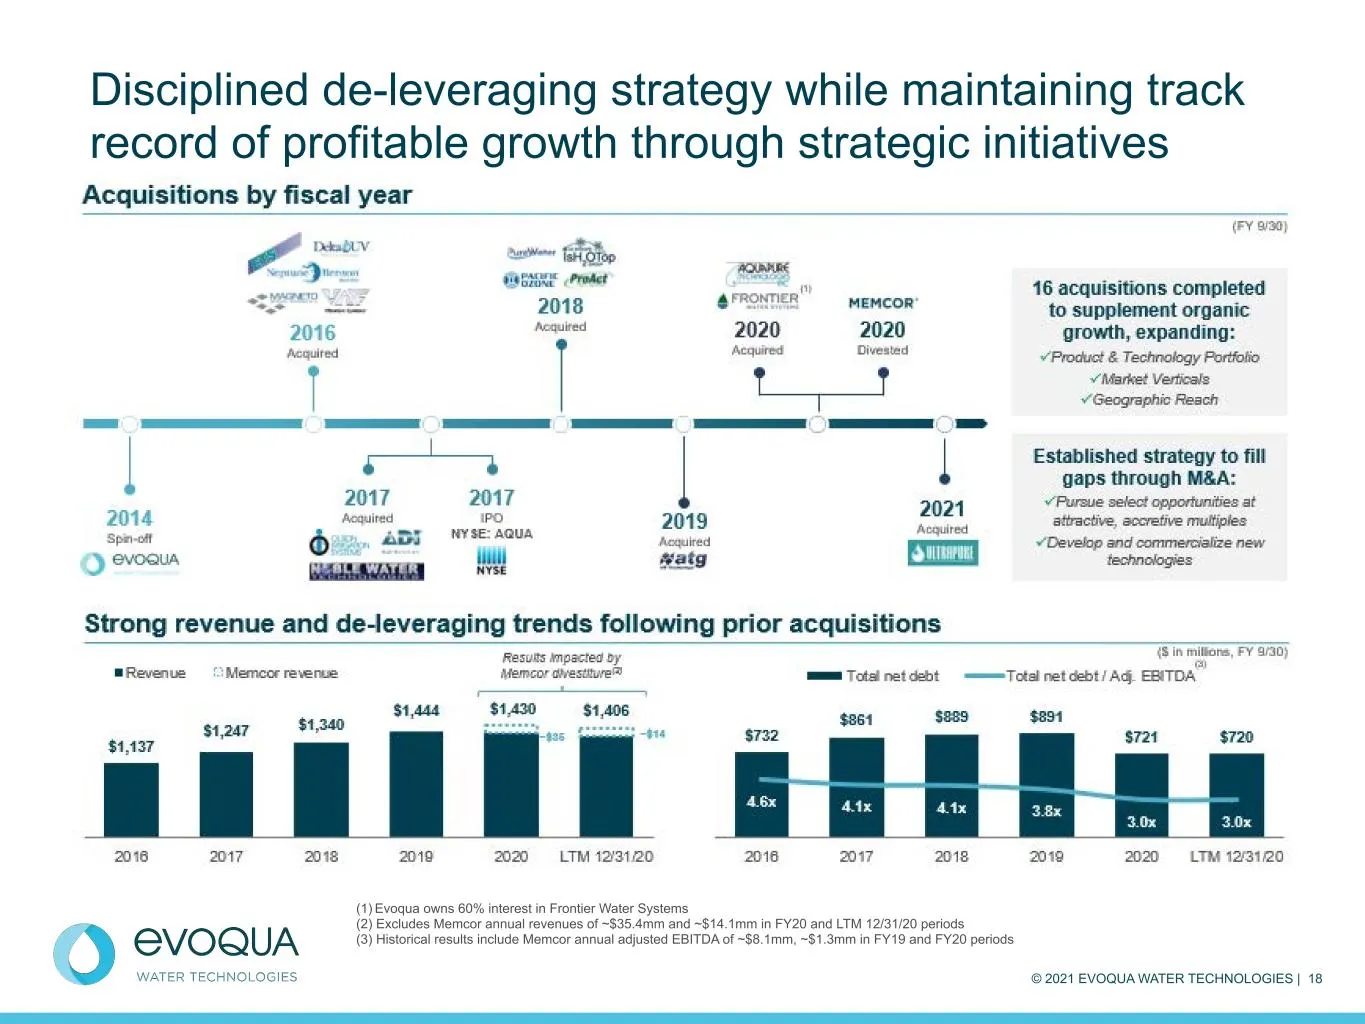
Slide 18: Disciplined de-leveraging strategy
© 2021 EVOQUA WATER TECHNOLOGIES | 18 Disciplined de-leveraging strategy while maintaining track record of profitable growth through strategic initiatives (1) Evoqua owns 60% interest in Frontier Water Systems (2) Excludes Memcor annual revenues of ~$35.4mm and ~$14.1mm in FY20 and LTM 12/31/20 peri
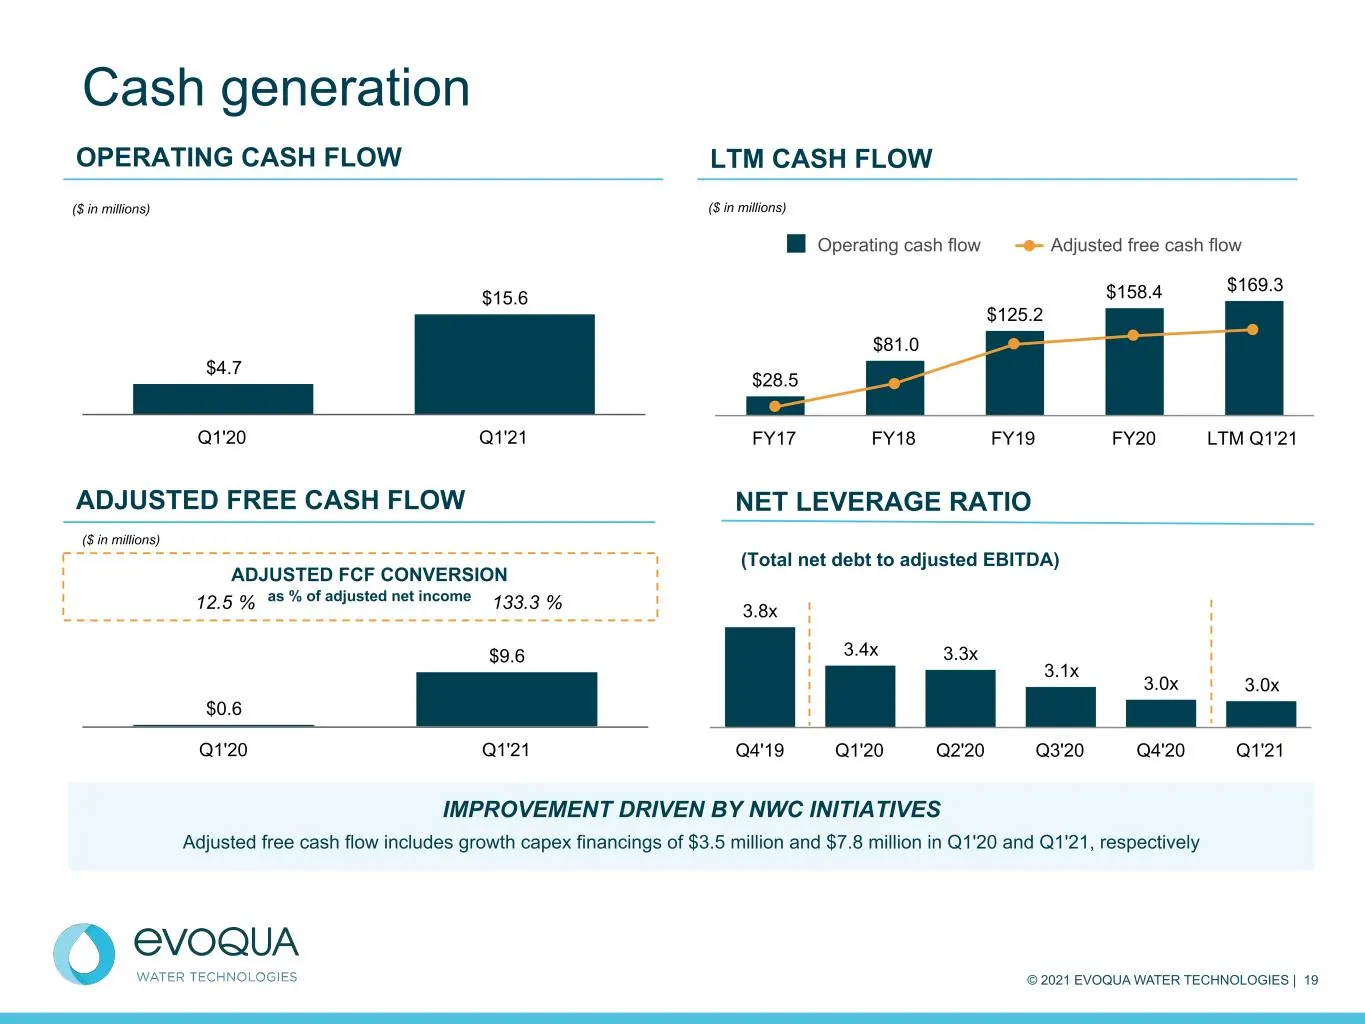
Slide 19: Cash generation and net leverage ratio
© 2021 EVOQUA WATER TECHNOLOGIES | 19 IMPROVEMENT DRIVEN BY NWC INITIATIVES Adjusted free cash flow includes growth capex financings of $3.5 million and $7.8 million in Q1'20 and Q1'21, respectively Cash generation $0.6 $9.6 Q1'20 Q1'21 ($ in millions) (Total net debt to adjusted EBITDA) 3.8x 3.4x 3
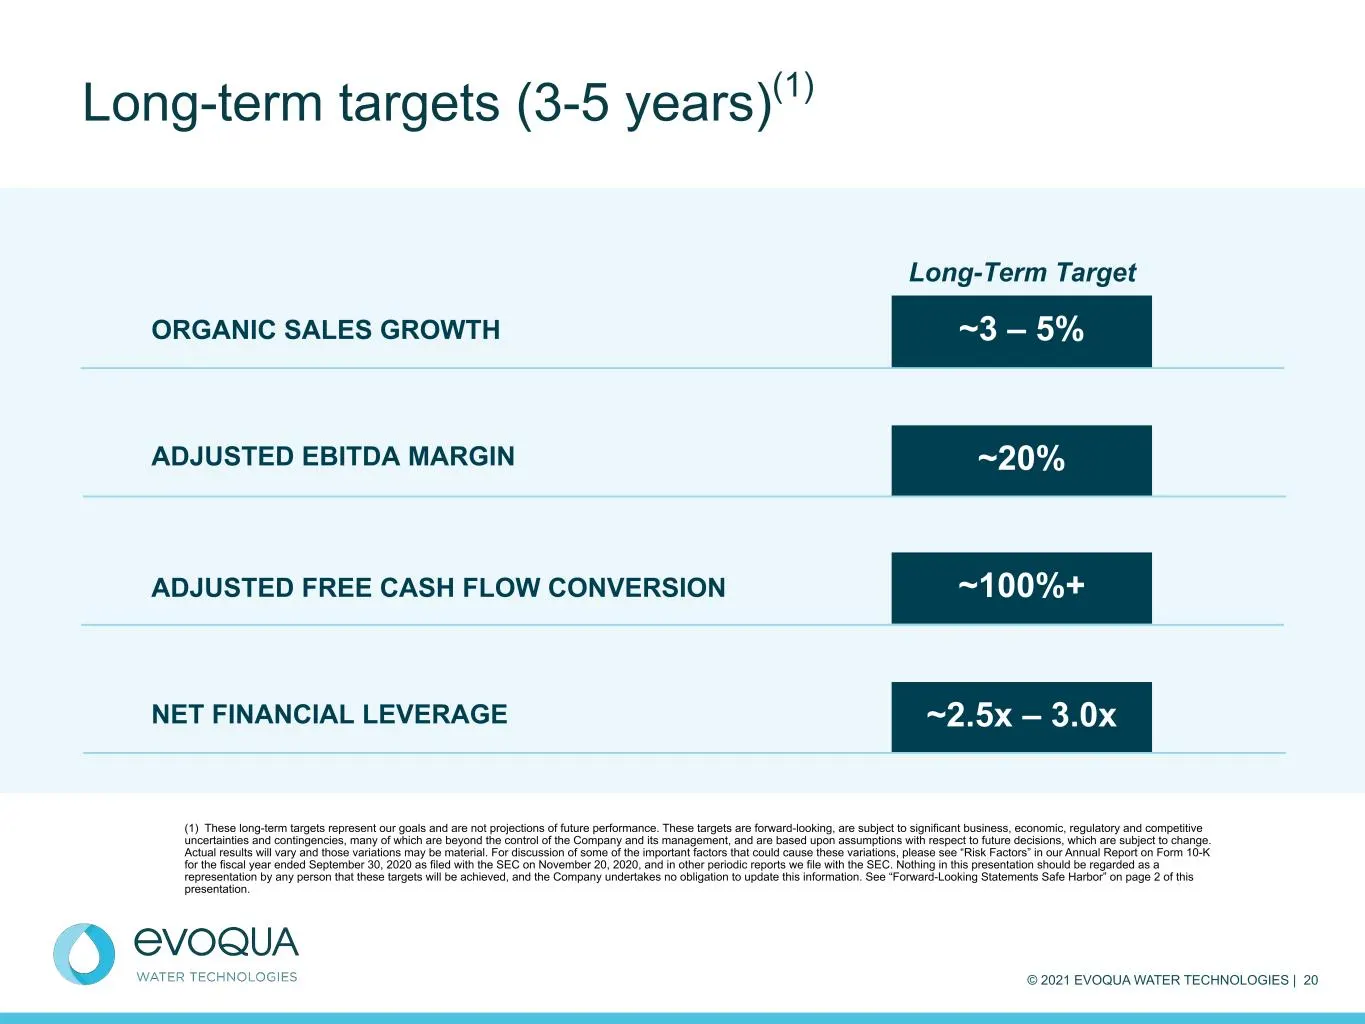
Slide 20: Long-term targets (3-5 years)
© 2021 EVOQUA WATER TECHNOLOGIES | 20 Long-term targets (3-5 years)(1) ORGANIC SALES GROWTH ~3 – 5% ADJUSTED EBITDA MARGIN ~20% ADJUSTED FREE CASH FLOW CONVERSION ~100%+ NET FINANCIAL LEVERAGE ~2.5x – 3.0x Long-Term Target (1) These long-term targets represent our goals and are not projections of fu
Slide 21: Key investment highlights
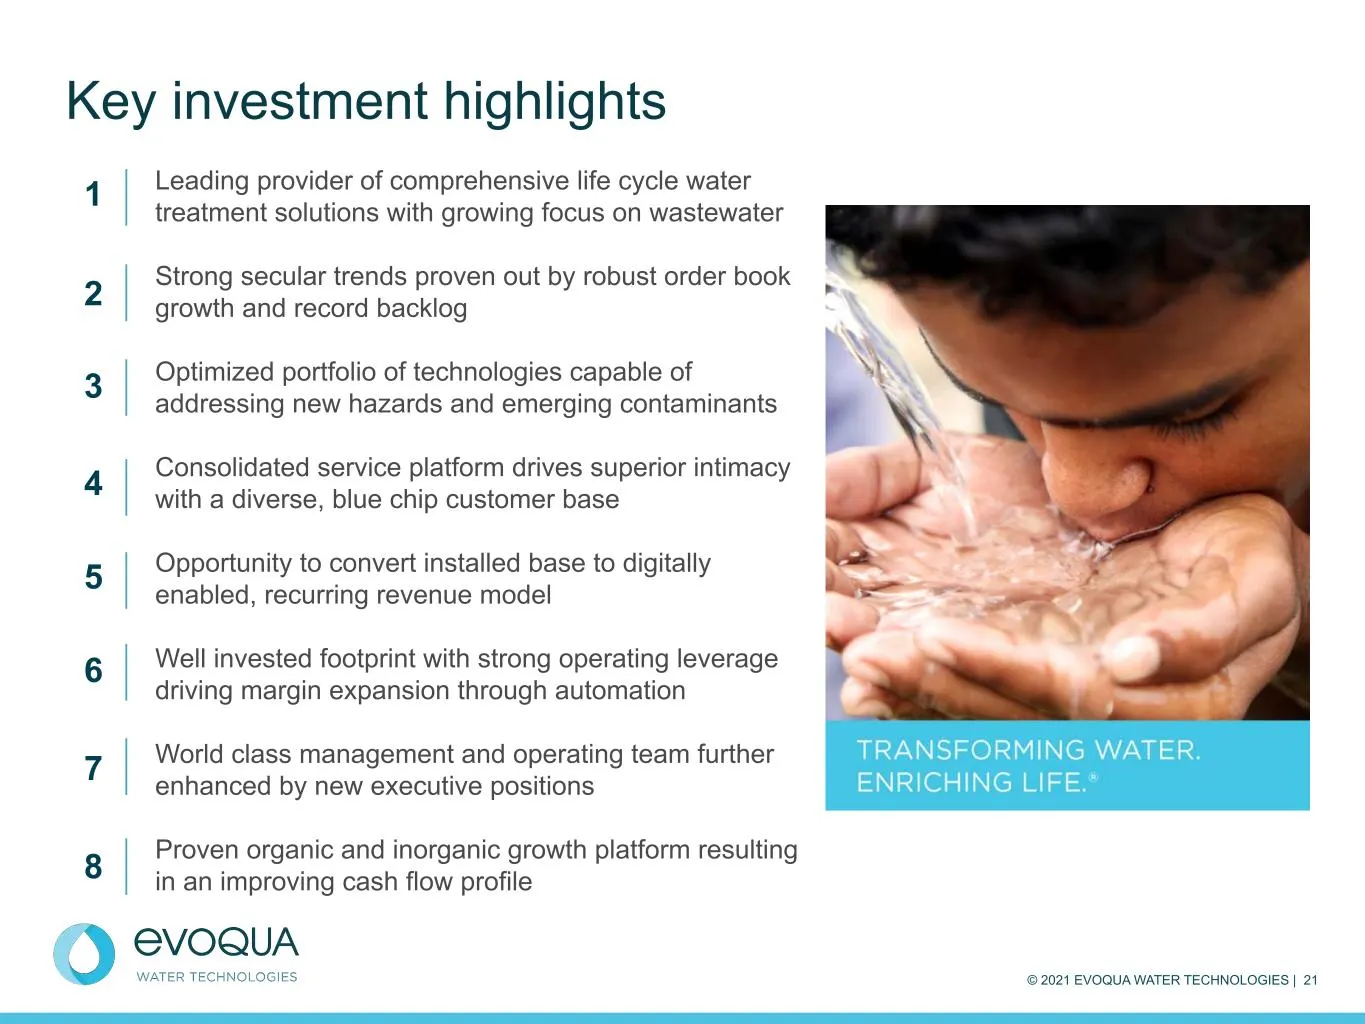
© 2021 EVOQUA WATER TECHNOLOGIES | 21 Leading provider of comprehensive life cycle water treatment solutions with growing focus on wastewater Strong secular trends proven out by robust order book growth and record backlog Optimized portfolio of technologies capable of addressing new hazards and emer
Slide 22: Appendix
©2021 EVOQUA WATER TECHNOLOGIES | 22 Appendix
Slide 23: Non-GAAP measures
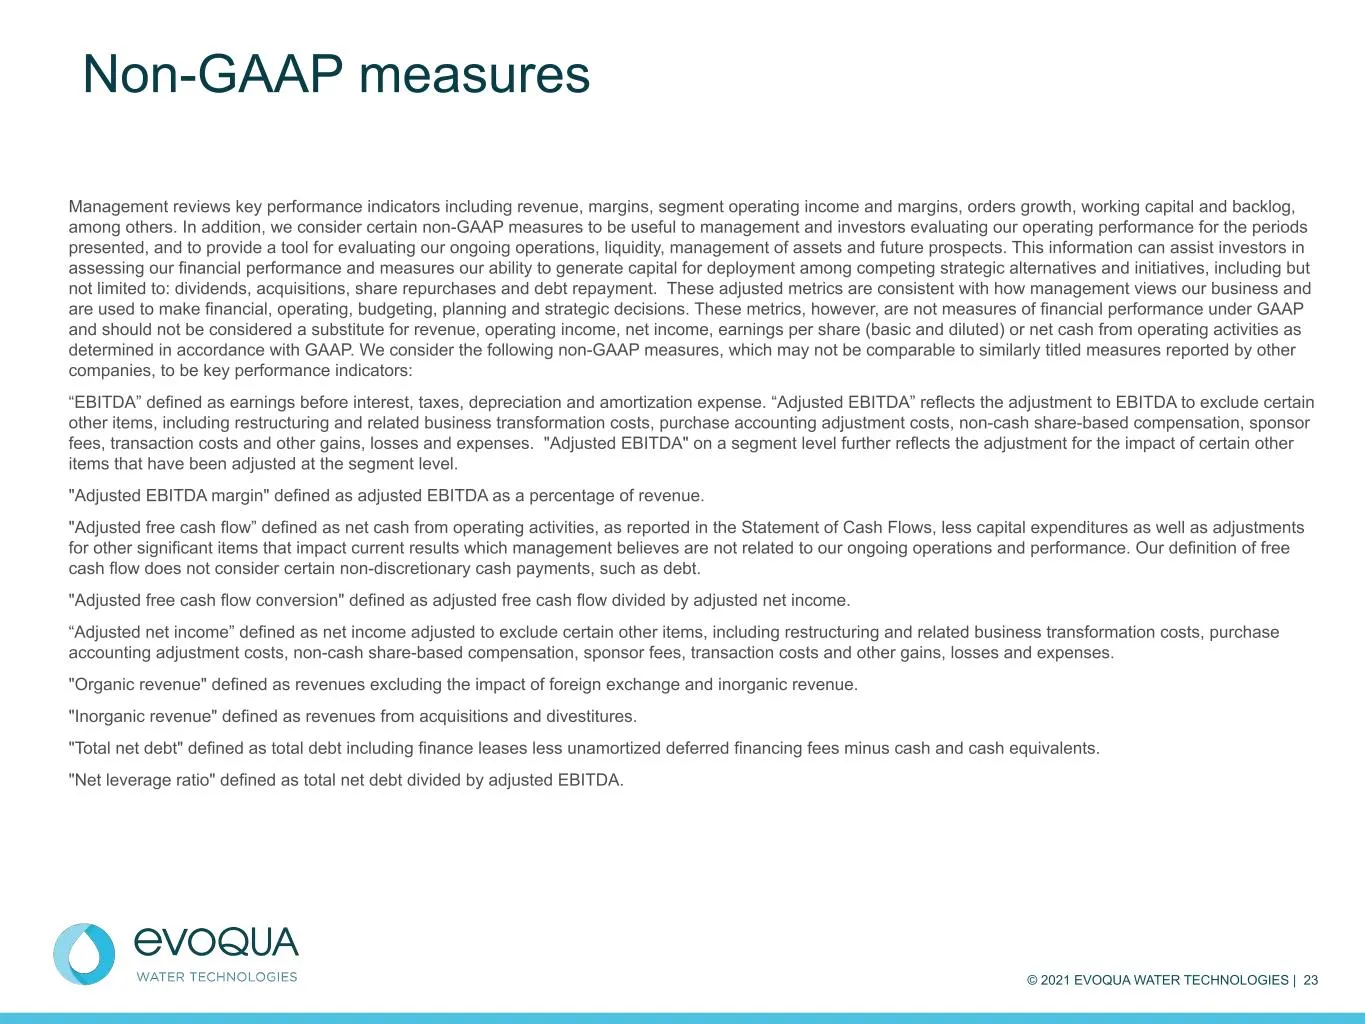
© 2021 EVOQUA WATER TECHNOLOGIES | 23 Management reviews key performance indicators including revenue, margins, segment operating income and margins, orders growth, working capital and backlog, among others. In addition, we consider certain non-GAAP measures to be useful to management and investors
Slide 24: Adjusted EBITDA reconciliation - 2021
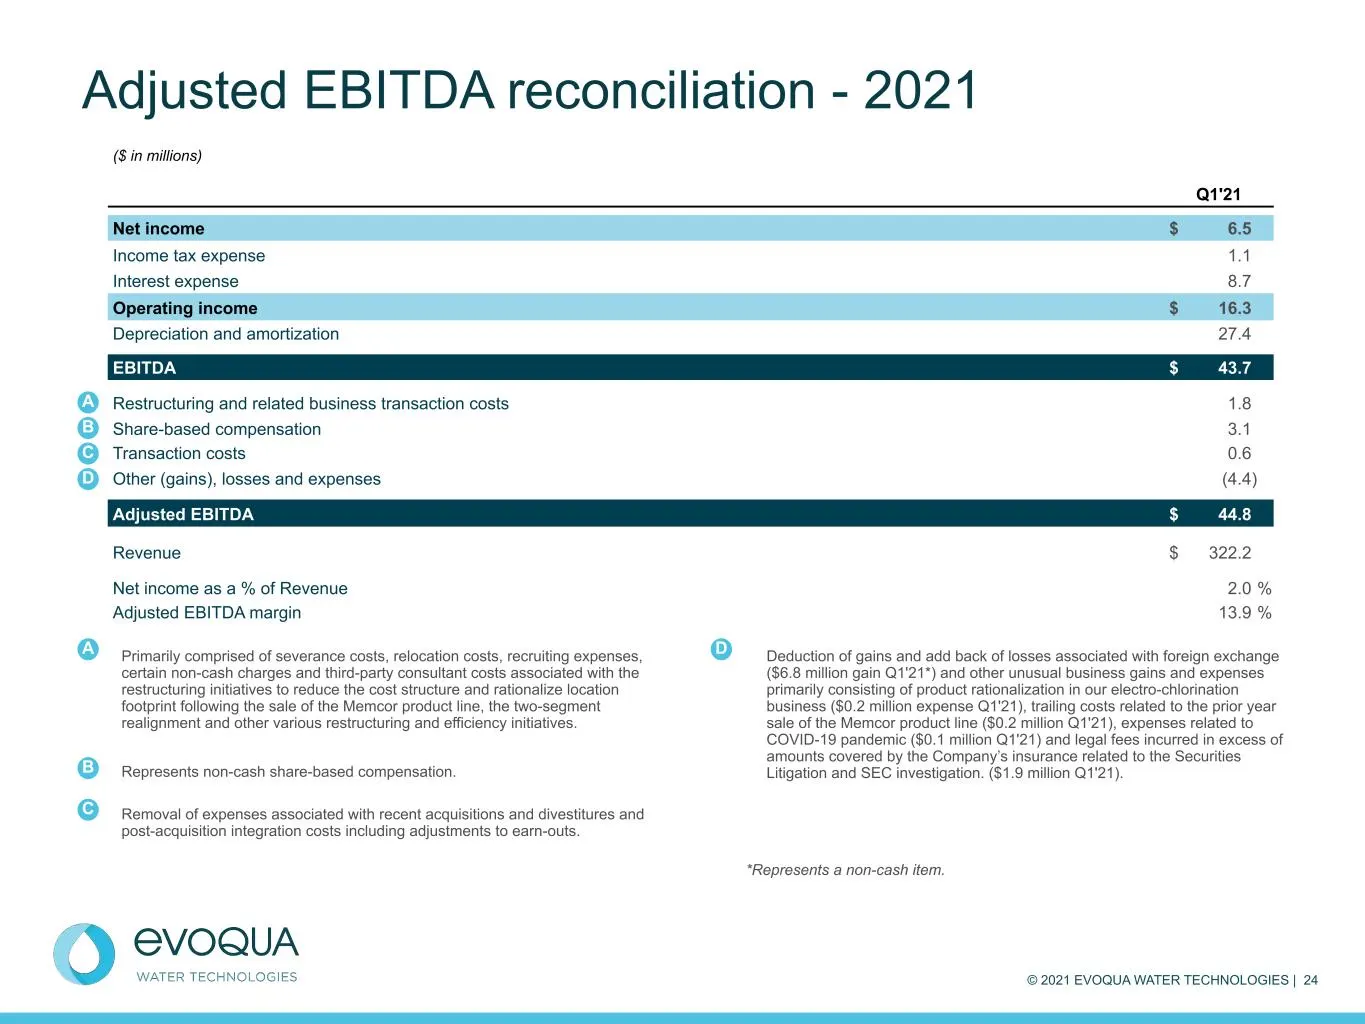
© 2021 EVOQUA WATER TECHNOLOGIES | 24 Adjusted EBITDA reconciliation - 2021 ($ in millions) Q1'21 Net income $ 6.5 Income tax expense 1.1 Interest expense 8.7 Operating income $ 16.3 Depreciation and amortization 27.4 EBITDA $ 43.7 Restructuring and related business transaction costs 1.8 Share-based
Slide 25: Adjusted EBITDA reconciliation - 2020
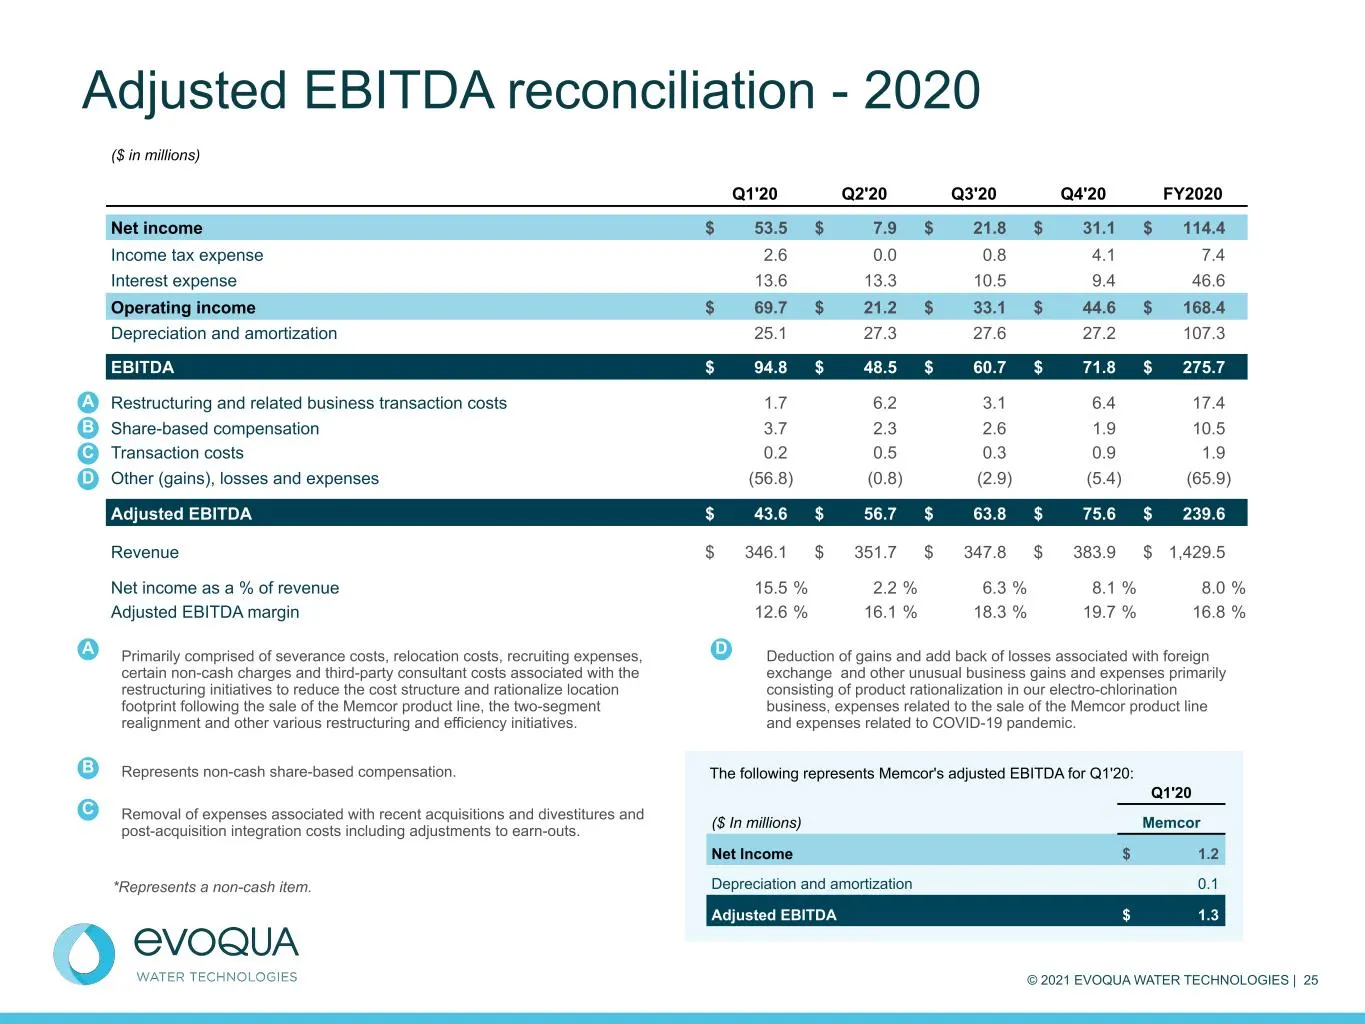
© 2021 EVOQUA WATER TECHNOLOGIES | 25 Adjusted EBITDA reconciliation - 2020 ($ in millions) Q1'20 Q2'20 Q3'20 Q4'20 FY2020 Net income $ 53.5 $ 7.9 $ 21.8 $ 31.1 $ 114.4 Income tax expense 2.6 0.0 0.8 4.1 7.4 Interest expense 13.6 13.3 10.5 9.4 46.6 Operating income $ 69.7 $ 21.2 $ 33.1 $ 44.6 $ 168.
Slide 26: Adjusted EBITDA reconciliation - 2019
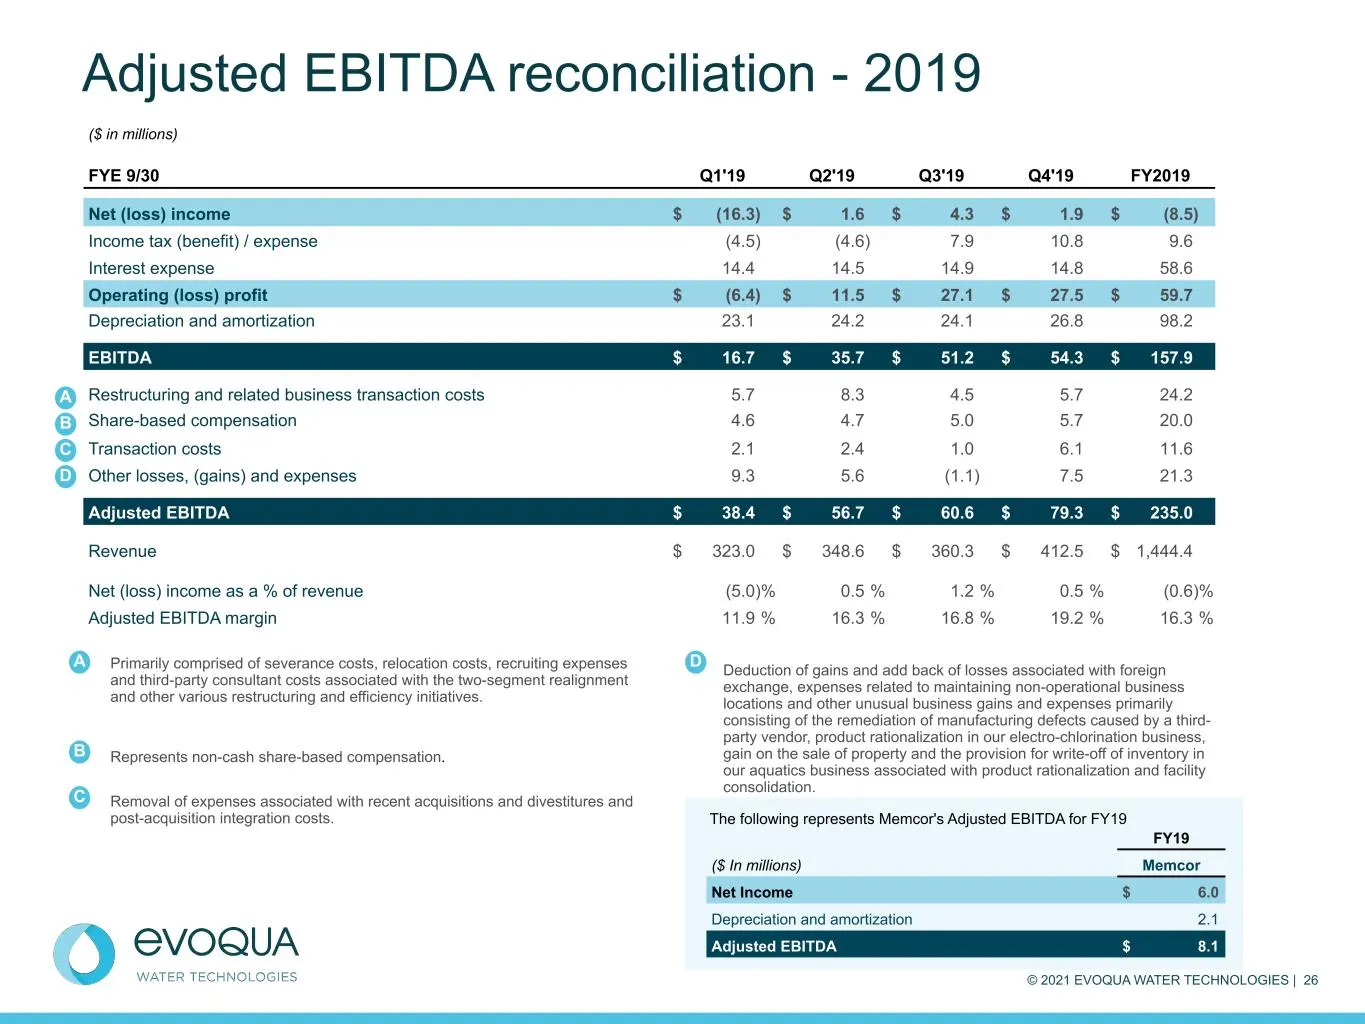
© 2021 EVOQUA WATER TECHNOLOGIES | 26 Adjusted EBITDA reconciliation - 2019 ($ in millions) FYE 9/30 Q1'19 Q2'19 Q3'19 Q4'19 FY2019 Net (loss) income $ (16.3) $ 1.6 $ 4.3 $ 1.9 $ (8.5) Income tax (benefit) / expense (4.5) (4.6) 7.9 10.8 9.6 Interest expense 14.4 14.5 14.9 14.8 58.6 Operating (loss)
Slide 27: Adjusted EBITDA reconciliation - 2018
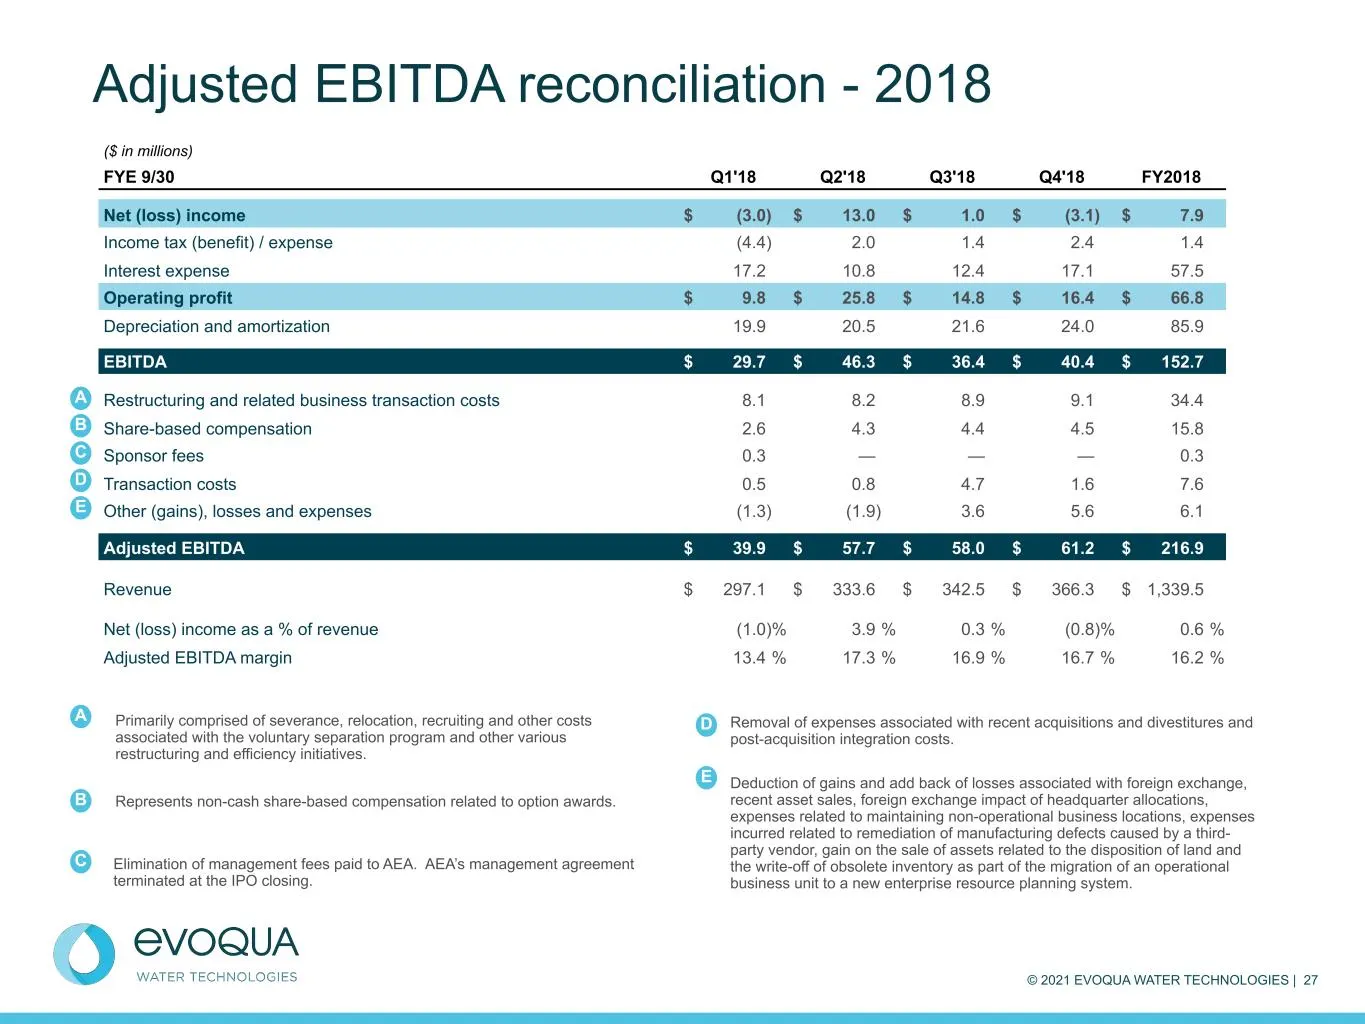
© 2021 EVOQUA WATER TECHNOLOGIES | 27 Adjusted EBITDA reconciliation - 2018 Primarily comprised of severance, relocation, recruiting and other costs associated with the voluntary separation program and other various restructuring and efficiency initiatives. Represents non-cash share-based compensati
Slide 28: Adjusted EBITDA reconciliation - 2017
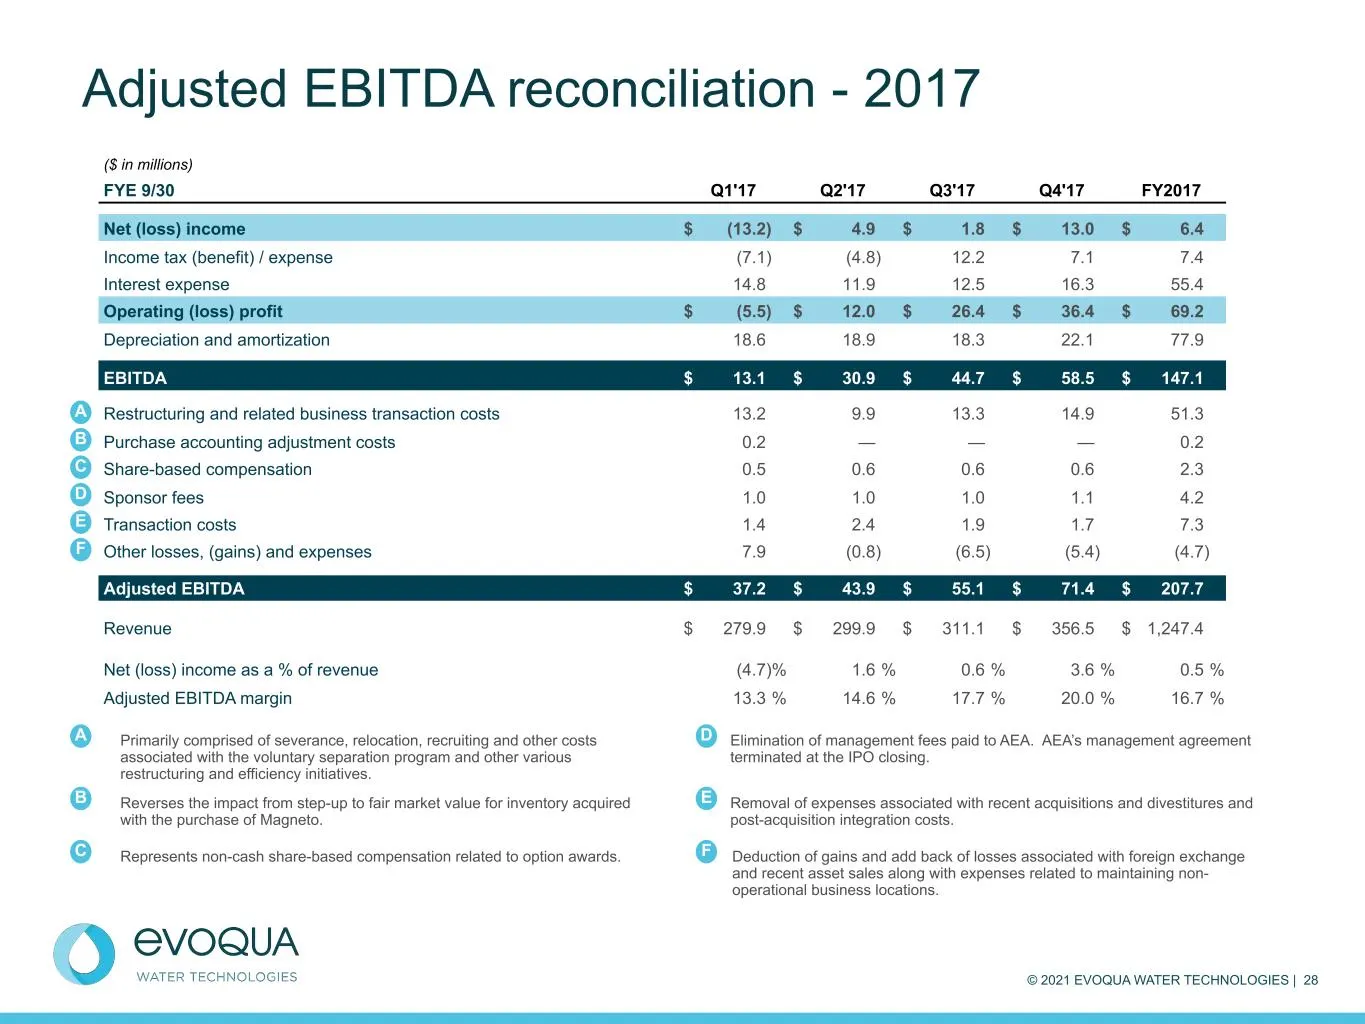
© 2021 EVOQUA WATER TECHNOLOGIES | 28 Adjusted EBITDA reconciliation - 2017 Primarily comprised of severance, relocation, recruiting and other costs associated with the voluntary separation program and other various restructuring and efficiency initiatives. Reverses the impact from step-up to fair m
Slide 29: Adjusted EBITDA Reconciliation - 2016
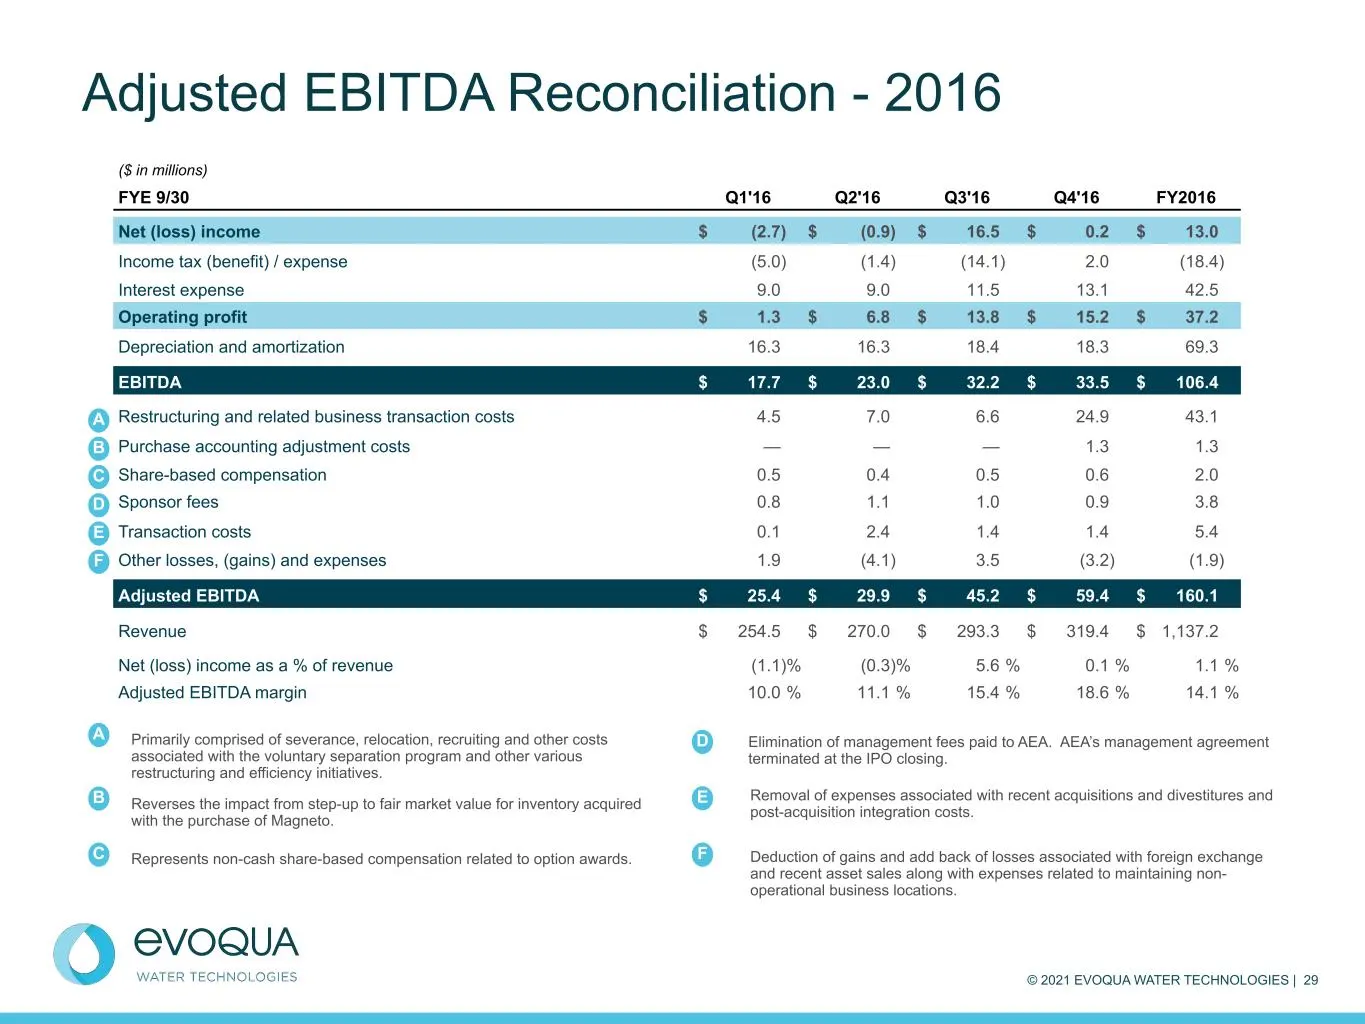
© 2021 EVOQUA WATER TECHNOLOGIES | 29 Adjusted EBITDA Reconciliation - 2016 Primarily comprised of severance, relocation, recruiting and other costs associated with the voluntary separation program and other various restructuring and efficiency initiatives. Reverses the impact from step-up to fair m
Slide 30: Segment adjusted EBITDA reconciliation
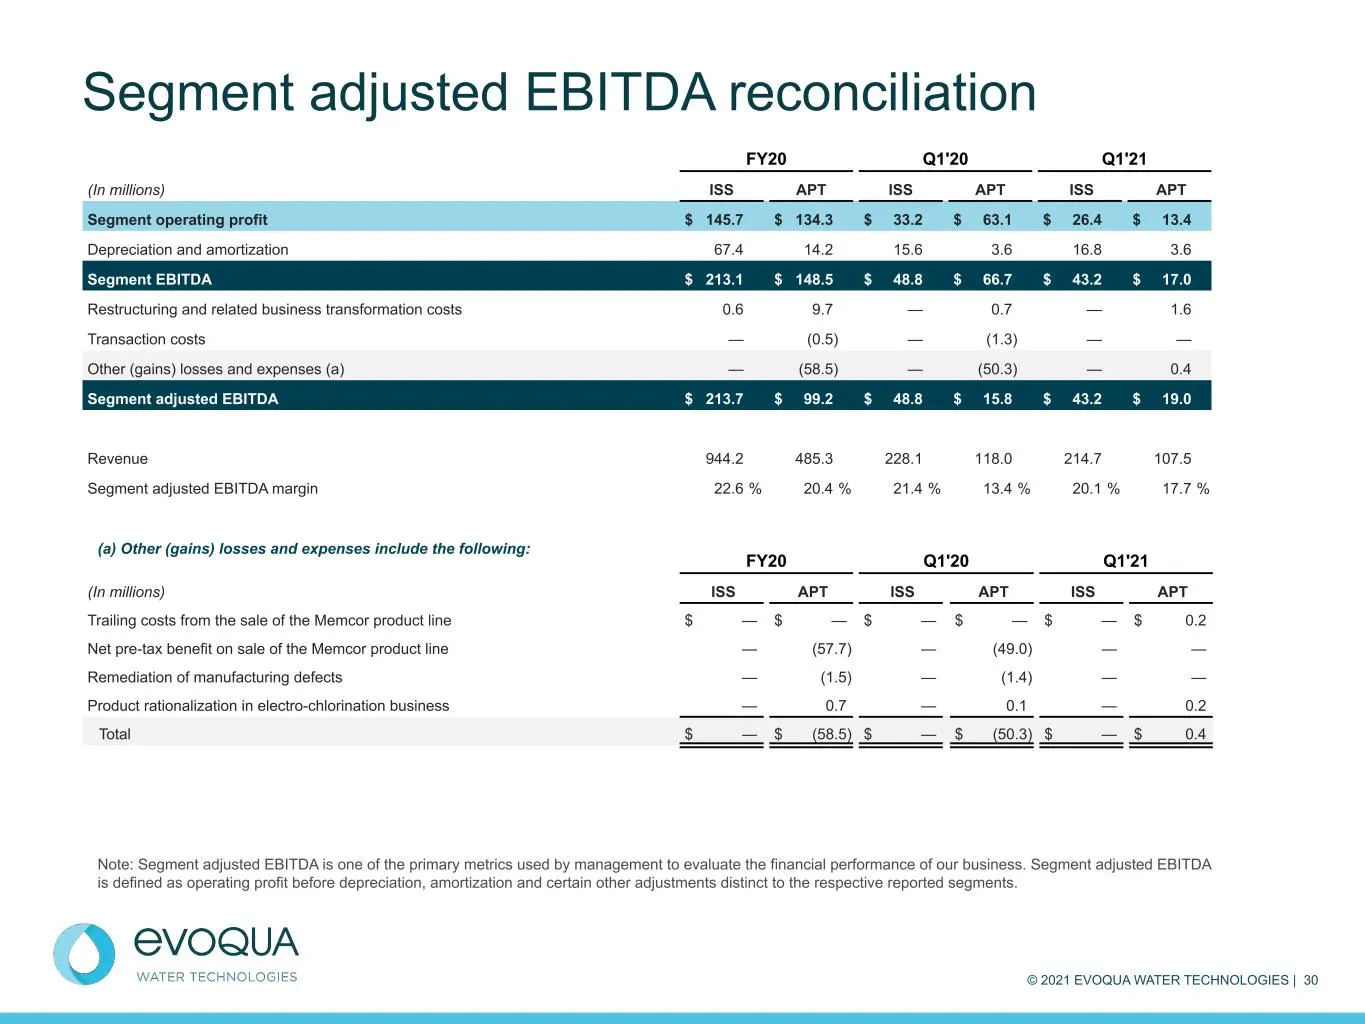
© 2021 EVOQUA WATER TECHNOLOGIES | 30 Segment adjusted EBITDA reconciliation FY20 Q1'20 Q1'21 (In millions) ISS APT ISS APT ISS APT Trailing costs from the sale of the Memcor product line $ — $ — $ — $ — $ — $ 0.2 Net pre-tax benefit on sale of the Memcor product line — (57.7) — (49.0) — — Remediati
Slide 31: Adjusted free cash flow (Q1)
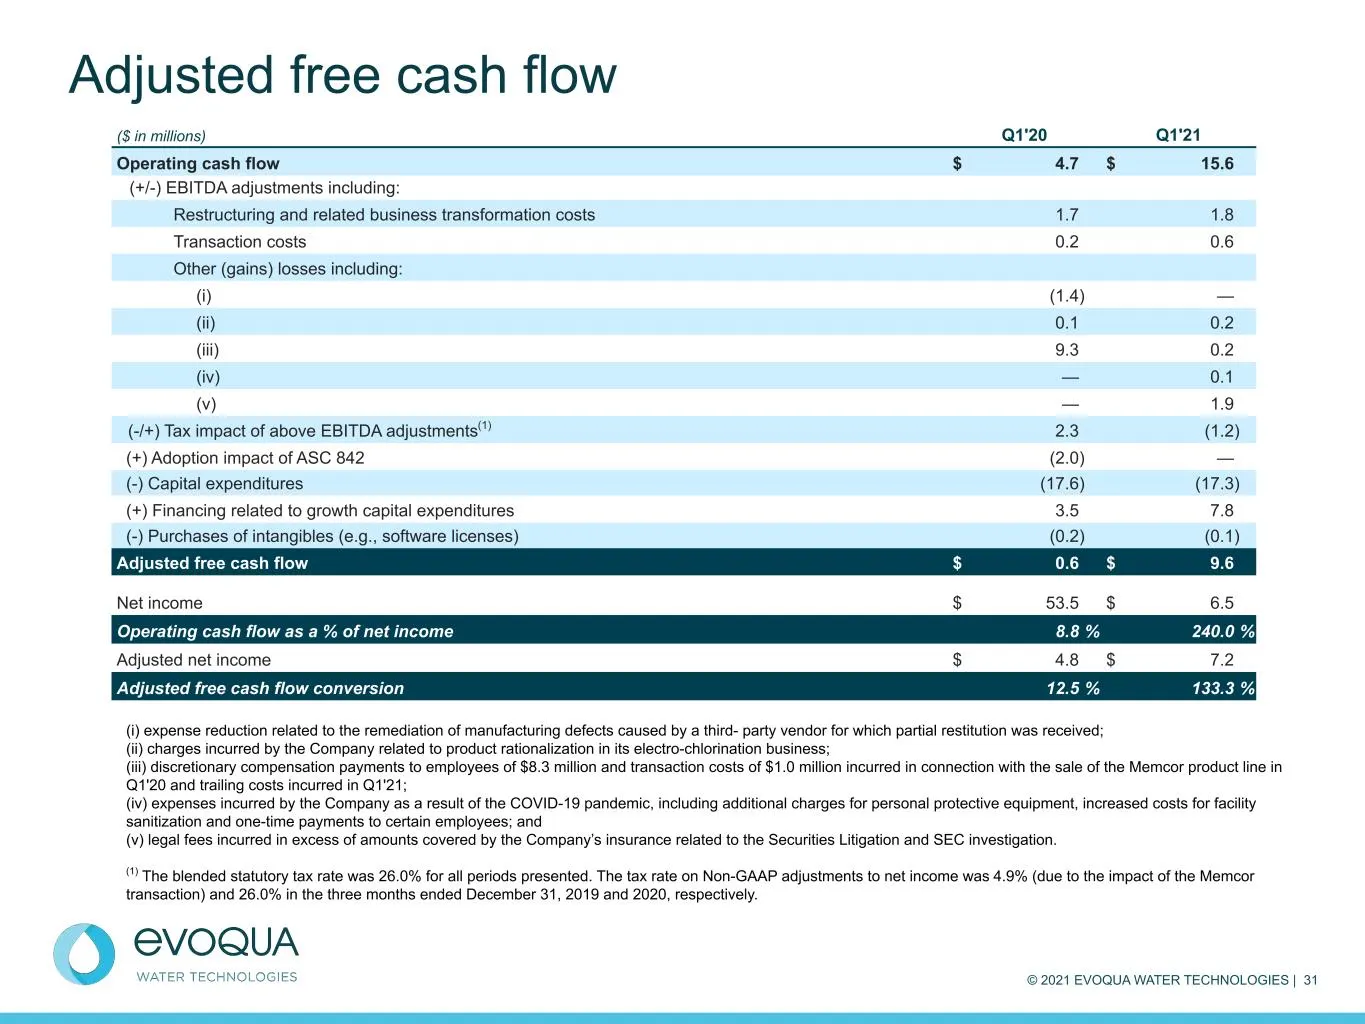
© 2021 EVOQUA WATER TECHNOLOGIES | 31 Adjusted free cash flow ($ in millions) Q1'20 Q1'21 Operating cash flow $ 4.7 $ 15.6 (+/-) EBITDA adjustments including: Restructuring and related business transformation costs 1.7 1.8 Transaction costs 0.2 0.6 Other (gains) losses including: (i) (1.4) — (ii) 0.
Slide 32: Adjusted free cash flow (annual and LTM)
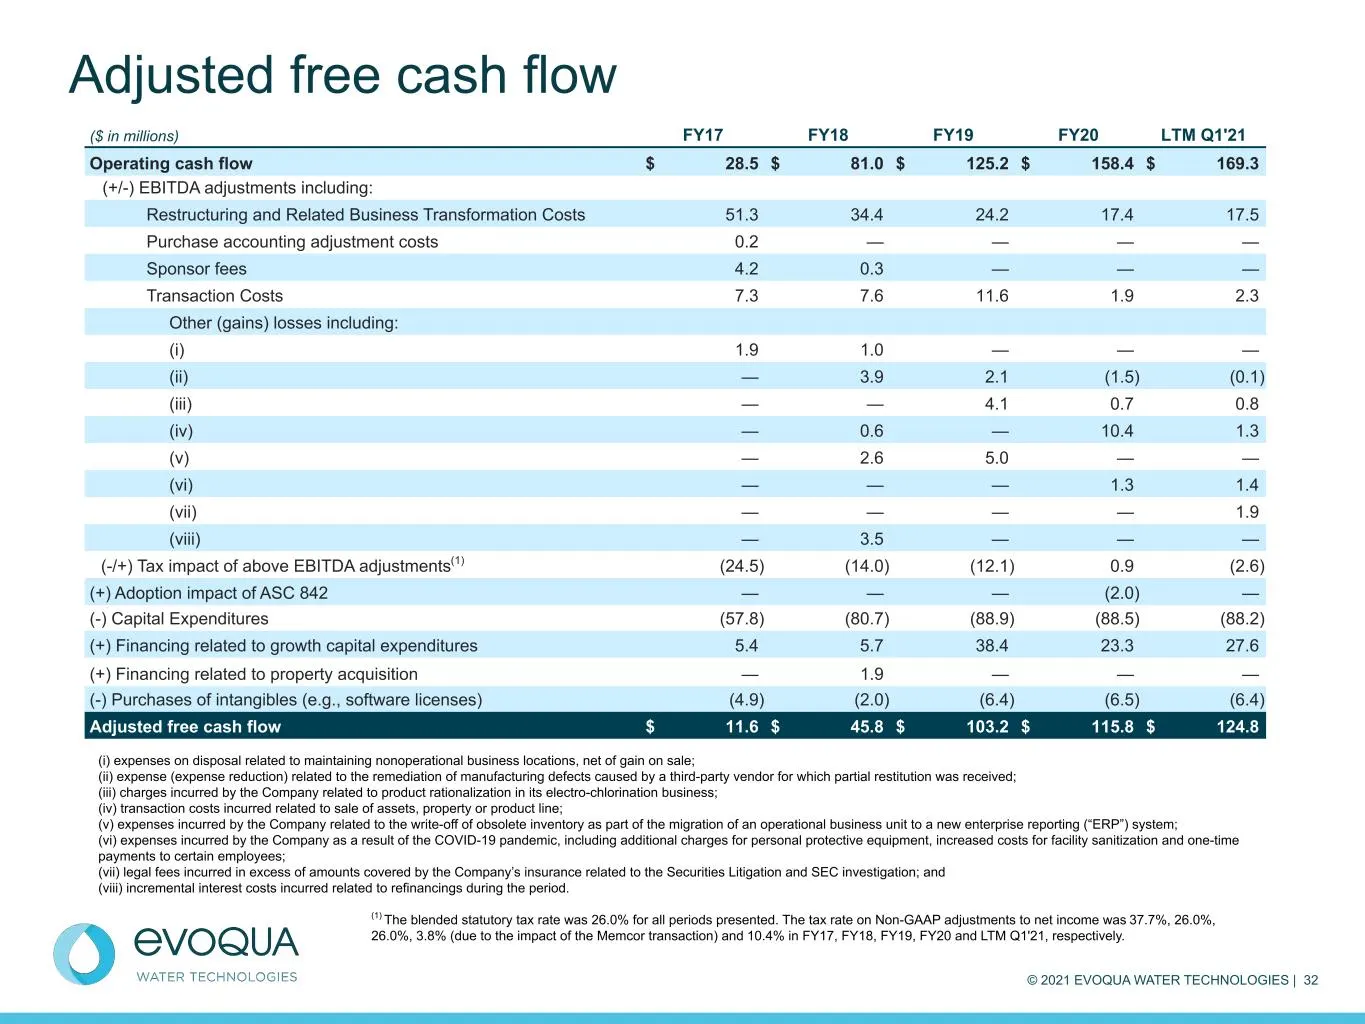
© 2021 EVOQUA WATER TECHNOLOGIES | 32 Adjusted free cash flow ($ in millions) FY17 FY18 FY19 FY20 LTM Q1'21 Operating cash flow $ 28.5 $ 81.0 $ 125.2 $ 158.4 $ 169.3 (+/-) EBITDA adjustments including: Restructuring and Related Business Transformation Costs 51.3 34.4 24.2 17.4 17.5 Purchase accounti
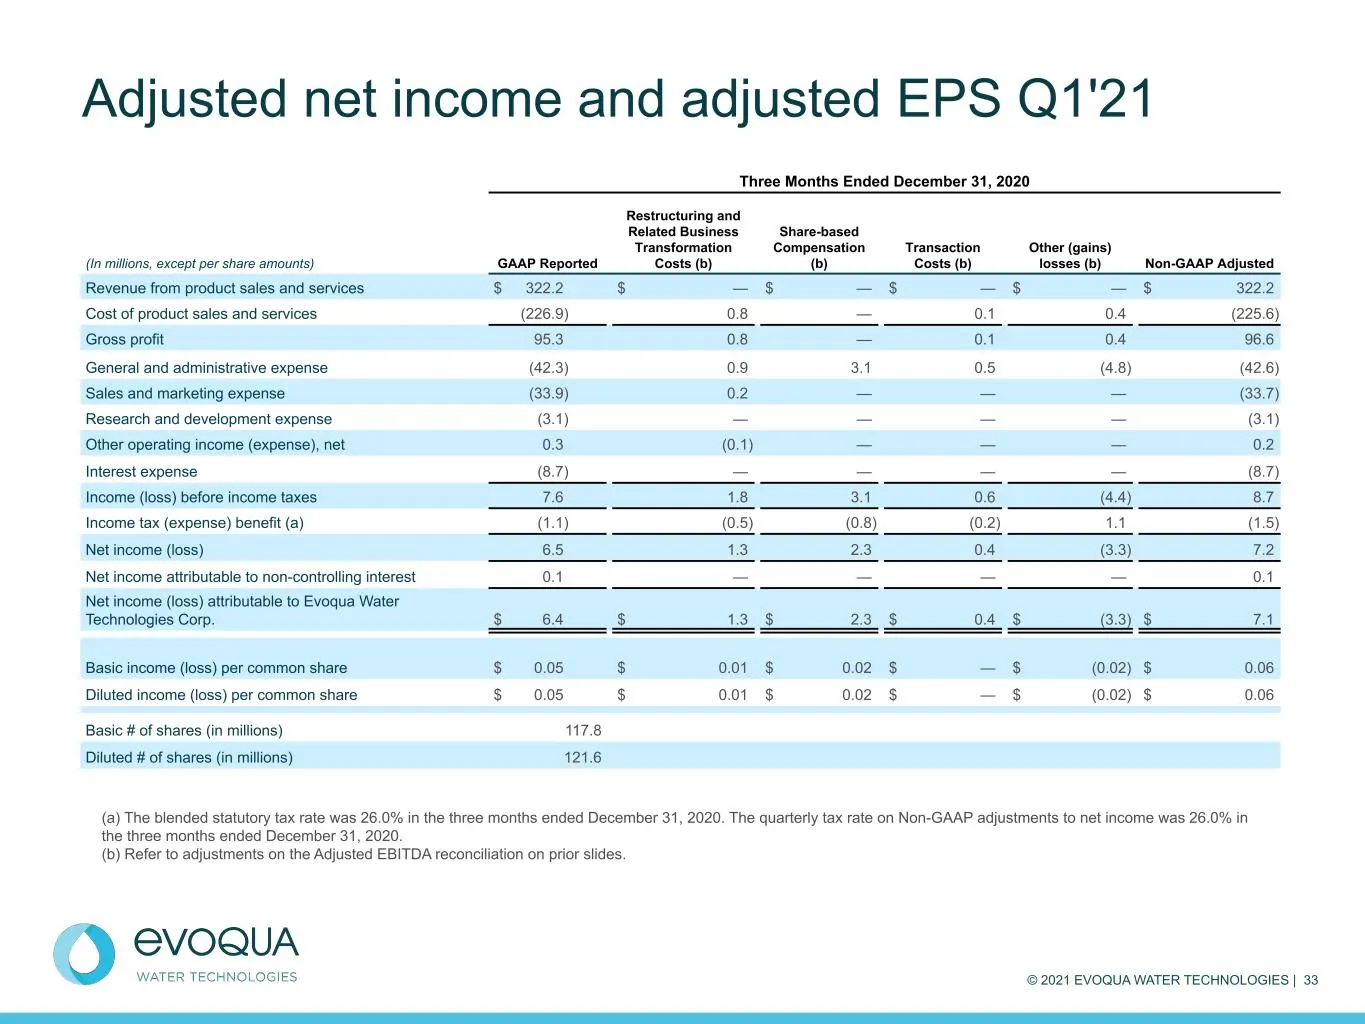
Slide 33: Adjusted net income and adjusted EPS Q1'21
© 2021 EVOQUA WATER TECHNOLOGIES | 33 Adjusted net income and adjusted EPS Q1'21 Three Months Ended December 31, 2020 (In millions, except per share amounts) GAAP Reported Restructuring and Related Business Transformation Costs (b) Share-based Compensation (b) Transaction Costs (b) Other (gains) los
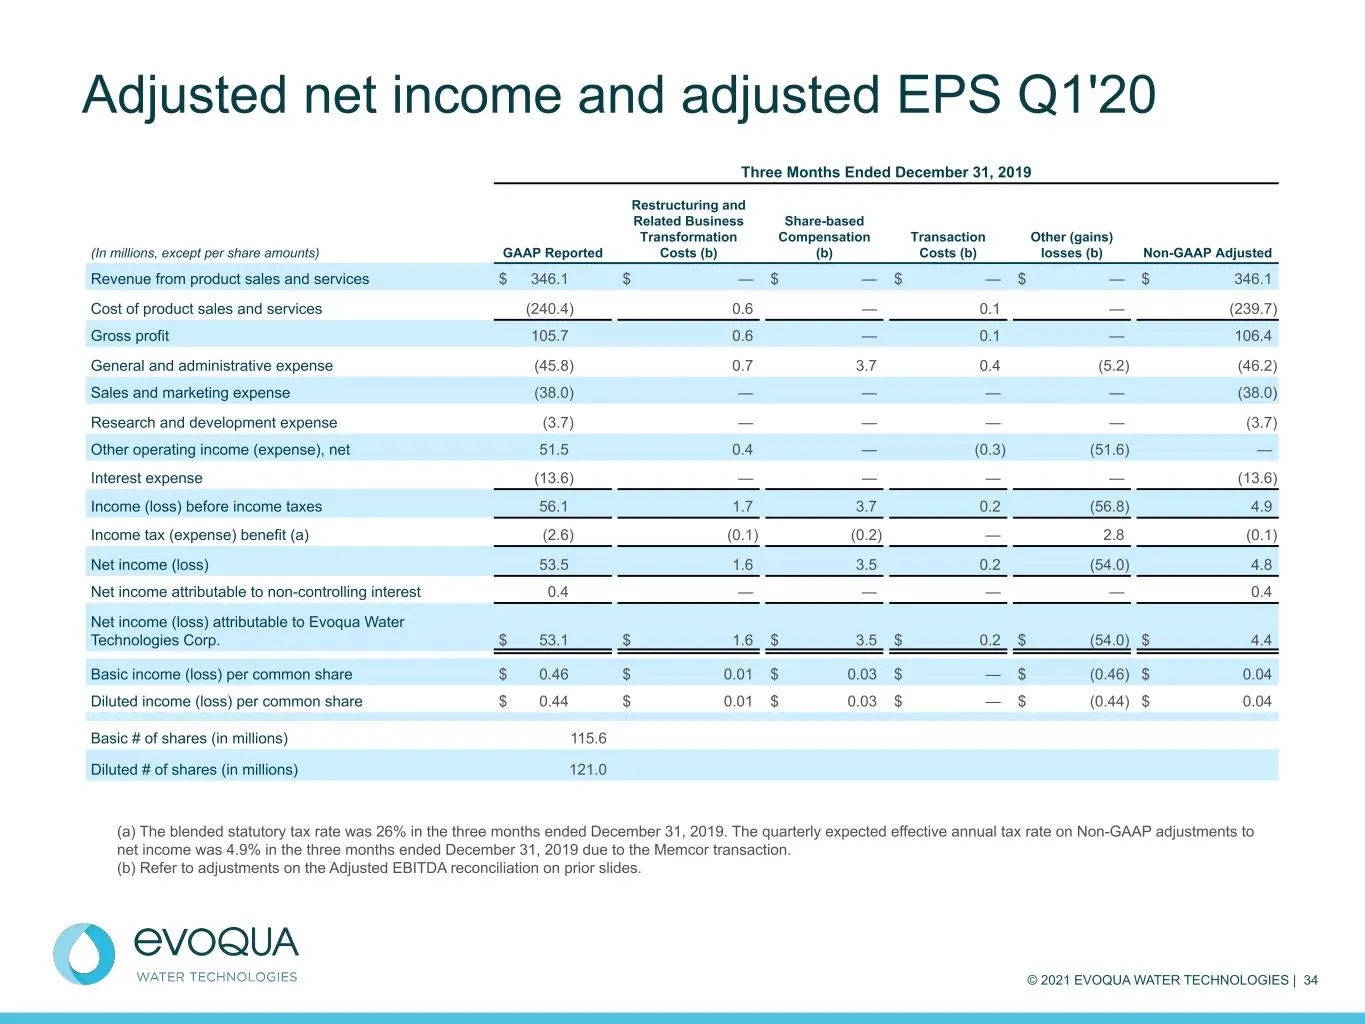
Slide 34: Adjusted net income and adjusted EPS Q1'20
© 2021 EVOQUA WATER TECHNOLOGIES | 34 Adjusted net income and adjusted EPS Q1'20 Three Months Ended December 31, 2019 (In millions, except per share amounts) GAAP Reported Restructuring and Related Business Transformation Costs (b) Share-based Compensation (b) Transaction Costs (b) Other (gains) los
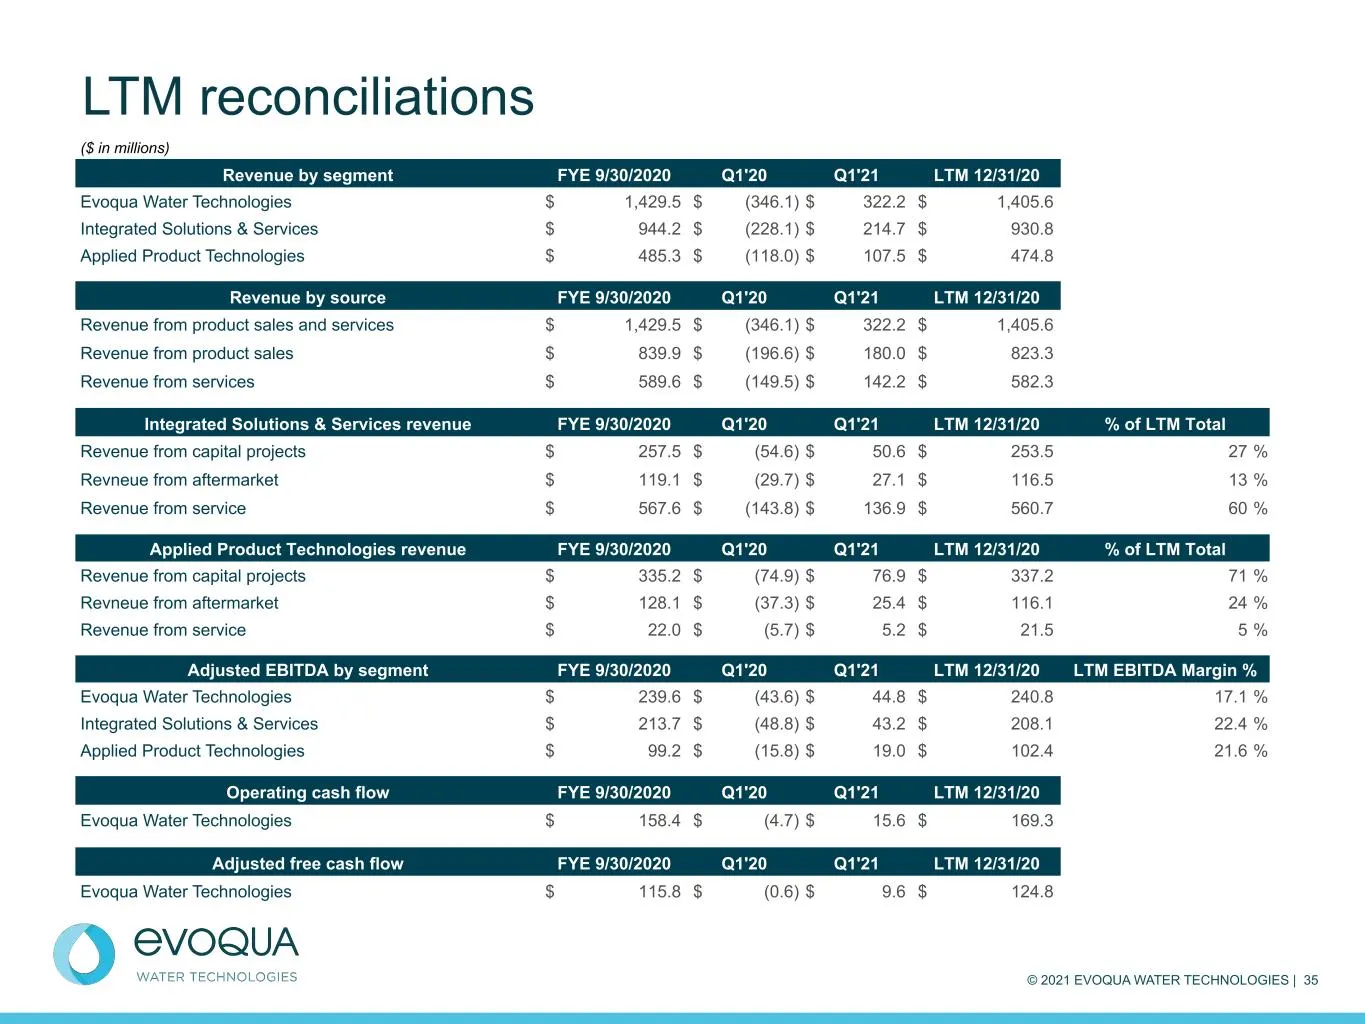
Slide 35: LTM reconciliations
© 2021 EVOQUA WATER TECHNOLOGIES | 35 LTM reconciliations ($ in millions) Revenue by segment FYE 9/30/2020 Q1'20 Q1'21 LTM 12/31/20 Evoqua Water Technologies $ 1,429.5 $ (346.1) $ 322.2 $ 1,405.6 Integrated Solutions & Services $ 944.2 $ (228.1) $ 214.7 $ 930.8 Applied Product Technologies $ 485.3 $
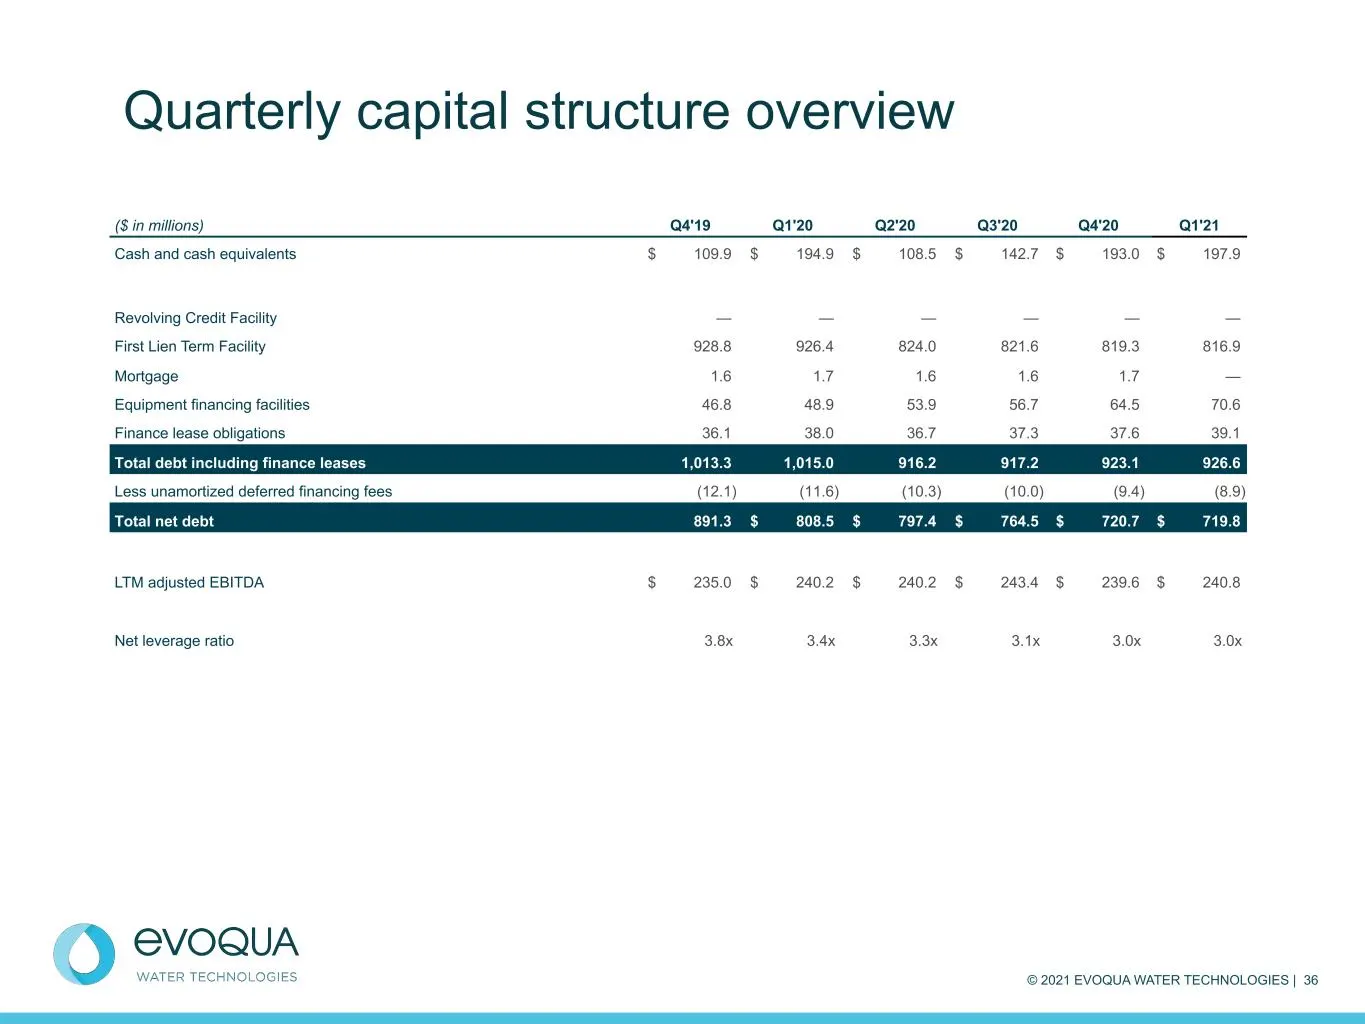
Slide 36: Quarterly capital structure overview
© 2021 EVOQUA WATER TECHNOLOGIES | 36 Quarterly capital structure overview ($ in millions) Q4'19 Q1'20 Q2'20 Q3'20 Q4'20 Q1'21 Cash and cash equivalents $ 109.9 $ 194.9 $ 108.5 $ 142.7 $ 193.0 $ 197.9 Revolving Credit Facility — — — — — — First Lien Term Facility 928.8 926.4 824.0 821.6 819.3 816.9
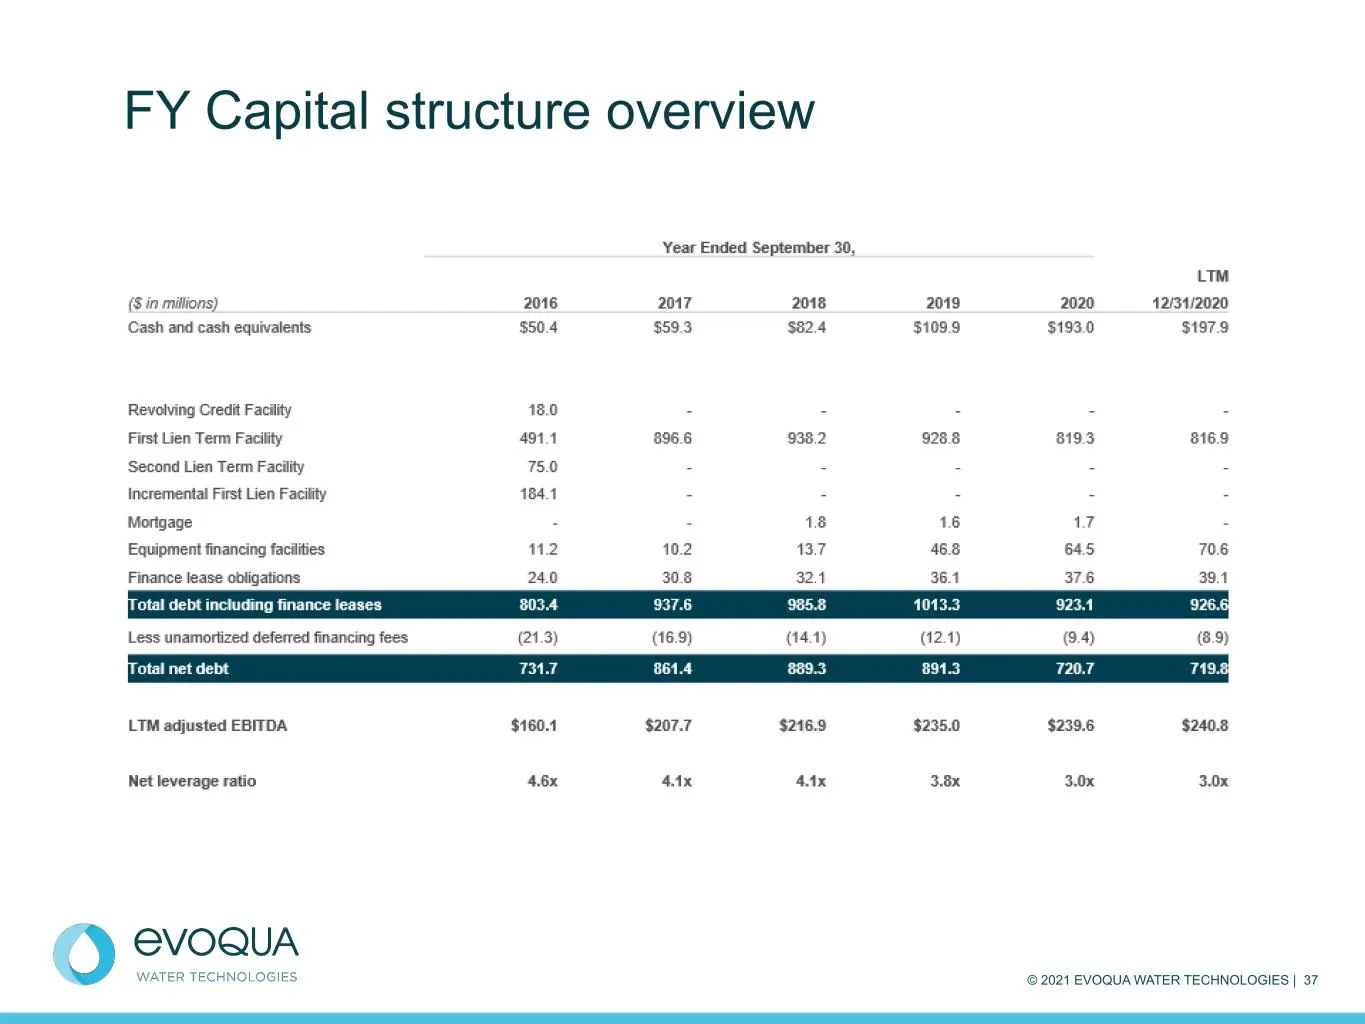
Slide 37: FY Capital structure overview
© 2021 EVOQUA WATER TECHNOLOGIES | 37 FY Capital structure overview
Slide 38: Thank you
CVOQUA WATER TECHNOLOGIES THANK YOU
Source: SEC EDGAR · 8-K filed Mar 2, 2021
More decks from Evoqua Water Technologies
 Merger or Acquisition (January 2023)20 slides · Jan 25, 2023
 Investor Presentation (September 2021)22 slides · Sep 28, 2021
 Credit Suisse Industrials Conference 201915 slides · Dec 4, 2019
 Investor Day (February 2019)28 slides · Feb 26, 2019
 Q4 2018 Earnings Presentation31 slides · Nov 27, 2018
 Q3 2018 Earnings Presentation31 slides · Aug 7, 2018