Cambridge Capital Acquisition Corp
Cambridge Capital Acquisition — SPAC Merger (March 2015)
27 slides from Cambridge Capital Acquisition's SPAC merger presentation, Mar 30, 2015
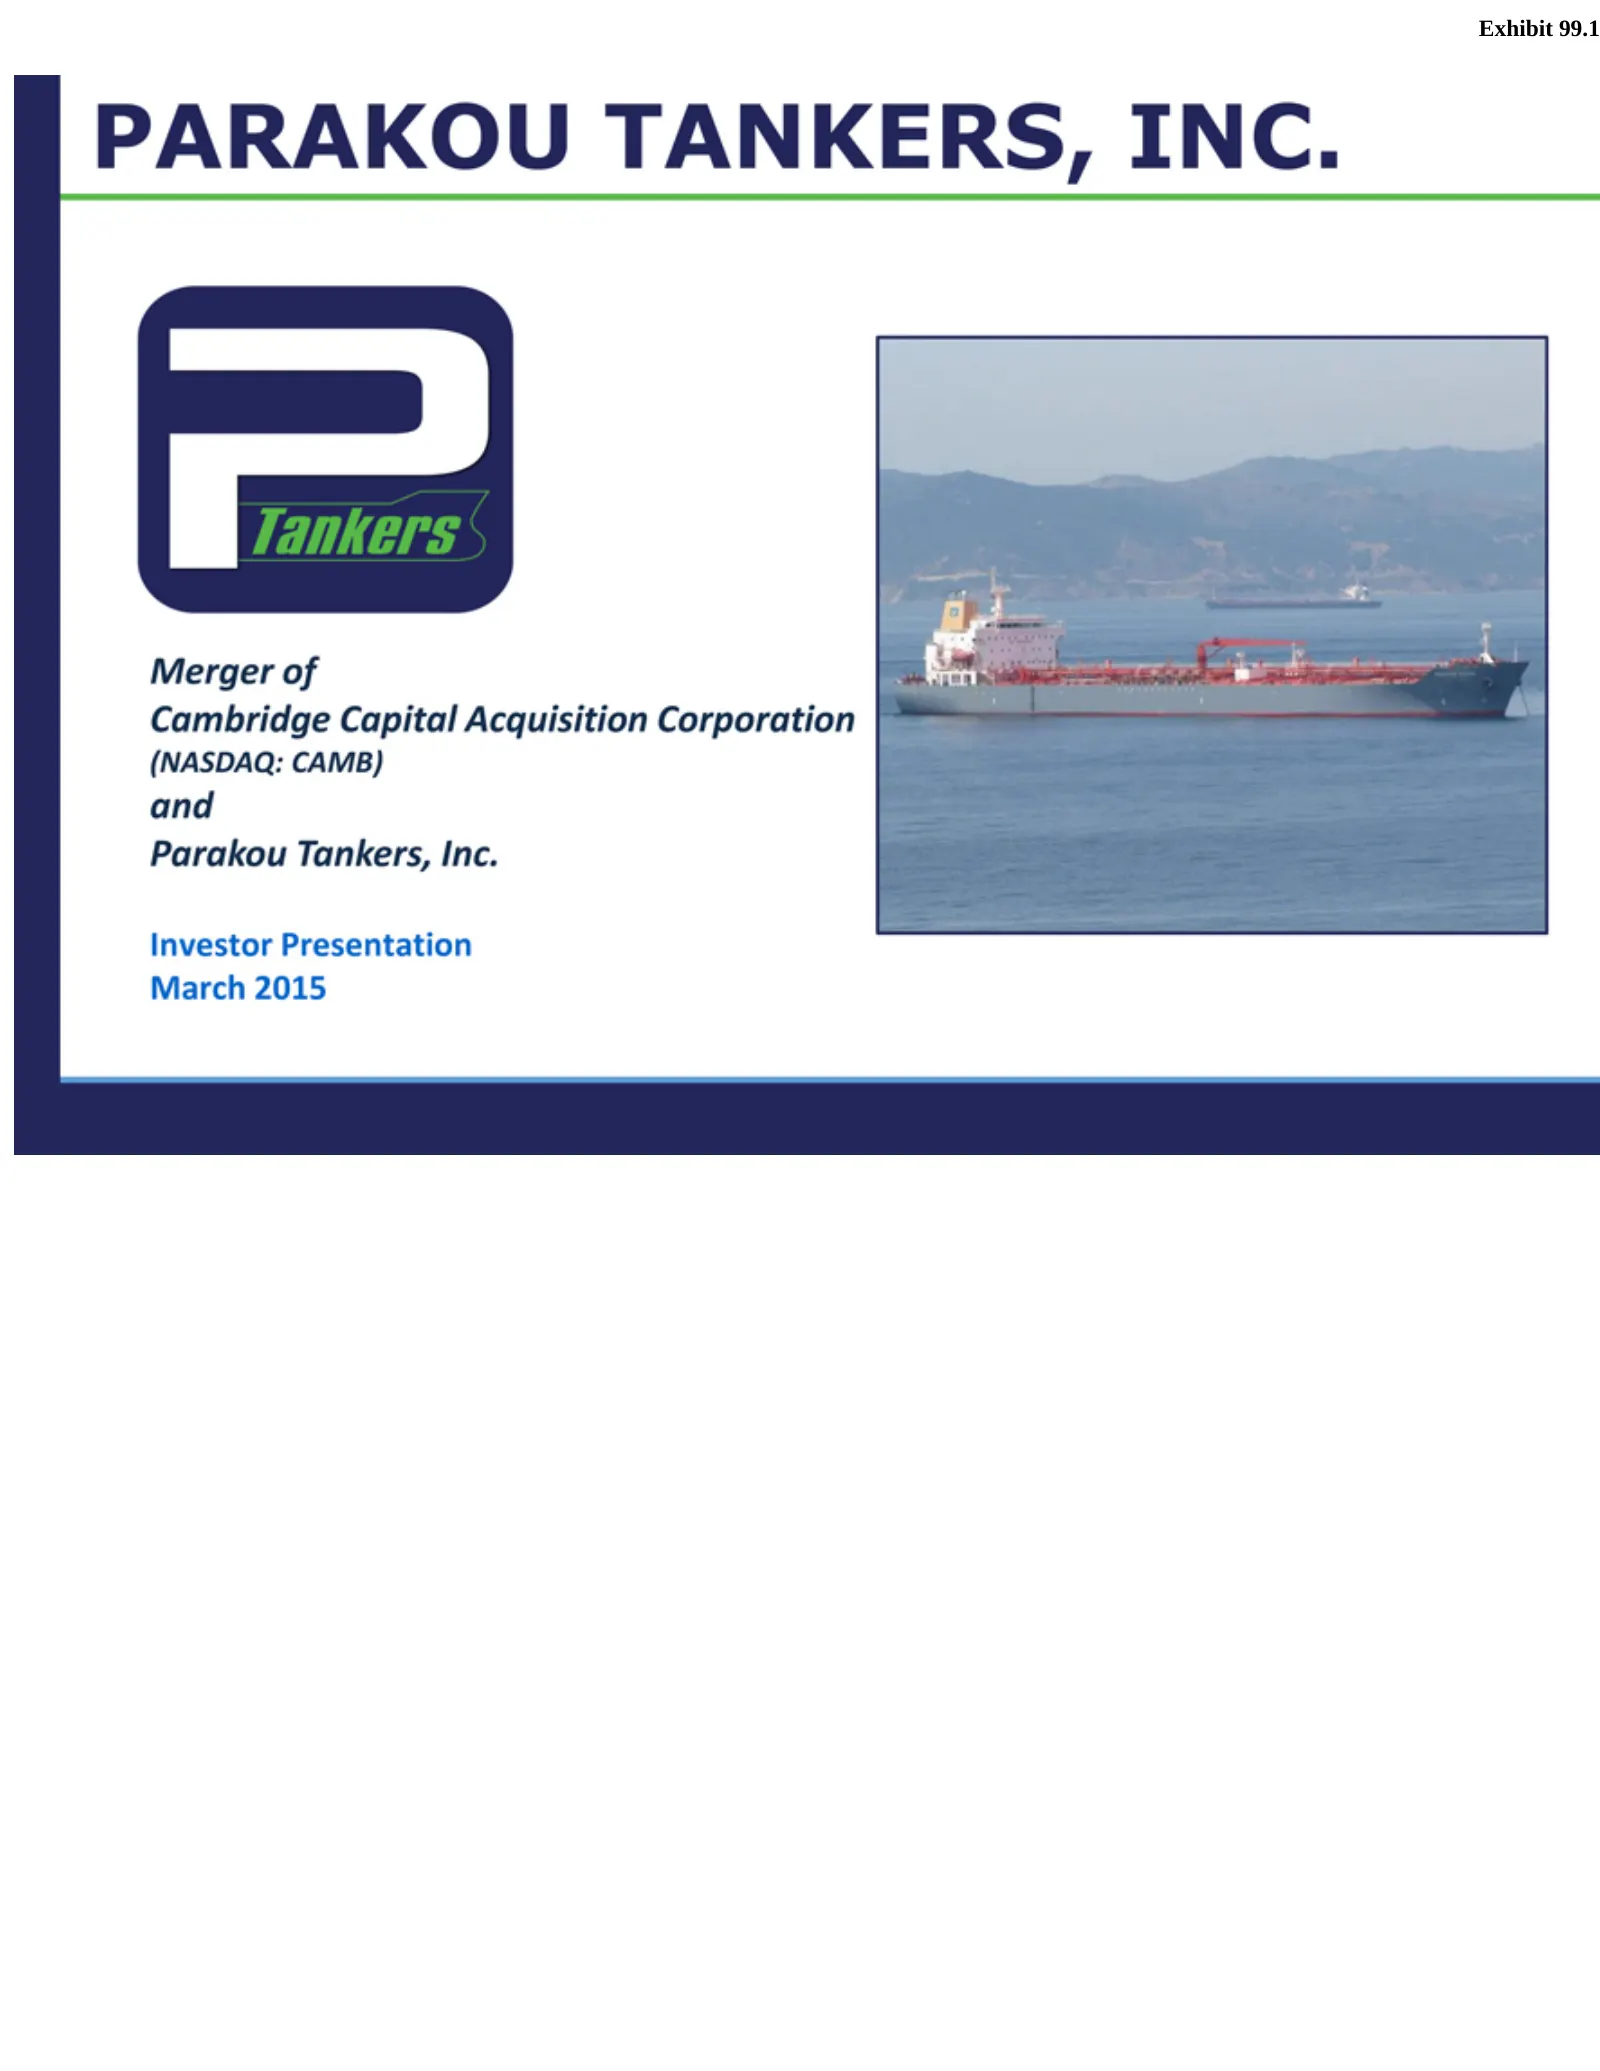
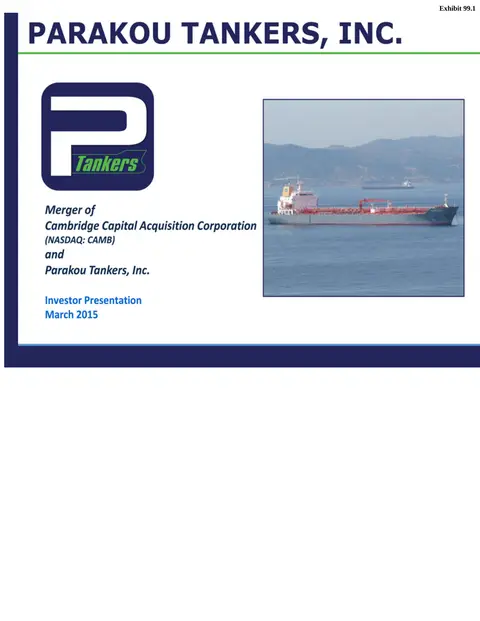
Slide 1: Parakou Tankers, Inc. and Cambridge Capital Acquisition Corporation Merger Investor Presentation
Exhibit 99.1 PARAKOU Merger Cambridge (NASDAQ: Parakou and Investor March 2015 ofTankers, Presentation Capital TANKERS, CAMB) Inc. Acquisition INC. Corporation
Slide 2: Forward-Looking Statements and Additional Information
Preliminary Additional (“Cambridge”) Commission persons summarized Such holdings proxy Stockholders These aParticipants rules can Cambridge Non-Solicitation. respect such be Forward-Looking “expect,” forward-looking not expectations proposed global key and uncertainties Cambridge’s the Readers under
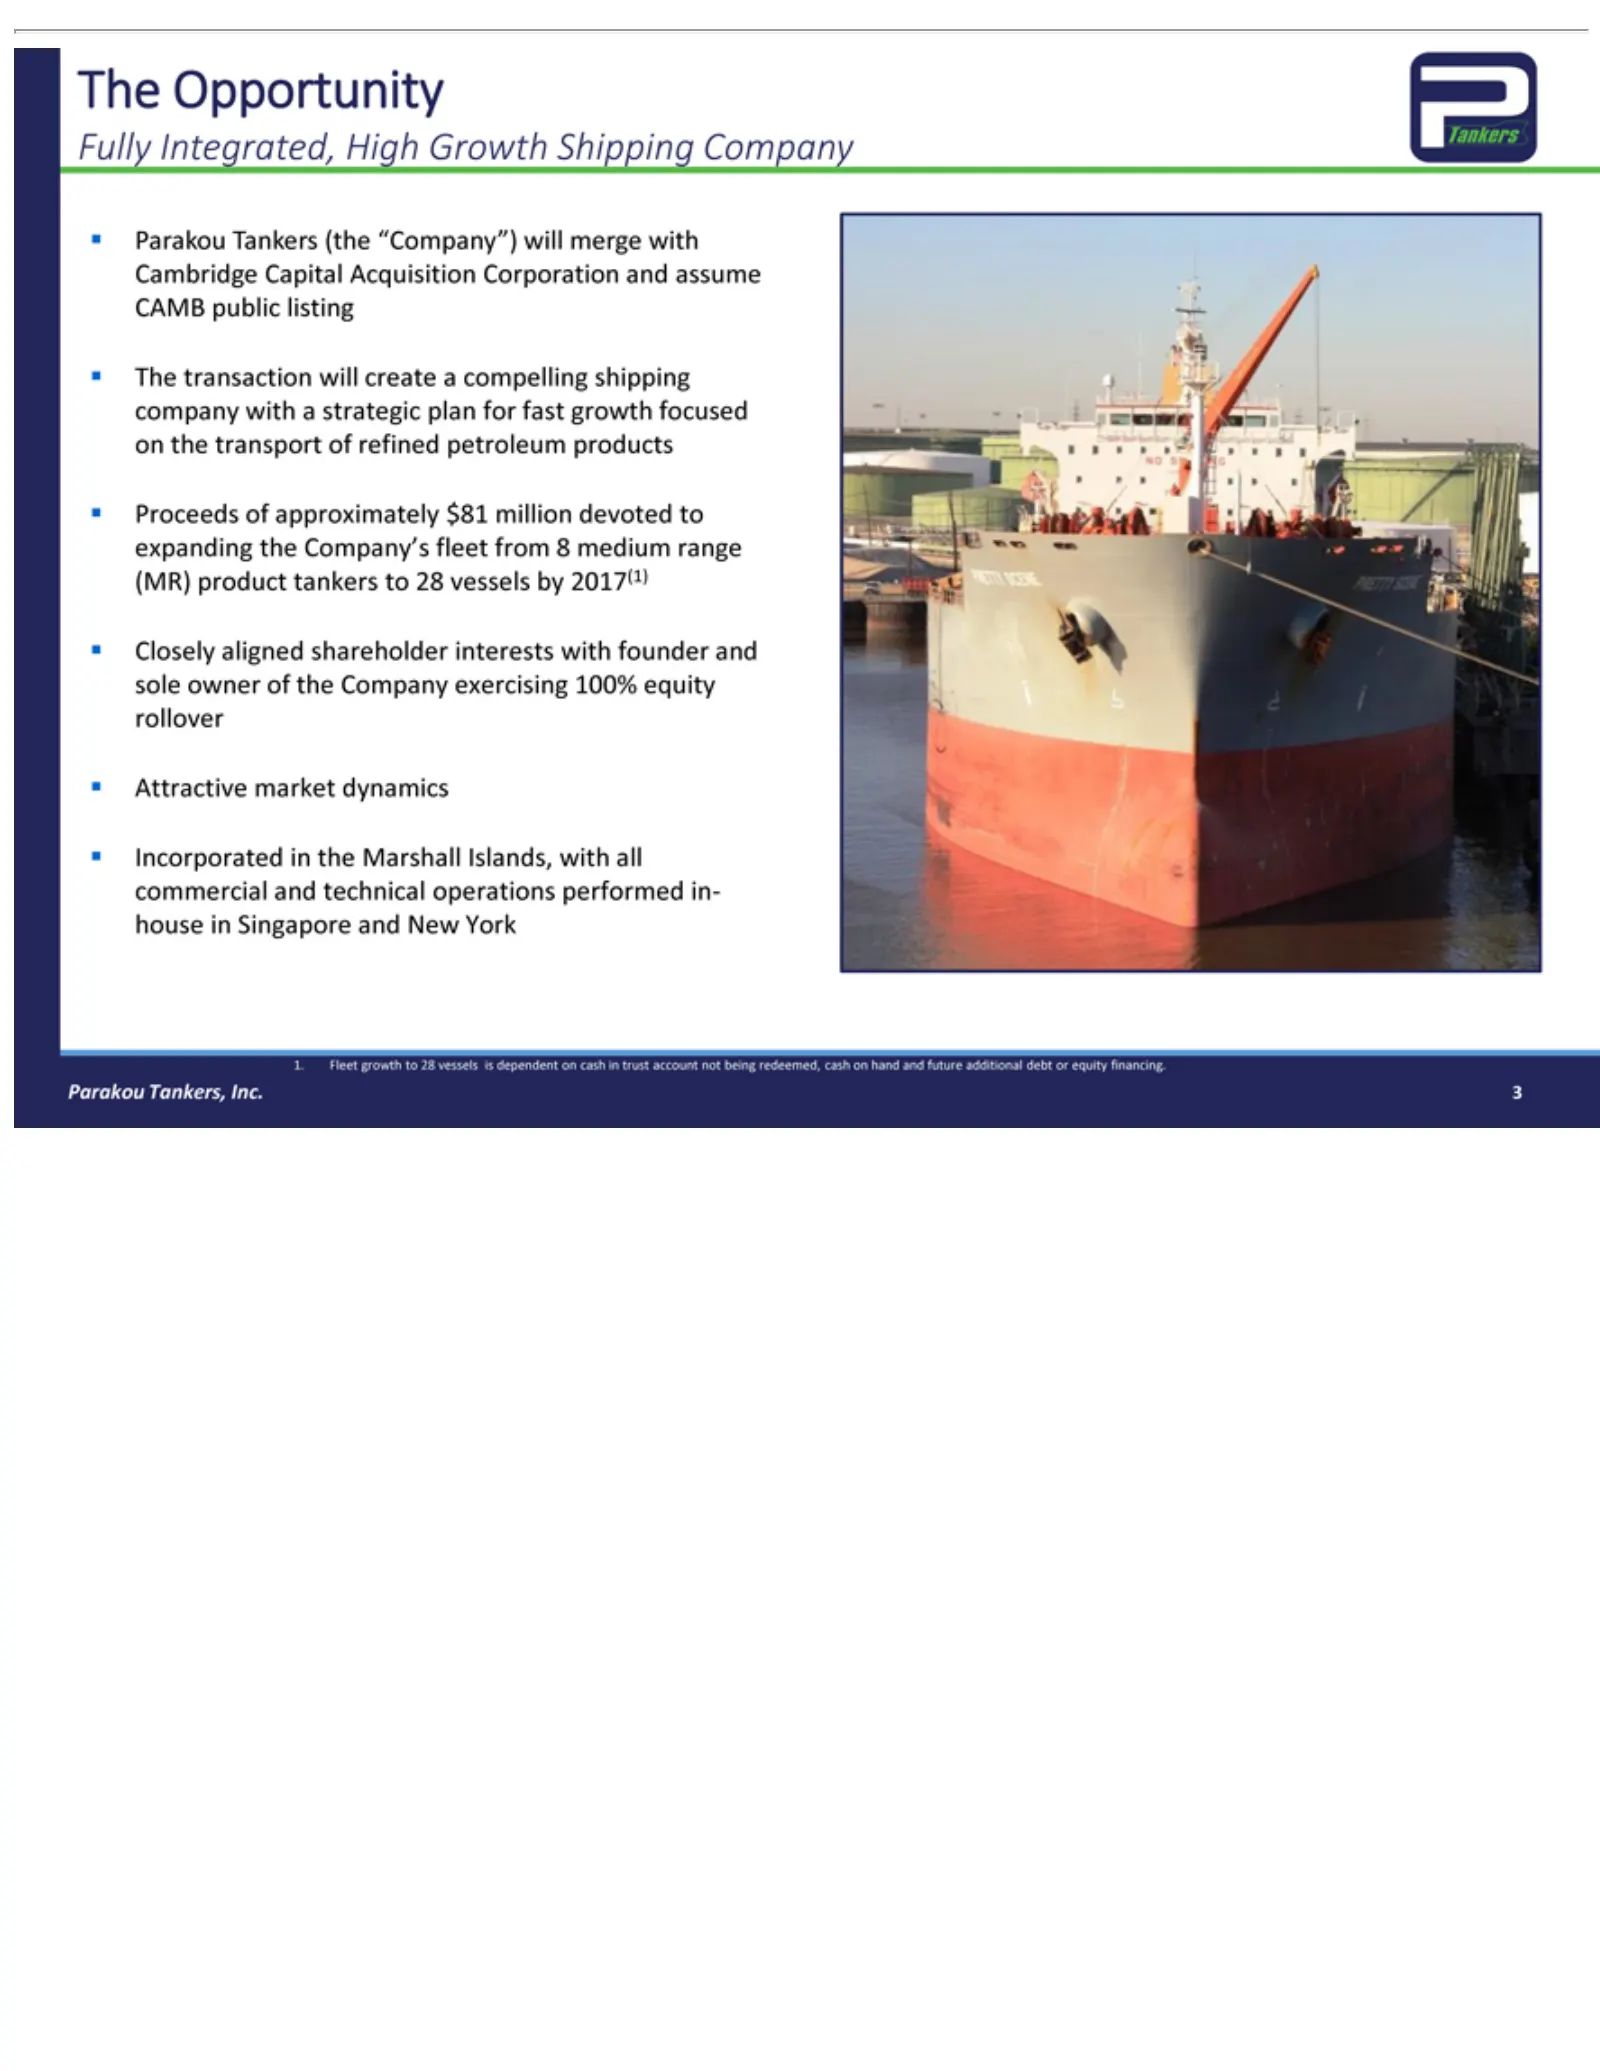
Slide 3: Transaction Overview
Fully Cambridge The Proceeds (MR) Closely Attractive Incorporated 1. 3Parakou Fleet Opportunity transaction Integrated, product growth aligned Tankers Tankers, ofmarket Capital approximately intankers to the will shareholder (the High Inc. dynamics 28 Acquisition Marshall create vessels “Company”) t
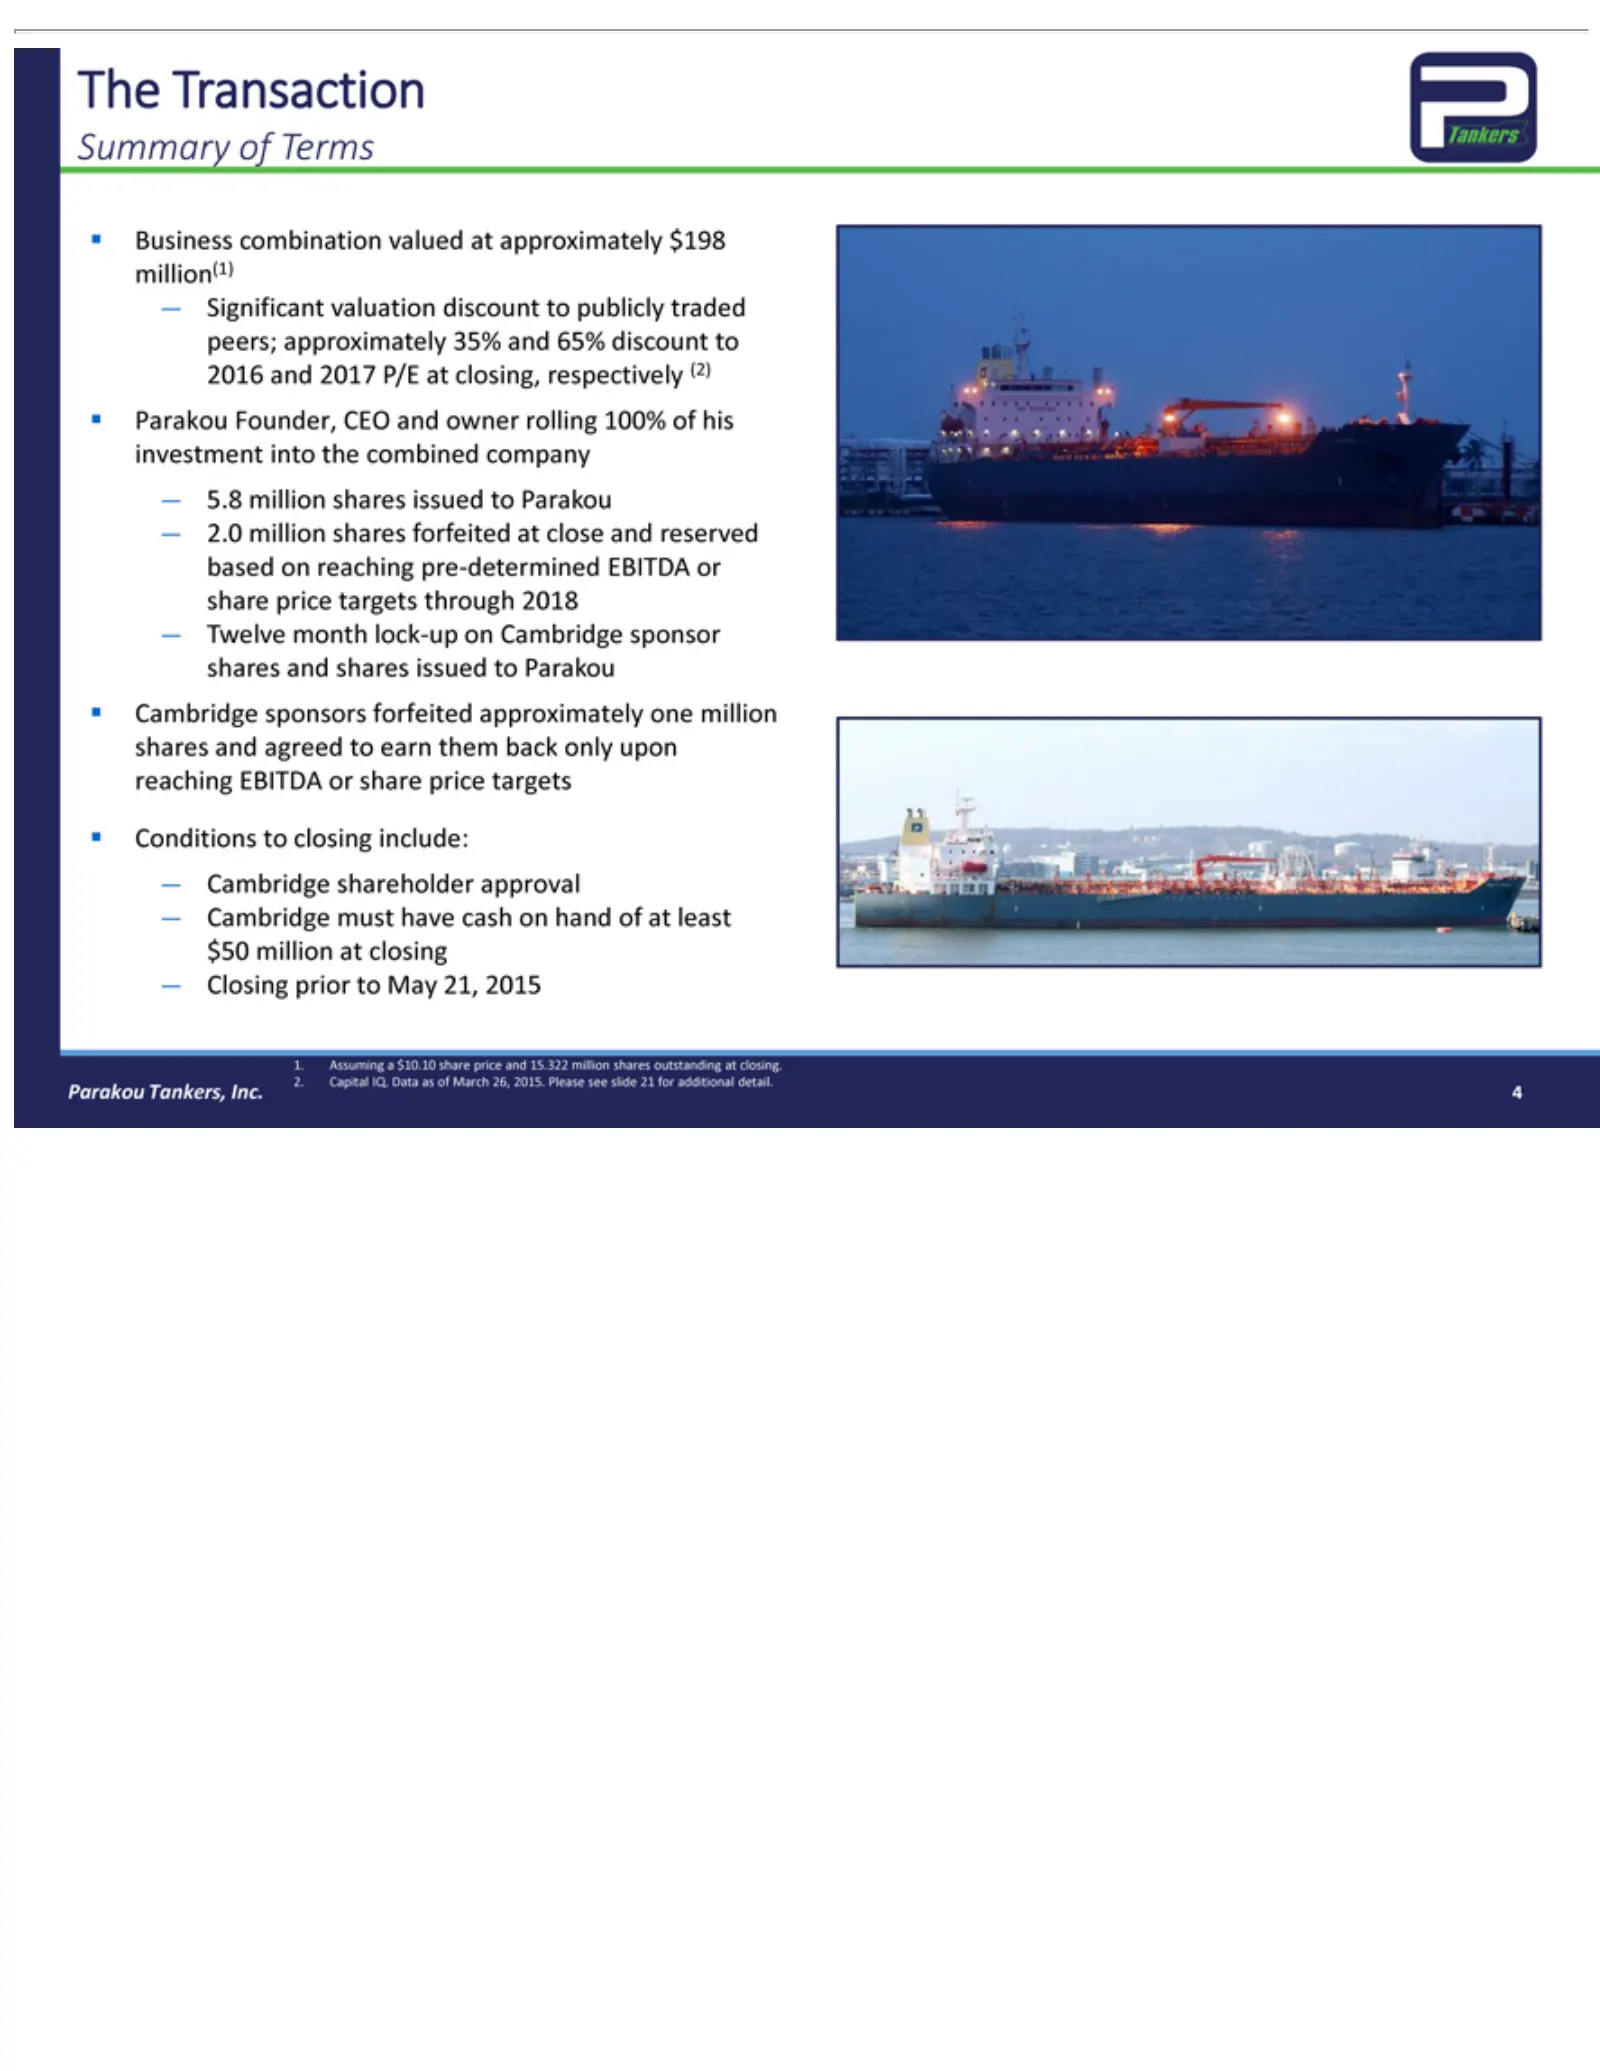
Slide 4: Summary Business Combination Terms
The Summary Business the price Conditions — 1. 2. Parakou Assuming Capital Twelve Significant 5.8 2.0 Cambridge Closing combined Transaction targets million Tankers, combination IQ. of month prior toTerms acompany closing Data valuation shares shareholder must $10.10 toInc. lock-up as May have issue
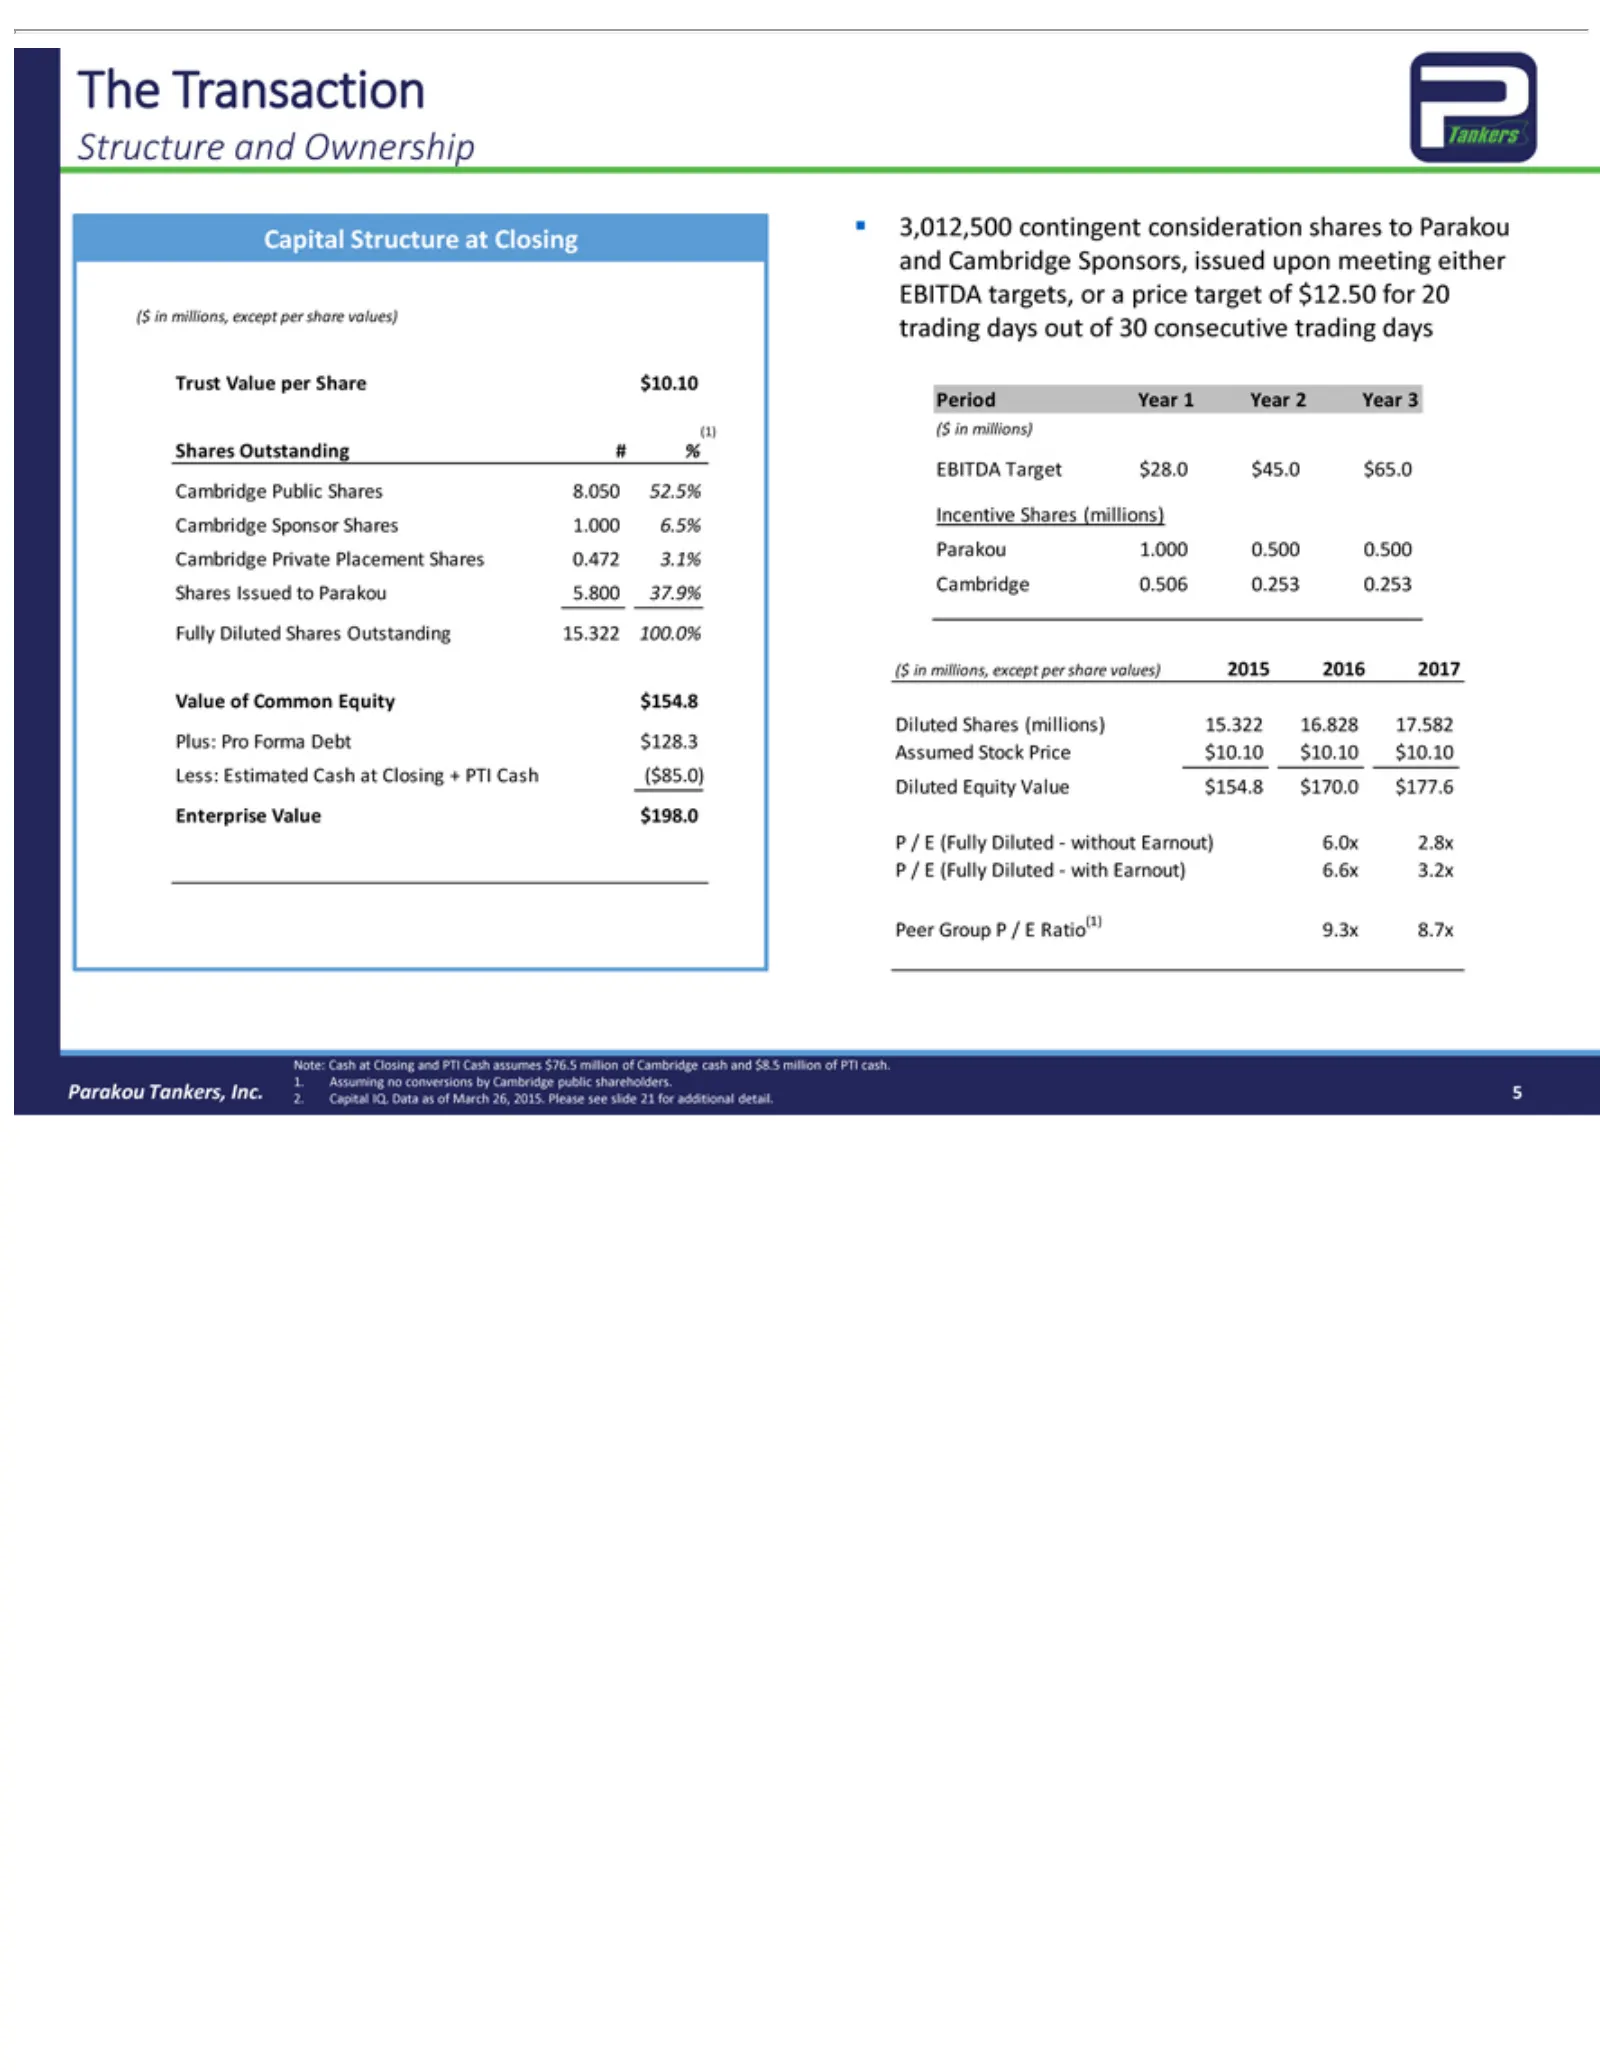
Slide 5: Transaction Structure and Pro Forma Ownership
The Structure Capital Trust (1) Shares Fully Value Plus: Less: Enterprise 3,012,500 and trading Period EBITDA Incentive Cambridge ($ Assumed Diluted P Peer Note: 1. 2. 5Parakou /Assuming Capital in ECambridge Transaction Group millions) millions, (Fully Pro Value Estimated Diluted Cash of Year Outst
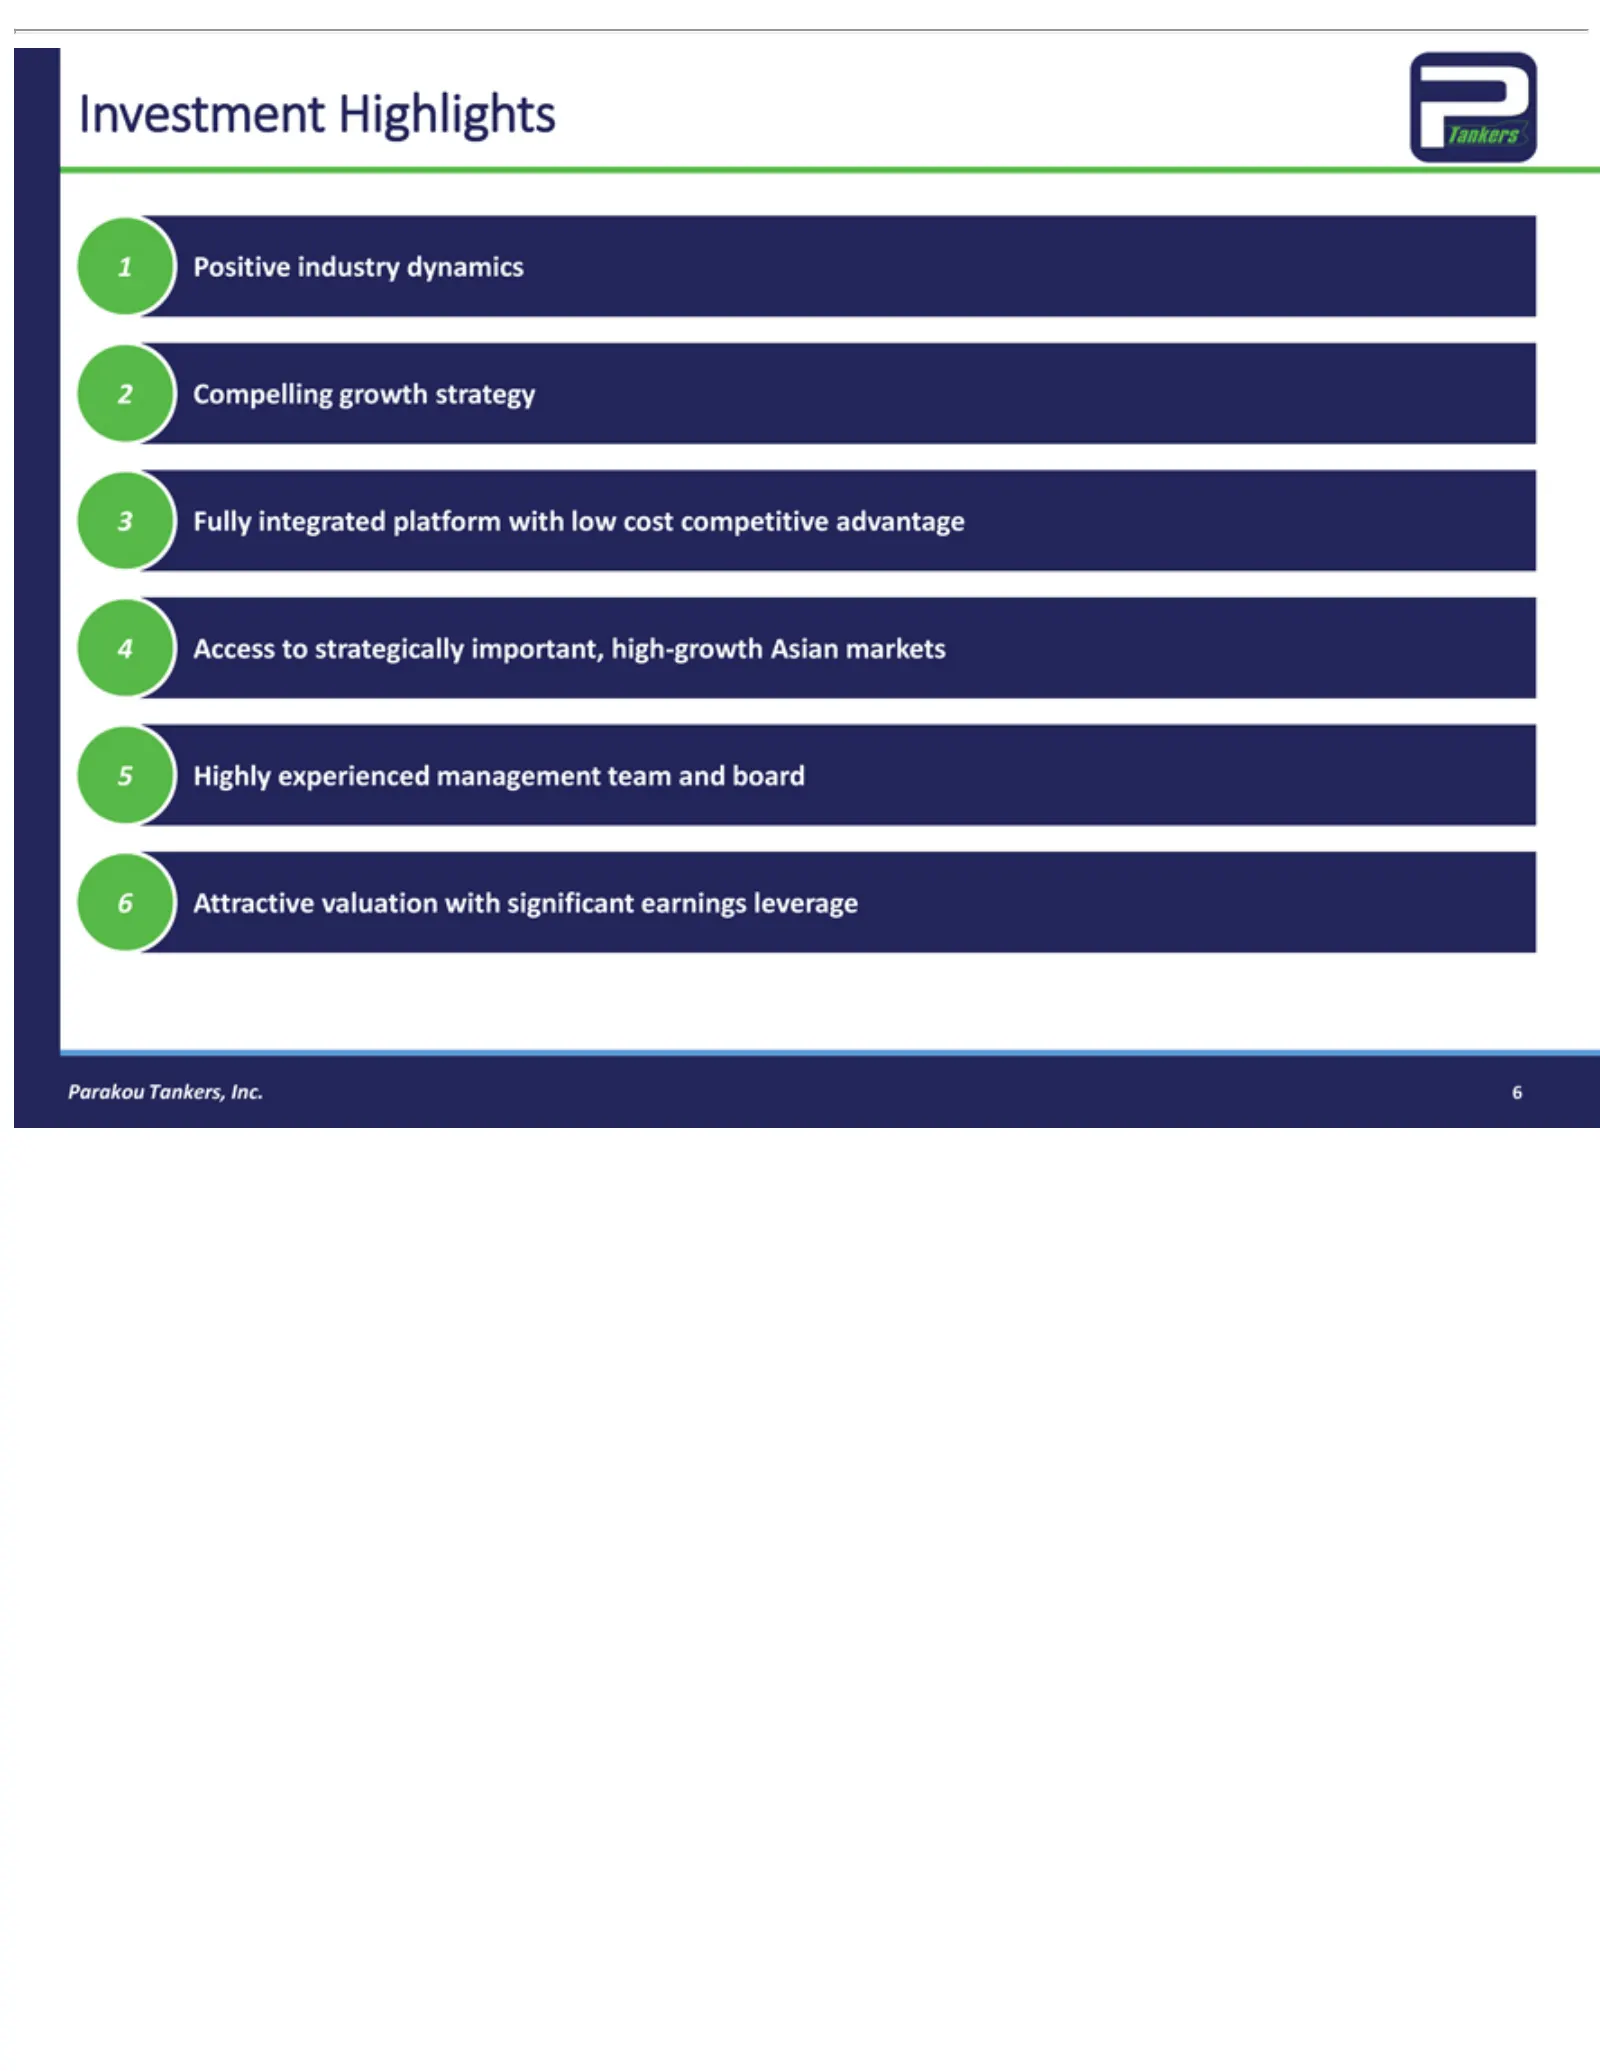
Slide 6: Investment Highlights
54321Investment 6Parakou Access Attractive Positive Compelling Fully Highlyintegrated Tankers, to experienced industry Highlights strategically valuation growth Inc. platform dynamics strategy management with important, significant with lowteam high-growth cost earnings and competitive board leverag
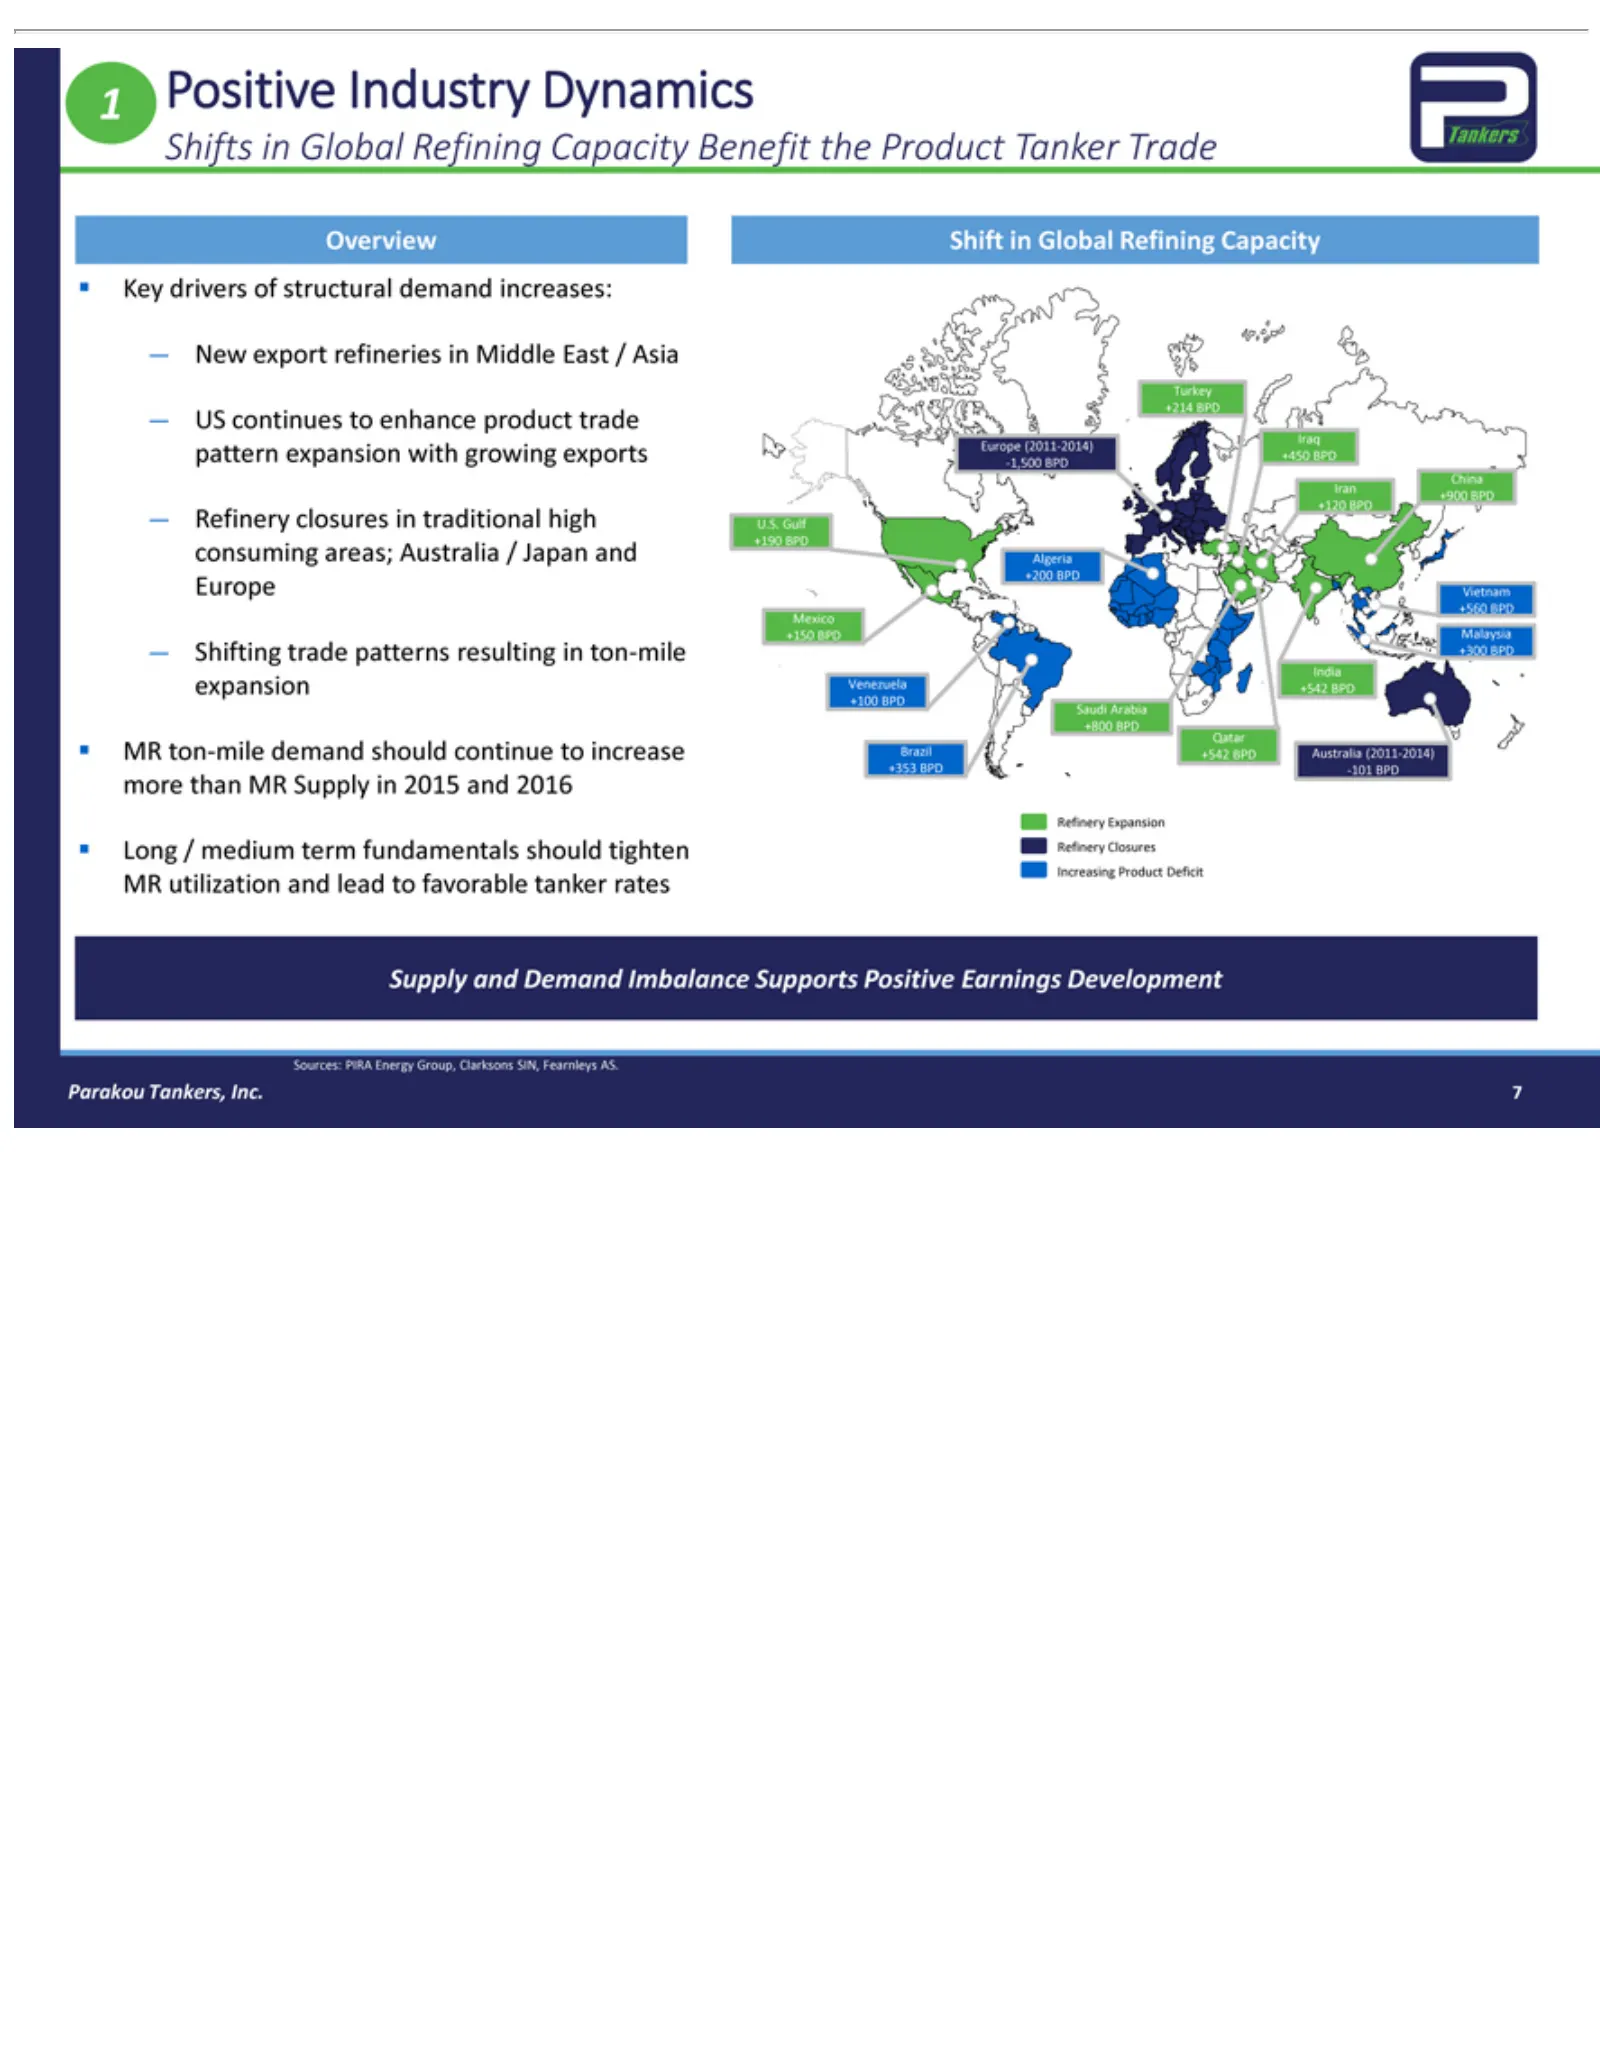
Slide 7: Positive Industry Dynamics: Shifts in Refining and Trade
1 Positive Shifts Overview Key — MR Long +214 Turkey Europe -1,500 Iran China +120 U.S. +190 +200 Algeria +560 Vietnam +150 Mexico +300 Venezuela India +100 Saudi +800 Brazil Qatar +353 Refinery Increasing Supply Sources: 7Parakou New US Refinery Shifting ton-mile +900 drivers Gulf BPD /Arabia in +5
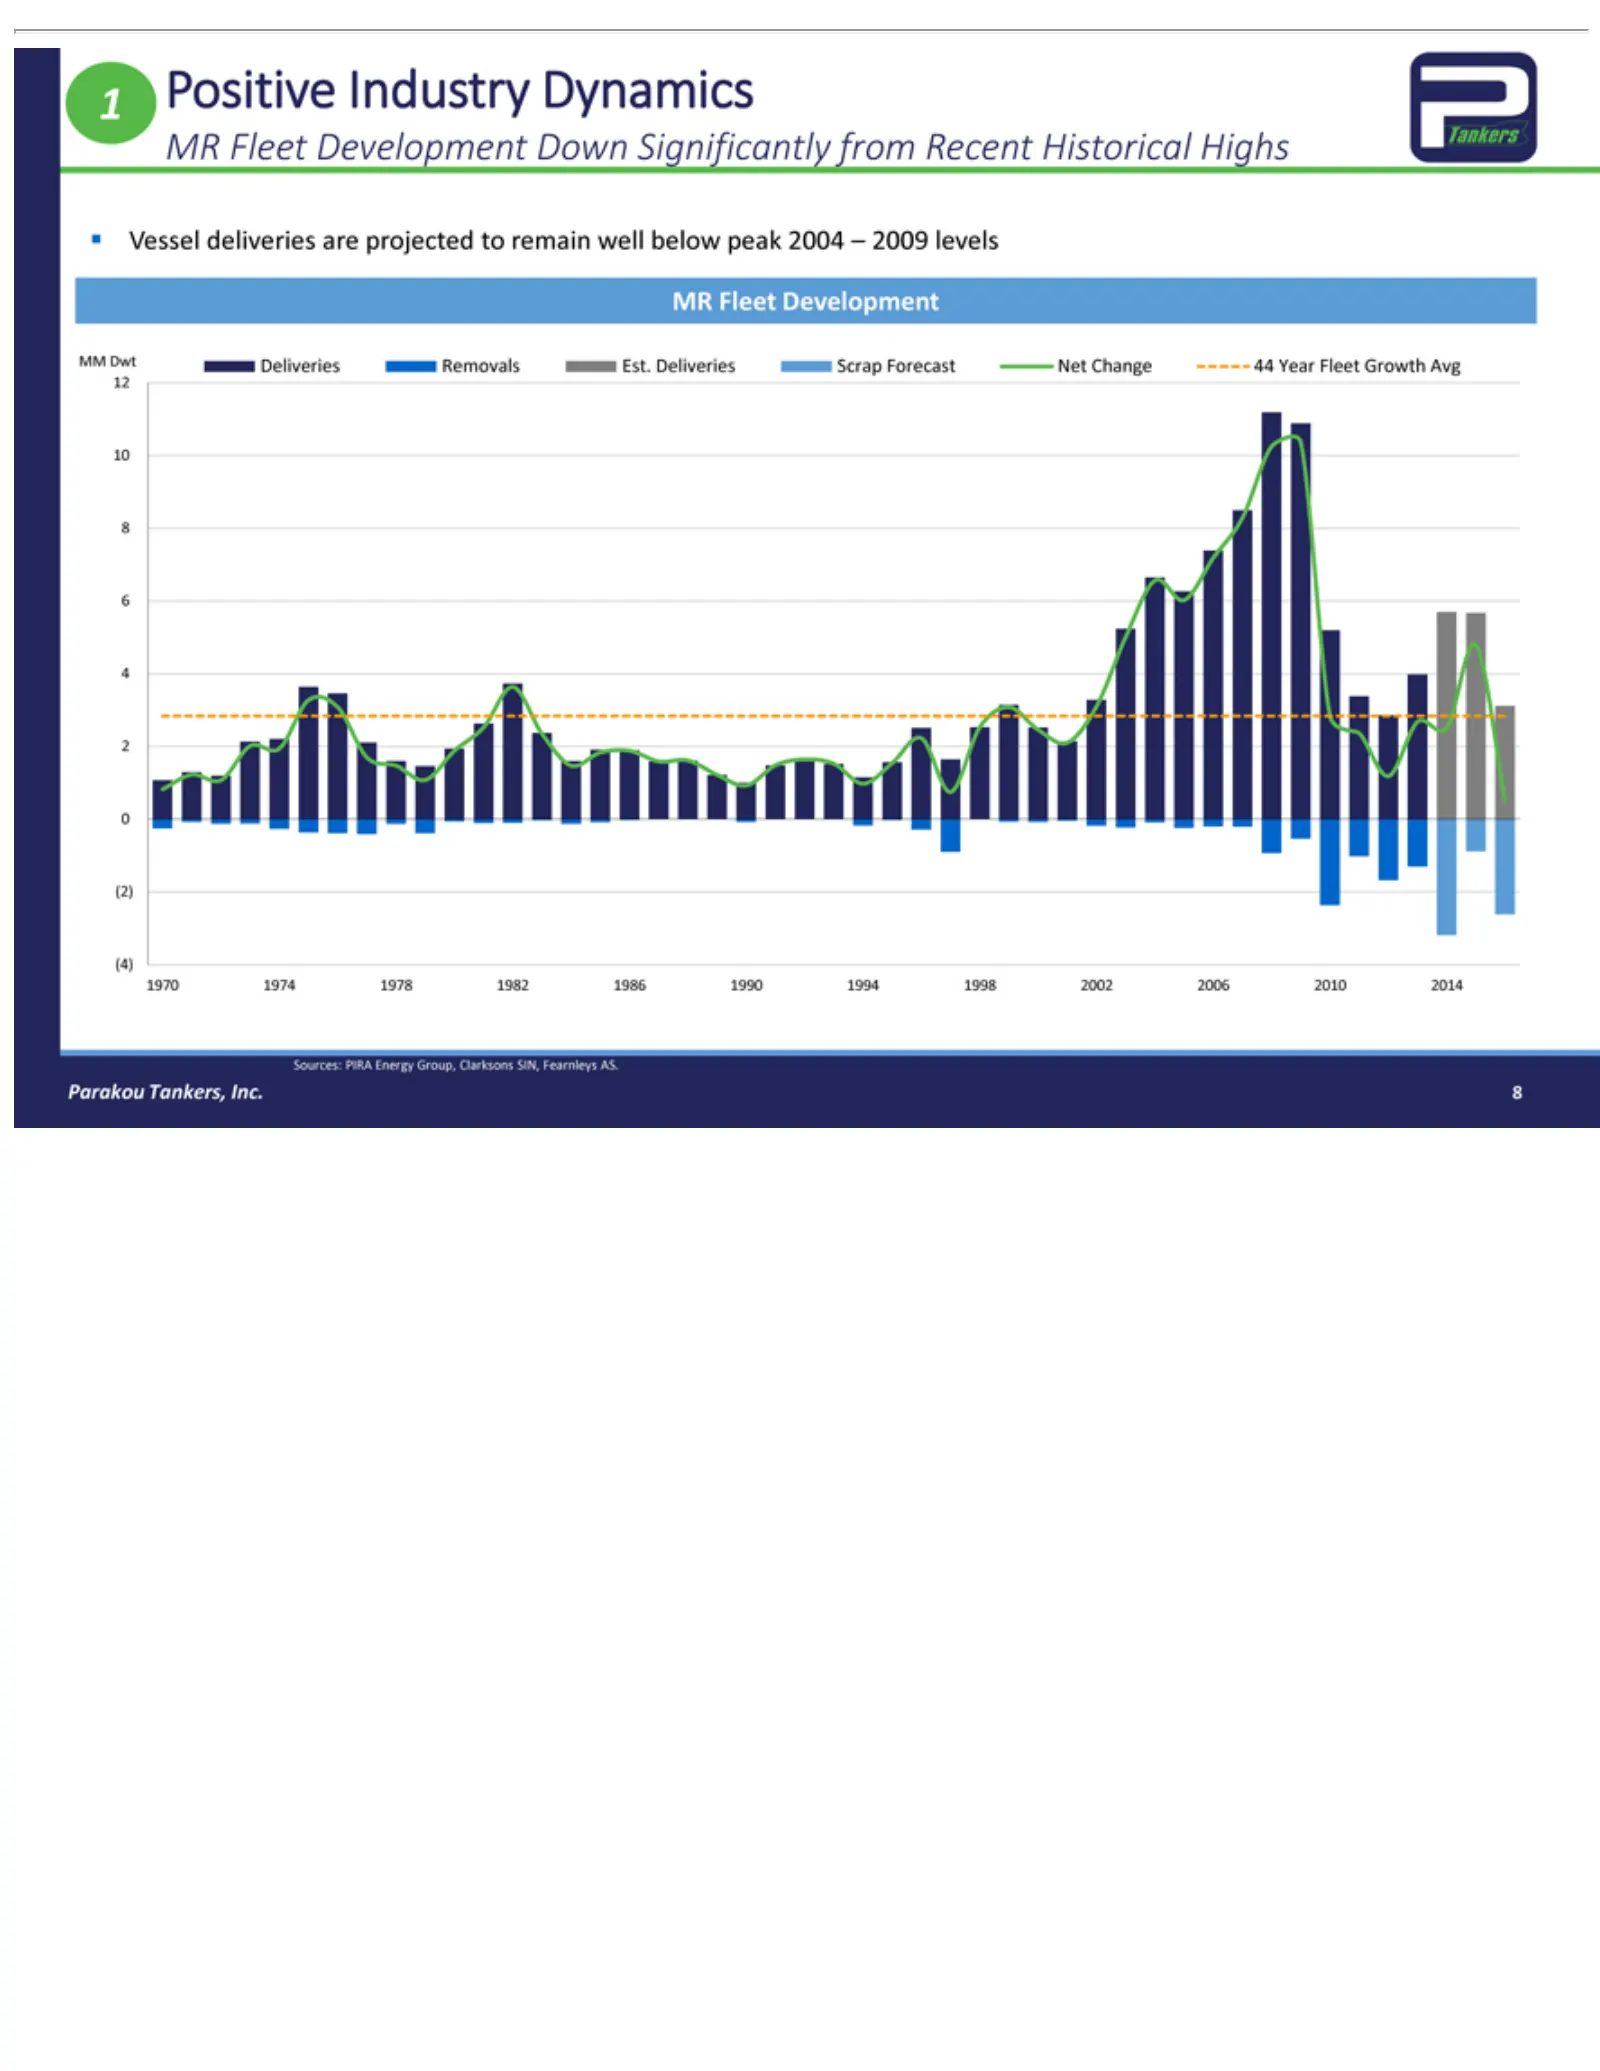
Slide 8: Positive Industry Dynamics: MR Vessel Deliveries
12)Positive Vessel MR 6420(MM 10 12 1970 (4) Sources: 8Parakou Fleet Dwt 1974 deliveries Tankers, PIRA Deliveries Development Industry 1978Energy 1982 are Inc. Dynamics Removals projected 1986 Group, Down 1990 Clarksons to Significantly Est. remain 1994 Deliveries 1998 well SIN, from 2002 below Fear
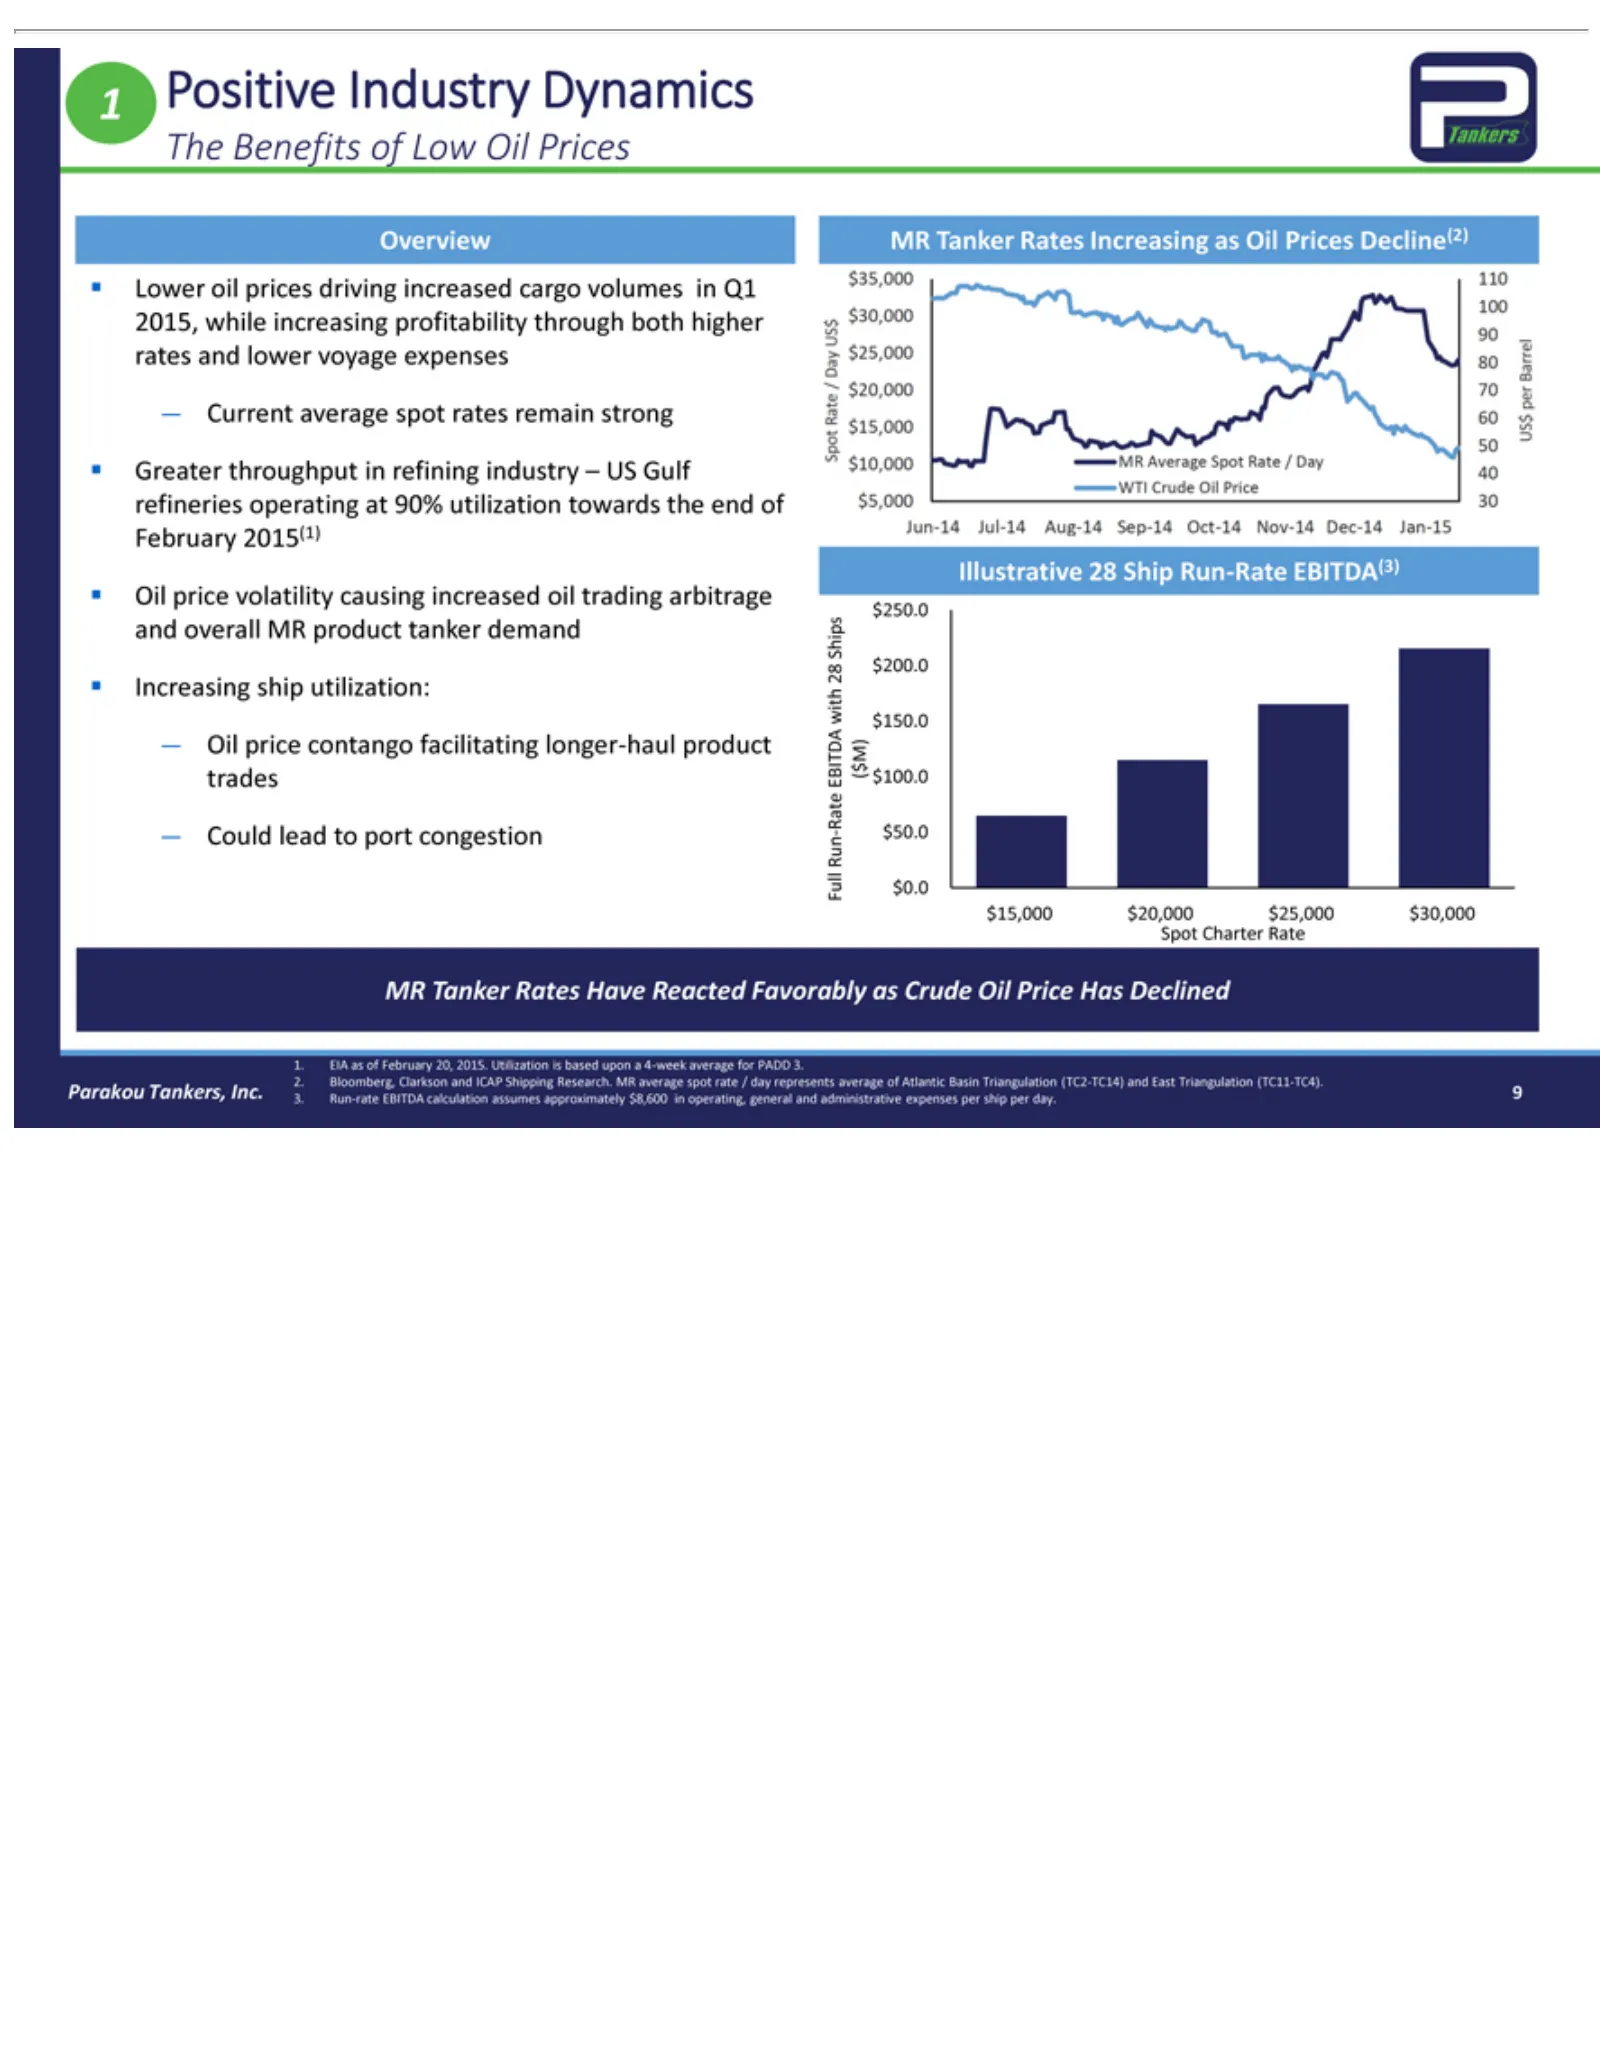
Slide 9: Positive Industry Dynamics: Lower Oil Prices
1 BITDA( The Overview Lower Greater Oil Increasing — Illustrative 28 Ships $250.0 with $E M) Full Run —$50.0 Rate $15,000 Spot Favorably 1. 2. 93. Positive EIA Bloomberg, Run-rate Current Oil Could $200.0 price Benefits $0.0 $150.0 Charter price oil asthroughput $20,000 volatility of lead prices MR
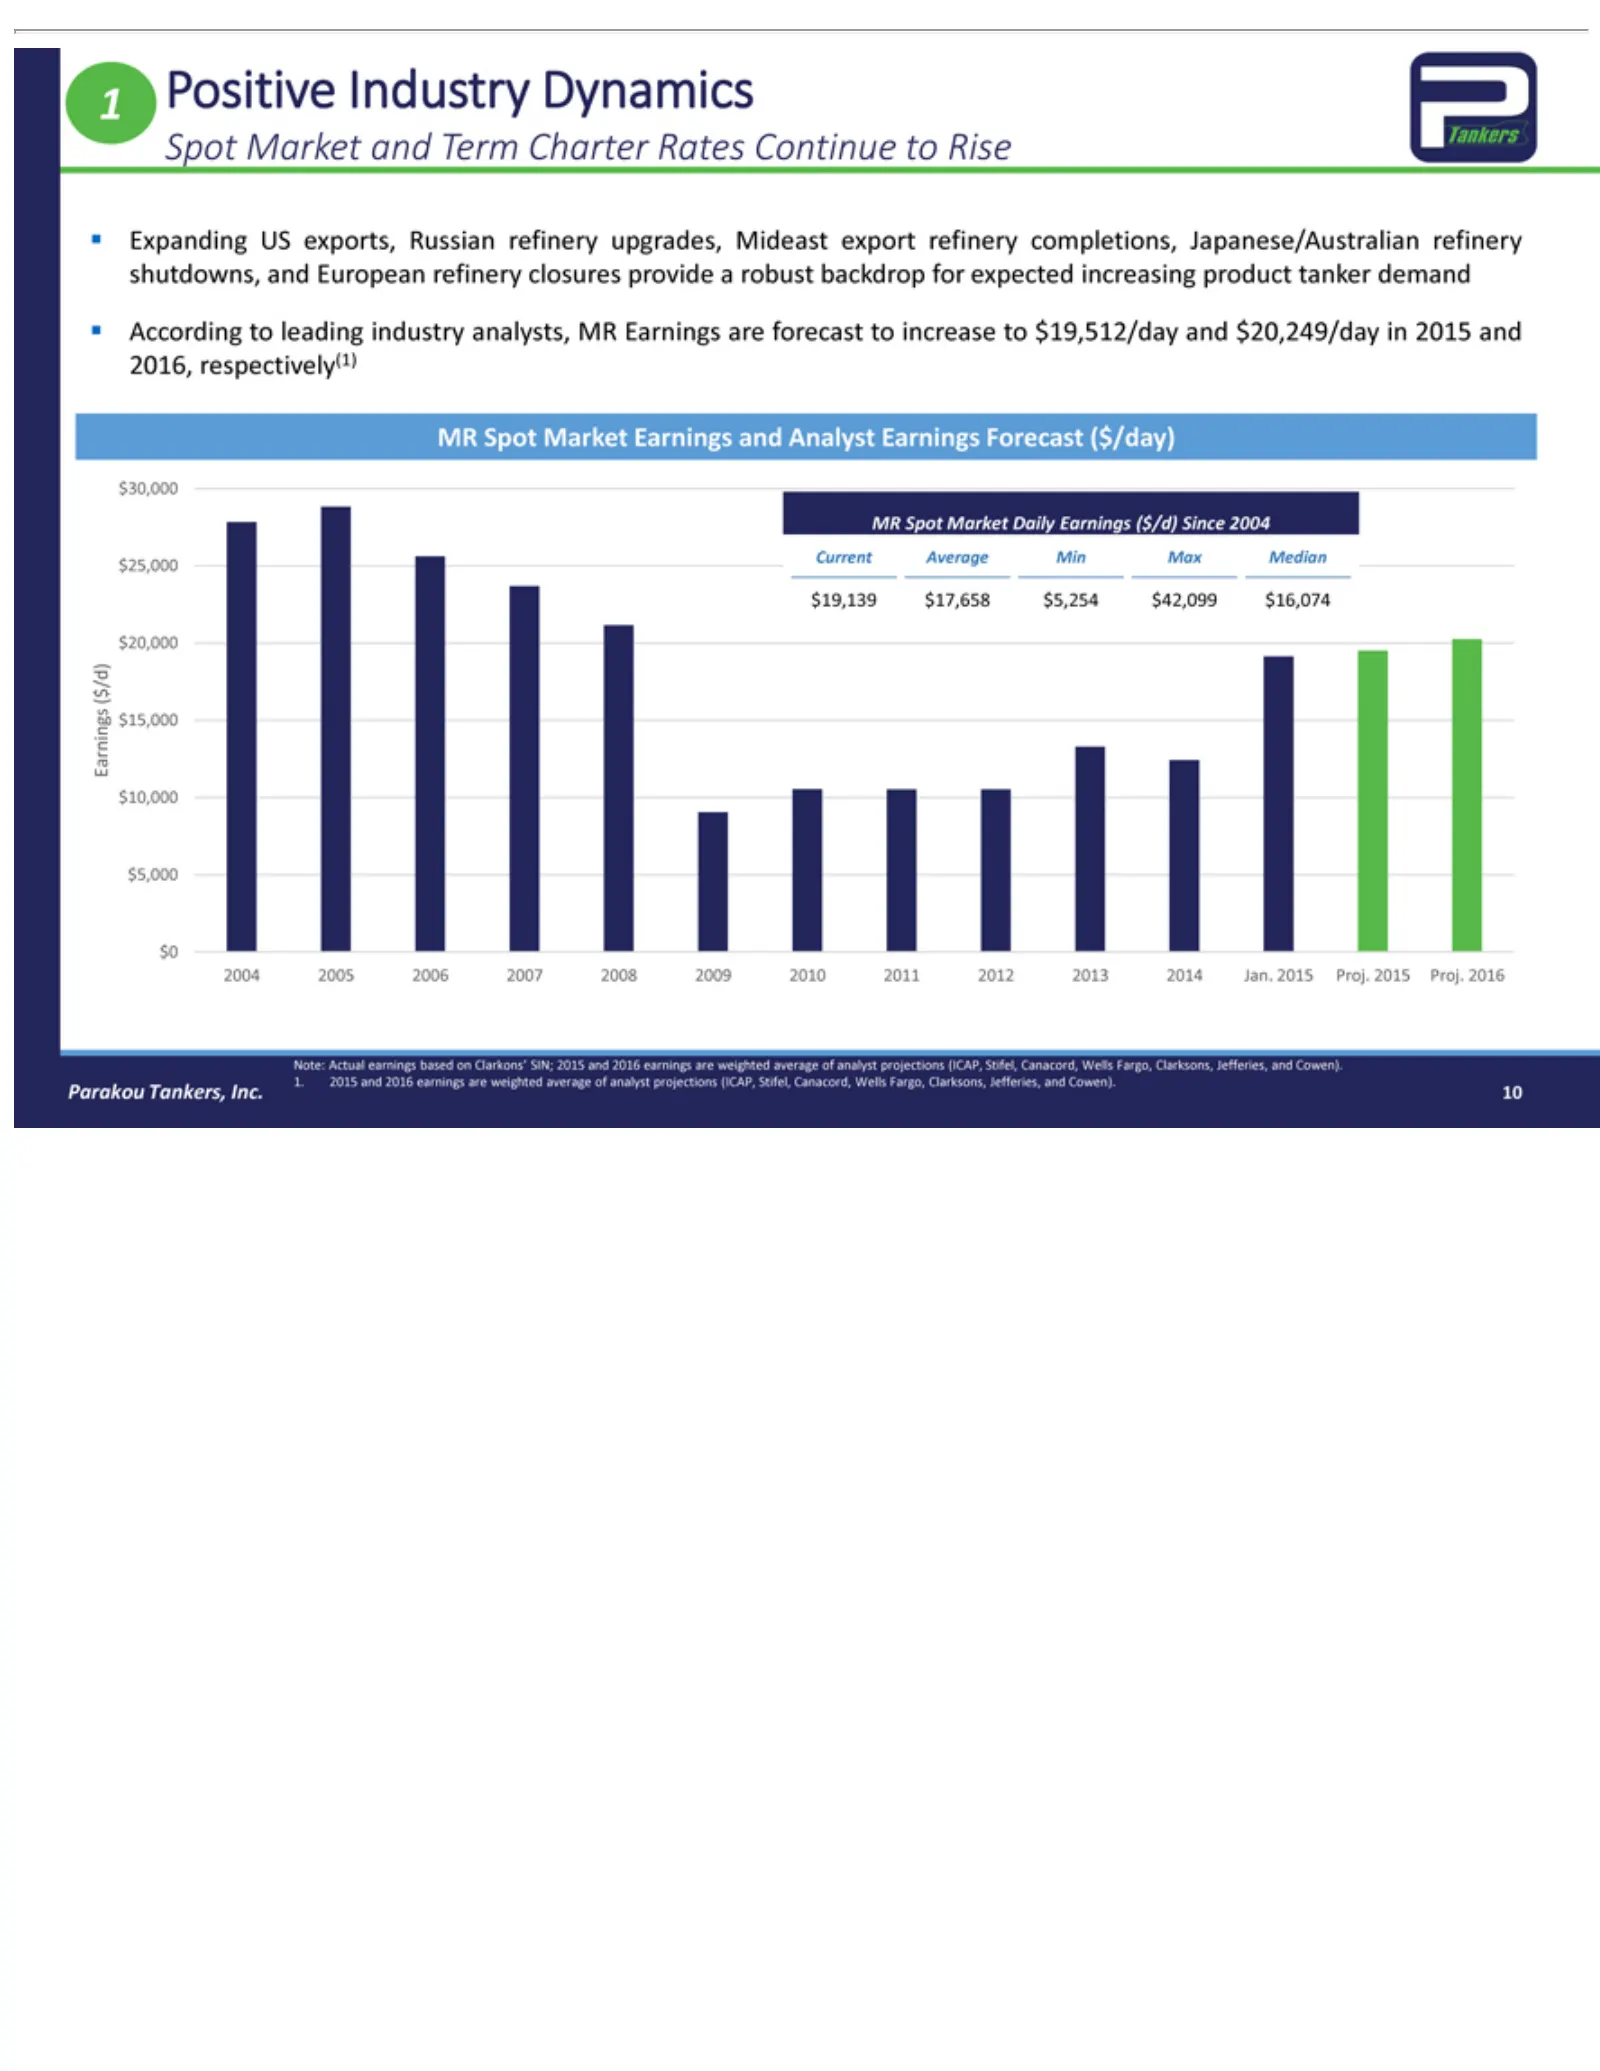
Slide 10: Positive Industry Dynamics: Spot Market Earnings
115,000 Spot Expanding product According MR $30,000 $25,000 $($19,139 /d) $20,000 2004 $0 $5,000 $10,000 Earnings Note: 1. Parakou 10 Positive 2015 Spot Market 2005 Actual and tanker Current $17,658 Tankers, Market Industry to 2006 US 2016 and earnings leading demand exports, Average 2007 Term $5,25
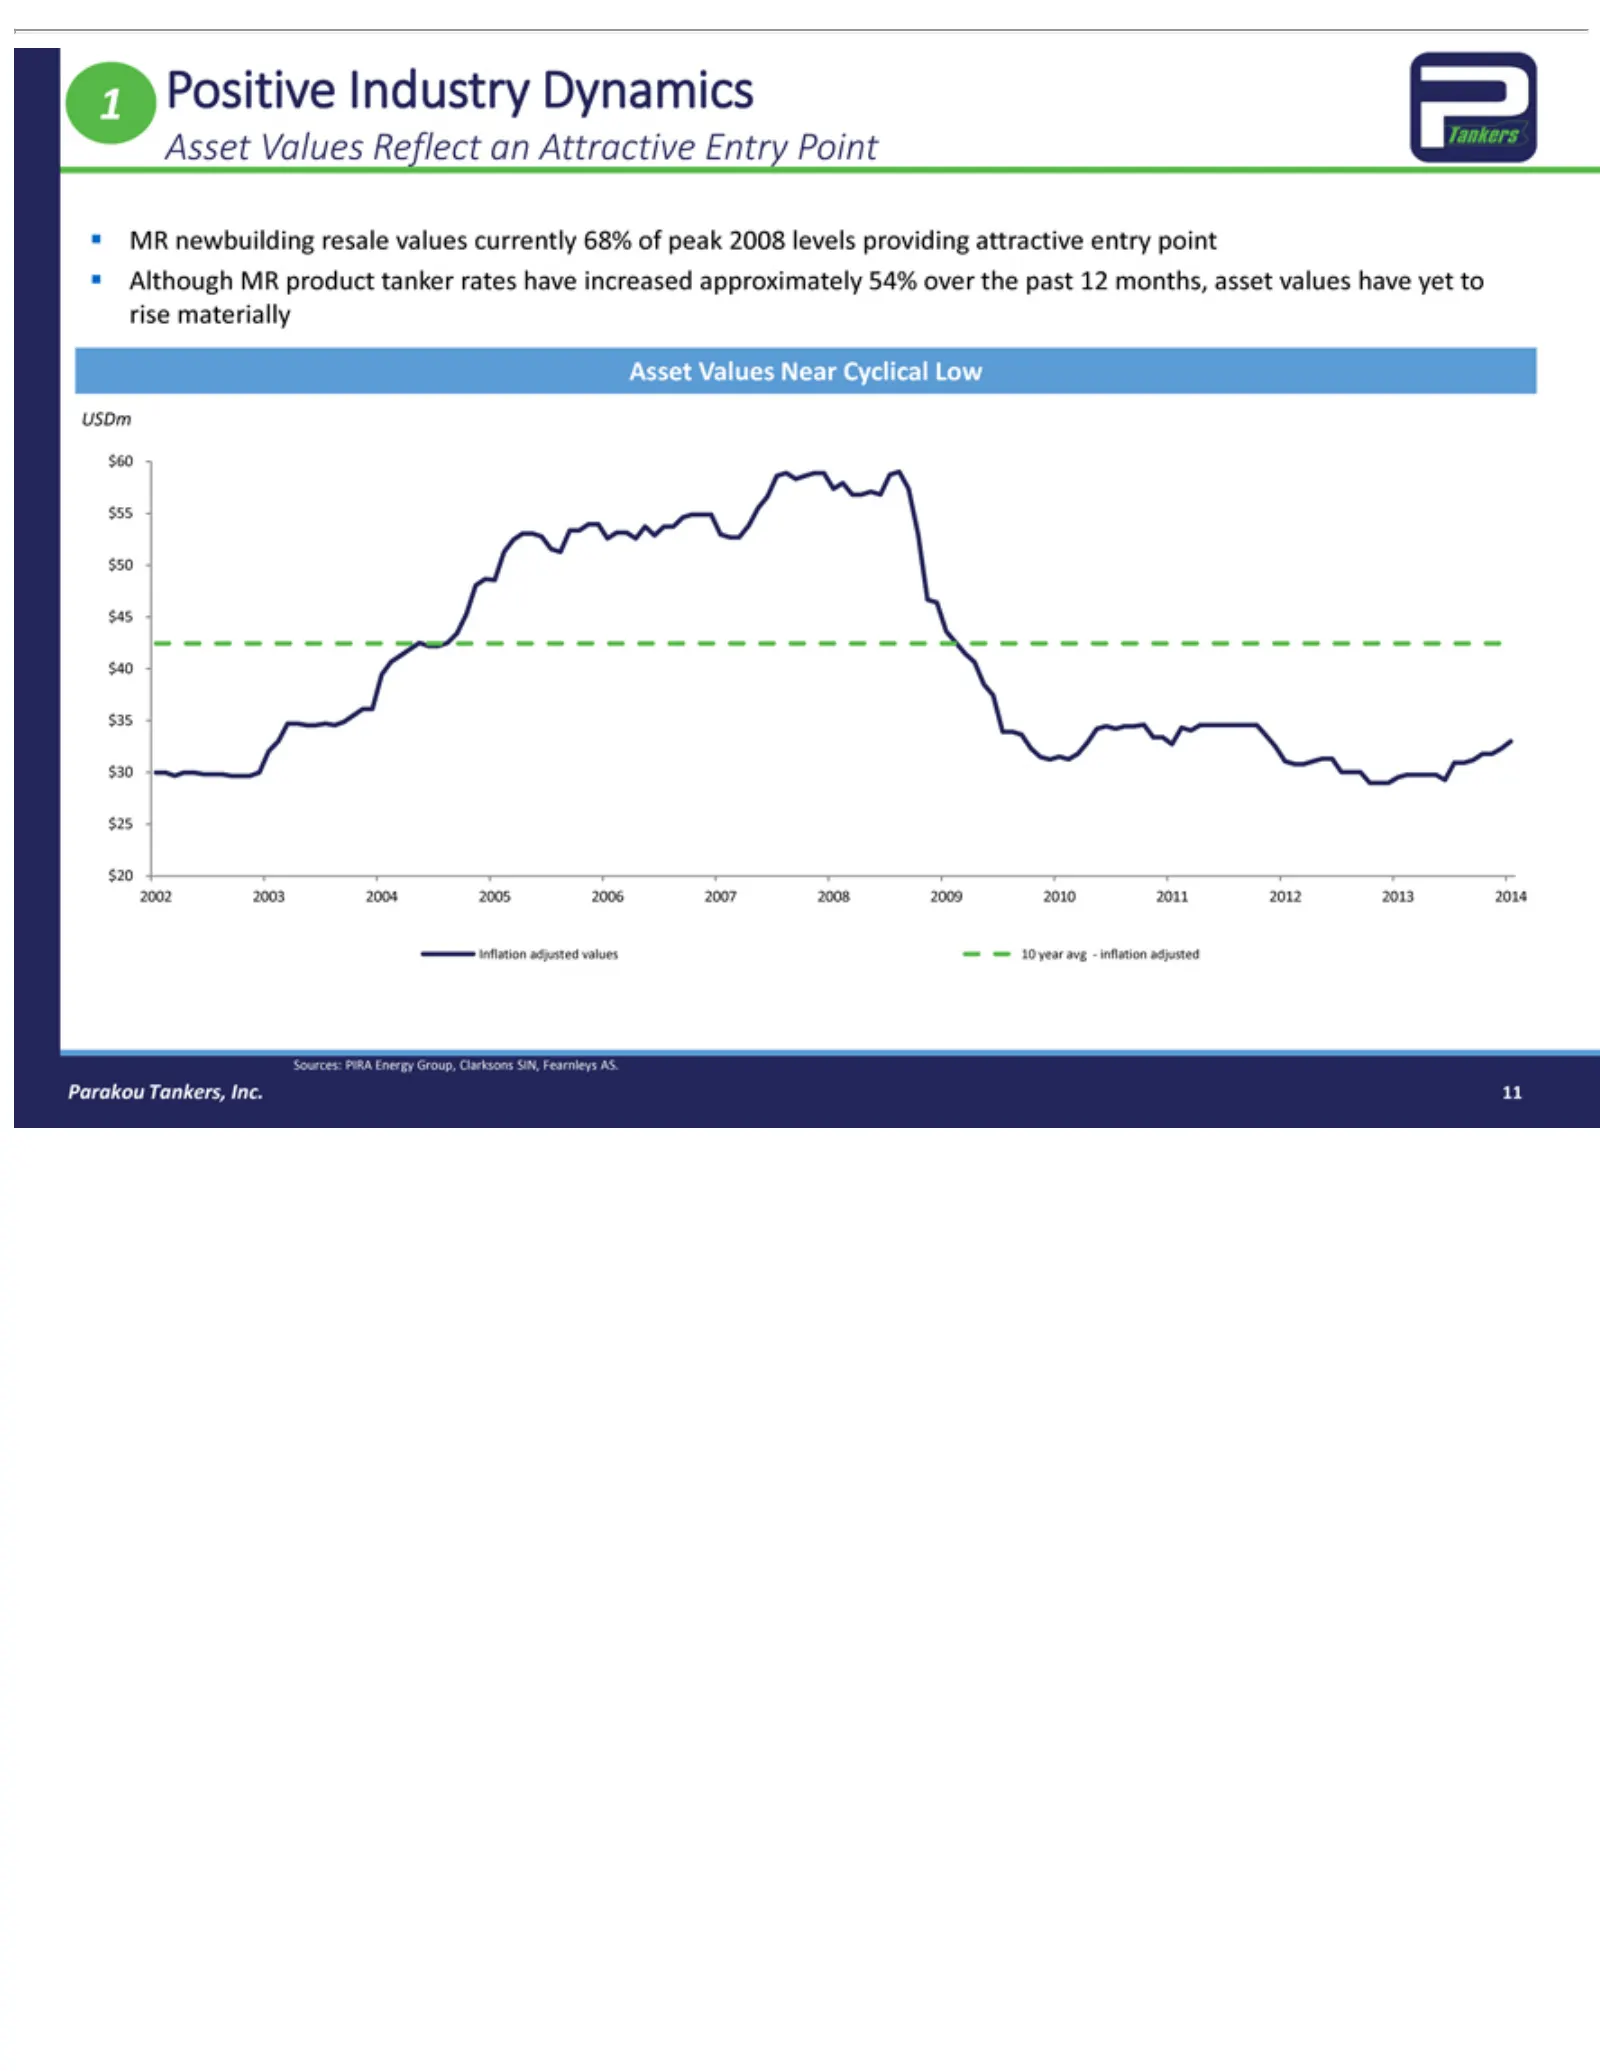
Slide 11: MR Asset Values: Attractive Entry Point
1 20 MR Although Asset $USDm 2002 Inflation Sources: Parakou 11Positive 60 55 50 45 40 35 30 25 newbuilding 2003 Values Tankers, adjusted PIRA MR Industry 2004 Reflect Near product Energy 2005 resale Inc. values Cyclical Dynamics an2006 tanker Group, values Attractive 10 Low 2007 year rates Clarkson
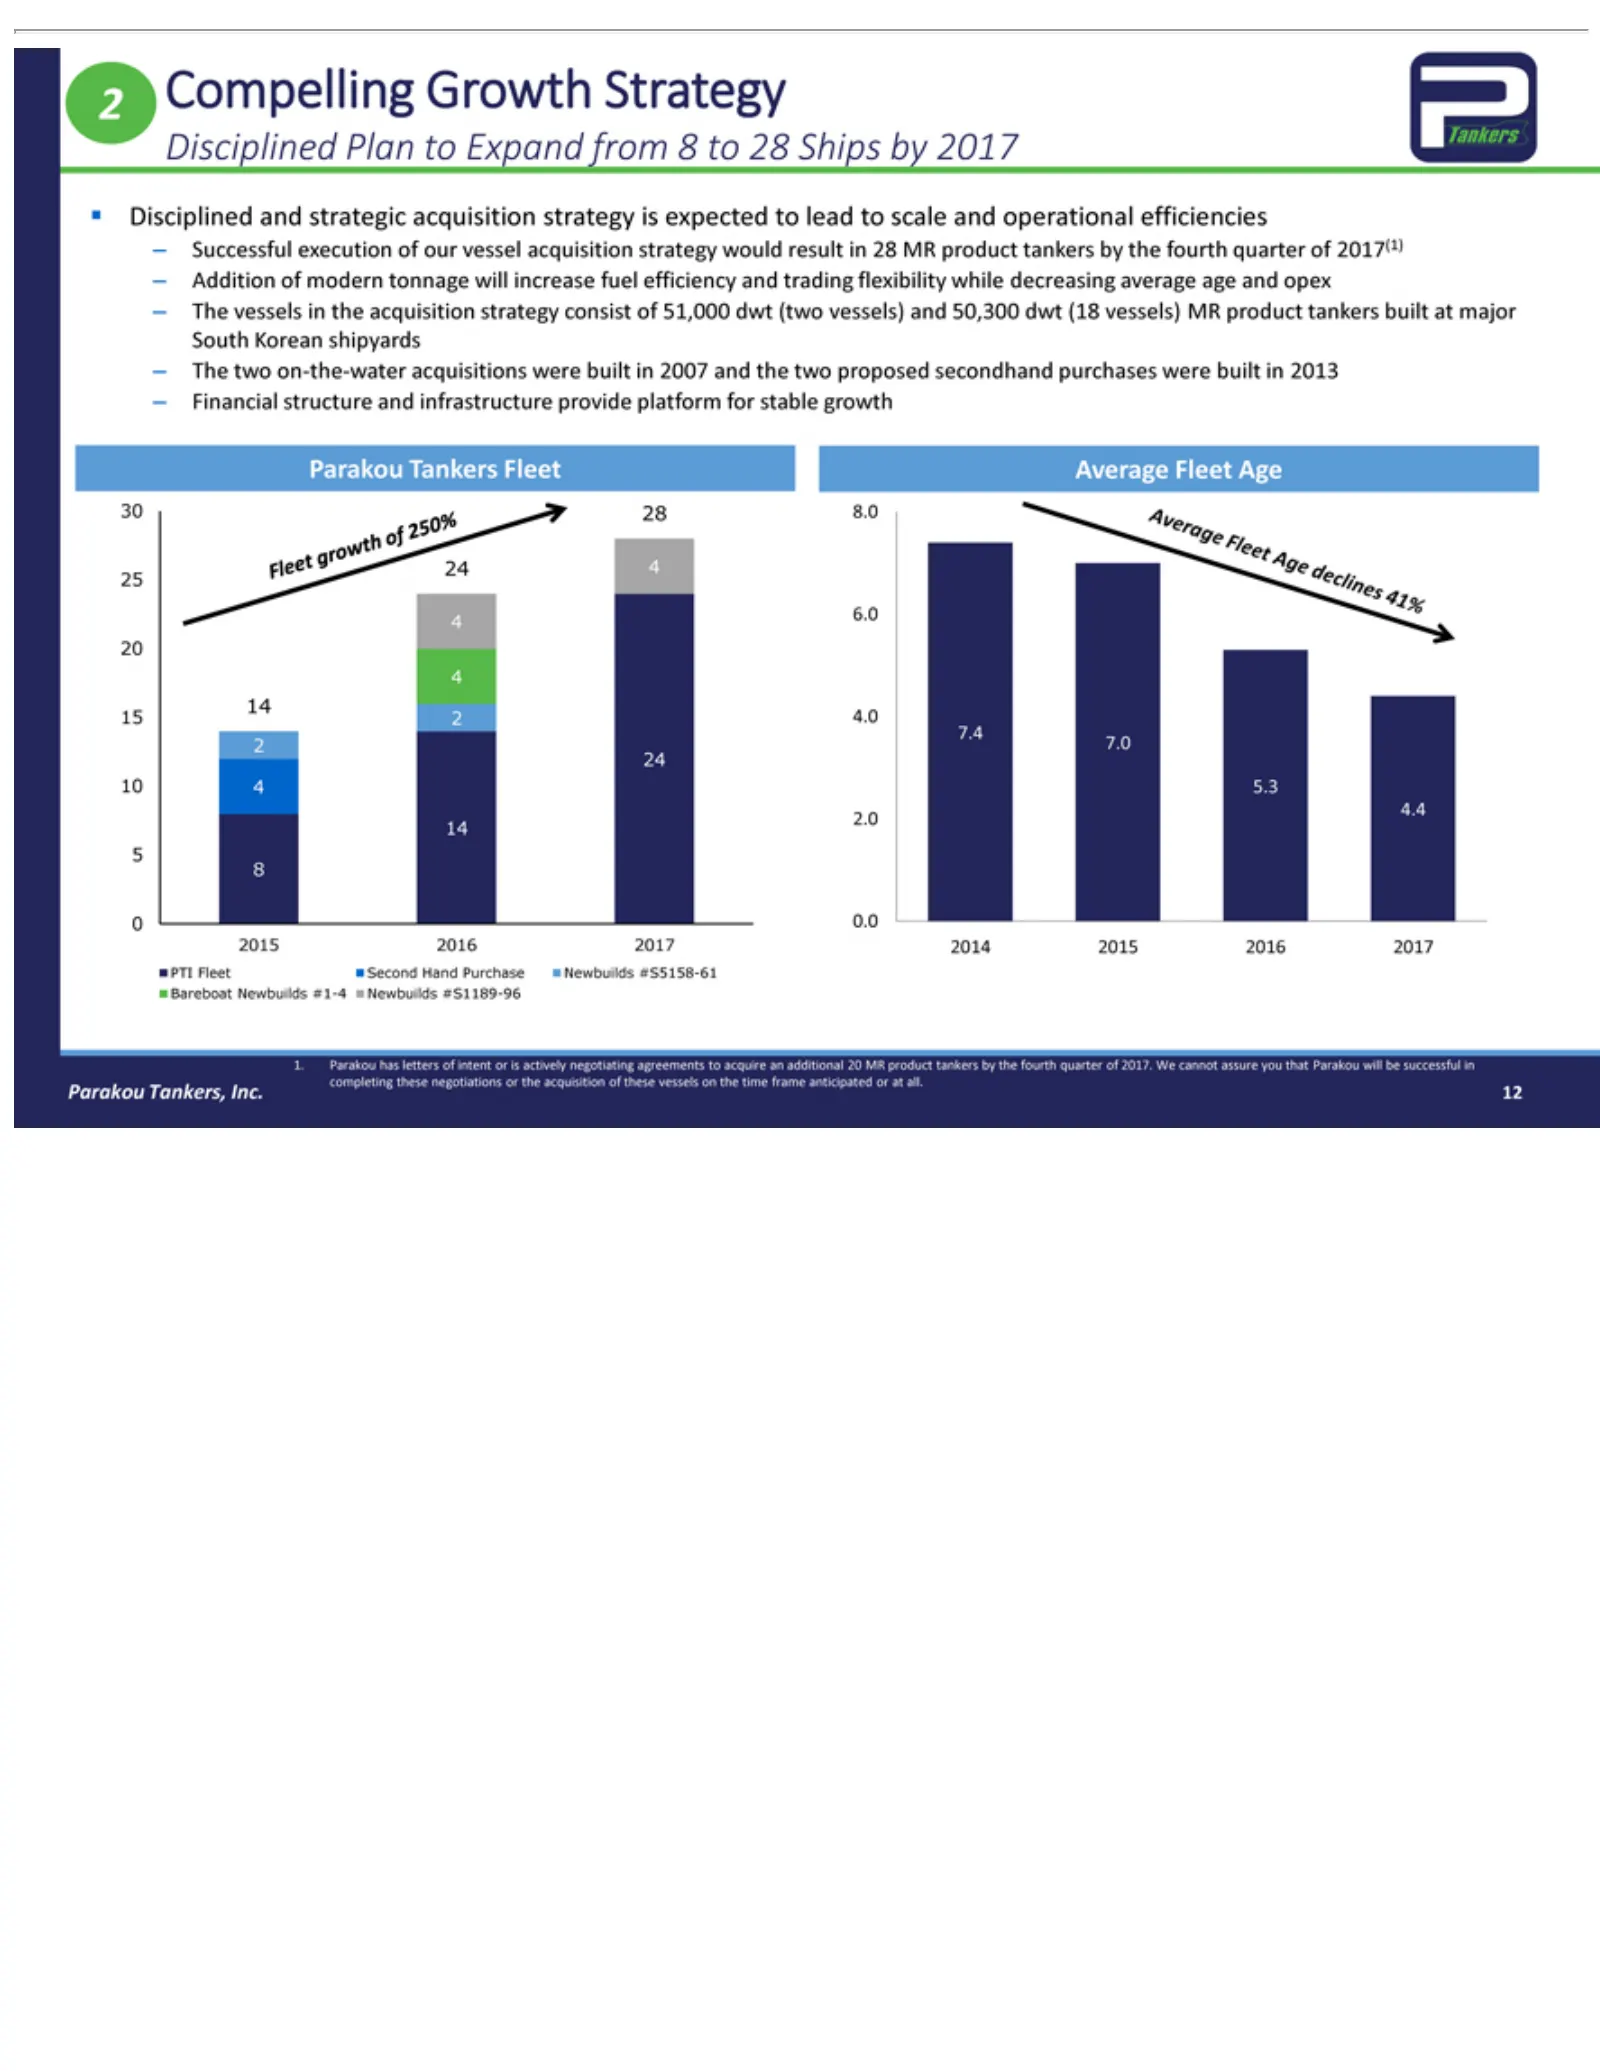
Slide 12: Disciplined Growth Strategy
–Disciplined Parakou 4130 20 215 7.4 10 24 14 5804.4 2015 PTI Bareboat 25 completing Par 12 4Addition The Compelling Successful Financial 6.0 7.0 0.0 28 4224 2.0 1. 4Fleet 4.0 5.3 2016 Parakou 8.0 4 vessels twoTankers Newbuilds Second on-the-water 2017 of structure these Plan and execution modern in
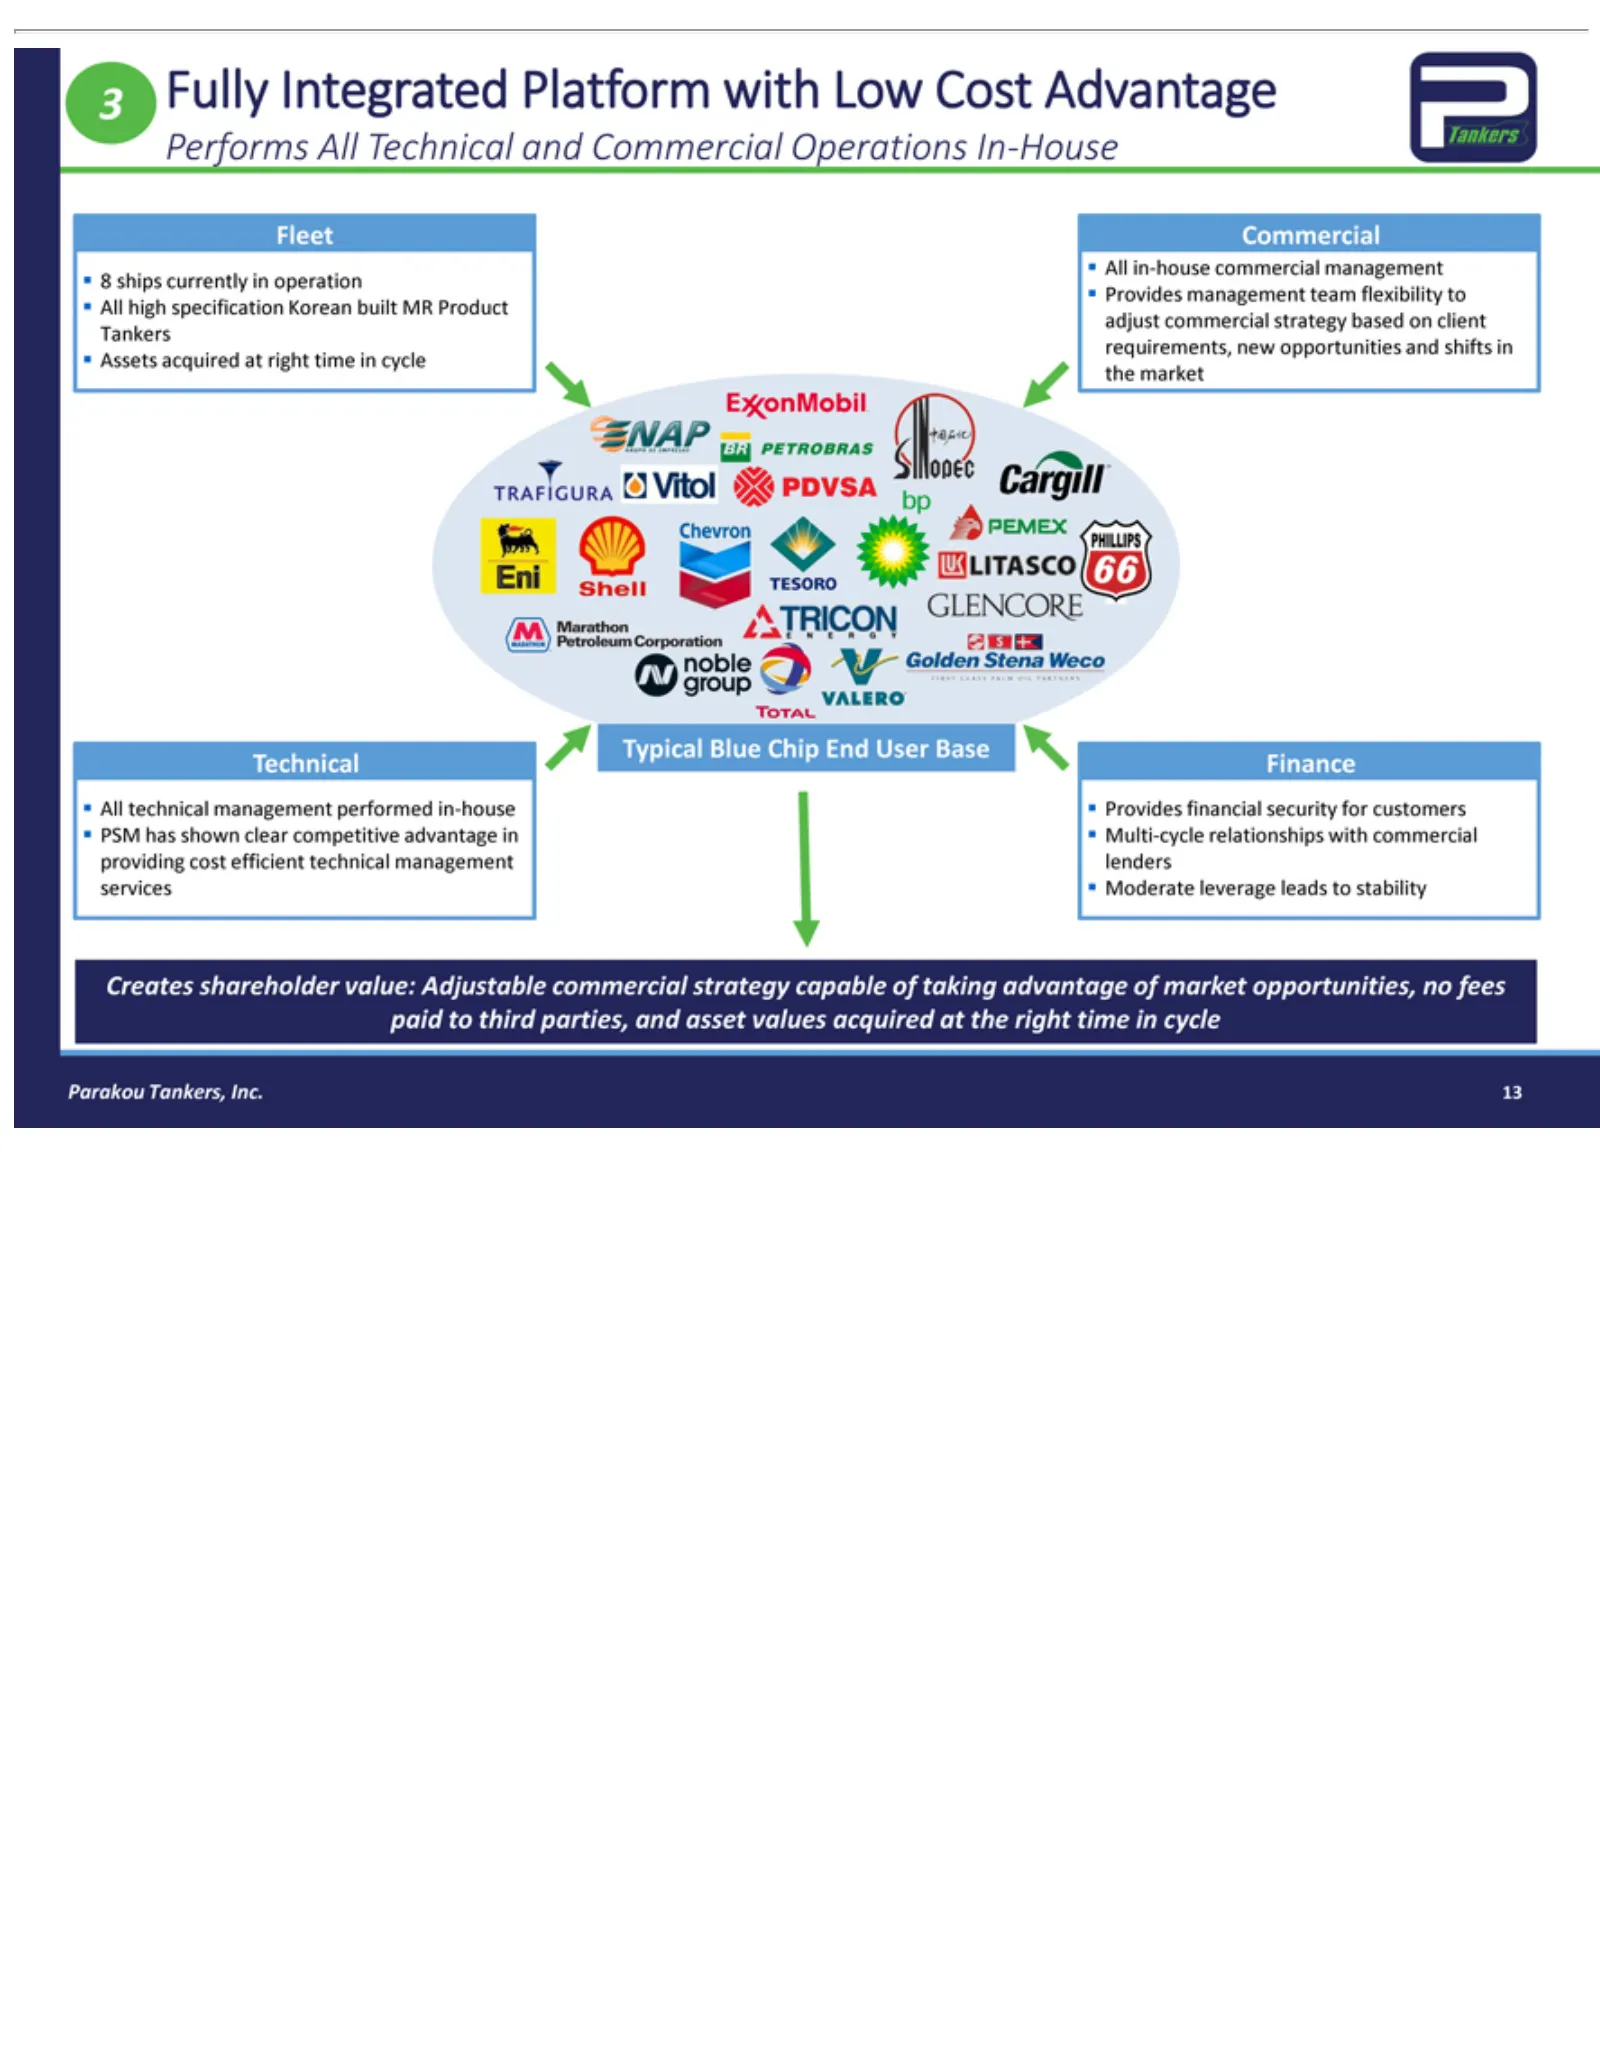
Slide 13: Fully Integrated Platform
3 ships Performs 8Fleet adjust Assets Tankers the Typical Technical All PSM providing services Creates Parakou 13Fully market high technical Commercial has commercial acquired currently Integrated Blue shareholder Moderate Tankers, specification shown All Finance costTechnical Chip management effici
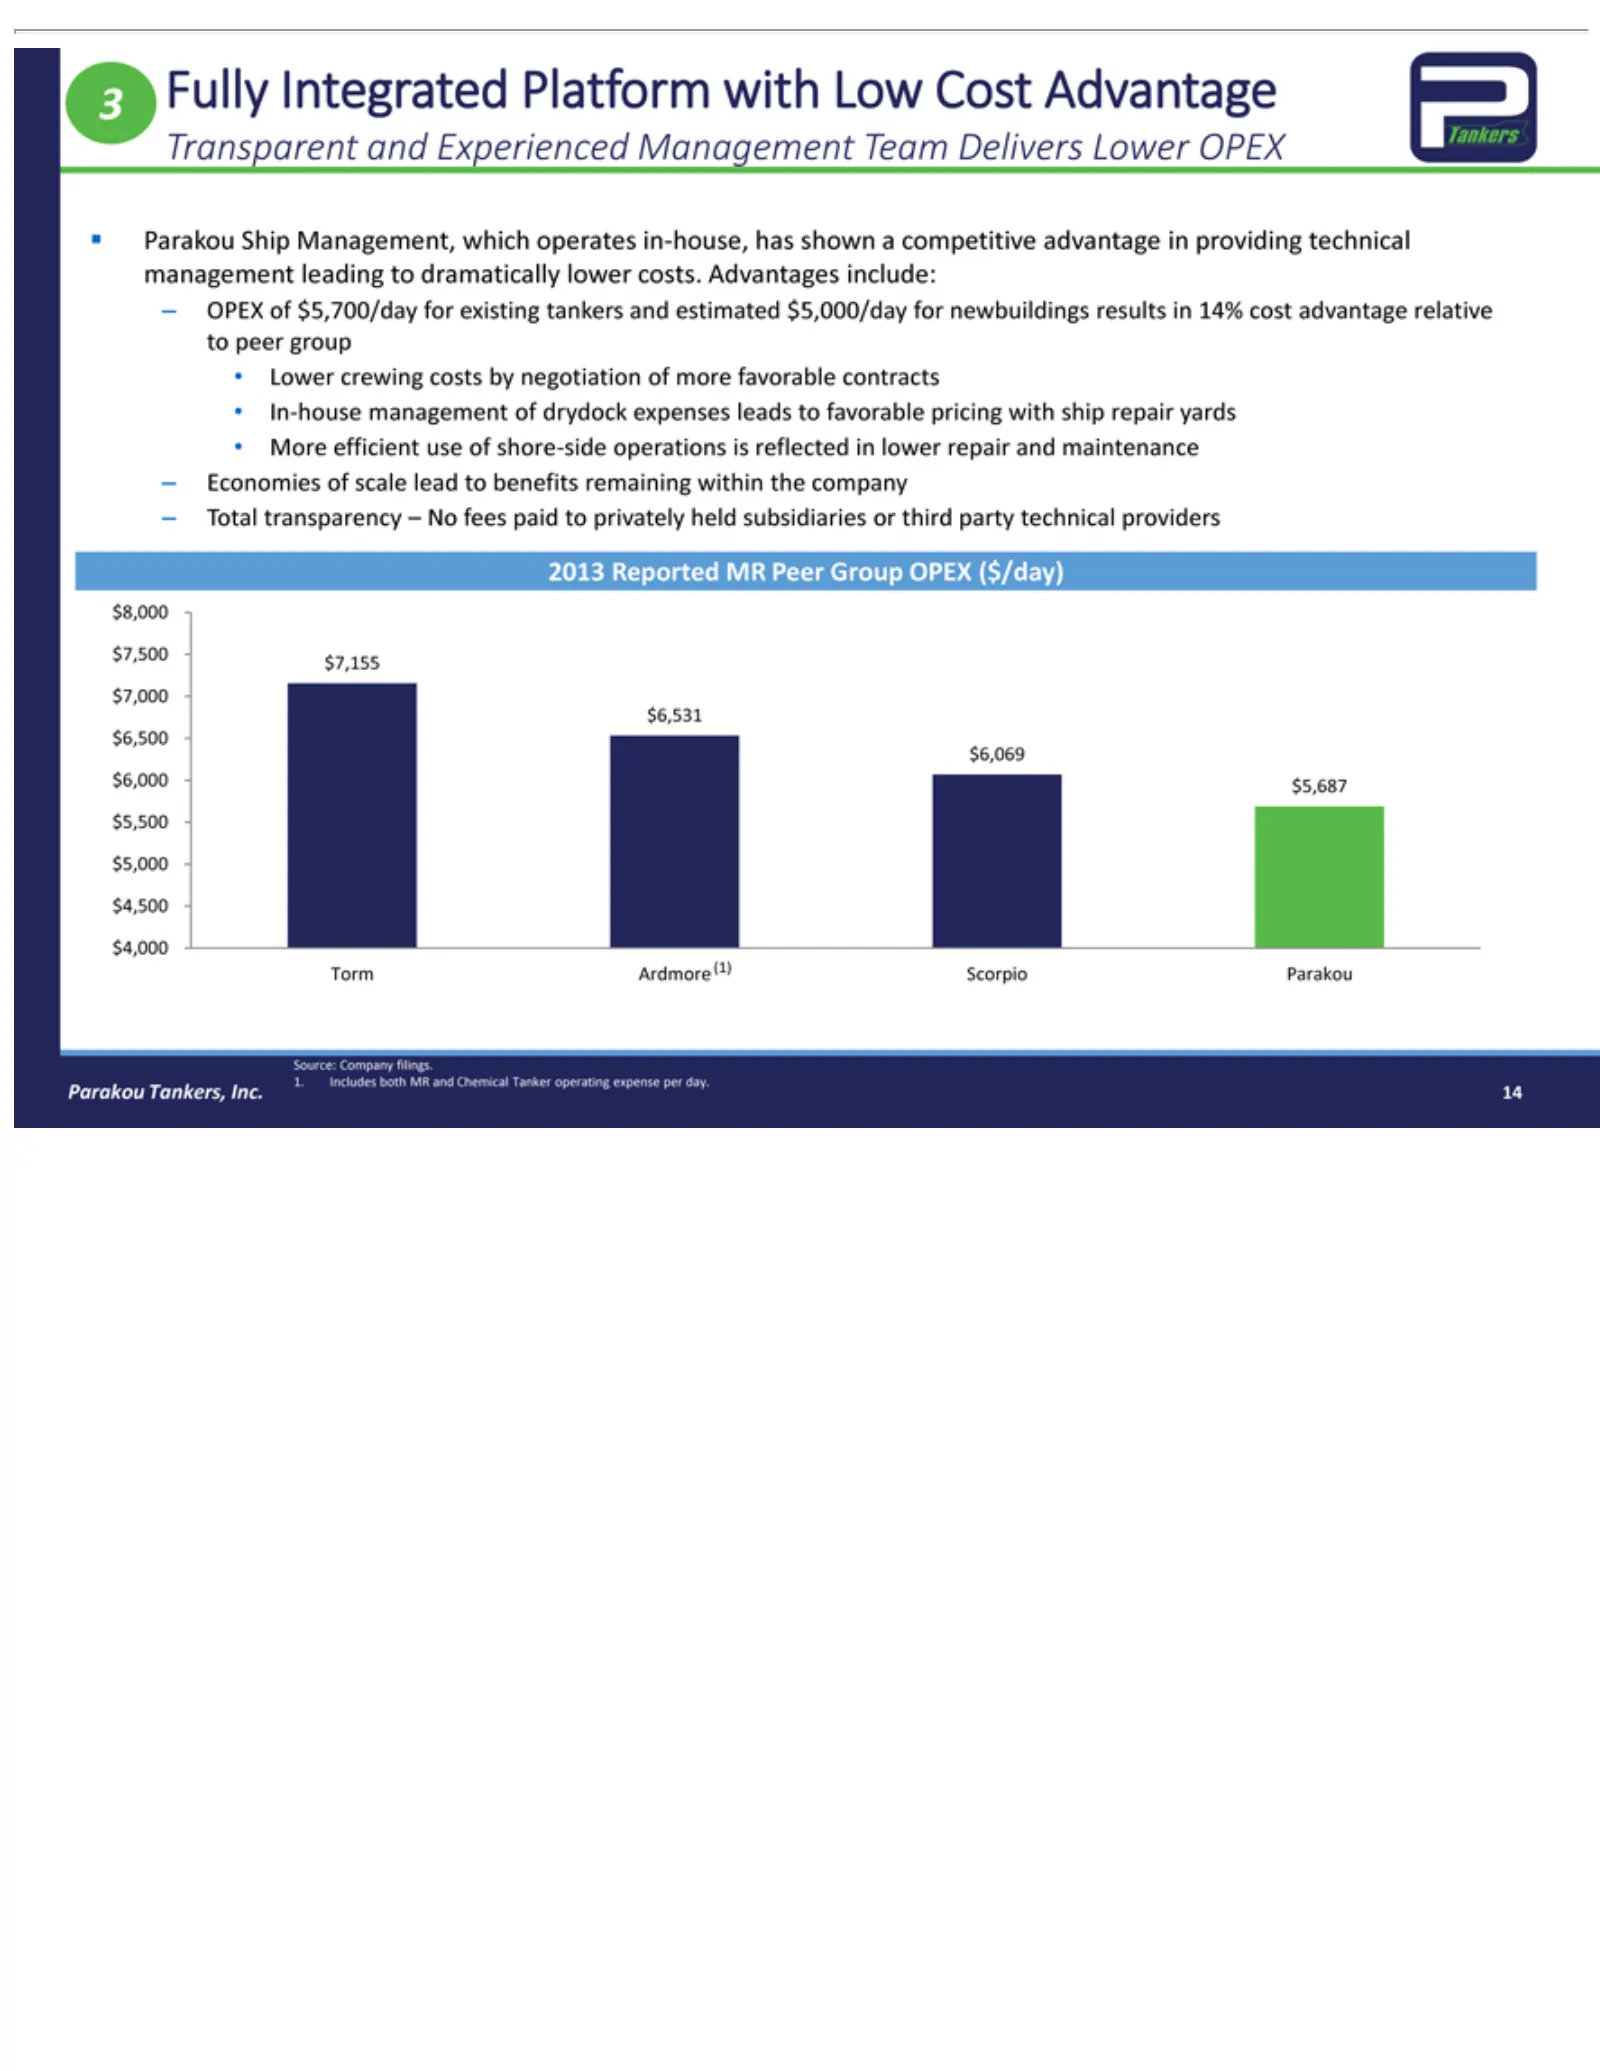
Slide 14: Fully Integrated Platform: Low Cost Advantage
3 Total Transparent Lower In-house –More 2013 $7,500 $8,000 Torm $4,000 $4,500 $5,000 Source: 1. Parakou 14 Fully OPEX Economies Includes Reported Ardmore(1) efficient crewing $7,155 transparency Integrated Company Tankers, Ship of management both $5,700/day and of Management, use $7,000 MR costs sc
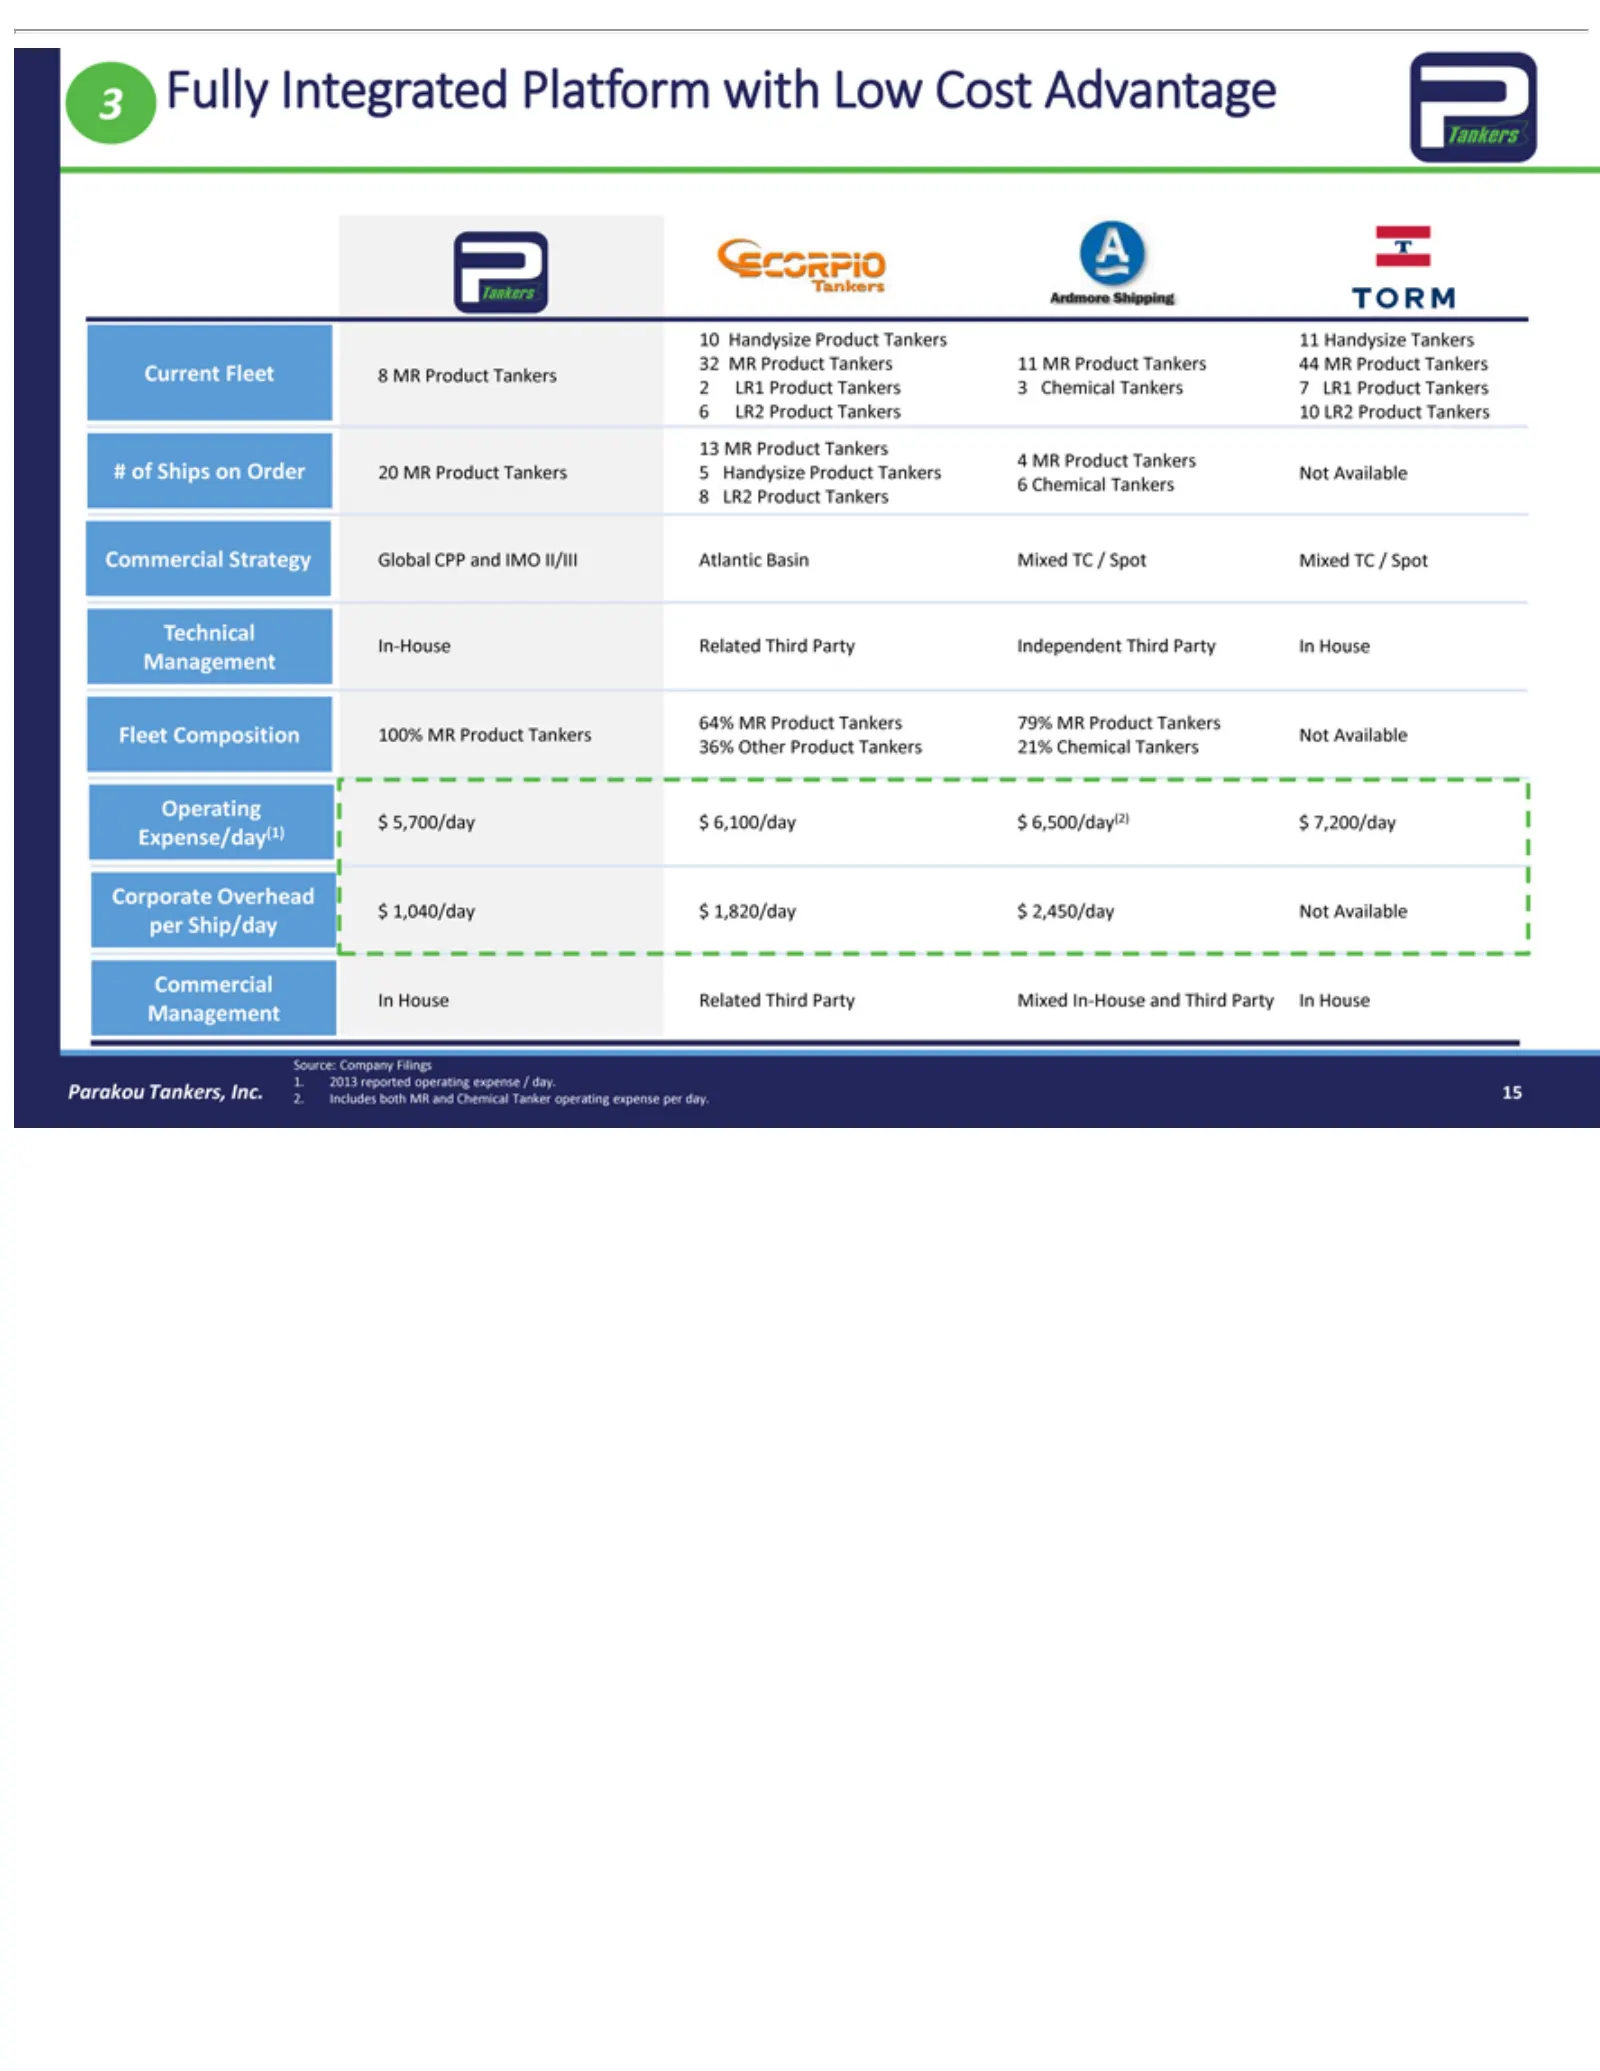
Slide 15: Fully Integrated Platform: Current Fleet and In-House Management
3 Tankers, 10 2Current 86#413 In-House Technical 64% Fleet 36% Operating Corporate $Expense/day(1) per In Commercial Source: Management 1. u2. 15 Fully LR1 MR of Chemical LR2 5,700/day 1,040/day 2013 Includes House Handysize MR Ship/day Ships MR Other Composition Product Product Product Integrated r
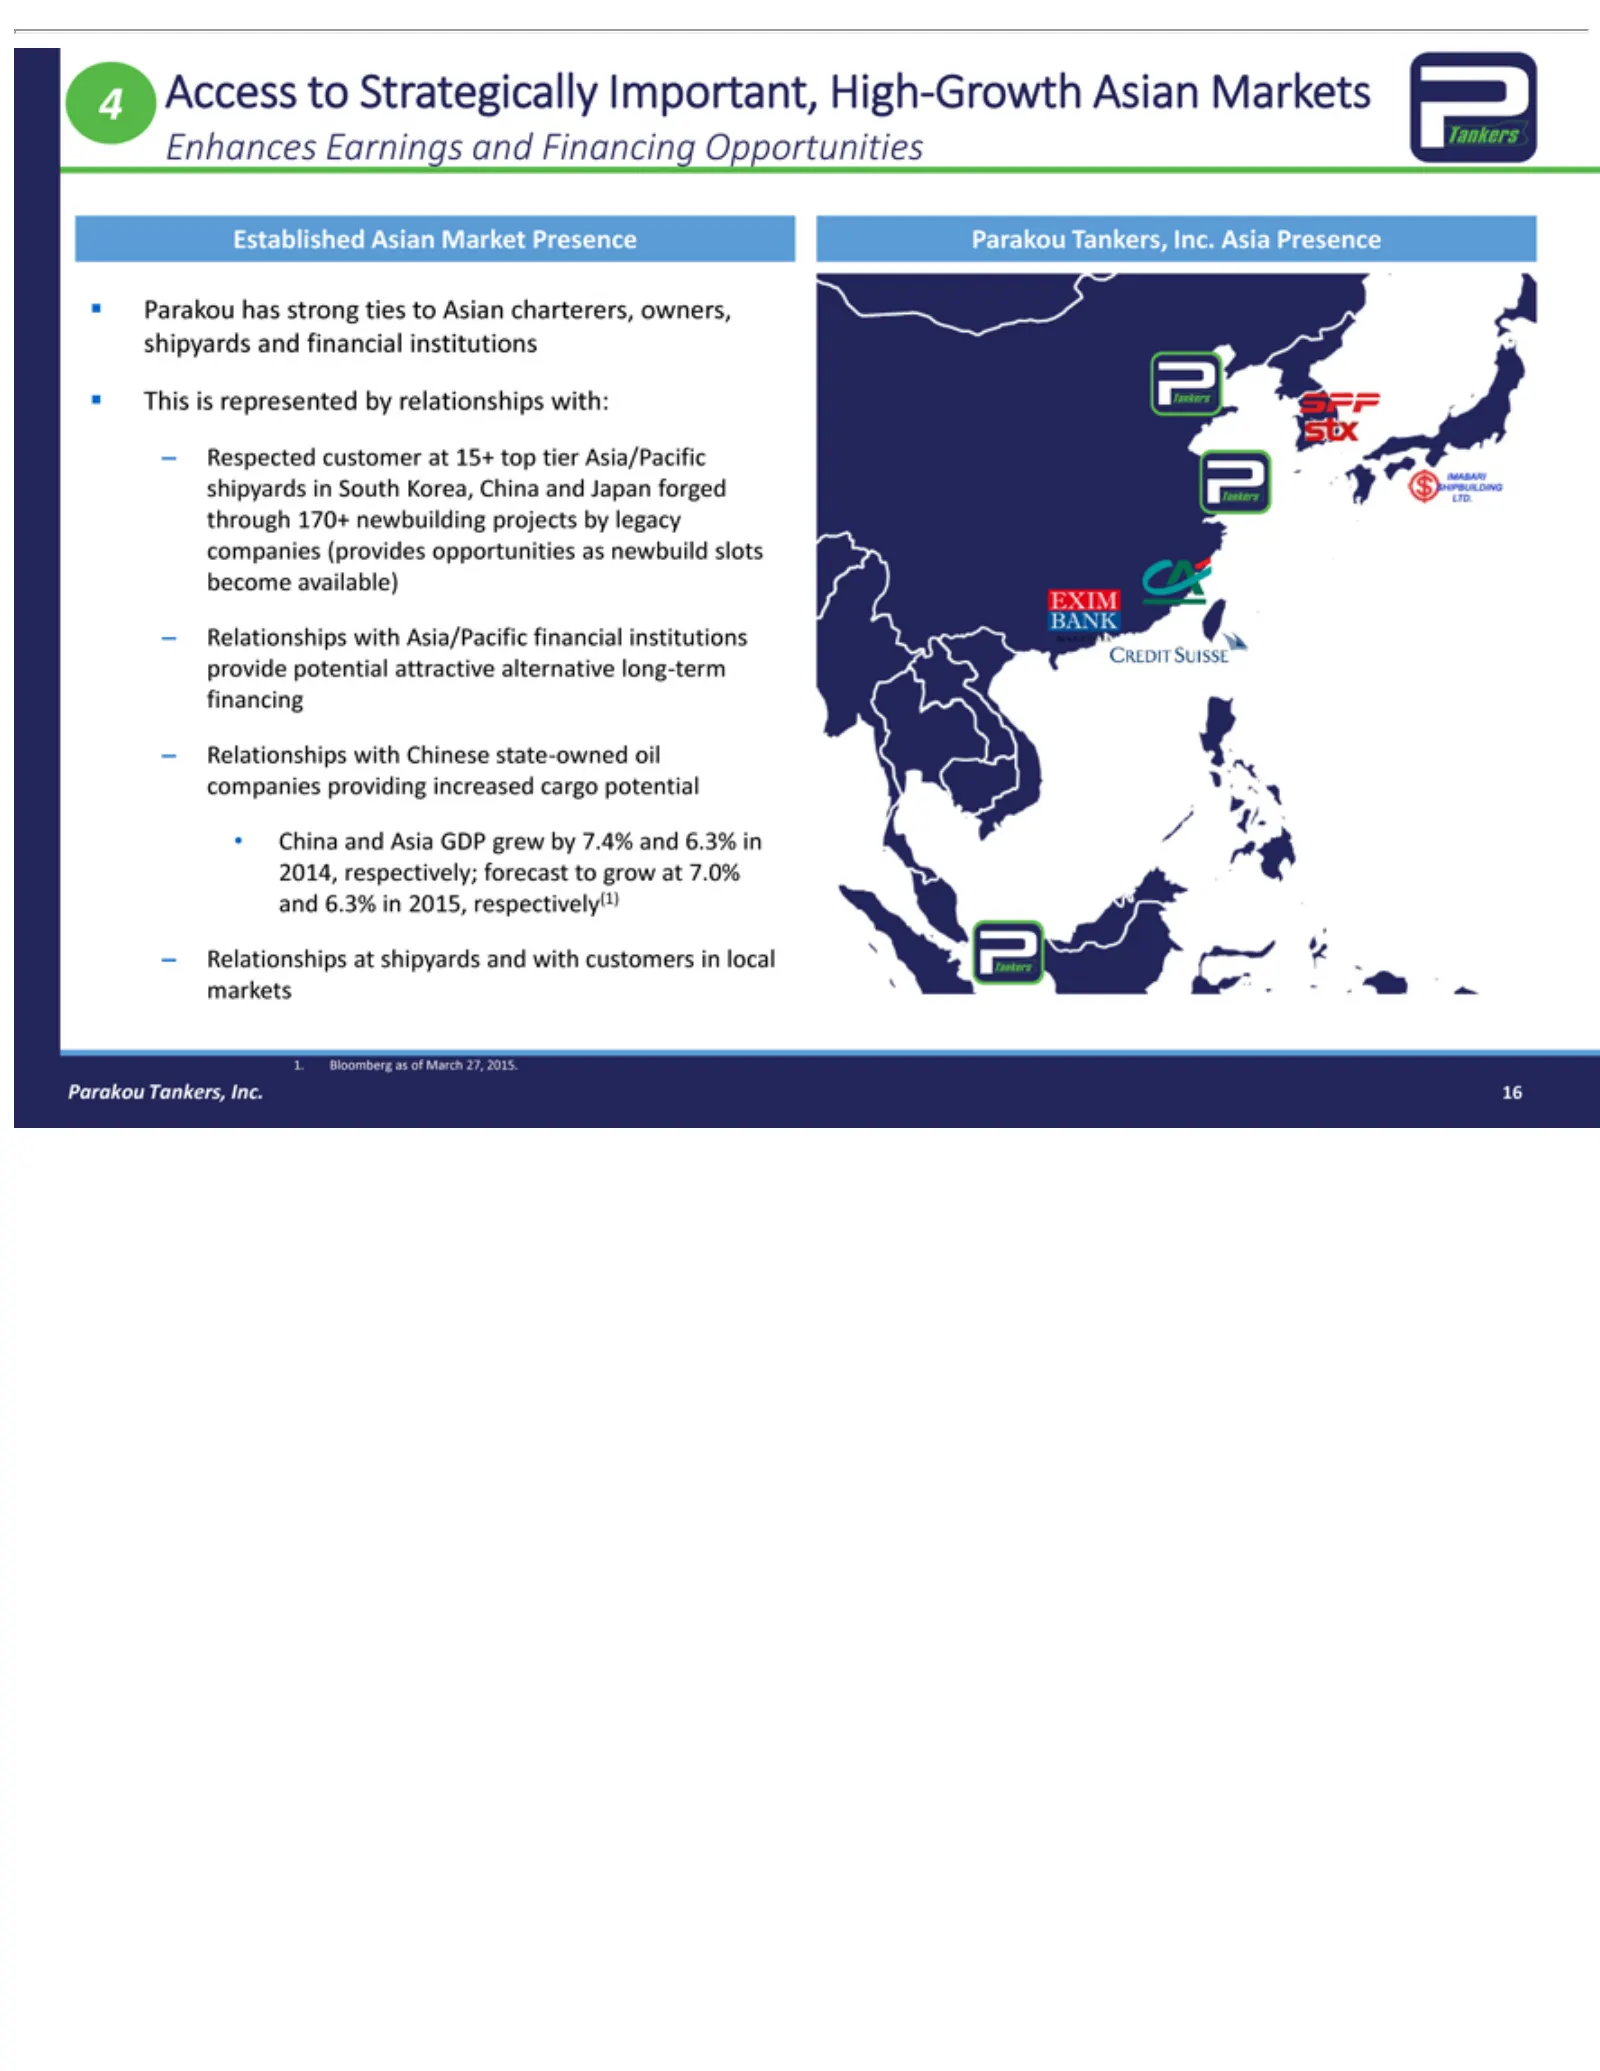
Slide 16: Access to Strategically Important, High-Growth Asian Markets
4 Access Enhances Established Parakou This available) –China u1. 16Tankers, Respected Relationships Bloomberg isand represented has toEarnings Asia Inc. Strategically Asian customer strong asGDP with at ofMarket shipyards by ties and March Asia/Pacific Chinese grew at relationships to Financing 15+
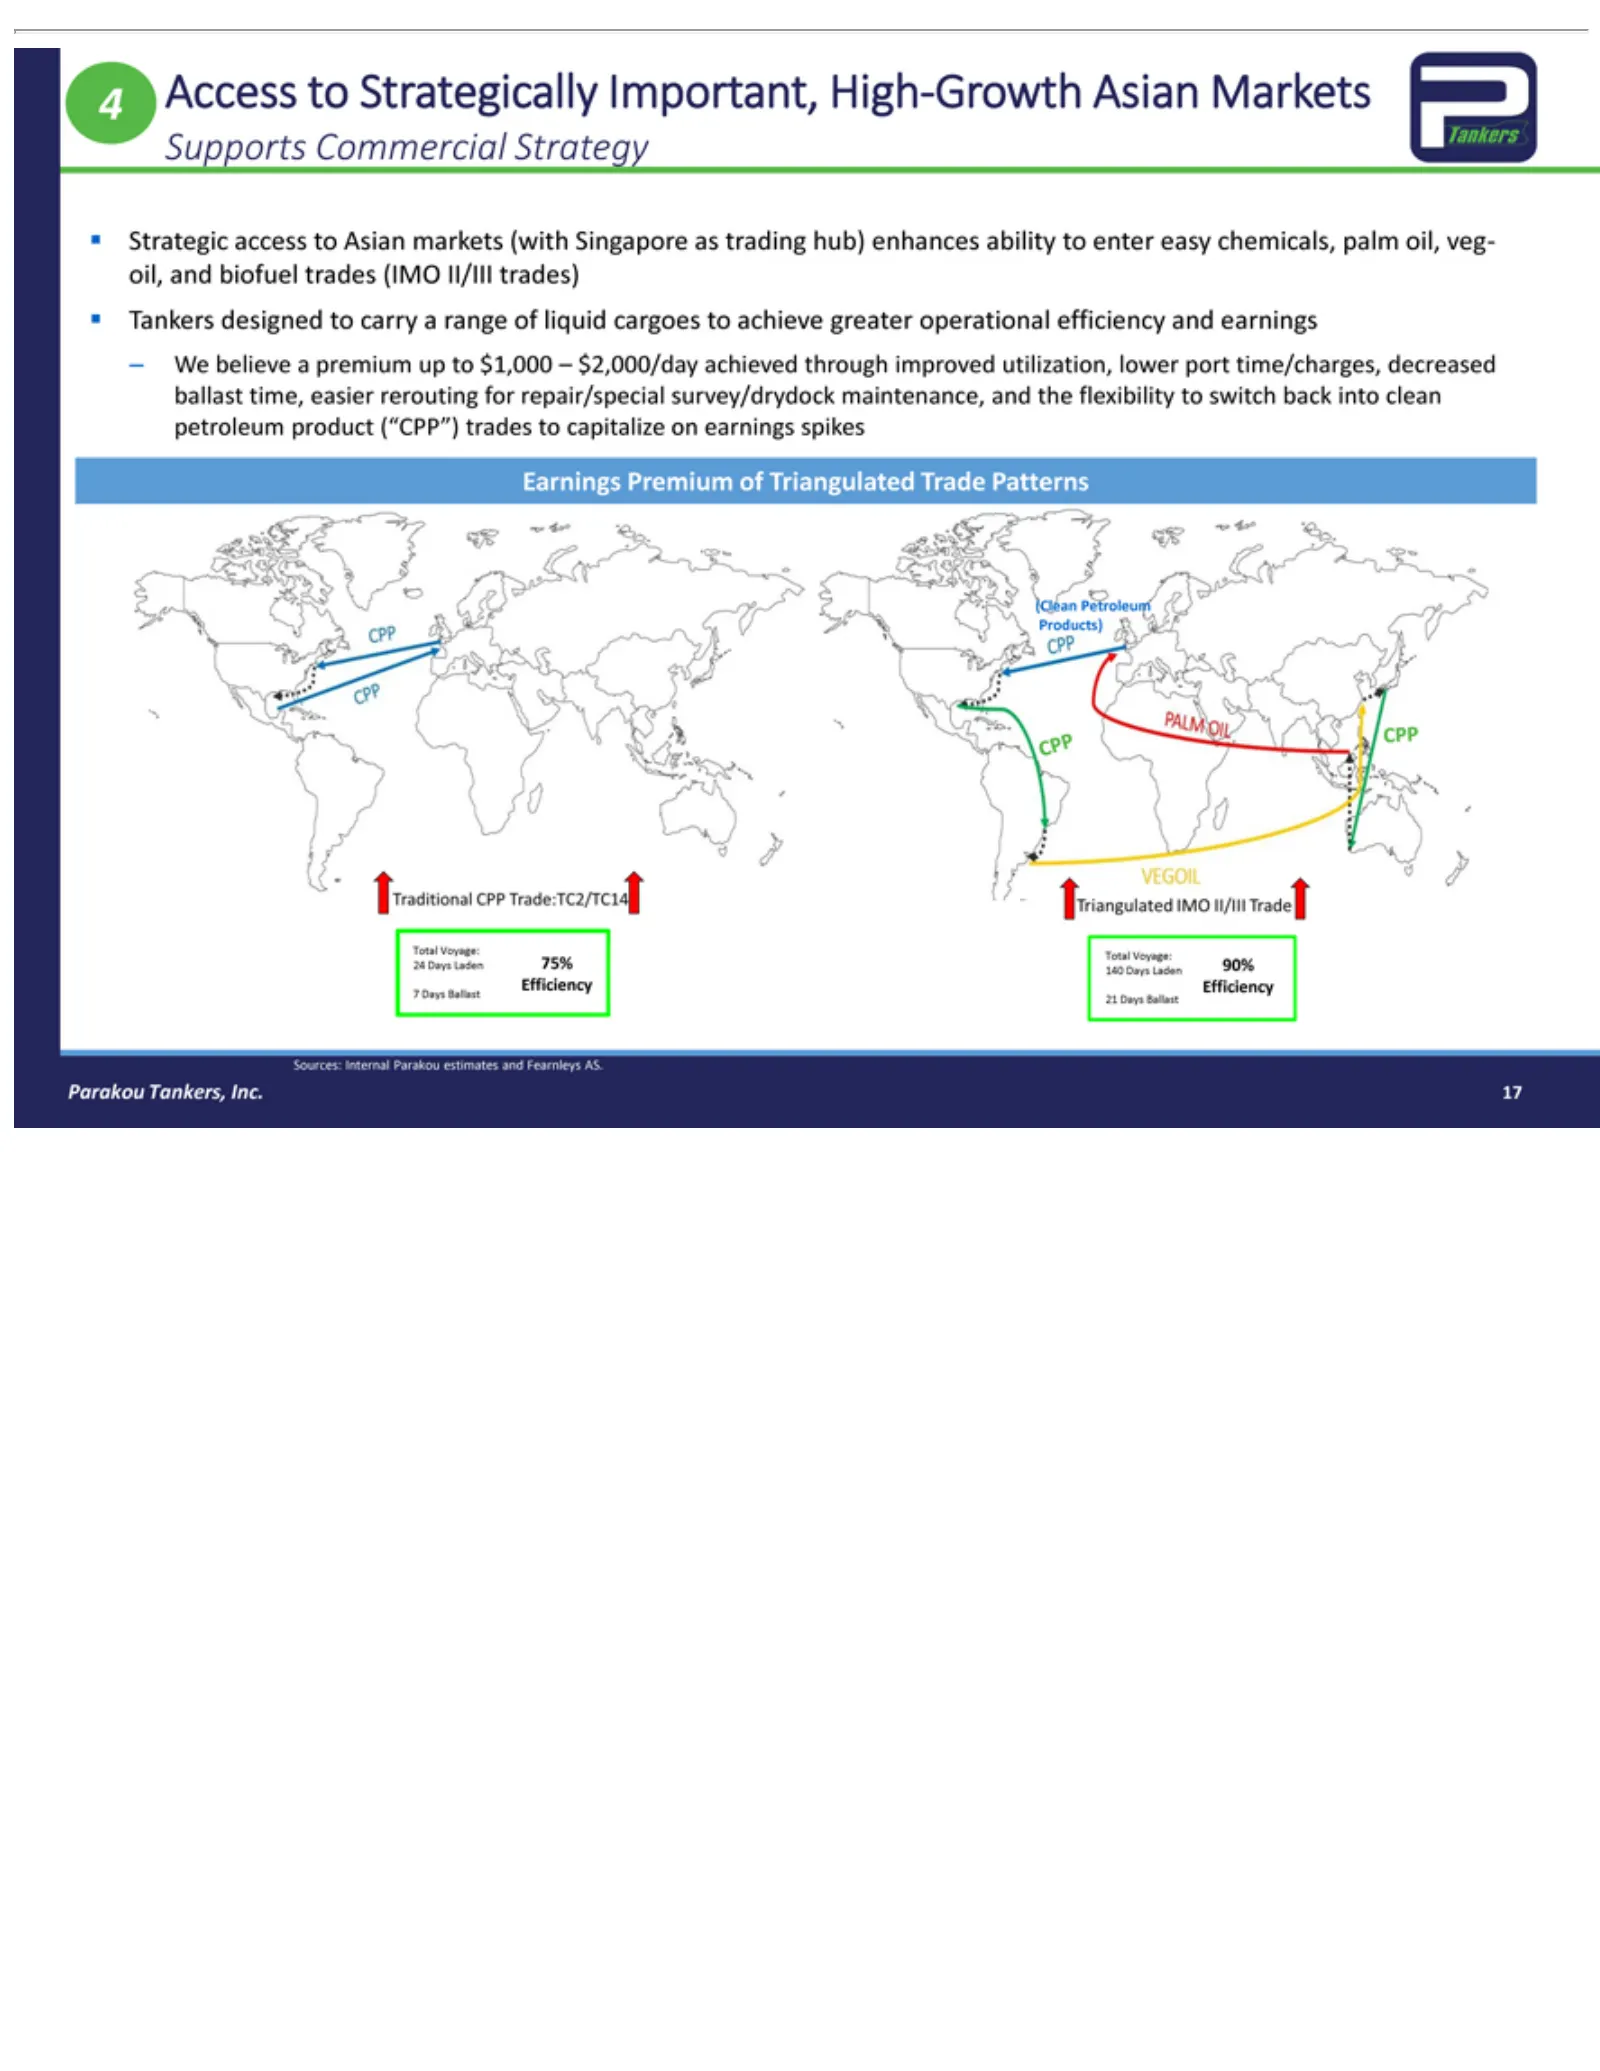
Slide 17: Asian Access Supports Commercial Strategy
4 Access Supports Strategic –achieve flexibility Earnings (Clean Total 724 21 Sources: Parakou 17 We Days Days Voyage: believe Petroleum Ballast greater Tankers, Laden Ballast Internal to access Premium Commercial toStrategically switch a Efficiency premium 75% operational toParakou Inc. Products) A
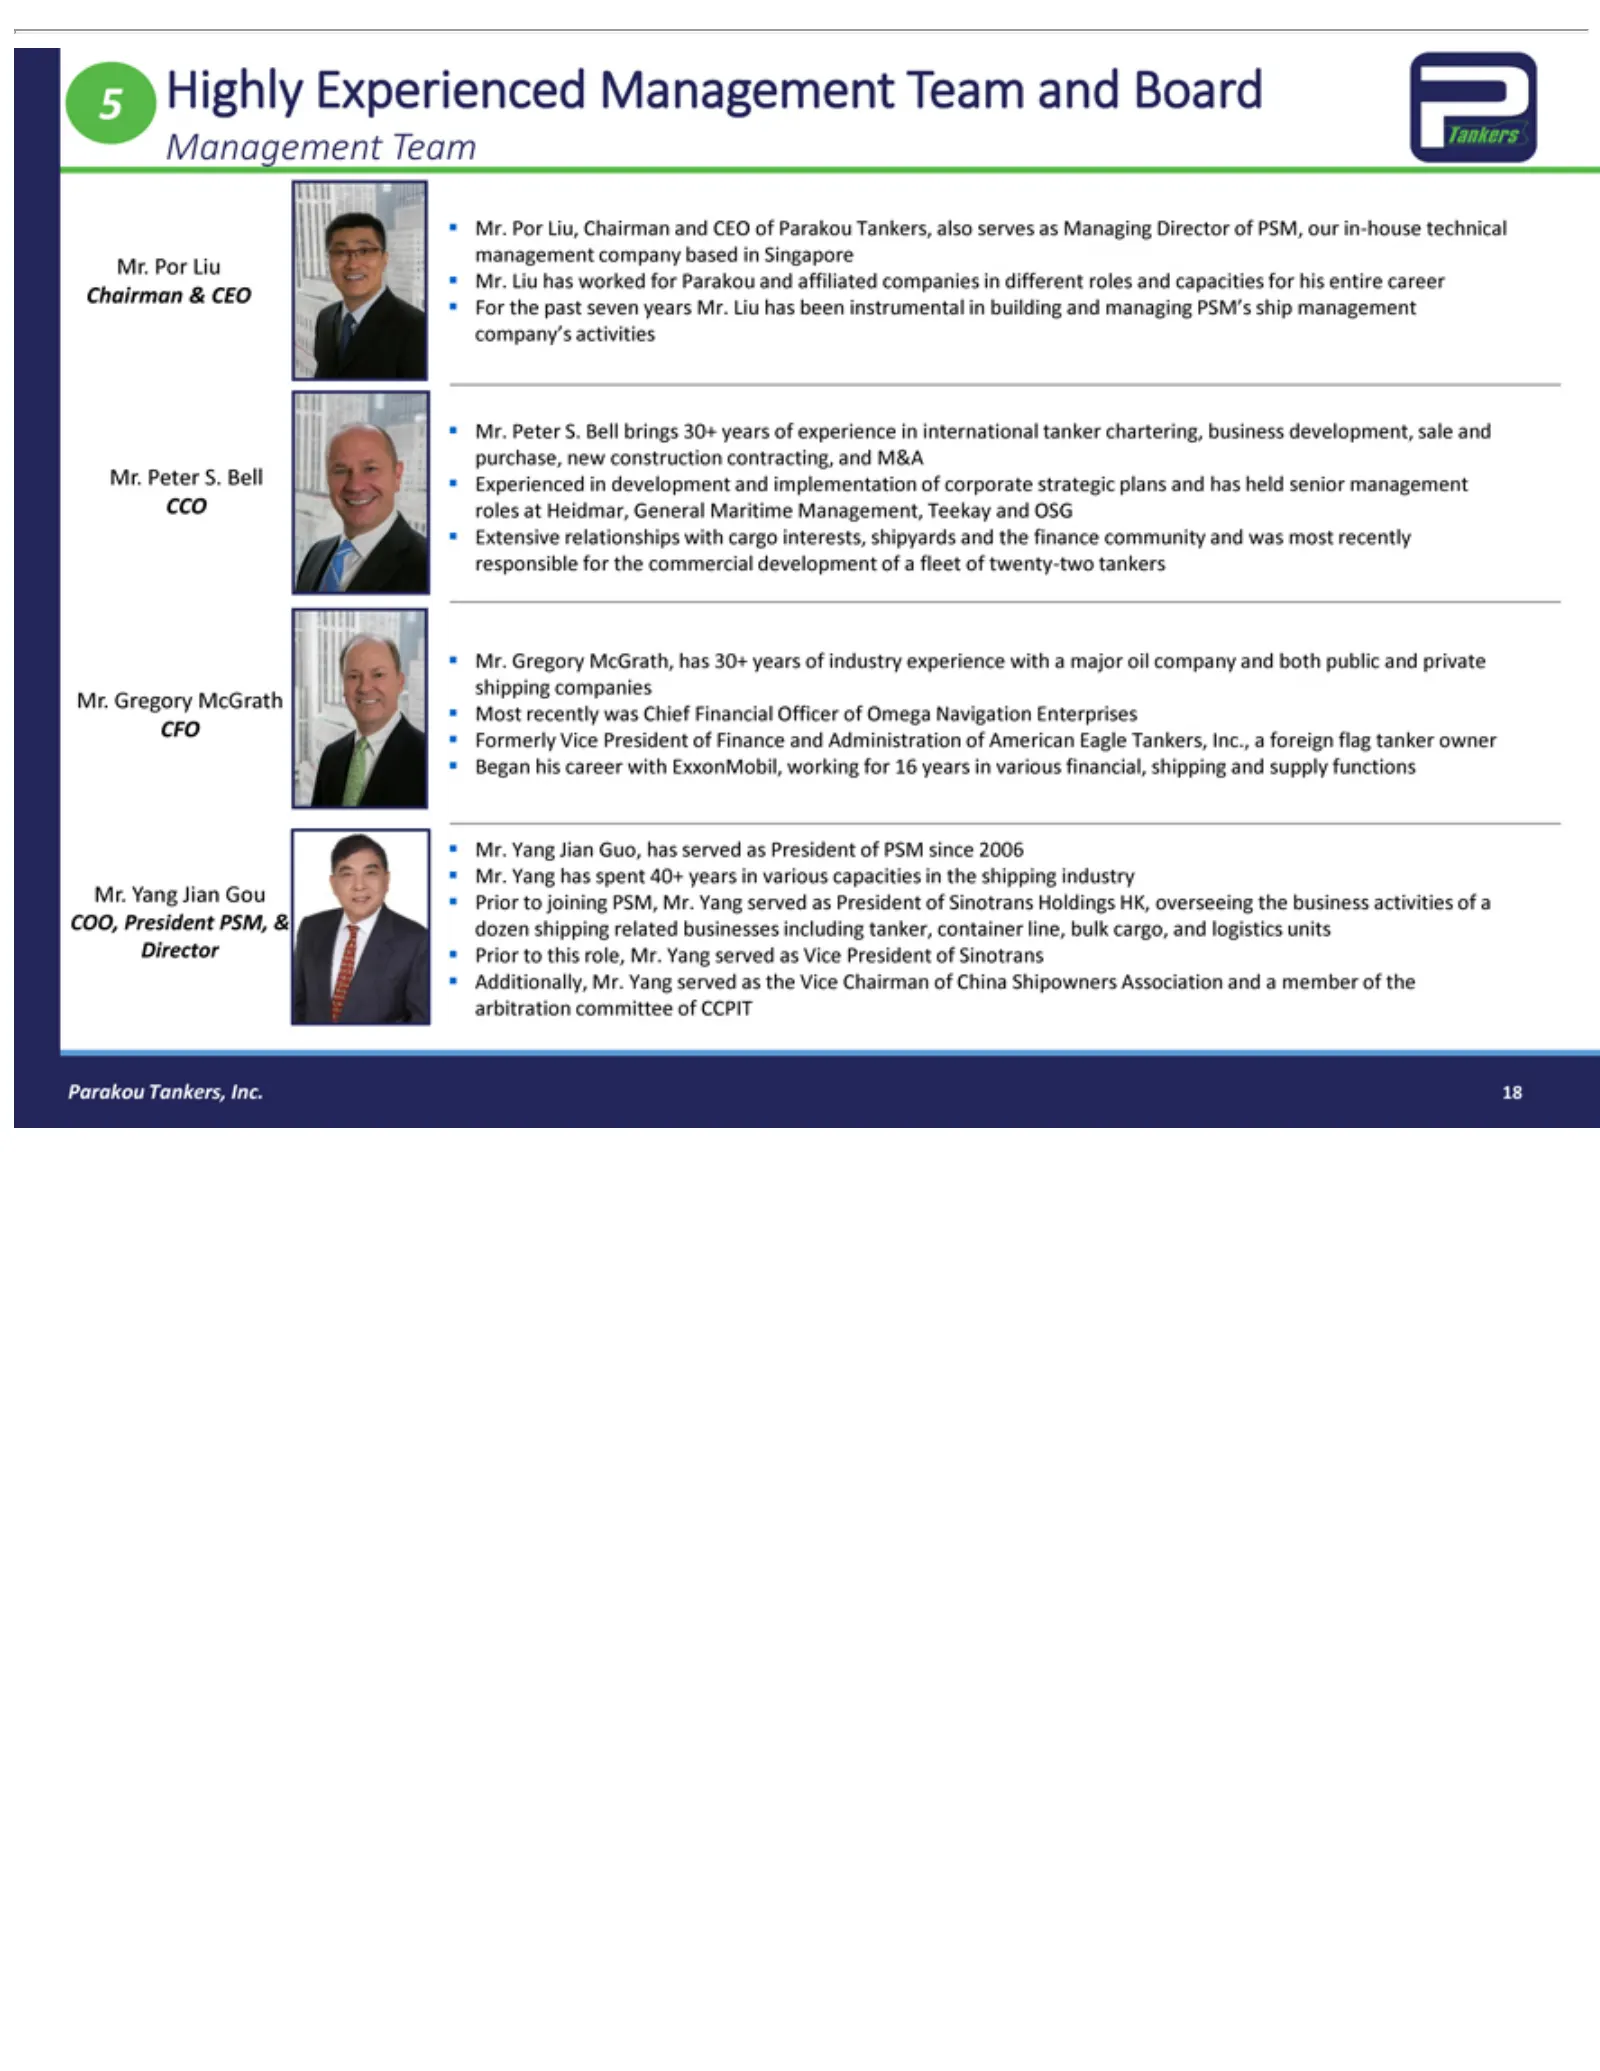
Slide 18: Highly Experienced Management Team
5 Highly Management management Chairman company’s purchase, CCO Extensive responsible shipping CFO Began Mr. COO, Director Additionally, arbitration Parakou 18 Yang Por Peter Gregory Formerly roles President his Liu, Liu Tankers, Prior companies Experienced has Jian S. new relationships & career com
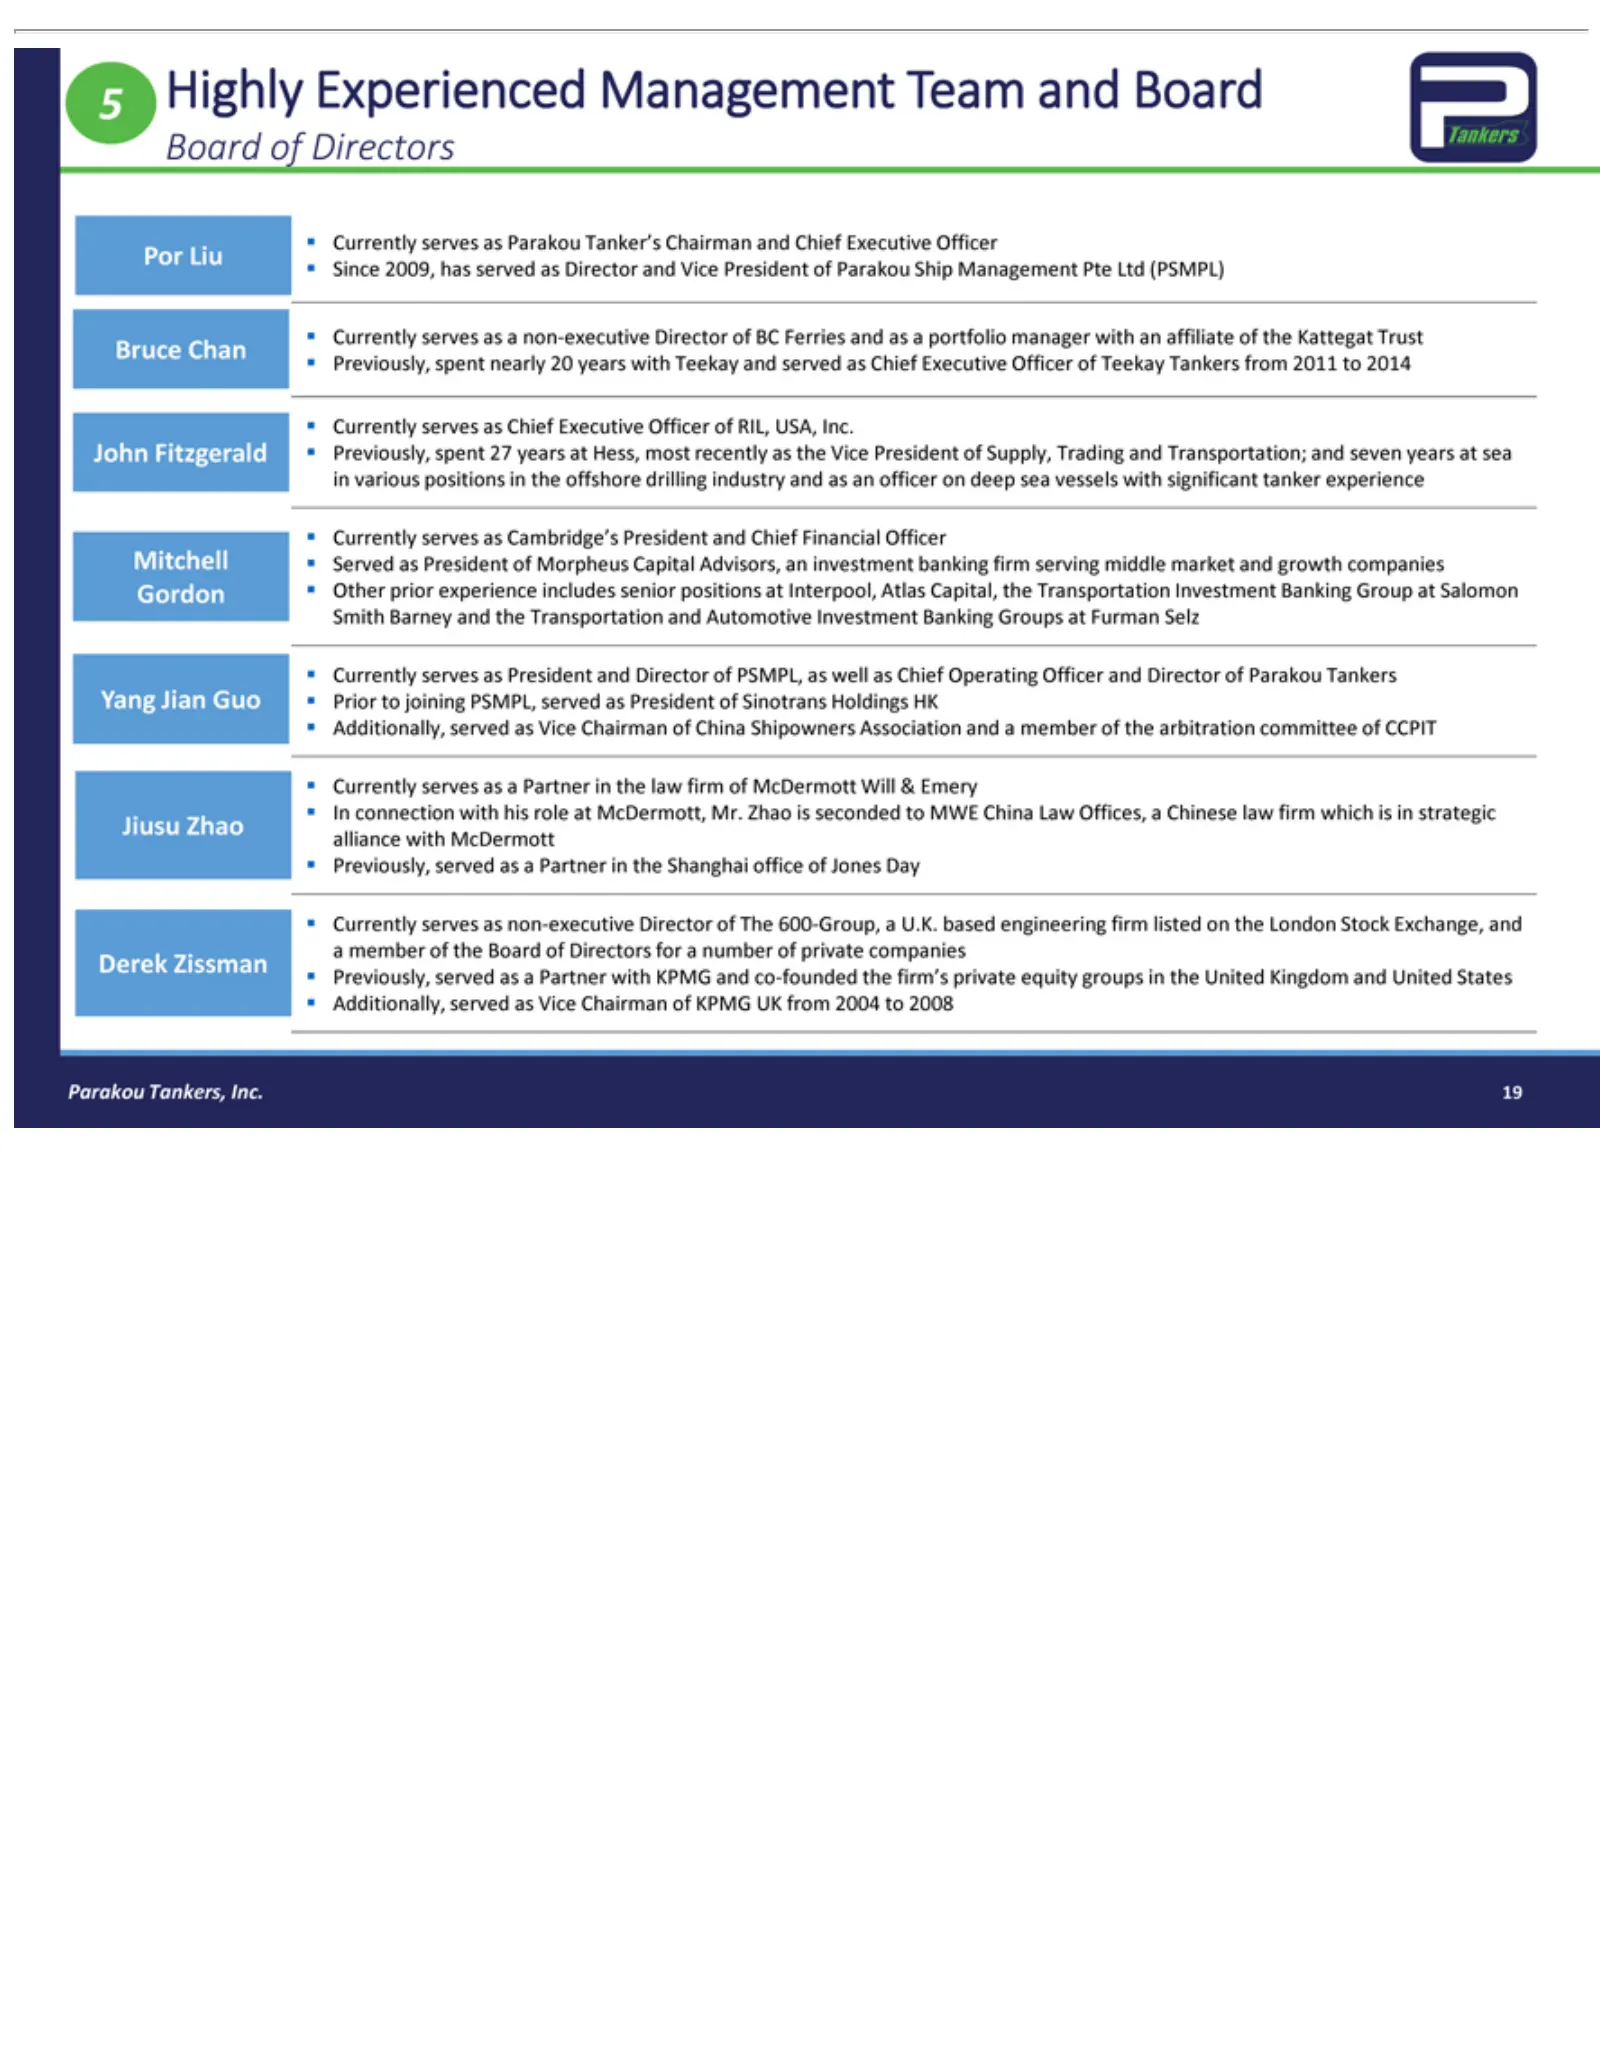
Slide 19: Experienced Board of Directors
5 member Board Por Bruce John in Mitchell Gordon Smith Yang Jiusu alliance Previously, aCurrently Derek Additionally, Parakou 19Highly various Liu Fitzgerald Zhao Jian Chan Barney Zissman ofSince Other with Tankers, Served Directors Experienced serves Guo of positions In served Previously, the McDer
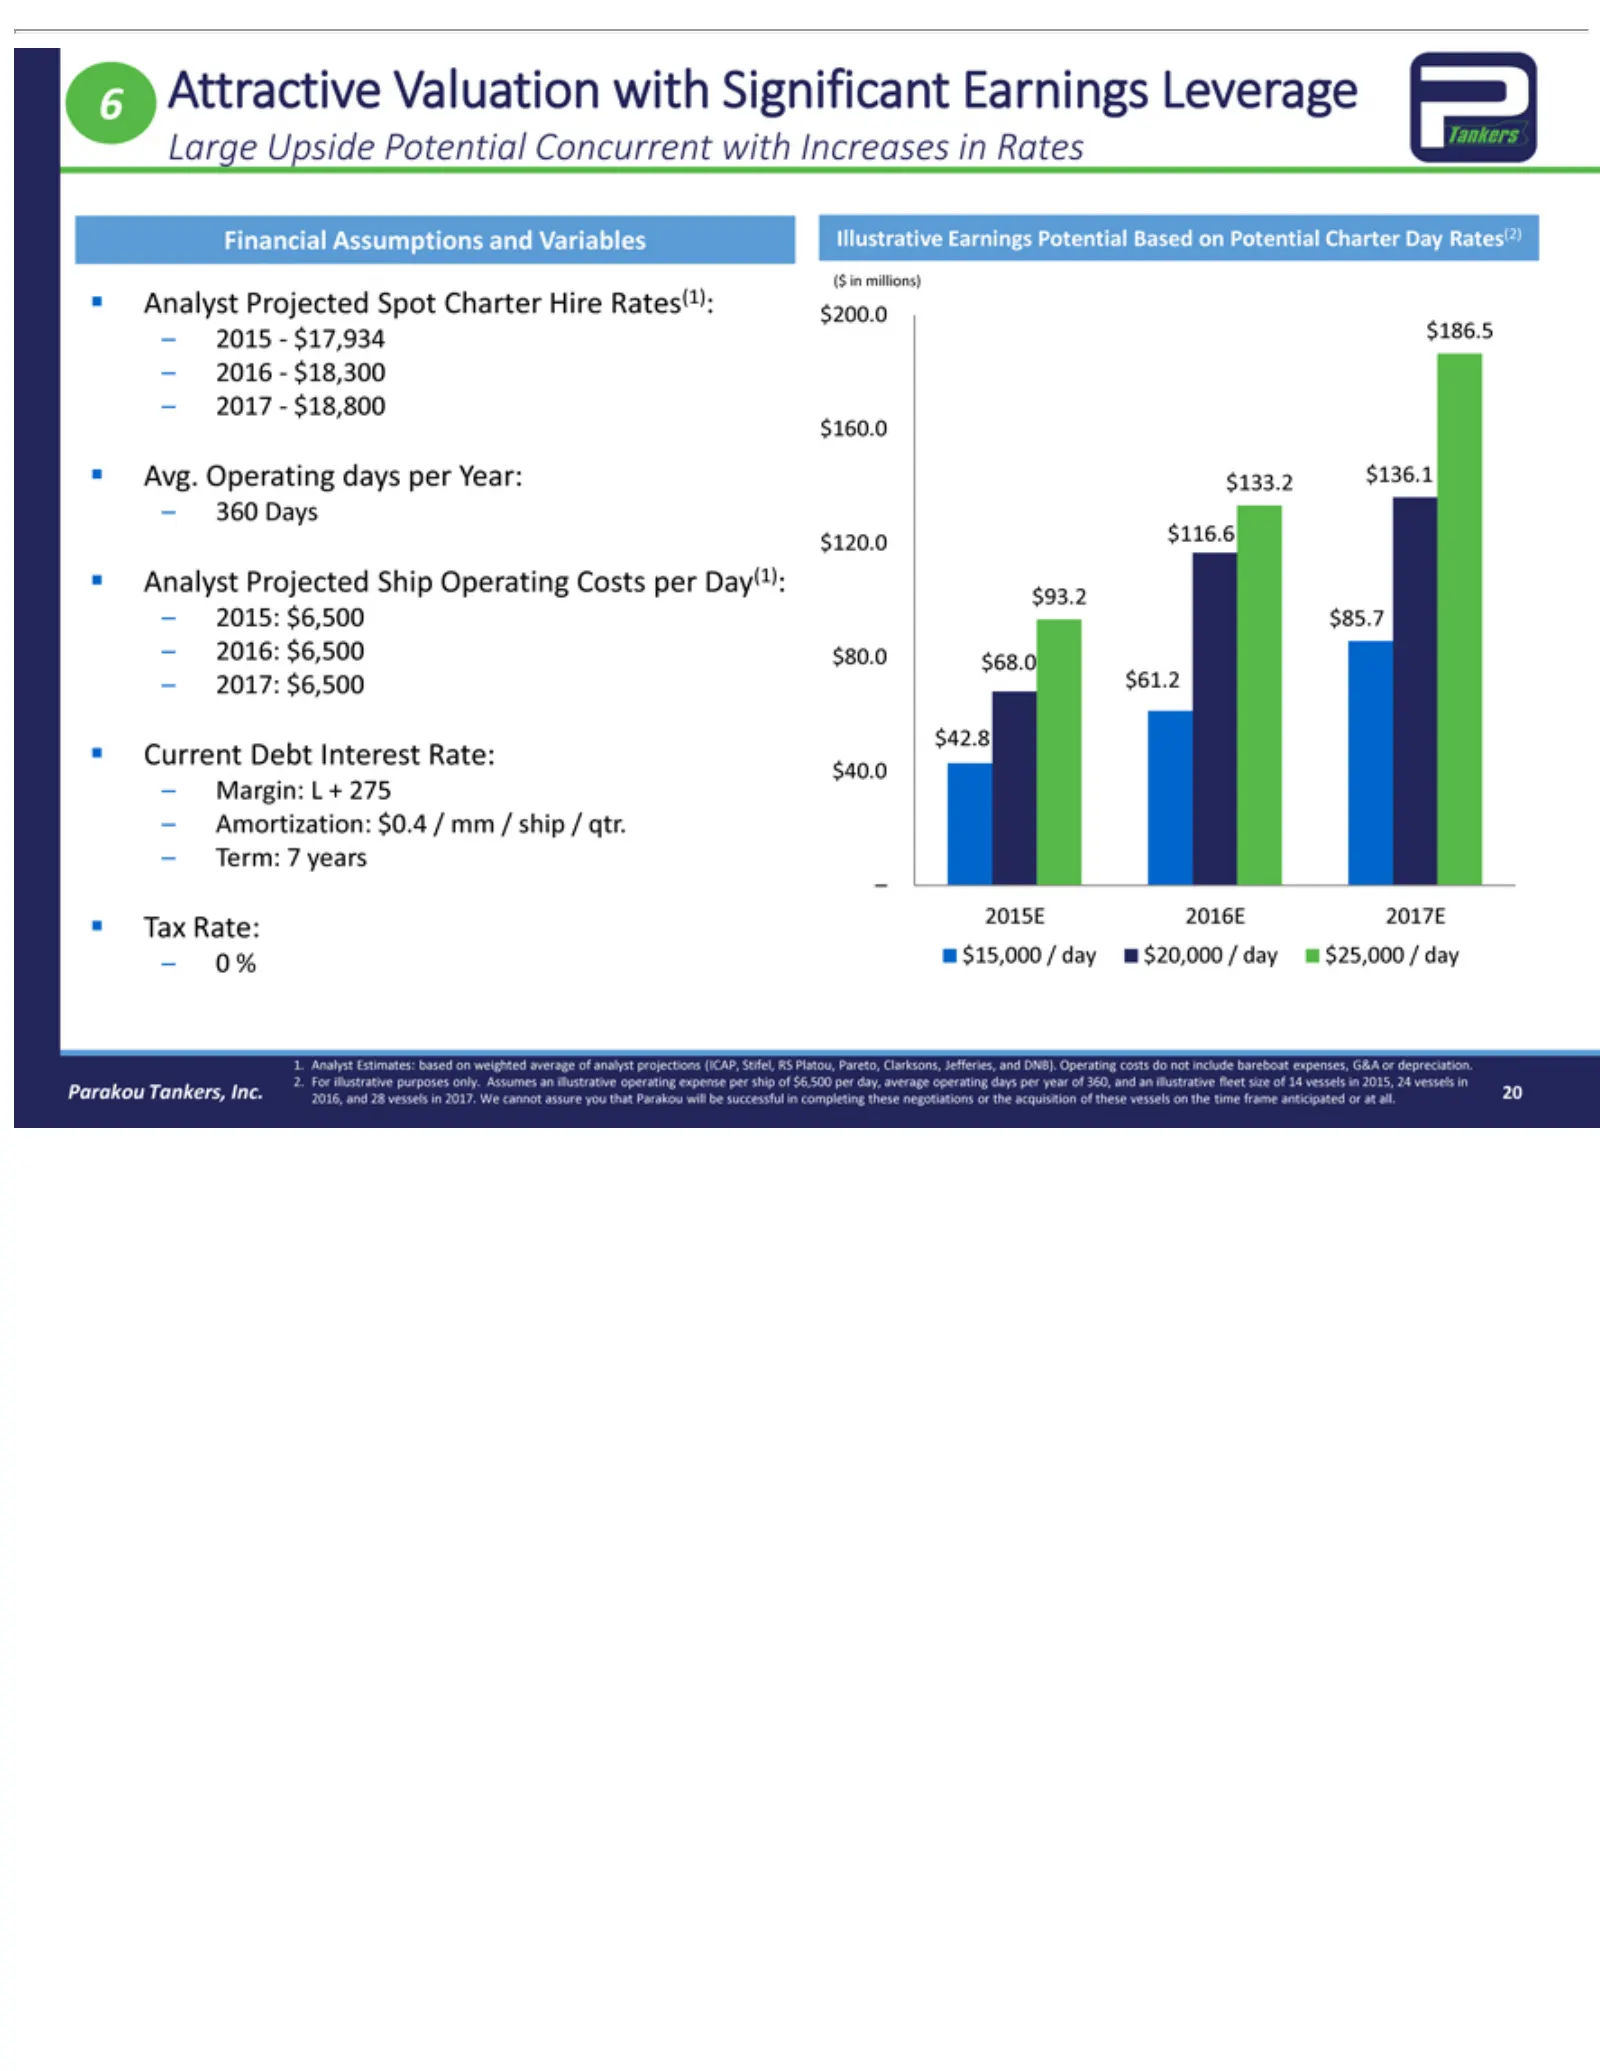
Slide 20: Large Financial Upside Potential with Significant Operating Leverage
6 ax Large Financial ($ Avg. $160.0 $120.0 Analyst Current $40.0 –T 1. 2. 28 Parakou 20Attractive Amortization: Term: 2015—$17,934 2016—$18,300 2017—$18,800 360 2015: 2016: 2017: 0Margin: Analyst For in vessels % Rate: millions) Operating Days Upside $15,000 illustrative $116.6 $6,500 Debt 7Projecte
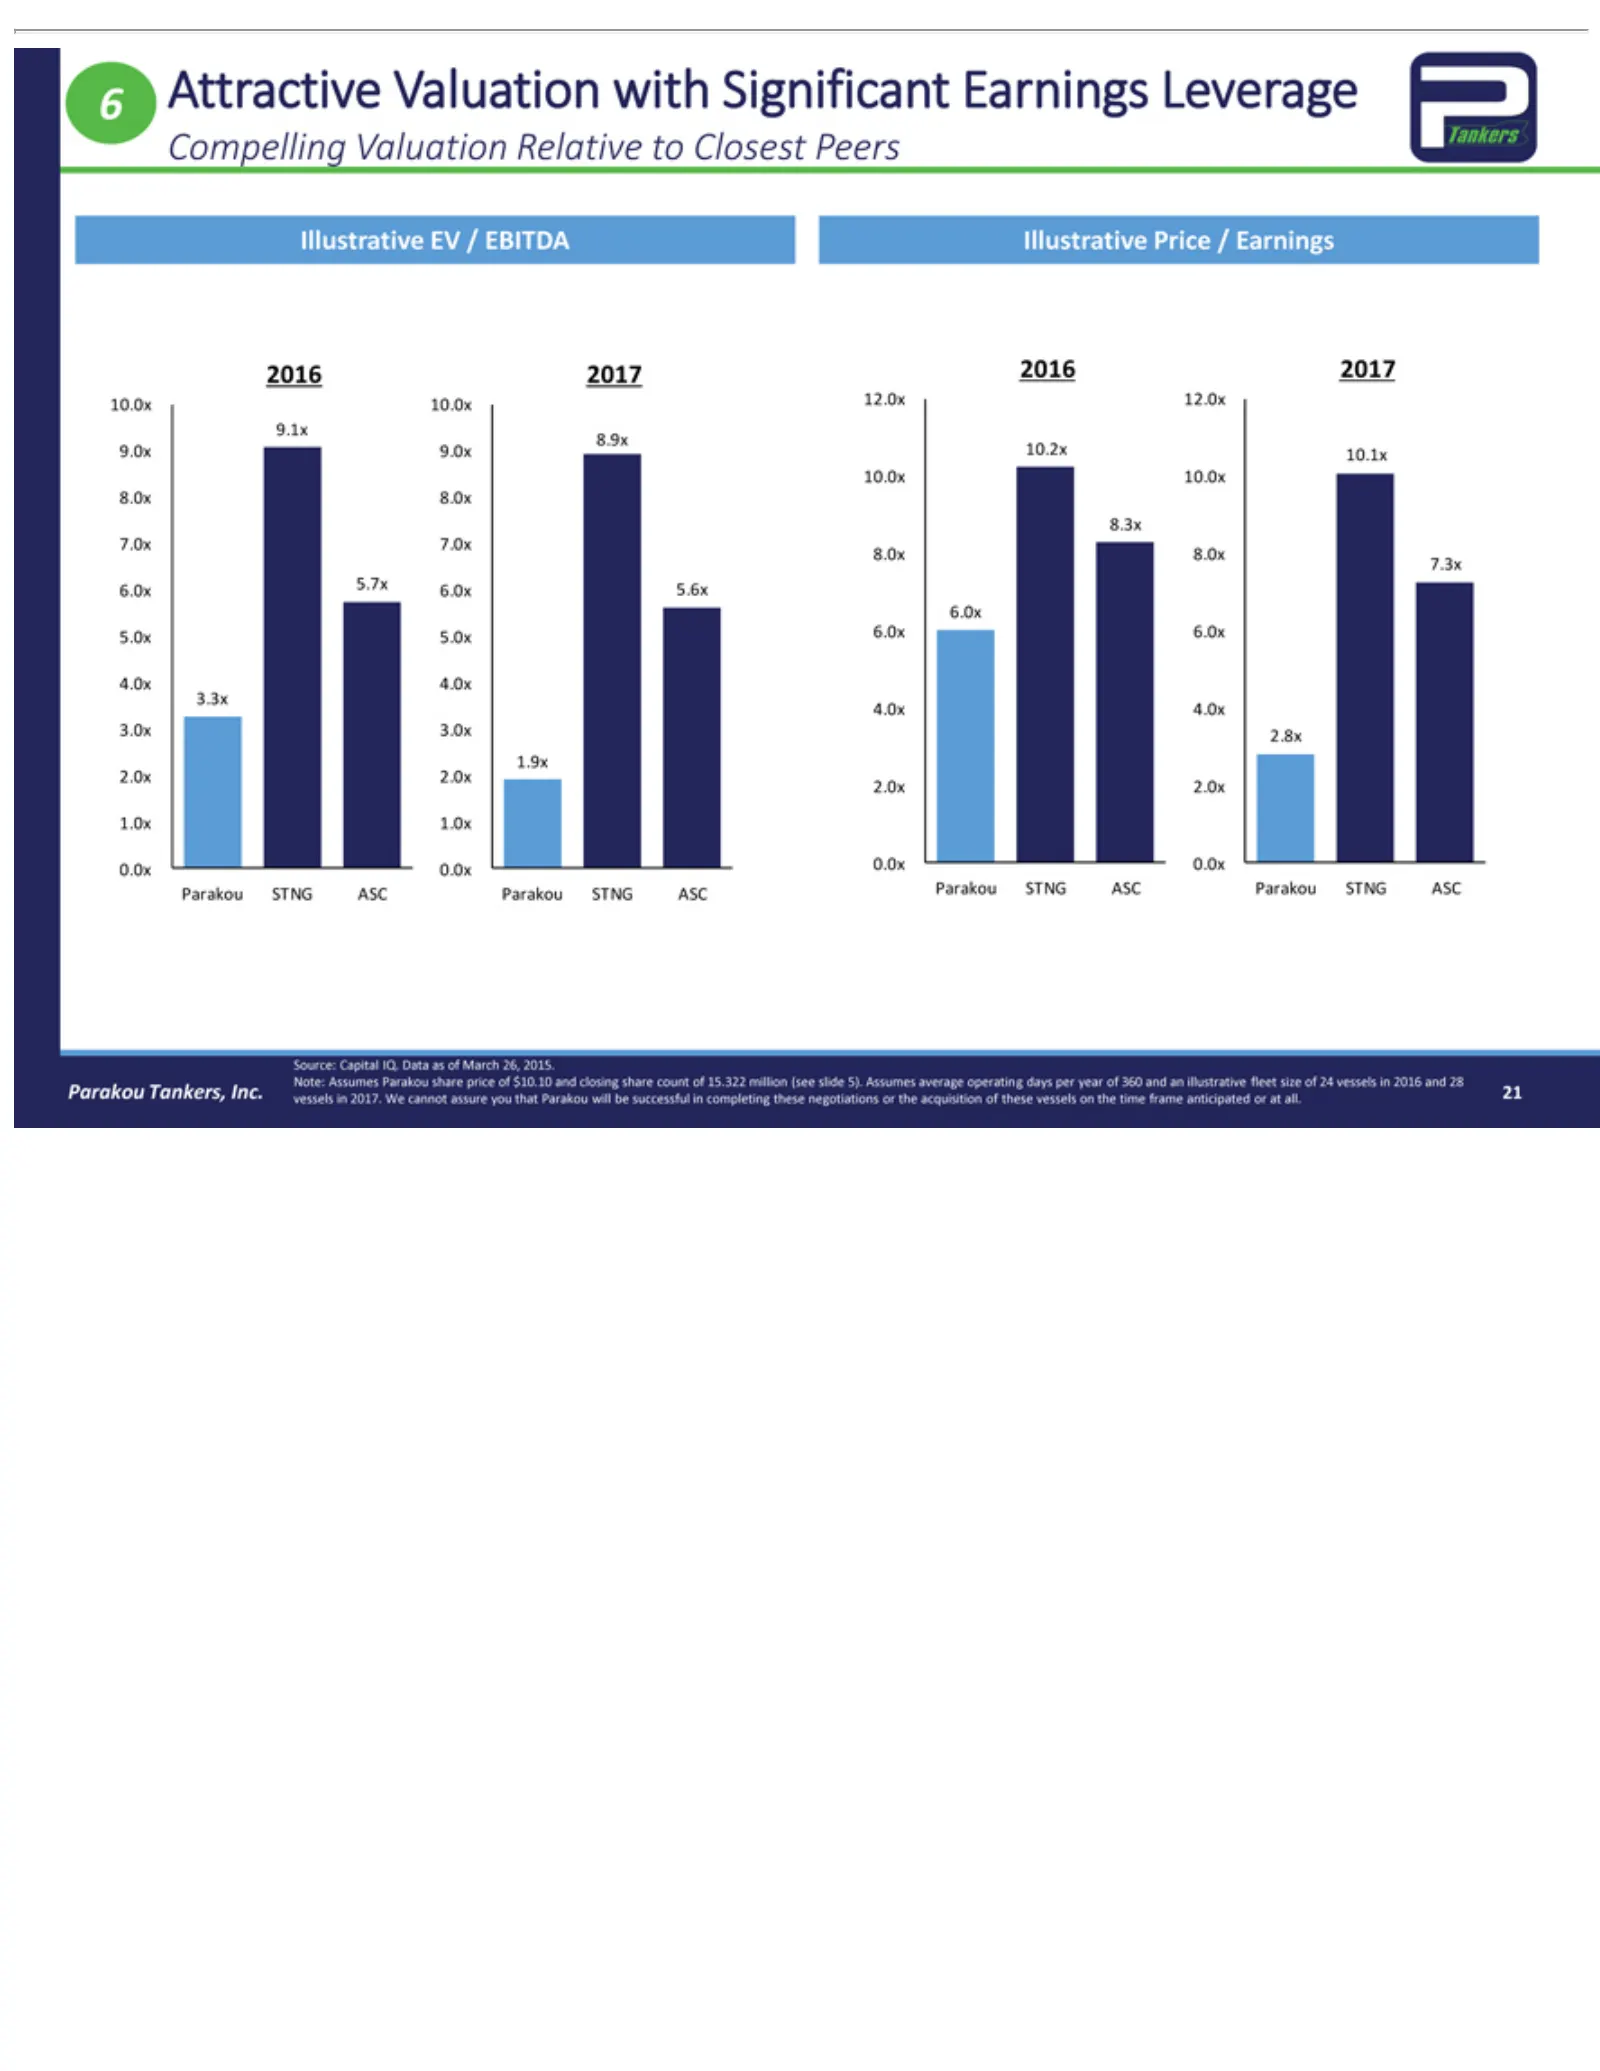
Slide 21: Attractive Valuation Relative to Closest Peers
6 Attractive Compelling Illustrative 2016 9.0x 8.9x 9.1x 10.0x 7.0x 8.3x 8.0x 5.0x 6.0x 4.0x 3.3x 3.0x 2.0x 1.9x 1.0x 0.0x Source: Note: 2017. Parakou 21 9.0x 7.0x 8.0x 5.7x 5.0x 4.0x 3.0x 2.0x 1.0x 0.0x 2017 Assumes We 10.0x Capital Tankers, STNG 10.2x 7.3x 6.0x 2.8x 2.0x 0.0x cannot 2016 EV Valuat
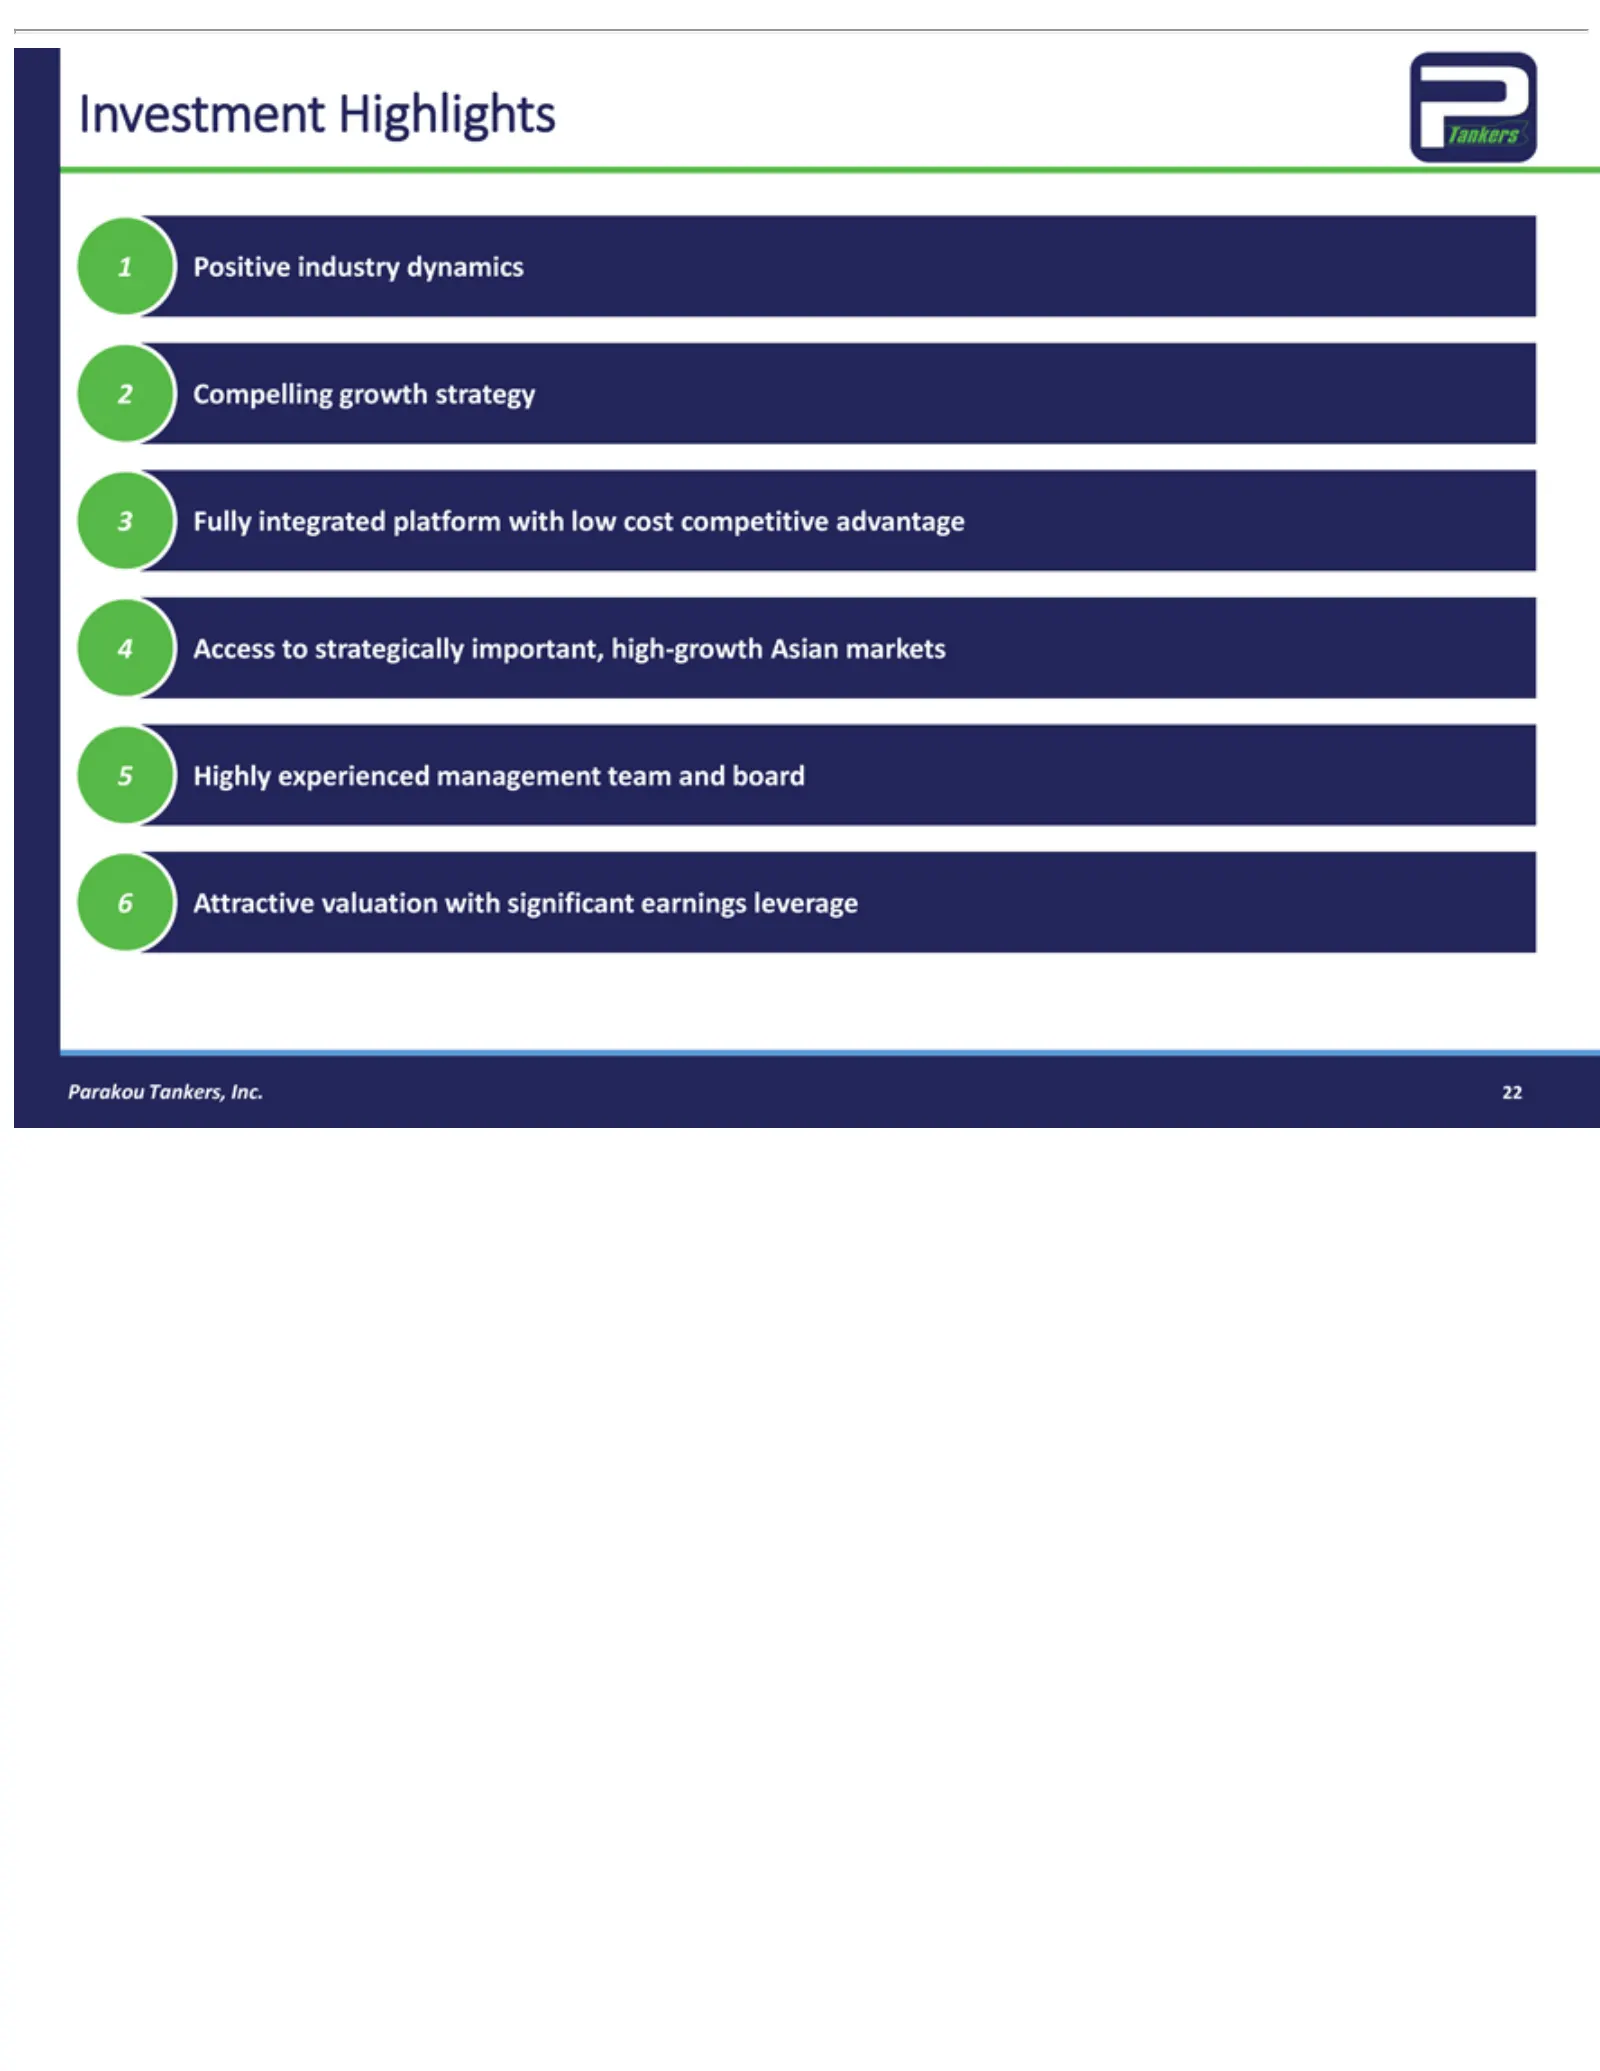
Slide 22: Investment Highlights
654321Investment Parakou 22Access Attractive Positive Compelling Fully Highlyintegrated Tankers, to experienced industry Highlights strategically valuation growth Inc. platform dynamics strategy management with important, significant with lowteam high-growth cost earnings and competitive board lever
Slide 23: Appendix
Parakou Tankers, Inc. Appendix 23
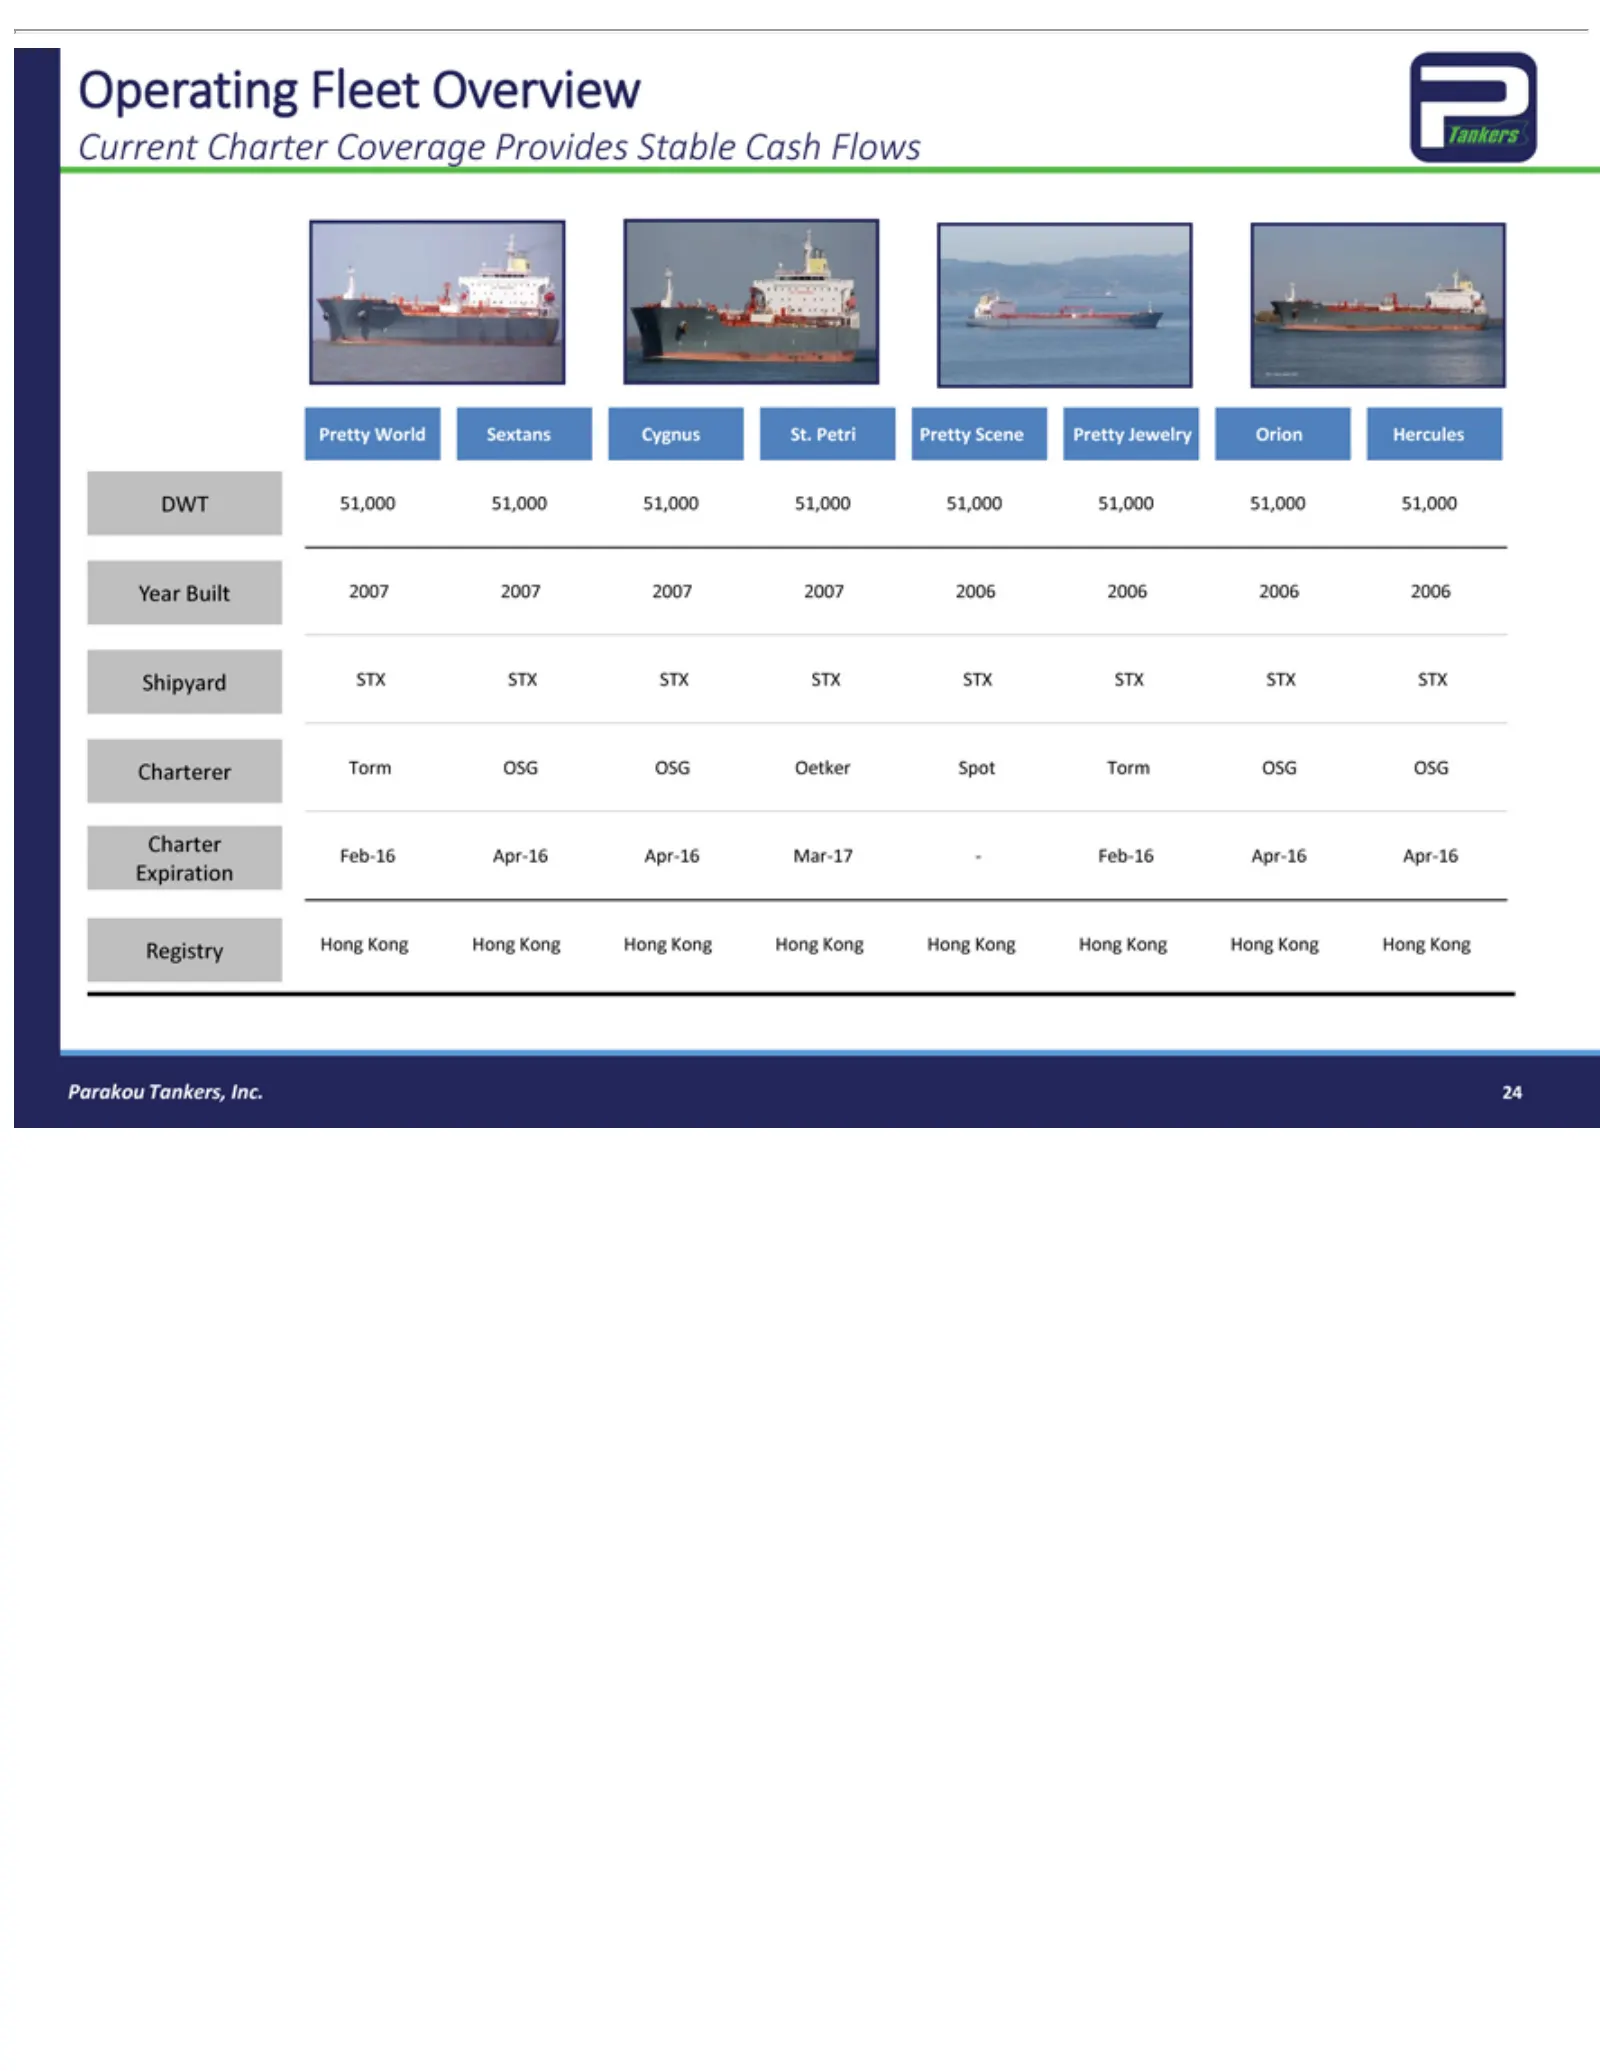
Slide 24: Current Operating Fleet Overview
Operating Current Pretty DWT Year Shipyard Charterer Charter Registry Expiration Parakou 24 Built 51,000 World Feb-16 Charter Tankers, Hong STX Torm Fleet 2007 Sextans 51,000 STX Kong Apr-16 OSG Overview Coverage 2007 Inc. STX 51,000 Hong OSG Cygnus 2007 Apr-16 STX Provides Oetker Kong 2007 51,000 S
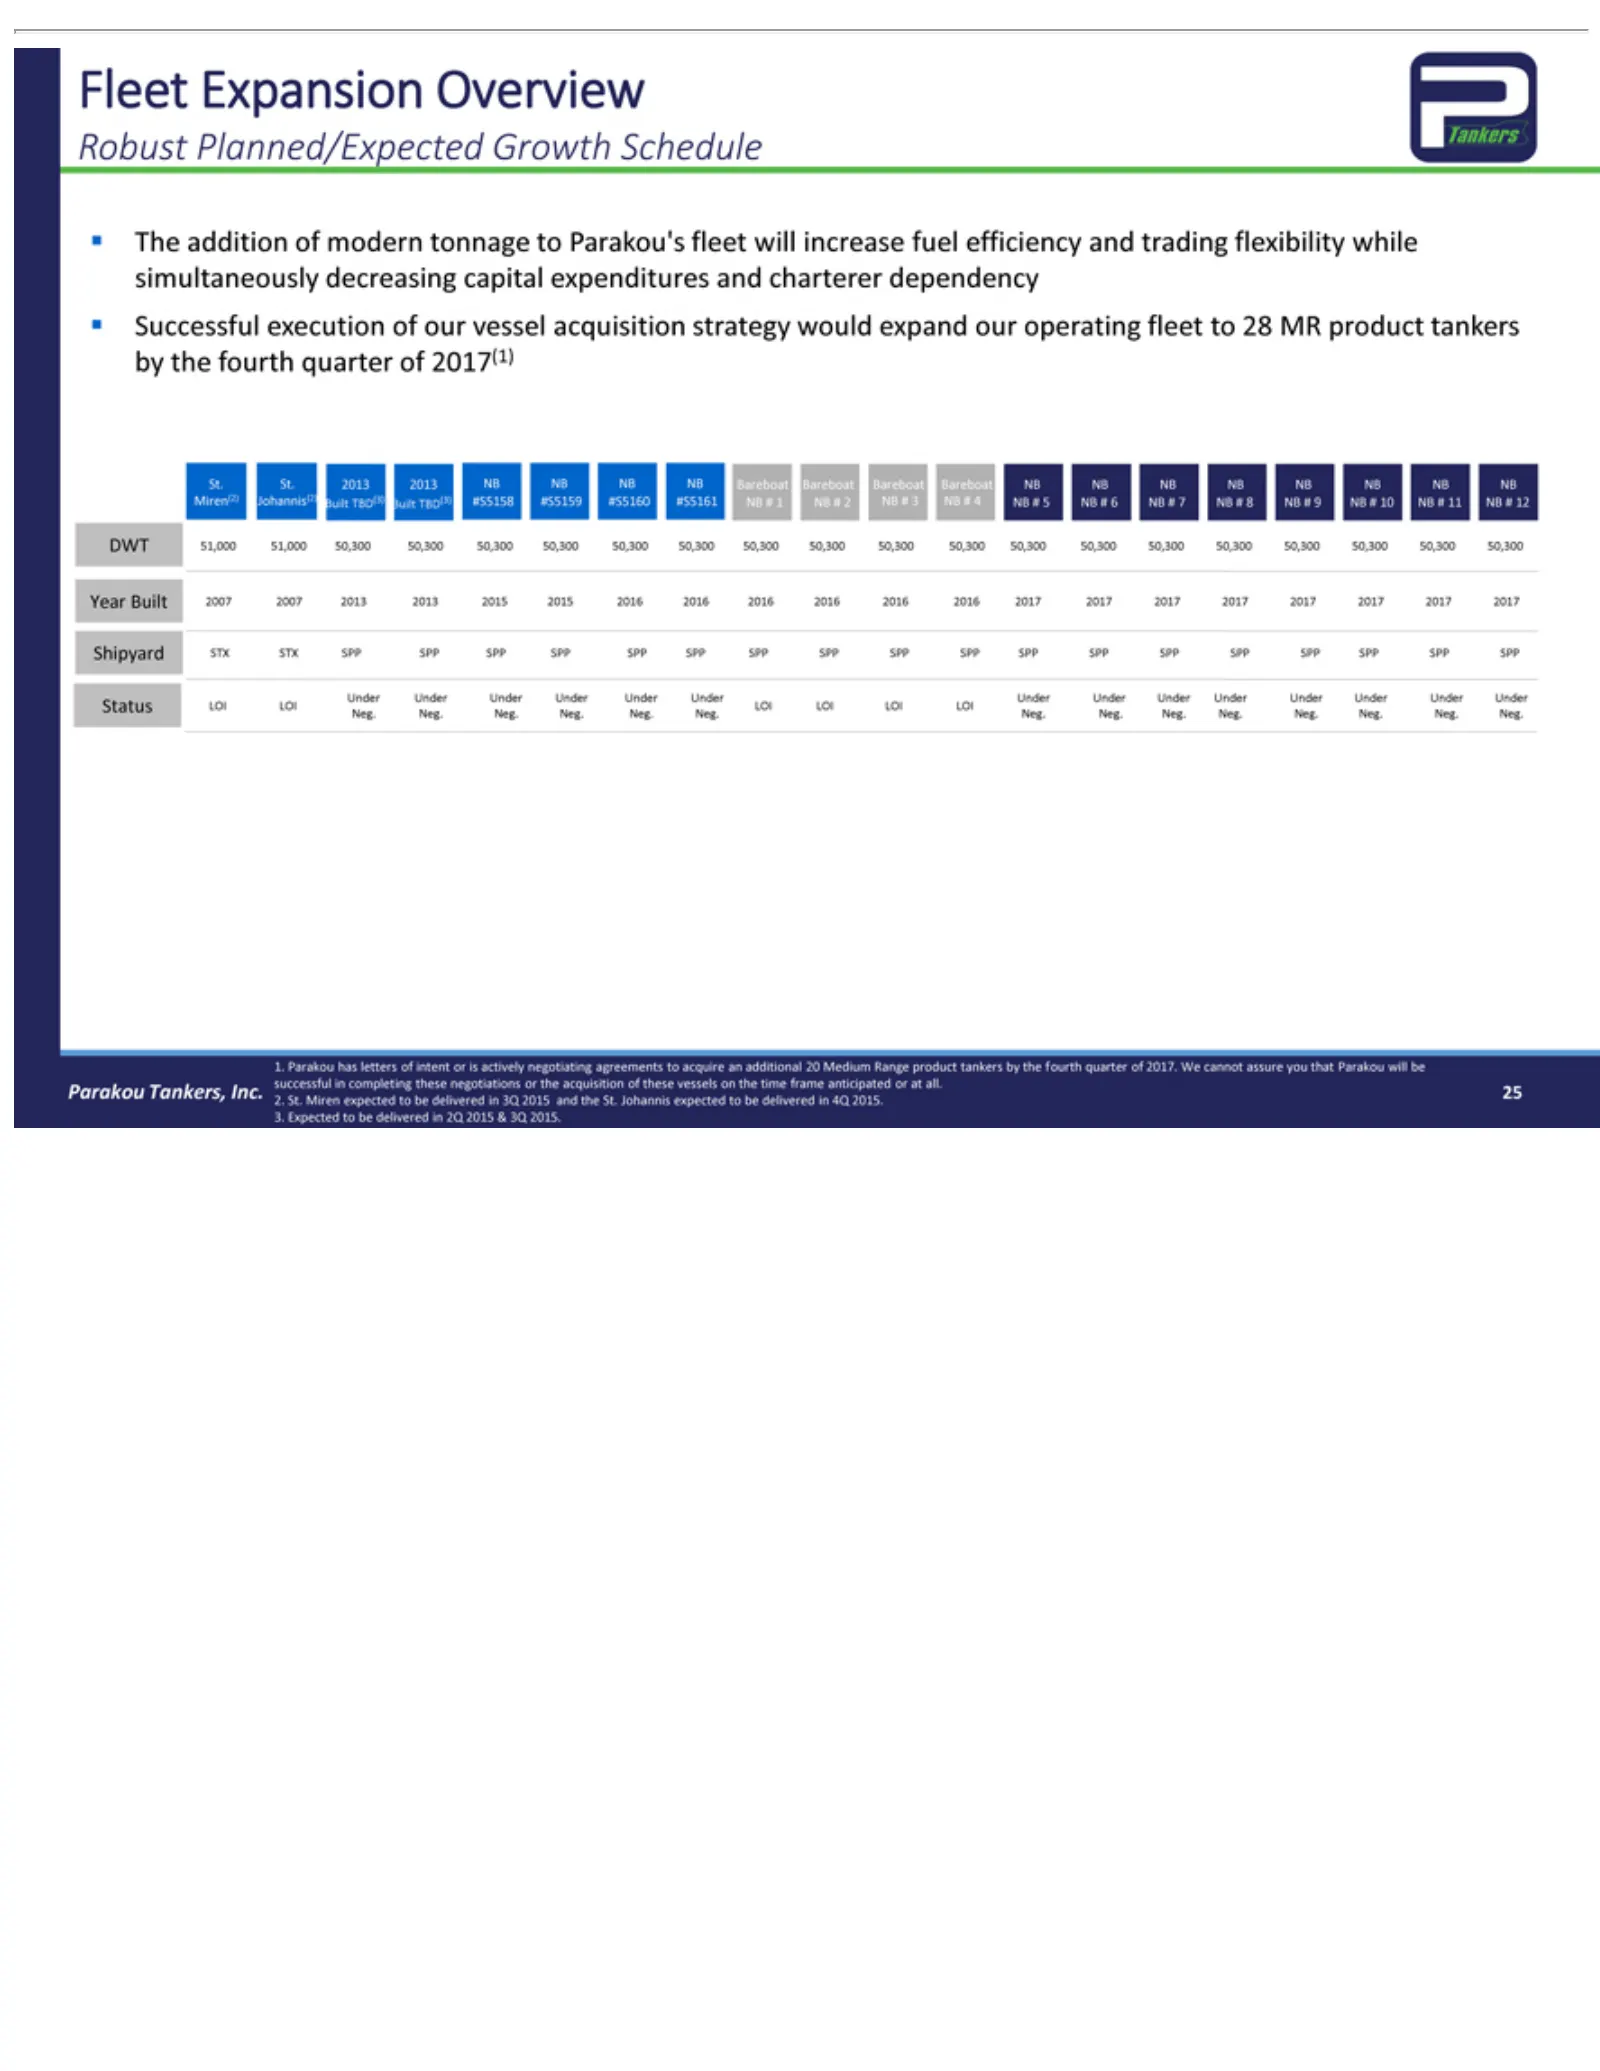
Slide 25: Robust Fleet Expansion: Growth Schedule
Fleet Robust The acquisition St. Miren(2) DWT Year Shipyard Under Status Neg. 1. completing 2. 3. Parakou 25 Parakou St. Expected St. addition Built Neg. Expansion Miren 51,000 2013 LOI Under Planned/Expected Tankers, Johannis(2) STX Neg. 2007 has LOI strategy these 2013 to expected of Under 51,000
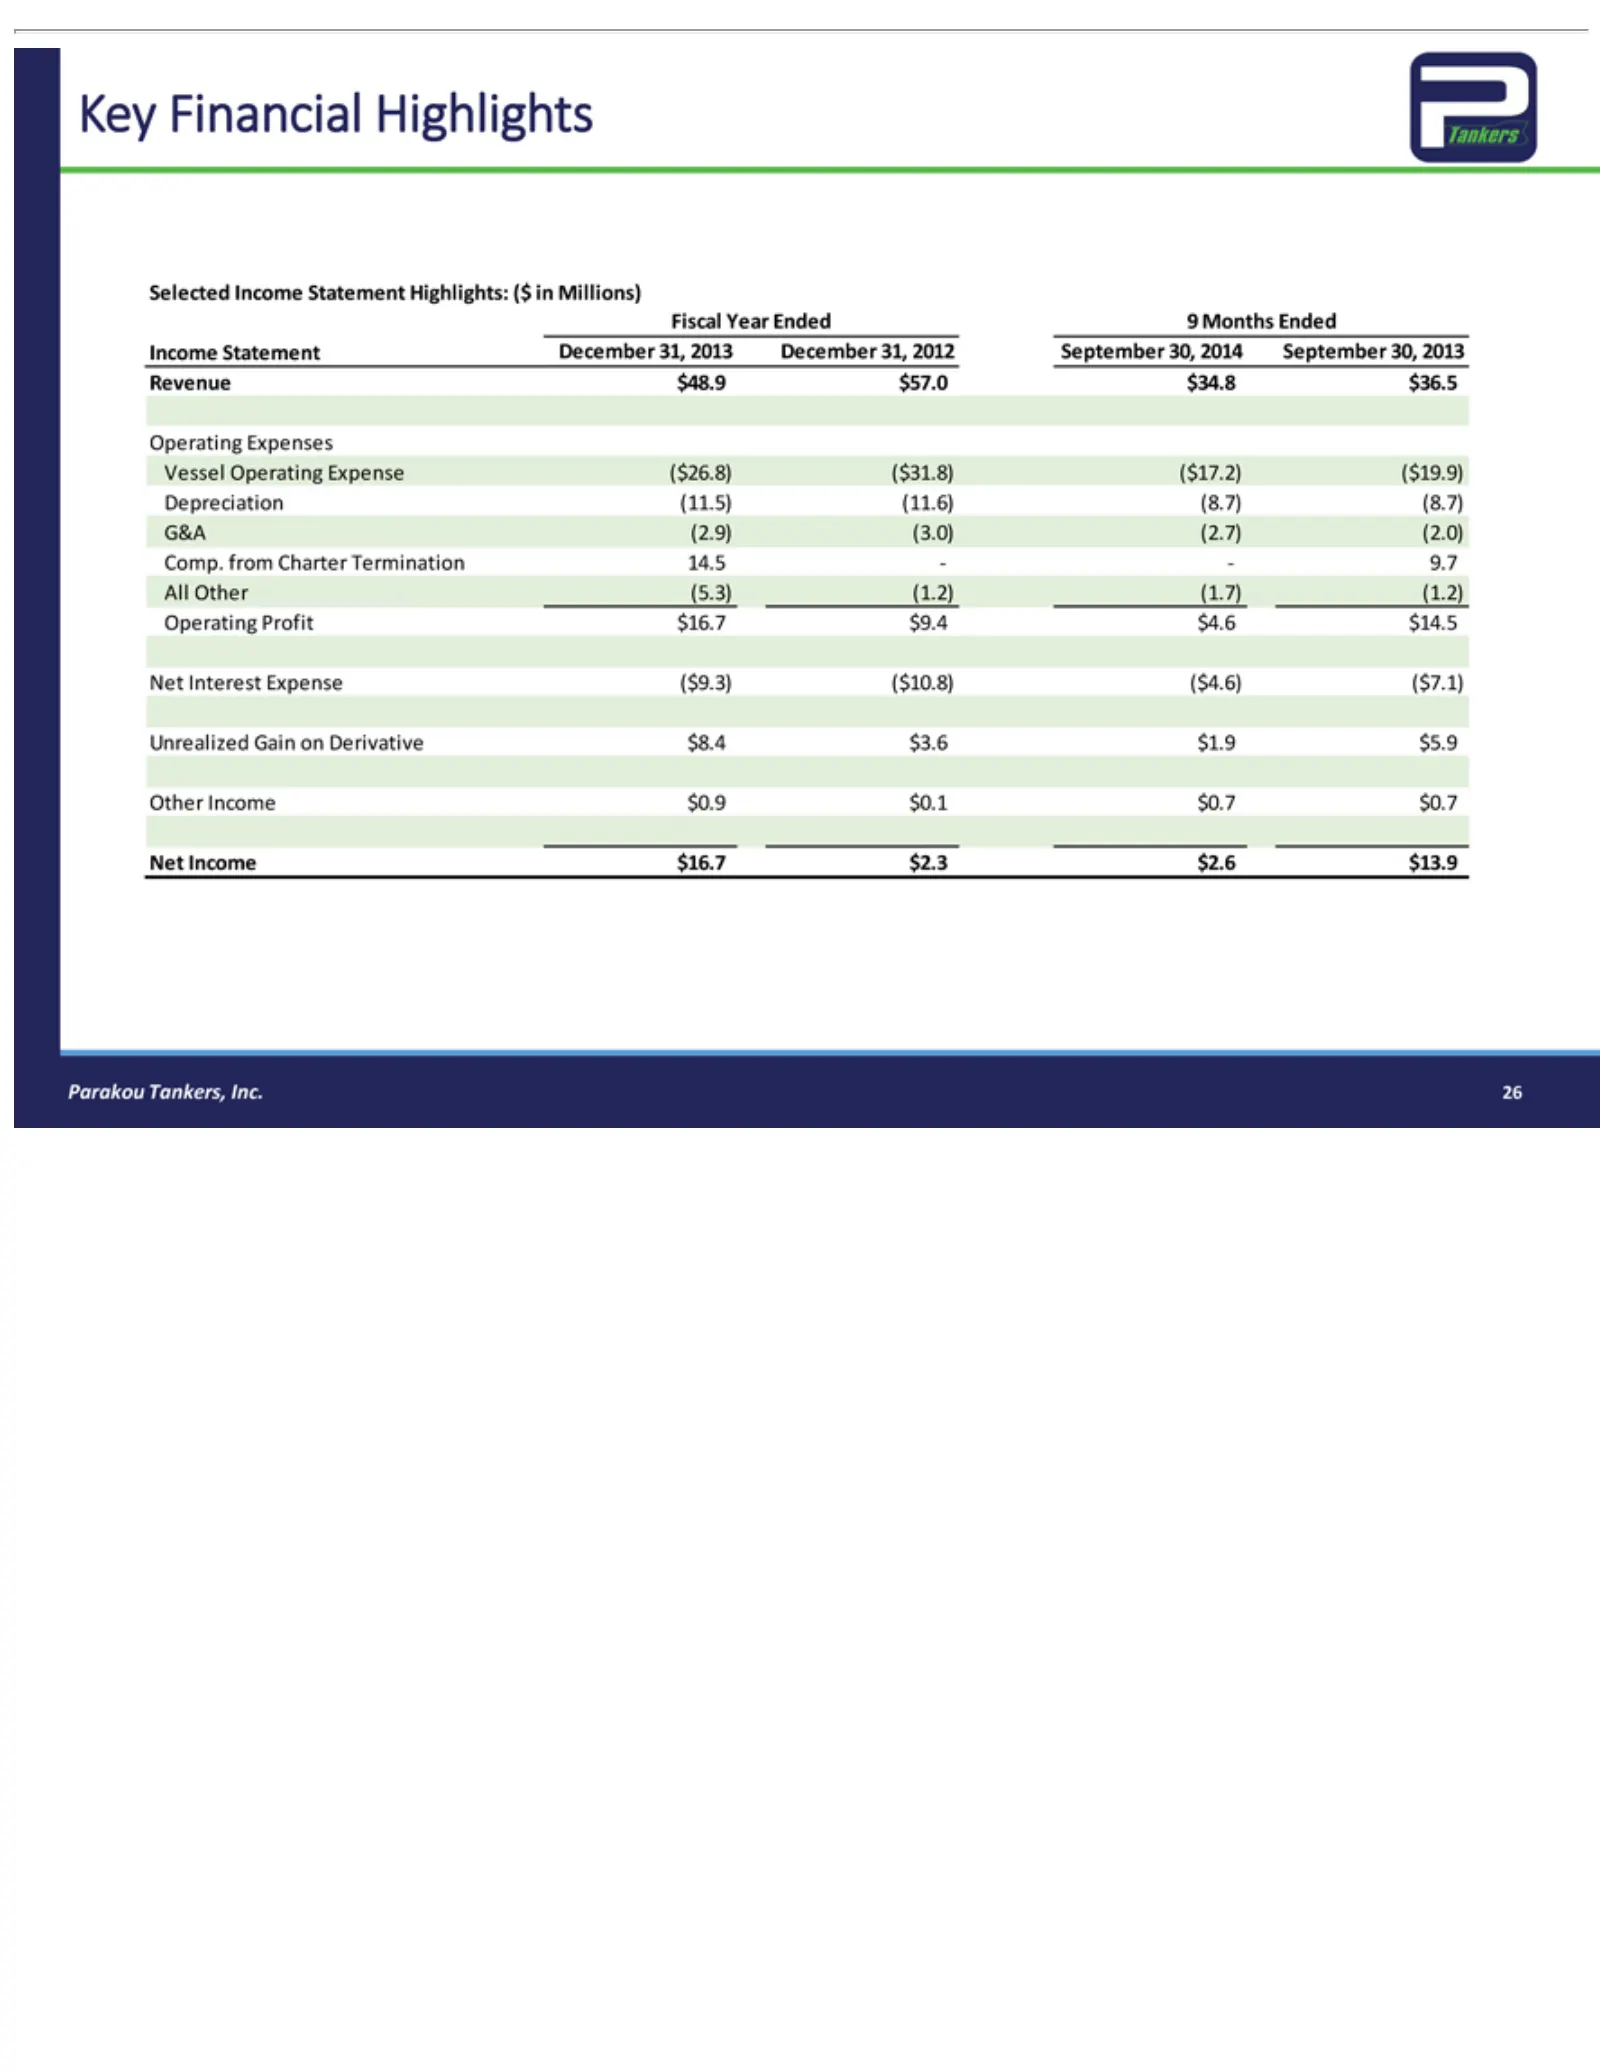
Slide 26: Selected Income Statement Highlights
KeyOther(5.3)(1.2)(1.7)(1.2) Selected Fiscal Income Revenue Vessel Comp. G&A(2.9)(3.0)(2.7)(2.0) Depreciation(11.5)(11.6)(8.7)(8.7) All Operating Unrealized Other Net Parakou 26 Interest Income Financial Income Year Operating from Statement Tankers, Income $48.9 Expenses Profit Gain Ended Expense($9
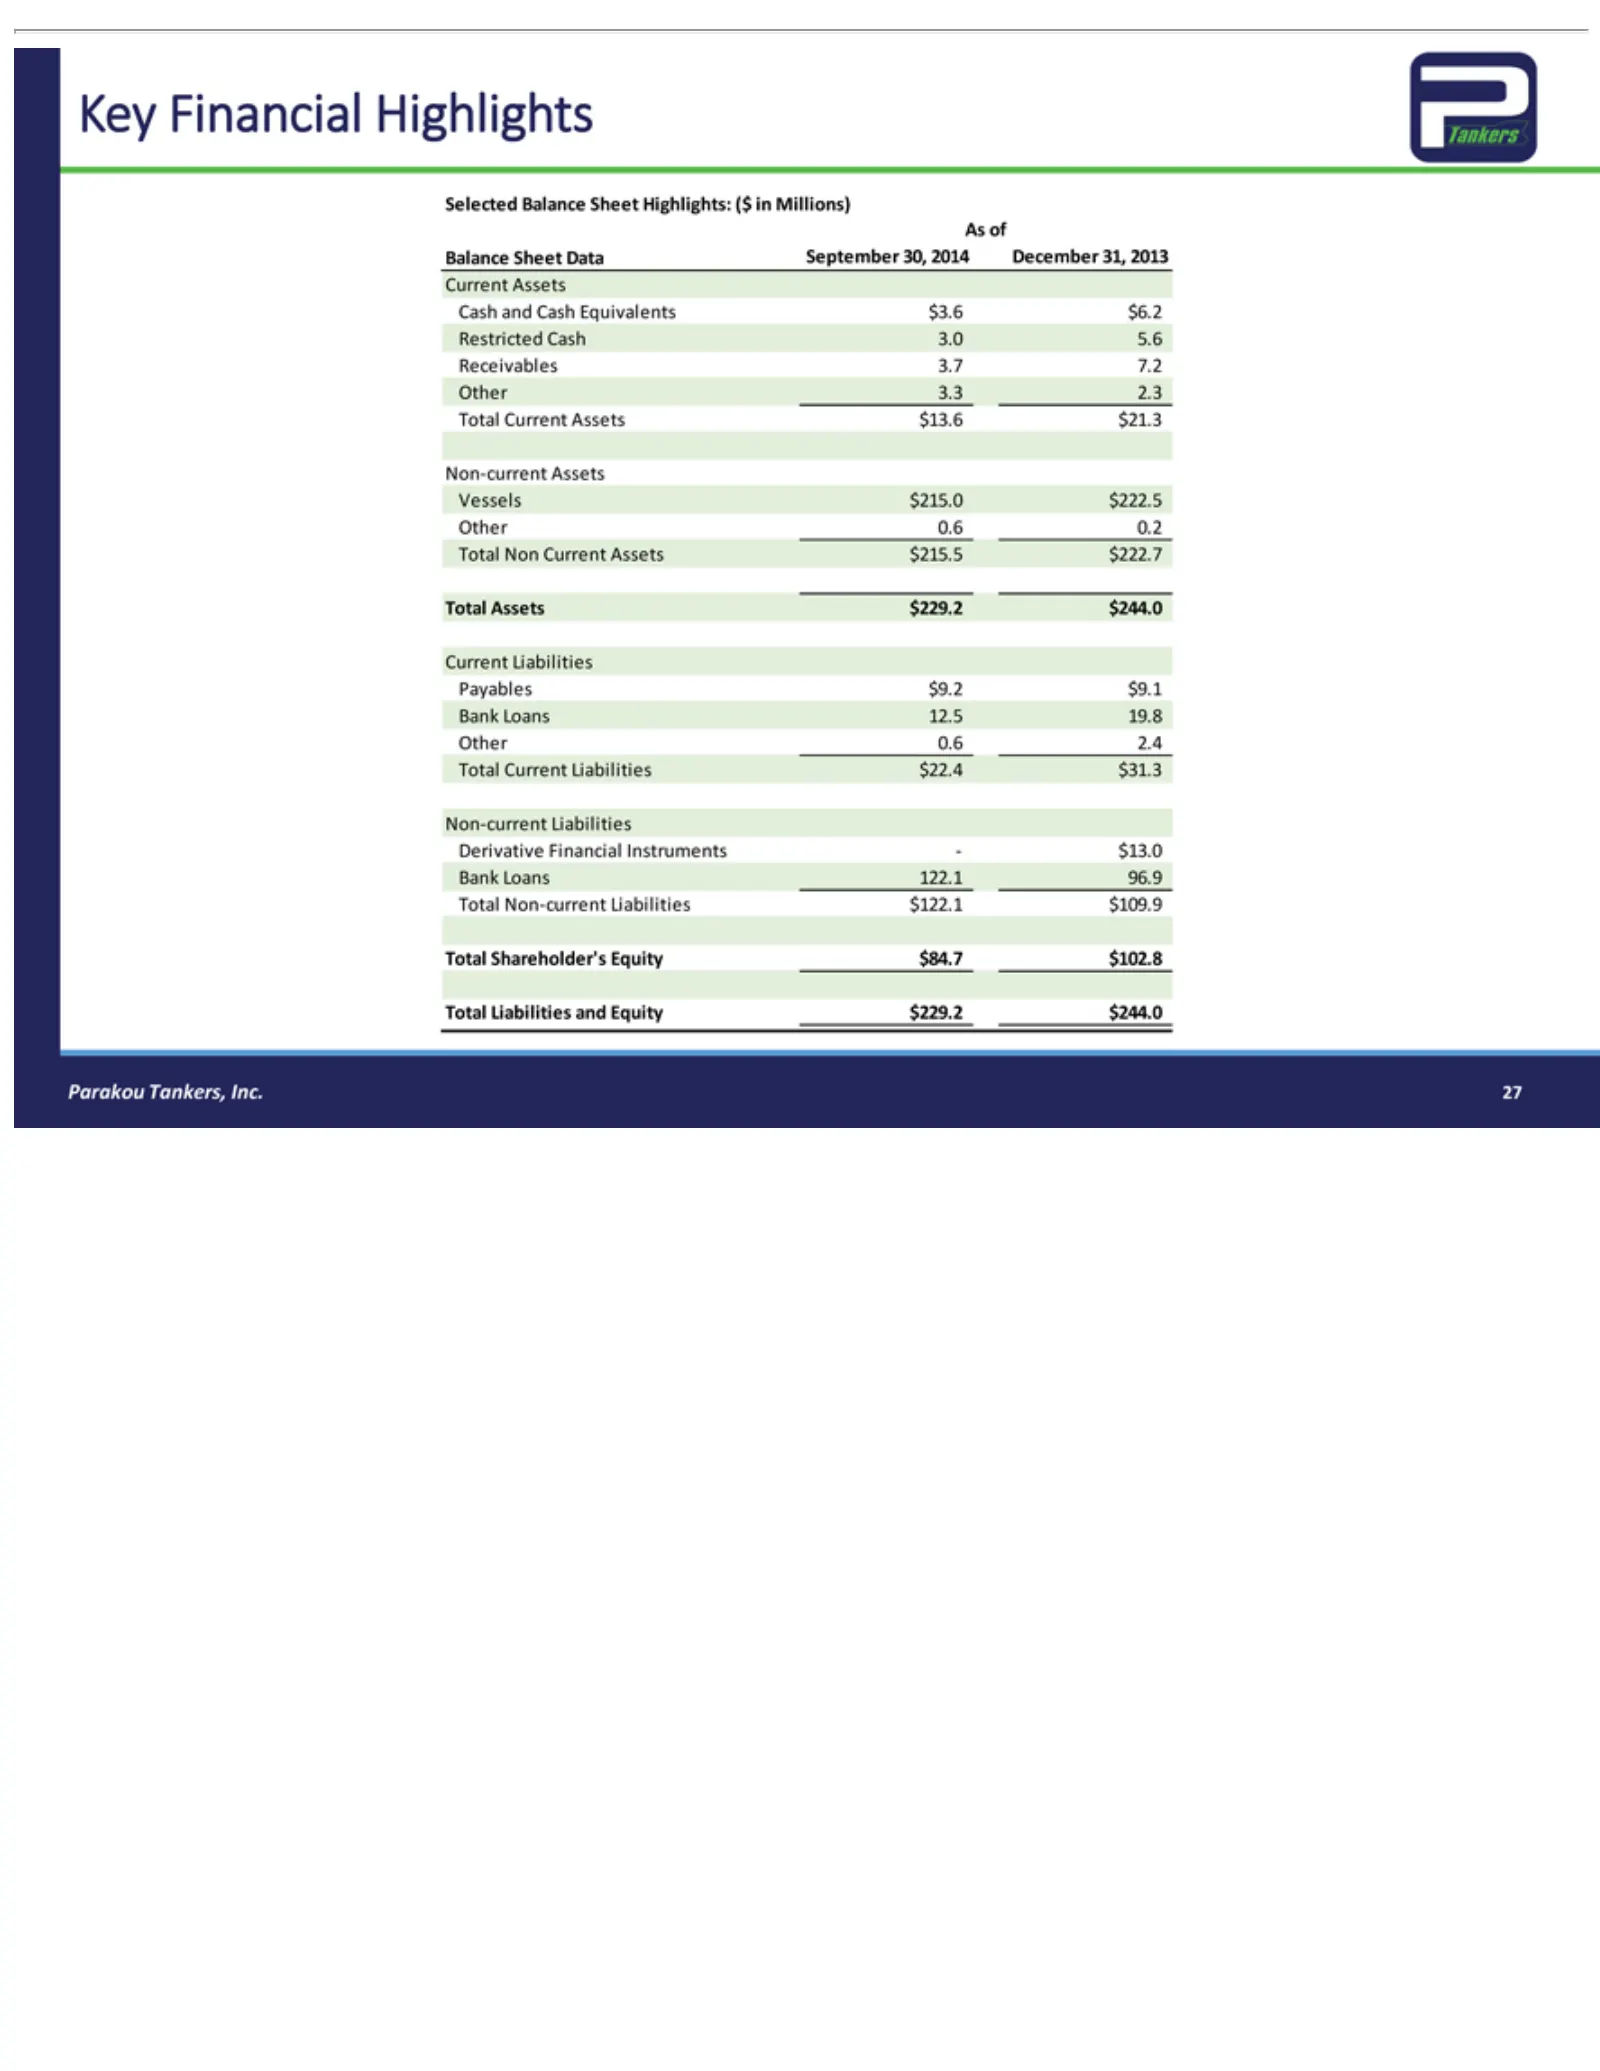
Slide 27: Selected Balance Sheet Highlights
KeyofFinancial Selected As Balance Cash Restricted Receivables Vessels Current Payables Other Non-current Derivative Bank Total Parakou 27 Assets and Non Current Non-current Shareholder’s Liabilities Loans 3.3 0.6 $215.0 Assets Liabilities Sheet Tankers, Balance $9.2 Cash 2.3 0.2 2.4 Current Cash Fi
Source: SEC EDGAR · 8-K filed Mar 30, 2015
More decks from Cambridge Capital Acquisition Corp
 SPAC Merger (November 2015)32 slides · Nov 30, 2015
 SPAC Merger (November 2015)31 slides · Nov 16, 2015
 SPAC Merger (September 2015)24 slides · Sep 30, 2015
 SPAC Merger (September 2015)22 slides · Sep 23, 2015
 SPAC Merger (September 2015)31 slides · Sep 23, 2015
 SPAC Merger (March 2015)27 slides · Mar 4, 2015