Maverick Tube — Investor Presentation (March 2005)
30 slides from Maverick Tube's investor presentation, Mar 2, 2005
Slide 1: Investor Presentation
Investor Presentation Maverick is a leading provider of products and services for the drilling, completion, and production cycles of oil and natural gas. Maverick has demonstrated a history of successful organic and strategic growth, providing a solid foundation for future international expansion an

Slide 2: Forward Looking Statements
These slides accompany an oral presentation by Maverick Tube Corporation which, except for the historical information, contain forward-looking statements representing our expectations or beliefs about future events and financial performance. Forward-looking statements are subject to known and unknow

Slide 3: Non-GAAP Financial Matters
Non-GAAP Financial Matters In this presentation, Maverick has included certain financial measures (EBITDA, EBITDA Margin and Cash Flow), which are not calculated in accordance with generally accepted accounting principles (GAAP). You should not consider these measures in isolation from or as a subst

Slide 4: Investment Considerations
Investment Considerations Market leader in oilfield tubing and casing, coiled tubing, line pipe, coiled line pipe, couplings and other custom-engineered pipe products used in oil and natural gas exploration, production, and transmission Proven ability to grow, with a solid foundation for further glo
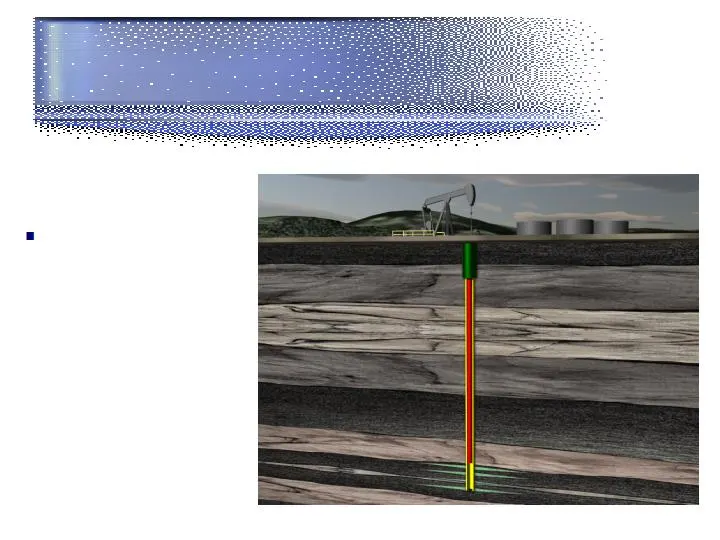
Slide 5: Drilling & Completion Products and Services
Drilling & Completion Products and Services Casing and tubing products with couplings
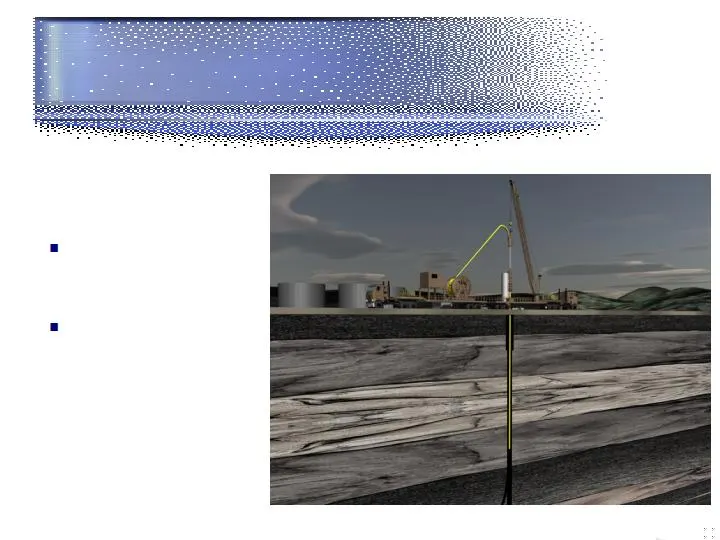
Slide 6: Drilling & Completion Products and Services
Drilling & Completion Products and Services Coiled tubing drill strings Coiled tubing for well completion
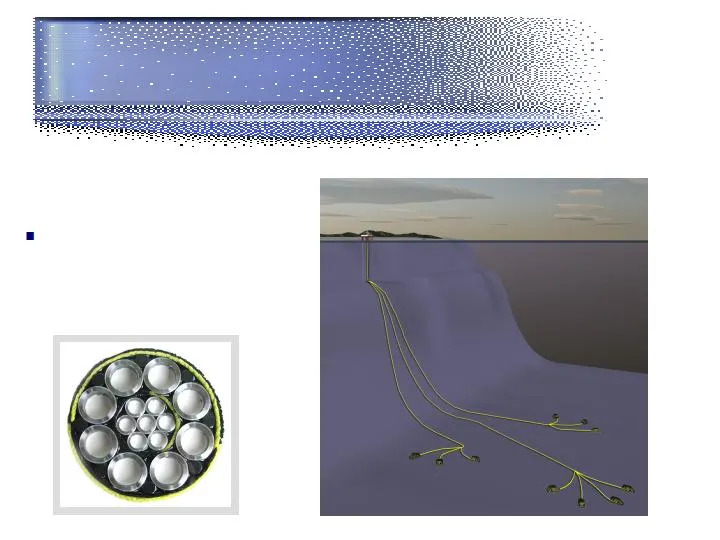
Slide 7: Drilling & Completion Products and Services
Drilling & Completion Products and Services Zinc coated coiled umbilical tubing
Slide 8: Transmission
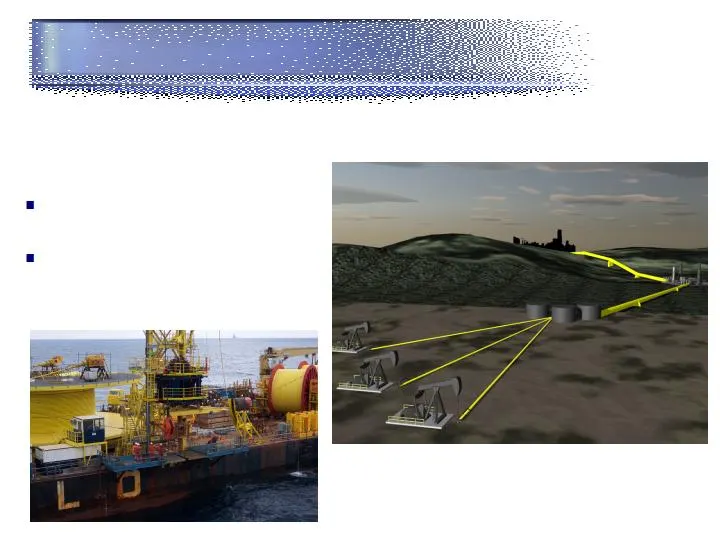
Transmission ERW jointed line pipe Coiled line pipe
Slide 9: Production Products & Services
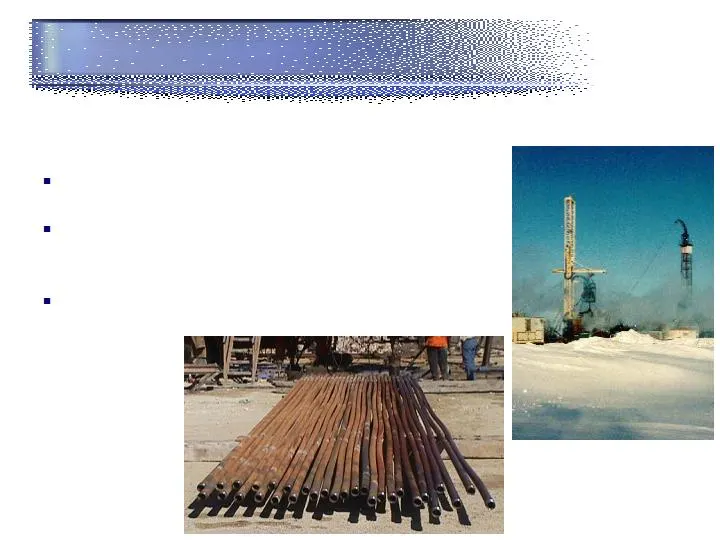
Production Products & Services Coiled tubing for well workover Coiled tubing repair services in U.S., Canada, and Scotland ERW tubing for well workover
Slide 10: Other Products and Services
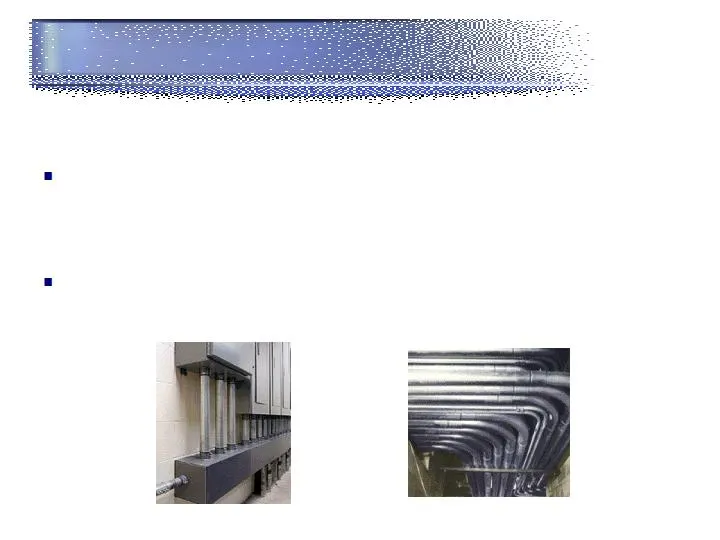
Other Products and Services Major supplier of steel electrical conduit and other industrial tubing products used in new non-residential construction and other applications driven by general economic growth Conduit consolidation
Slide 11: Global Reach
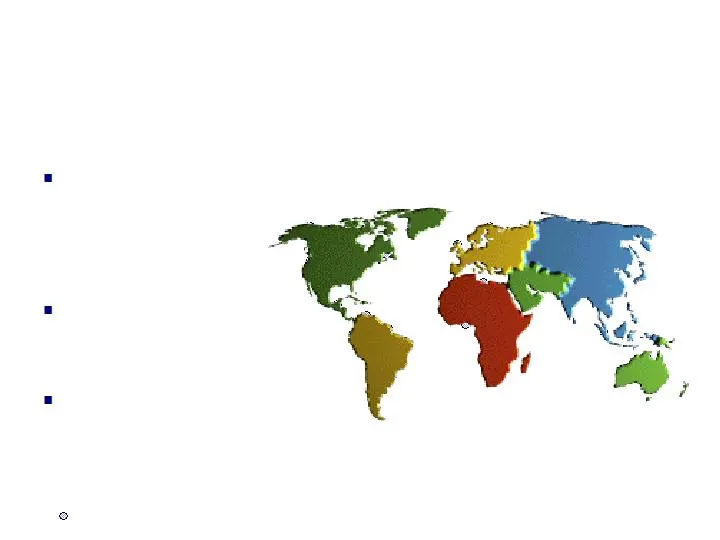
Global Reach Manufacturing, sales, and/or service locations in 5 countries around the world 70% of revenue from United States in 2004 Extensive worldwide customer base Denotes locations of significant current projects in progress

Slide 12: Leadership in Products & Services
Leadership in Products & Services Drilling and Completion Products & Services Coiled tubing products ERW API, CSA and custom-engineered oil country tubular goods (OCTG) in North America API couplings in North America Production Products Coiled tubing products ERW tubing products in North America Tra
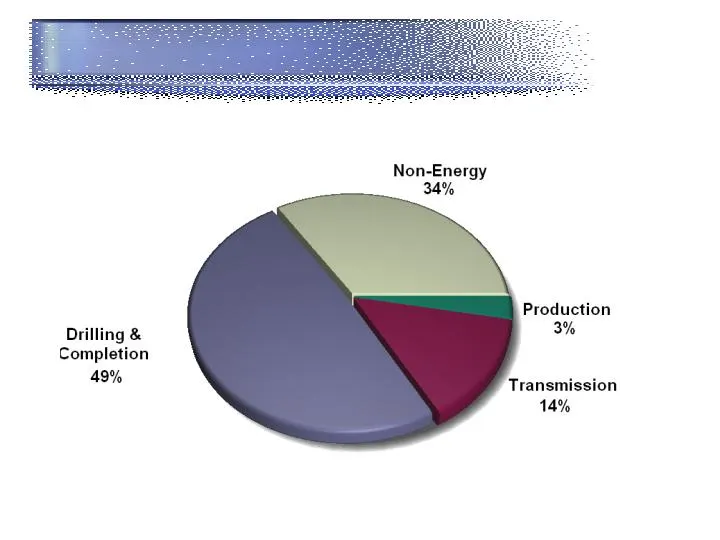
Slide 13: Revenue Source
Revenue Source Source: Historical Data; year ended December 31, 2004

Slide 14: Industry Trends Favor Maverick
Industry Trends Favor Maverick Continued strength in North American energy market for the near to mid-term New drilling and infrastructure, especially in Canada Workovers – U.S. and Canada Natural gas production relatively flat in North America despite record gas drilling Growth in LNG activity worl

Slide 15: Long-Term Oil Service Fundamentals
Long-Term Oil Service Fundamentals Worldwide oil demand to increase by 1.6% per year from 82 mb/d today to 121 mb/d in 2030 Worldwide natural gas demand forecast to double by 2030 E&P expenditures in 2030 required to meet this challenge are 159% percent above 2004 levels (in 2004 dollars) Source: IE
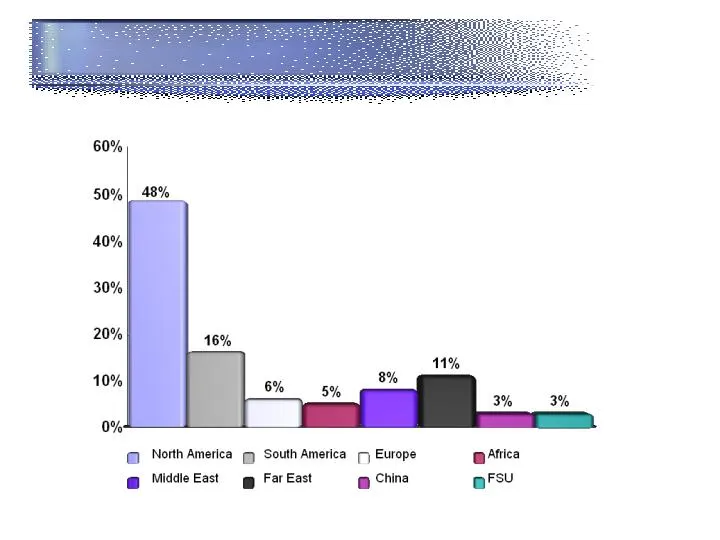
Slide 16: E&P Expenditures by Region
E&P Expenditures by Region Source: Spears & Associates

Slide 17: Top Reserve Holders
Top Reserve Holders MMBOE NORTH AMERICA ExxonMobil 21,203 x ChevronTexaco 11,759 x ConnocoPhillips* 7,848 x Suncor Energy Inc. 3,744 x Anadarko* 2,513 x Occidental Petroleum* 2,470 x EnCana* 2,359 x CNR 2,118 x Imperial Oil Ltd. 2,079 x Burlington* 1,879 x Unocal 1,759 x Devon Energy 1,428 x Husky E

Slide 18: Long-Term Corporate Goals
Long-Term Corporate Goals Have the best safety record in the oil service industry Continue our history of profitable organic and strategic growth Expand our geographic reach and broaden our portfolio of value-added oil service products Consistently generate superior returns on capital employed in al

Slide 19: Growth Strategy
Growth Strategy Organic Growth Productivity, cost and product technology enhancements Expand existing businesses geographically Strategic Growth Capitalize on opportunities to expand geographic coverage and product range of existing businesses Continue to expand the Company’s offerings of value-adde
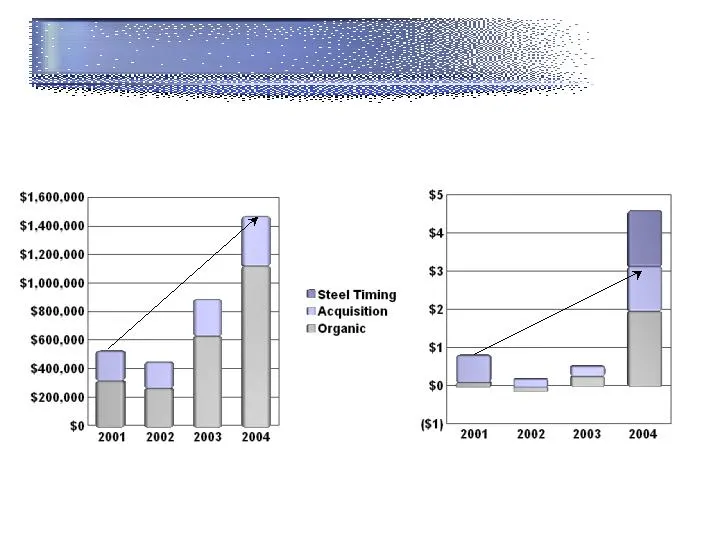
Slide 20: Growth Trends
Growth Trends Revenue (ooo’s) CAGR 39% EPS CAGR 55% (1) Acquisitions are highlighted for two years including the year of purchase. Acquisitions included by year are as follows: 2001-Prudential, 2002-Prudential & Precision, 2003-Precision, LTV & SeaCAT, 2004-LTV, SeaCAT & Texas Arai (2) Excluding eff
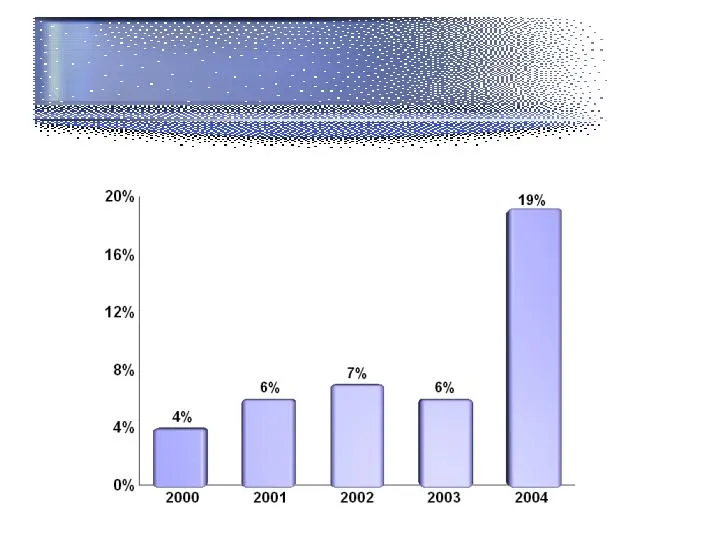
Slide 21: Return on Average Stockholders' Equity
Return on Average Stockholders’ Equity (Rolling Three-Year Average)
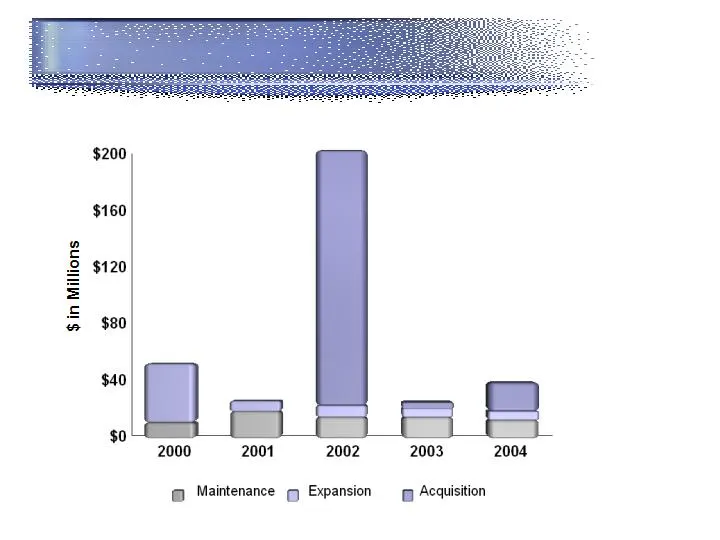
Slide 22: Investments in Future Growth
Investments in Future Growth (1) Excludes the $493 million acquisition of Prudential Steel Limited treated as a pooling of interests. (1)
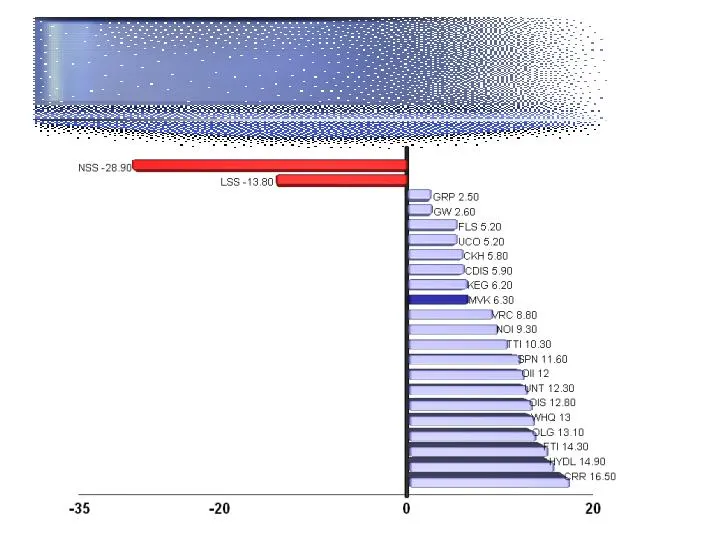
Slide 23: Comparative Returns on Average Equity
Comparative Returns on Average Equity Source: OSX, Annualized 3-year average 2001- 2003 as calculated by management
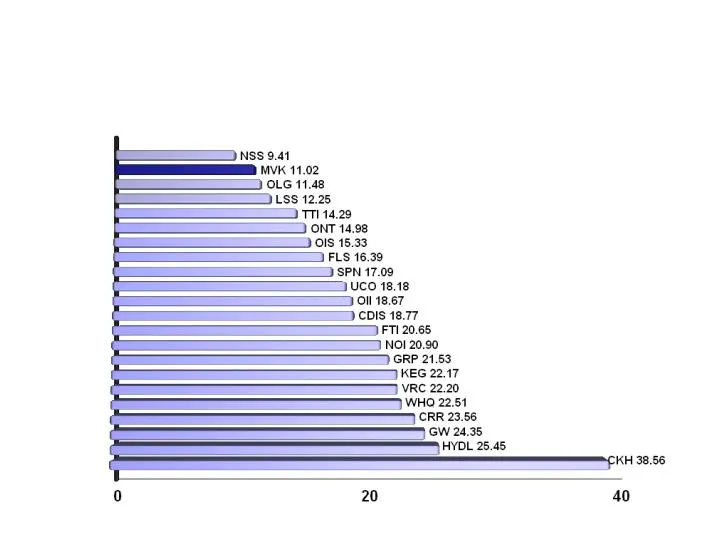
Slide 24: Comparative Market Valuations
Comparative Market Valuations Source: biz.yahoo.com as of February 7, 2005 (Forward P/E Ratio based on 2005 consensus earnings)
Slide 25: Year-To-Date Overview
Year-To-Date Overview % Inc. ($ in Millions) North American Rig Count 1,559 11% 1,403 Revenues 1,456 $ 65% $ Energy Products $ 53% $ Industrial Products $ 92% $ Operating Income $ 1138% $ Op. Margin % 22.3% 5.1% EPS 4.54 $ 725% 0.55 $ EBITDA $ 507% $ EBITDA Margin % 24% 7%
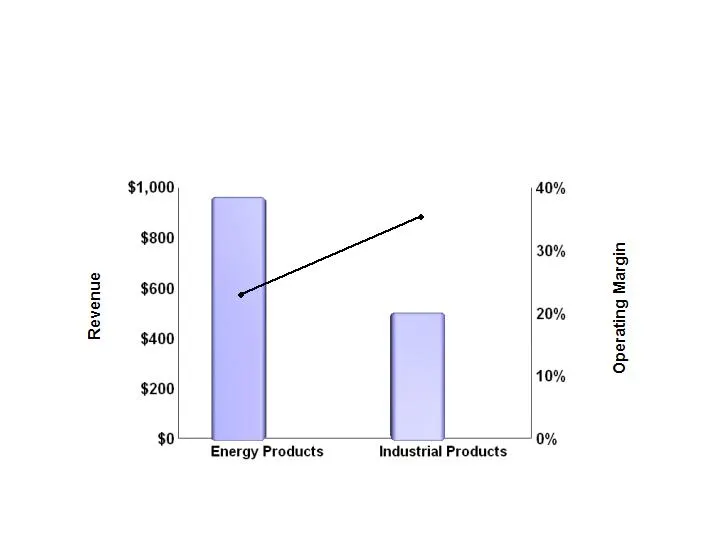
Slide 26: Segment Operating Results
Segment Operating Results Twelve months ended December 31, 2004 24% 37%

Slide 27: Balance Sheet Summary
Balance Sheet Summary Leverage Ratio $ 384,798 $ 595,664 Stockholders’ Equity $ 148,753 $ 146,253 Net Debt $ 127,742 $ 126,279 Other Debt Balance $ 50,213 $ 54,660 Revolver Balance $ 29,202 $ 34,686 Cash Availability 12/31/2003 12/31/2004 27.9% 19.7%
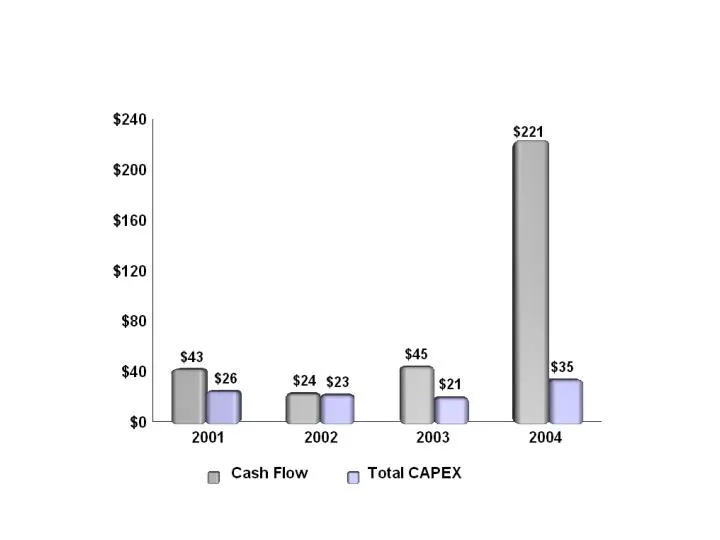
Slide 28: Growing Cash Flow Generation
Growing Cash Flow Generation (1) Cash flow represents net income plus depreciation and amortization (2) Excluding any conduit consolidation capital expenditures (1) (2)

Slide 29: Why Maverick?
Market share leader in key segments of the oil service industry, with contributing revenues and earnings from non- energy products Proven ability to profitably grow during all phases of the energy cycle Solid foundation and financial capacity to continue our organic growth and global expansion into
Slide 30: Maverick
MAVERICK
Source: SEC EDGAR · 8-K filed Mar 2, 2005
More decks from Maverick Tube Corp
 Investor Presentation (May 2006)28 slides · May 11, 2006
 Investor Presentation (March 2006)32 slides · Mar 13, 2006
 Investor Presentation (November 2005)29 slides · Nov 16, 2005
 Investor Presentation (November 2005)29 slides · Nov 1, 2005
 Investor Presentation (October 2005)29 slides · Oct 26, 2005
 Investor Presentation (September 2005)28 slides · Sep 1, 2005