Maverick Tube — Investor Presentation (November 2005)
29 slides from Maverick Tube's investor presentation, Nov 16, 2005
Slide 1: Investor Presentation November 2005
Maverick is a leading provider of products and services for the drilling, completion, and production cycles of oil and natural gas. Maverick has demonstrated a history of successful organic and strategic growth, providing a solid foundation for future international expansion and the addition of othe
Slide 2: Forward looking statements
These slides accompany an oral presentation by Maverick Tube Corporation which, except for the historical information, contain forward-looking statements representing our expectations or beliefs about future events and financial performance. Forward-looking statements are subject to known and unknow
Slide 3: Non-GAAP financial matters
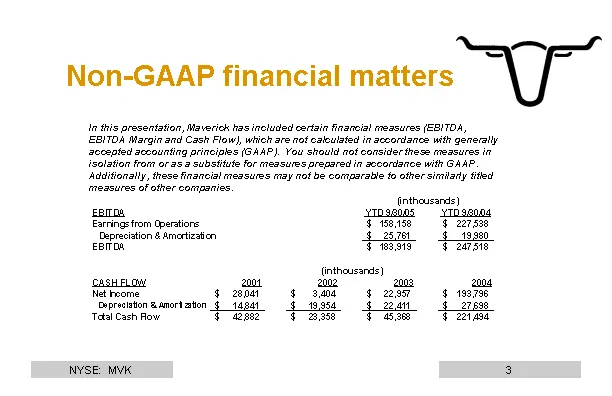
(in thousands) EBITDA YTD 9/30/05 YTD 9/30/04 Earnings from Operations $ 158,158 $ 227,538 Depreciation & Amortization $ 25,761 $ 19,980 EBITDA $ 183,919 $ 247,518 (in thousands) CASH FLOW 2001 2002 2003 2004 Net Income $ 28,041 $ 3,404 $ 22,957 $ 193,796 Depreciation & Amortization $ 14,841 $ 19,95
Slide 4: Investment highlights
Market leader in key segments of the oil service industry Tubular operations located in 3 of the top geographies of oil and gas activity - U.S., Canada, Latin America Proven ability to profitably grow both organically and through acquisitions Strong capital structure and financial capability to aggr
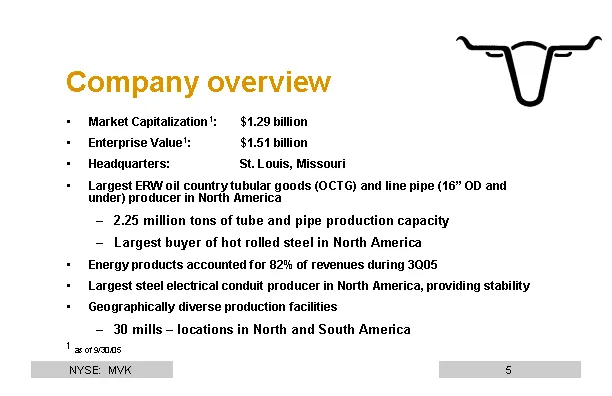
Slide 5: Company overview
Market Capitalization1: $1.29 billion Enterprise Value1: $1.51 billion Headquarters: St. Louis, Missouri Largest ERW oil country tubular goods (OCTG) and line pipe (16" OD and under) producer in North America 2.25 million tons of tube and pipe production capacity Largest buyer of hot rolled steel in
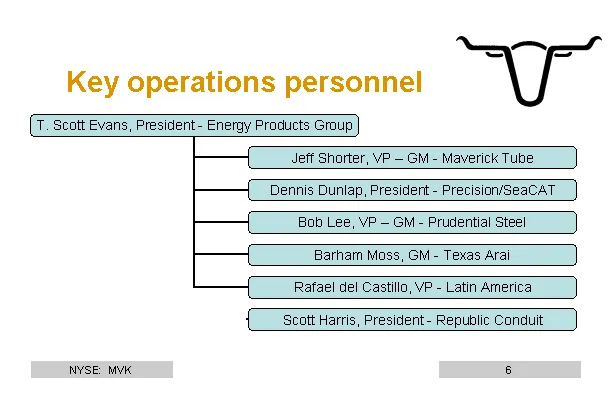
Slide 6: Key operations personnel
T. Scott Evans, President - Energy Products Group Jeff Shorter, VP E GM - Maverick Tube Dennis Dunlap, President - Precision/SeaCAT Bob Lee, VP E GM - Prudential Steel Barham Moss, GM - Texas Arai Rafael del Castillo, VP - Latin America Scott Harris, President - Republic Conduit Key operations perso
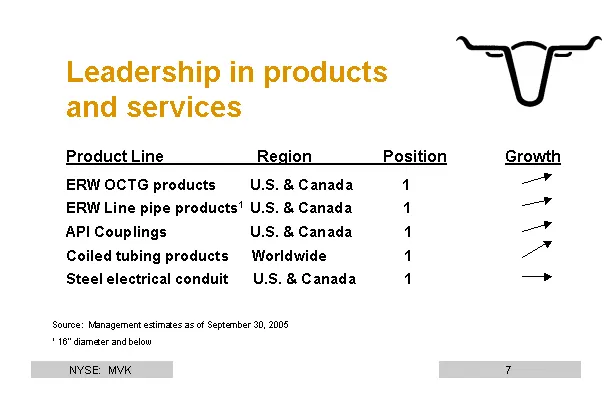
Slide 7: Leadership in products and services
Source: Management estimates as of September 30, 2005 1 16" diameter and below Product Line Region Position Growth ERW OCTG products U.S. & Canada 1 ERW Line pipe products1 U.S. & Canada 1 API Couplings U.S. & Canada 1 Coiled tubing products Worldwide 1 Steel electrical conduit U.S. & Canada 1 Leade
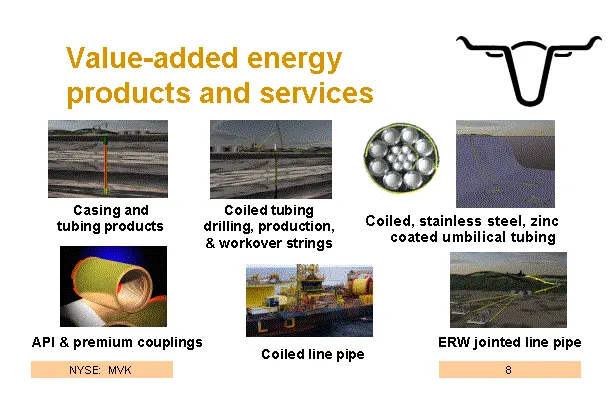
Slide 8: Value-added energy products and services
Coiled, stainless steel, zinc coated umbilical tubing Casing and tubing products Coiled tubing drilling, production, & workover strings ERW jointed line pipe Coiled line pipe API & premium couplings Value-added energy products and services
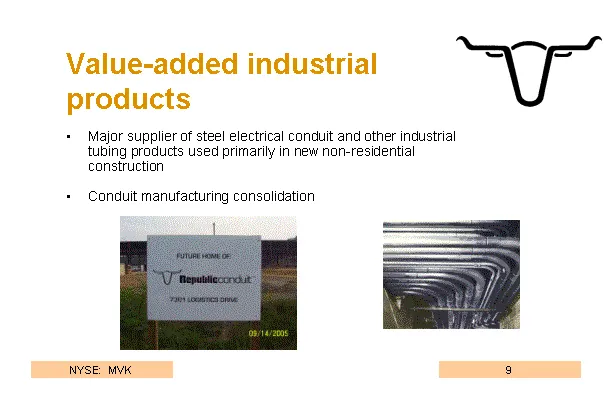
Slide 9: Value-added industrial products
Major supplier of steel electrical conduit and other industrial tubing products used primarily in new non-residential construction Conduit manufacturing consolidation Value-added industrial products
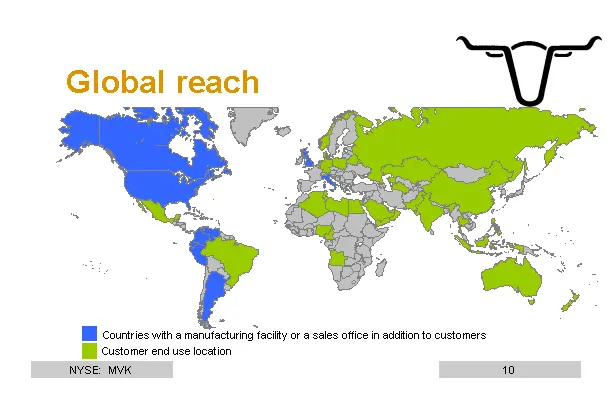
Slide 10: Global reach
Countries with a manufacturing facility or a sales office in addition to customers Customer end use location Global reach
Slide 11: Aggressive growth strategy
Organic Growth Enhance productivity, cost effectiveness and product technology Expand product lines Alloy OCTG Coiled tubing Strategic Growth Expand geographic coverage of existing businesses Tubos del Caribe/Colmena Expand the Company's offerings of value-added oil service products domestically and
Slide 12: Alloy OCTG expansion
Alloy OCTG demand growing rapidly due to deeper, more complex drilling Industry-wide alloy production capacity appears to be near full utilization Alloy products' selling prices substantially higher than carbon grades Maverick announced a 100% increase in available alloy product capacity by 2006 Tub
Slide 13: Coiled tubing expansion
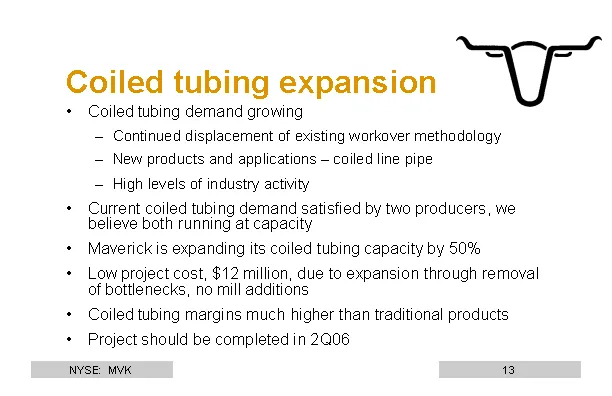
Coiled tubing demand growing Continued displacement of existing workover methodology New products and applications - coiled line pipe High levels of industry activity Current coiled tubing demand satisfied by two producers, we believe both running at capacity Maverick is expanding its coiled tubing
Slide 14: Tubos del Caribe S.A. & Colmena S.A. acquisition
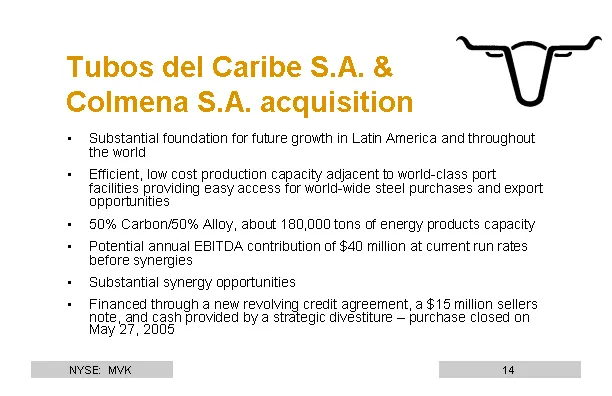
Substantial foundation for future growth in Latin America and throughout the world Efficient, low cost production capacity adjacent to world-class port facilities providing easy access for world-wide steel purchases and export opportunities 50% Carbon/50% Alloy, about 180,000 tons of energy products
Slide 15: Outstanding business climate
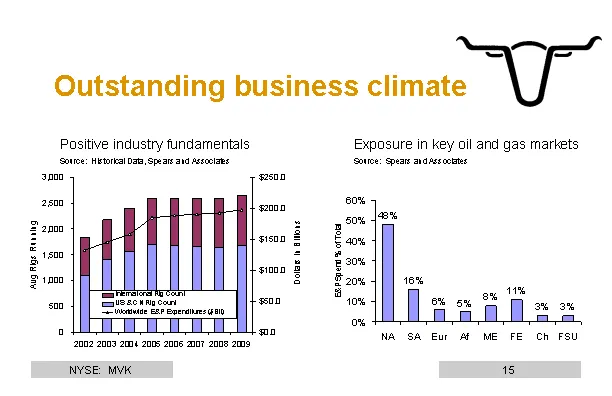
Outstanding business climate Exposure in key oil and gas markets Source: Spears and Associates Positive industry fundamentals Source: Historical Data, Spears and Associates
Slide 16: 2006 outlook
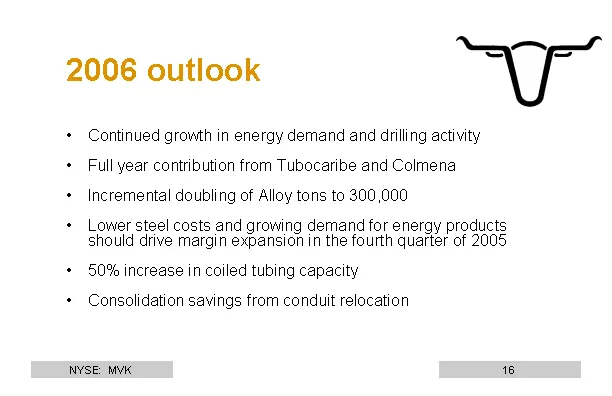
2006 outlook Continued growth in energy demand and drilling activity Full year contribution from Tubocaribe and Colmena Incremental doubling of Alloy tons to 300,000 Lower steel costs and growing demand for energy products should drive margin expansion in the fourth quarter of 2005 50% increase in c
Slide 17: Financial and Equity Information
Financial and Equity Information
Slide 18: Revenue breakdown 3Q05
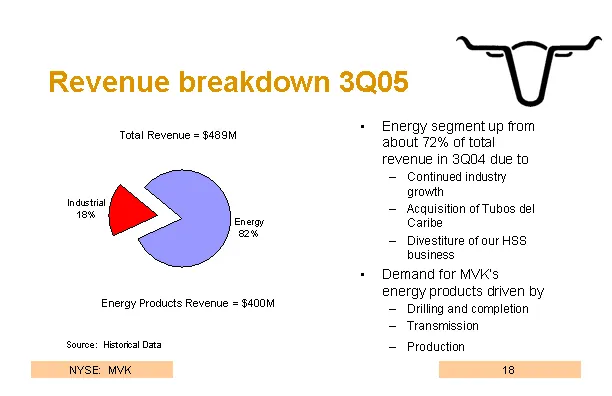
Source: Historical Data Energy Products Revenue = $400M Revenue breakdown 3Q05 Energy segment up from about 72% of total revenue in 3Q04 due to Continued industry growth Acquisition of Tubos del Caribe Divestiture of our HSS business Demand for MVK's energy products driven by Drilling and completion
Slide 19: Summary 3rd Quarter Results
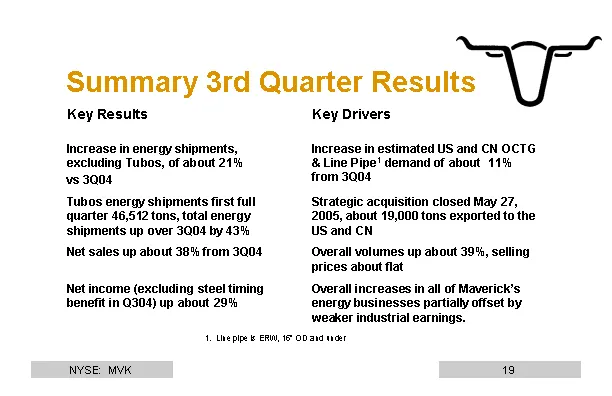
Summary 3rd Quarter Results Key Results Key Drivers Increase in energy shipments, excluding Tubos, of about 21% vs 3Q04 Increase in estimated US and CN OCTG & Line Pipe1 demand of about 11% from 3Q04 Tubos energy shipments first full quarter 46,512 tons, total energy shipments up over 3Q04 by 43% St
Slide 20: Improving prices over costs
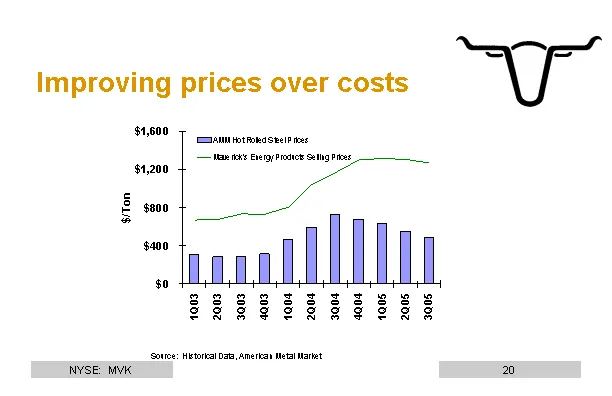
Improving prices over costs Source: Historical Data, American Metal Market
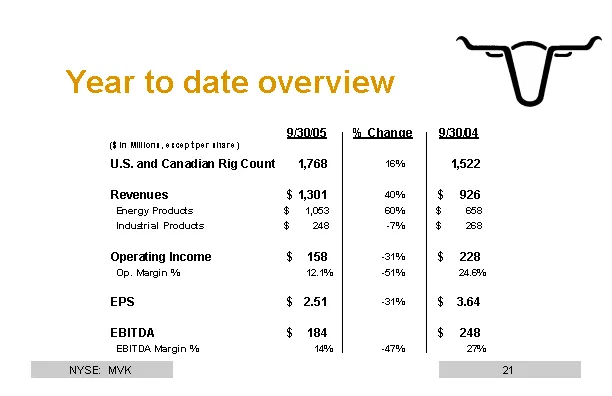
Slide 21: Year to date overview
Year to date overview 3Q '04 % Inc. 3Q '03 North American Rig Count 20.4 27.4 90 20.4 West 30.6 38.6 34.6 31.6 North 45.9 46.9 45 43.9
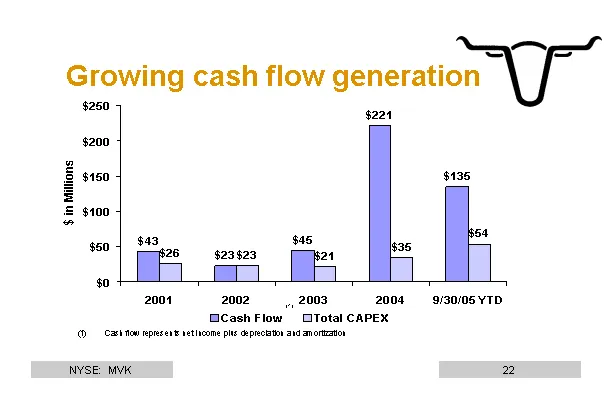
Slide 22: Growing cash flow generation
Cash flow represents net income plus depreciation and amortization (1) Growing cash flow generation
Slide 23: Convertible offering and stock buy back
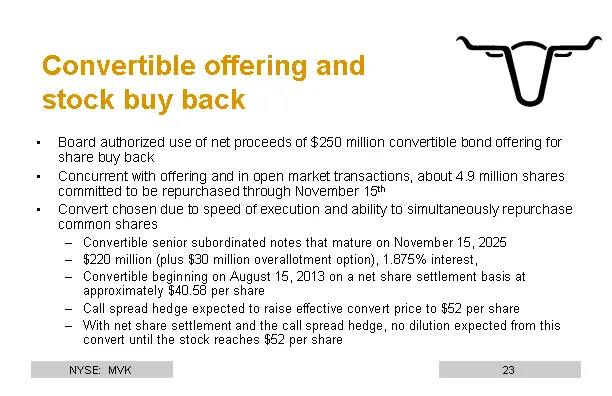
Convertible offering and stock buy back Board authorized use of net proceeds of $250 million convertible bond offering for share buy back Concurrent with offering and in open market transactions, about 4.9 million shares committed to be repurchased through November 15th Convert chosen due to speed o
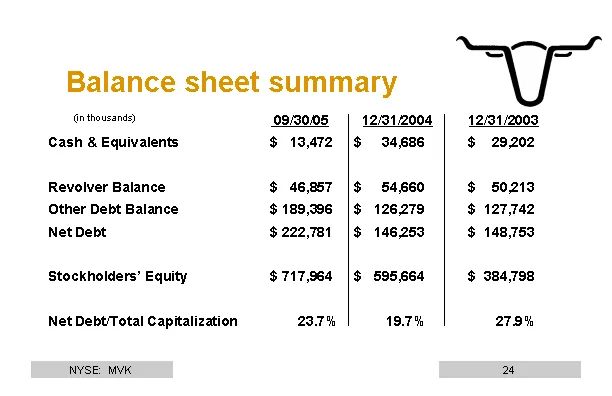
Slide 24: Balance sheet summary
(in thousands) 09/30/05 12/31/2004 12/31/2003 Cash & Equivalents $ 13,472 $ 34,686 $ 29,202 Revolver Balance $ 46,857 $ 54,660 $ 50,213 Other Debt Balance $ 189,396 $ 126,279 $ 127,742 Net Debt $ 222,781 $ 146,253 $ 148,753 Stockholders' Equity $ 717,964 $ 595,664 $ 384,798 Net Debt/Total Capitaliza
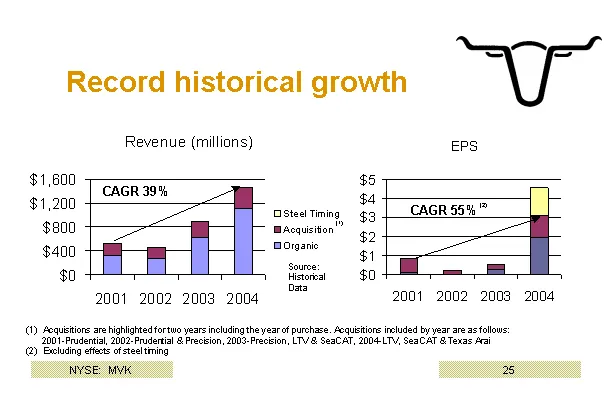
Slide 25: Record historical growth
Record historical growth (1) Acquisitions are highlighted for two years including the year of purchase. Acquisitions included by year are as follows: 2001-Prudential, 2002-Prudential & Precision, 2003-Precision, LTV & SeaCAT, 2004-LTV, SeaCAT & Texas Arai (2) Excluding effects of steel timing Source
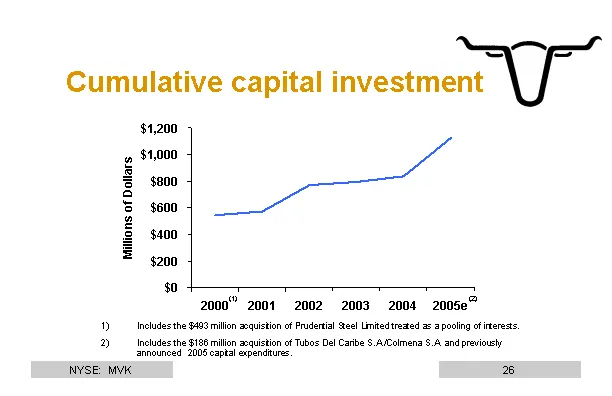
Slide 26: Cumulative capital investment
Includes the $493 million acquisition of Prudential Steel Limited treated as a pooling of interests. Includes the $186 million acquisition of Tubos Del Caribe S.A./Colmena S.A. and previously announced 2005 capital expenditures. Cumulative capital investment (1) (2)
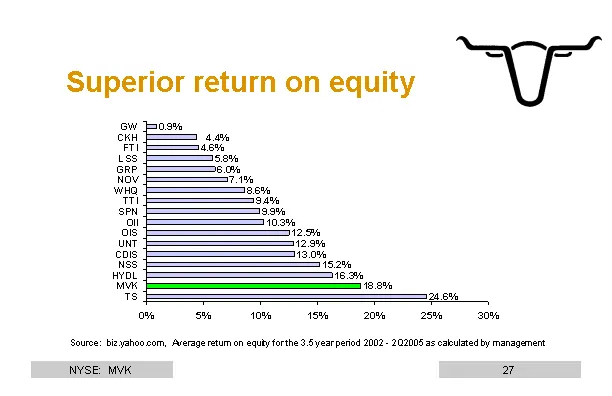
Slide 27: Superior return on equity
Source: biz.yahoo.com, Average return on equity for the 3.5 year period 2002 - 2Q2005 as calculated by management Superior return on equity
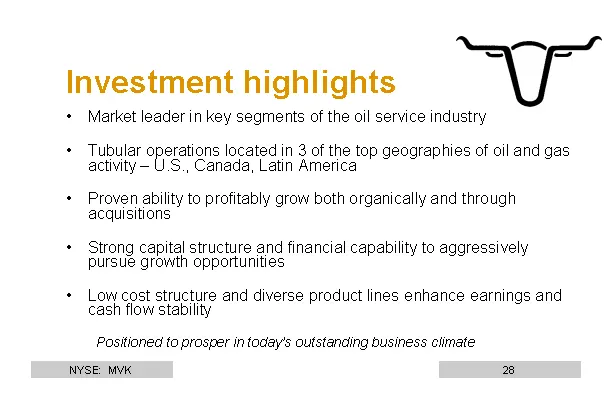
Slide 28: Investment highlights
Market leader in key segments of the oil service industry Tubular operations located in 3 of the top geographies of oil and gas activity - U.S., Canada, Latin America Proven ability to profitably grow both organically and through acquisitions Strong capital structure and financial capability to aggr
Slide 29: Maverick
mv MAVERICK 2
Source: SEC EDGAR · 8-K filed Nov 16, 2005
More decks from Maverick Tube Corp
 Investor Presentation (May 2006)28 slides · May 11, 2006
 Investor Presentation (March 2006)32 slides · Mar 13, 2006
 Investor Presentation (November 2005)29 slides · Nov 1, 2005
 Investor Presentation (October 2005)29 slides · Oct 26, 2005
 Investor Presentation (September 2005)28 slides · Sep 1, 2005
 Investor Presentation (May 2005)35 slides · May 31, 2005