Snap-On Incorporated · NYSE:SNA
Snap-On — Q4 2018 Earnings Presentation
17 slides from Snap-On's earnings presentation, Feb 7, 2019
Slide 1: Quarterly Financial Review Fourth Quarter 2018
Quarterly Financial Review Fourth Quarter 2018 Snap-on Tools In-Depth Business Review Q4-2018 Board Quarterly Review of Directors 1April DB-2 1 -1 © 2019 Snap-on 27, 2011 Incorporated
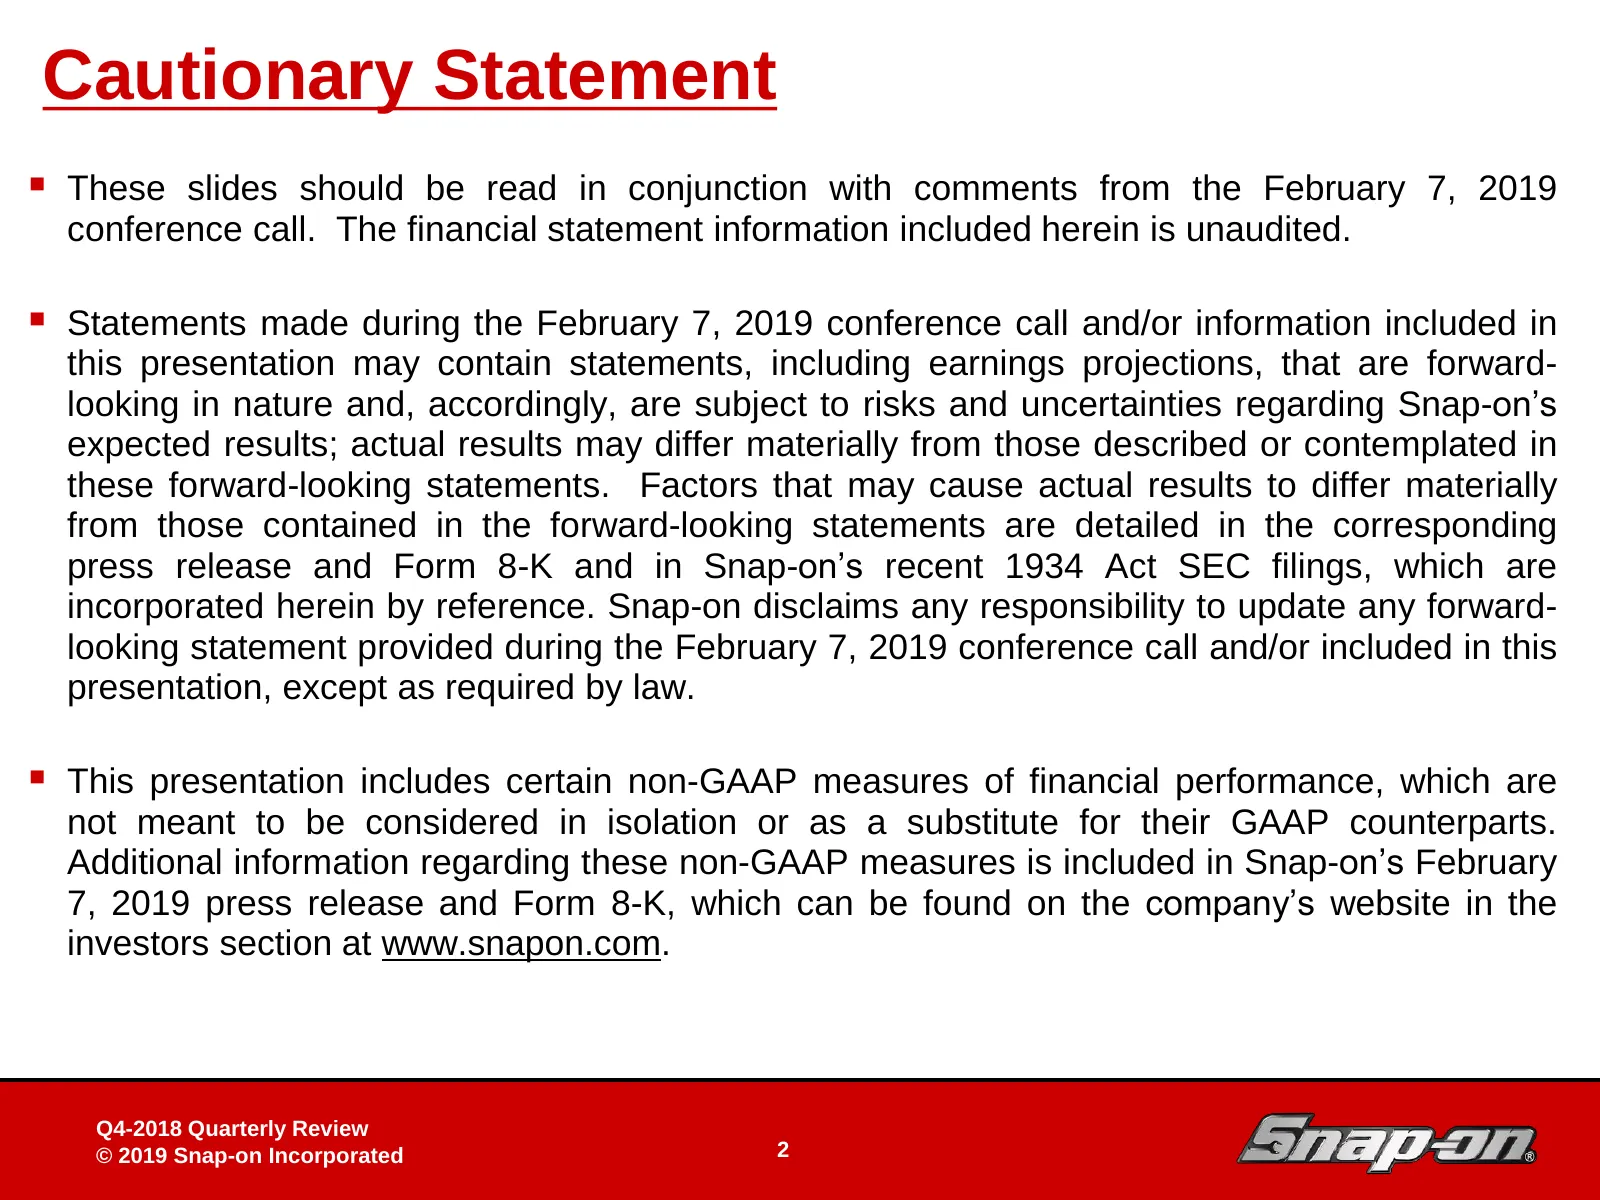
Slide 2: Cautionary Statement
Cautionary Statement These slides should be read in conjunction with comments from the February 7, 2019 conference call. The financial statement information included herein is unaudited. Statements made during the February 7, 2019 conference call and/or information included in this presentation

Slide 3: Board of Directors
Snap-on Tools In-Depth Business Review Board of Directors DB-2 3April 27, 2011 3 -3

Slide 4: Nick Pinchuk
Nick Pinchuk Chairman and Chief Executive Officer Snap-on Tools In-Depth Business Review Q4-2018 Board Quarterly Review of Directors 4April DB-2 4 -4 © 2019 Snap-on 27, 2011 Incorporated

Slide 5: Aldo Pagliari
Aldo Pagliari Senior Vice President and Chief Financial Officer Snap-on Tools In-Depth Business Review Q4-2018 Board Quarterly Review of Directors 5April DB-2 5 -5 © 2019 Snap-on 27, 2011 Incorporated
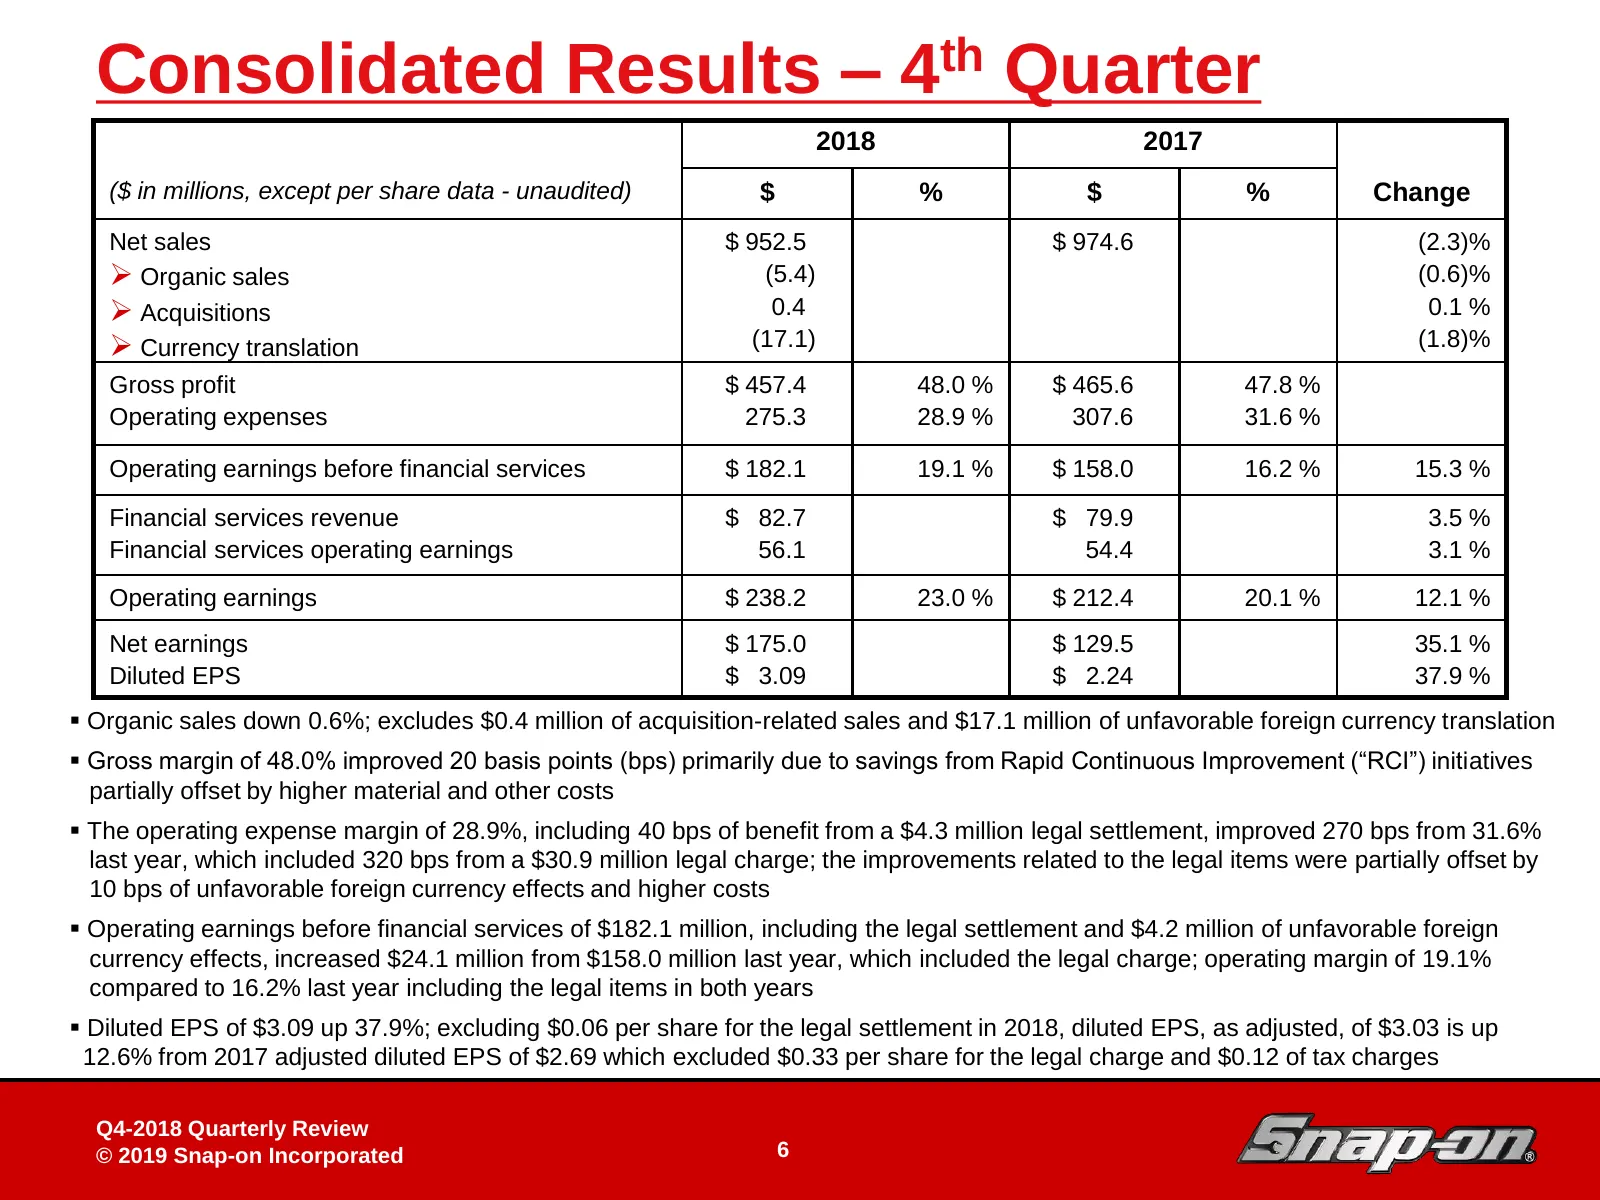
Slide 6: Consolidated Results – 4th Quarter
Consolidated Results – 4th Quarter 2018 2017 ($ in millions, except per share data - unaudited) $ % $ % Change Net sales $ 952.5 $ 974.6 (2.3)% Organic sales (5.4) (0.6)% Acquisitions 0.4 0.1 % Currency translation (17.1) (1.8)% Gross profit $ 457.4 48.0 % $ 465.6 47.8 % Operating expenses 275
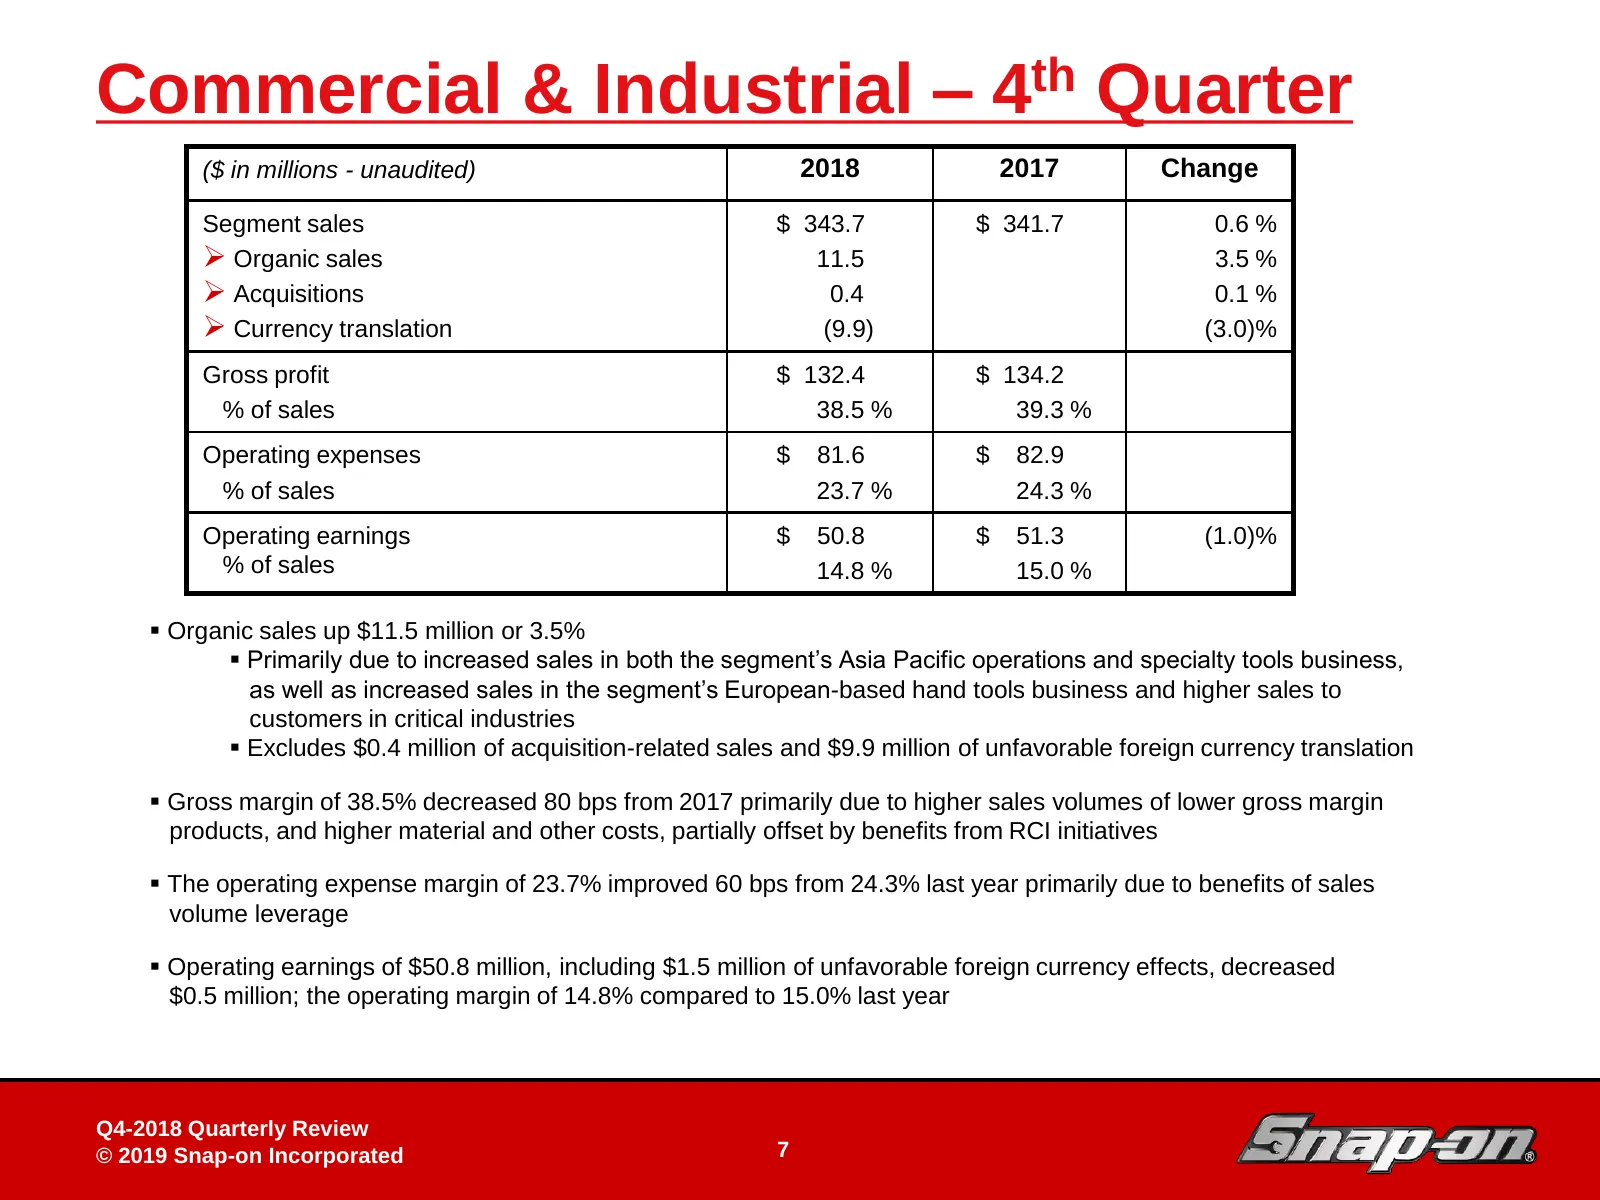
Slide 7: Commercial & Industrial – 4th Quarter
Commercial & Industrial – 4th Quarter ($ in millions - unaudited) 2018 2017 Change Segment sales $ 343.7 $ 341.7 0.6 % Organic sales 11.5 3.5 % Acquisitions 0.4 0.1 % Currency translation (9.9) (3.0)% Gross profit $ 132.4 $ 134.2 % of sales 38.5 % 39.3 % Operating expenses $ 81.6 $ 82.9 % of s
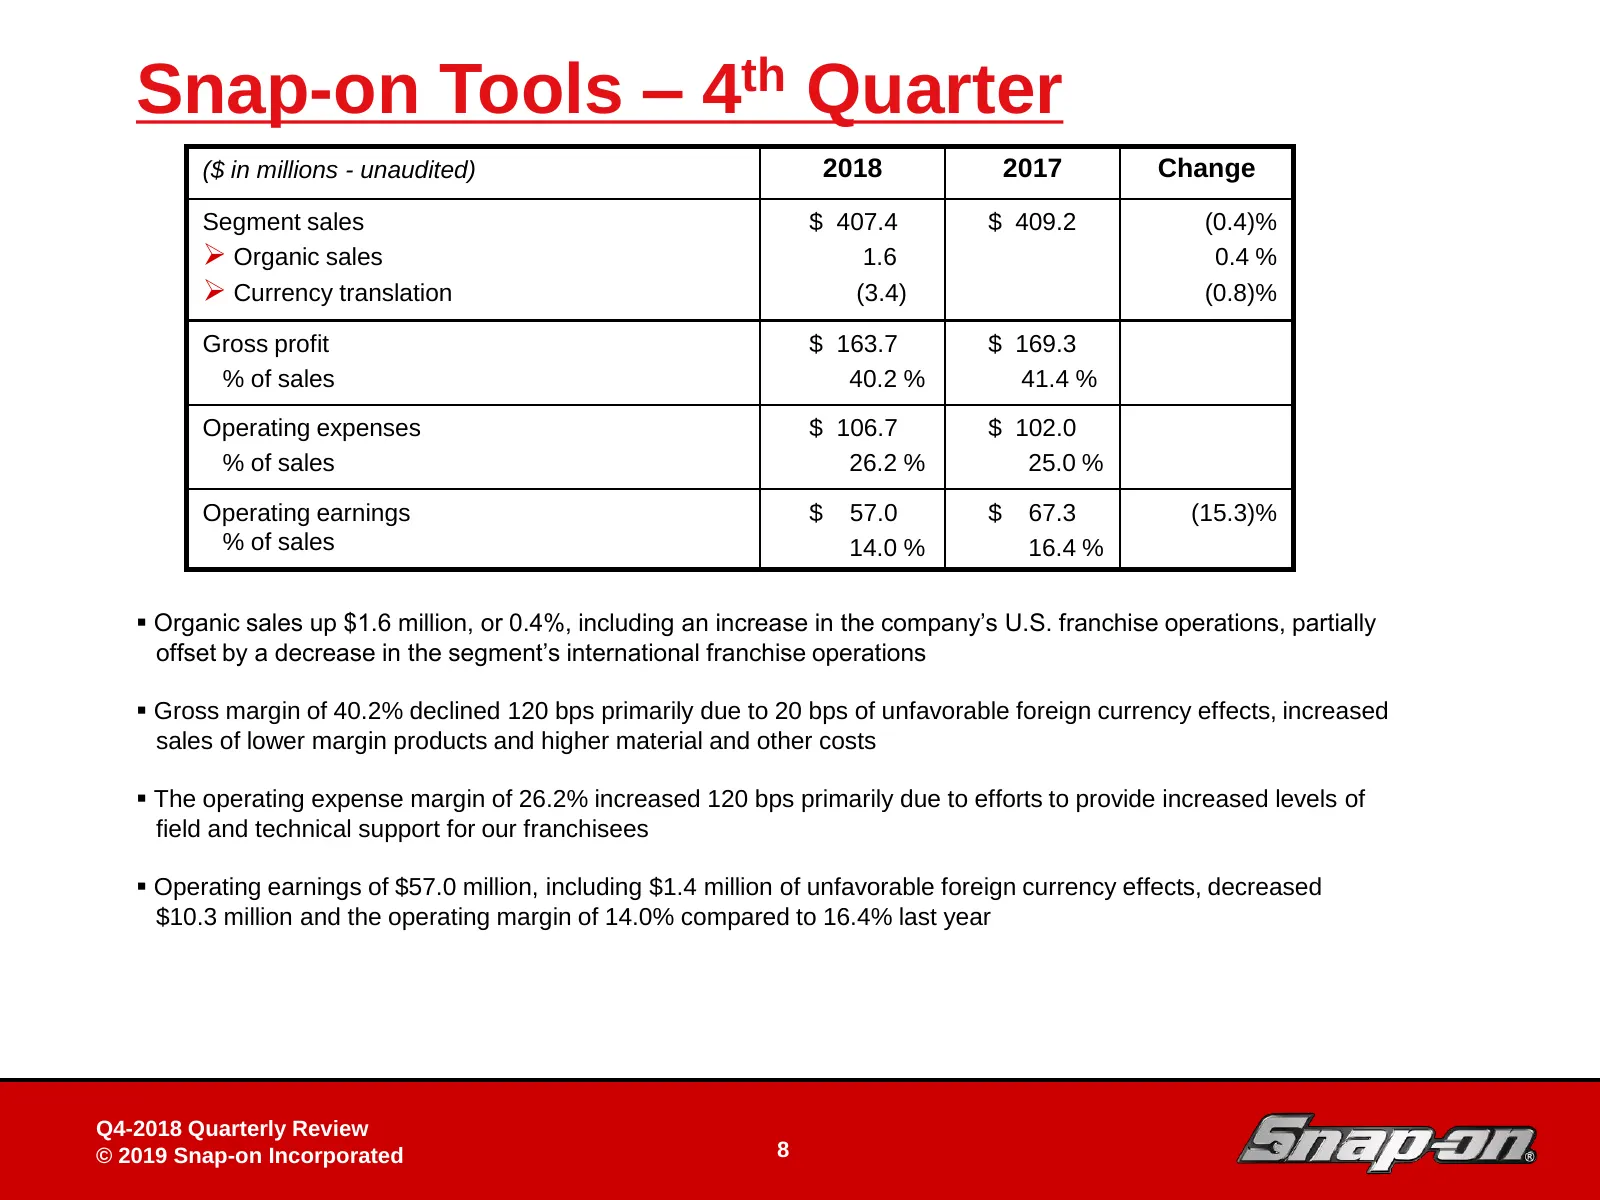
Slide 8: Snap-on Tools – 4th Quarter
Snap-on Tools – 4th Quarter ($ in millions - unaudited) 2018 2017 Change Segment sales $ 407.4 $ 409.2 (0.4)% Organic sales 1.6 0.4 % Currency translation (3.4) (0.8)% Gross profit $ 163.7 $ 169.3 % of sales 40.2 % 41.4 % Operating expenses $ 106.7 $ 102.0 % of sales 26.2 % 25.0 % Operating earn
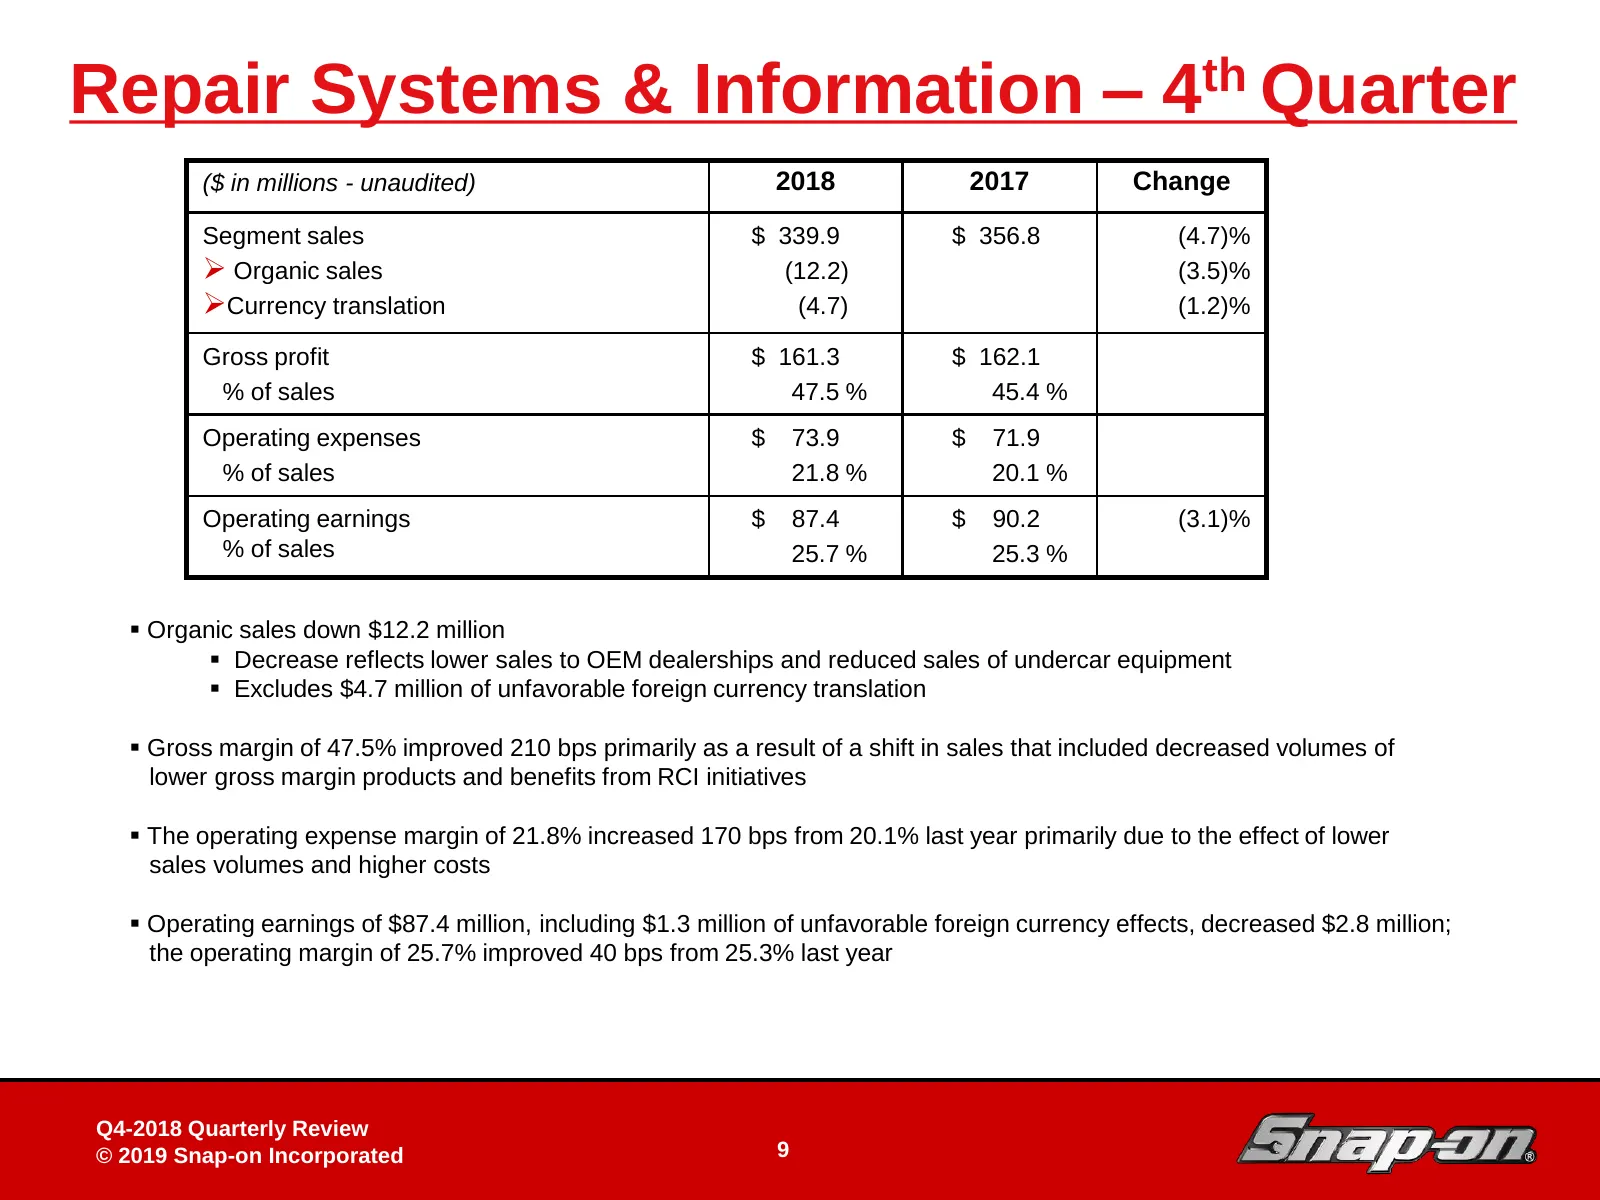
Slide 9: Repair Systems & Information – 4th Quarter
Repair Systems & Information – 4th Quarter ($ in millions - unaudited) 2018 2017 Change Segment sales $ 339.9 $ 356.8 (4.7)% Organic sales (12.2) (3.5)% Currency translation (4.7) (1.2)% Gross profit $ 161.3 $ 162.1 % of sales 47.5 % 45.4 % Operating expenses $ 73.9 $ 71.9 % of sales 21.8 % 20.1
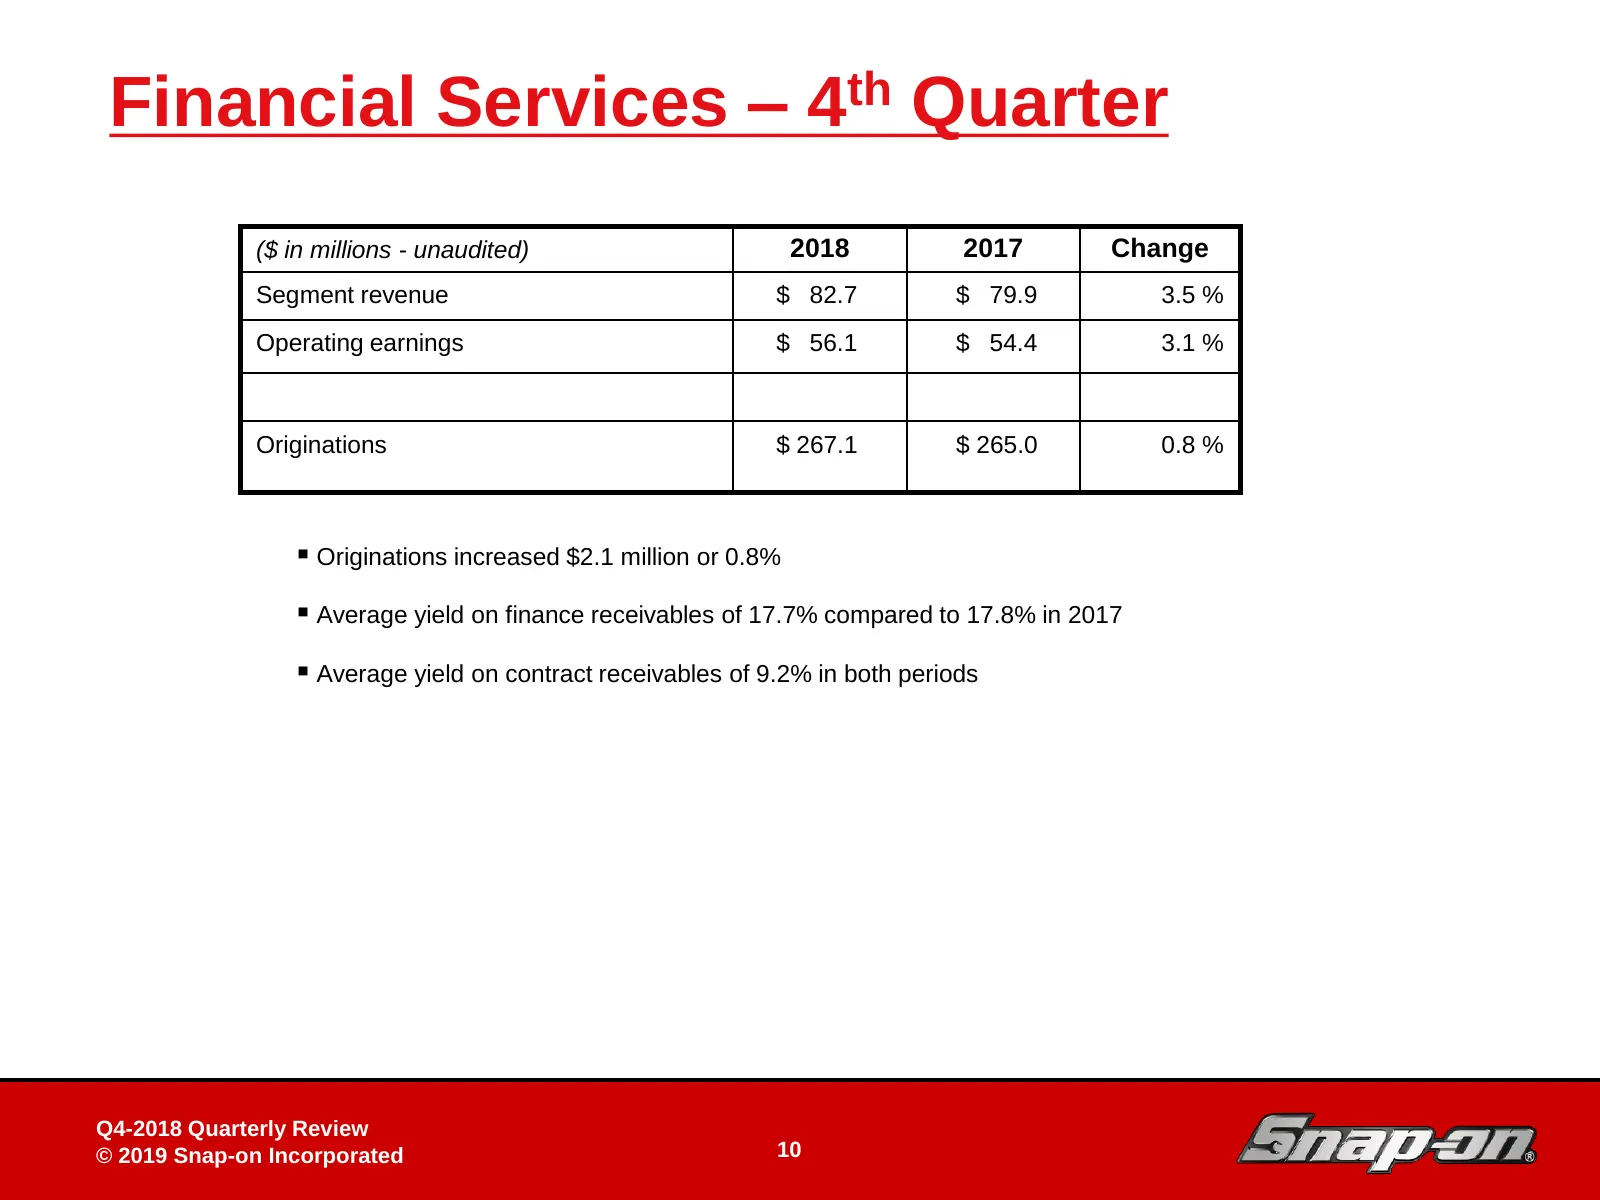
Slide 10: Financial Services – 4th Quarter
Financial Services – 4th Quarter ($ in millions - unaudited) 2018 2017 Change Segment revenue $ 82.7 $ 79.9 3.5 % Operating earnings $ 56.1 $ 54.4 3.1 % Originations $ 267.1 $ 265.0 0.8 % Originations increased $2.1 million or 0.8% Average yield on finance receivables of 17.7% compared to 17.8%
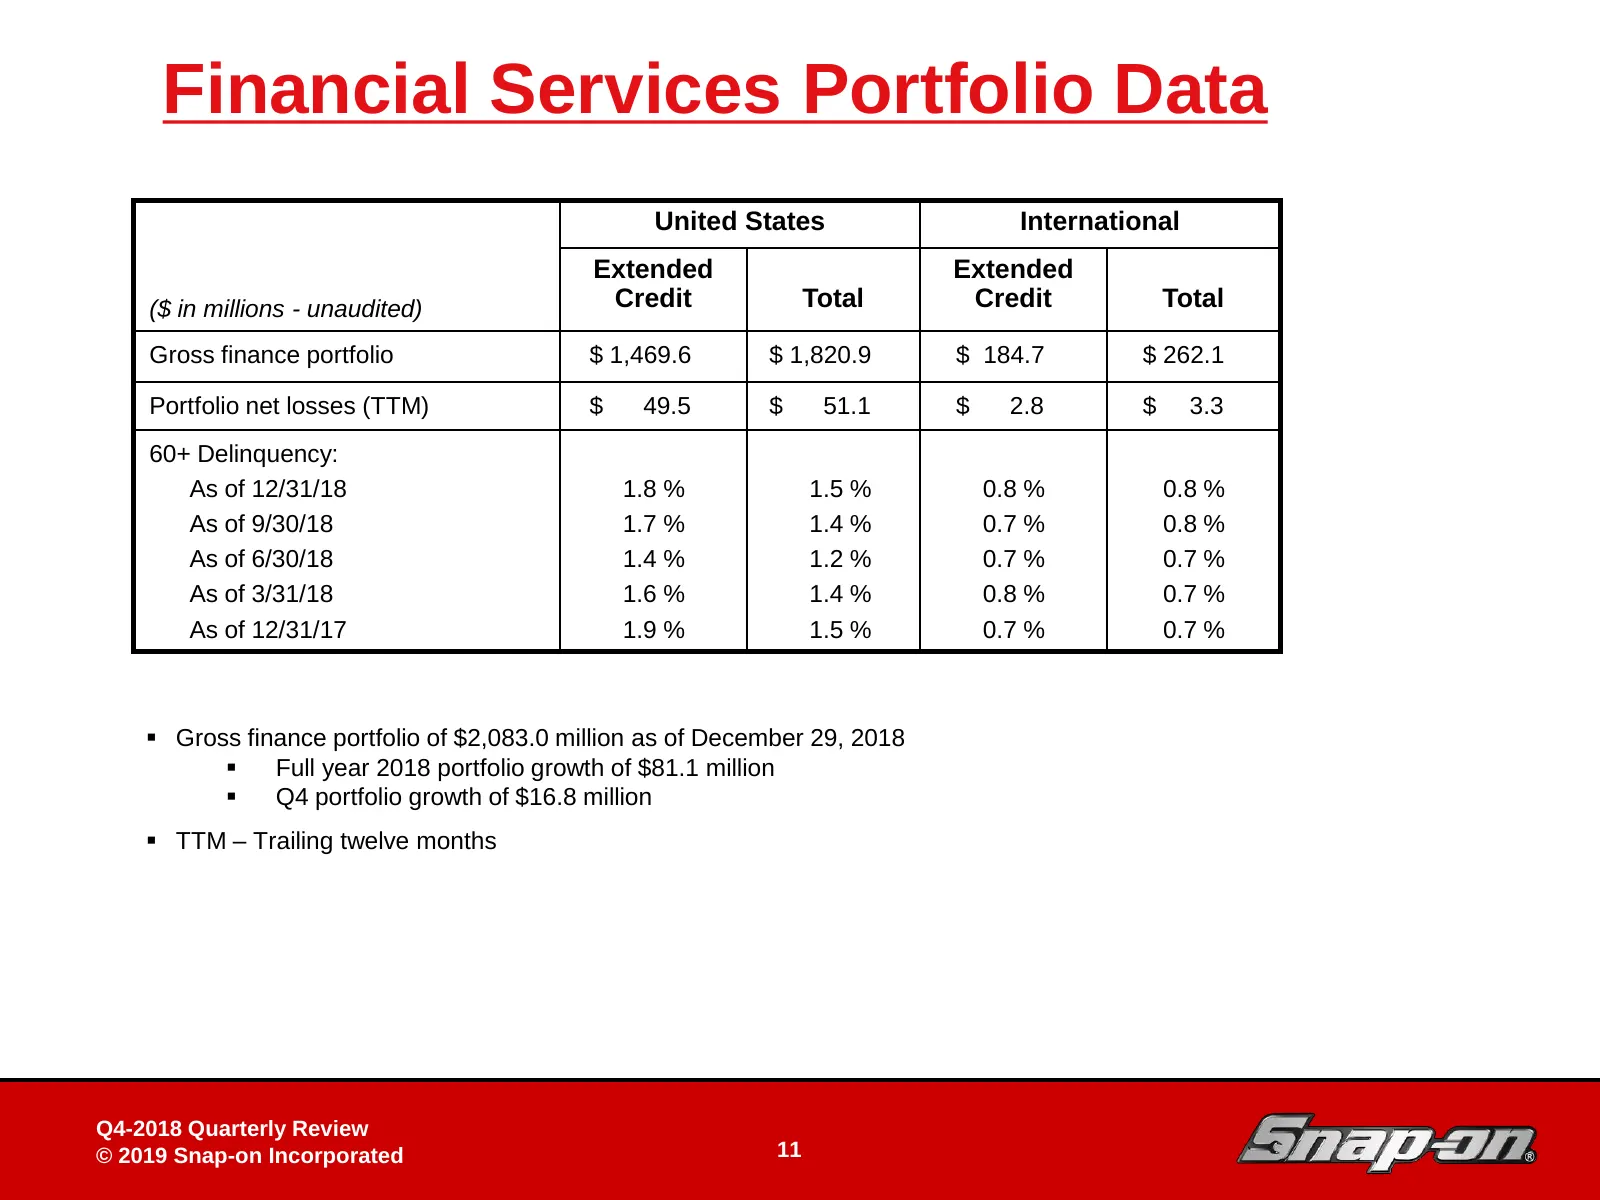
Slide 11: Financial Services Portfolio Data
Financial Services Portfolio Data United States International Extended Extended ($ in millions - unaudited) Credit Total Credit Total Gross finance portfolio $ 1,469.6 $ 1,820.9 $ 184.7 $ 262.1 Portfolio net losses (TTM) $ 49.5 $ 51.1 $ 2.8 $ 3.3 60+ Delinquency: As of 12/31/18 1.8 % 1.5 % 0.8 % 0.8
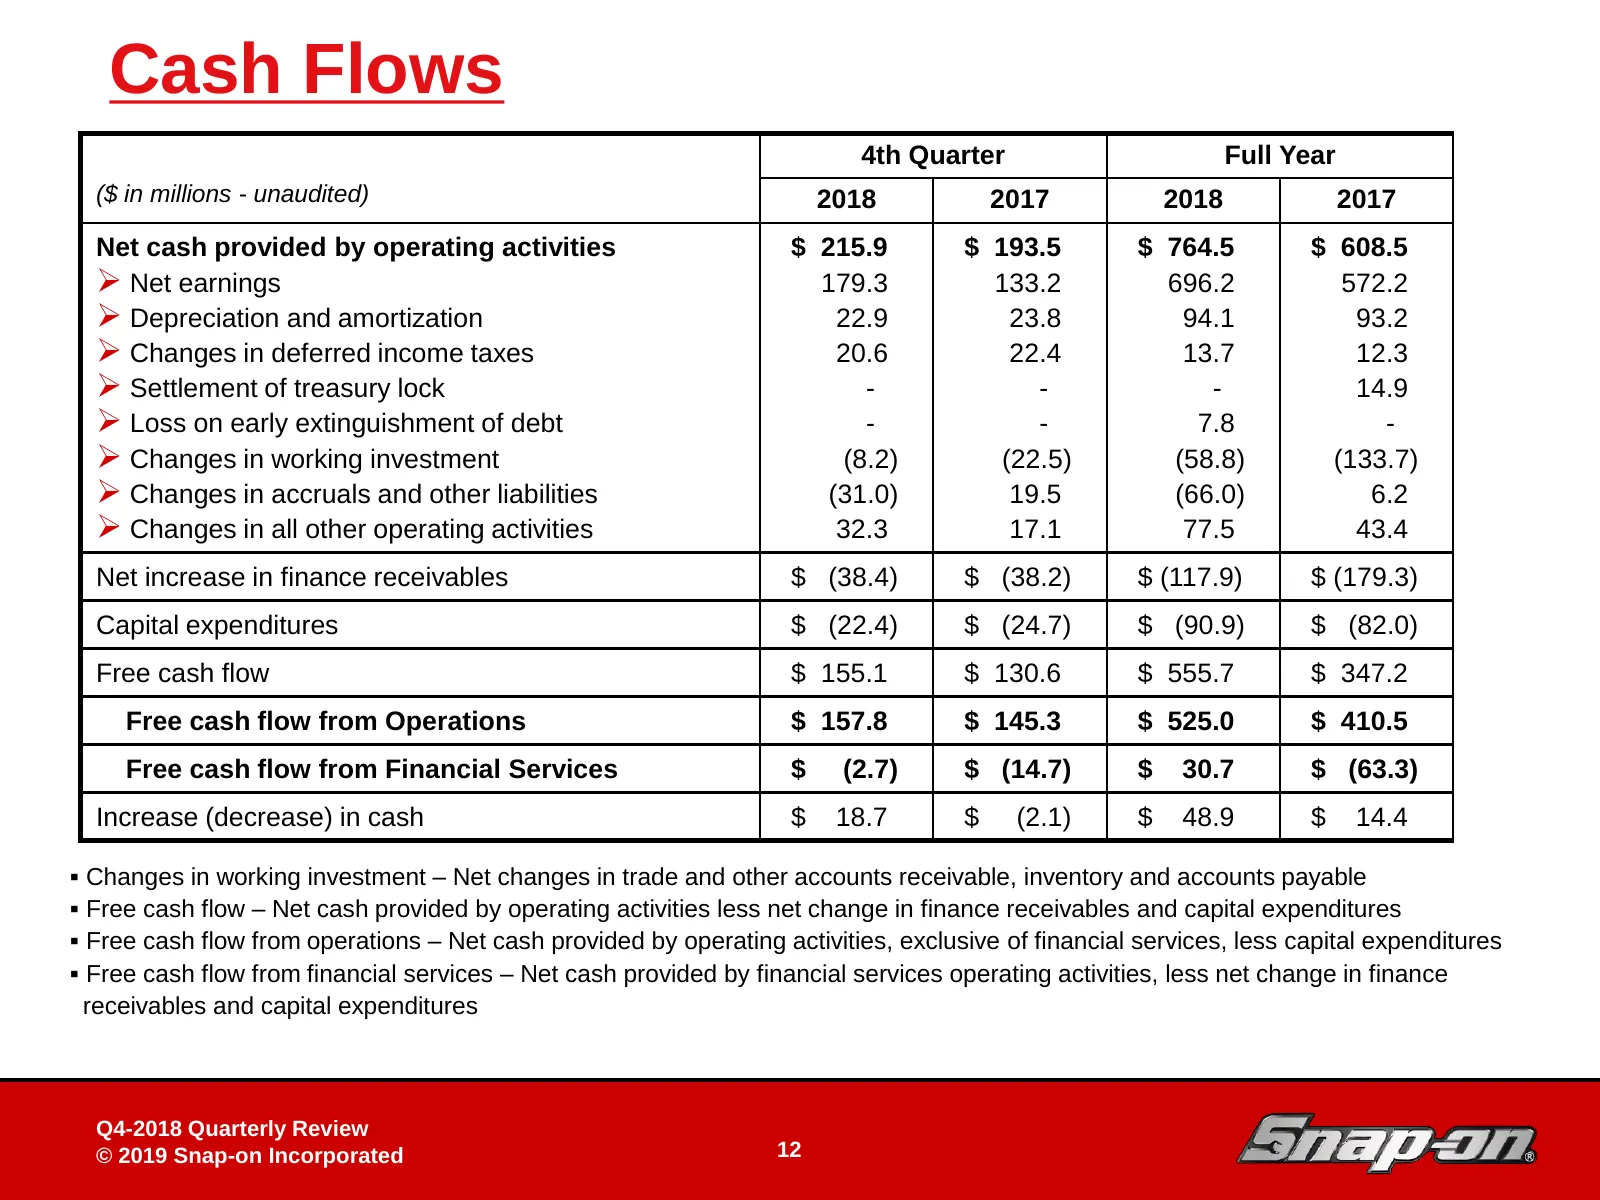
Slide 12: Cash Flows
Cash Flows 4th Quarter Full Year ($ in millions - unaudited) 2018 2017 2018 2017 Net cash provided by operating activities $ 215.9 $ 193.5 $ 764.5 $ 608.5 Net earnings 179.3 133.2 696.2 572.2 Depreciation and amortization 22.9 23.8 94.1 93.2 Changes in deferred income taxes 20.6 22.4 13.7 12.3
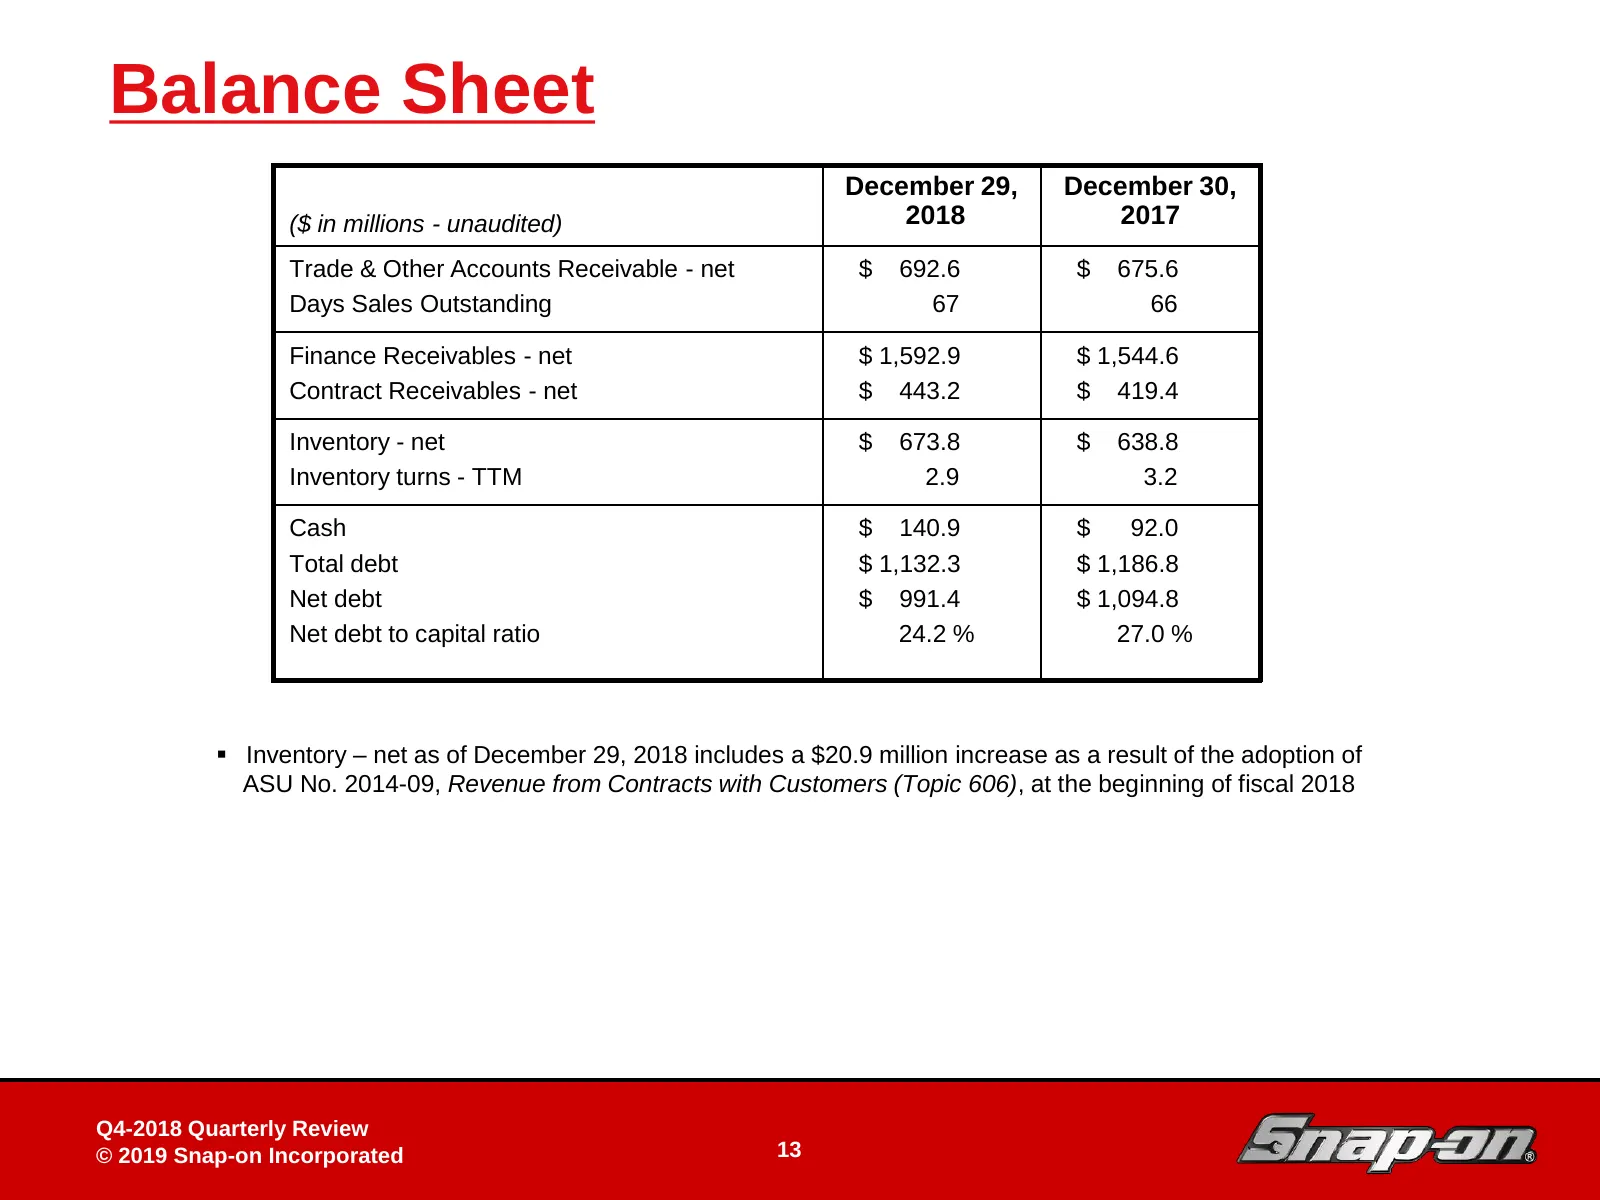
Slide 13: Balance Sheet
Balance Sheet December 29, December 30, ($ in millions - unaudited) 2018 2017 Trade & Other Accounts Receivable - net $ 692.6 $ 675.6 Days Sales Outstanding 67 66 Finance Receivables - net $ 1,592.9 $ 1,544.6 Contract Receivables - net $ 443.2 $ 419.4 Inventory - net $ 673.8 $ 638.8 Inventory turns
Slide 14: Reconciliation of Non-GAAP Financial Measures
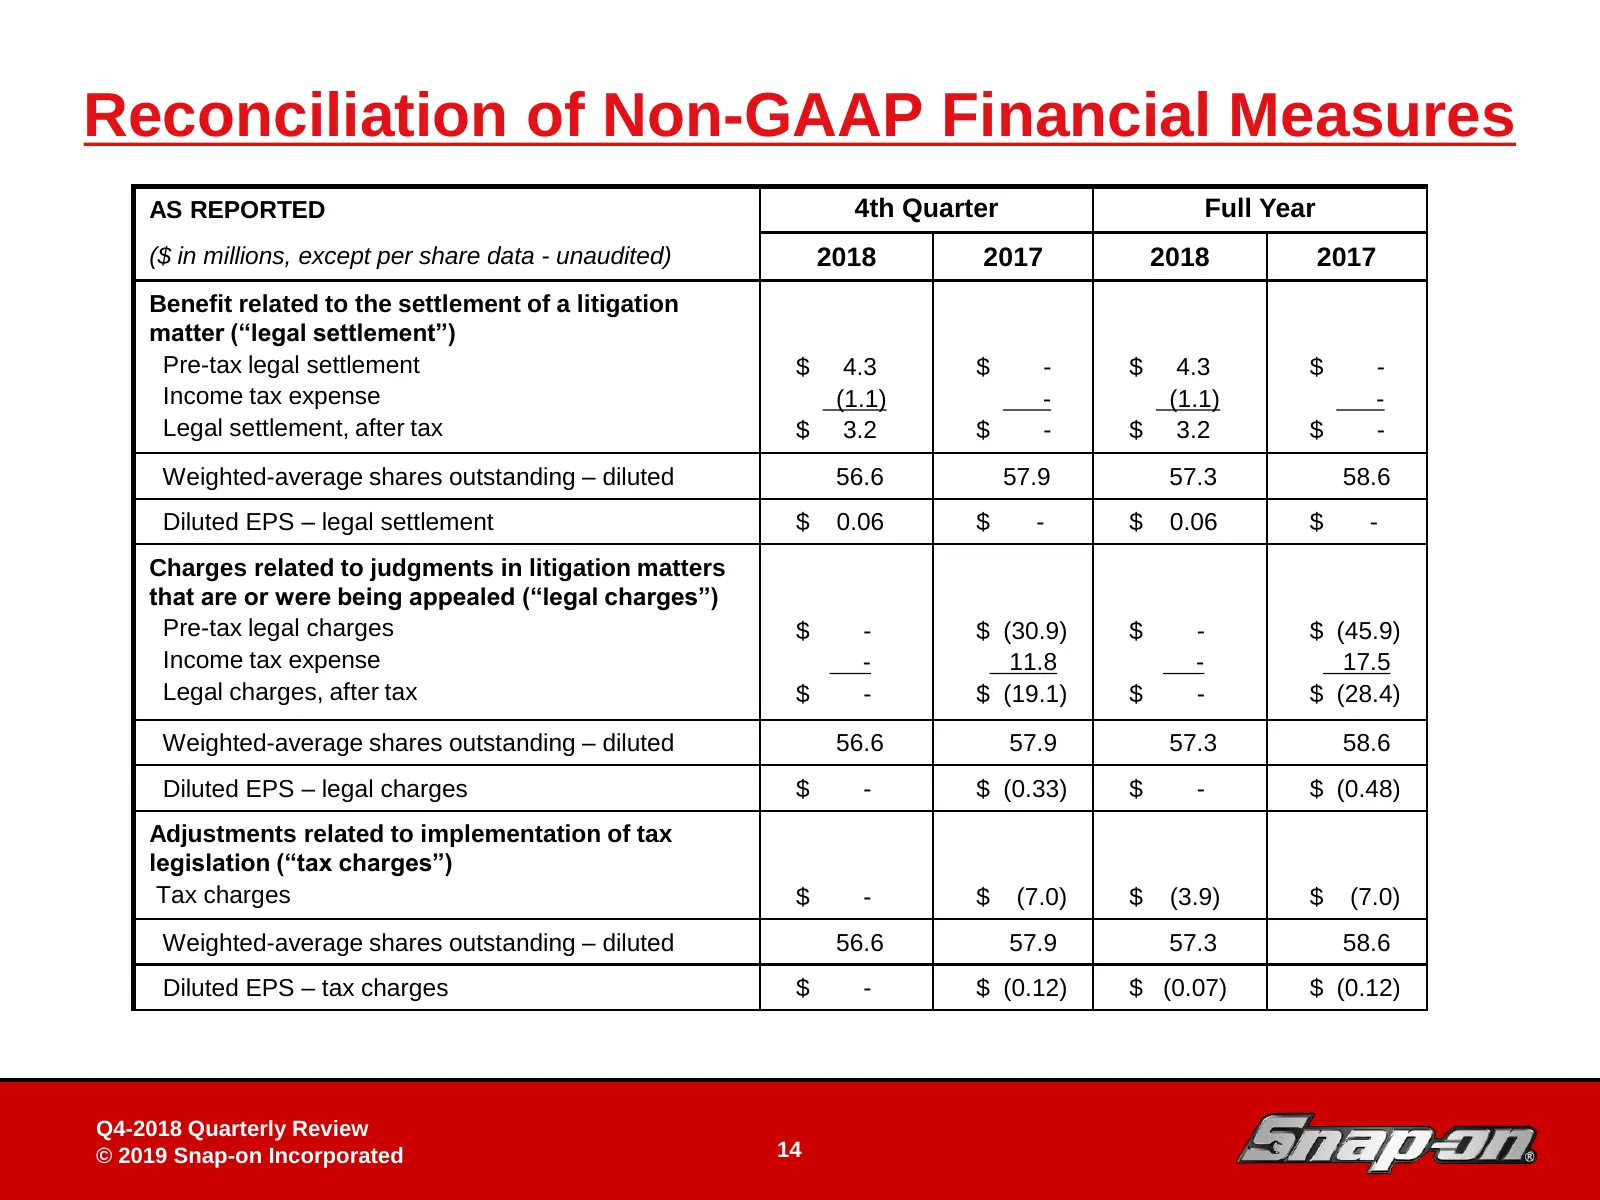
Reconciliation of Non-GAAP Financial Measures AS REPORTED 4th Quarter Full Year ($ in millions, except per share data - unaudited) 2018 2017 2018 2017 Benefit related to the settlement of a litigation matter (“legal settlement”) Pre-tax legal settlement $ 4.3 $ - $ 4.3 $ - Income tax expense (1.1) -
Slide 15: Reconciliation of Non-GAAP Financial Measures
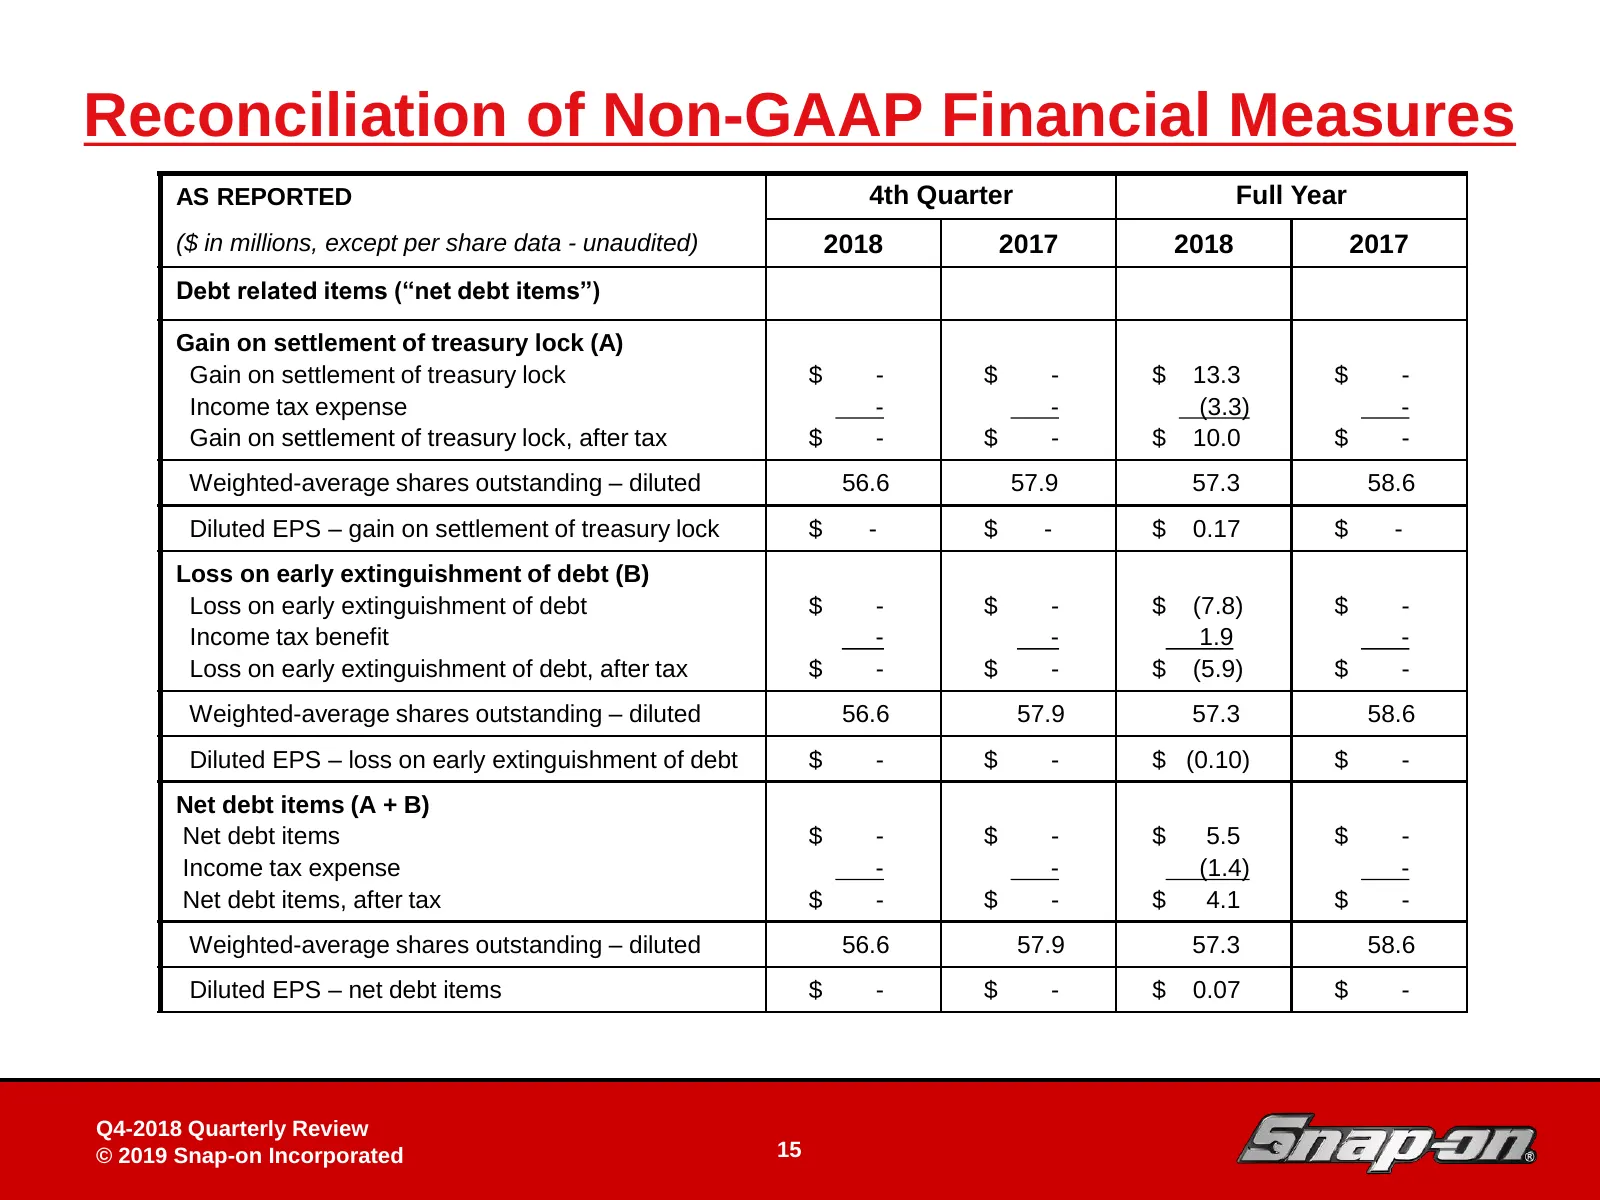
Reconciliation of Non-GAAP Financial Measures AS REPORTED 4th Quarter Full Year ($ in millions, except per share data - unaudited) 2018 2017 2018 2017 Debt related items (“net debt items”) Gain on settlement of treasury lock (A) Gain on settlement of treasury lock $ - $ - $ 13.3 $ - Income tax expen
Slide 16: Reconciliation of Non-GAAP Financial Measures
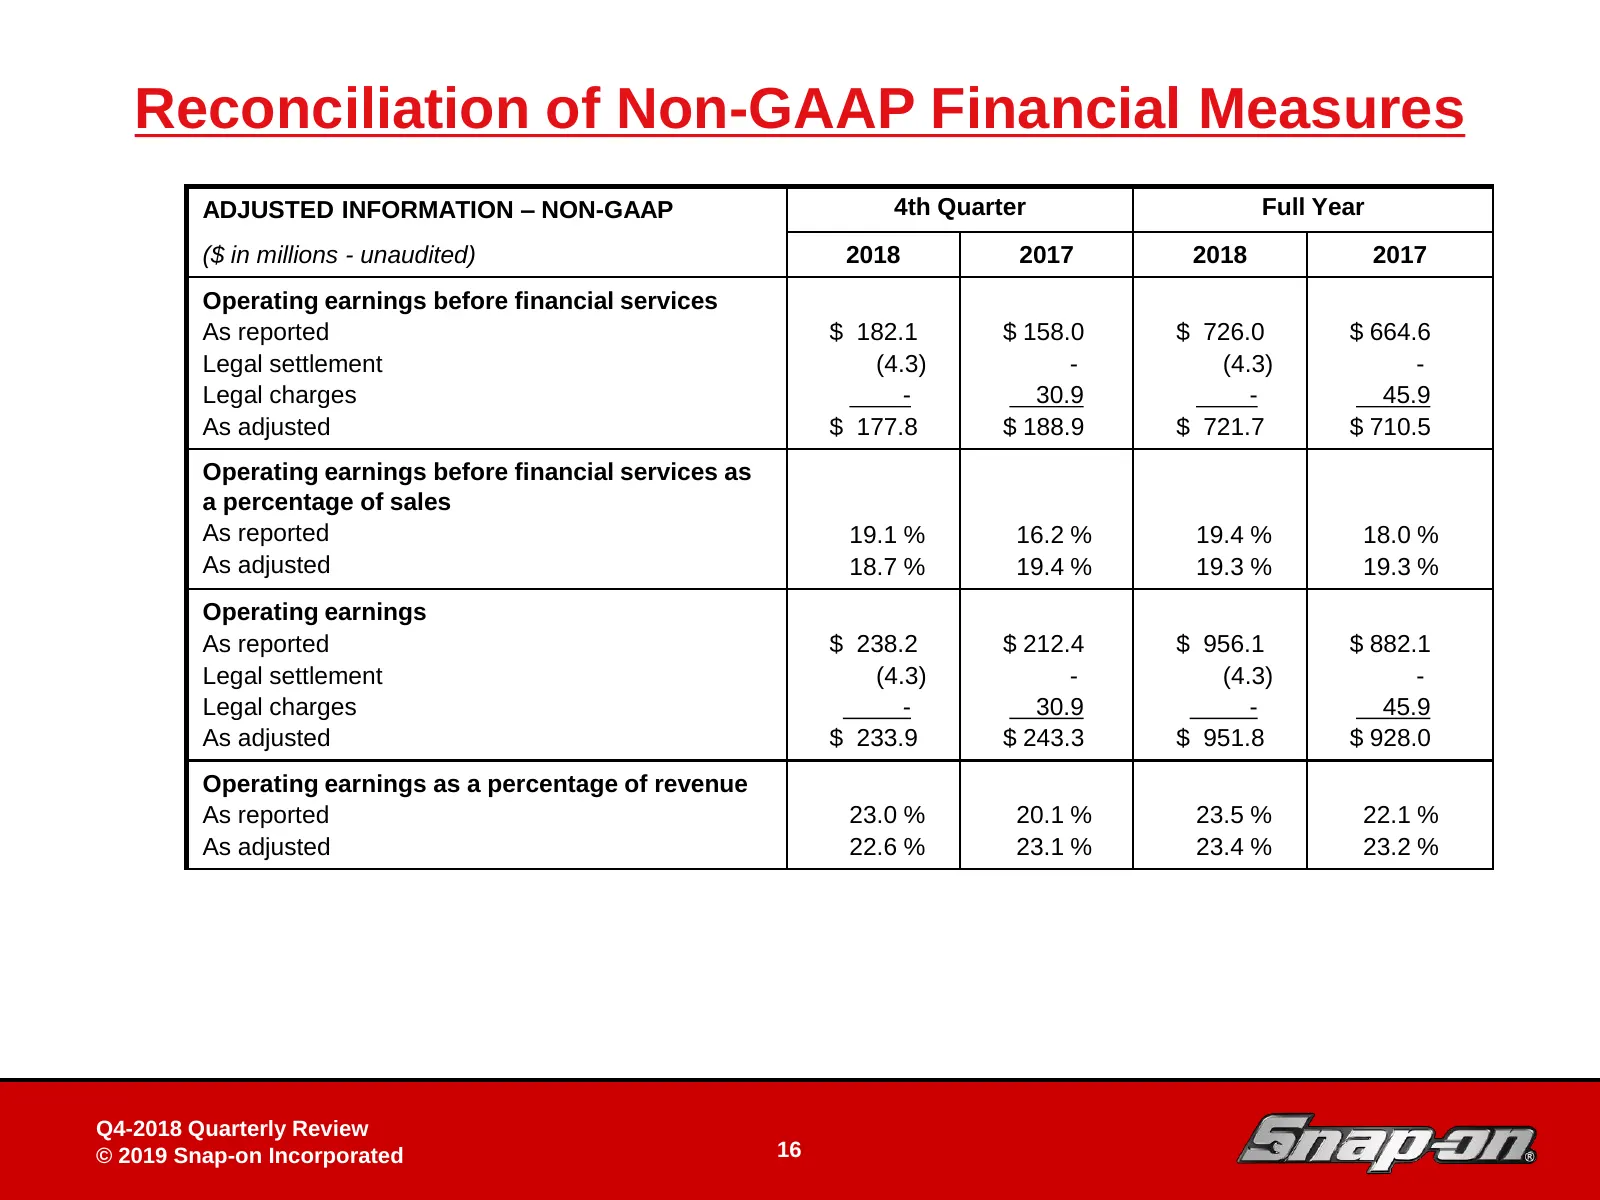
Reconciliation of Non-GAAP Financial Measures ADJUSTED INFORMATION – NON-GAAP 4th Quarter Full Year ($ in millions - unaudited) 2018 2017 2018 2017 Operating earnings before financial services As reported $ 182.1 $ 158.0 $ 726.0 $ 664.6 Legal settlement (4.3) - (4.3) - Legal charges - 30.9 - 45.9 As
Slide 17: Reconciliation of Non-GAAP Financial Measures
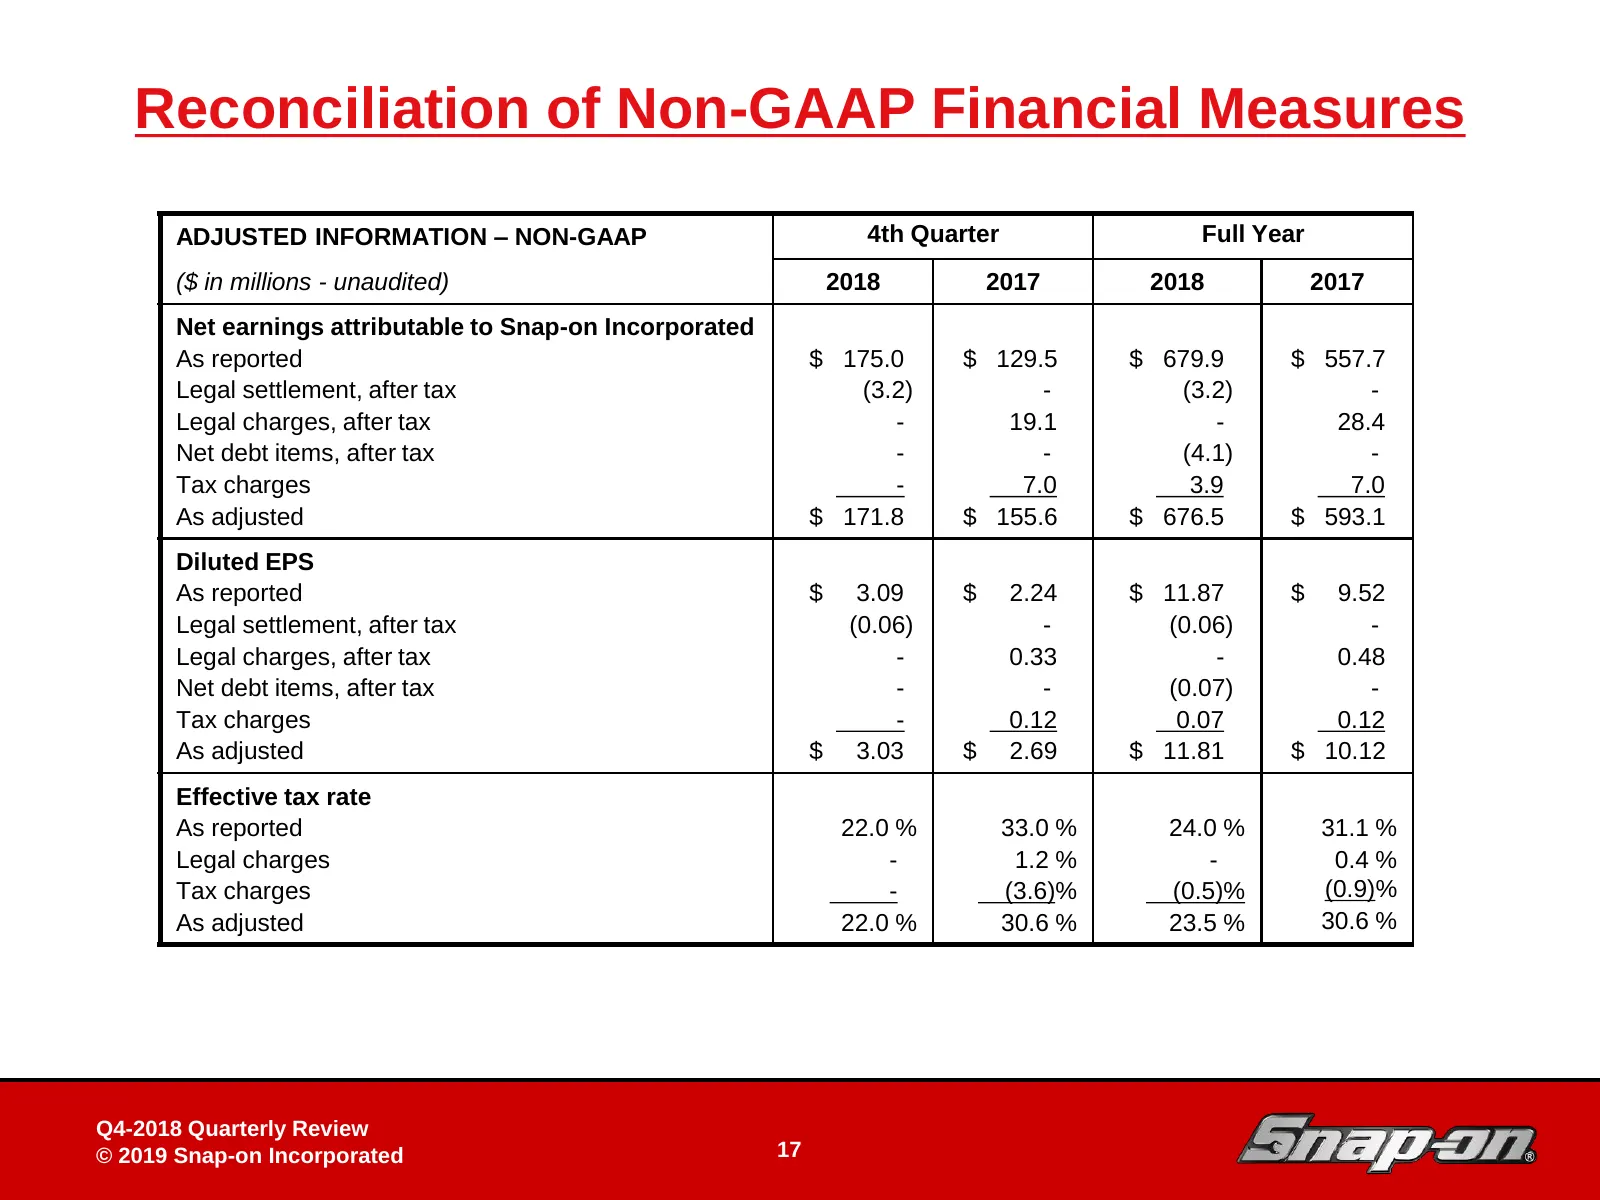
Reconciliation of Non-GAAP Financial Measures ADJUSTED INFORMATION – NON-GAAP 4th Quarter Full Year ($ in millions - unaudited) 2018 2017 2018 2017 Net earnings attributable to Snap-on Incorporated As reported $ 175.0 $ 129.5 $ 679.9 $ 557.7 Legal settlement, after tax (3.2) - (3.2) - Legal charges,
Source: Internet Archive copy of snapon.com