OR Royalties Inc. · TSX:OR
OR Royalties — Investor Day (November 2026)
89 slides from OR Royalties's investor day presentation, Nov 19, 2026
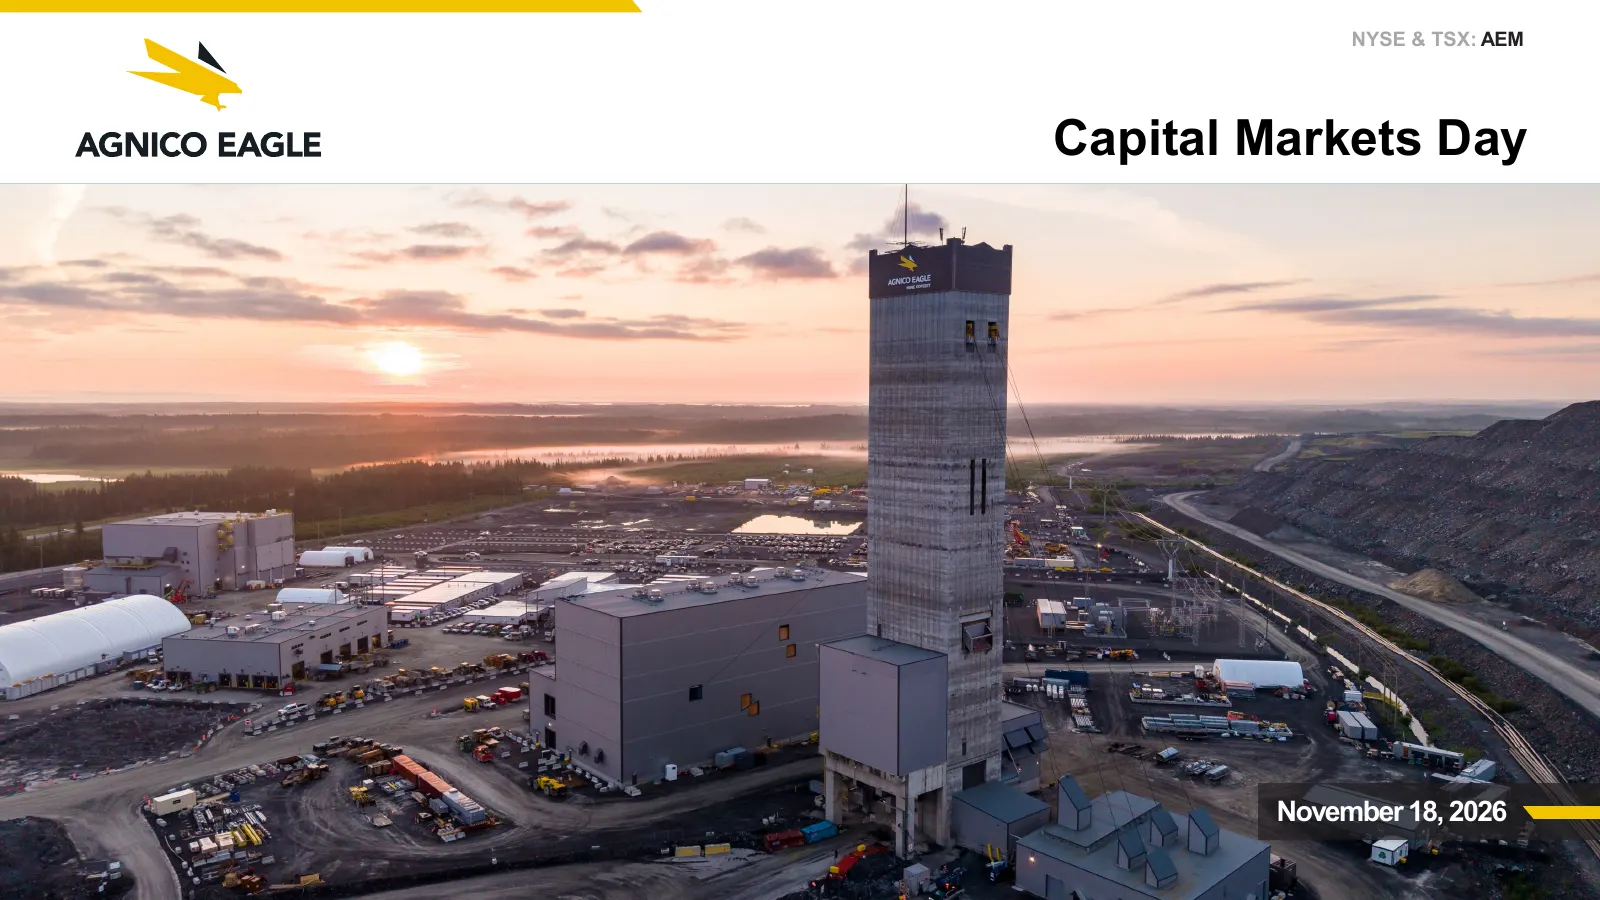
Slide 1: Capital Markets Day
NYSE & TSX: AEM Capital Markets Day November 18, 2026
Slide 2: Notes to Investors
Notes to Investors Forward-Looking Statements The information in this presentation has been prepared as at November 17, 2026. Certain statements contained in this presentation constitute "forward-looking statements" within the meaning of the United States Private Securities Litigation Reform Act of
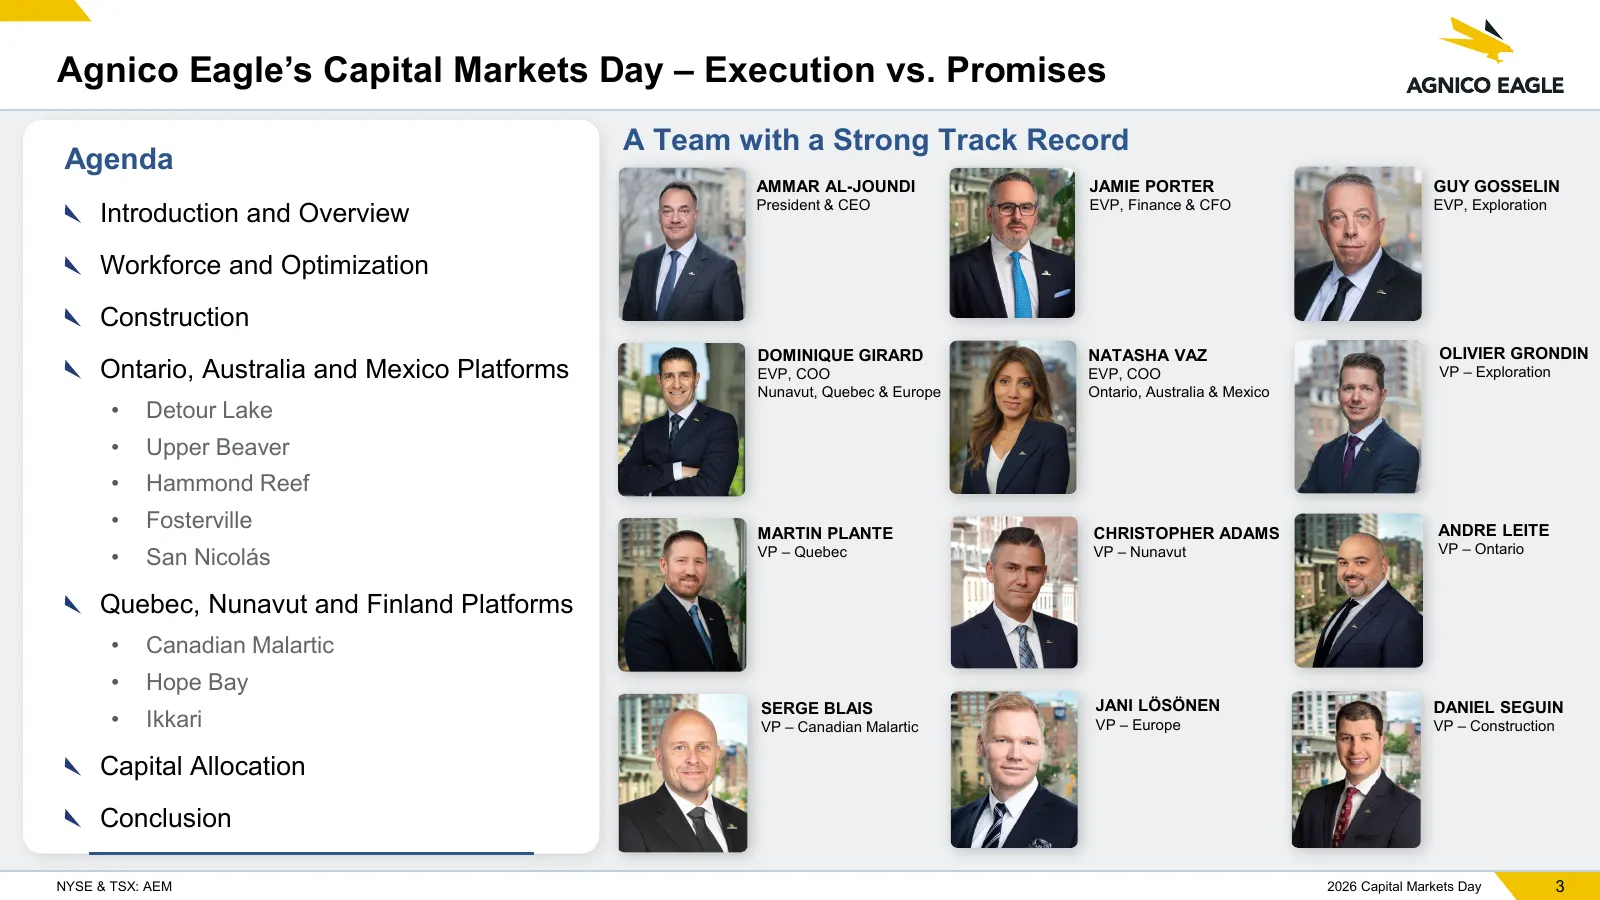
Slide 3: Agenda and presenters
Agnico Eagle’s Capital Markets Day – Execution vs. Promises A Team with a Strong Track Record Agenda AMMAR AL-JOUNDI JAMIE PORTER GUY GOSSELIN President & CEO EVP, Exploration Introduction and Overview EVP, Finance & CFO Workforce and Optimization Construction DOMINIQUE GIRARD NATASHA VAZ OLIVIER GR
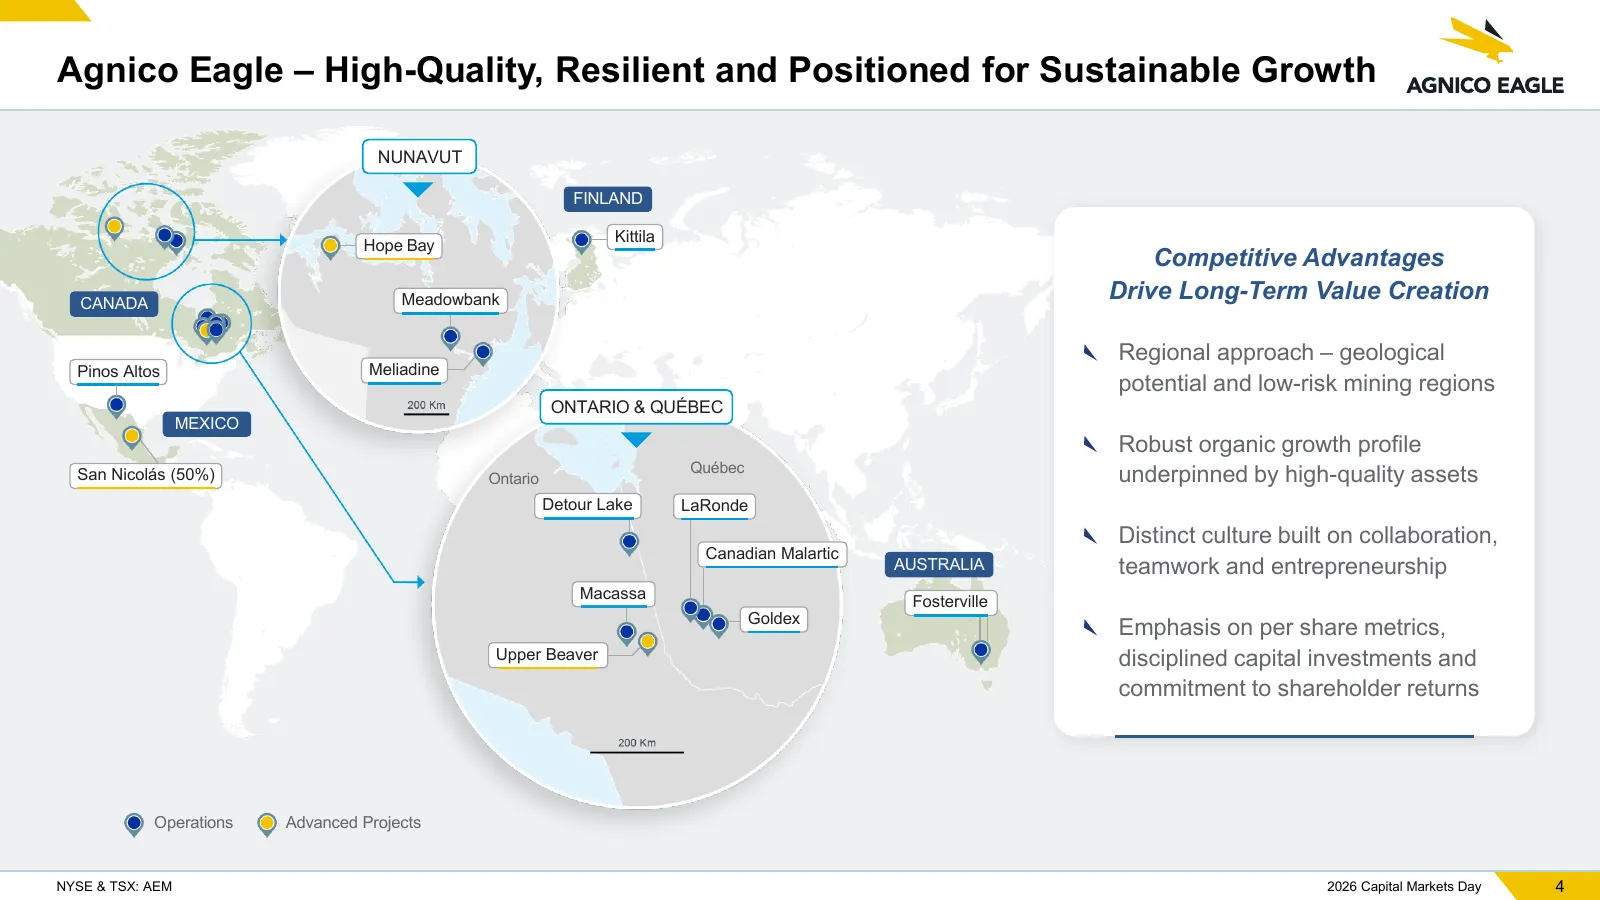
Slide 4: High-Quality, Resilient and Positioned for Sustainable Growth
Agnico Eagle – High-Quality, Resilient and Positioned for Sustainable Growth NUNAVUT FINLAND Kittila Hope Bay Competitive Advantages CANADA Meadowbank Drive Long-Term Value Creation Regional approach – geological Pinos Altos Meliadine potential and low-risk mining regions ONTARIO & QUÉBEC MEXICO Rob
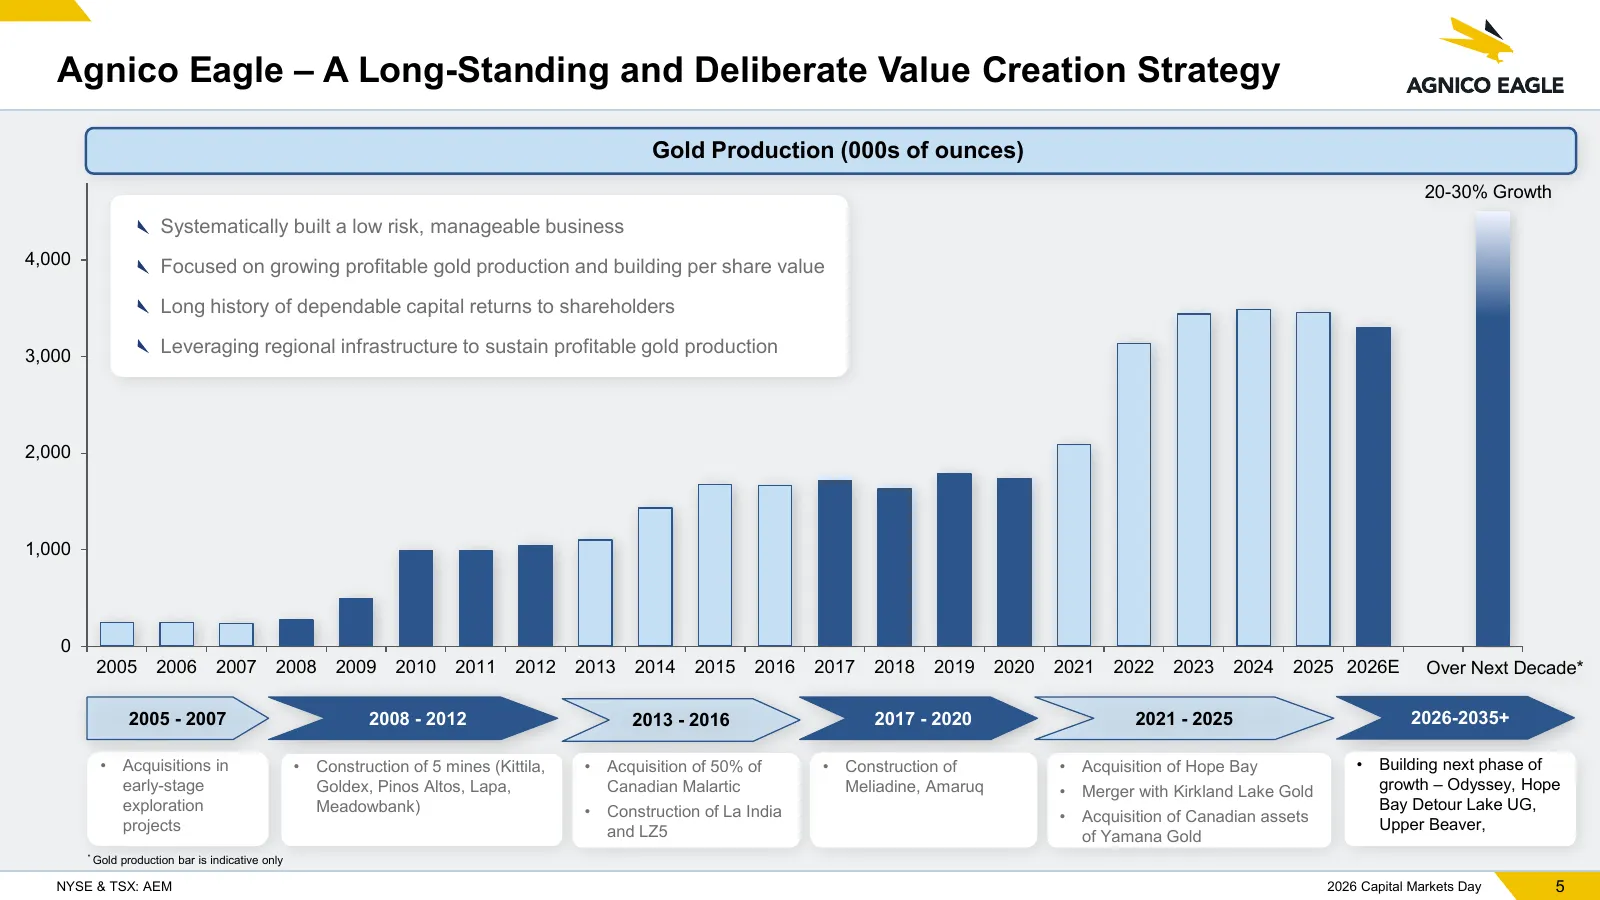
Slide 5: A Long-Standing and Deliberate Value Creation Strategy
Agnico Eagle – A Long-Standing and Deliberate Value Creation Strategy Gold Production (000s of ounces) 20-30% Growth Systematically built a low risk, manageable business 4,000 Focused on growing profitable gold production and building per share value Long history of dependable capital returns to sha
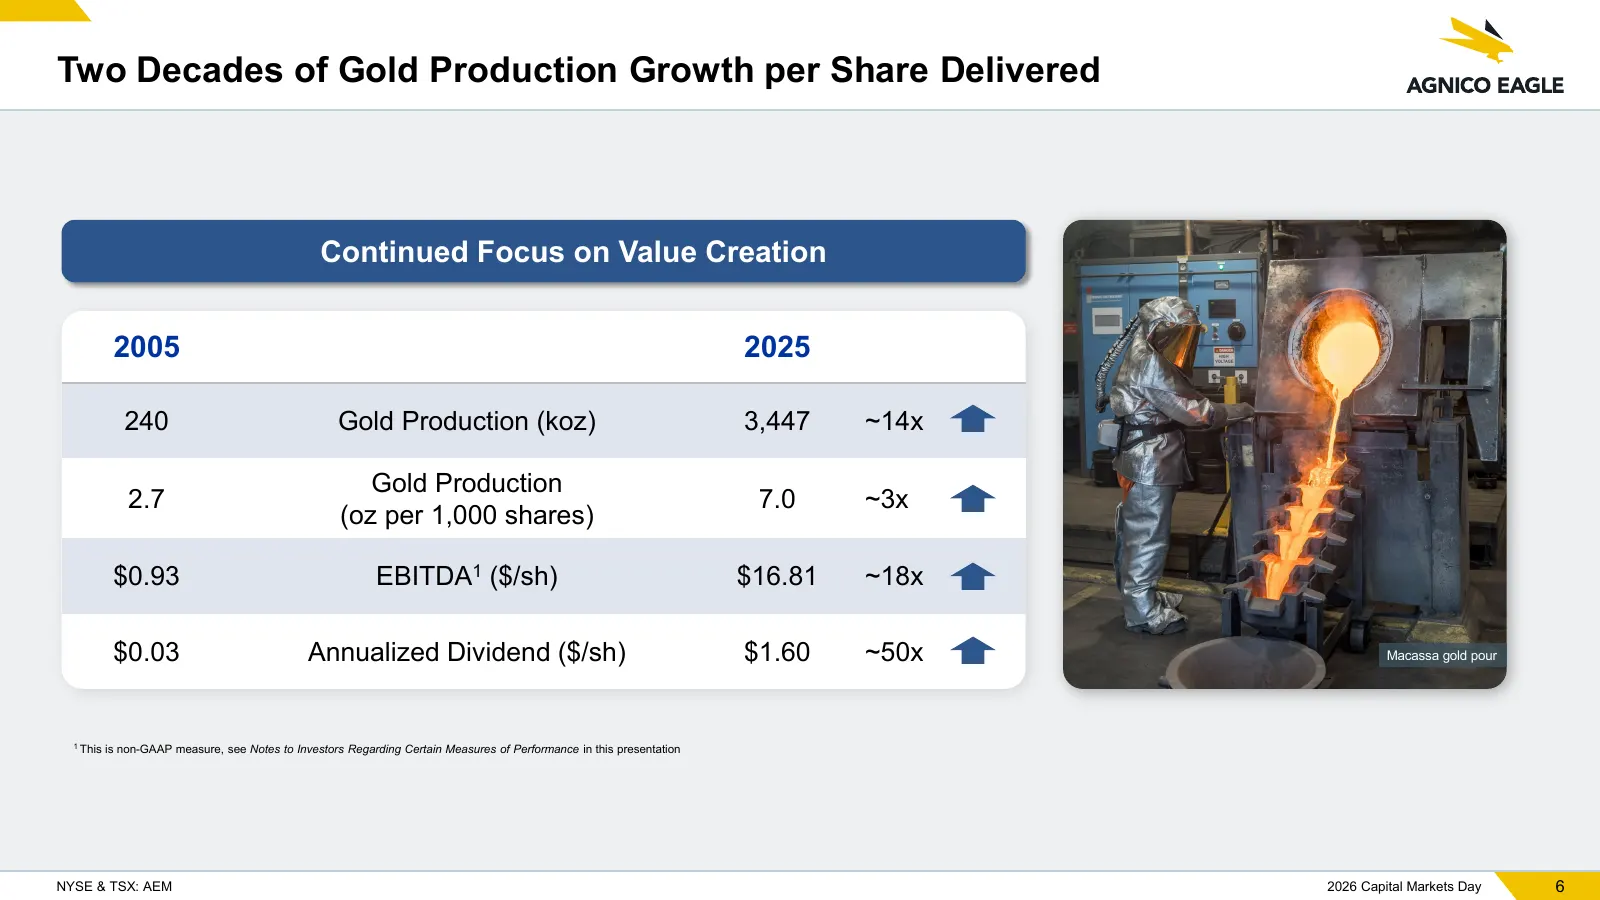
Slide 6: Two Decades of Gold Production Growth per Share Delivered
Two Decades of Gold Production Growth per Share Delivered Continued Focus on Value Creation 2005 2025 240 Gold Production (koz) 3,447 ~14x Gold Production 2.7 7.0 ~3x (oz per 1,000 shares) $0.93 EBITDA1 ($/sh) $16.81 ~18x $0.03 Annualized Dividend ($/sh) $1.60 ~50x Macassa gold pour 1 This is non-GA
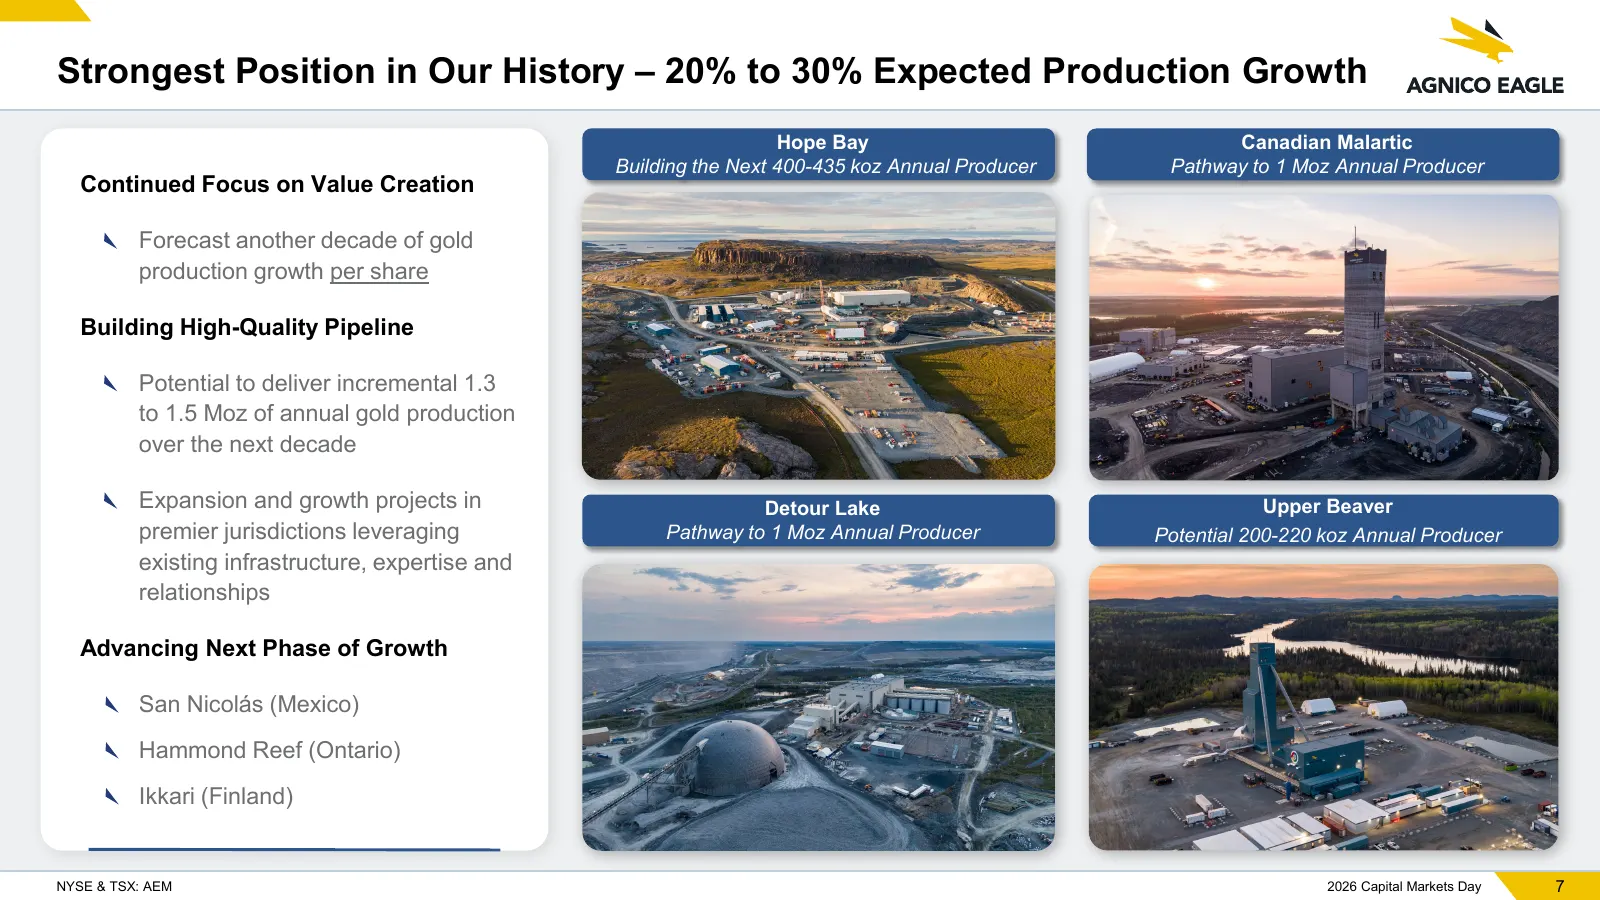
Slide 7: 20% to 30% Expected Production Growth
Strongest Position in Our History – 20% to 30% Expected Production Growth Hope Bay Canadian Malartic Building the Next 400-435 koz Annual Producer Pathway to 1 Moz Annual Producer Continued Focus on Value Creation Forecast another decade of gold production growth per share Building High-Quality Pipe
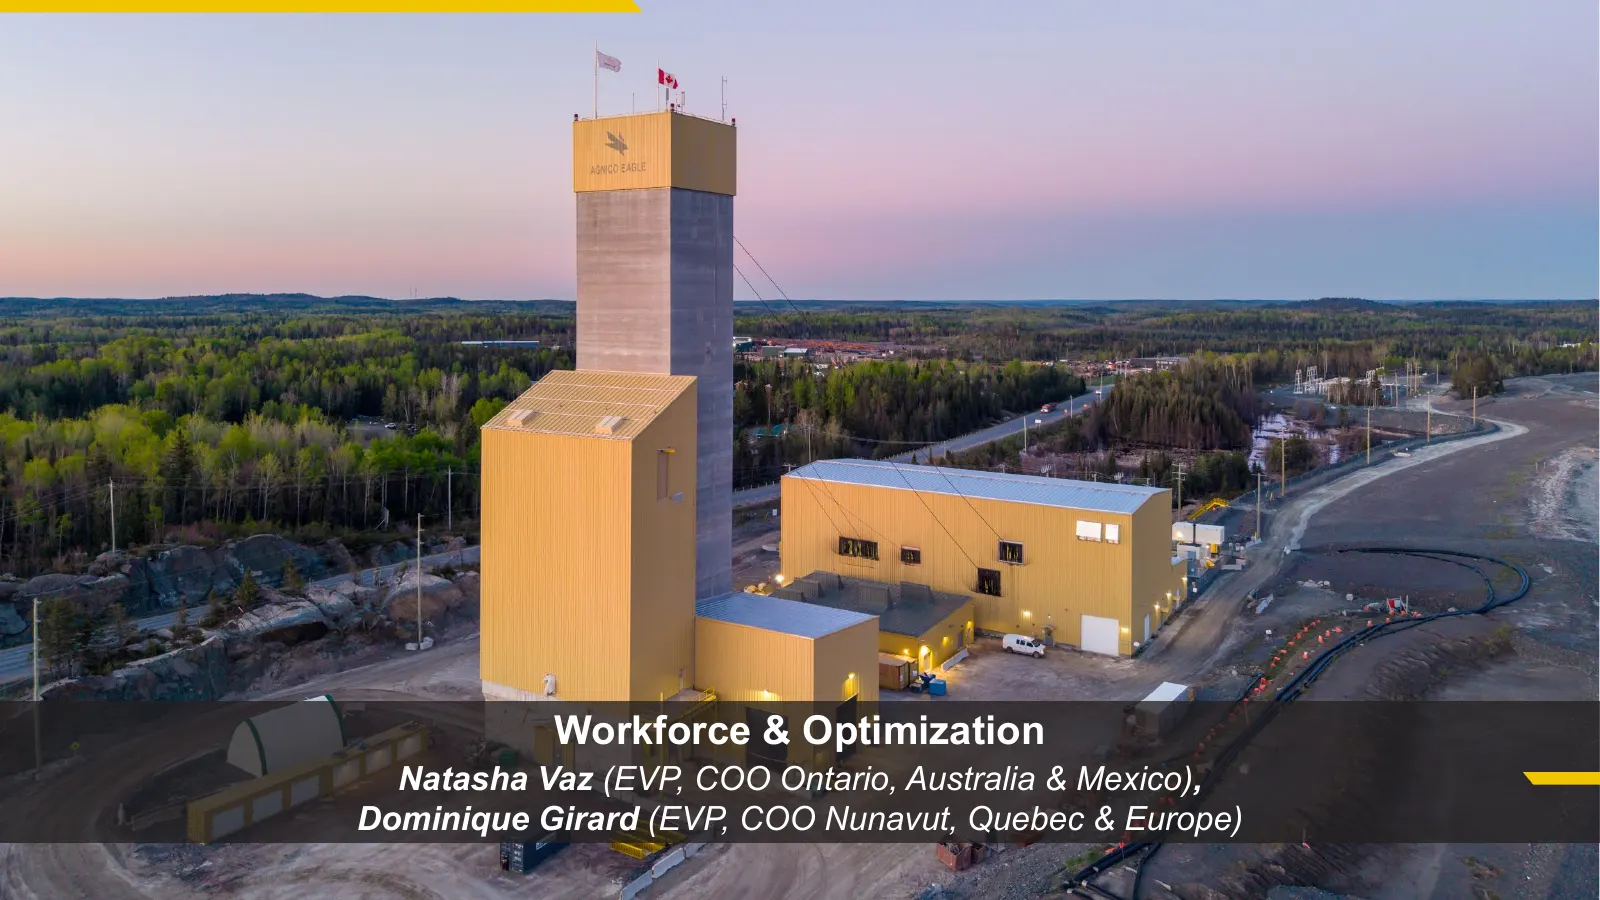
Slide 8: Workforce & Optimization
Workforce & Optimization Natasha Vaz (EVP, COO Ontario, Australia & Mexico), Dominique Girard (EVP, COO Nunavut, Quebec & Europe)
Slide 9: Building the Workforce Required to Deliver Our Growth
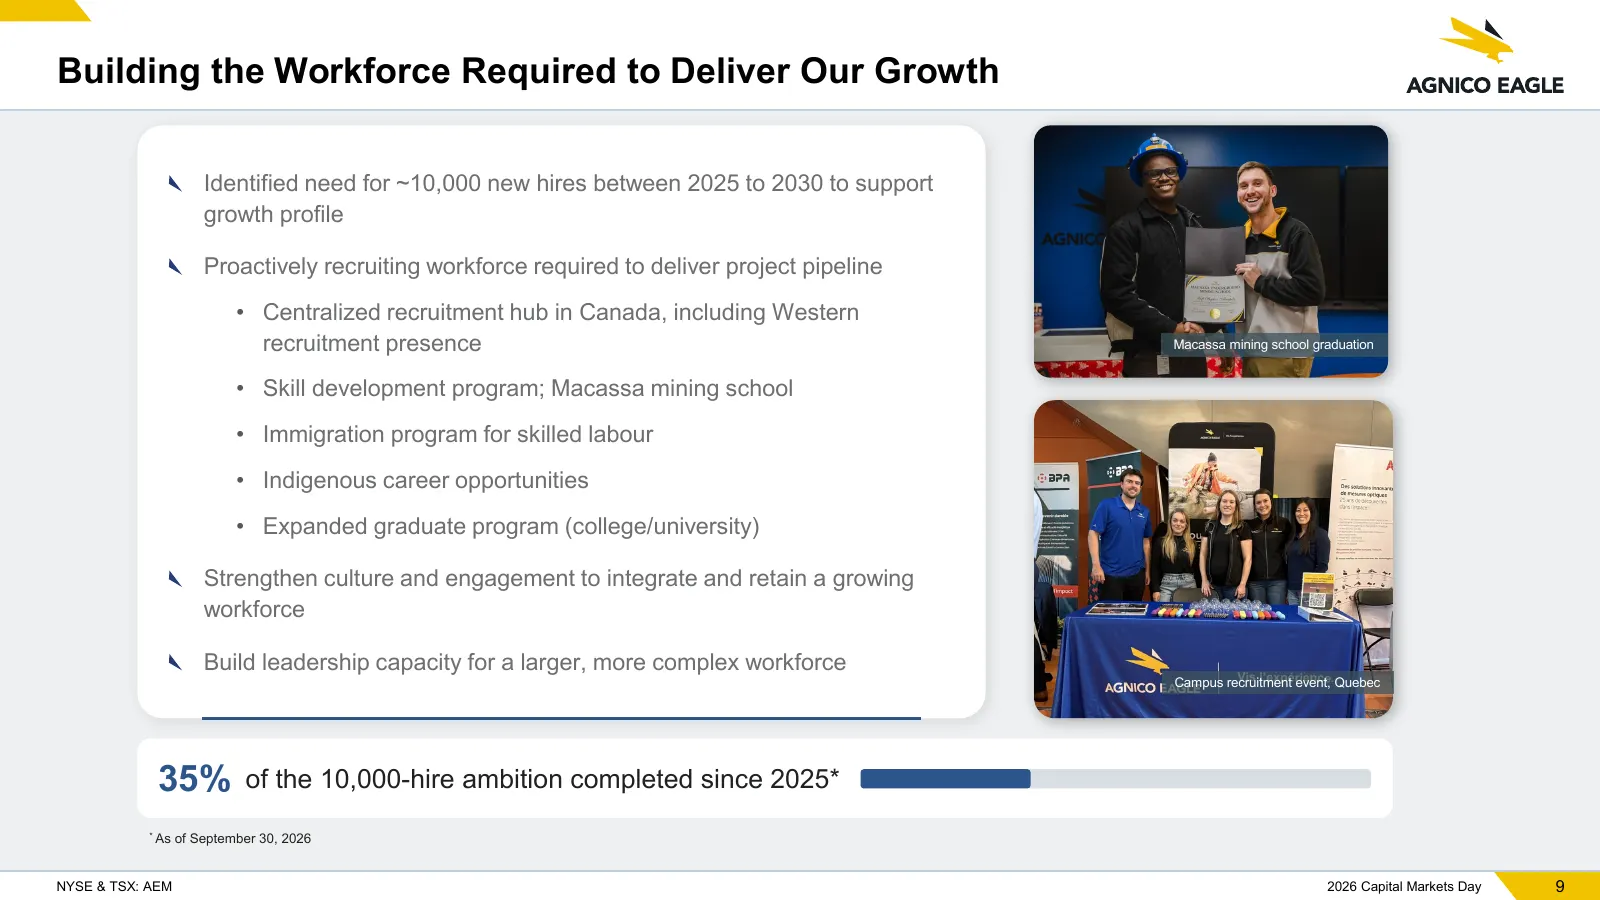
Building the Workforce Required to Deliver Our Growth Identified need for ~10,000 new hires between 2025 to 2030 to support growth profile Proactively recruiting workforce required to deliver project pipeline • Centralized recruitment hub in Canada, including Western recruitment presence Macassa min
Slide 10: Enhancing Productivity to Support Sustainable Growth
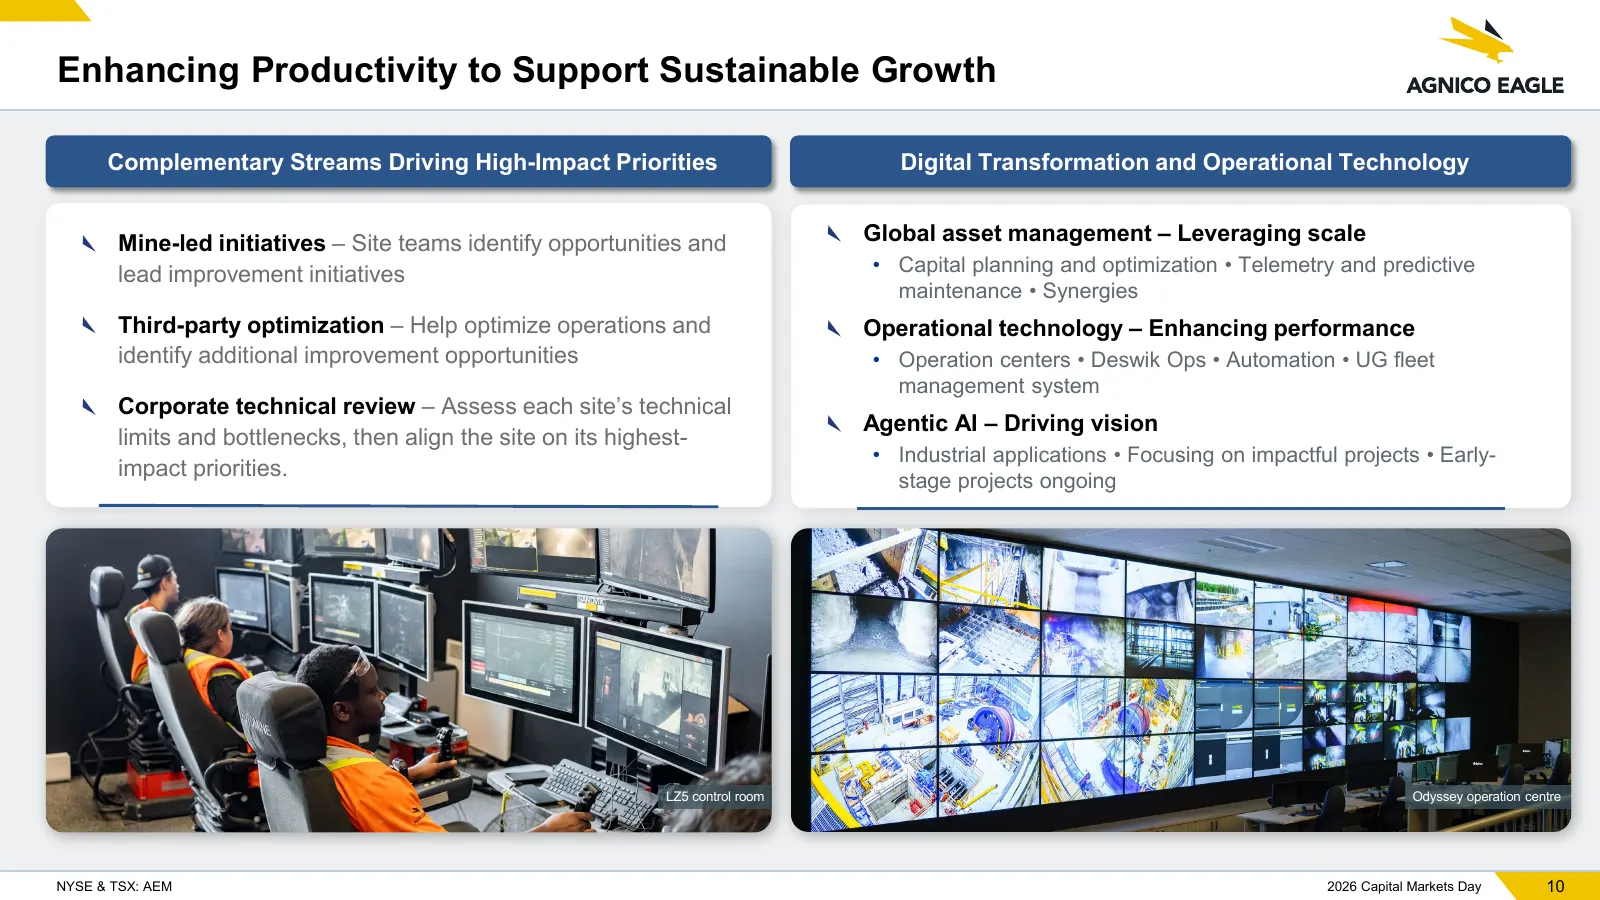
Enhancing Productivity to Support Sustainable Growth Complementary Streams Driving High-Impact Priorities Digital Transformation and Operational Technology Mine-led initiatives – Site teams identify opportunities and Global asset management – Leveraging scale lead improvement initiatives • Capital p
Slide 11: The Agnico Eagle Way
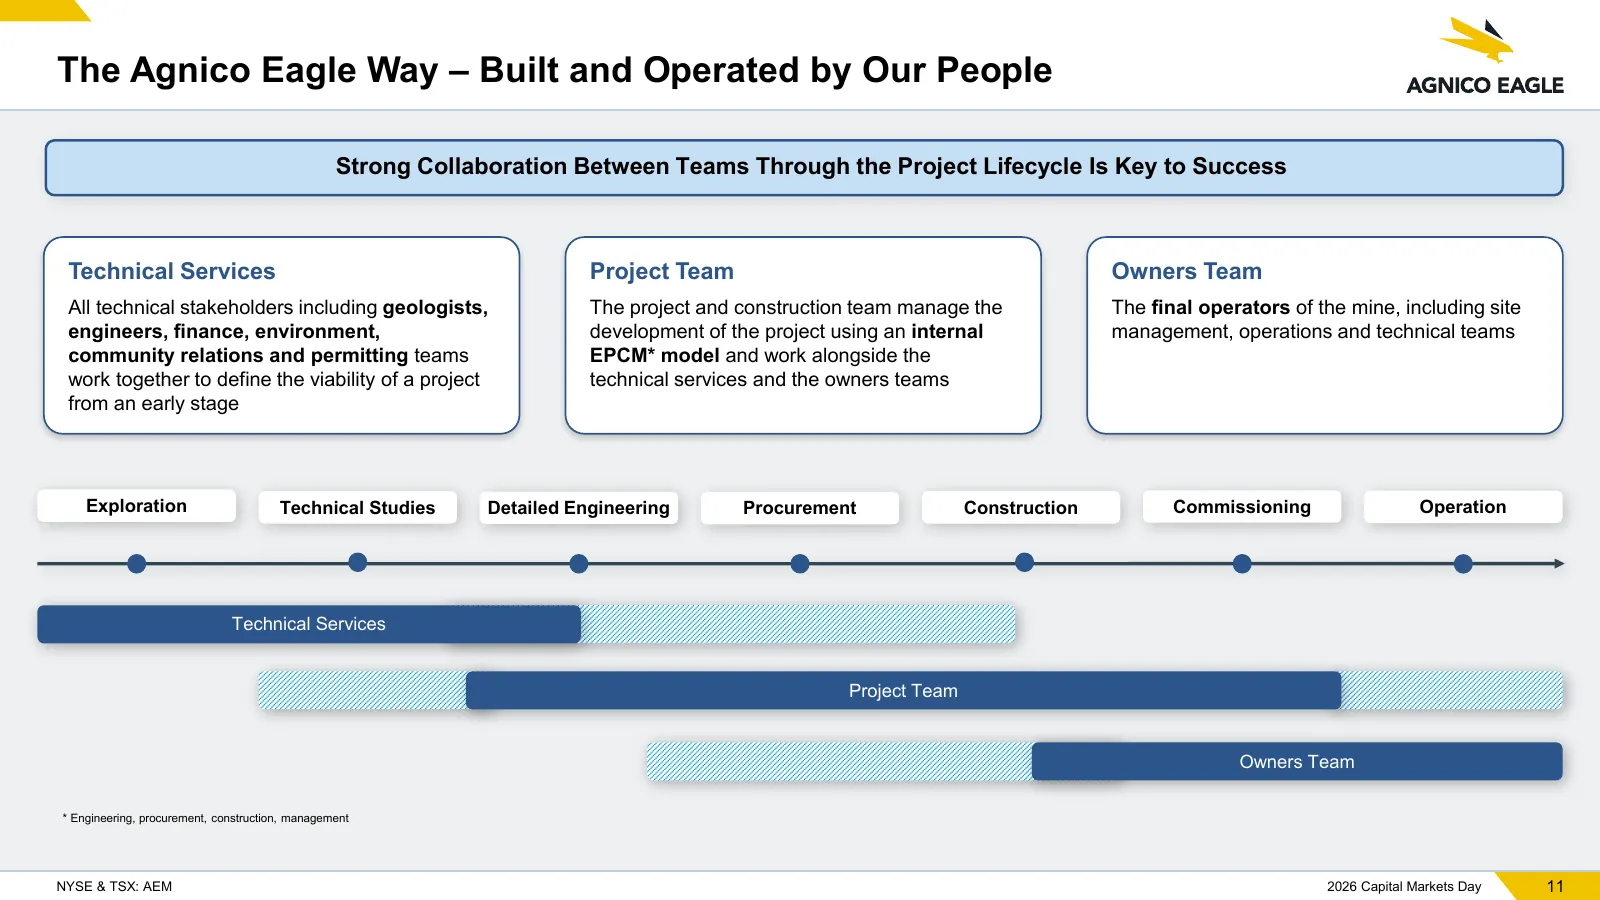
The Agnico Eagle Way – Built and Operated by Our People Strong Collaboration Between Teams Through the Project Lifecycle Is Key to Success Technical Services Project Team Owners Team All technical stakeholders including geologists, The project and construction team manage the The final operators of
Slide 12: Construction
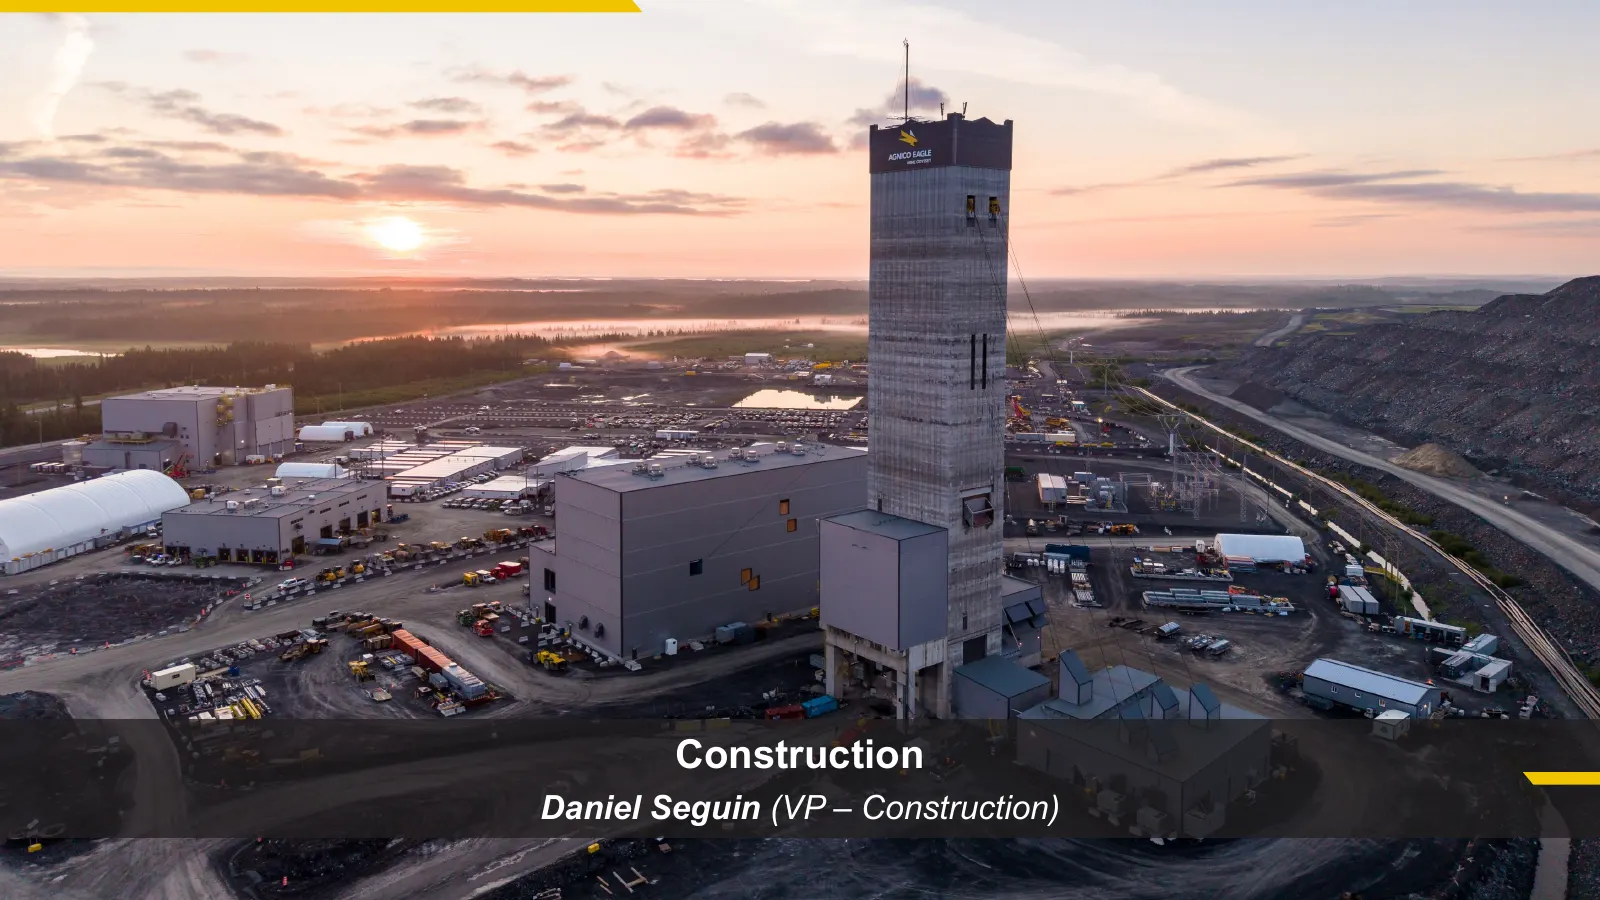
Construction Daniel Seguin (VP – Construction) NYSE & TSX: AEM 2026 Capital Markets Day
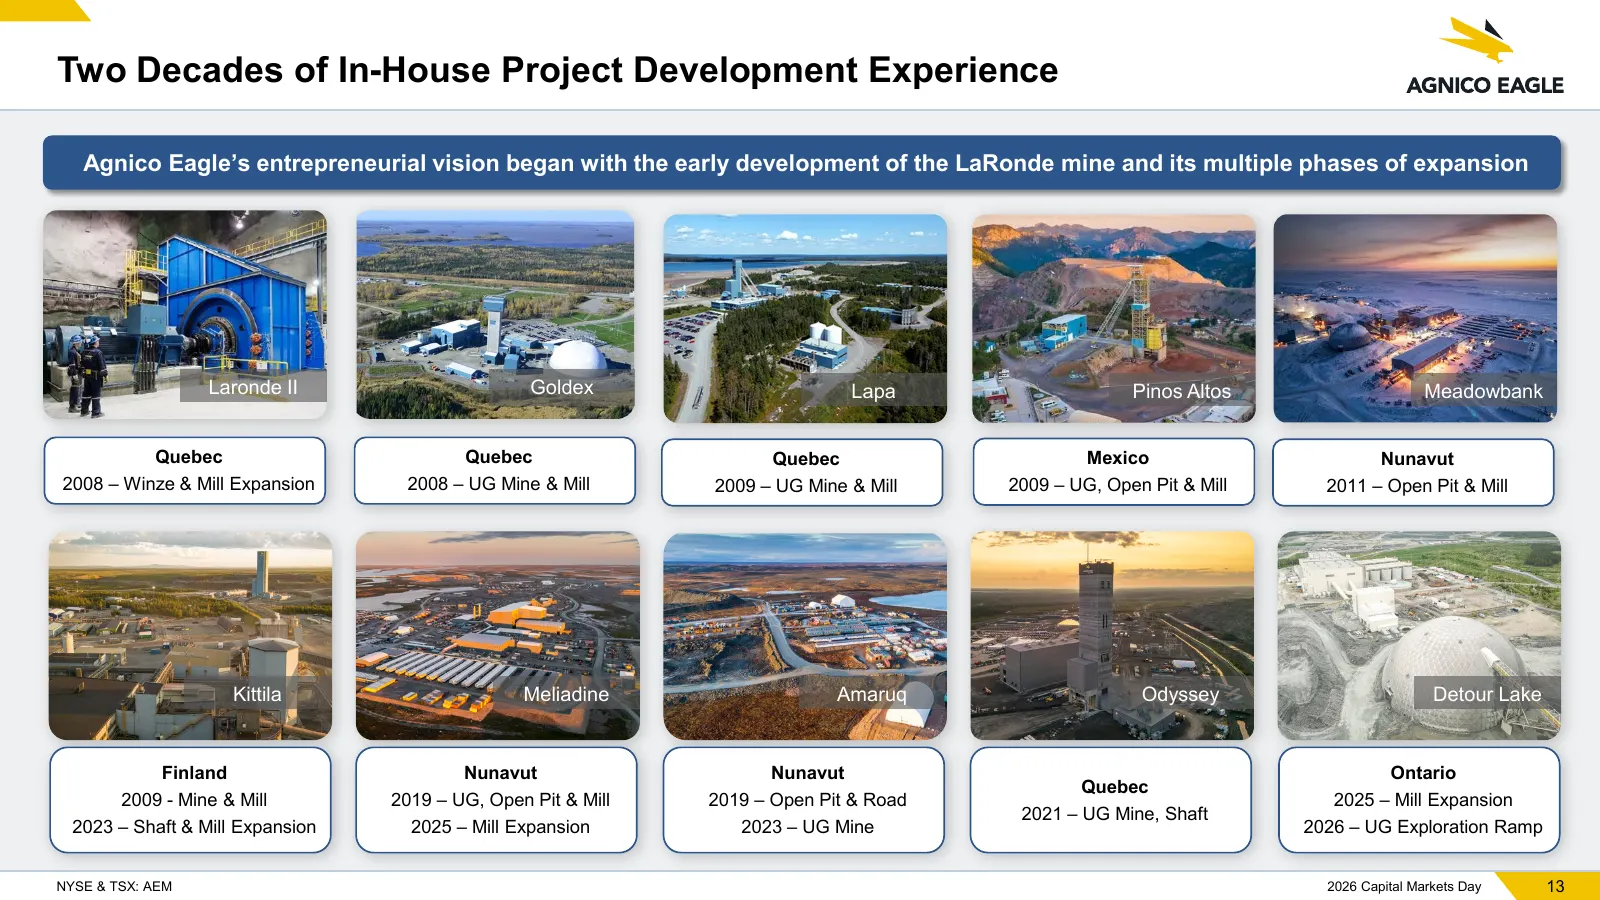
Slide 13: Two Decades of In-House Project Development Experience
Two Decades of In-House Project Development Experience Agnico Eagle’s entrepreneurial vision began with the early development of the LaRonde mine and its multiple phases of expansion Laronde II Goldex Lapa Pinos Altos Meadowbank Quebec Quebec Quebec Mexico Nunavut 2008 – Winze & Mill Expansion 2008
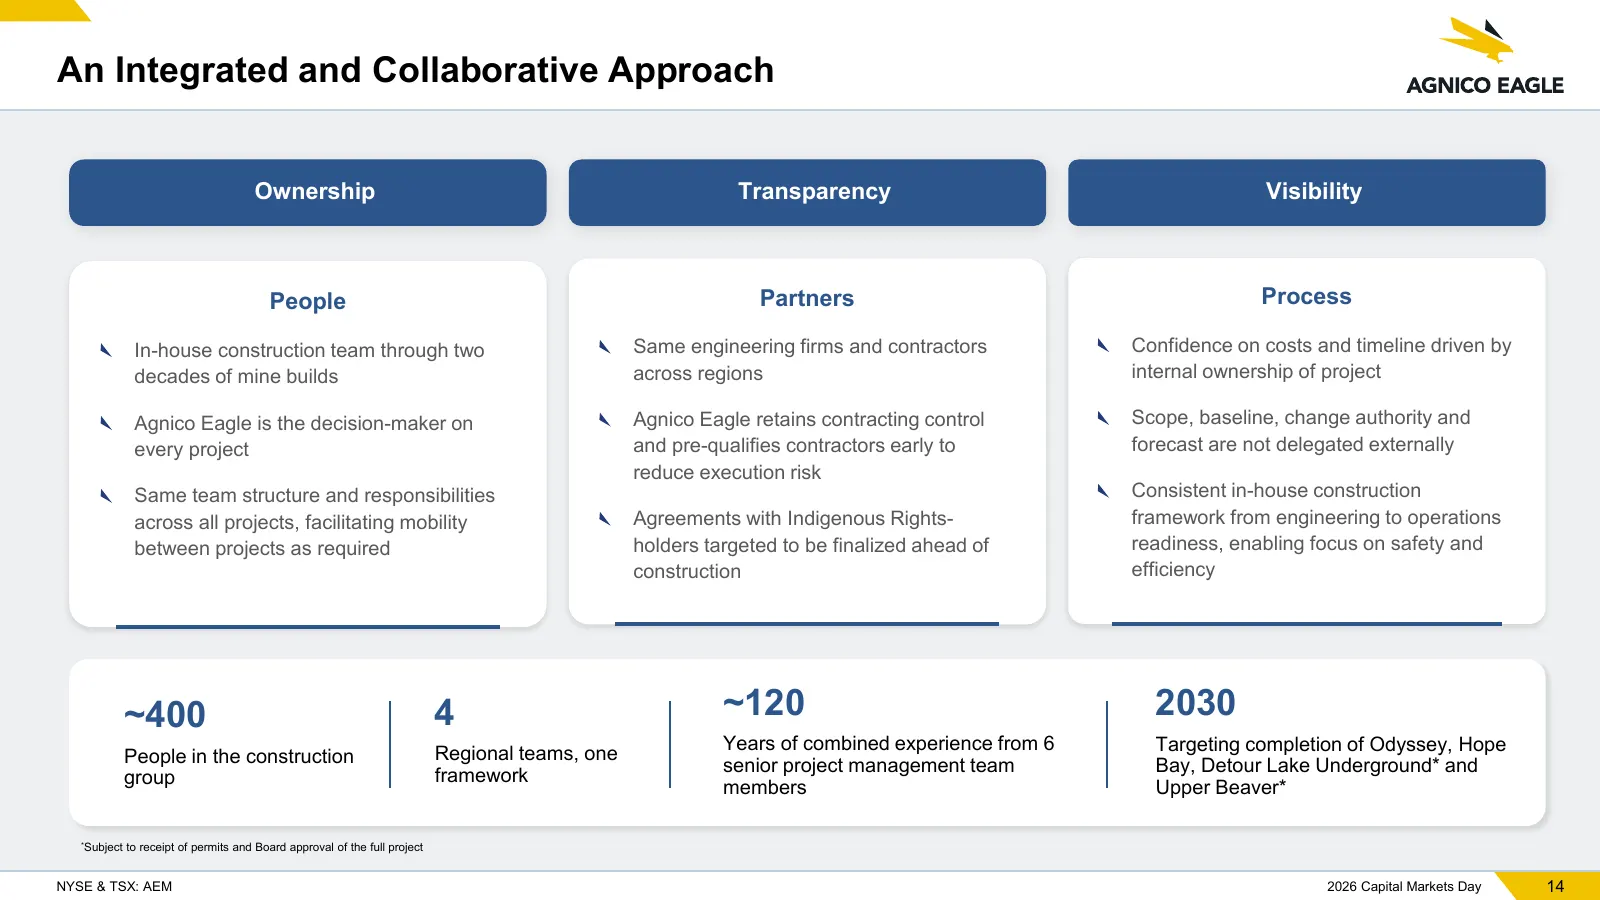
Slide 14: An Integrated and Collaborative Approach
An Integrated and Collaborative Approach Ownership Transparency Visibility People Partners Process In-house construction team through two Same engineering firms and contractors Confidence on costs and timeline driven by decades of mine builds across regions internal ownership of project Agnico Eagle
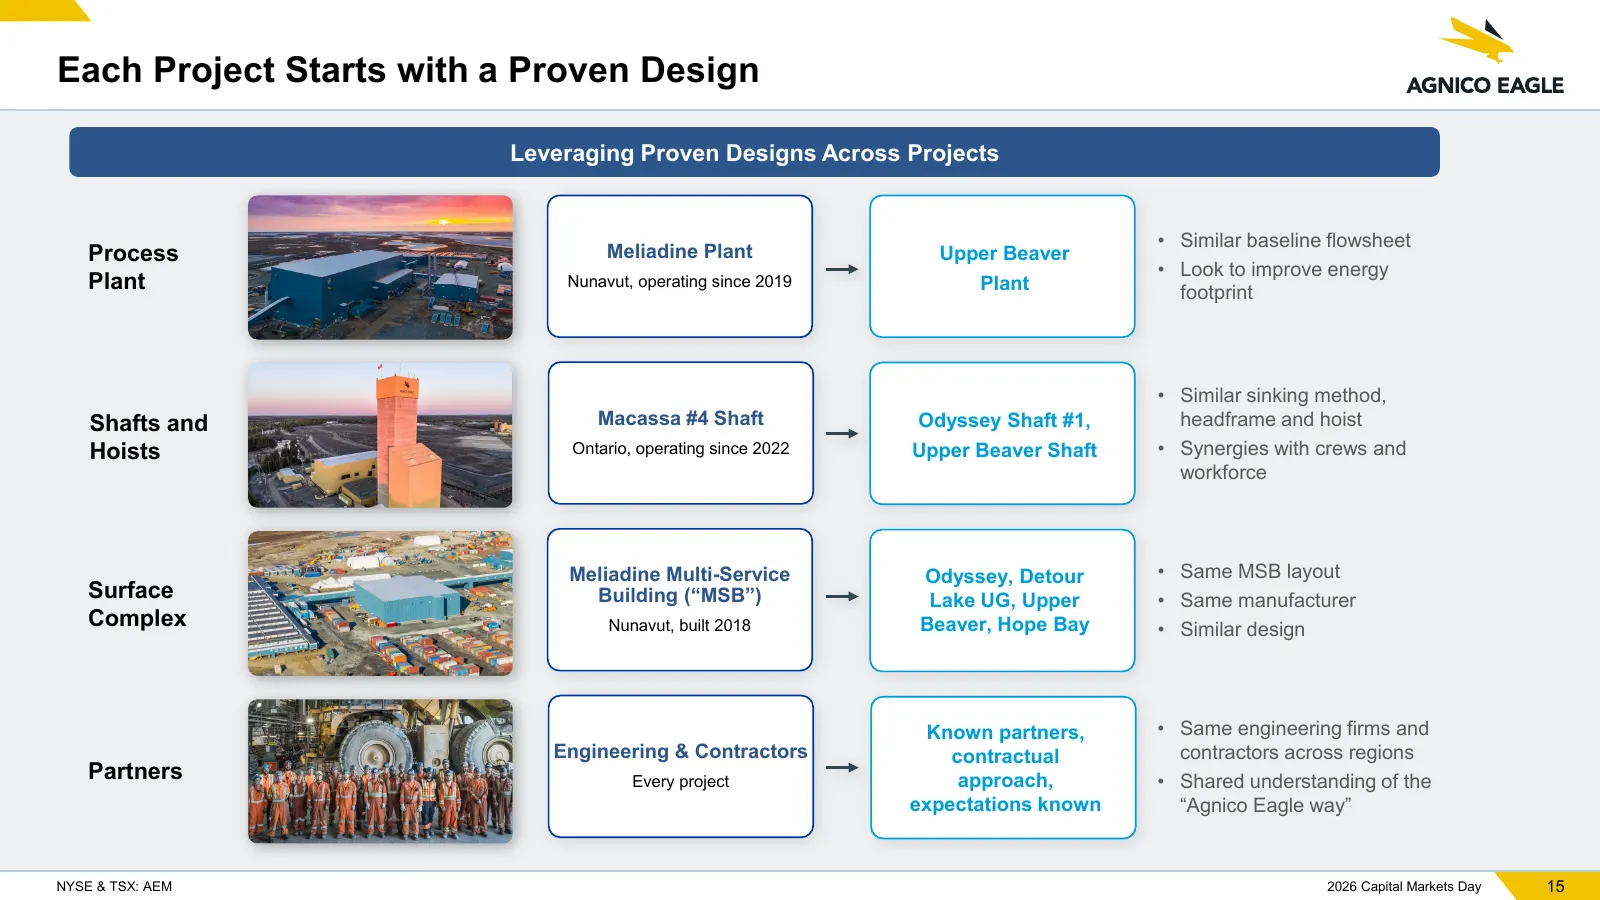
Slide 15: Each Project Starts with a Proven Design
Each Project Starts with a Proven Design Leveraging Proven Designs Across Projects • Similar baseline flowsheet Process Meliadine Plant Upper Beaver • Look to improve energy Plant Nunavut, operating since 2019 Plant footprint • Similar sinking method, Shafts and Macassa #4 Shaft Odyssey Shaft #1, he
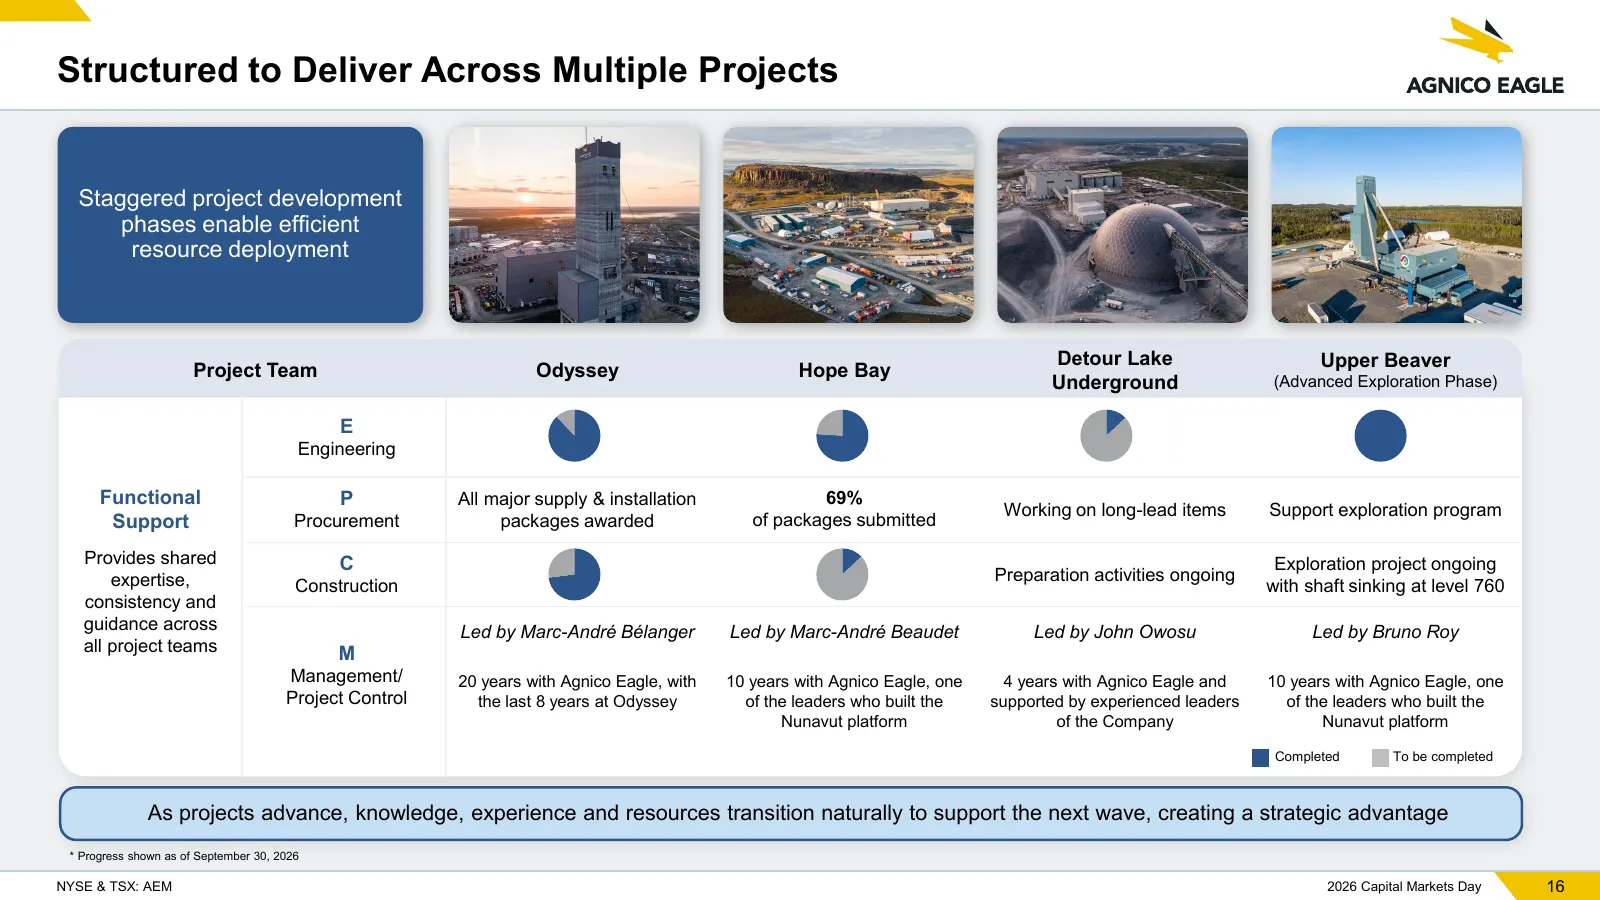
Slide 16: Structured to Deliver Across Multiple Projects
Structured to Deliver Across Multiple Projects Staggered project development phases enable efficient resource deployment Detour Lake Upper Beaver Project Team Odyssey Hope Bay Underground (Advanced Exploration Phase) E Engineering Functional P All major supply & installation 69% Working on long-lead
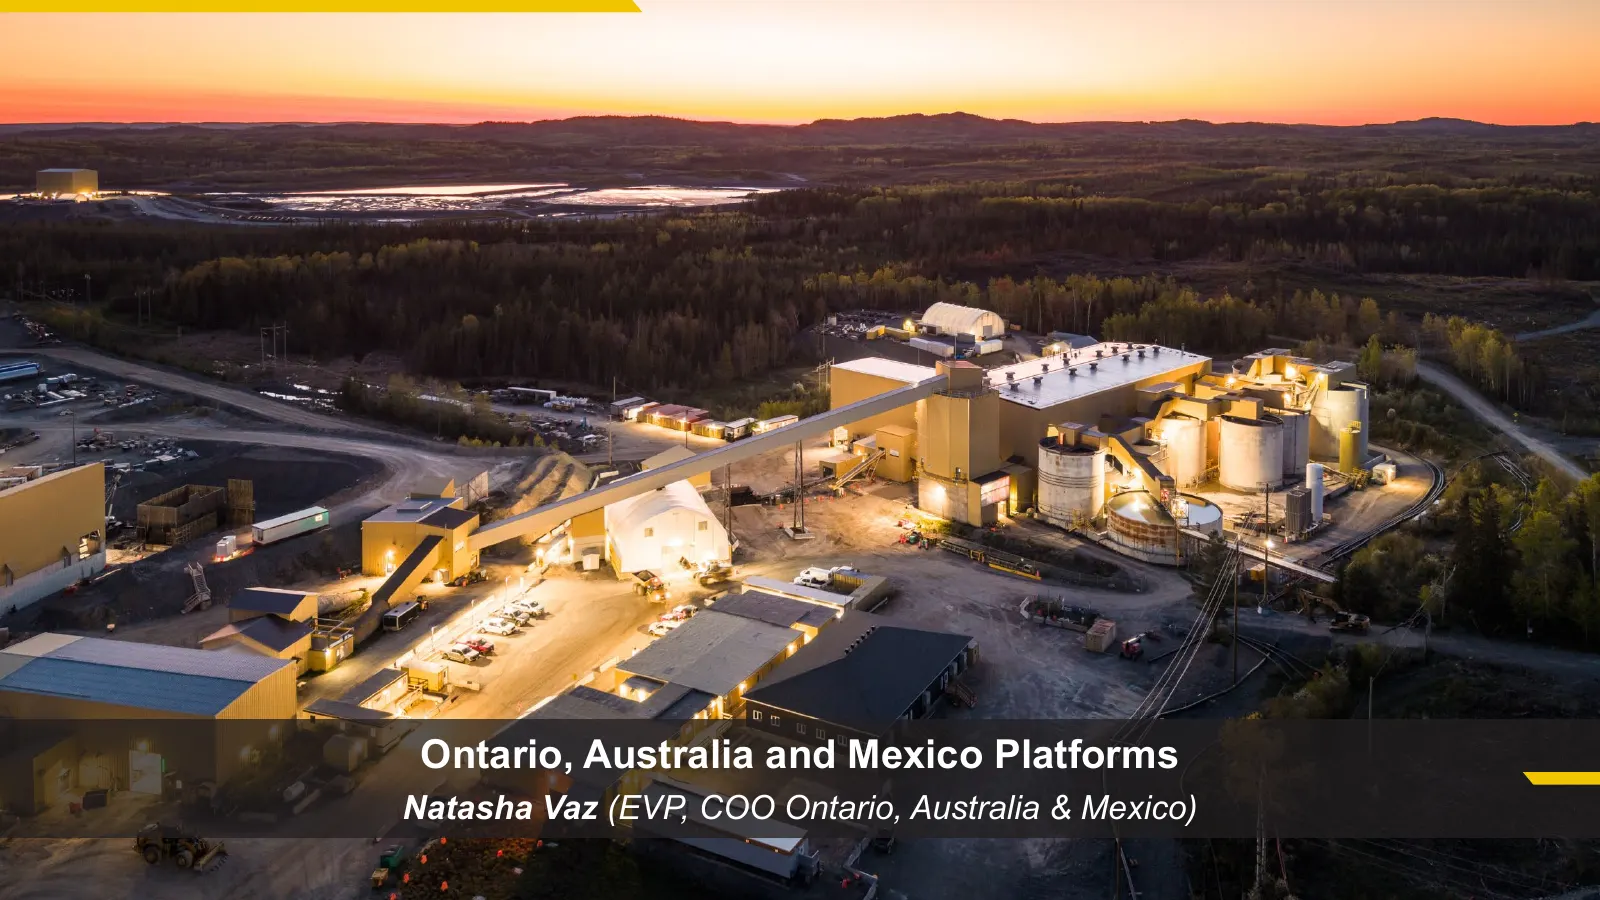
Slide 17: Ontario, Australia and Mexico Platforms
Ontario, Australia and Mexico Platforms Natasha Vaz (EVP, COO Ontario, Australia & Mexico) NYSE & TSX: AEM 2026 Capital Markets Day
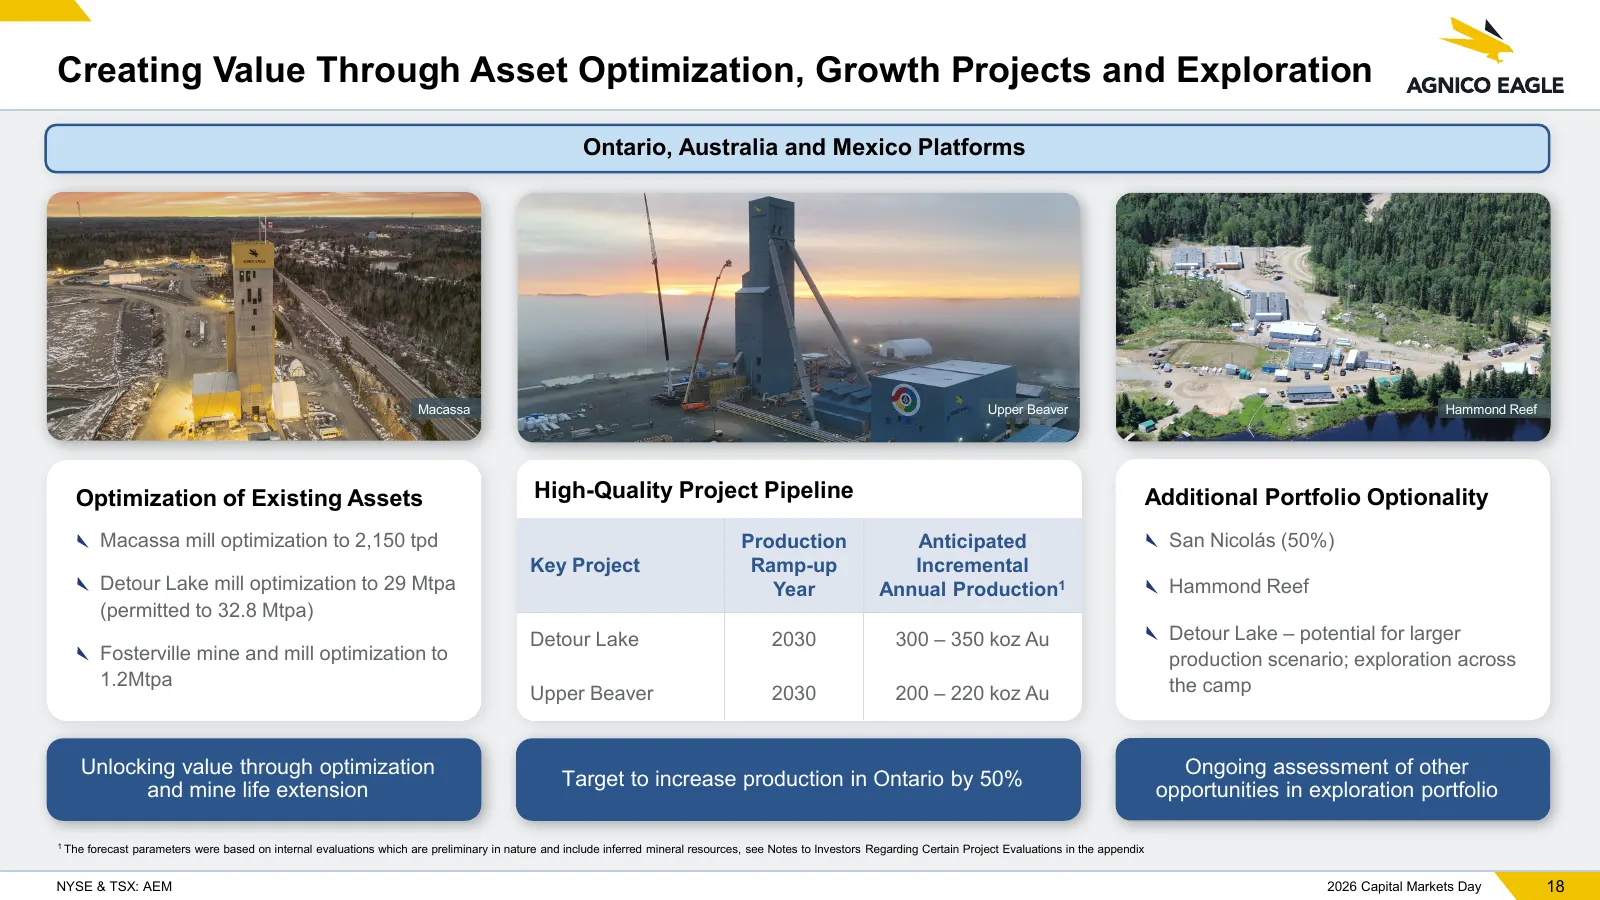
Slide 18: Creating Value Through Asset Optimization, Growth Projects and Exploration
Creating Value Through Asset Optimization, Growth Projects and Exploration Ontario, Australia and Mexico Platforms Macassa Upper Beaver Hammond Reef Optimization of Existing Assets High-Quality Project Pipeline Additional Portfolio Optionality Macassa mill optimization to 2,150 tpd Production Antici
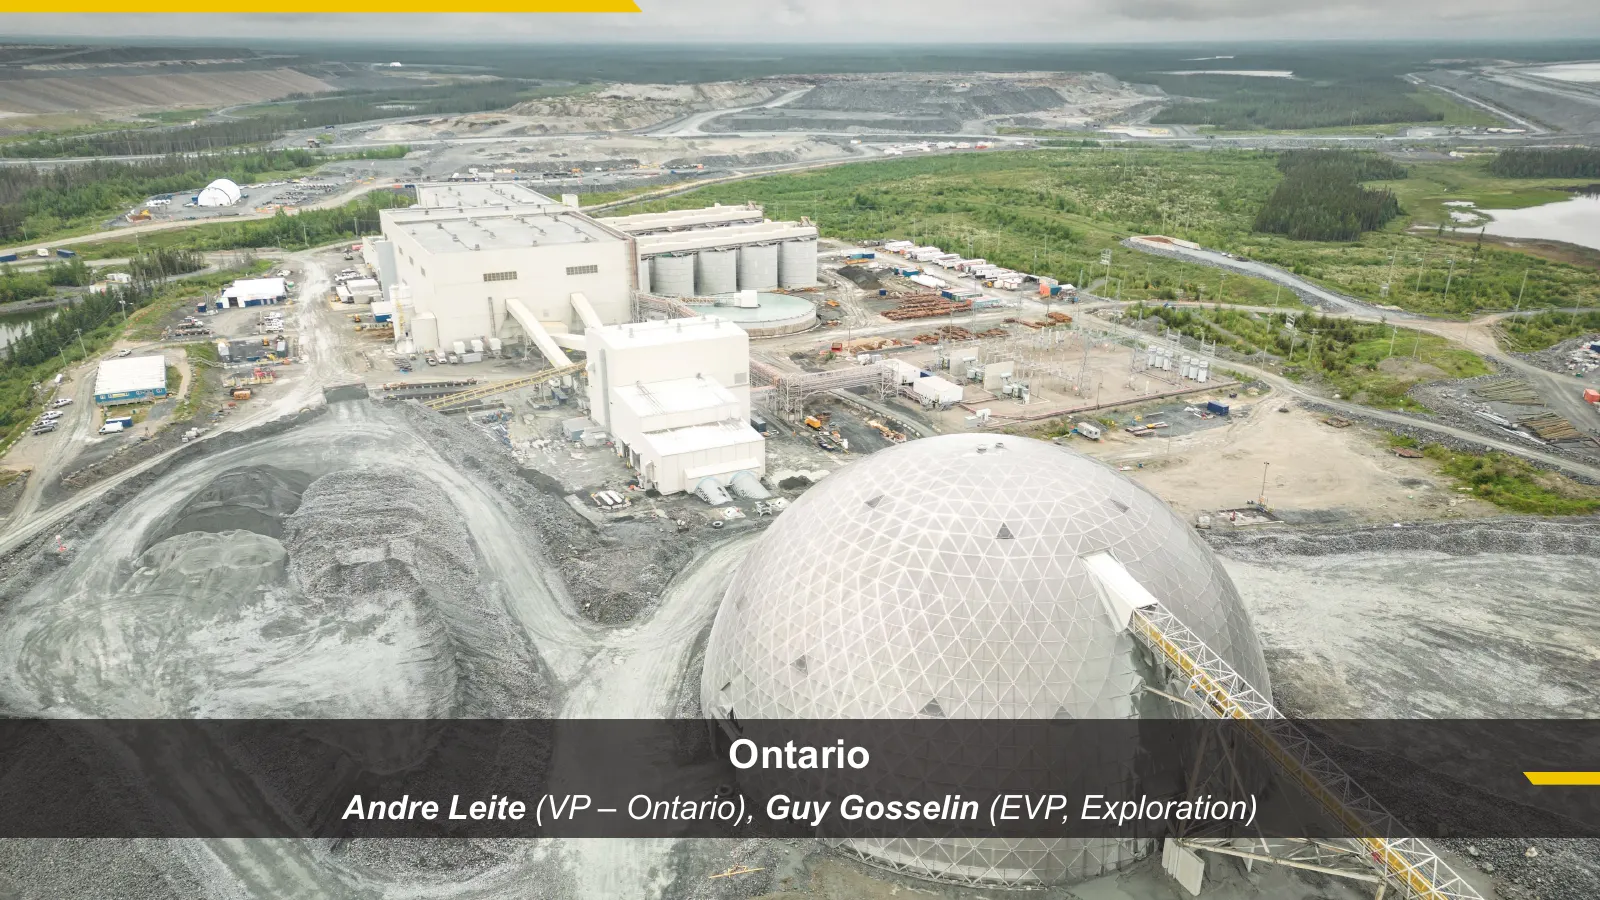
Slide 19: Ontario
Ontario Andre Leite (VP – Ontario), Guy Gosselin (EVP, Exploration)
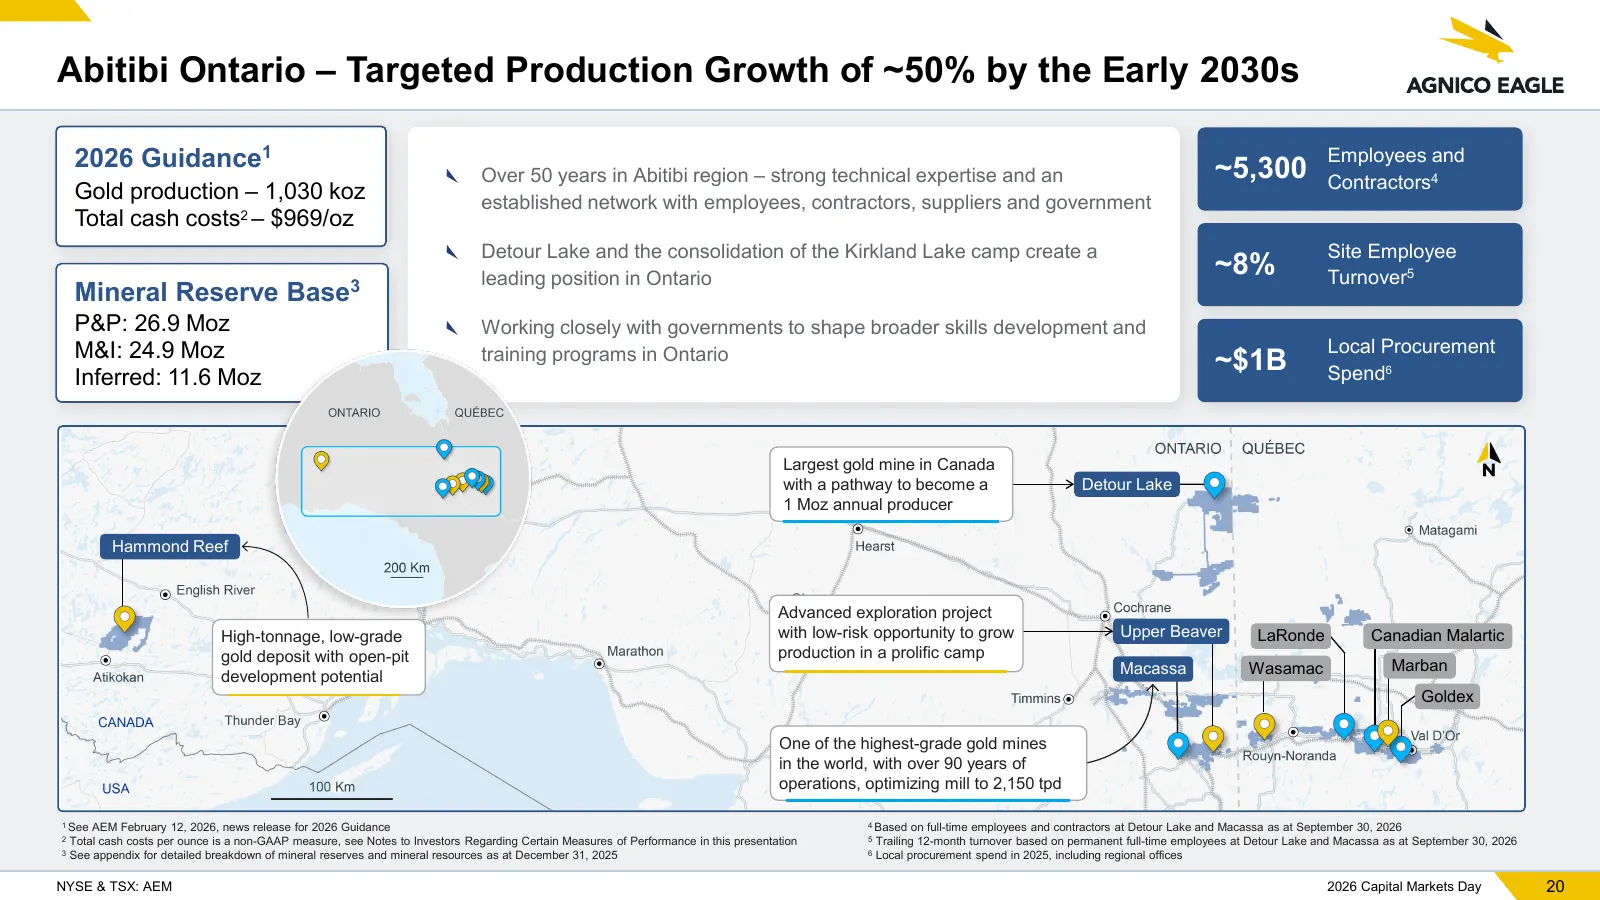
Slide 20: Abitibi Ontario – Targeted Production Growth of ~50%
Abitibi Ontario – Targeted Production Growth of ~50% by the Early 2030s 2026 Guidance1 ~5,300 Contractors4 Employees and Over 50 years in Abitibi region – strong technical expertise and an Gold production – 1,030 koz established network with employees, contractors, suppliers and government Total cas
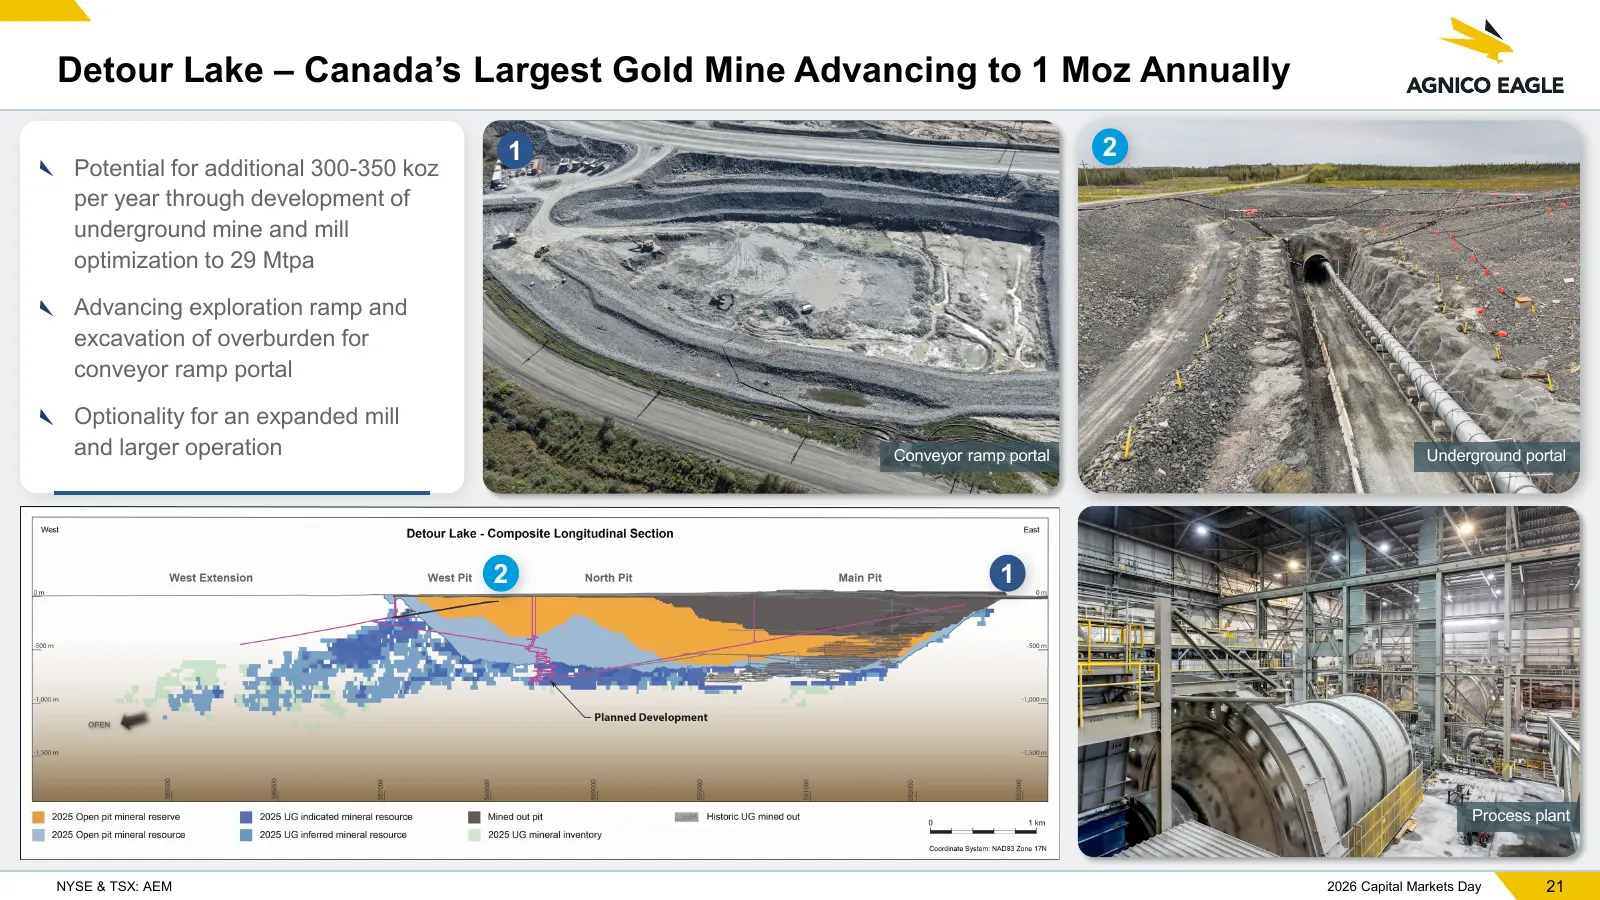
Slide 21: Detour Lake – Advancing to 1 Moz Annually
Detour Lake – Canada’s Largest Gold Mine Advancing to 1 Moz Annually 1 2 Potential for additional 300-350 koz per year through development of underground mine and mill optimization to 29 Mtpa Advancing exploration ramp and excavation of overburden for conveyor ramp portal Optionality for an expanded
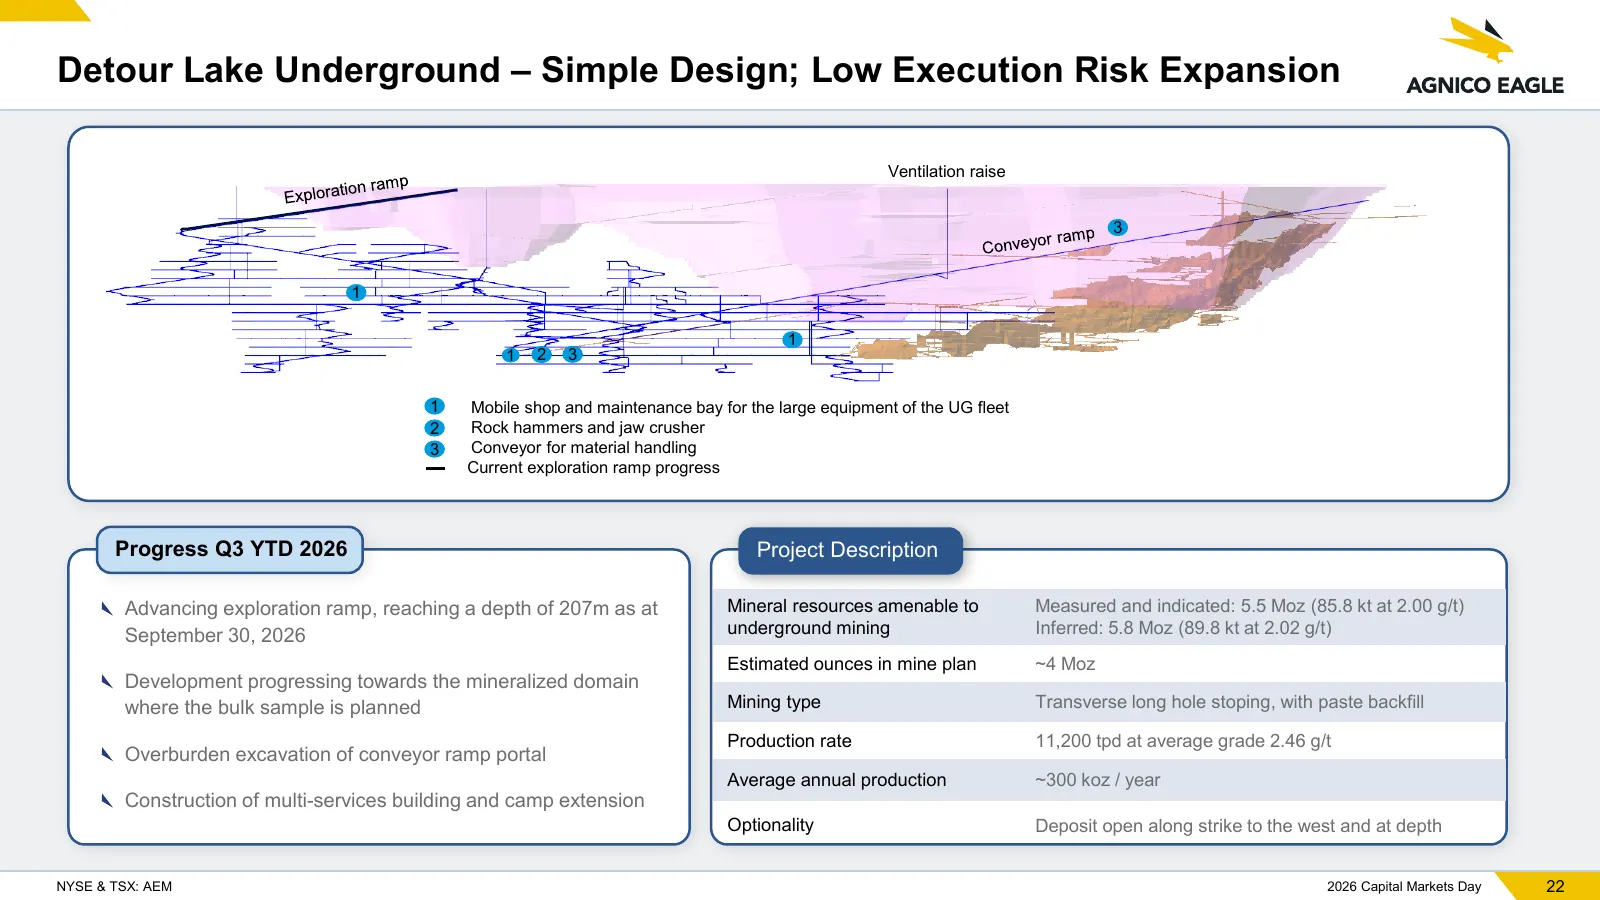
Slide 22: Detour Lake Underground – Simple Design; Low Execution Risk
Detour Lake Underground – Simple Design; Low Execution Risk Expansion Ventilation raise 3 1 1 1 2 3 •1 Mobile shop and maintenance bay for the large equipment of the UG fleet •2 Rock hammers and jaw crusher •3 Conveyor for material handling Current exploration ramp progress Progress Q3 YTD 2026 Proj
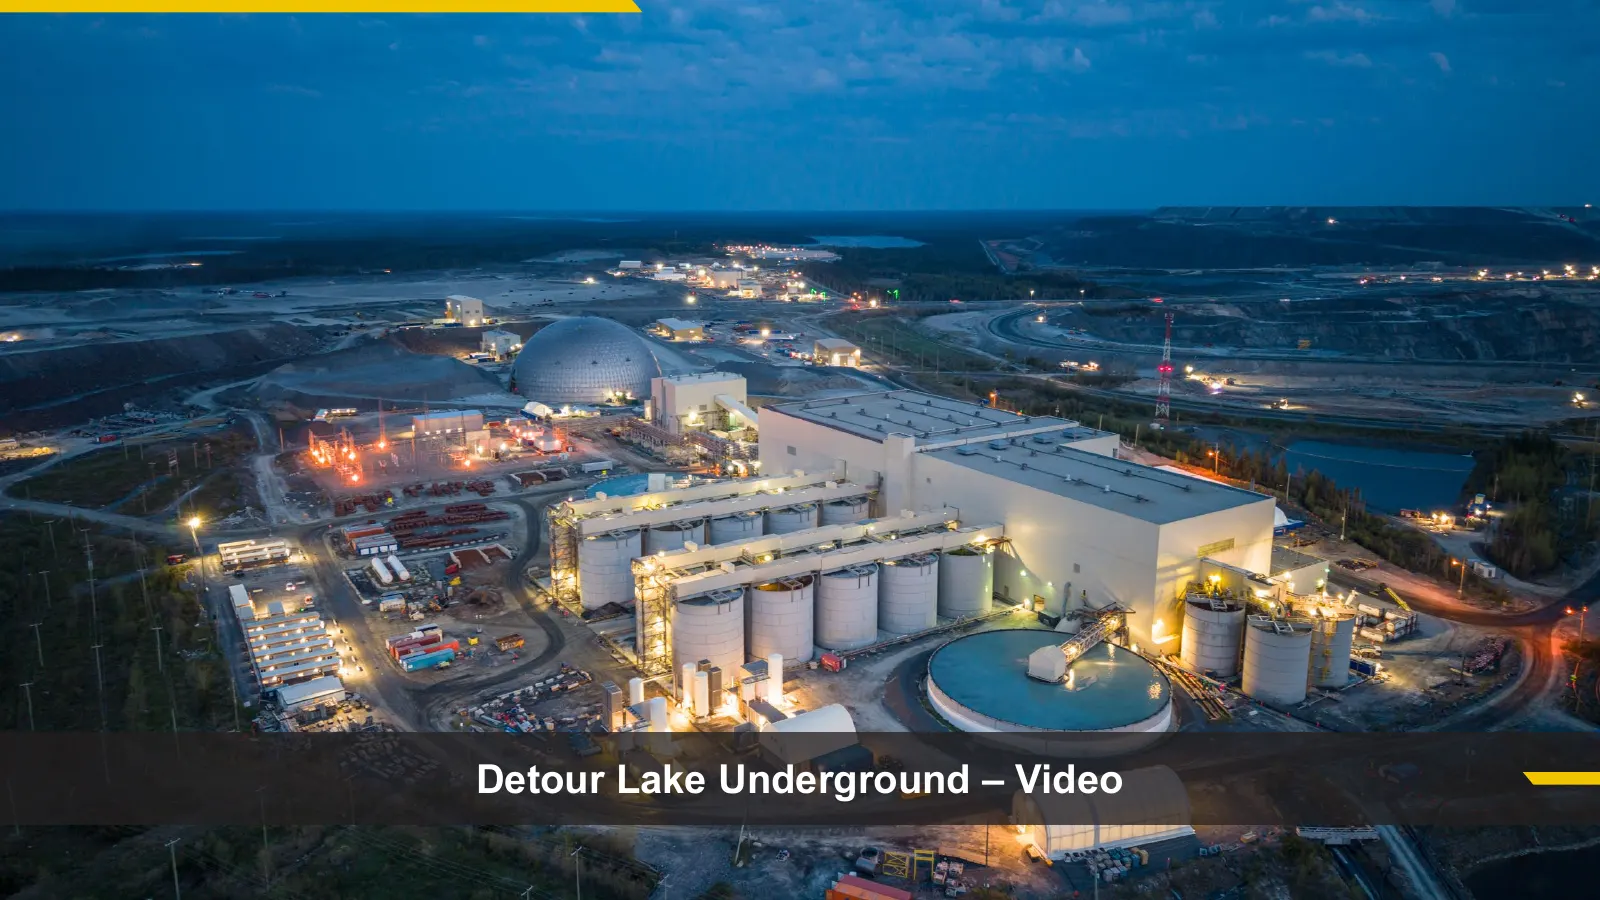
Slide 23: Detour Lake Underground – Video
Detour Lake Underground – Video
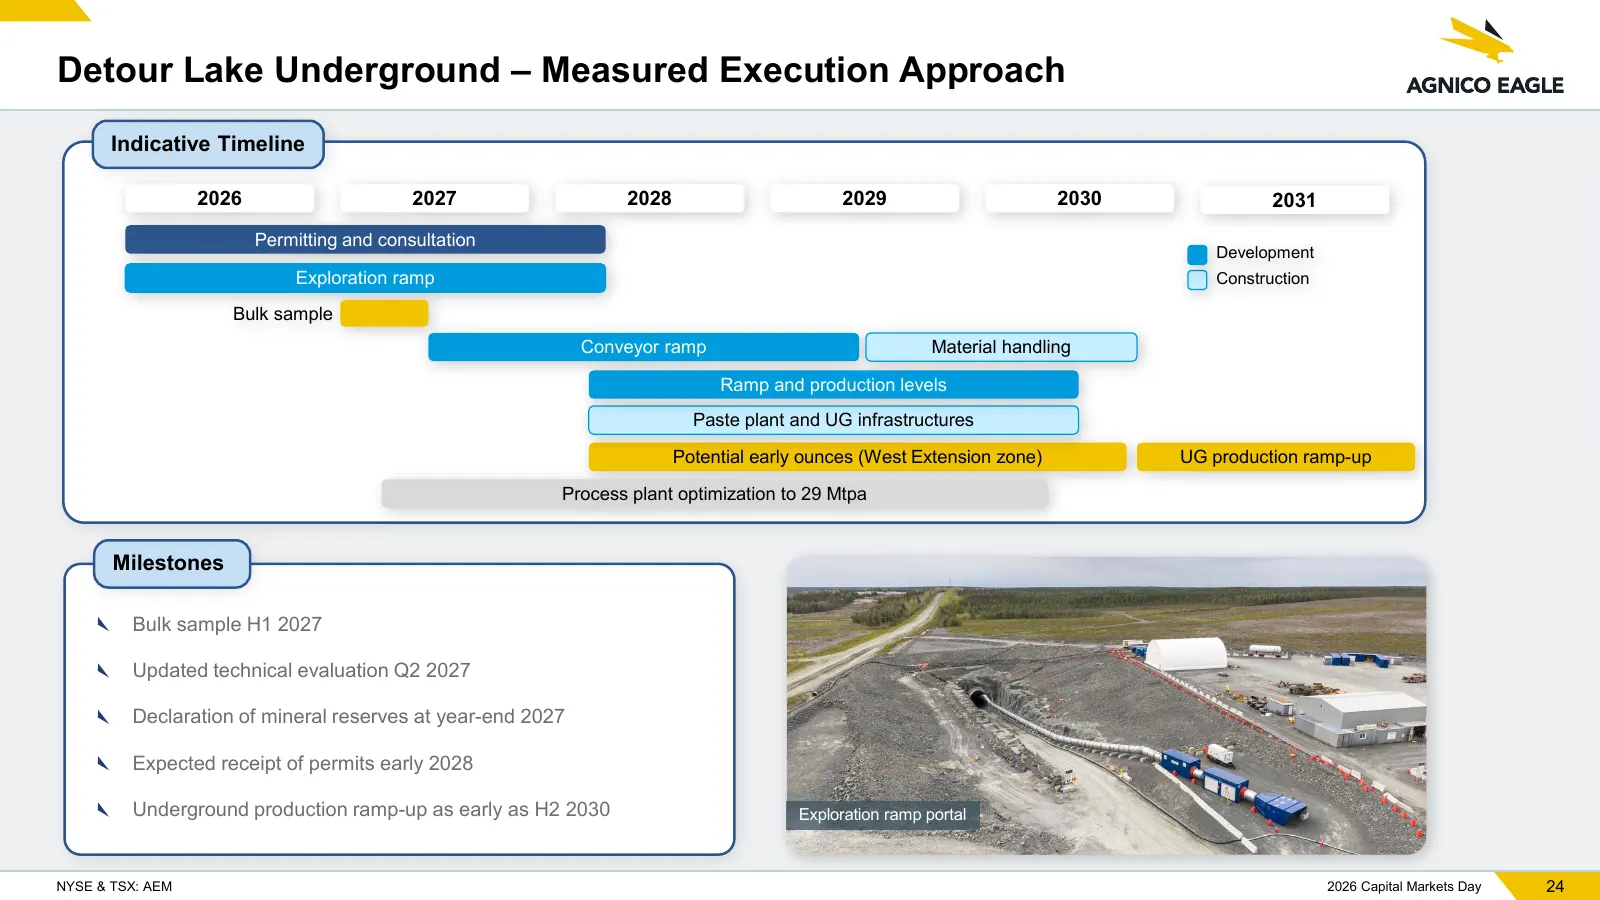
Slide 24: Detour Lake Underground – Measured Execution Approach
Detour Lake Underground – Measured Execution Approach Indicative Timeline 2026 2027 2028 2029 2030 2031 Permitting and consultation Development Exploration ramp Construction Bulk sample Conveyor ramp Material handling Ramp and production levels Paste plant and UG infrastructures Potential early ounc
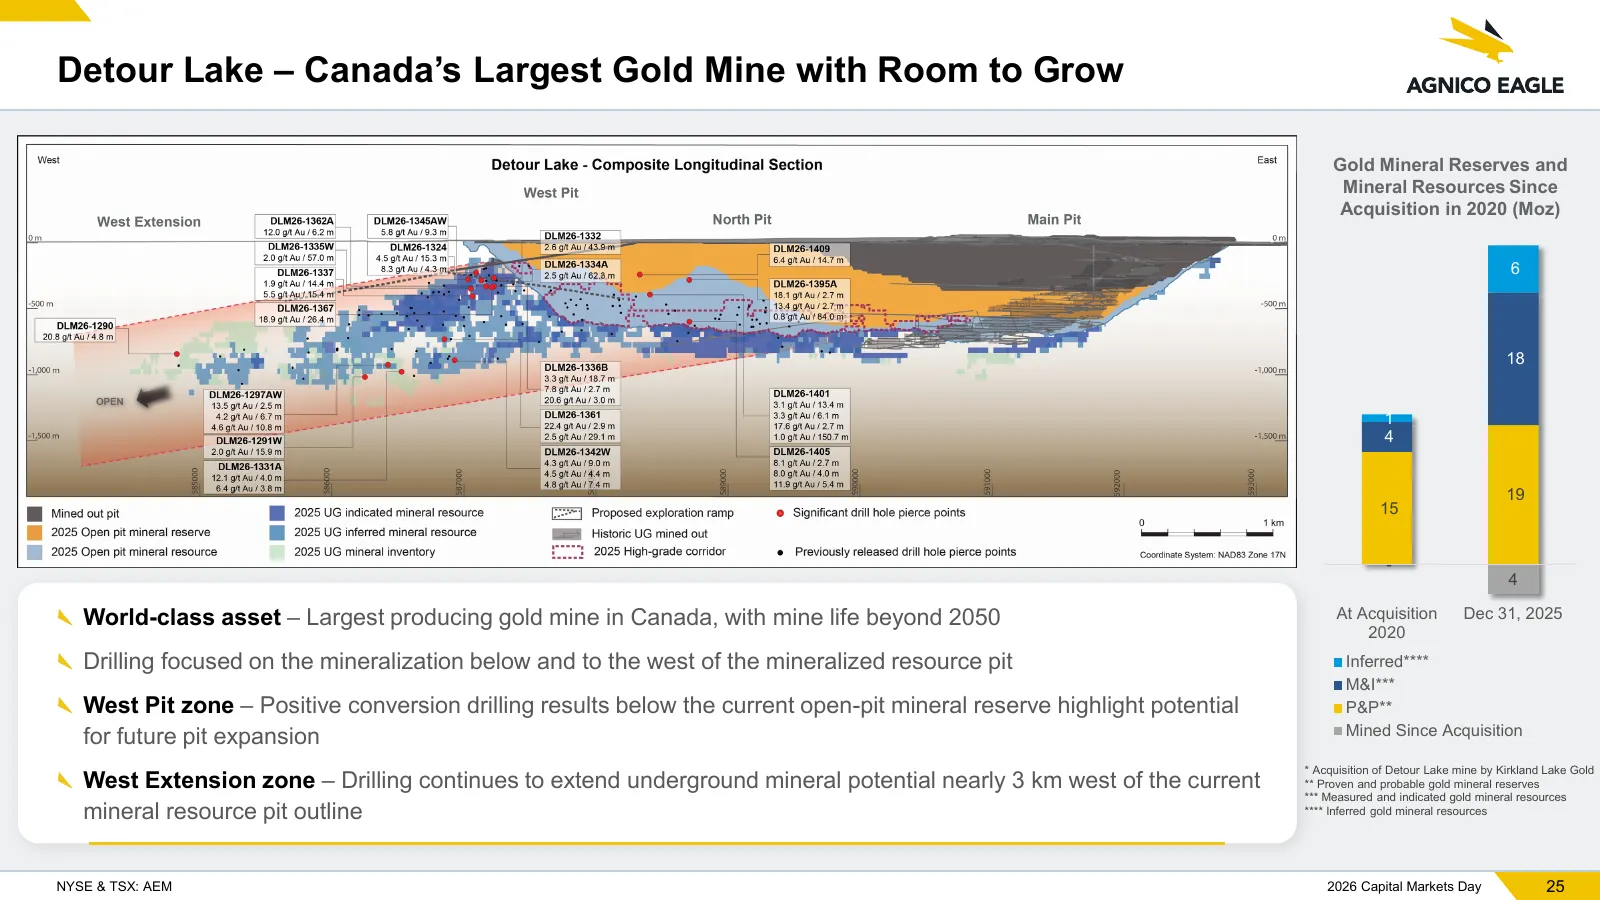
Slide 25: Detour Lake – Room to Grow
Detour Lake – Canada’s Largest Gold Mine with Room to Grow Gold Mineral Reserves and Mineral Resources Since Acquisition in 2020 (Moz) 6 18 1 4 19 15 - 4 World-class asset – Largest producing gold mine in Canada, with mine life beyond 2050 At Acquisition Dec 31, 2025 2020 Drilling focused on the min
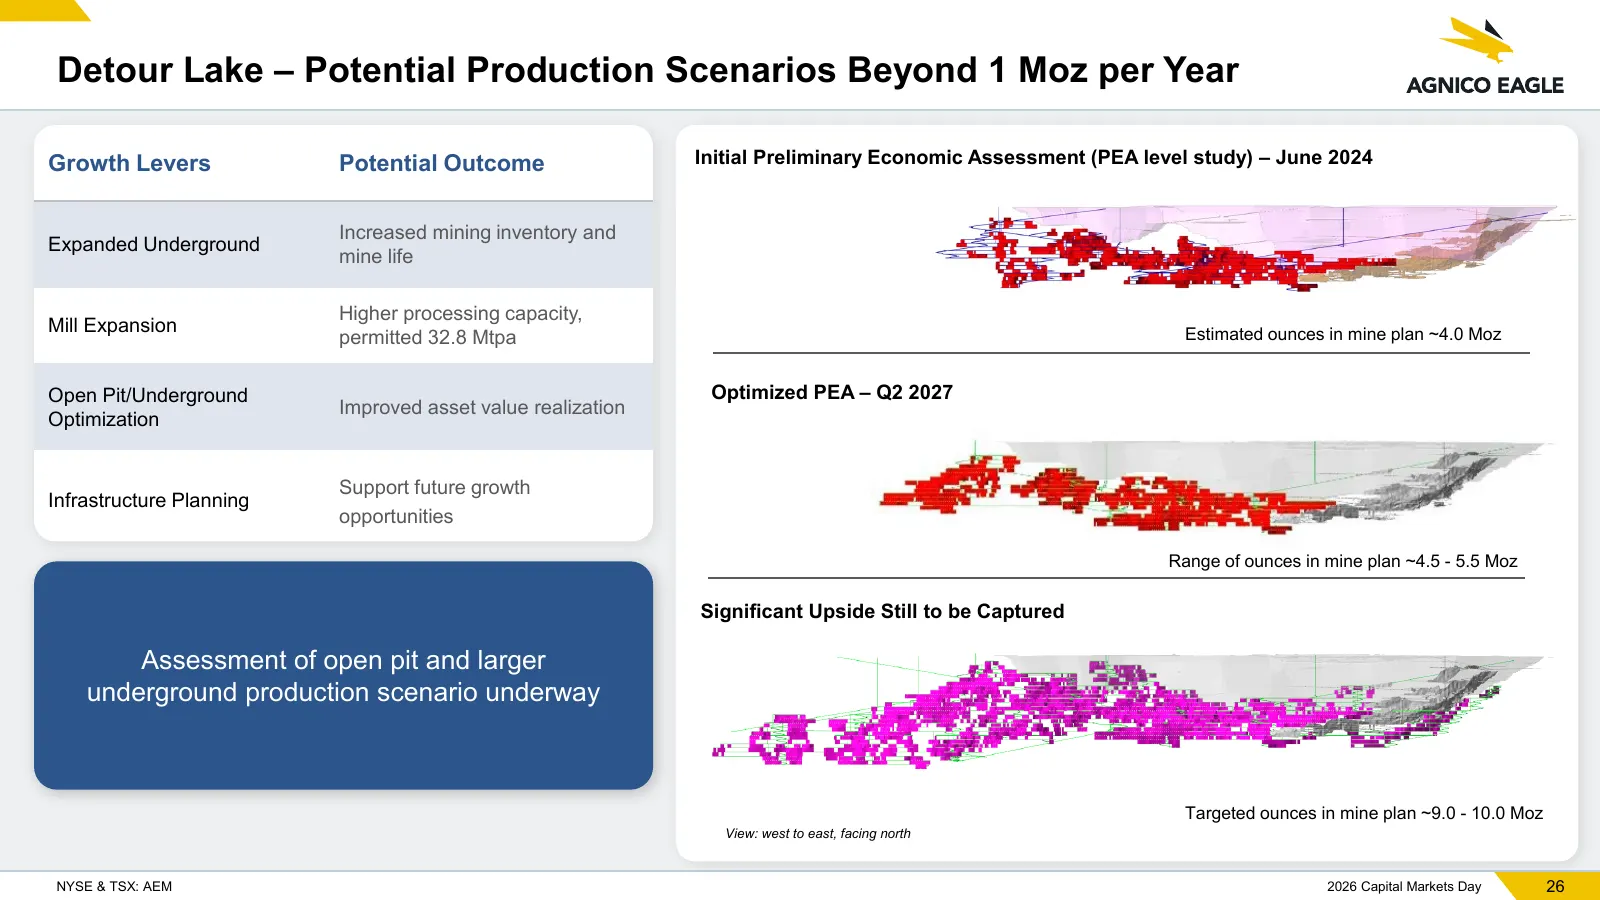
Slide 26: Detour Lake – Potential Production Scenarios Beyond 1 Moz
Detour Lake – Potential Production Scenarios Beyond 1 Moz per Year Growth Levers Potential Outcome Initial Preliminary Economic Assessment (PEA level study) – June 2024 Increased mining inventory and Expanded Underground mine life Higher processing capacity, Mill Expansion Estimated ounces in mine p
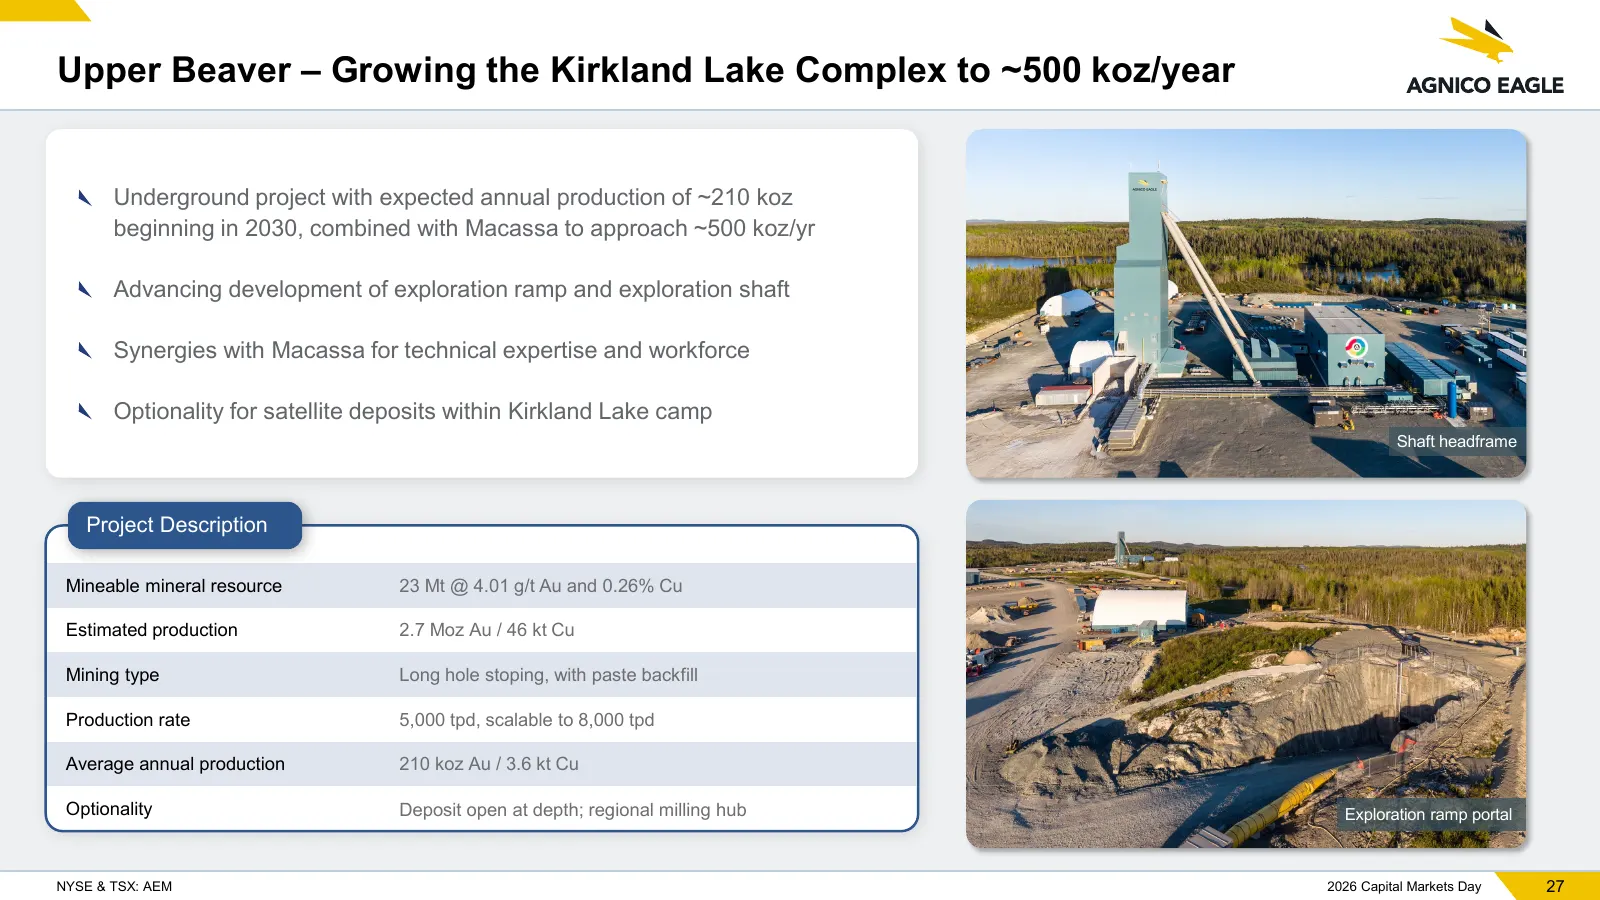
Slide 27: Upper Beaver – Growing the Kirkland Lake Complex
Upper Beaver – Growing the Kirkland Lake Complex to ~500 koz/year Underground project with expected annual production of ~210 koz beginning in 2030, combined with Macassa to approach ~500 koz/yr Advancing development of exploration ramp and exploration shaft Synergies with Macassa for technical expe
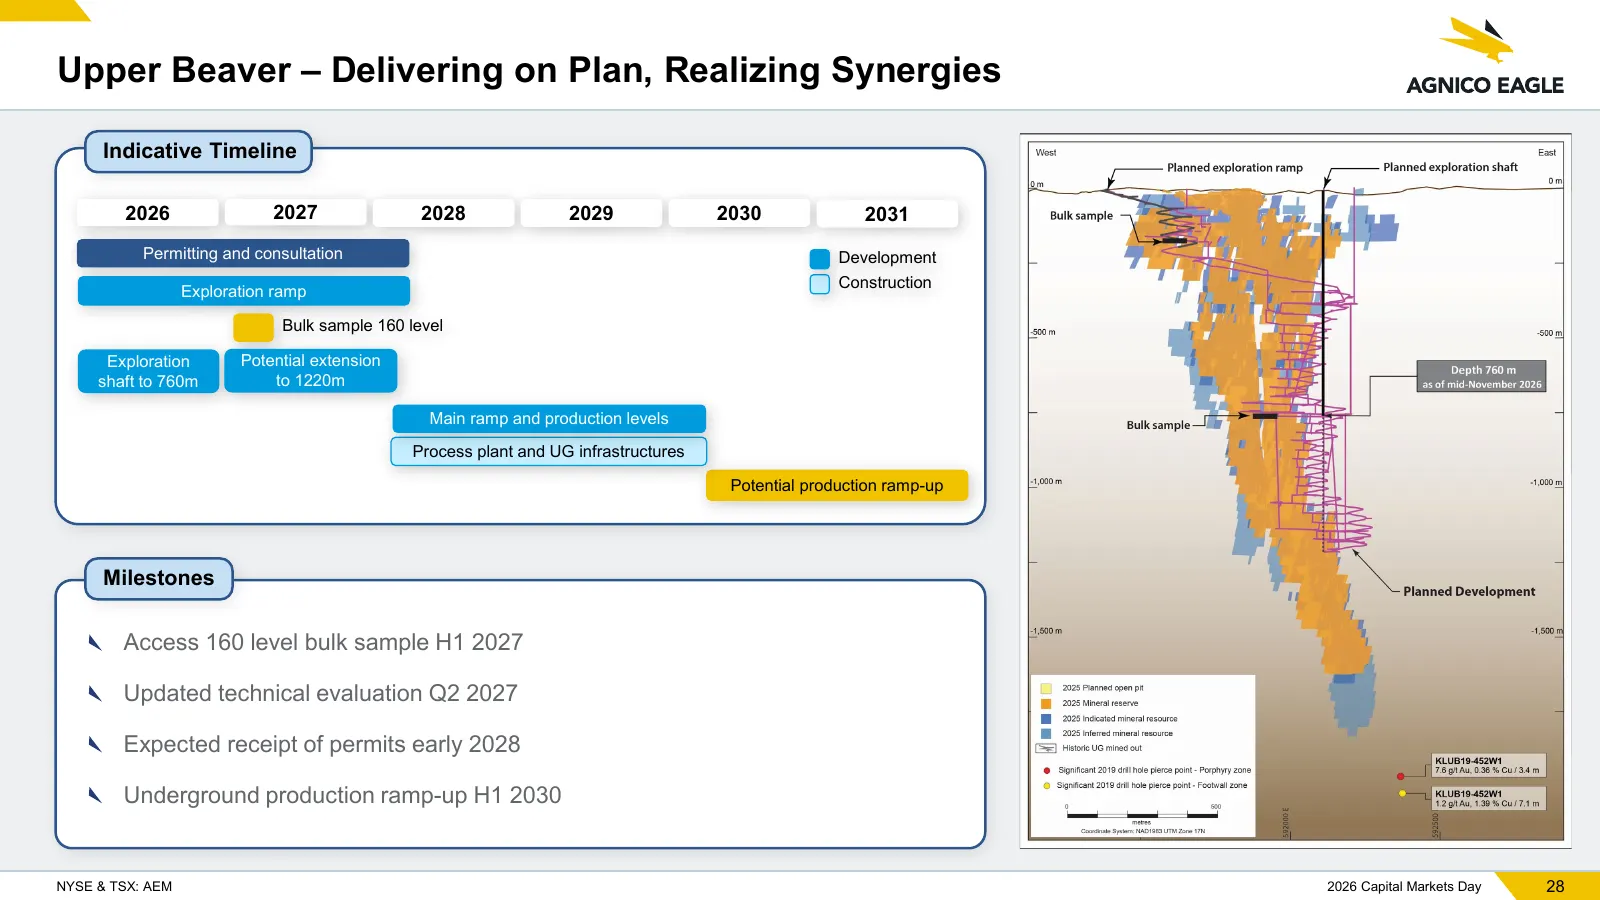
Slide 28: Upper Beaver – Delivering on Plan
Upper Beaver – Delivering on Plan, Realizing Synergies Indicative Timeline 2026 2027 2028 2029 2030 2031 Permitting and consultation Development Construction Exploration ramp Bulk sample 160 level Exploration Potential extension shaft to 760m to 1220m Main ramp and production levels Process plant an
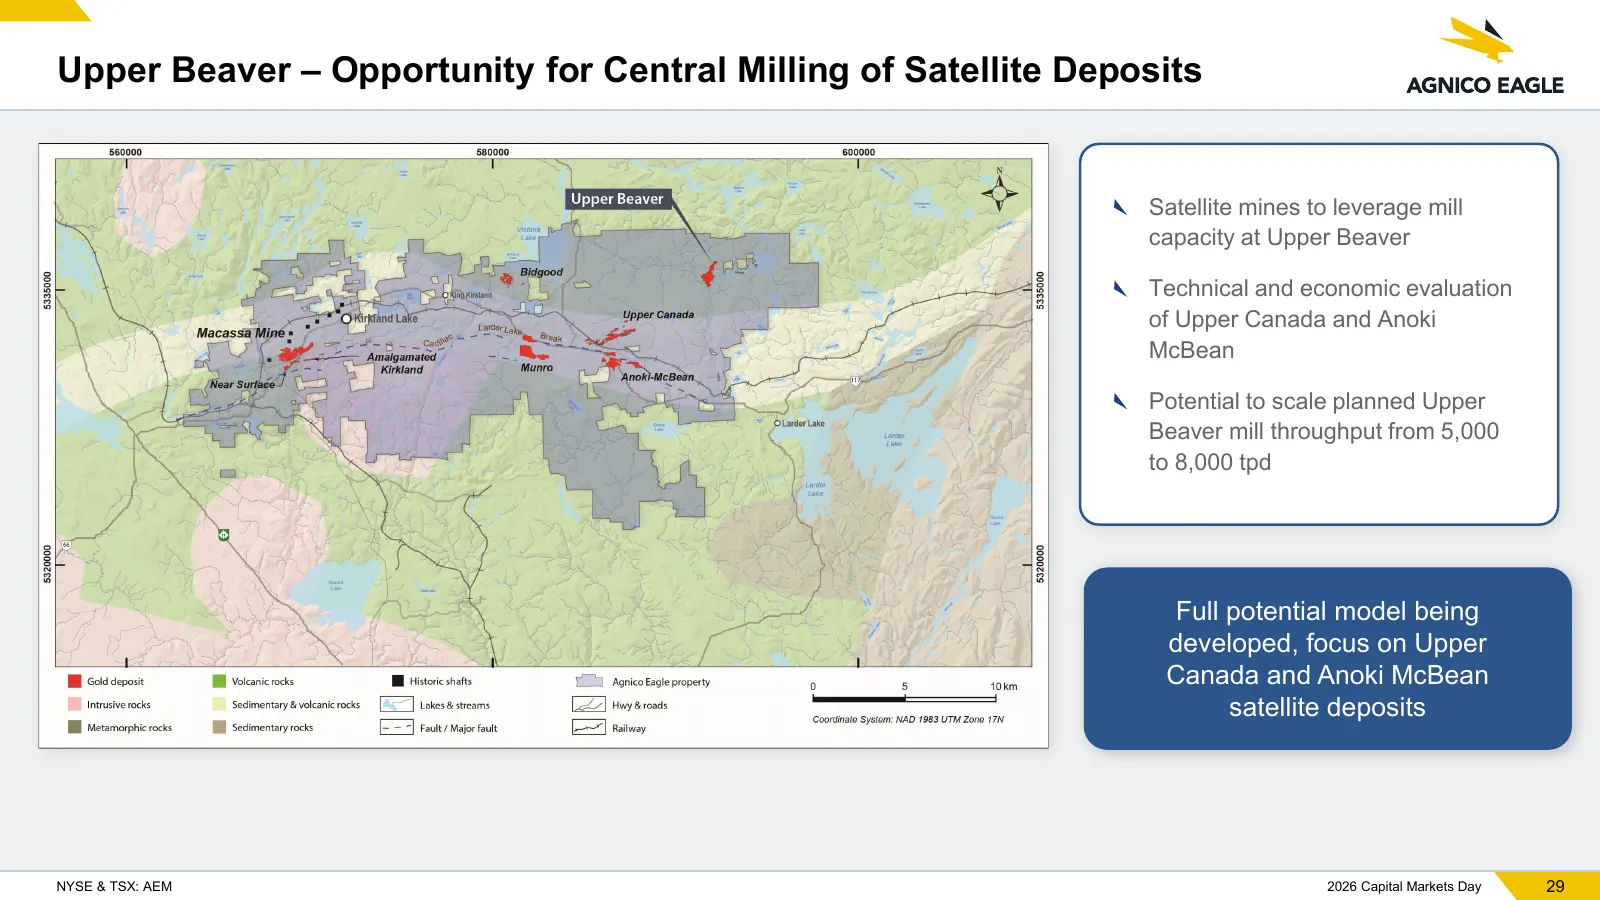
Slide 29: Upper Beaver – Central Milling of Satellite Deposits
Upper Beaver – Opportunity for Central Milling of Satellite Deposits Satellite mines to leverage mill capacity at Upper Beaver Technical and economic evaluation of Upper Canada and Anoki McBean Potential to scale planned Upper Beaver mill throughput from 5,000 to 8,000 tpd Full potential model being
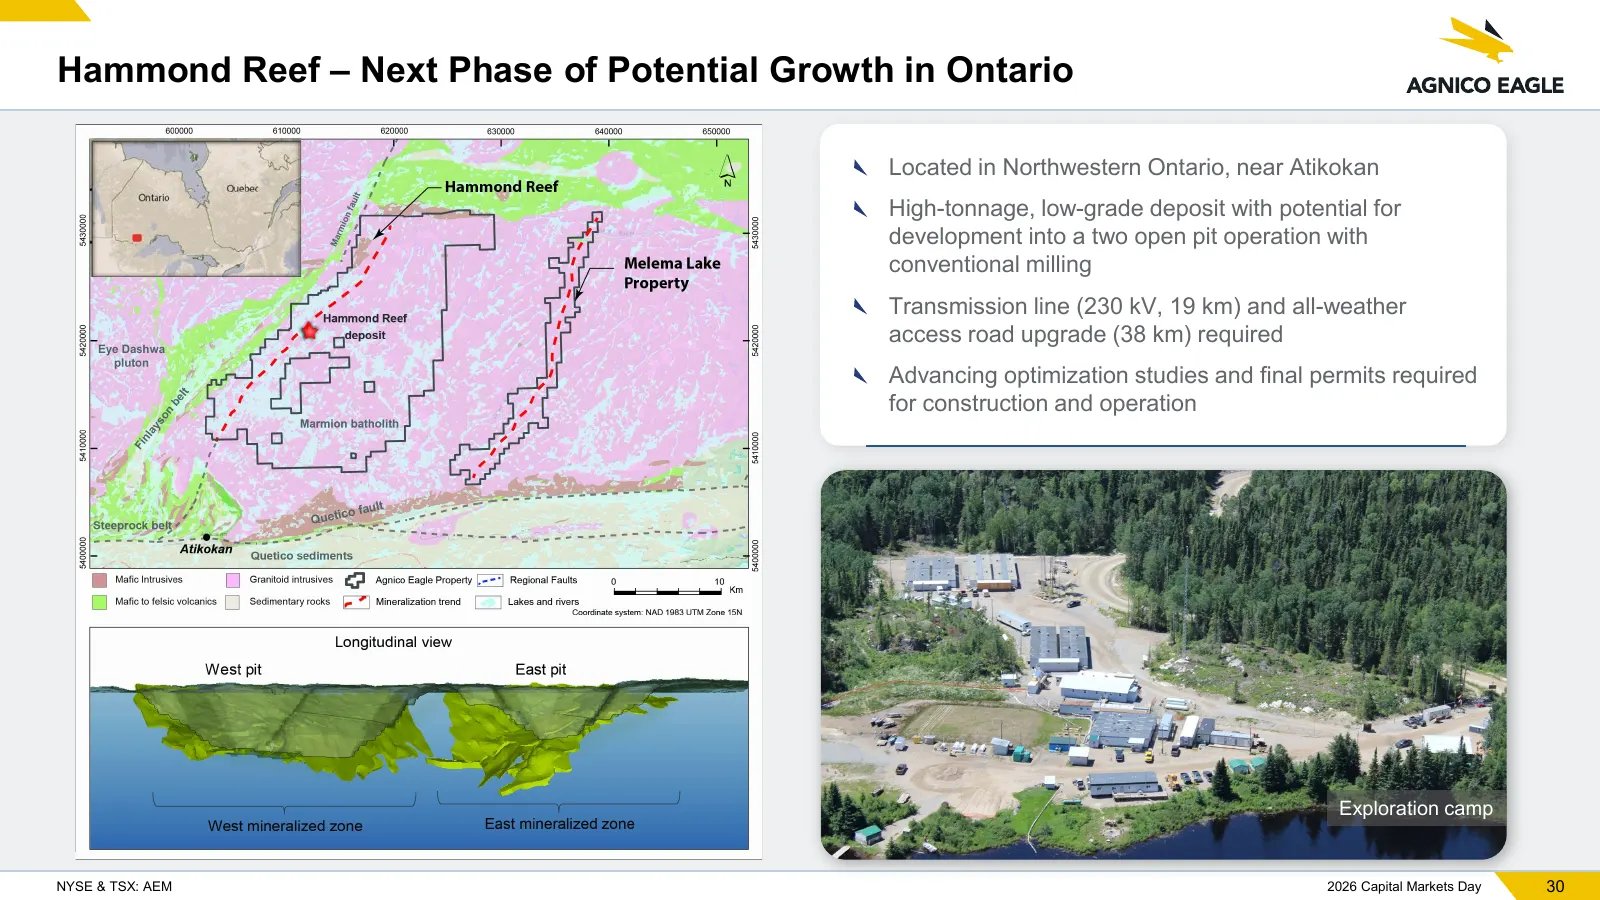
Slide 30: Hammond Reef – Next Phase of Potential Growth
Hammond Reef – Next Phase of Potential Growth in Ontario Located in Northwestern Ontario, near Atikokan High-tonnage, low-grade deposit with potential for development into a two open pit operation with conventional milling Transmission line (230 kV, 19 km) and all-weather access road upgrade (38 km)
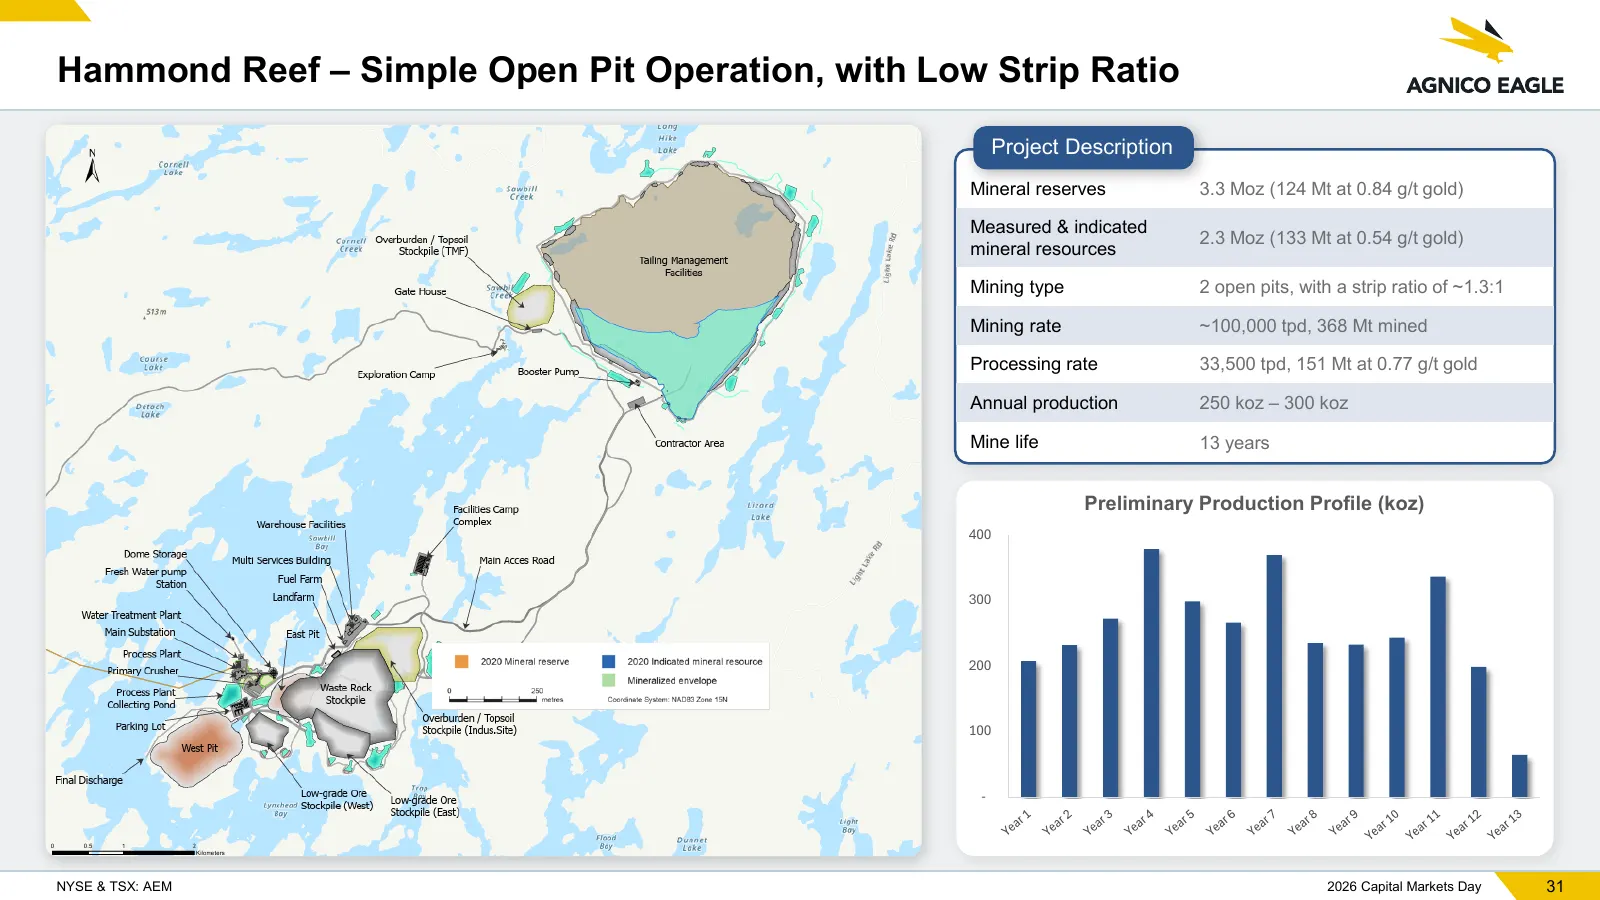
Slide 31: Hammond Reef – Simple Open Pit Operation
Hammond Reef – Simple Open Pit Operation, with Low Strip Ratio Project Description Mineral reserves 3.3 Moz (124 Mt at 0.84 g/t gold) Measured & indicated 2.3 Moz (133 Mt at 0.54 g/t gold) mineral resources Mining type 2 open pits, with a strip ratio of ~1.3:1 Mining rate ~100,000 tpd, 368 Mt mined
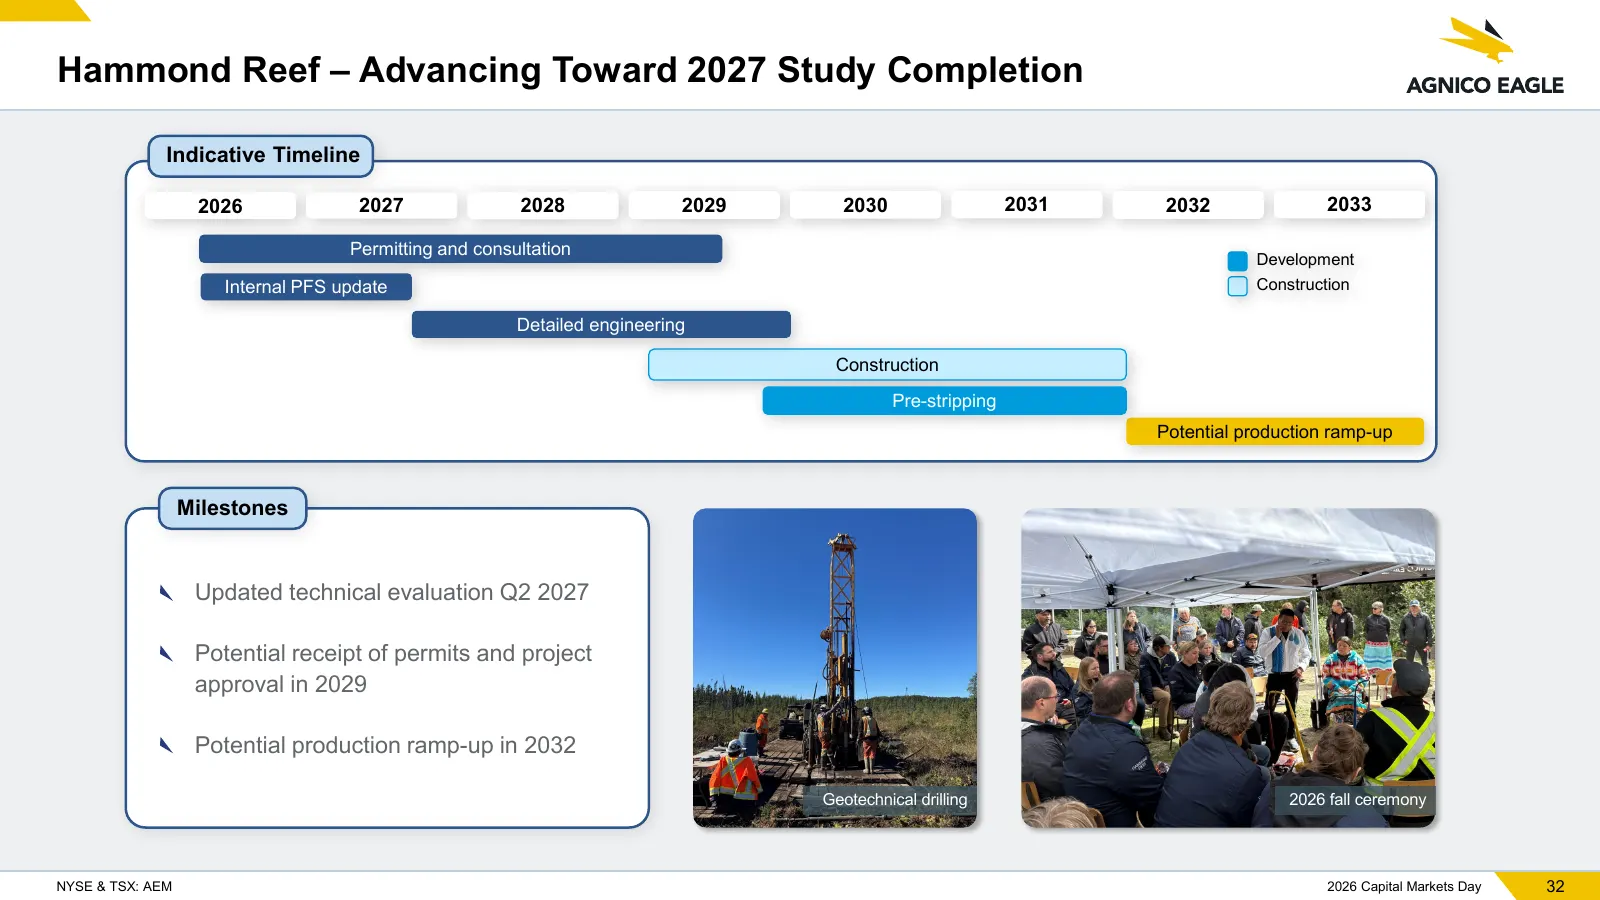
Slide 32: Hammond Reef – Advancing Toward 2027 Study Completion
Hammond Reef – Advancing Toward 2027 Study Completion Indicative Timeline 2026 2027 2028 2029 2030 2031 2032 2033 Permitting and consultation Development Internal PFS update Construction Detailed engineering Construction Pre-stripping Potential production ramp-up Milestones Updated technical evaluat
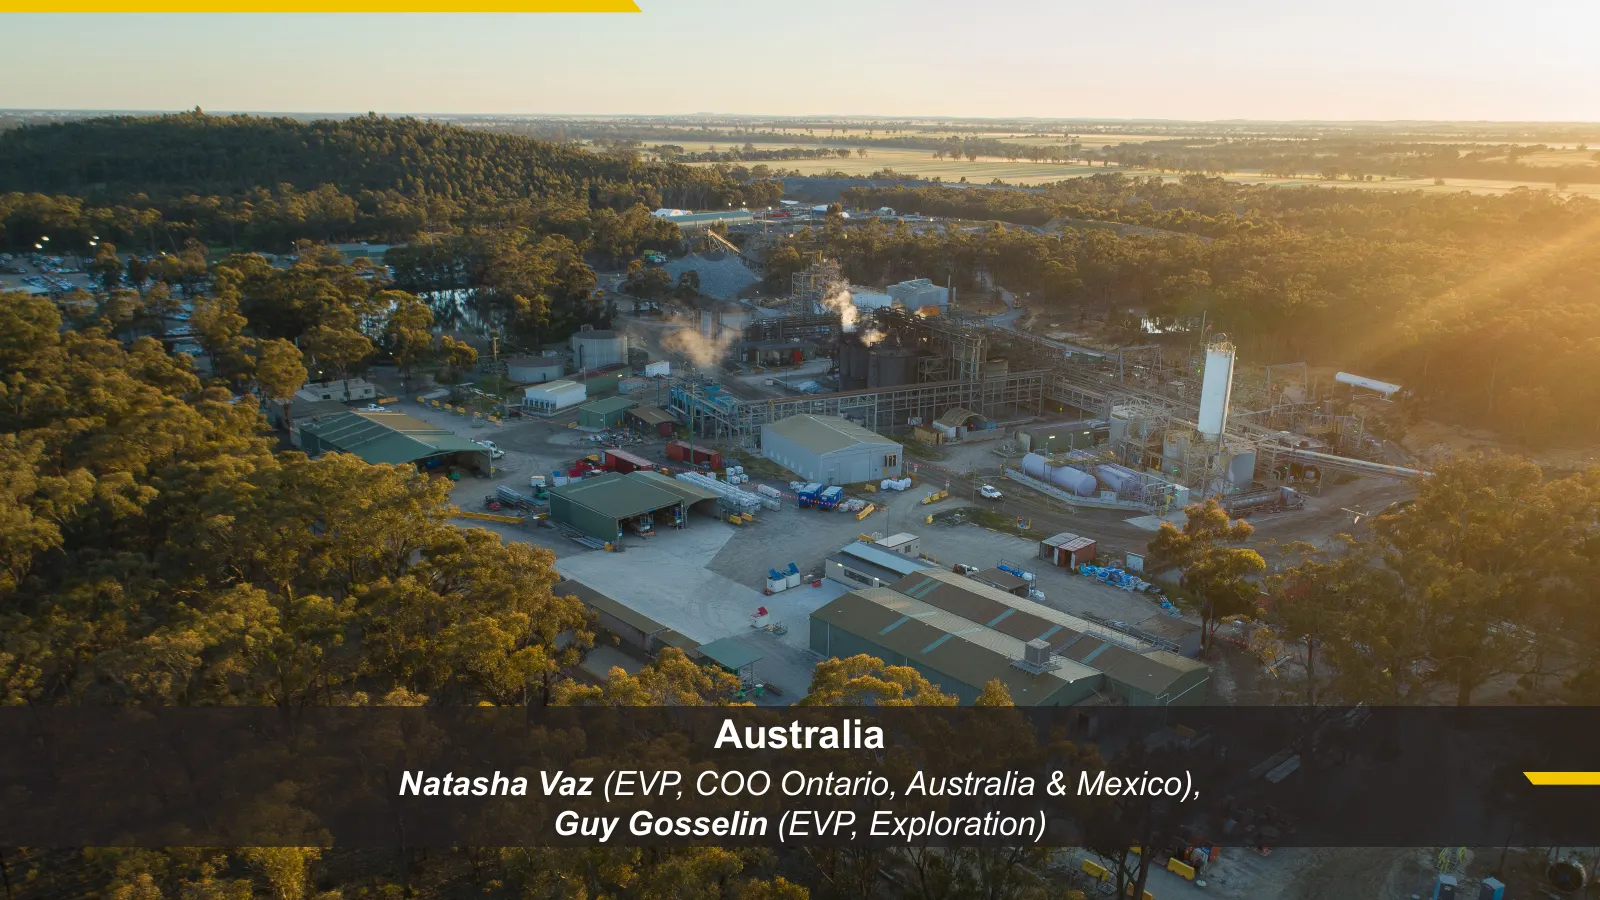
Slide 33: Australia
Australia Natasha Vaz (EVP, COO Ontario, Australia & Mexico), Guy Gosselin (EVP, Exploration)
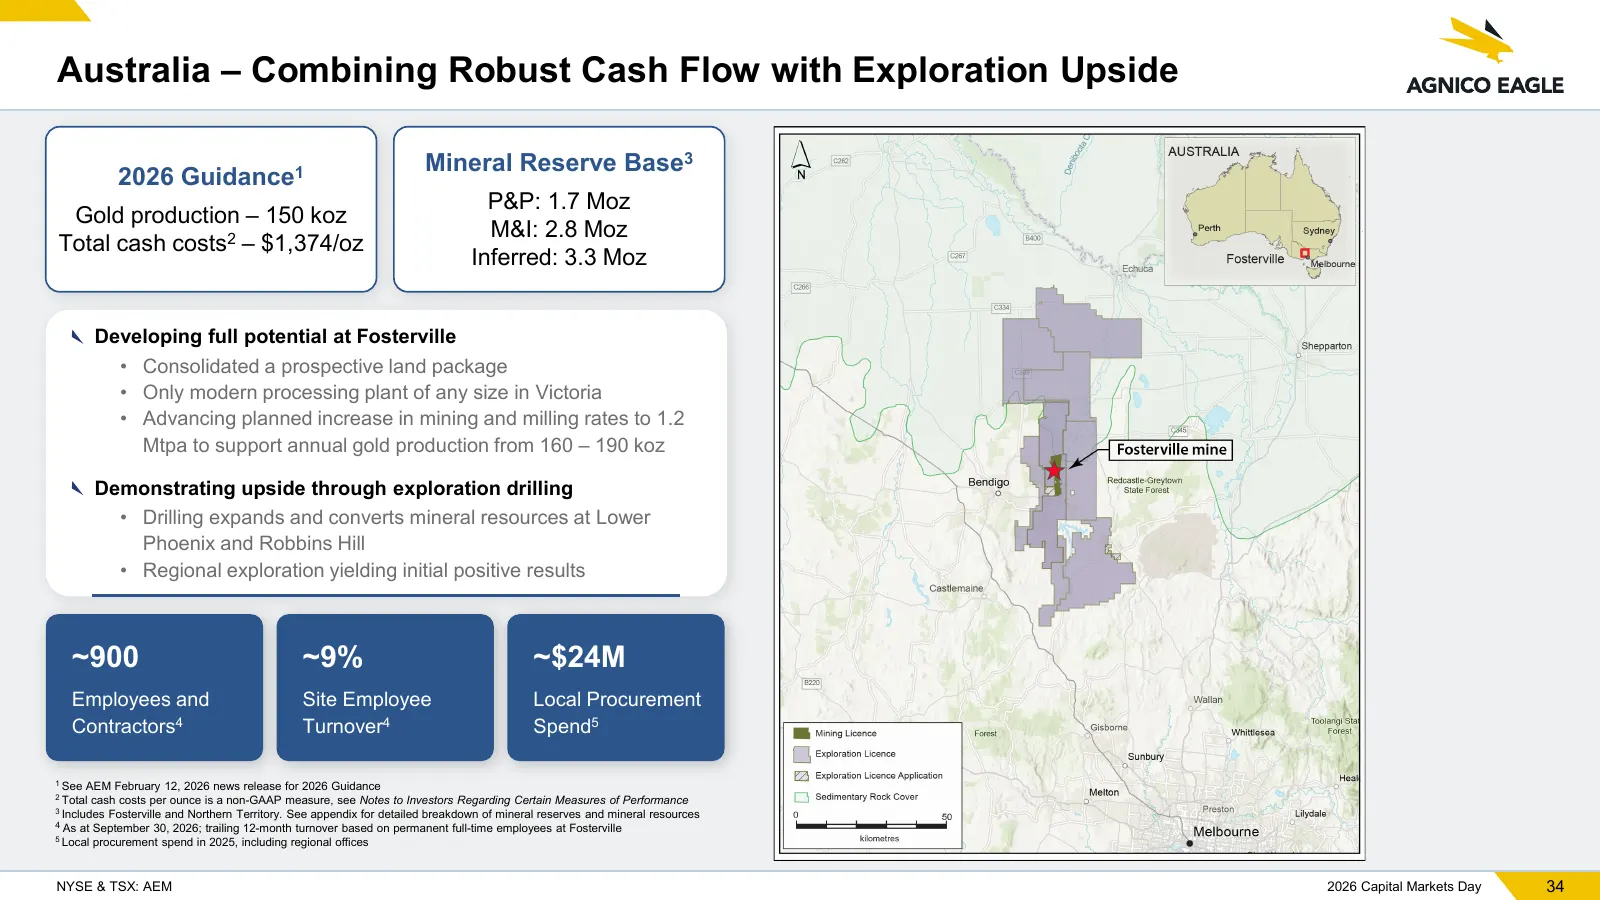
Slide 34: Australia – Robust Cash Flow with Exploration Upside
Australia – Combining Robust Cash Flow with Exploration Upside Mineral Reserve Base3 2026 Guidance1 P&P: 1.7 Moz Gold production – 150 koz M&I: 2.8 Moz Total cash costs2 – $1,374/oz Inferred: 3.3 Moz Developing full potential at Fosterville • Consolidated a prospective land package • Only modern pro
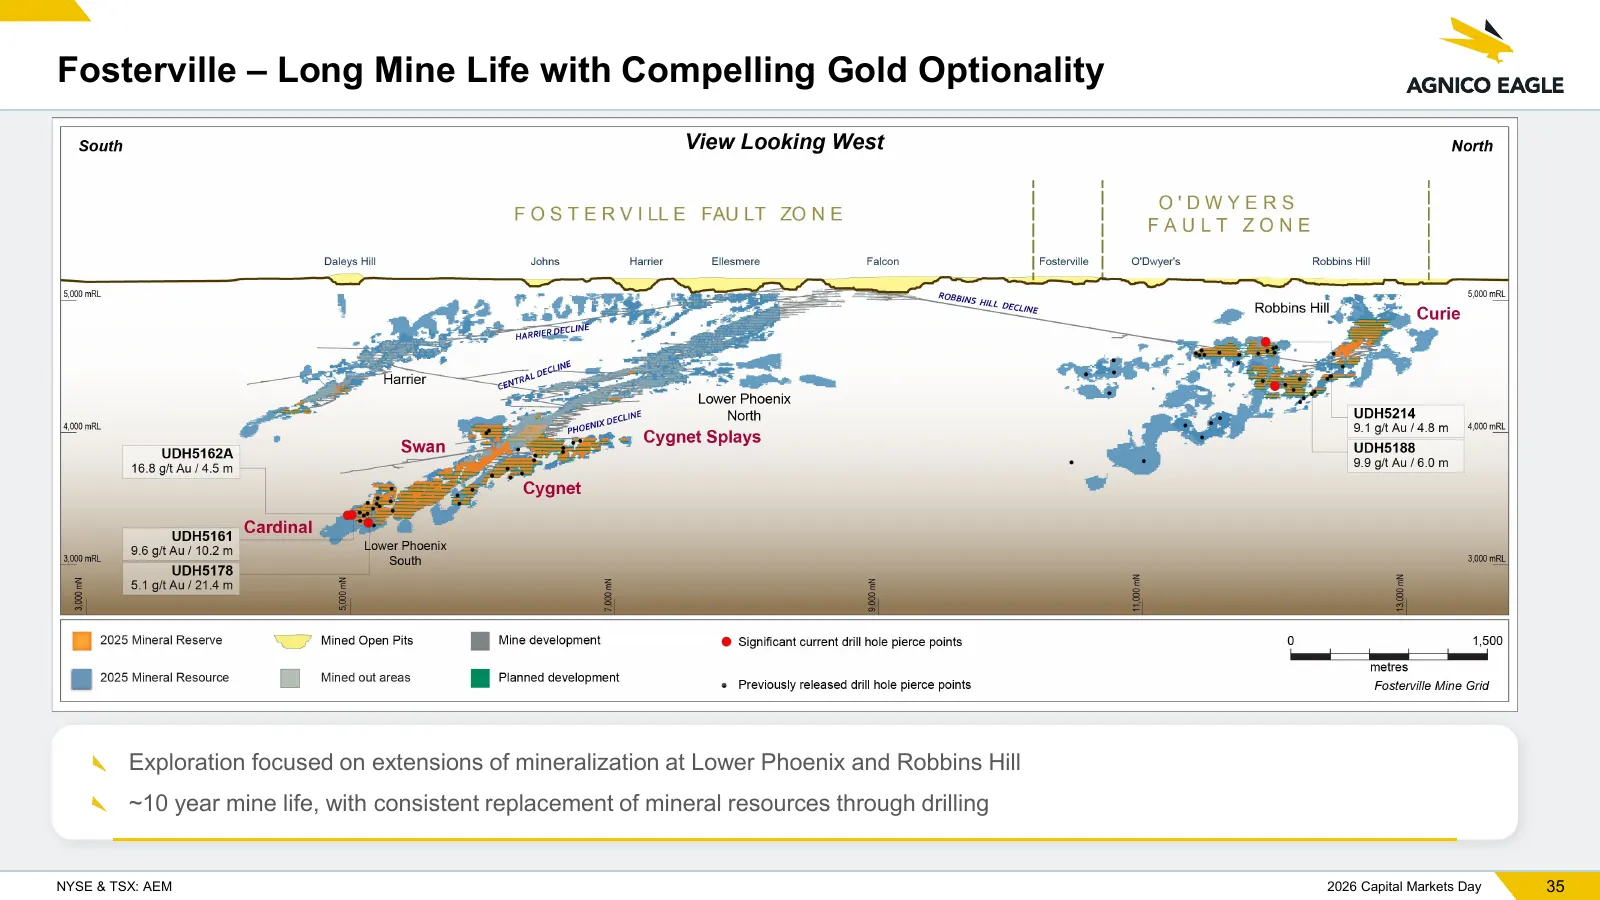
Slide 35: Fosterville – Long Mine Life
Fosterville – Long Mine Life with Compelling Gold Optionality Exploration focused on extensions of mineralization at Lower Phoenix and Robbins Hill ~10 year mine life, with consistent replacement of mineral resources through drilling NYSE & TSX: AEM 2026 Capital Markets Day 35
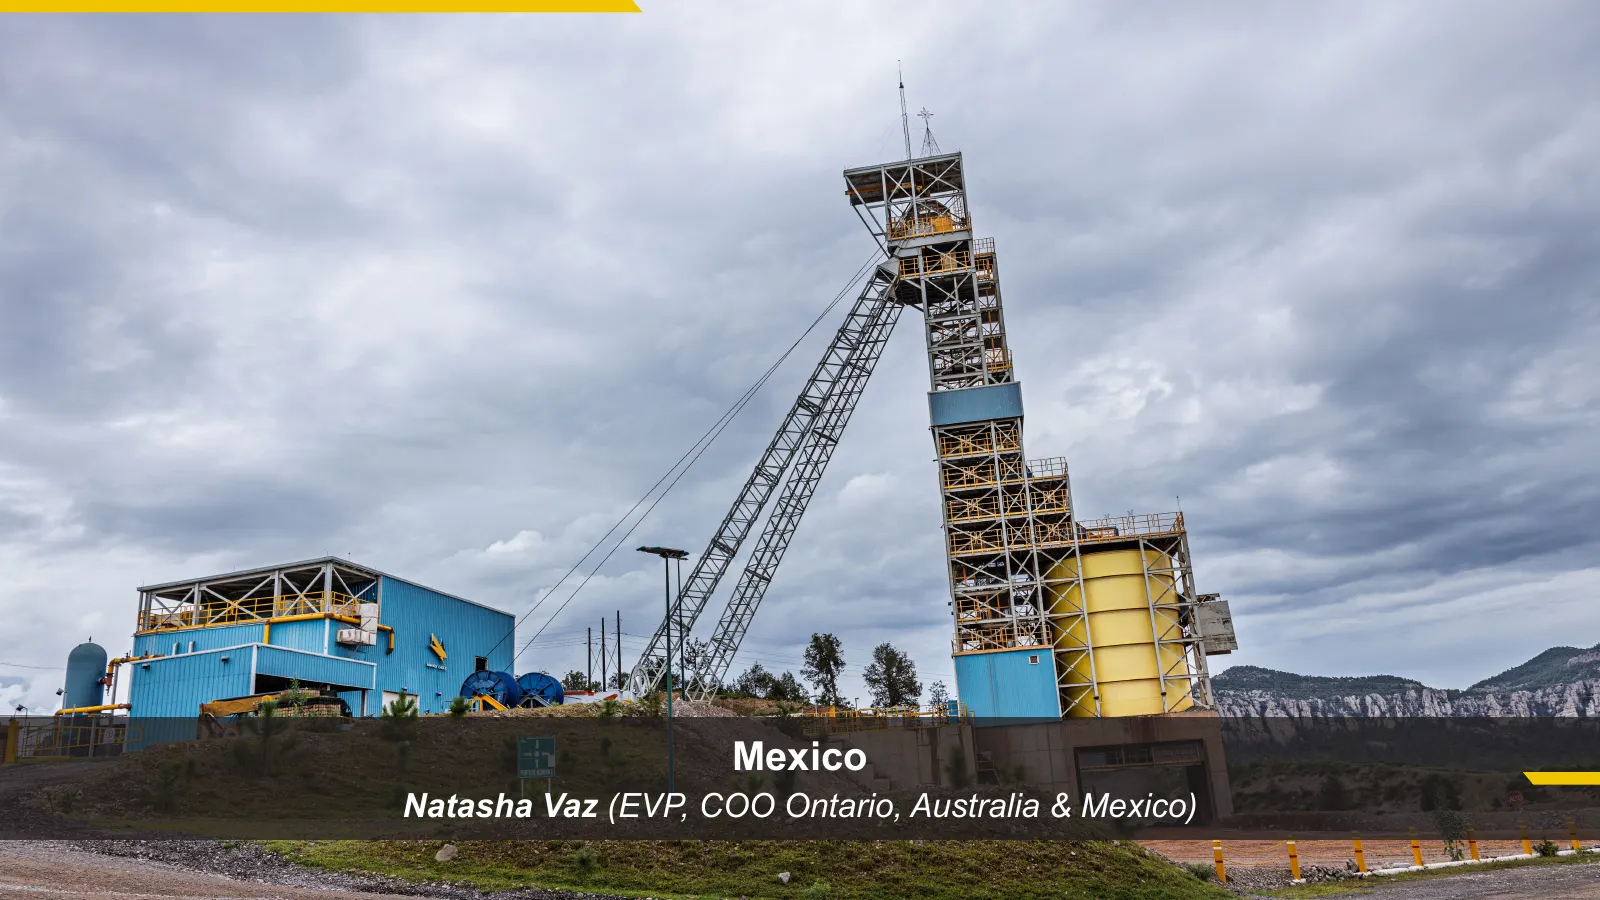
Slide 36: Mexico
Mexico Natasha Vaz (EVP, COO Ontario, Australia & Mexico) NYSE & TSX: AEM 2026 Capital Markets Day
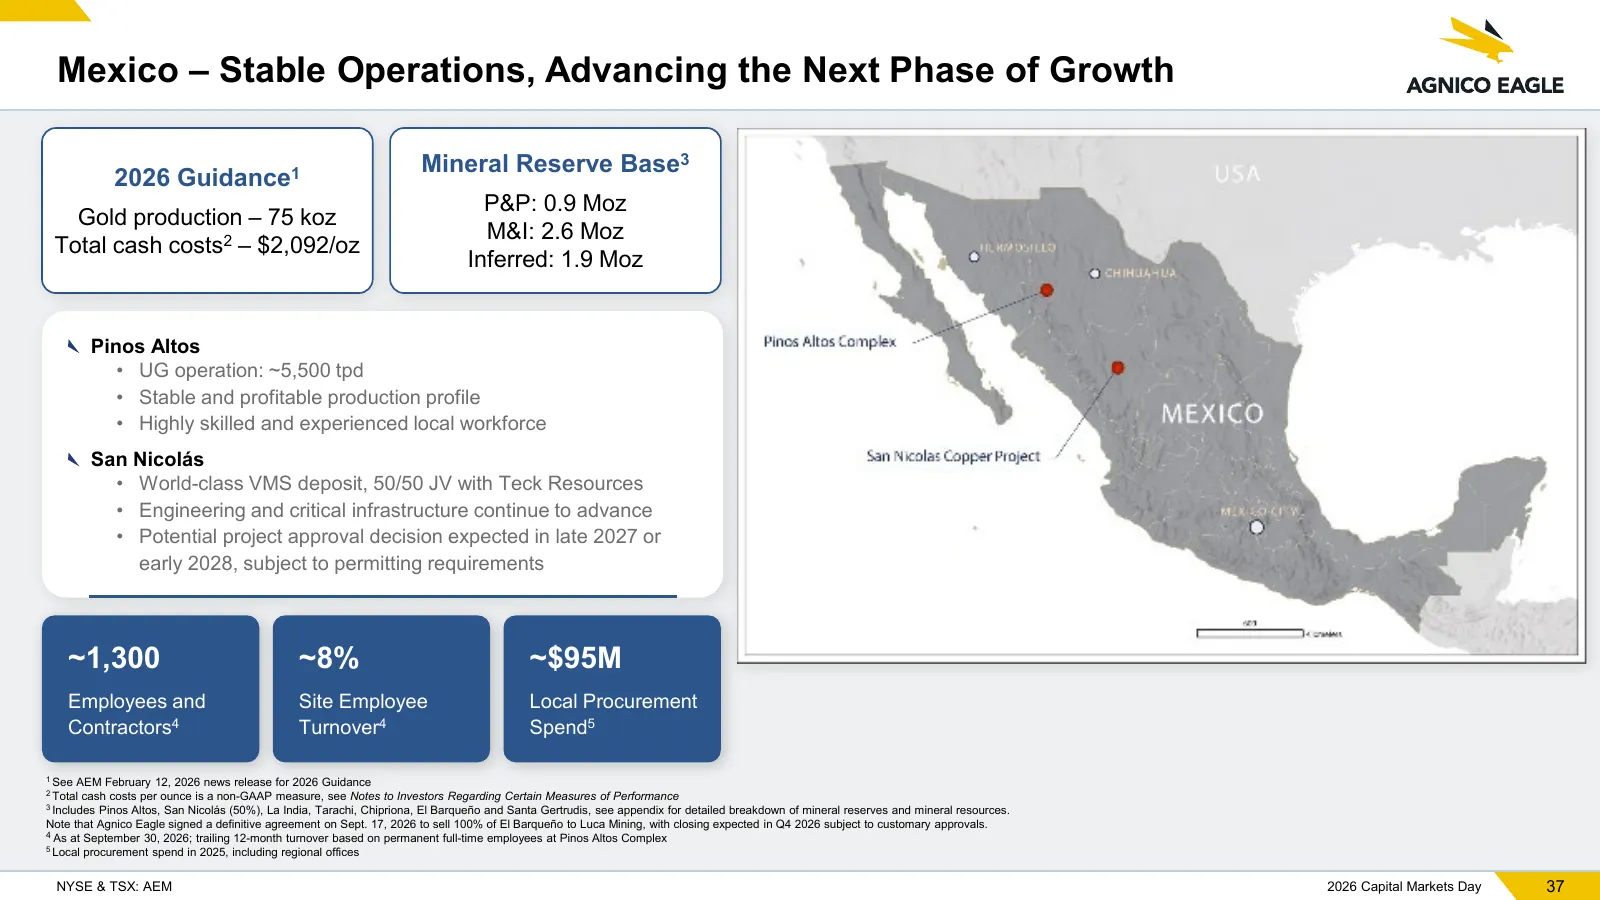
Slide 37: Mexico – Stable Operations, Advancing Next Phase of Growth
Mexico – Stable Operations, Advancing the Next Phase of Growth Mineral Reserve Base3 2026 Guidance1 P&P: 0.9 Moz Gold production – 75 koz M&I: 2.6 Moz Total cash costs2 – $2,092/oz Inferred: 1.9 Moz Pinos Altos • UG operation: ~5,500 tpd • Stable and profitable production profile • Highly skilled an
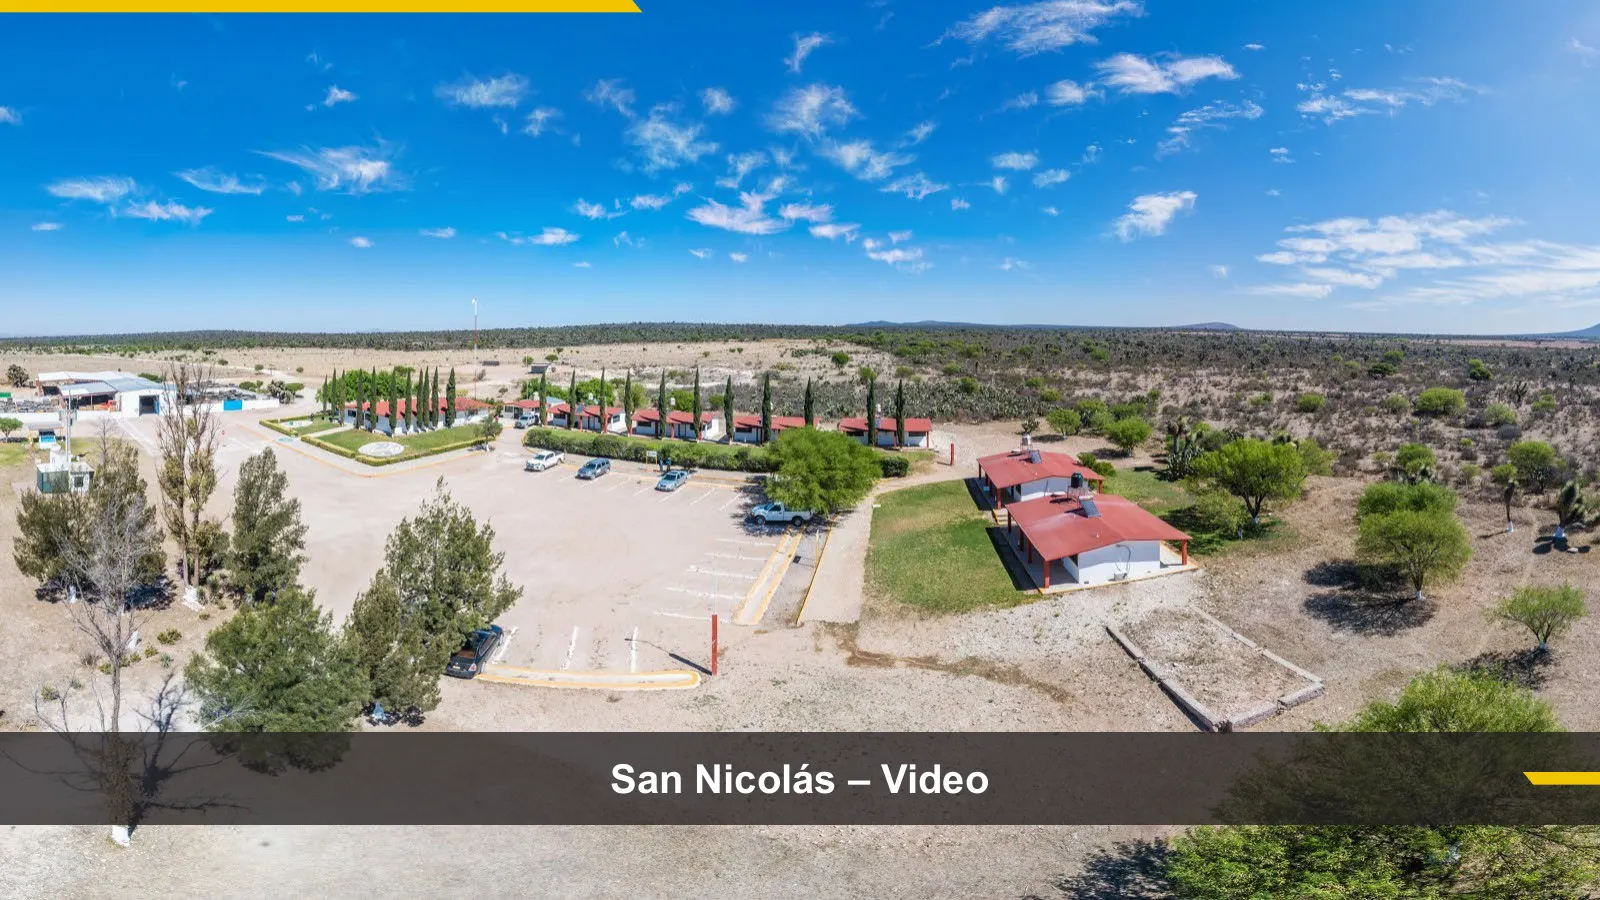
Slide 38: San Nicolás – Video
San Nicolás – Video
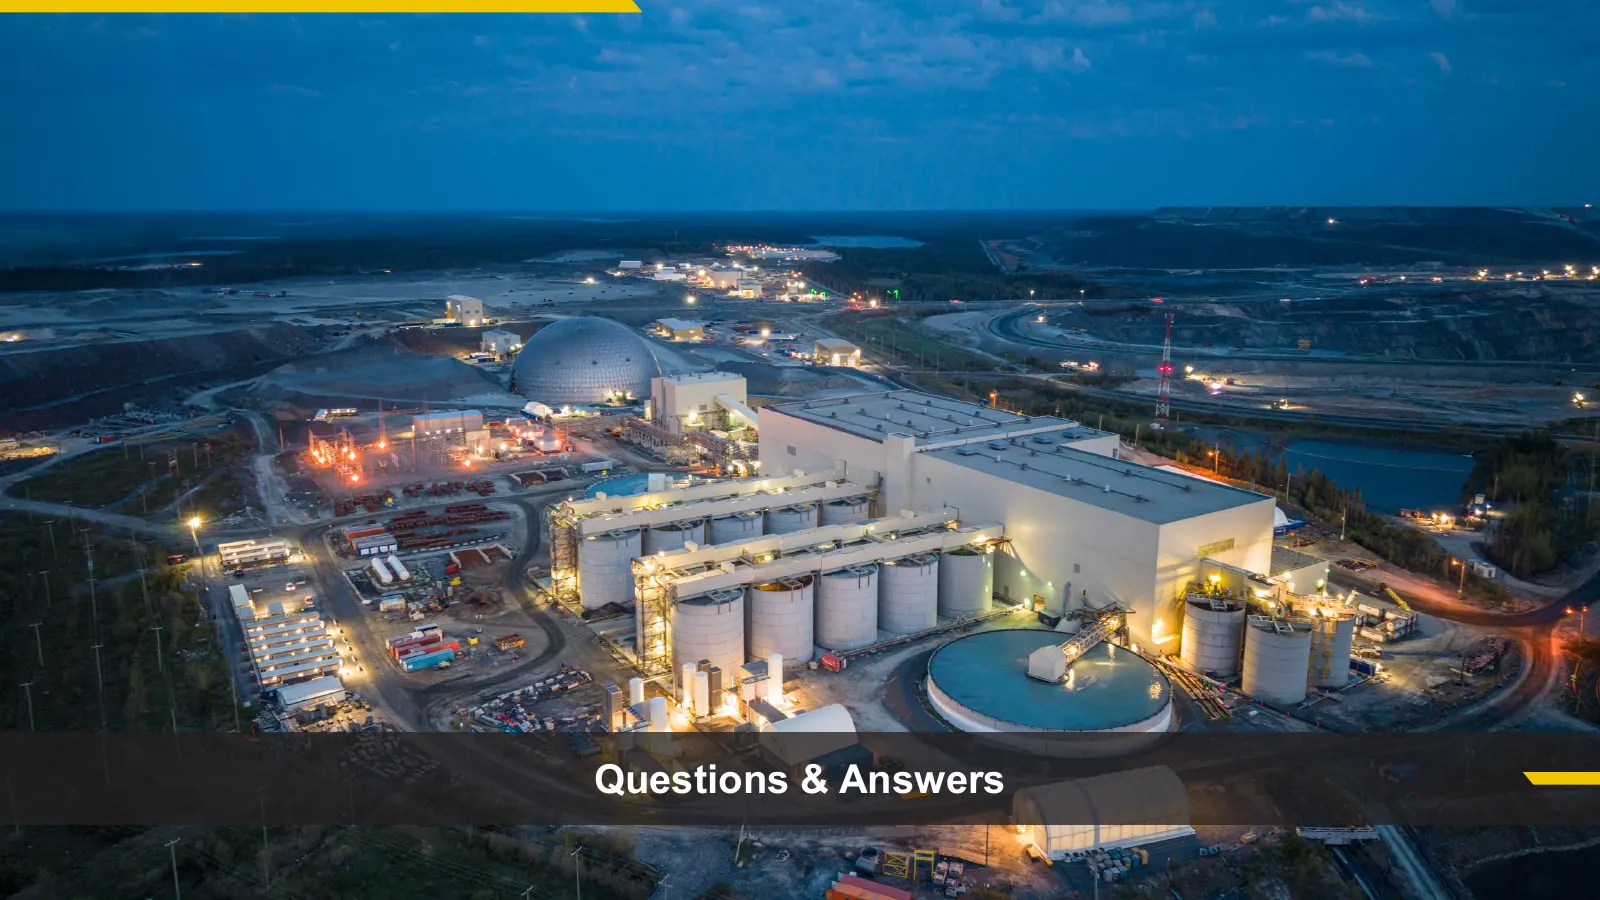
Slide 39: Questions & Answers
Questions & Answers — oe nee
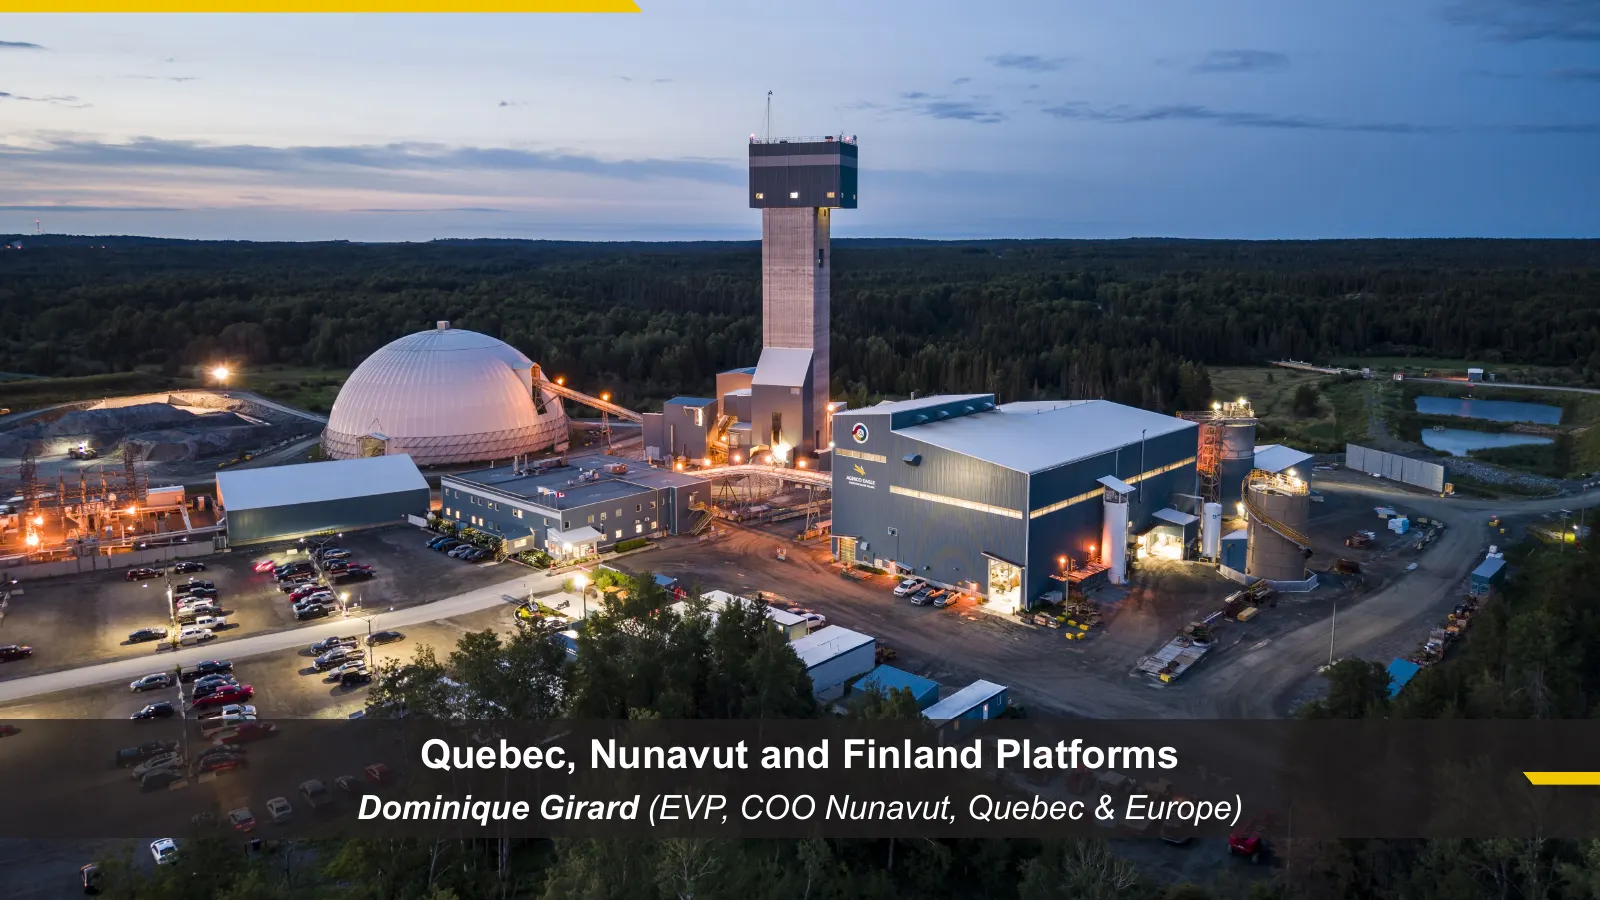
Slide 40: Quebec, Nunavut and Finland Platforms
Quebec, Nunavut and Finland Platforms Dominique Girard (EVP, COO Nunavut, Quebec & Europe)
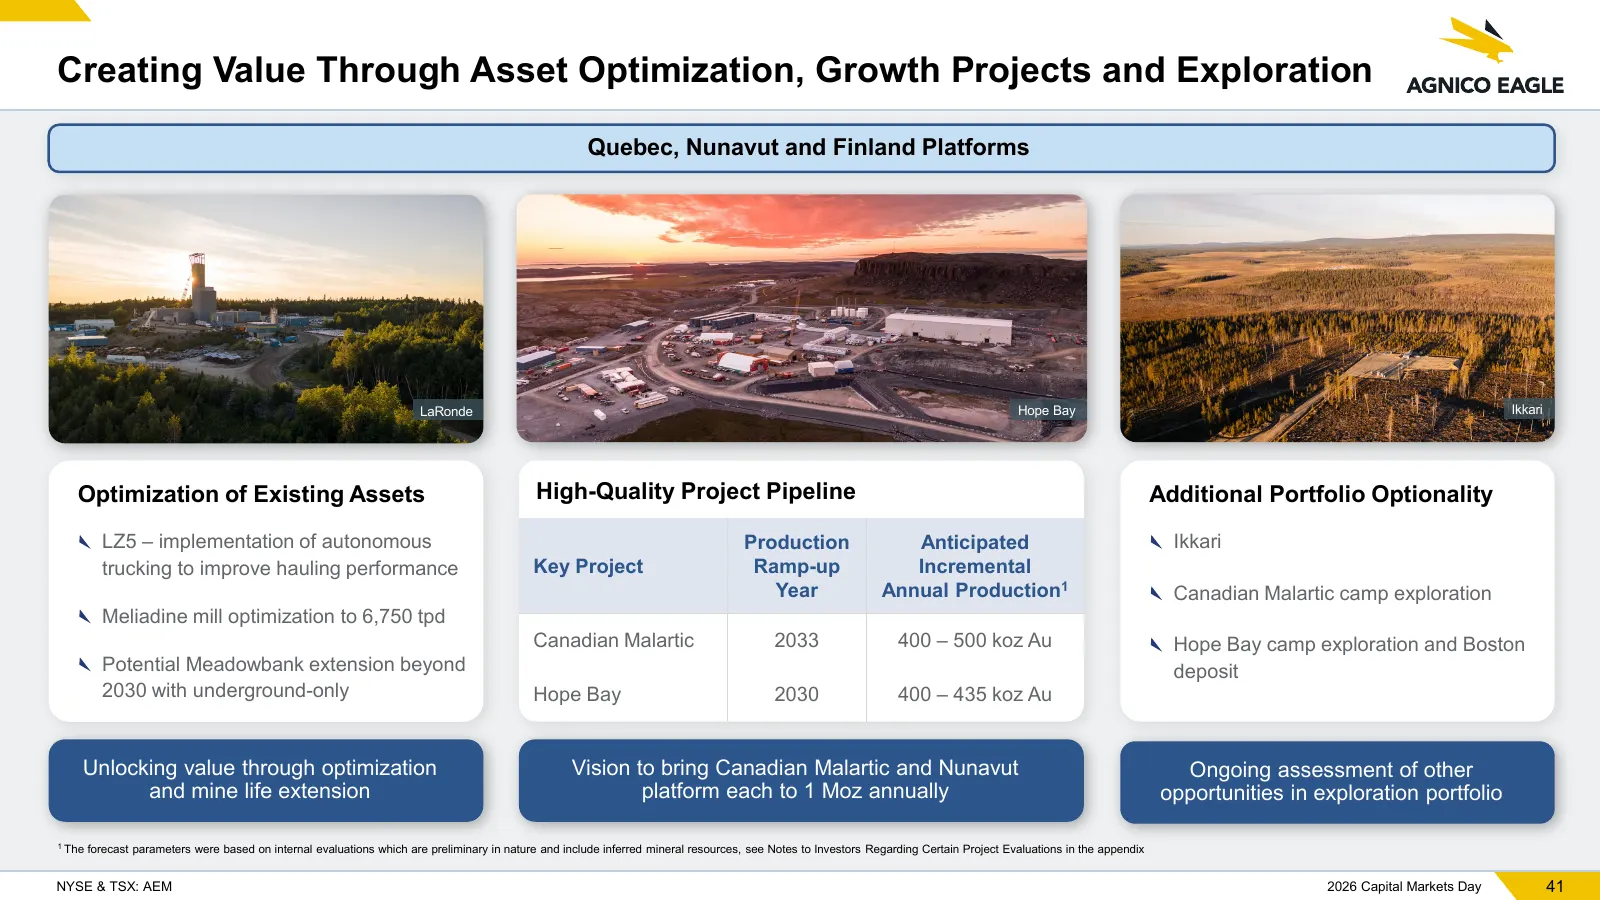
Slide 41: Creating Value Through Asset Optimization, Growth Projects and Exploration
Creating Value Through Asset Optimization, Growth Projects and Exploration Quebec, Nunavut and Finland Platforms LaRonde Hope Bay Ikkari Optimization of Existing Assets High-Quality Project Pipeline Additional Portfolio Optionality LZ5 – implementation of autonomous Production Anticipated Ikkari tru
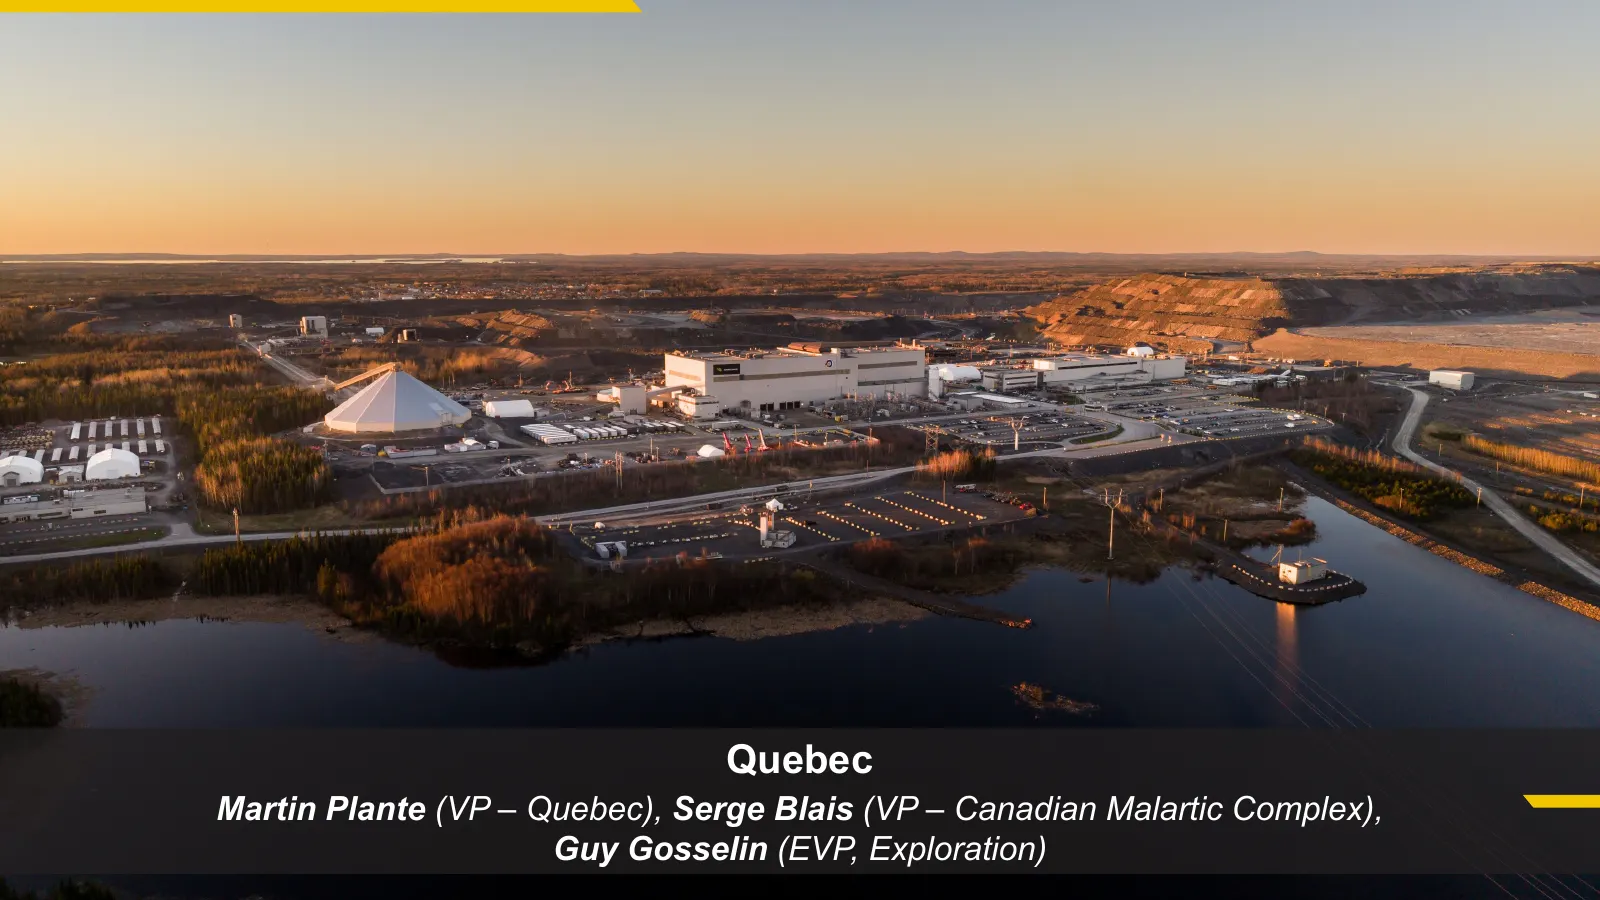
Slide 42: Quebec
Quebec Martin Plante (VP – Quebec), Serge Blais (VP – Canadian Malartic Complex), Guy Gosselin (EVP, Exploration)
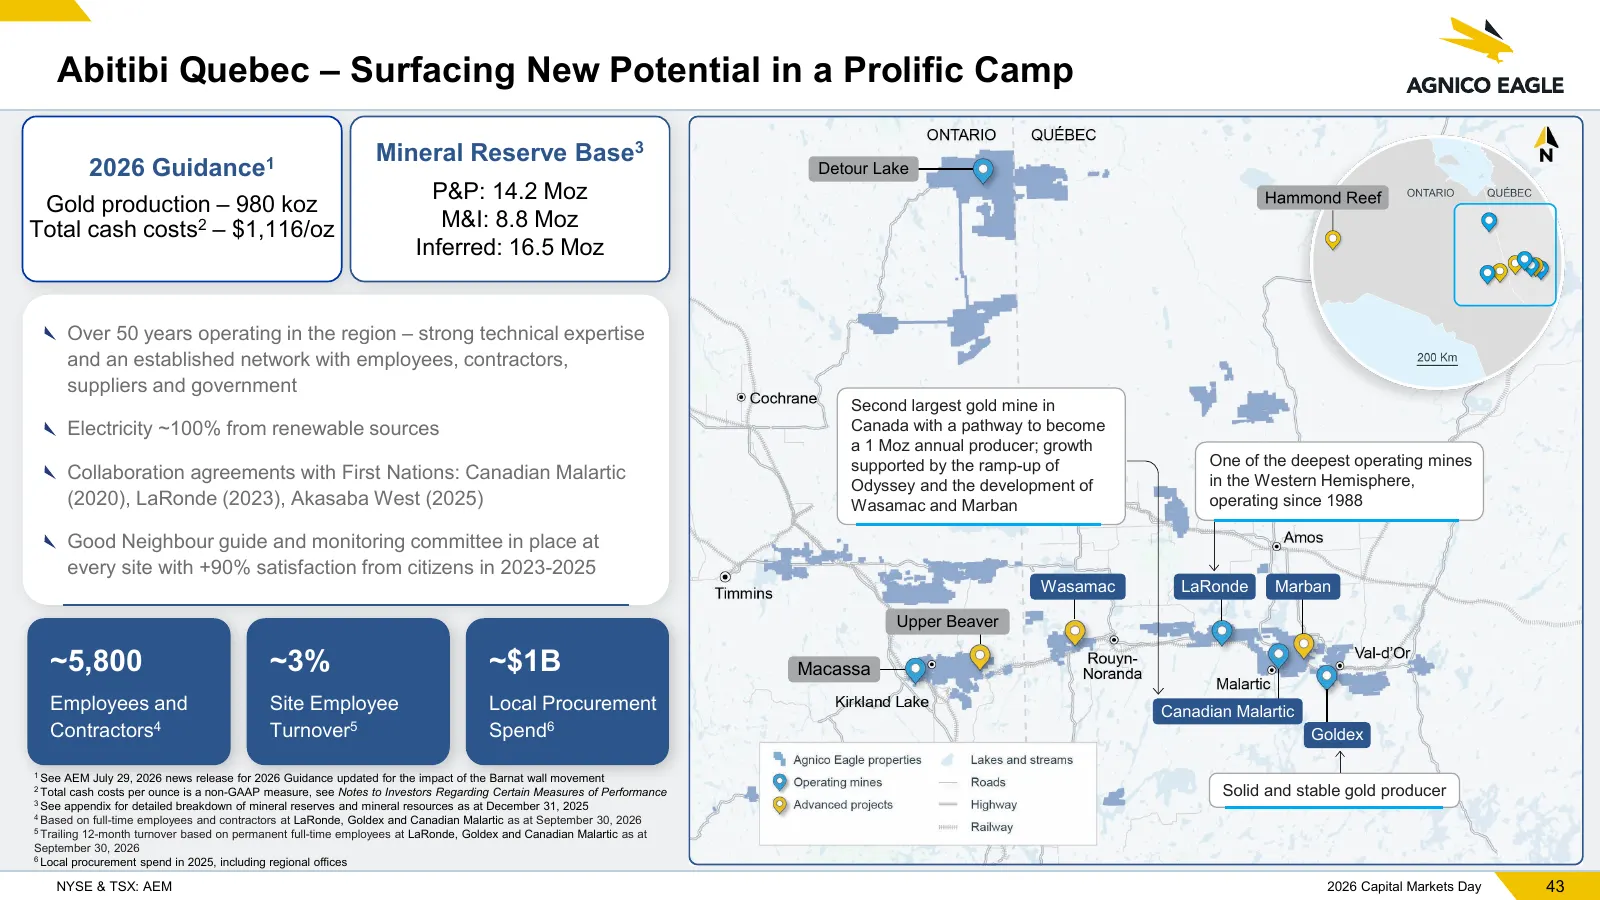
Slide 43: Abitibi Quebec – Surfacing New Potential
Abitibi Quebec – Surfacing New Potential in a Prolific Camp Mineral Reserve Base3 2026 Guidance1 Detour Lake P&P: 14.2 Moz Gold production – 980 koz Total cash costs2 – $1,116/oz M&I: 8.8 Moz Inferred: 16.5 Moz Over 50 years operating in the region – strong technical expertise and an established net
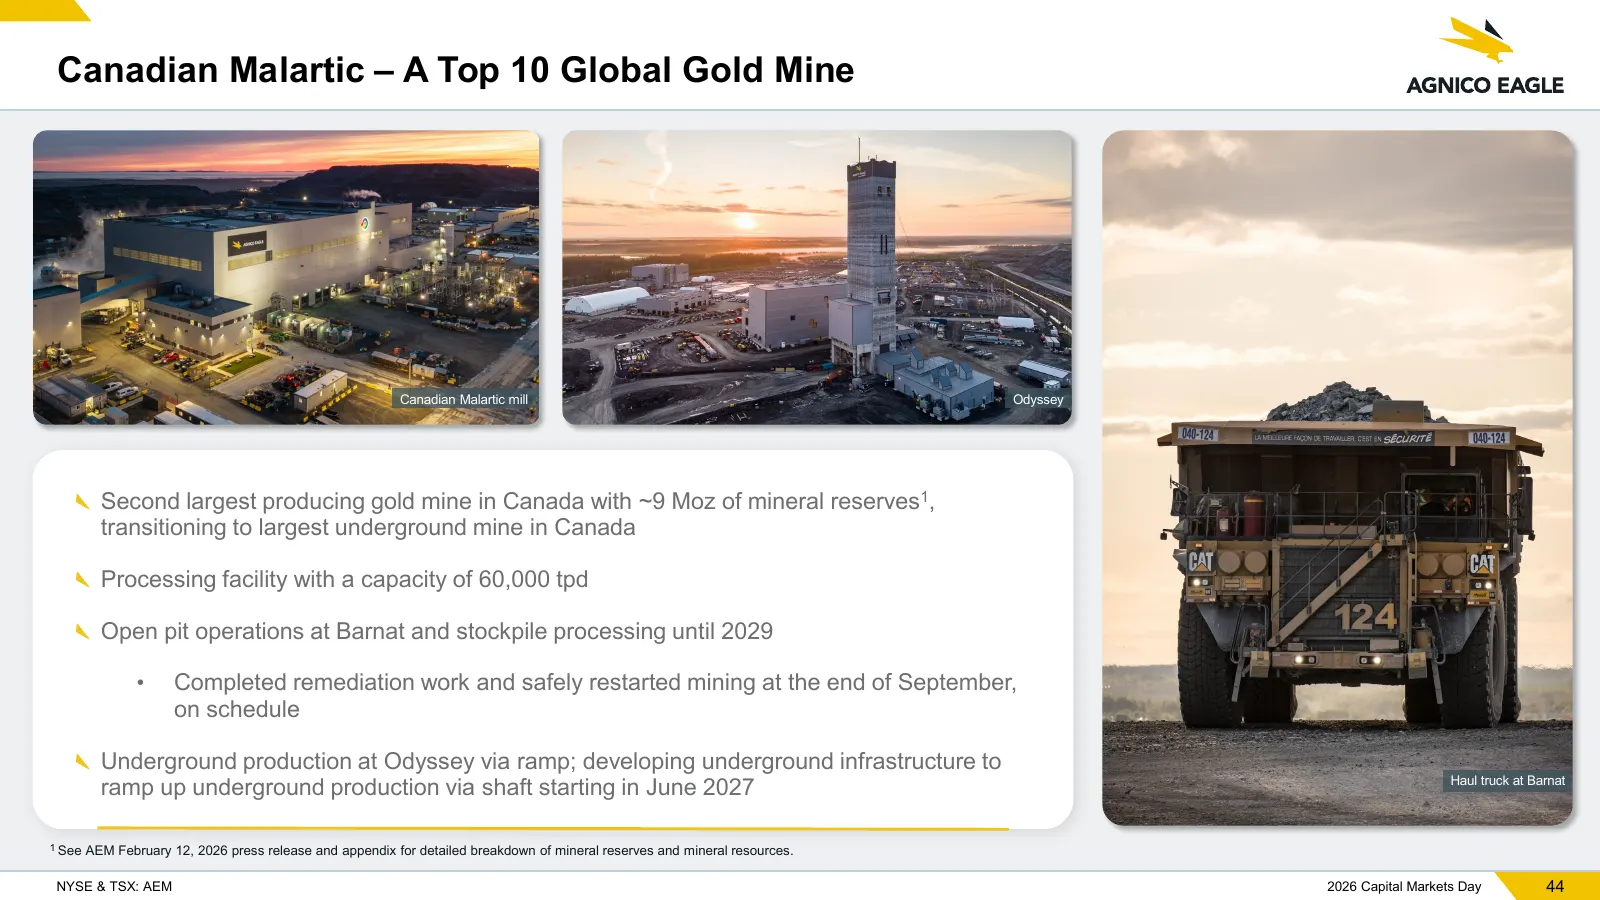
Slide 44: Canadian Malartic – A Top Global Gold Mine
Canadian Malartic – A Top 10 Global Gold Mine Canadian Malartic mill Odyssey Second largest producing gold mine in Canada with ~9 Moz of mineral reserves1, transitioning to largest underground mine in Canada Processing facility with a capacity of 60,000 tpd Open pit operations at Barnat and stockpil
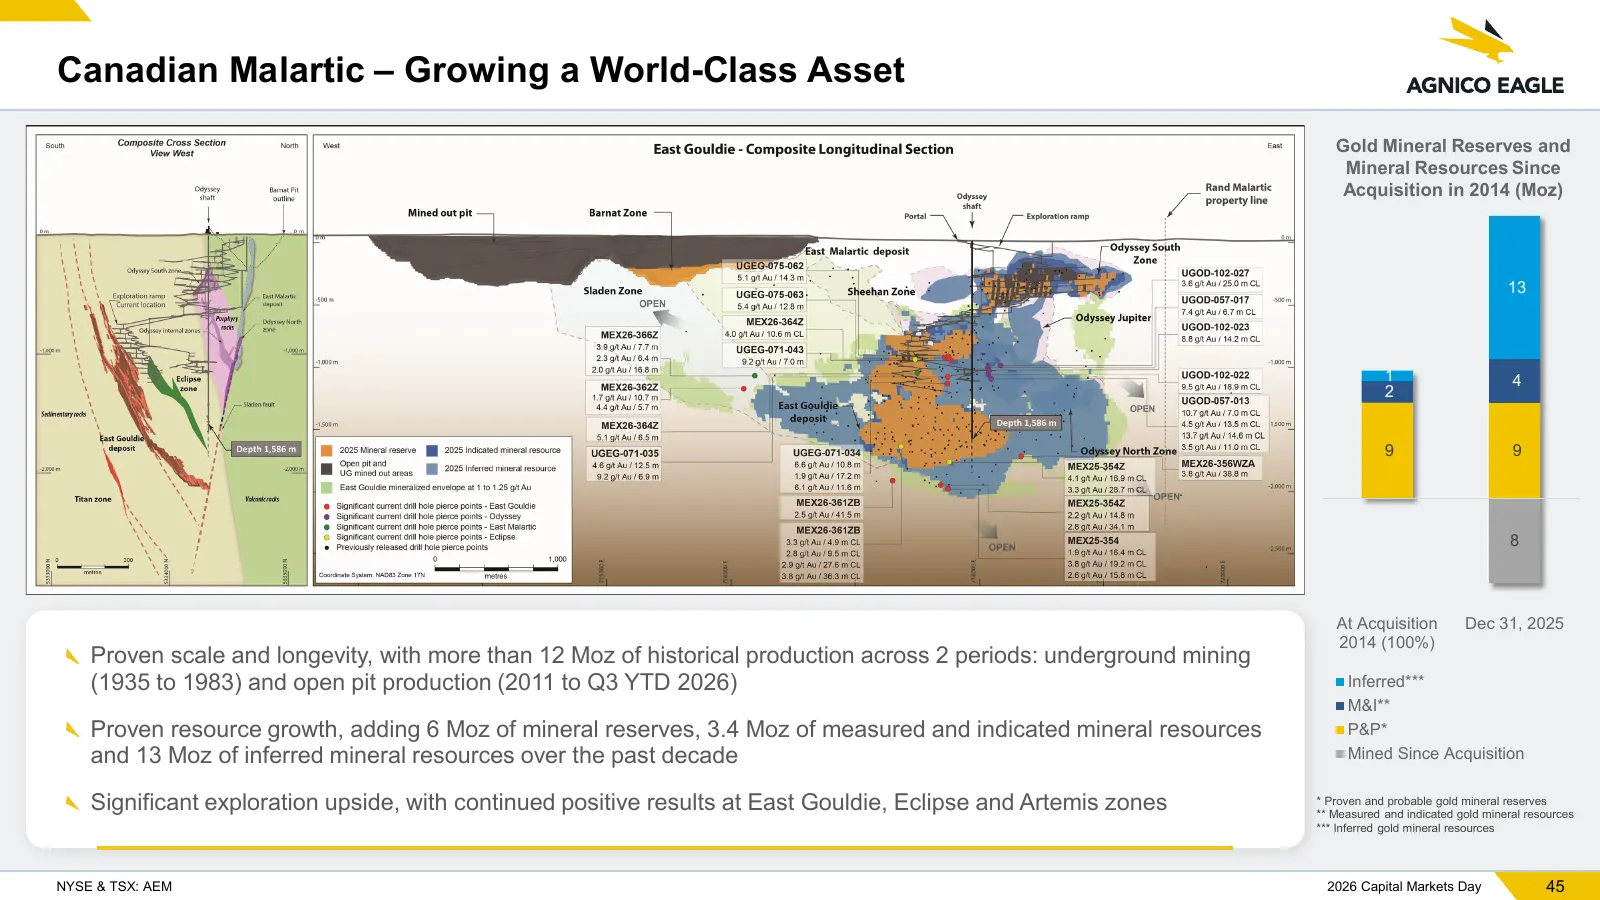
Slide 45: Canadian Malartic – Growing a World-Class Asset
Canadian Malartic – Growing a World-Class Asset Gold Mineral Reserves and Mineral Resources Since Acquisition in 2014 (Moz) 13 1 4 2 9 9 8 At Acquisition Dec 31, 2025 2014 (100%) Proven scale and longevity, with more than 12 Moz of historical production across 2 periods: underground mining (1935 to
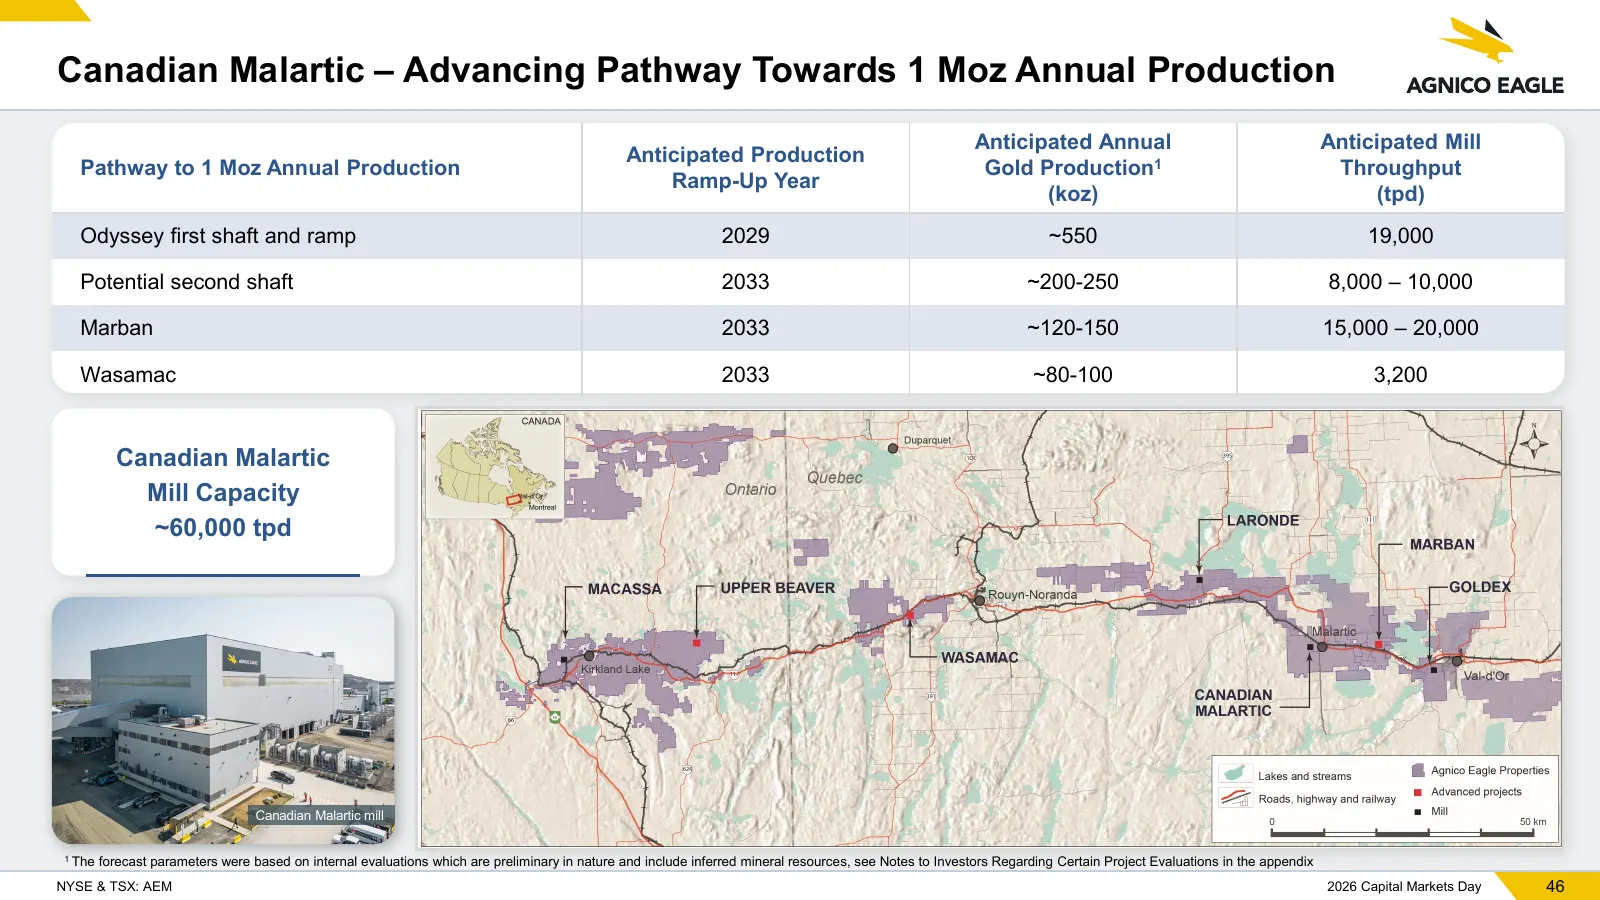
Slide 46: Canadian Malartic – Pathway Towards 1 Moz
Canadian Malartic – Advancing Pathway Towards 1 Moz Annual Production Anticipated Annual Anticipated Mill Anticipated Production Pathway to 1 Moz Annual Production Gold Production1 Throughput Ramp-Up Year (koz) (tpd) Odyssey first shaft and ramp 2029 ~550 19,000 Potential second shaft 2033 ~200-250
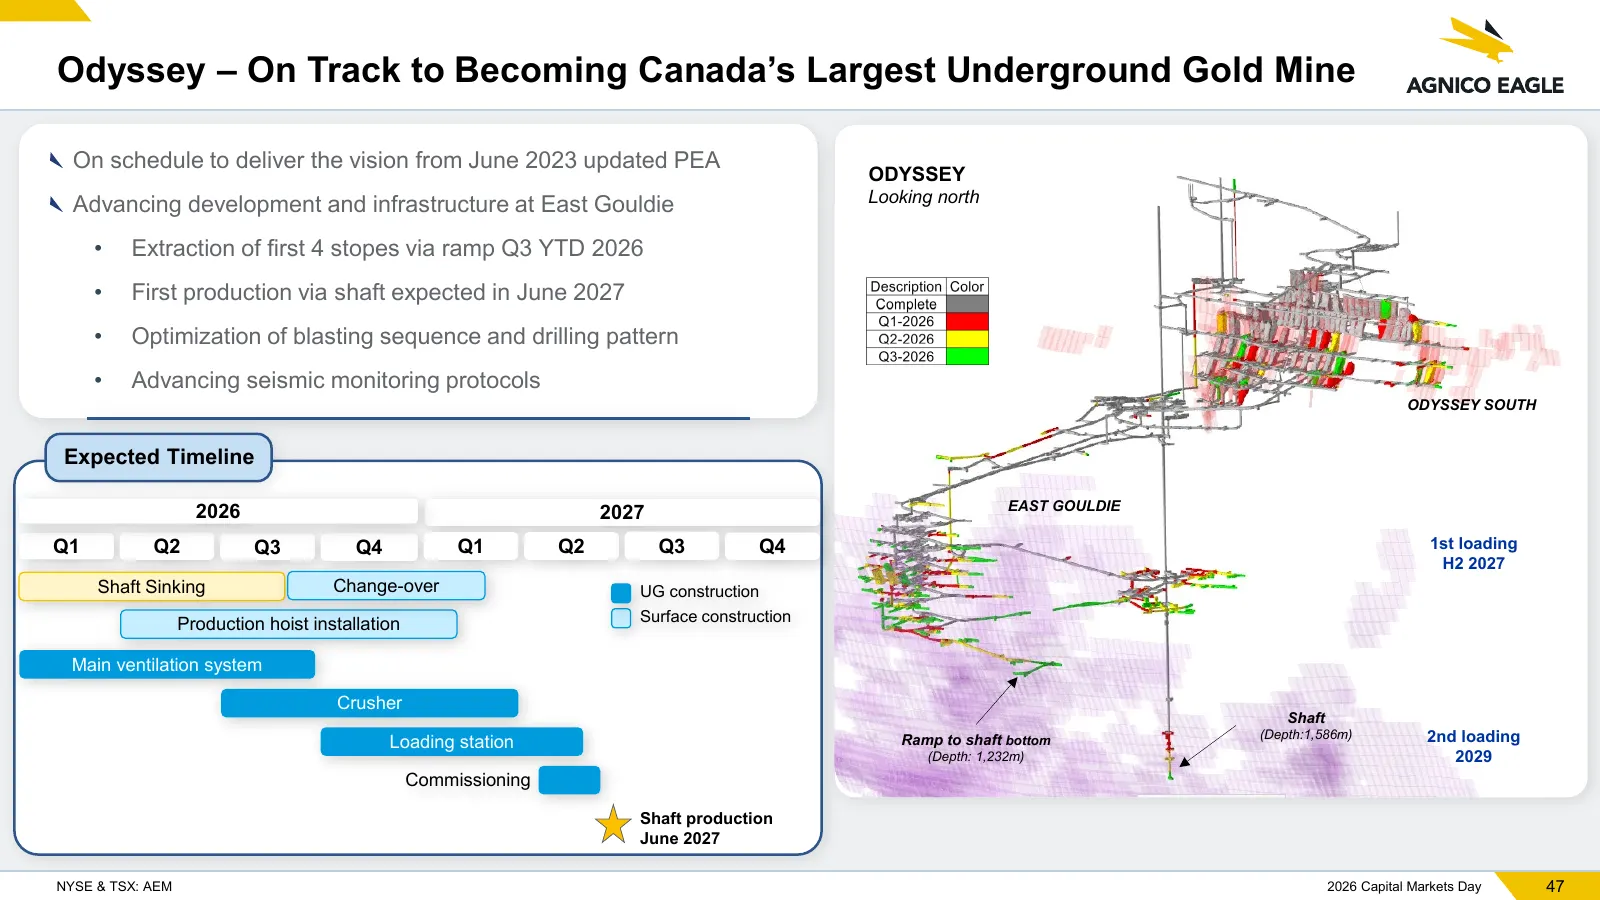
Slide 47: Odyssey – On Track to Becoming Canada's Largest Underground Gold Mine
Odyssey – On Track to Becoming Canada’s Largest Underground Gold Mine On schedule to deliver the vision from June 2023 updated PEA ODYSSEY Advancing development and infrastructure at East Gouldie Looking north • Extraction of first 4 stopes via ramp Q3 YTD 2026 • First production via shaft expected
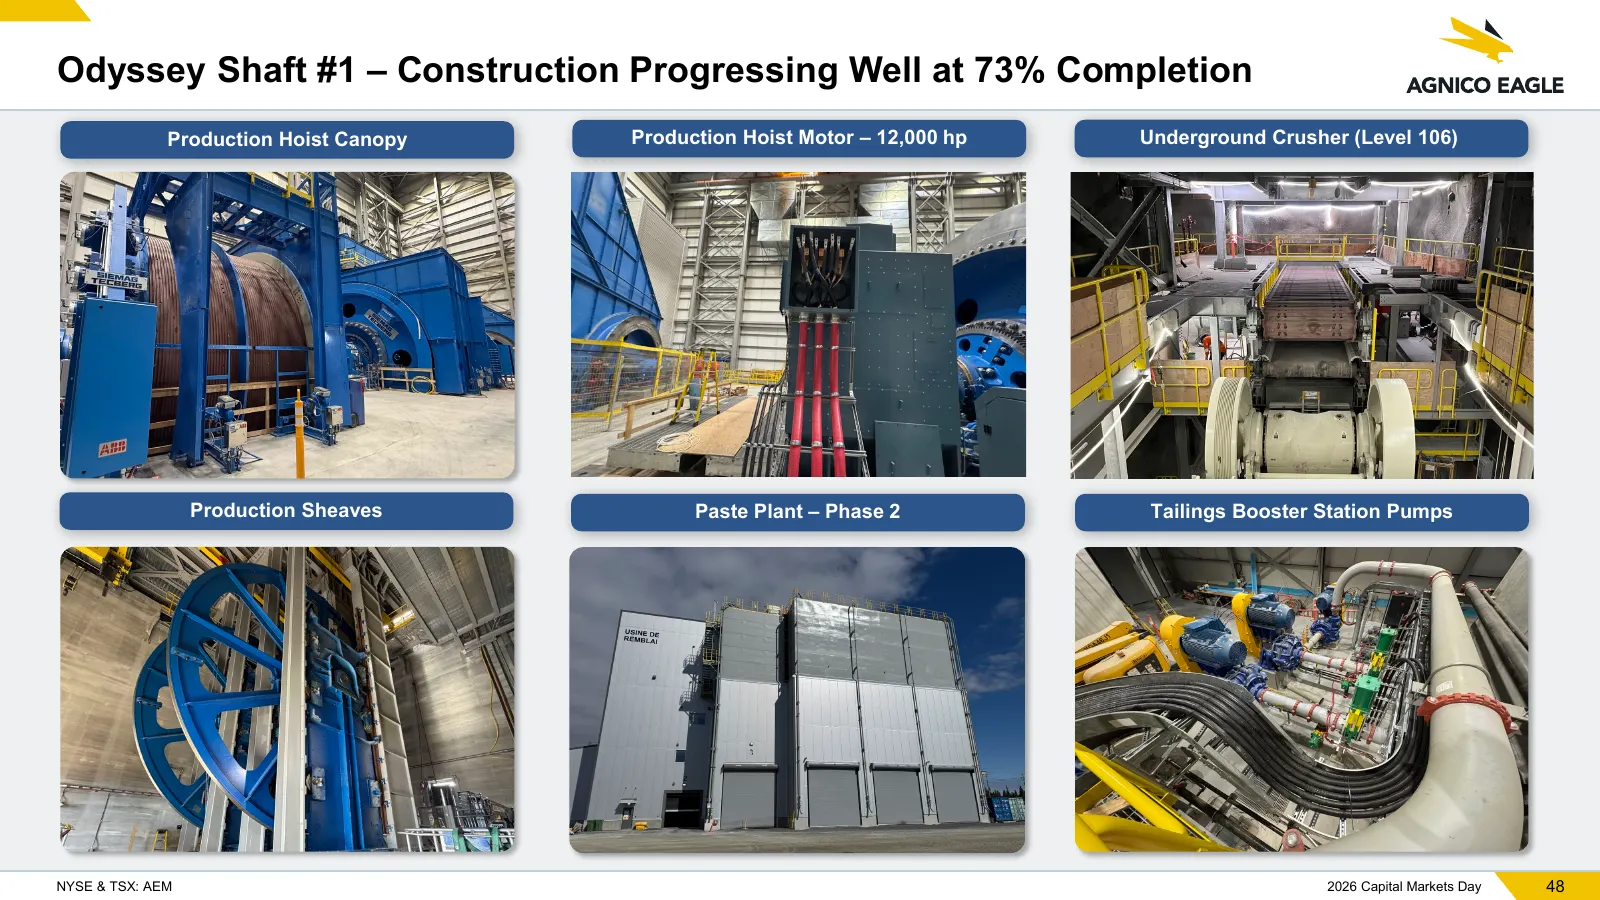
Slide 48: Odyssey Shaft #1 – Construction at 73% Completion
Odyssey Shaft #1 – Construction Progressing Well at 73% Completion Production Hoist Canopy Production Hoist Motor – 12,000 hp Underground Crusher (Level 106) Production Sheaves Paste Plant – Phase 2 Tailings Booster Station Pumps NYSE & TSX: AEM 2026 Capital Markets Day 48
Slide 49: Odyssey Shaft #2 – Potential First Production in 2033
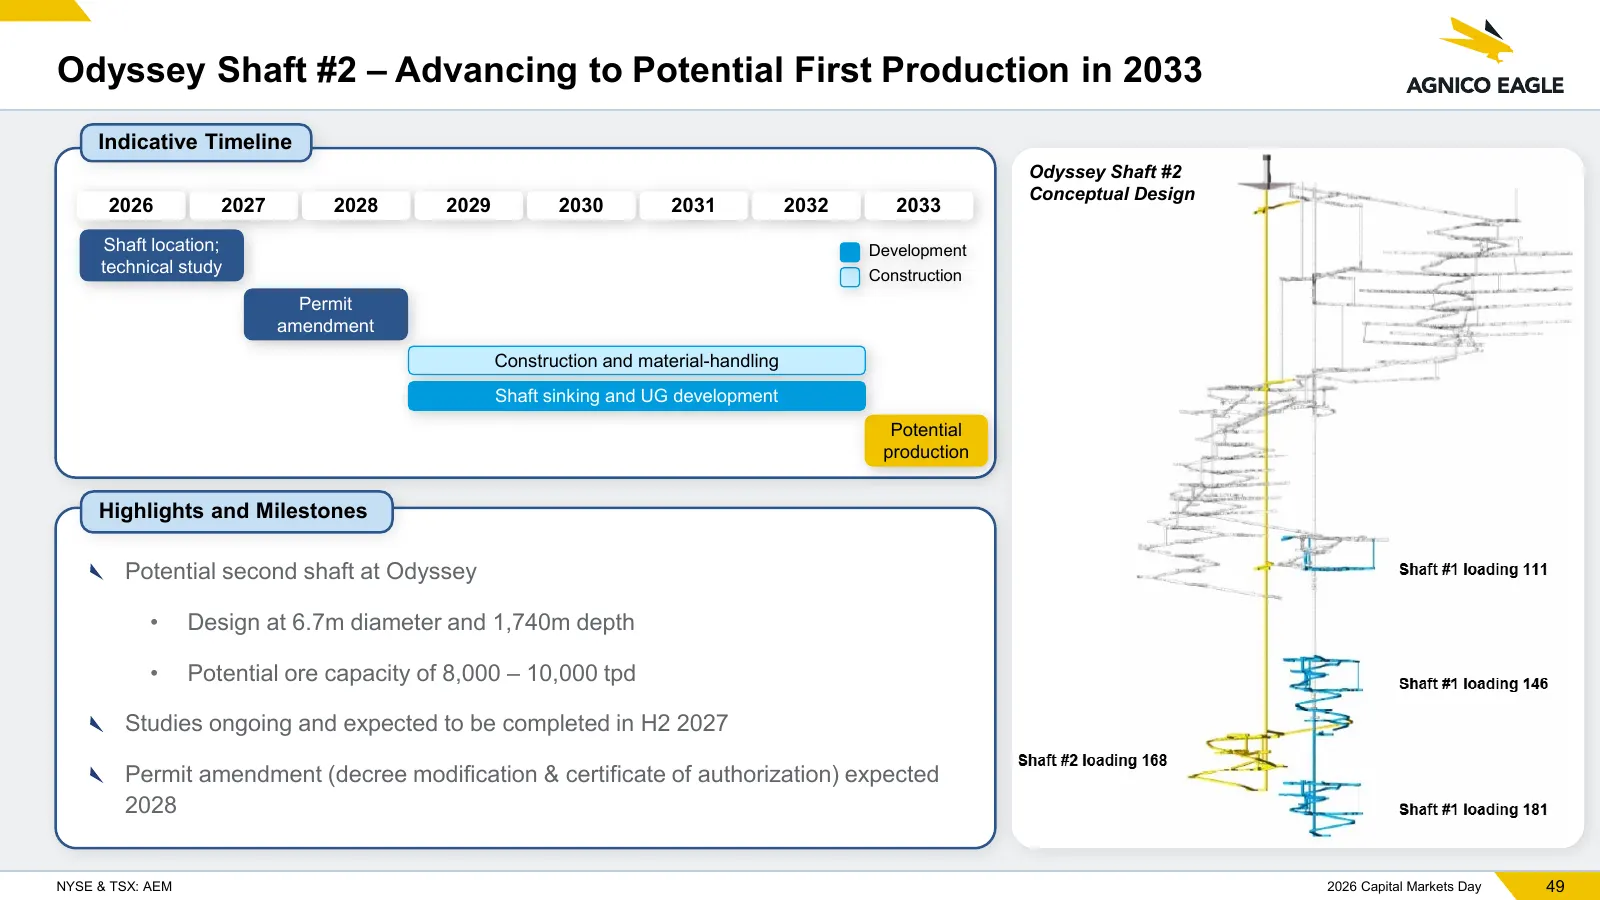
Odyssey Shaft #2 – Advancing to Potential First Production in 2033 Indicative Timeline Odyssey Shaft #2 Conceptual Design 2026 2027 2028 2029 2030 2031 2032 2033 Shaft location; Development technical study Construction Permit amendment Construction and material-handling Shaft sinking and UG developm
Slide 50: Marban – Open Pit with First Production as Early as 2033
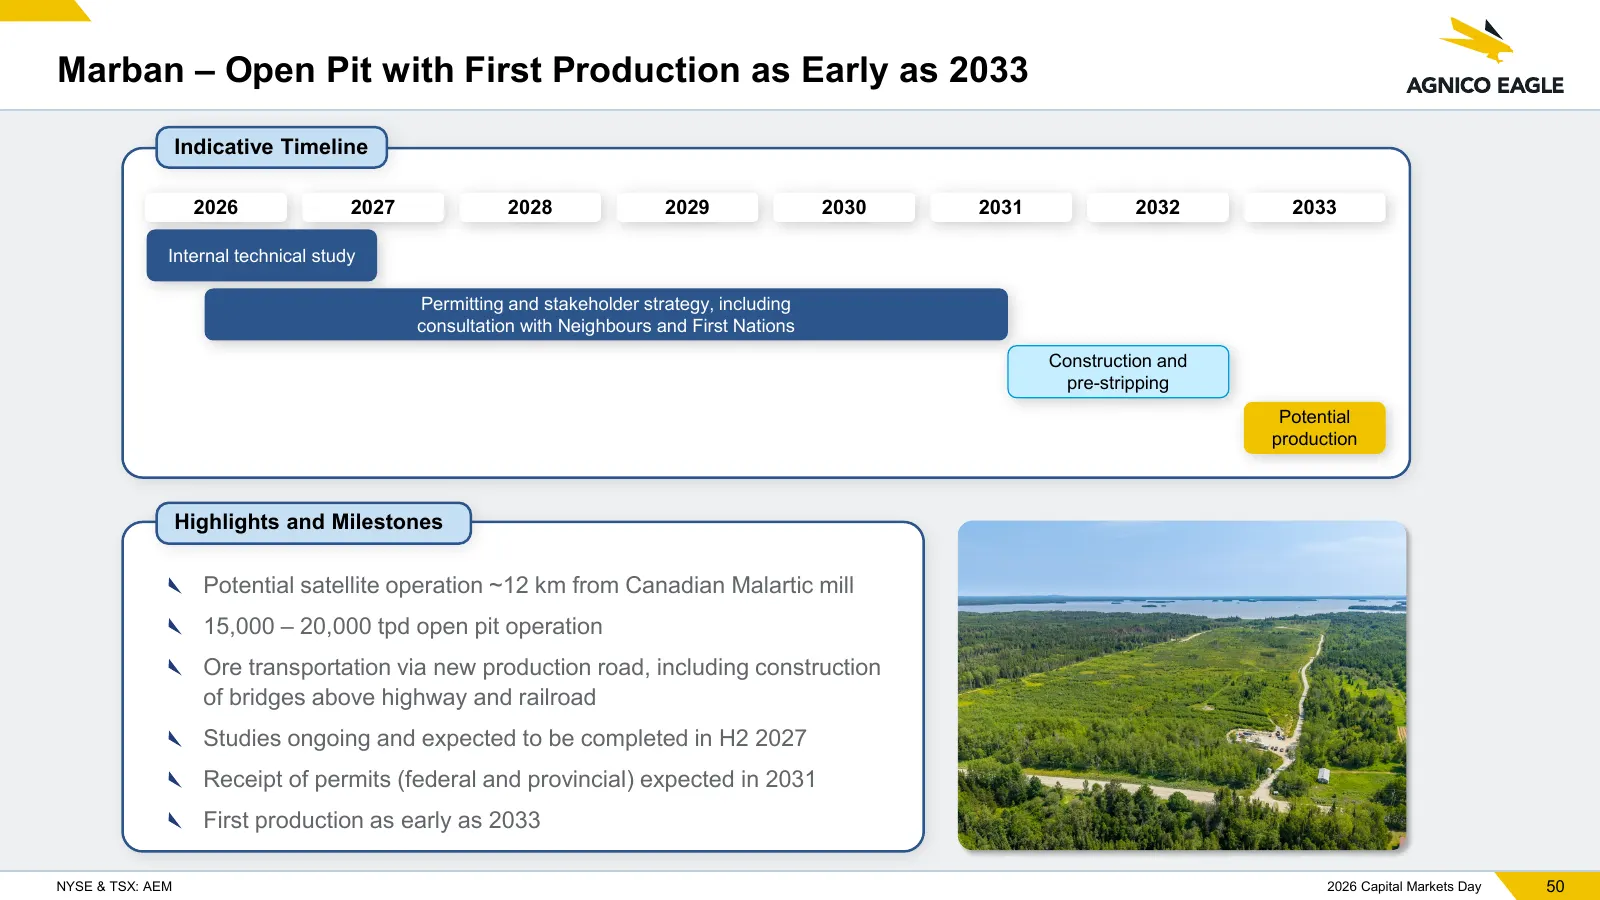
Marban – Open Pit with First Production as Early as 2033 Indicative Timeline 2026 2027 2028 2029 2030 2031 2032 2033 Internal technical study Permitting and stakeholder strategy, including consultation with Neighbours and First Nations Construction and pre-stripping Potential production Highlights a
Slide 51: Marban – Satellite Open Pit Deposit
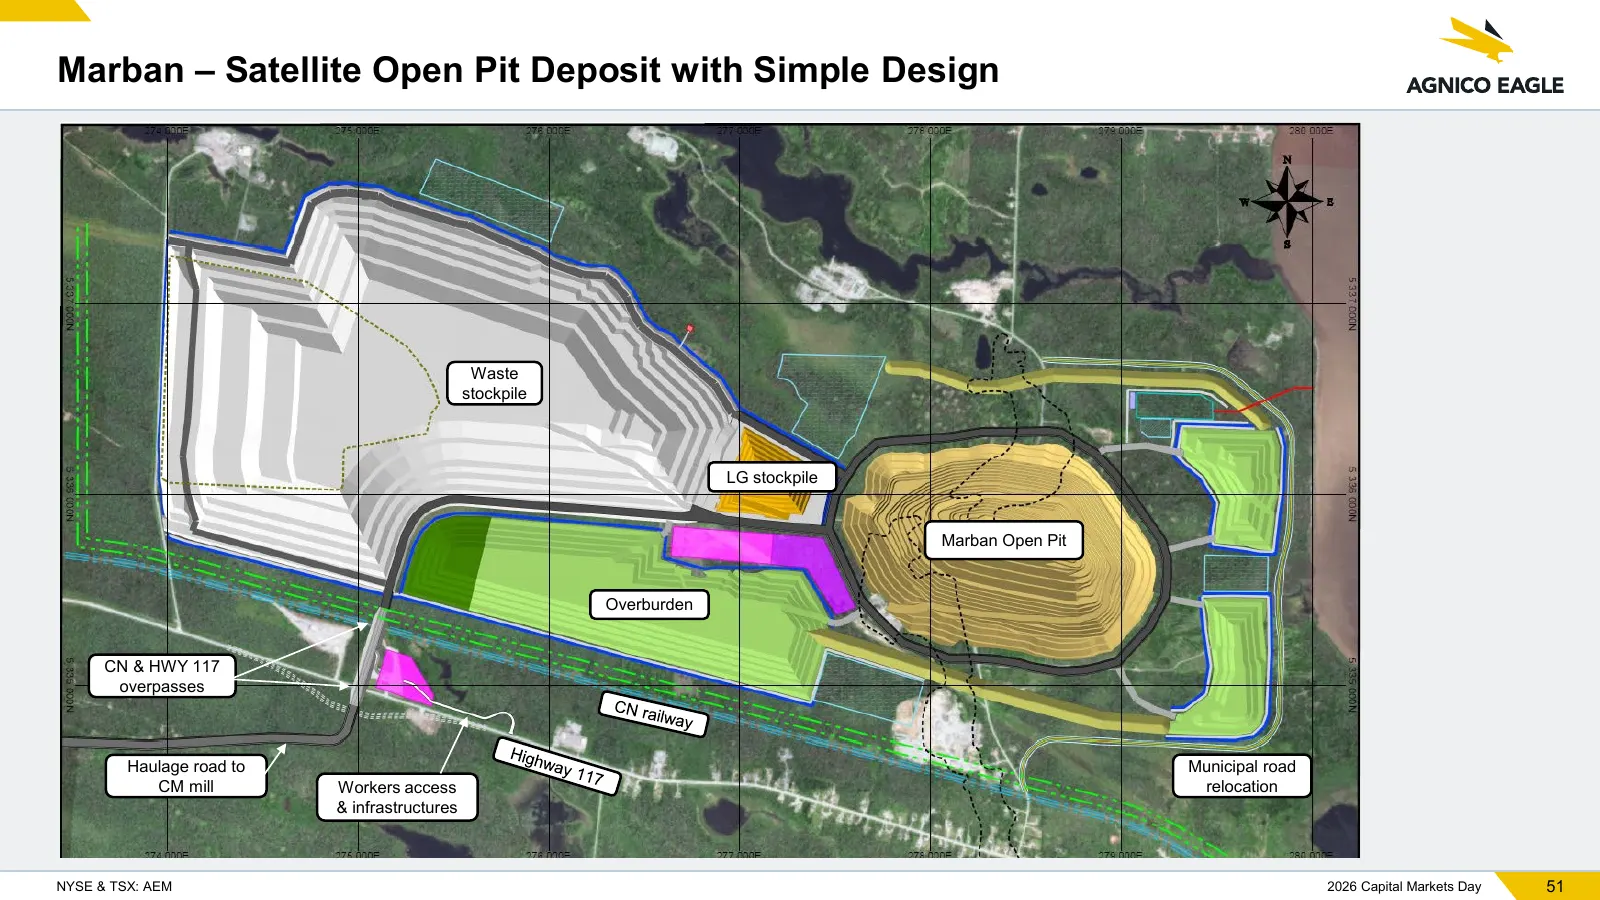
Marban – Satellite Open Pit Deposit with Simple Design Waste stockpile LG stockpile Marban Open Pit Overburden CN & HWY 117 overpasses Haulage road to Municipal road CM mill Workers access relocation & infrastructures NYSE & TSX: AEM 2026 Capital Markets Day 51
Slide 52: Wasamac – Underground Project, First Production as Early as 2033
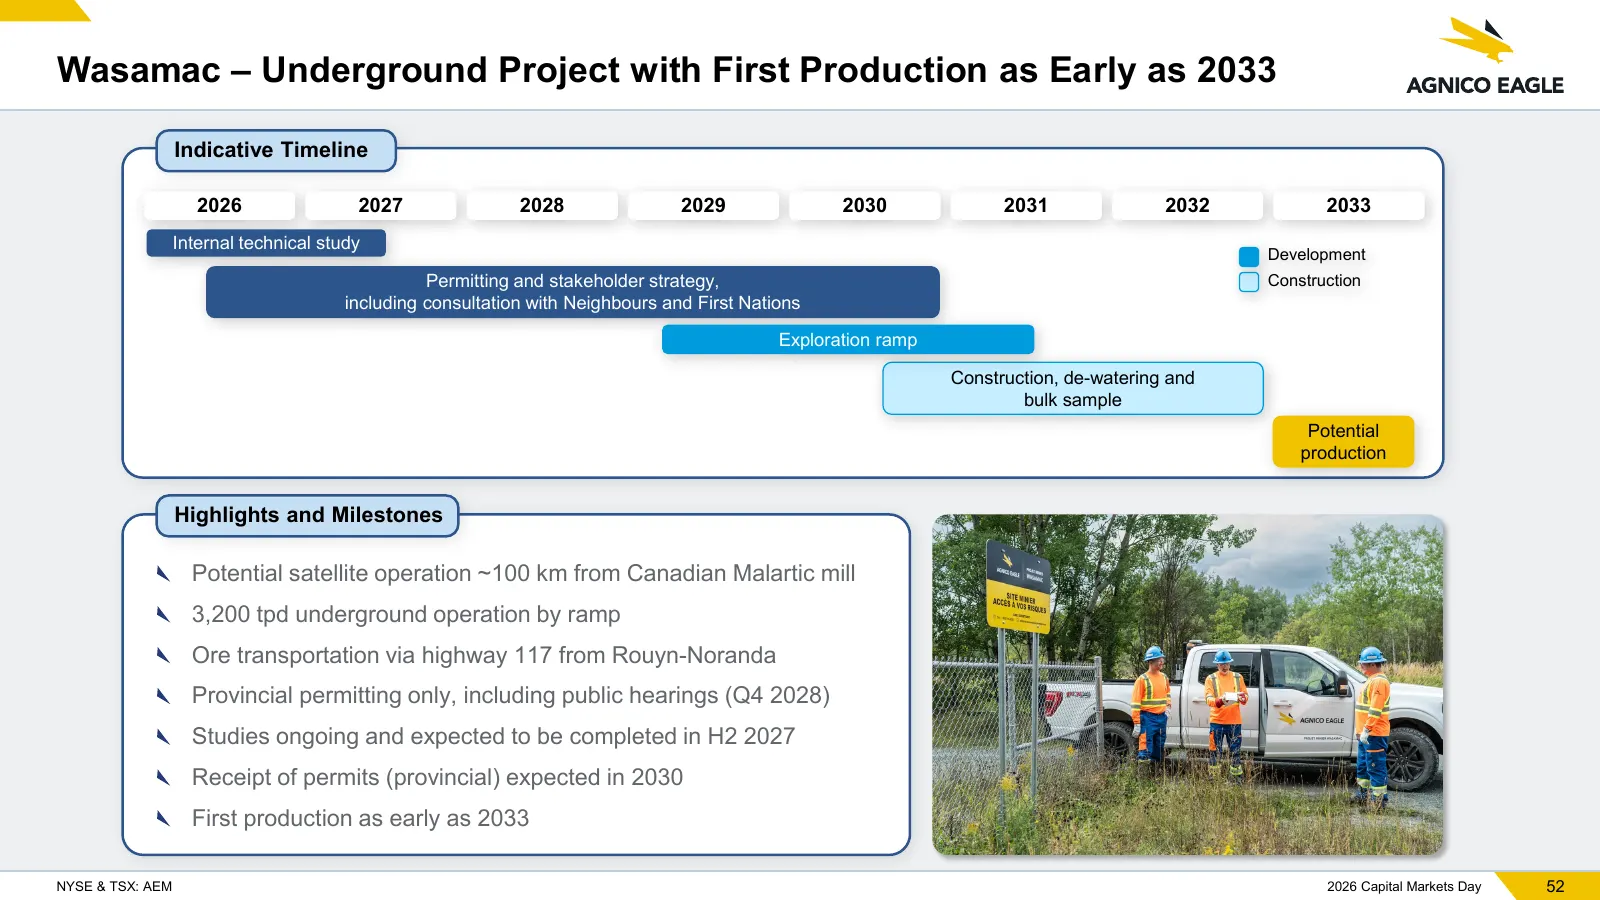
Wasamac – Underground Project with First Production as Early as 2033 Indicative Timeline 2026 2027 2028 2029 2030 2031 2032 2033 Internal technical study Development Permitting and stakeholder strategy, Construction including consultation with Neighbours and First Nations Exploration ramp Constructi
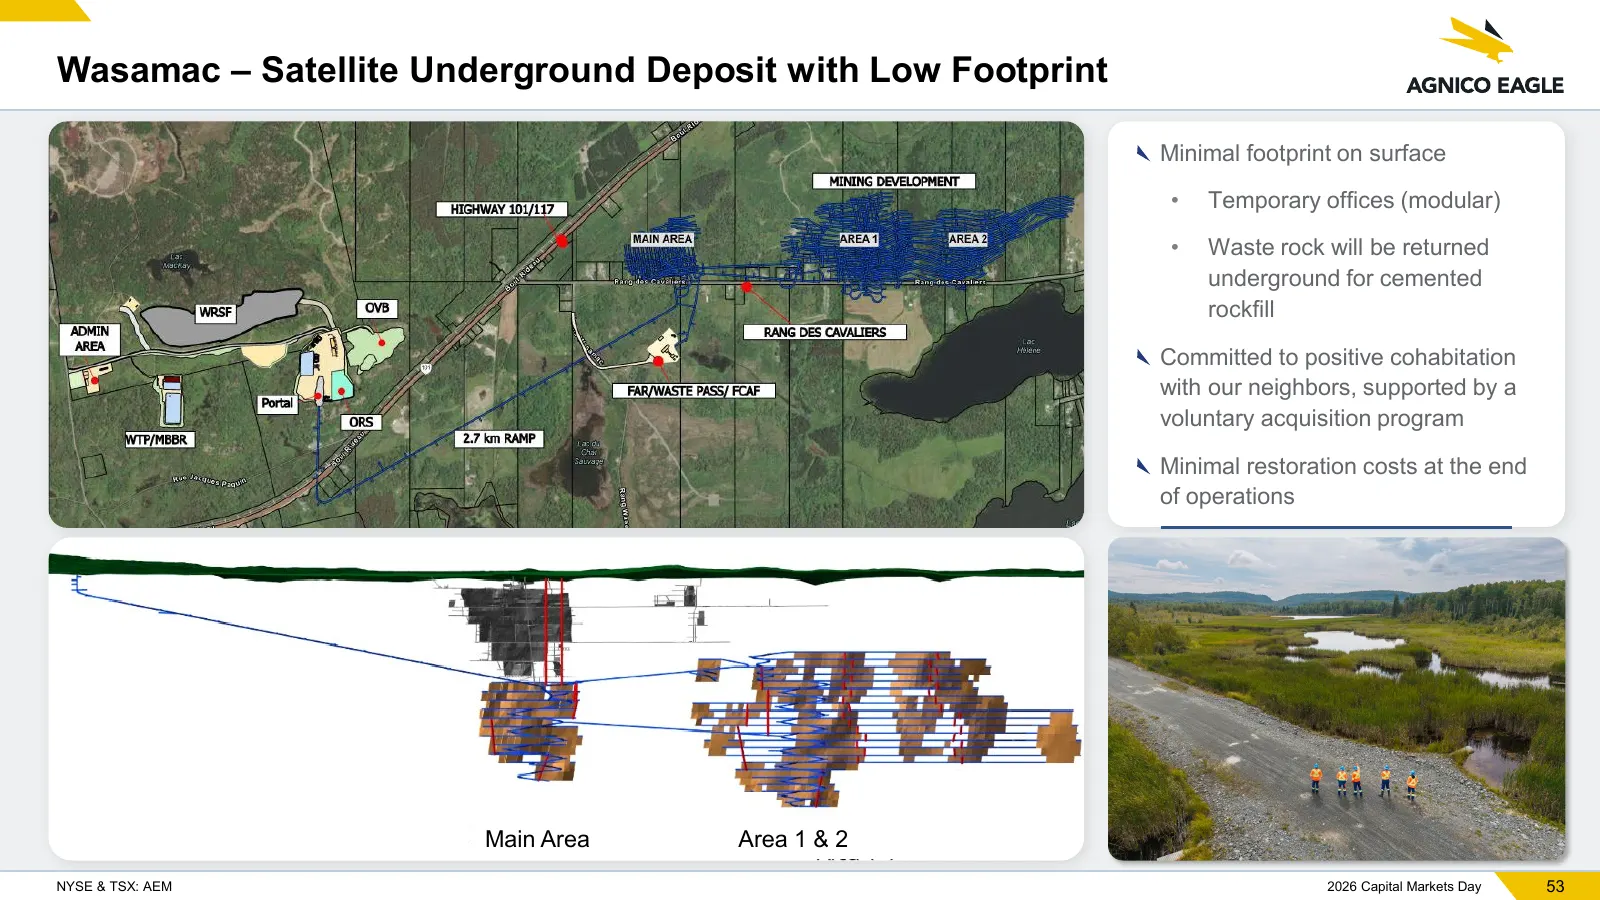
Slide 53: Wasamac – Satellite Underground Deposit with Low Footprint
Wasamac – Satellite Underground Deposit with Low Footprint Minimal footprint on surface • Temporary offices (modular) • Waste rock will be returned underground for cemented rockfill Committed to positive cohabitation with our neighbors, supported by a voluntary acquisition program Minimal restoratio
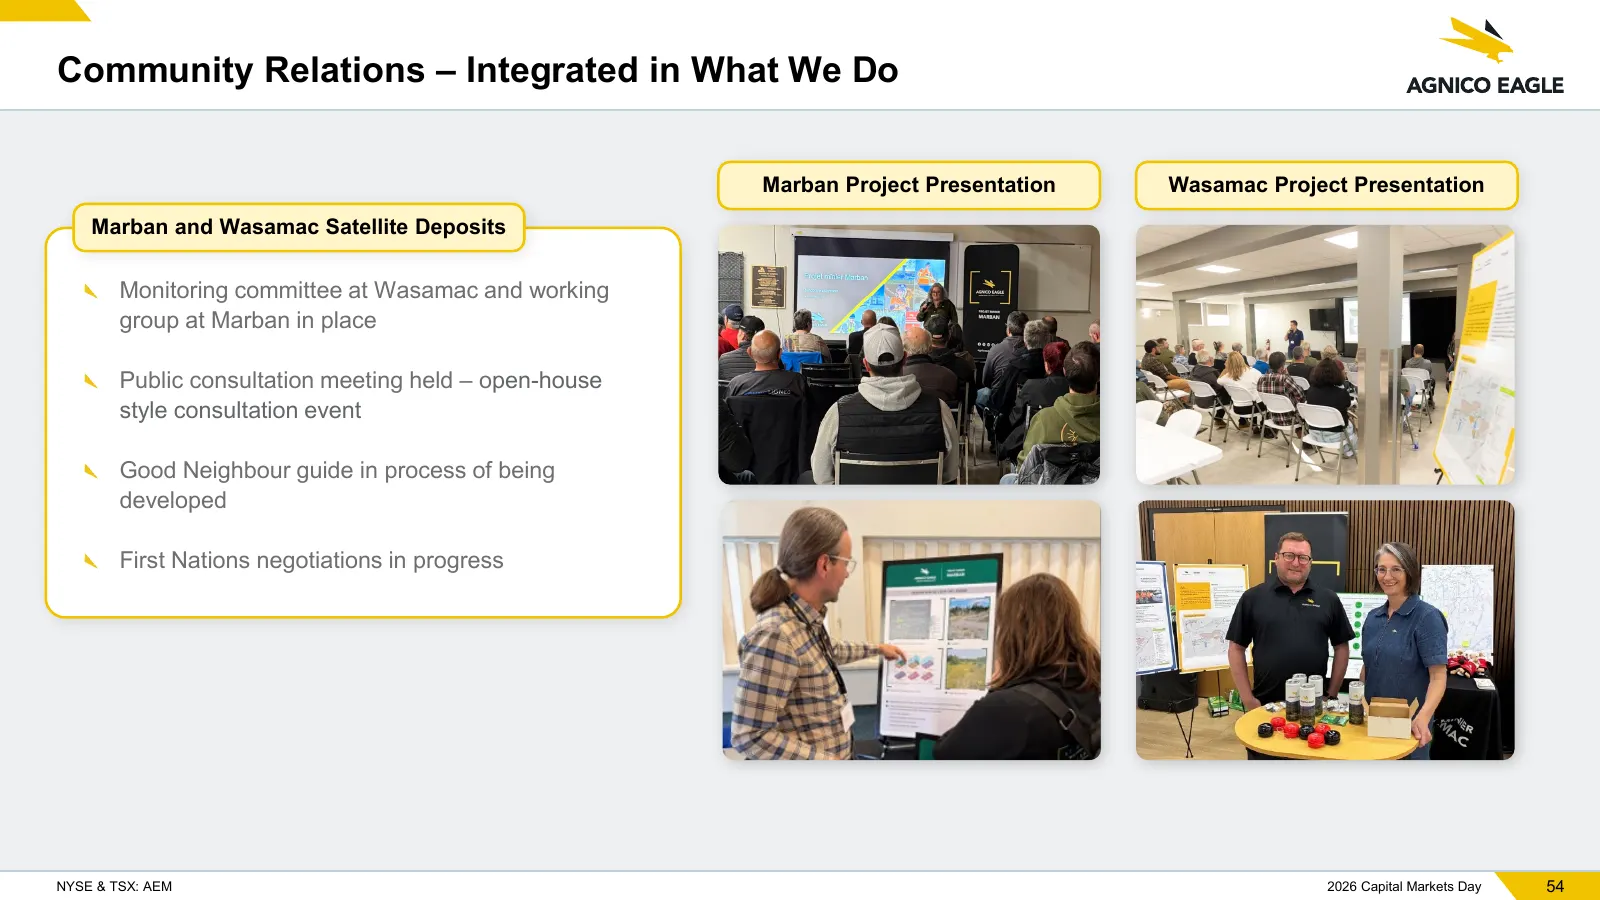
Slide 54: Community Relations – Integrated in What We Do
Community Relations – Integrated in What We Do Marban Project Presentation Wasamac Project Presentation Marban and Wasamac Satellite Deposits Monitoring committee at Wasamac and working group at Marban in place Public consultation meeting held – open-house style consultation event Good Neighbour gui
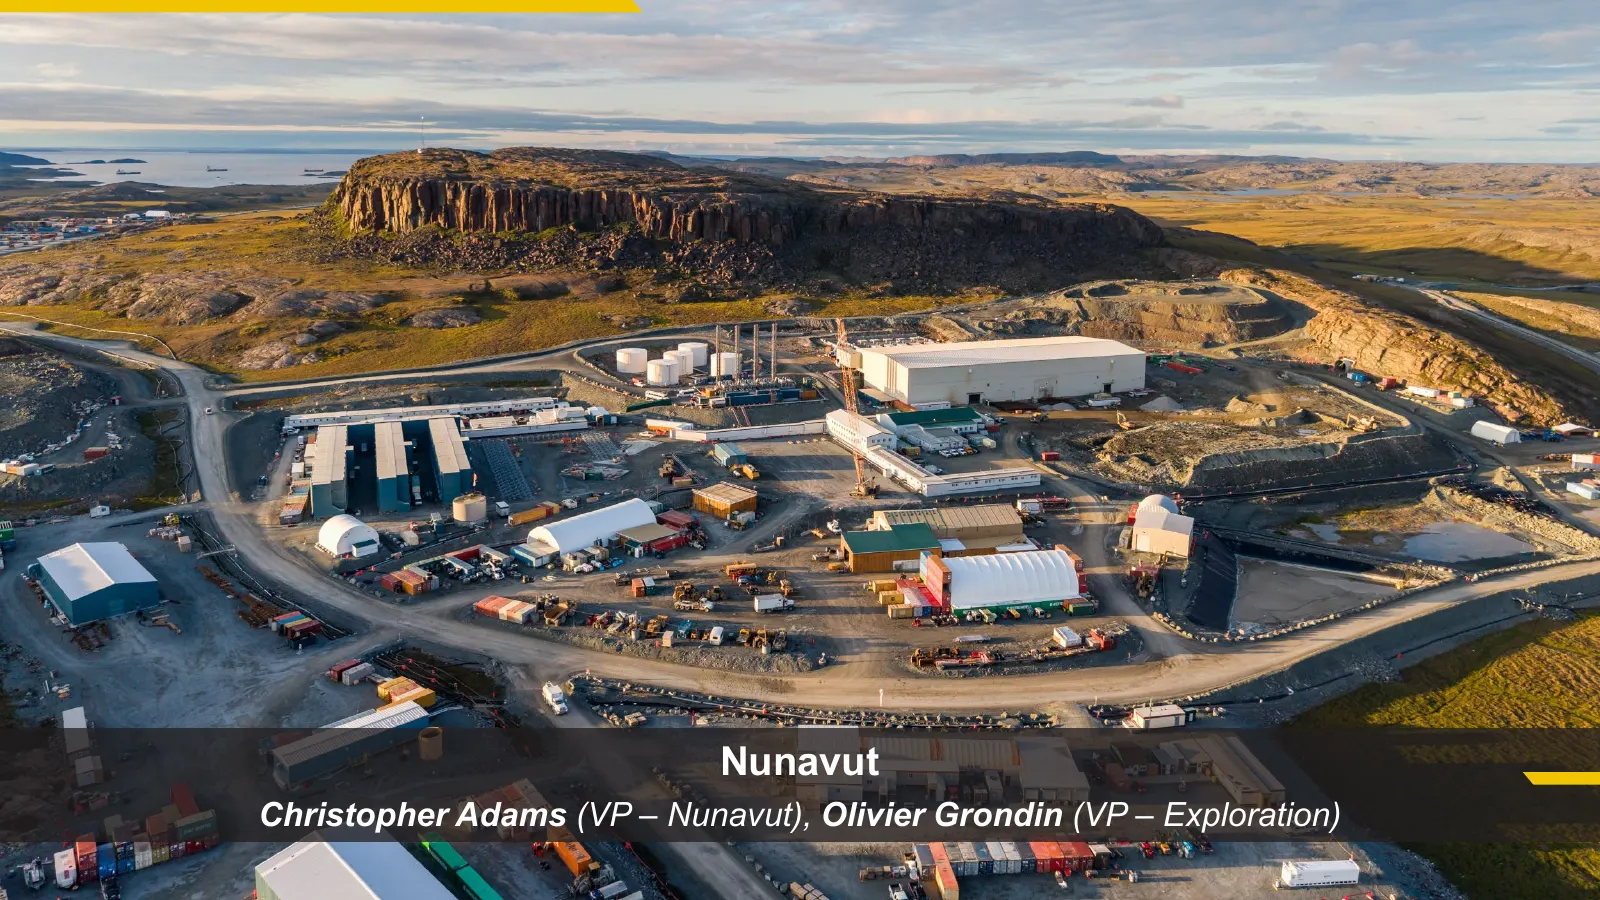
Slide 55: Nunavut
Nunavut Christopher Adams (VP – Nunavut), Olivier Grondin (VP – Exploration)
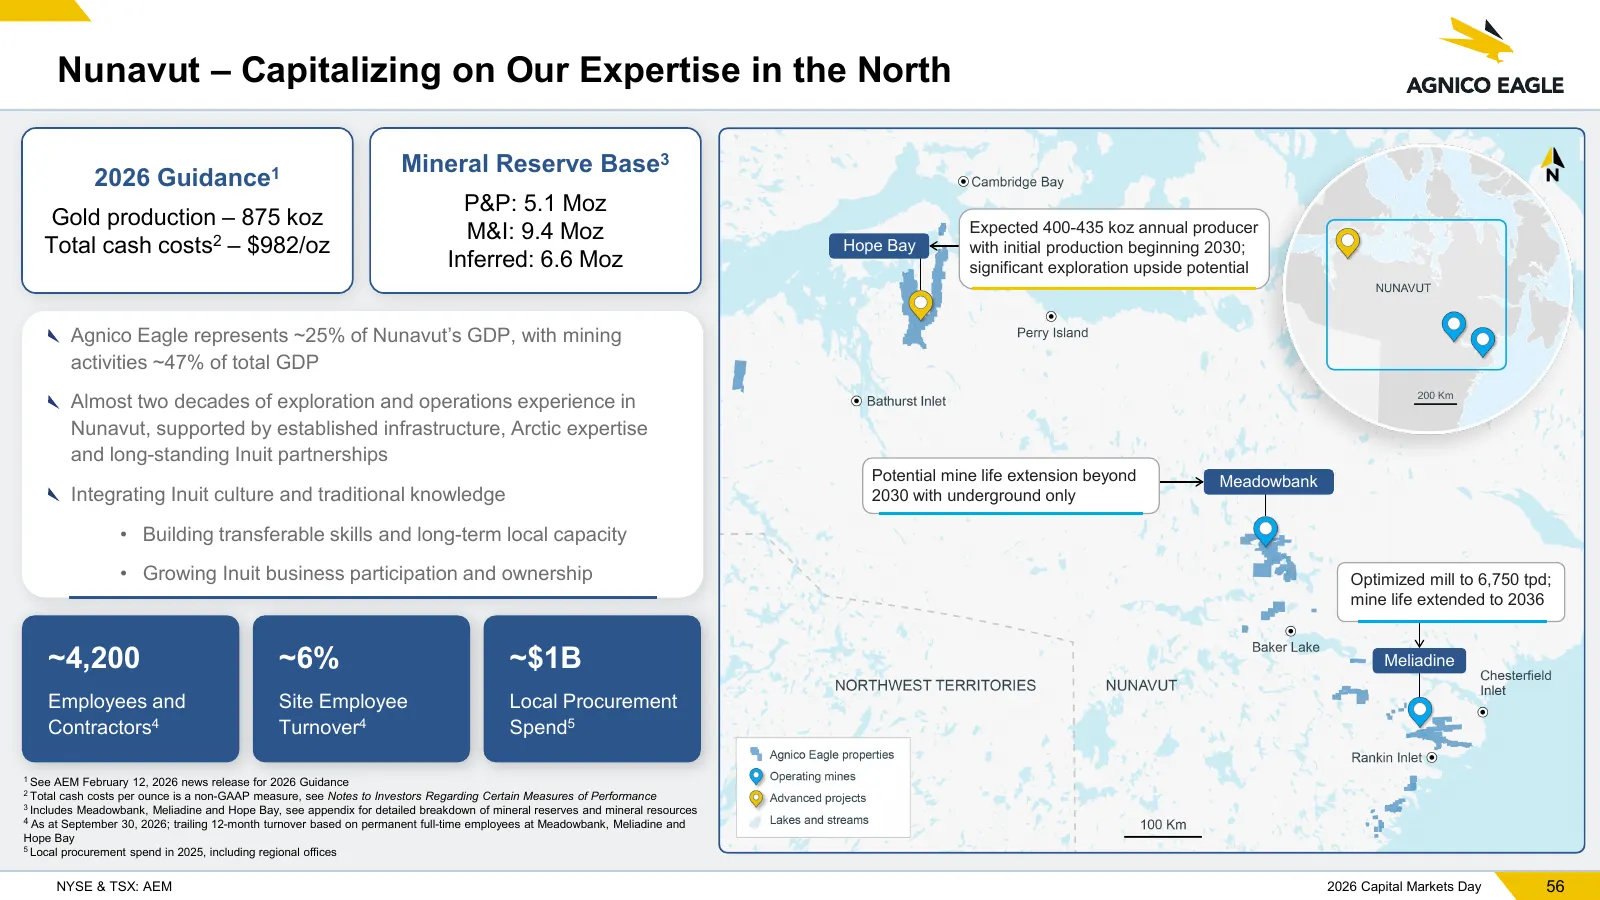
Slide 56: Nunavut – Capitalizing on Our Expertise in the North
Nunavut – Capitalizing on Our Expertise in the North Mineral Reserve Base3 2026 Guidance1 P&P: 5.1 Moz Gold production – 875 koz M&I: 9.4 Moz Expected 400-435 koz annual producer Total cash costs2 – $982/oz Hope Bay with initial production beginning 2030; Inferred: 6.6 Moz significant exploration up
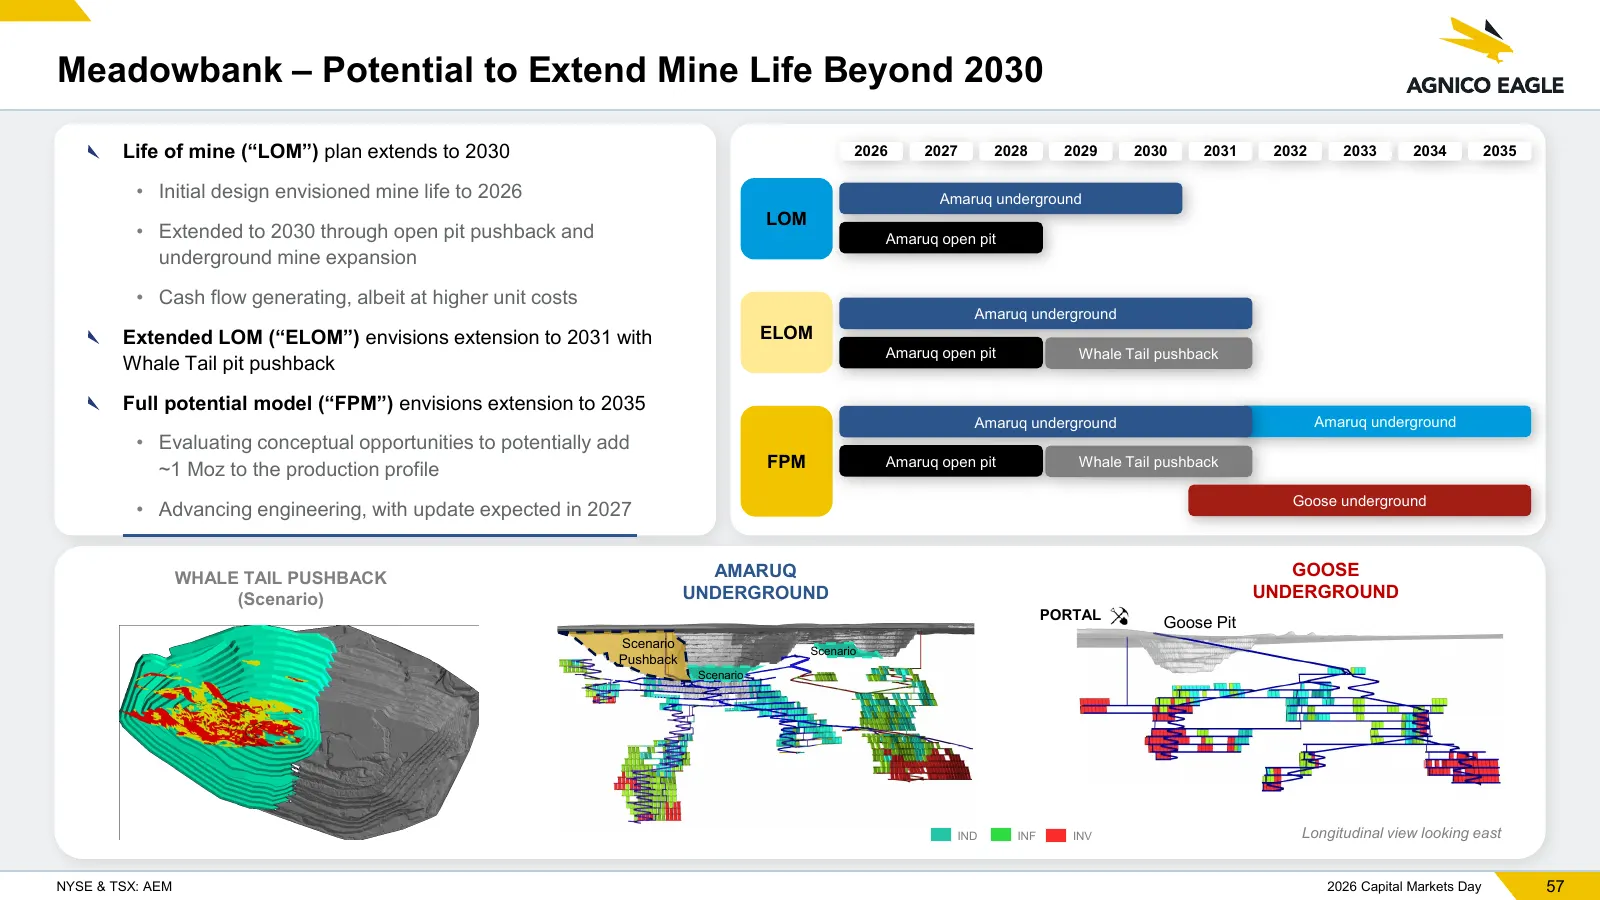
Slide 57: Meadowbank – Potential to Extend Mine Life Beyond 2030
Meadowbank – Potential to Extend Mine Life Beyond 2030 Life of mine (“LOM”) plan extends to 2030 2026 2027 2028 2029 2030 2031 2032 2033 2034 2035 • Initial design envisioned mine life to 2026 Amaruq underground LOM • Extended to 2030 through open pit pushback and Amaruq open pit underground mine ex
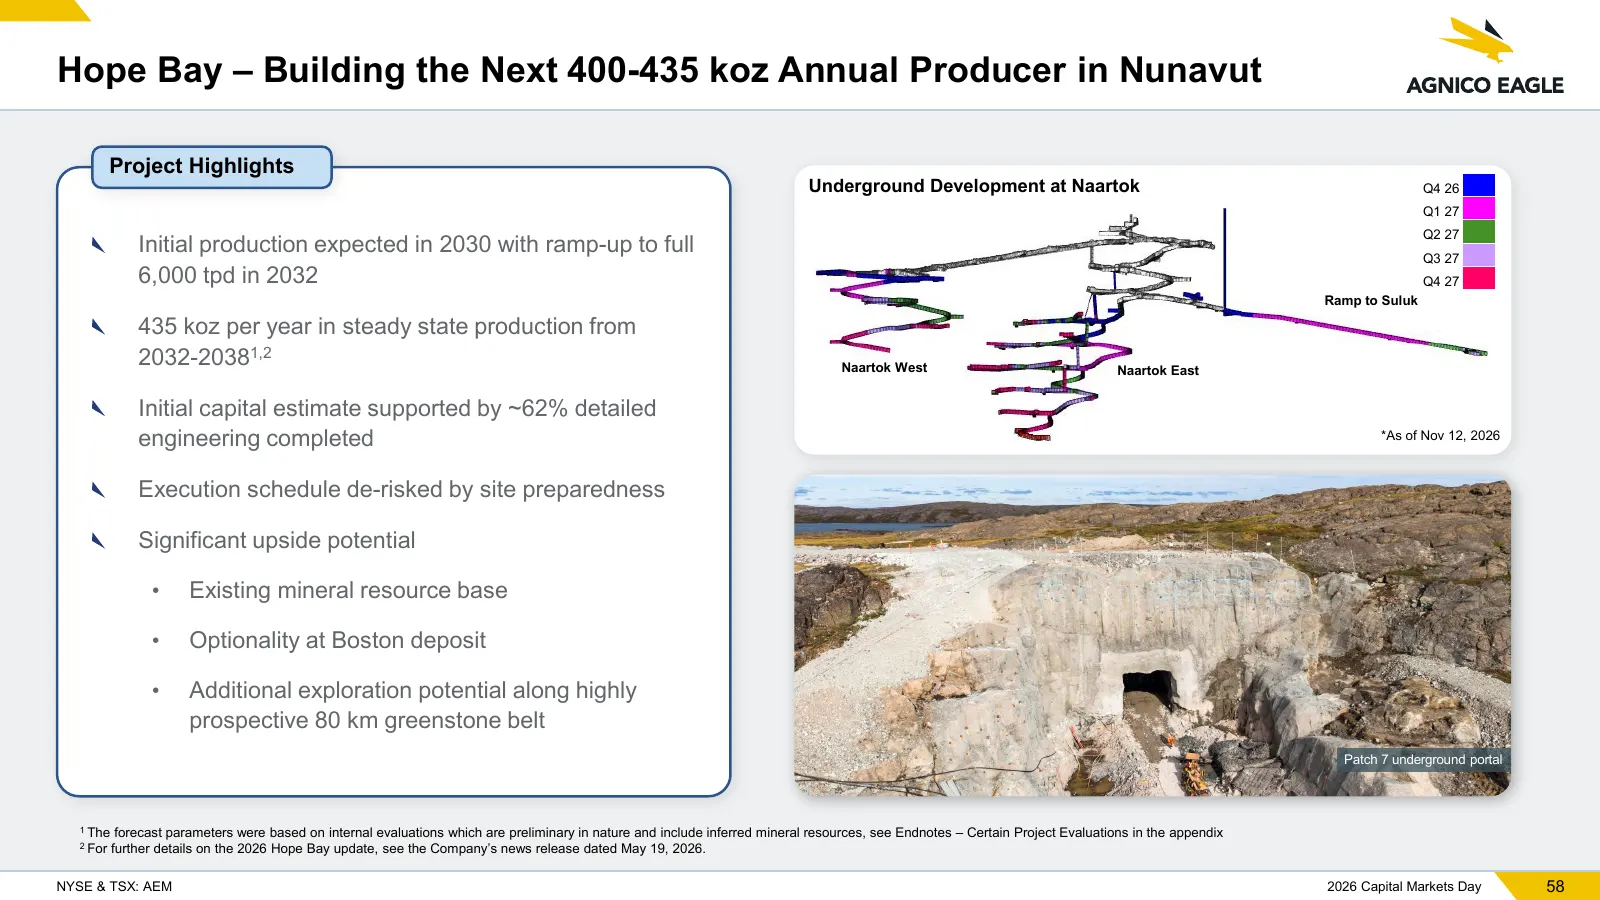
Slide 58: Hope Bay – Building the Next 400-435 koz Annual Producer
Hope Bay – Building the Next 400-435 koz Annual Producer in Nunavut Project Highlights Underground Development at Naartok Q4 26 Q1 27 Q2 27 Initial production expected in 2030 with ramp-up to full Q3 27 6,000 tpd in 2032 Q4 27 Ramp to Suluk 435 koz per year in steady state production from 2032-20381
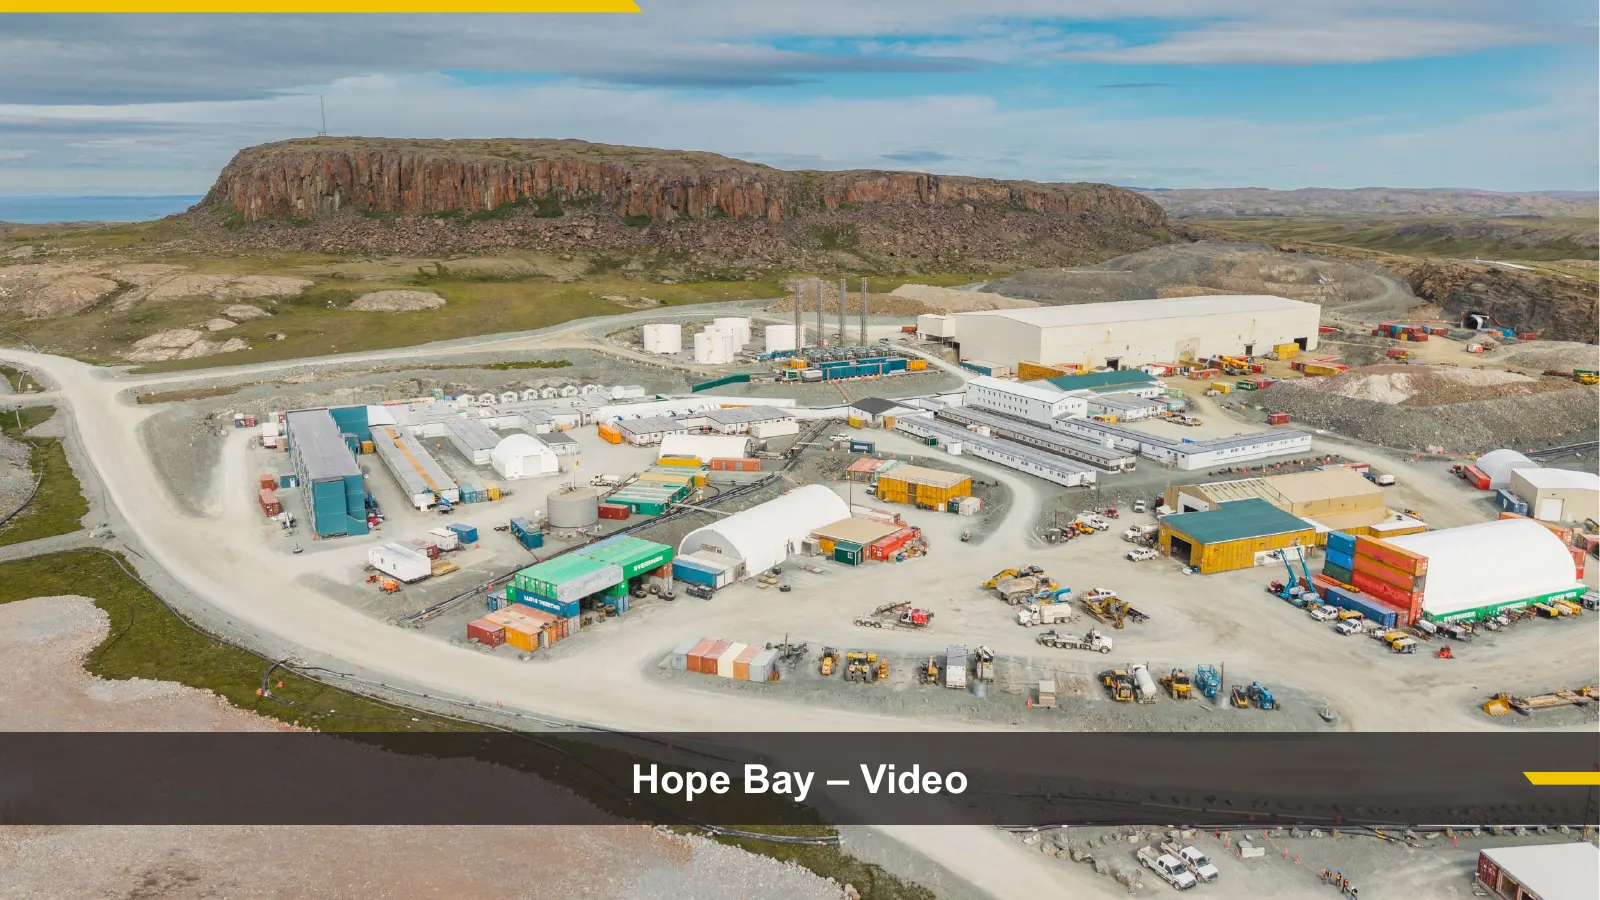
Slide 59: Hope Bay – Video
Hope Bay – Video
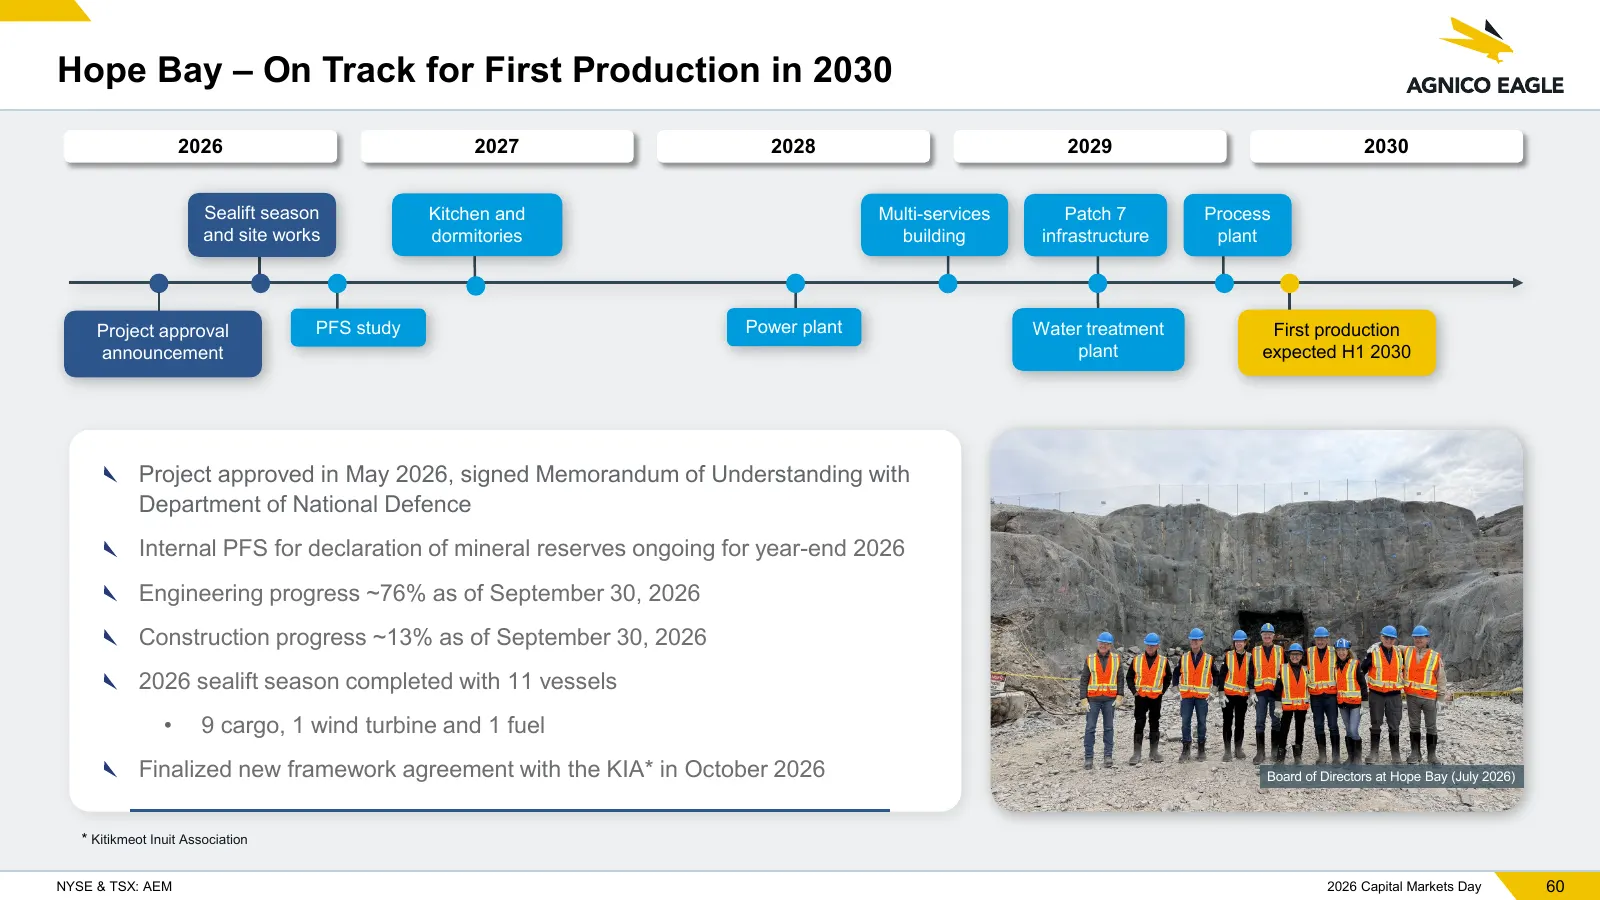
Slide 60: Hope Bay – On Track for First Production in 2030
Hope Bay – On Track for First Production in 2030 2026 2027 2028 2029 2030 Sealift season Kitchen and Multi-services Patch 7 Process and site works dormitories building infrastructure plant Project approval PFS study Power plant Water treatment First production announcement plant expected H1 2030 Pro
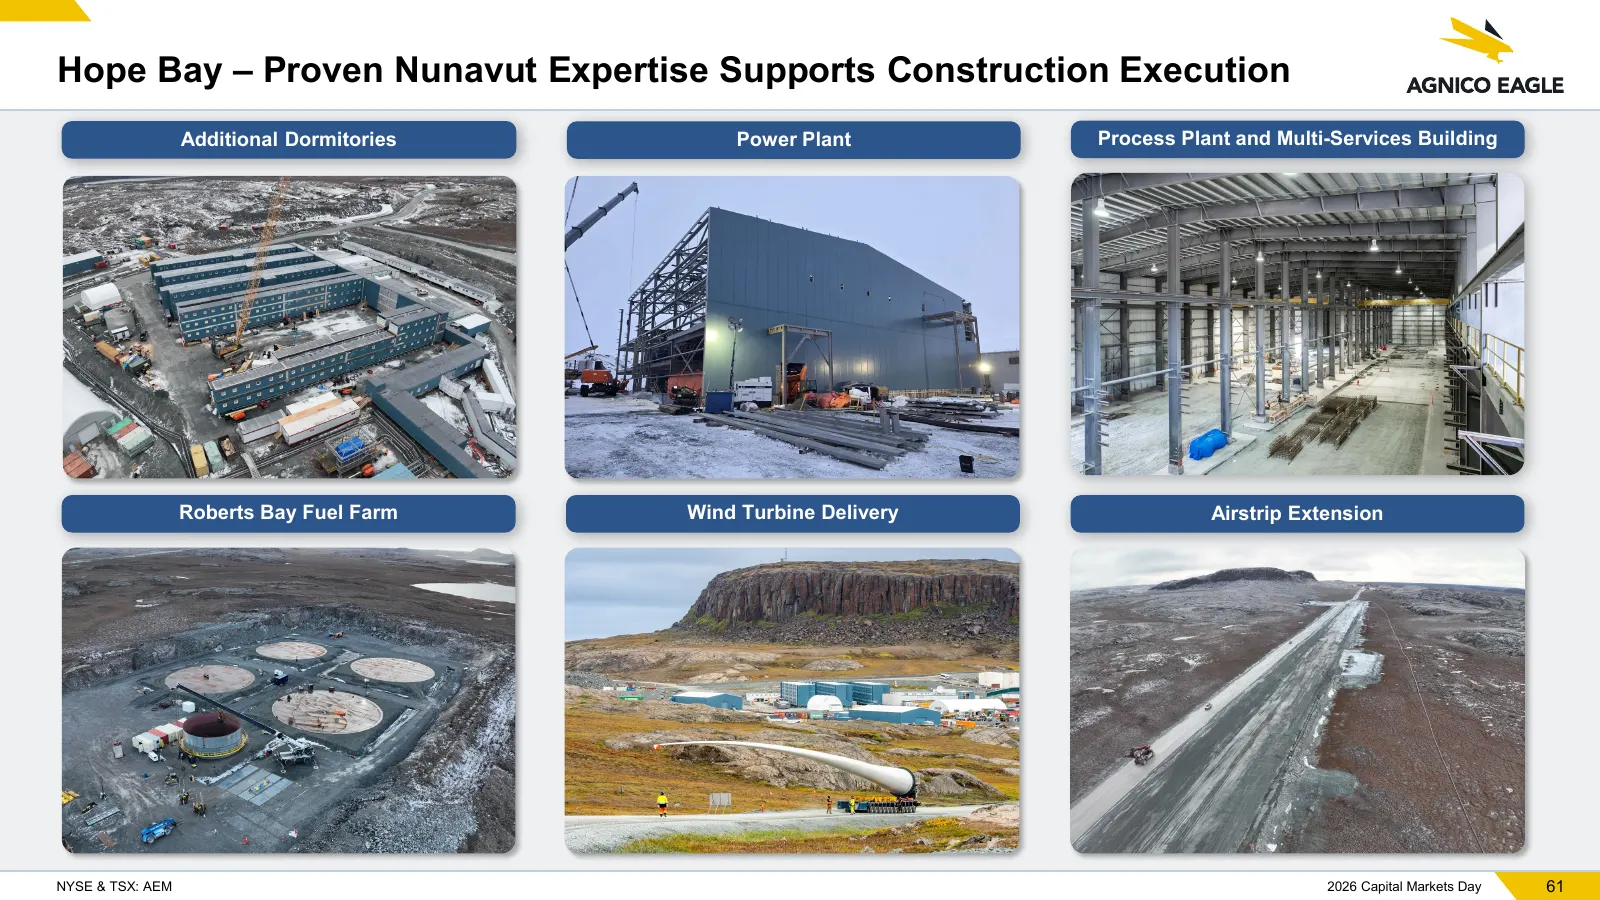
Slide 61: Hope Bay – Proven Nunavut Expertise Supports Construction Execution
Hope Bay – Proven Nunavut Expertise Supports Construction Execution Additional Dormitories Power Plant Process Plant and Multi-Services Building Roberts Bay Fuel Farm Wind Turbine Delivery Airstrip Extension NYSE & TSX: AEM 2026 Capital Markets Day 61
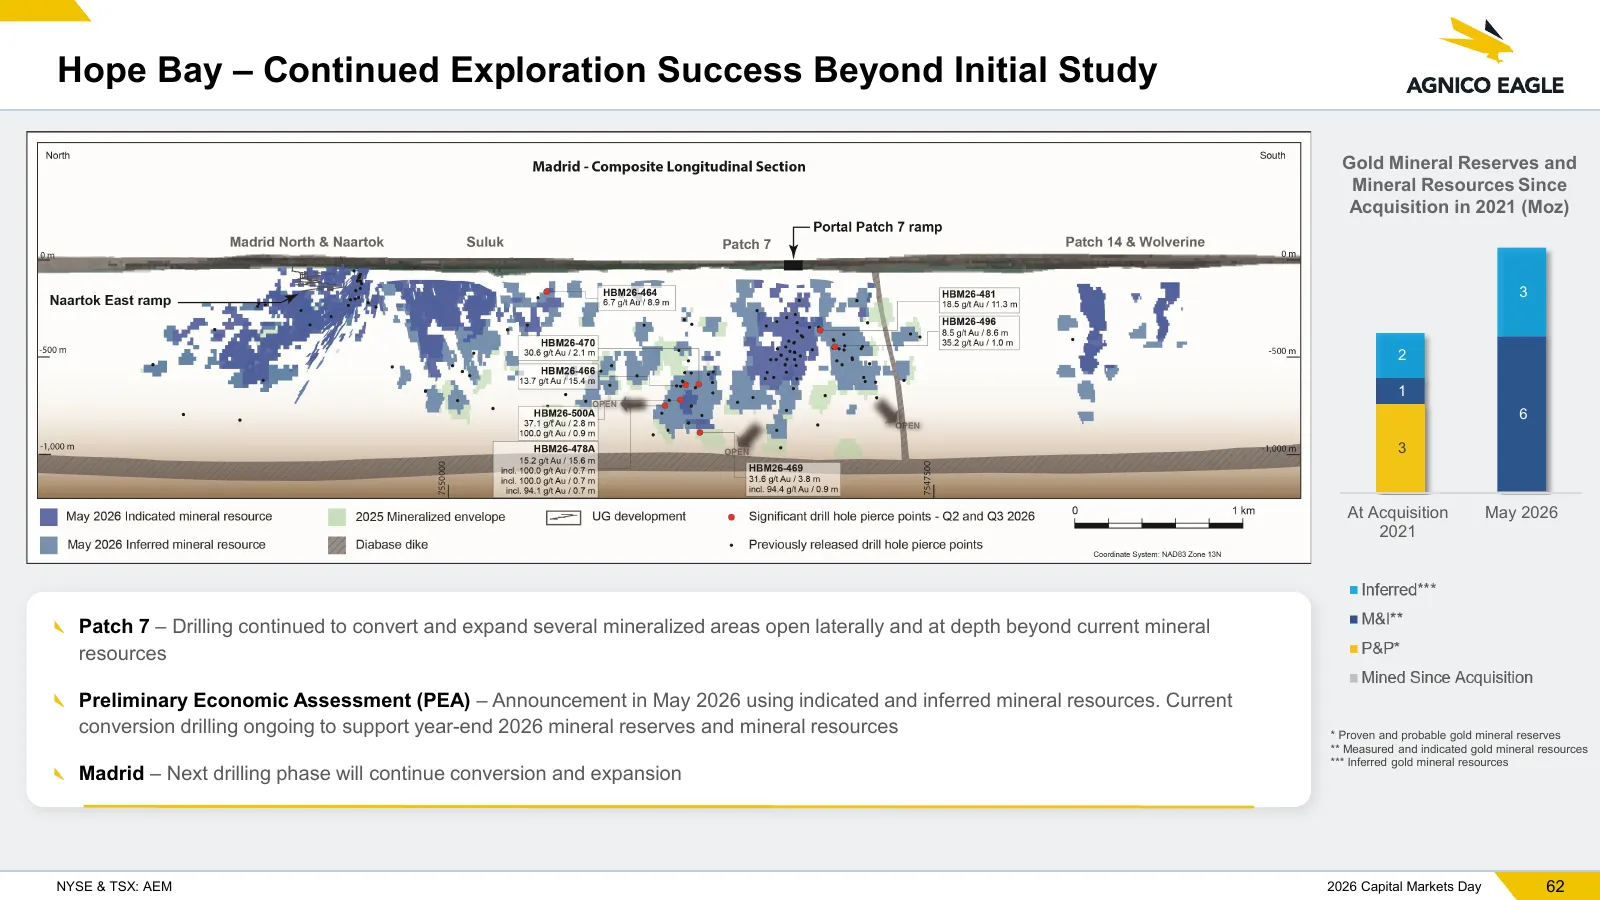
Slide 62: Hope Bay – Continued Exploration Success
Hope Bay – Continued Exploration Success Beyond Initial Study Gold Mineral Reserves and Mineral Resources Since Acquisition in 2021 (Moz) 3 2 1 6 3 At Acquisition May 2026 2021 Patch 7 – Drilling continued to convert and expand several mineralized areas open laterally and at depth beyond current min
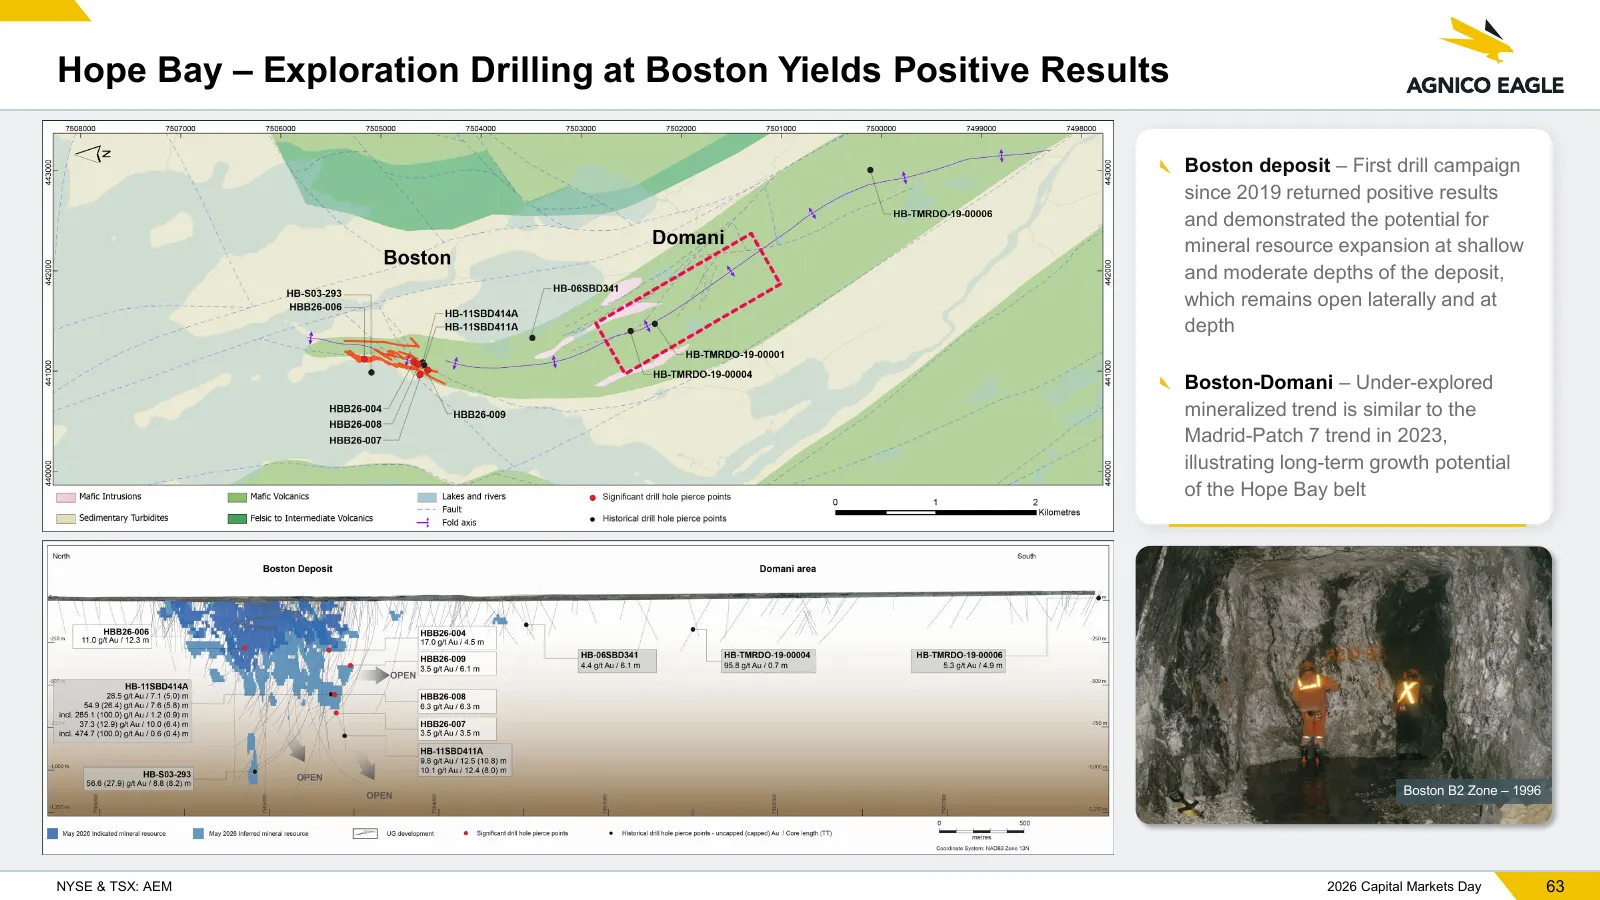
Slide 63: Hope Bay – Exploration Drilling at Boston
Hope Bay – Exploration Drilling at Boston Yields Positive Results Boston deposit – First drill campaign since 2019 returned positive results and demonstrated the potential for mineral resource expansion at shallow and moderate depths of the deposit, which remains open laterally and at depth Boston-D
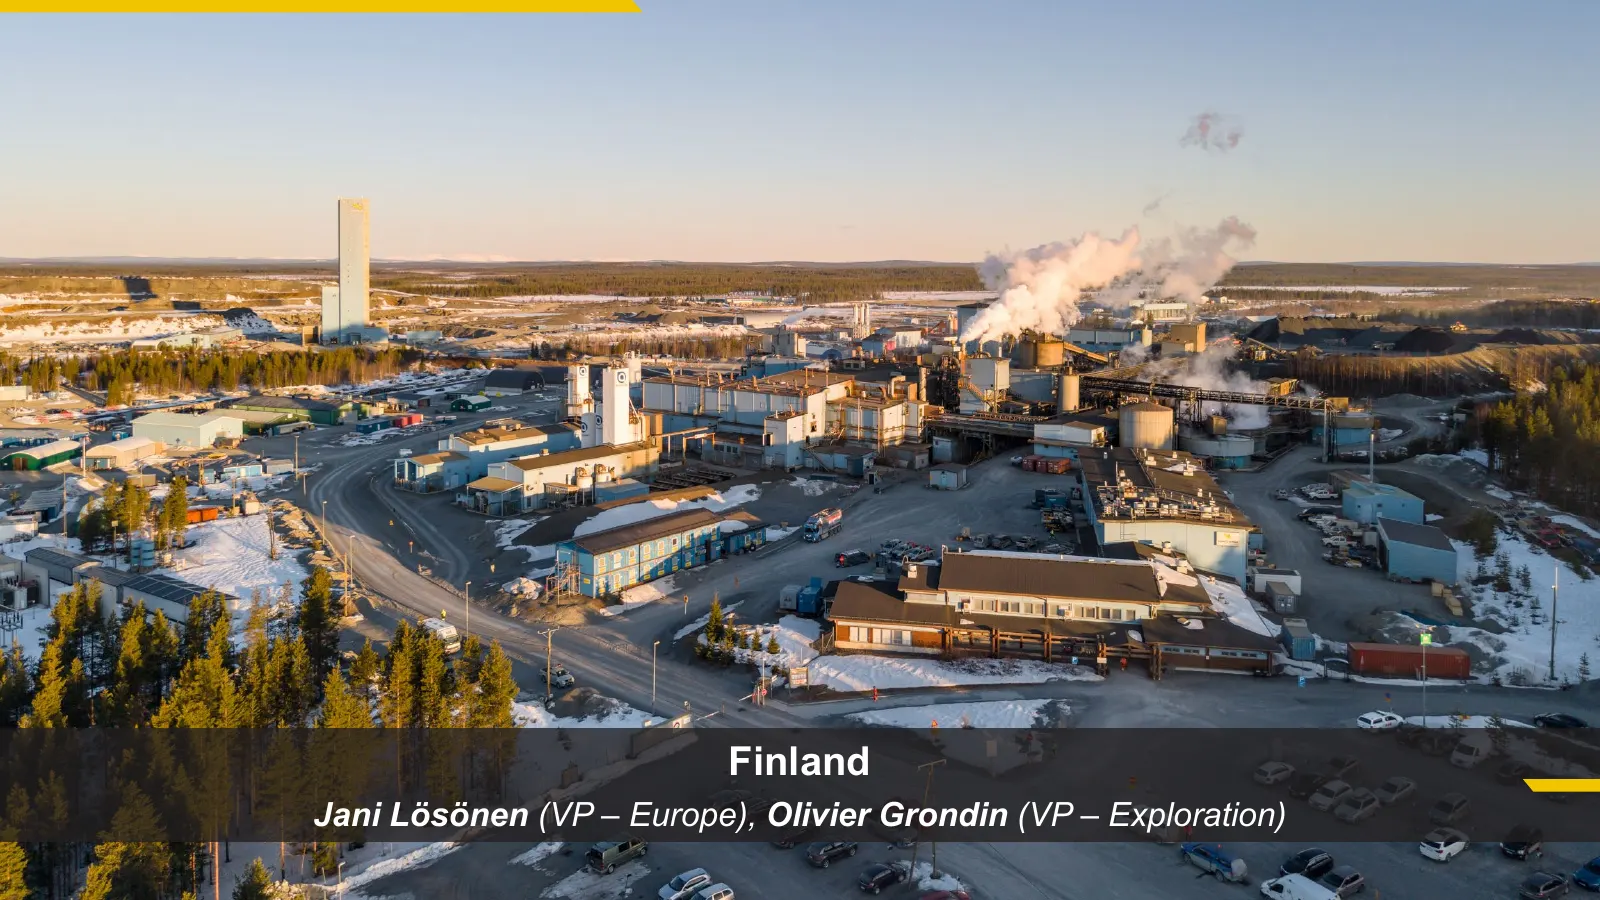
Slide 64: Finland
Finland Jani Lösönen (VP – Europe), Olivier Grondin (VP – Exploration)
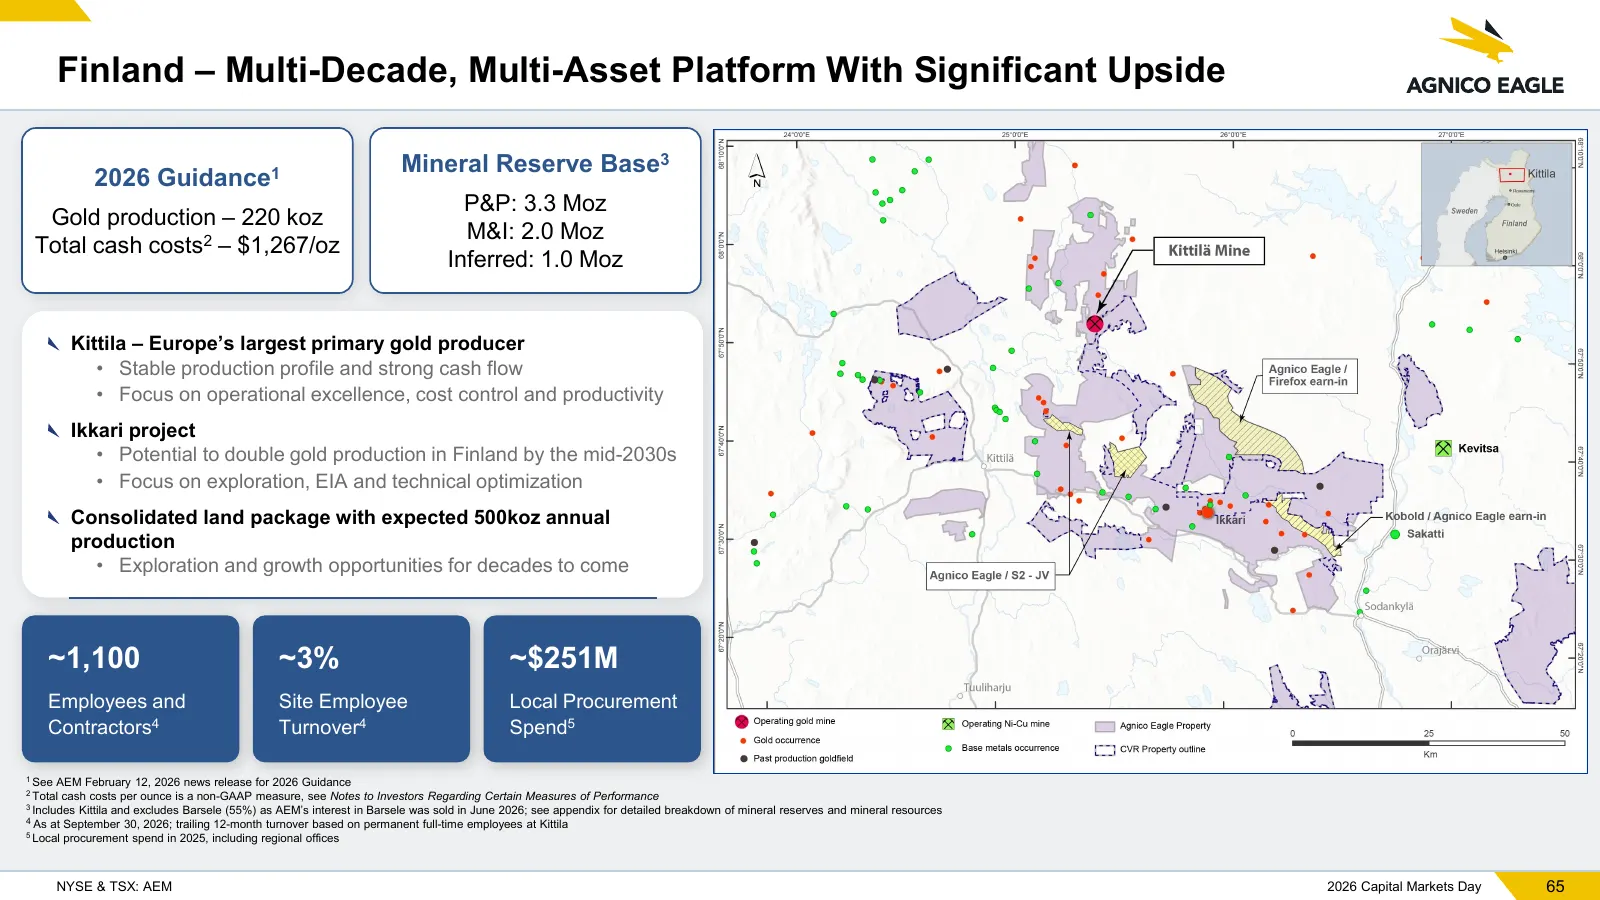
Slide 65: Finland – Multi-Decade, Multi-Asset Platform
Finland – Multi-Decade, Multi-Asset Platform With Significant Upside Mineral Reserve Base3 2026 Guidance1 P&P: 3.3 Moz Gold production – 220 koz M&I: 2.0 Moz Total cash costs2 – $1,267/oz Inferred: 1.0 Moz Kittila – Europe’s largest primary gold producer • Stable production profile and strong cash f
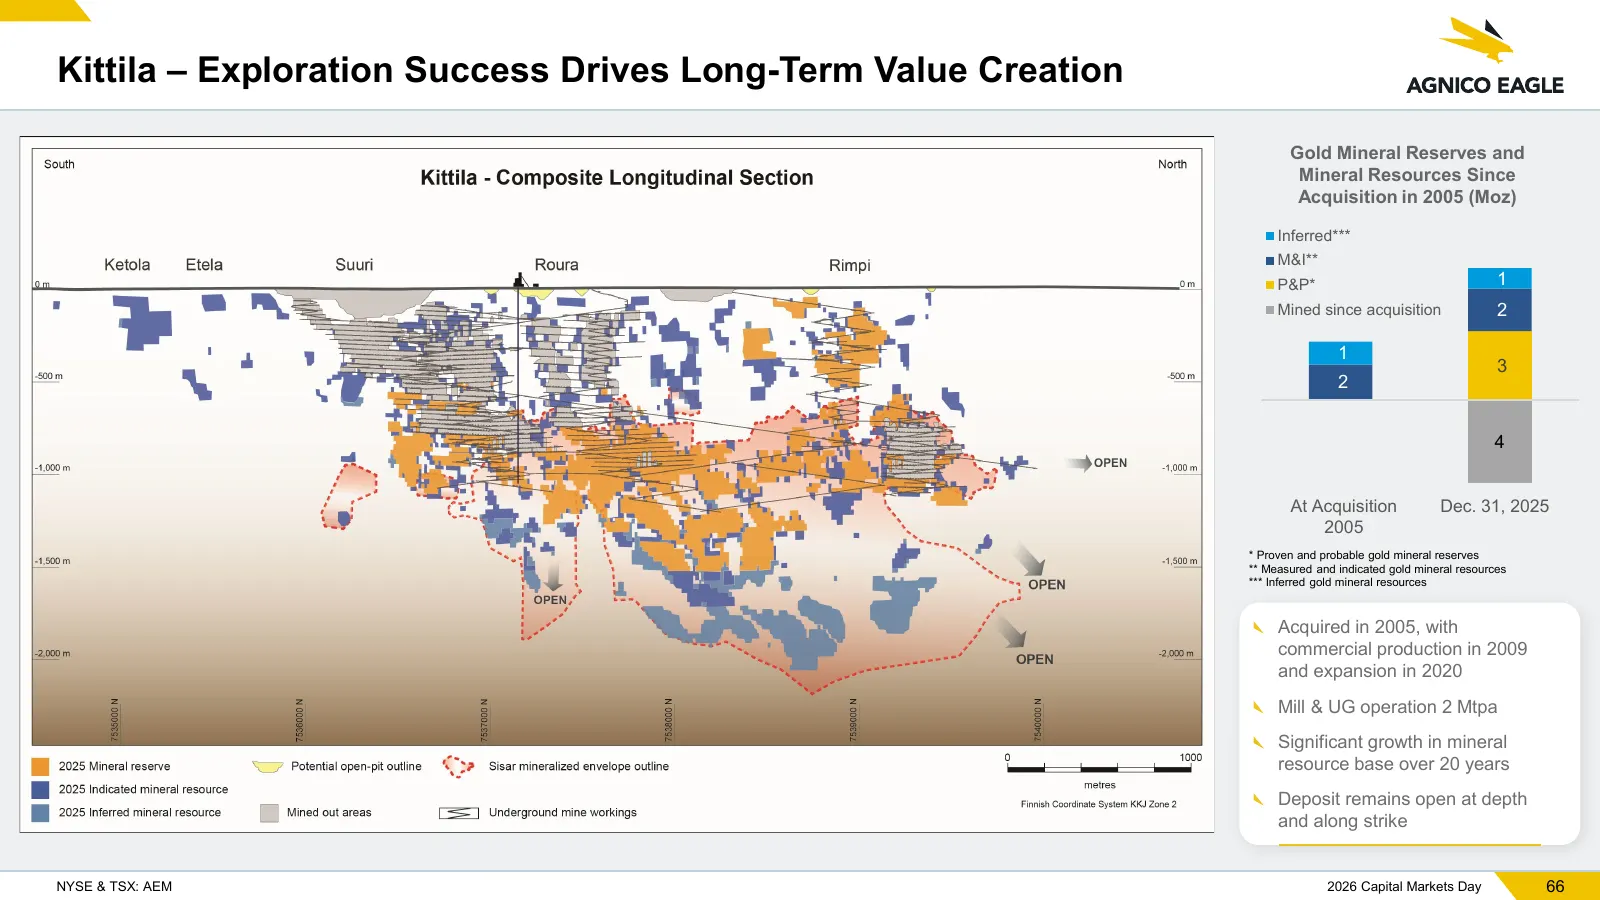
Slide 66: Kittila – Exploration Success Drives Long-Term Value
Kittila – Exploration Success Drives Long-Term Value Creation Gold Mineral Reserves and Mineral Resources Since Acquisition in 2005 (Moz) Inferred*** M&I** P&P* 1 Mined since acquisition 2 1 3 2 4 At Acquisition Dec. 31, 2025 2005 * Proven and probable gold mineral reserves ** Measured and indicated
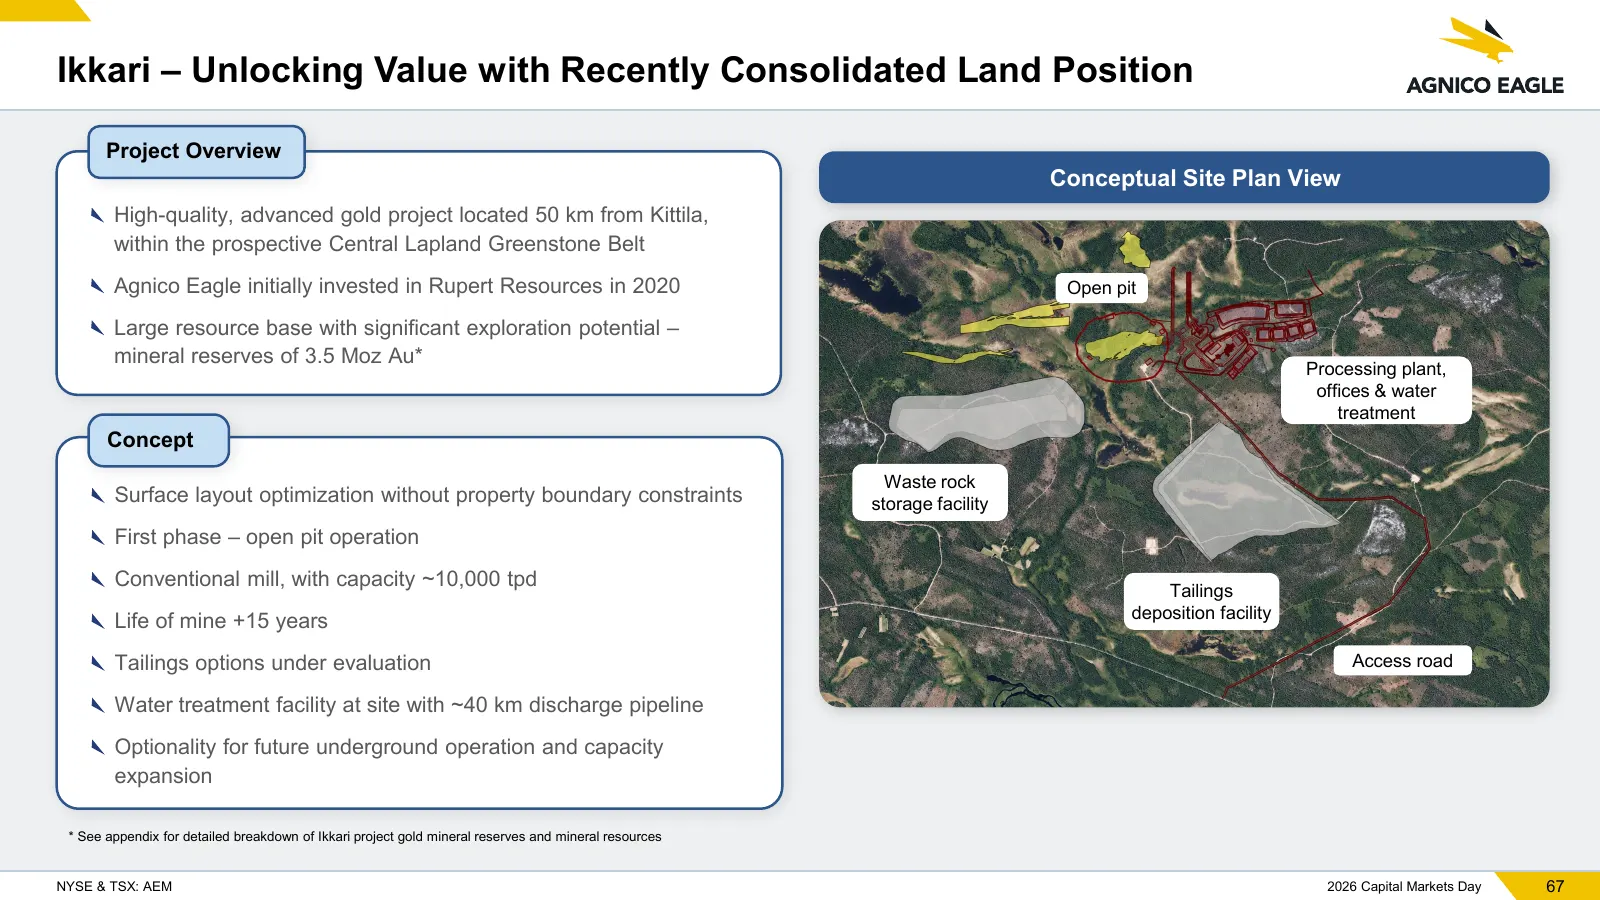
Slide 67: Ikkari – Unlocking Value with Consolidated Land Position
Ikkari – Unlocking Value with Recently Consolidated Land Position Project Overview Conceptual Site Plan View High-quality, advanced gold project located 50 km from Kittila, within the prospective Central Lapland Greenstone Belt Agnico Eagle initially invested in Rupert Resources in 2020 Open pit Lar
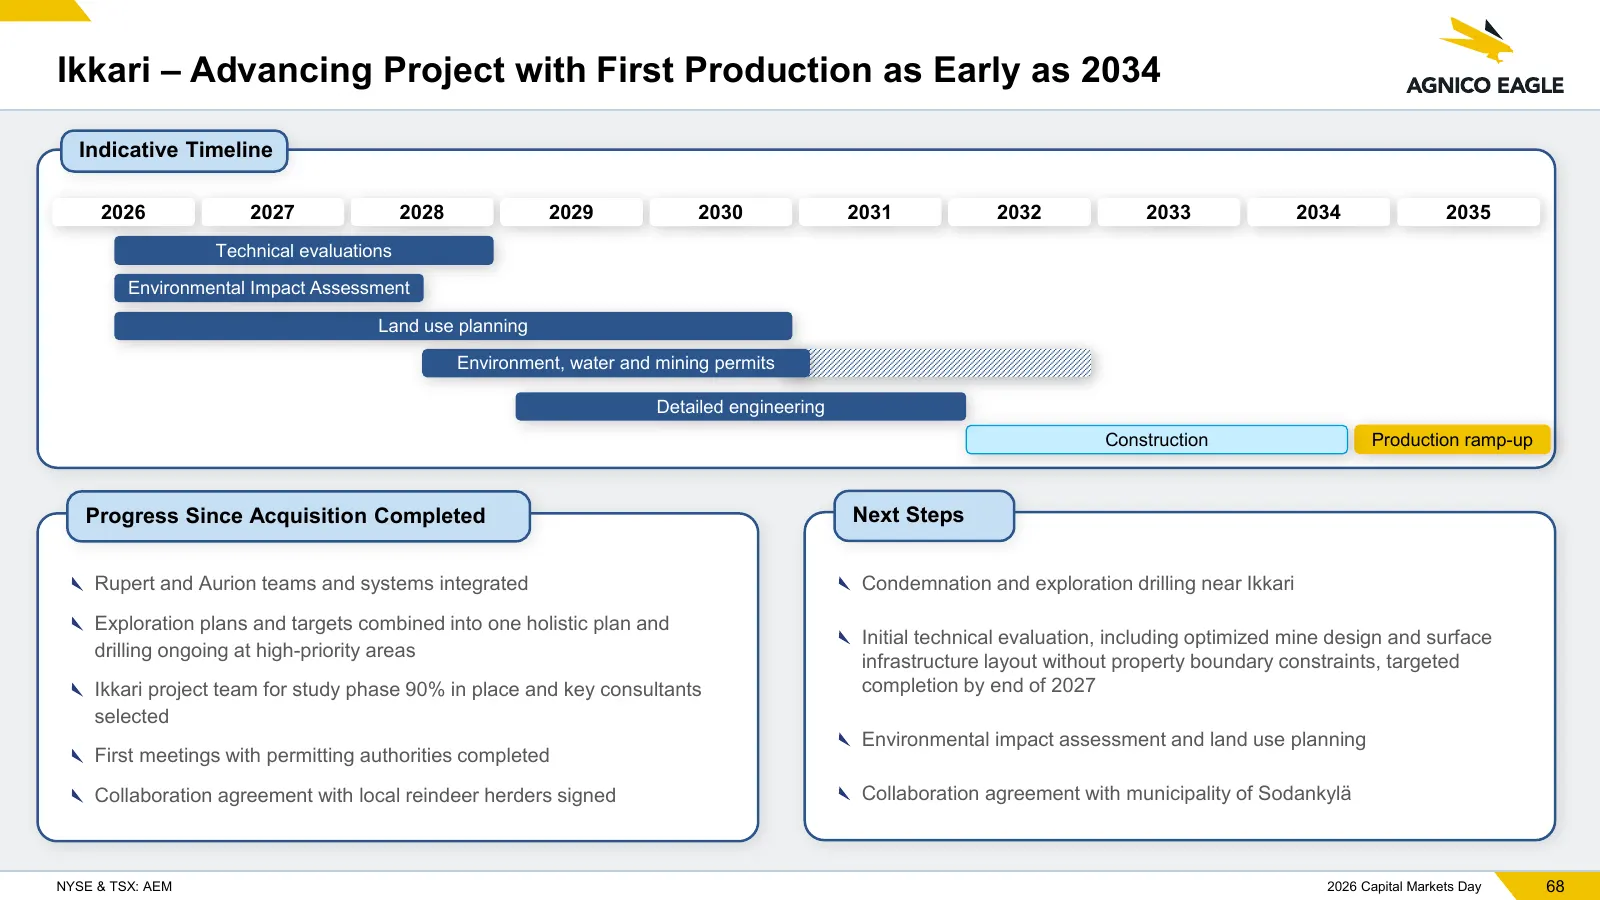
Slide 68: Ikkari – First Production as Early as 2034
Ikkari – Advancing Project with First Production as Early as 2034 Indicative Timeline 2026 2027 2028 2029 2030 2031 2032 2033 2034 2035 Technical evaluations Environmental Impact Assessment Land use planning Environment, water and mining permits Detailed engineering Construction Production ramp-up P
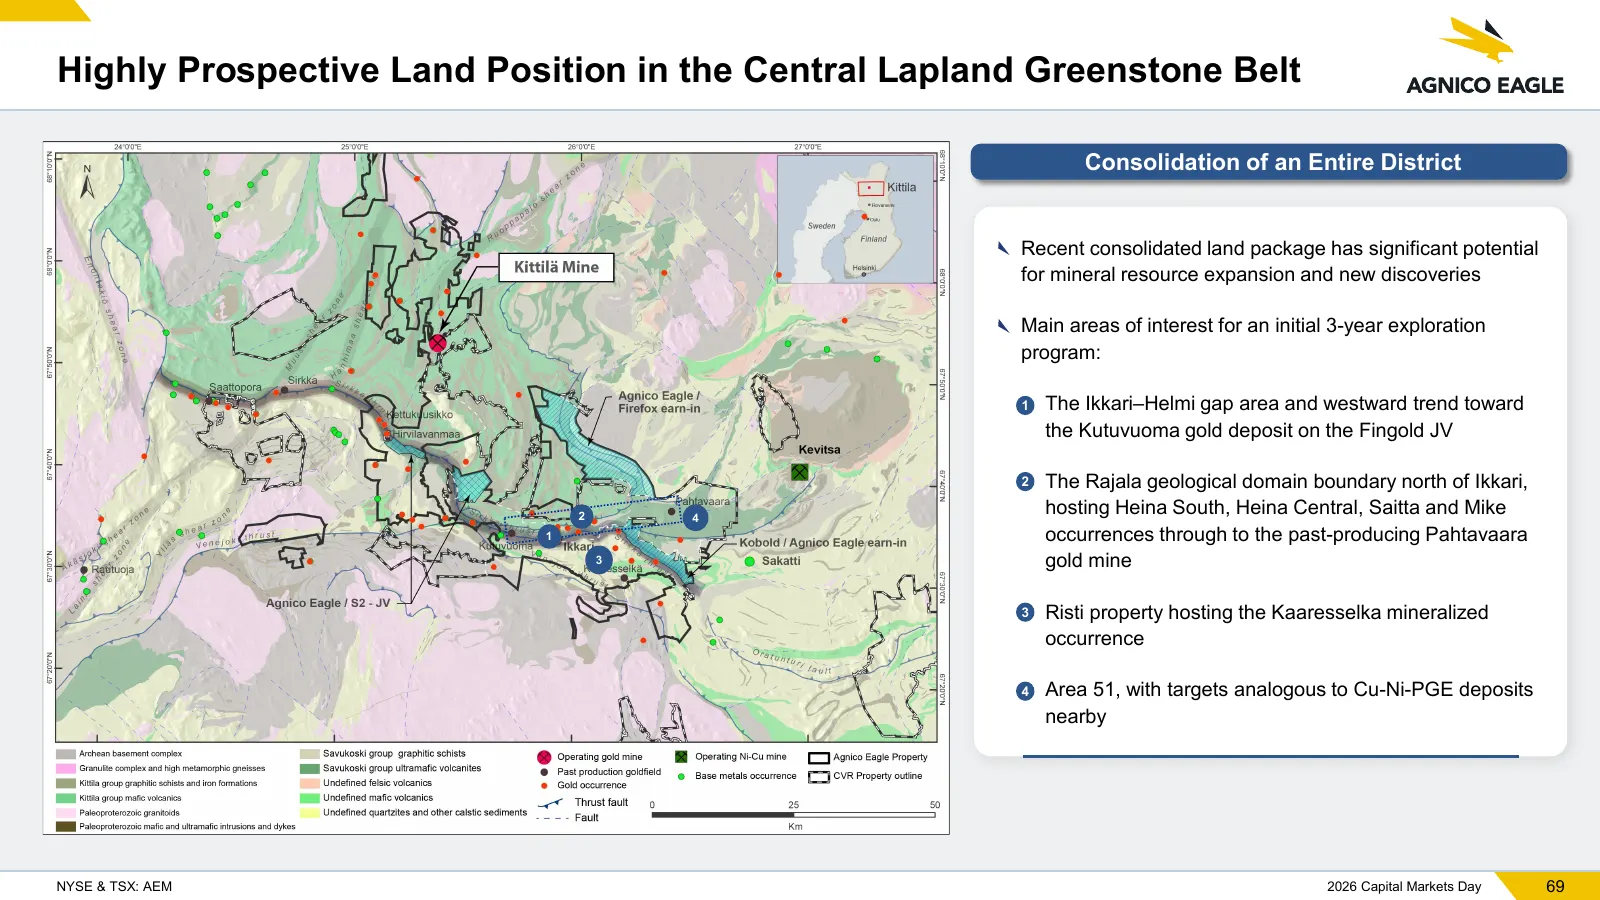
Slide 69: Prospective Land Position in Central Lapland Greenstone Belt
Highly Prospective Land Position in the Central Lapland Greenstone Belt Consolidation of an Entire District Recent consolidated land package has significant potential for mineral resource expansion and new discoveries Main areas of interest for an initial 3-year exploration program: 1 The Ikkari–He
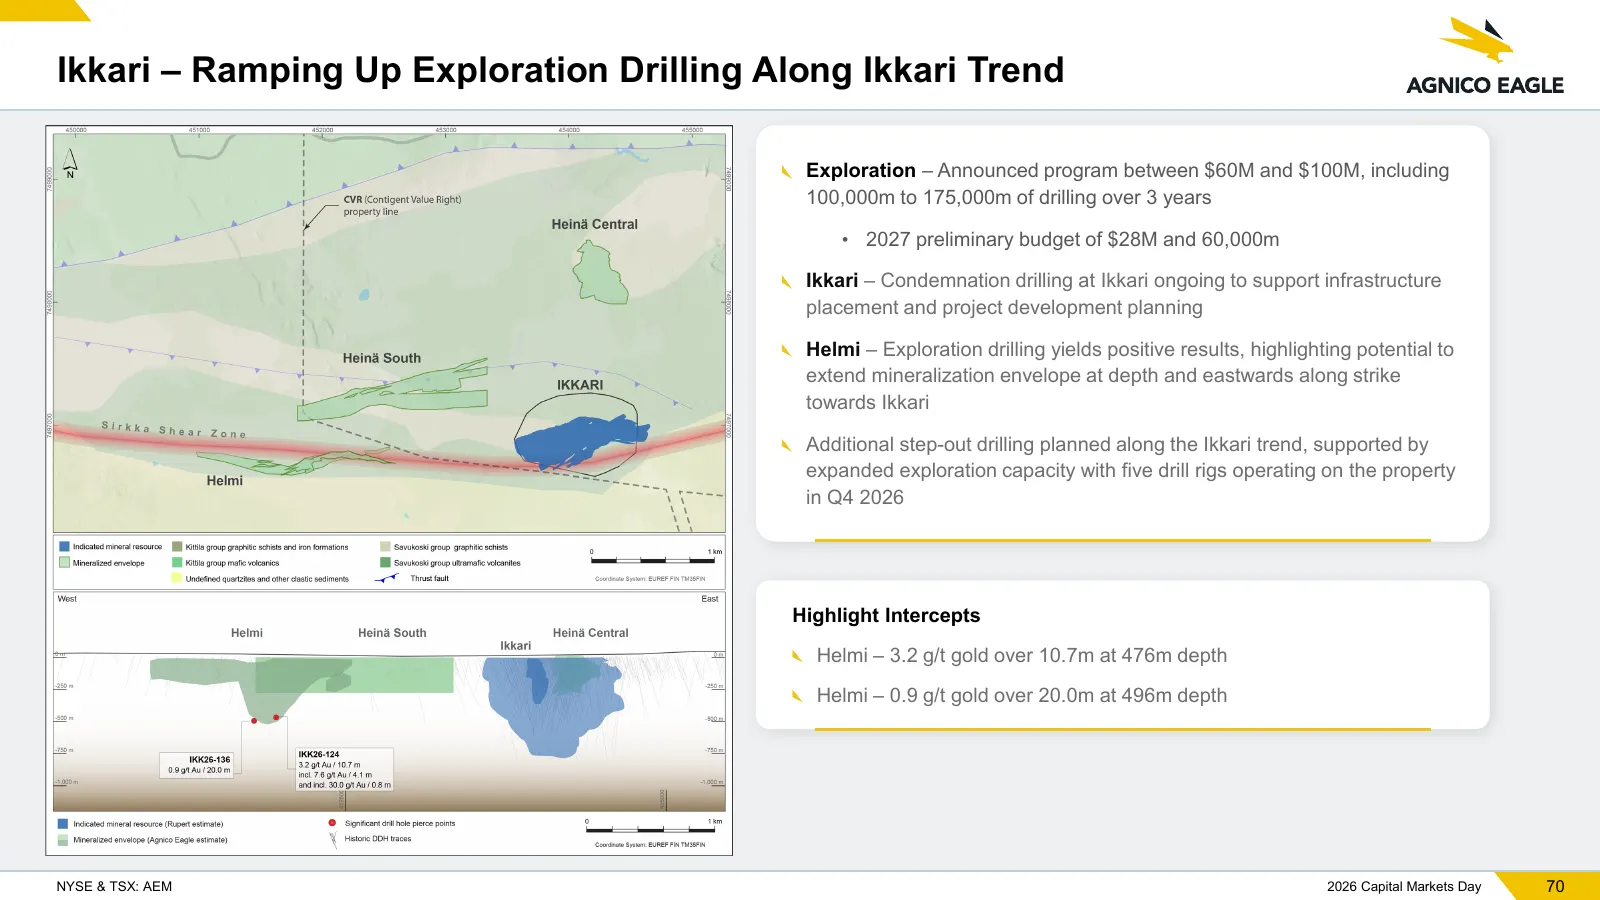
Slide 70: Ikkari – Ramping Up Exploration Drilling
Ikkari – Ramping Up Exploration Drilling Along Ikkari Trend Exploration – Announced program between $60M and $100M, including 100,000m to 175,000m of drilling over 3 years • 2027 preliminary budget of $28M and 60,000m Ikkari – Condemnation drilling at Ikkari ongoing to support infrastructure placeme
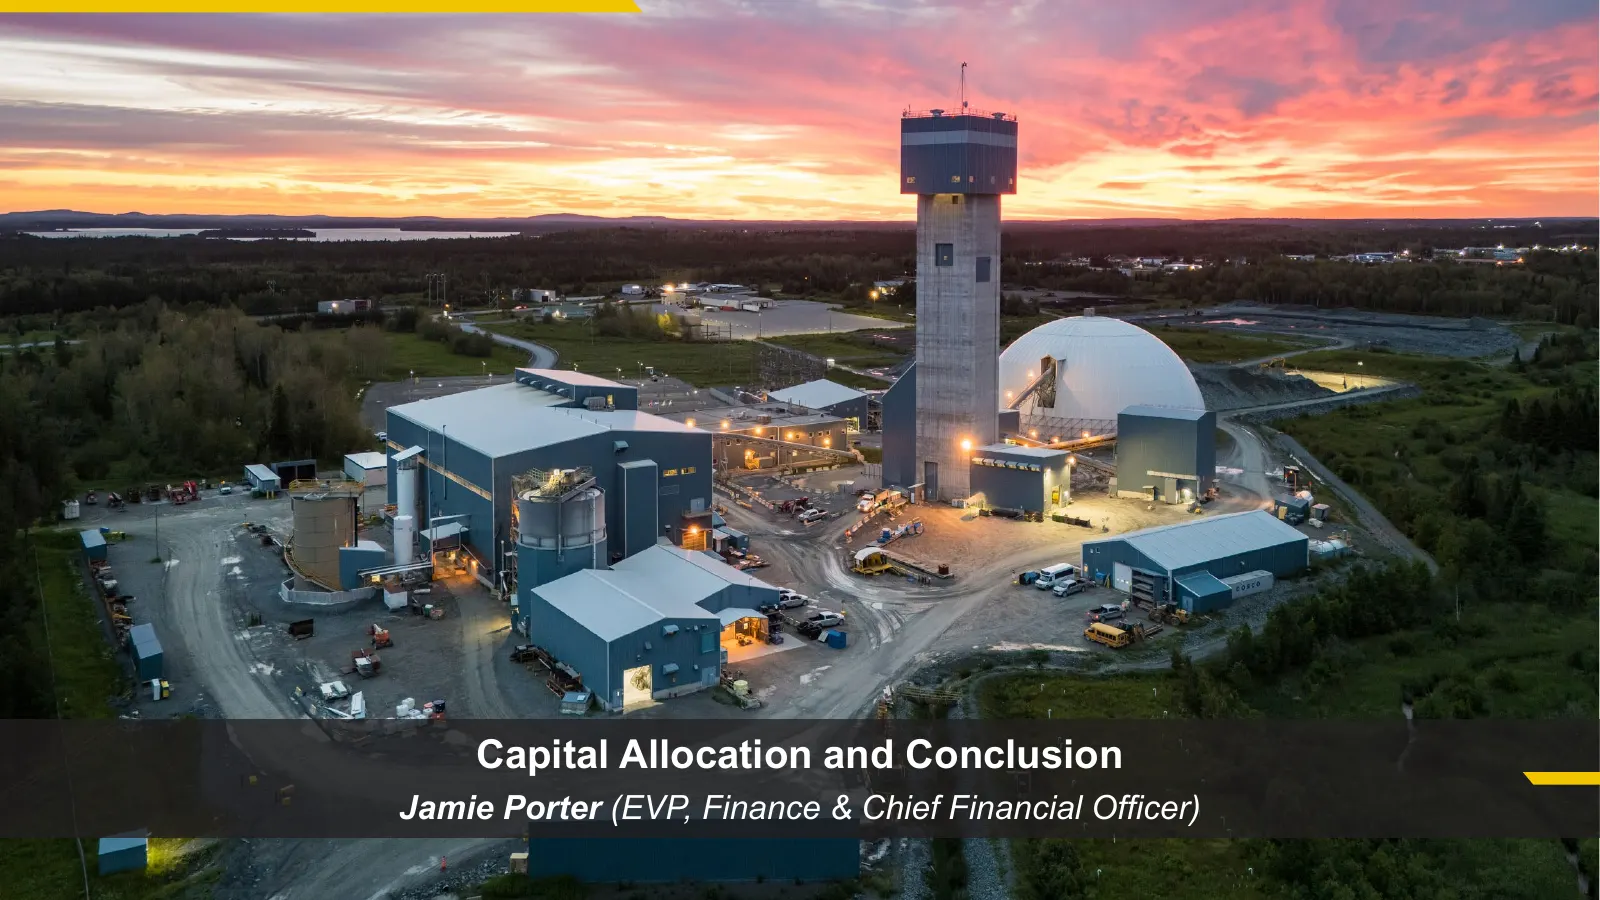
Slide 71: Capital Allocation and Conclusion
NYSE & TSX: AEM Capital Allocation and Conclusion Jamie Porter (EVP, Finance & Chief Financial Officer)
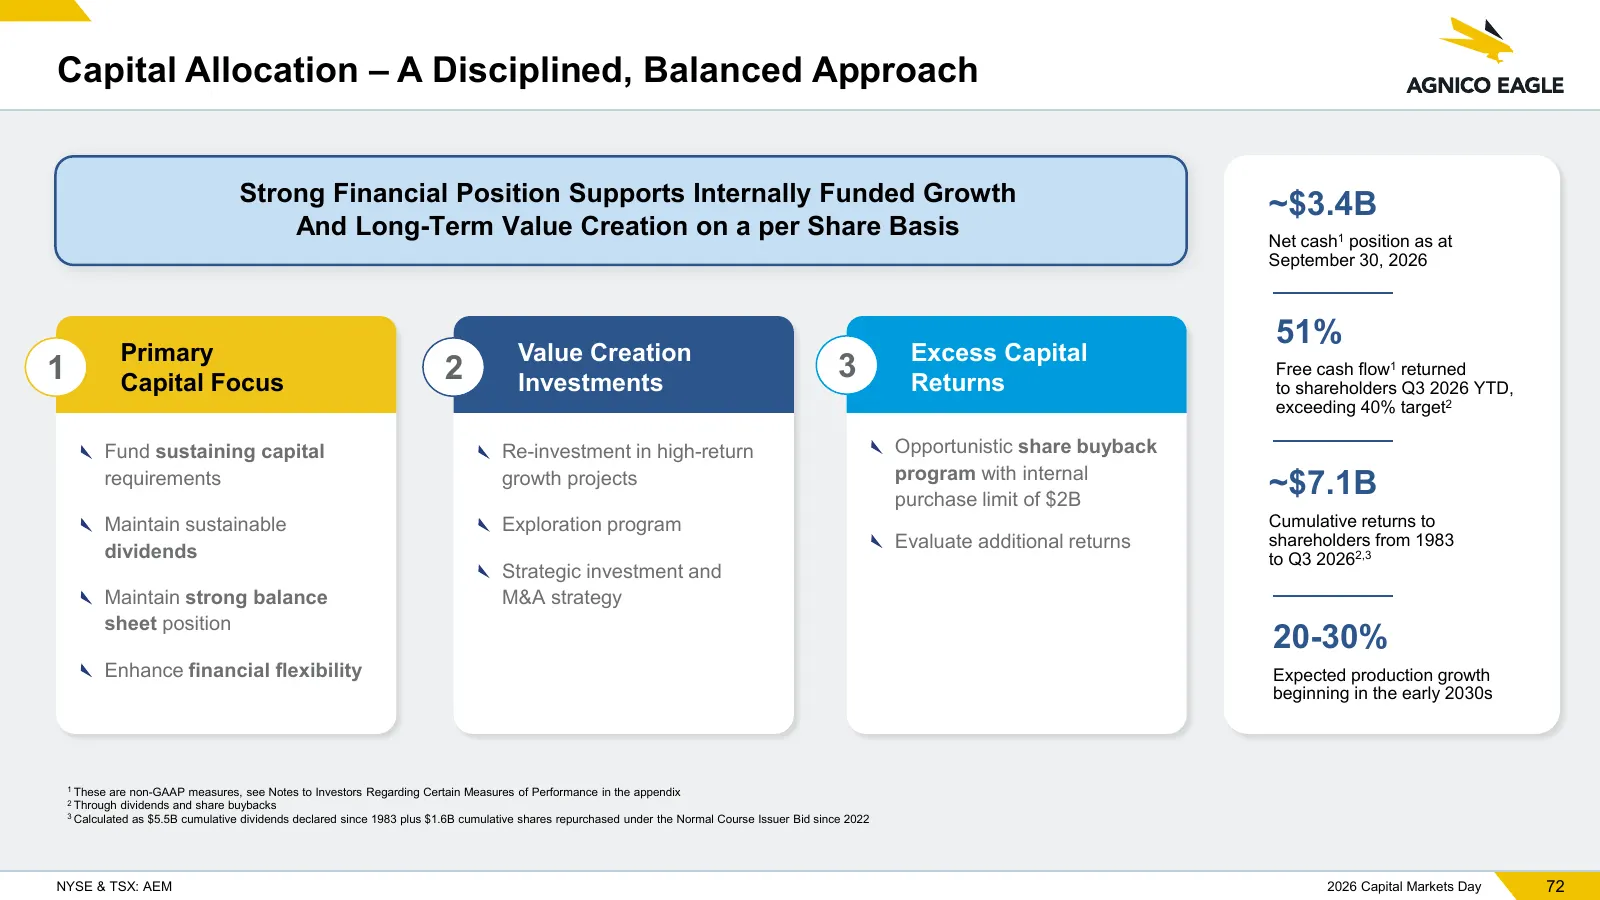
Slide 72: Capital Allocation – A Disciplined, Balanced Approach
Capital Allocation – A Disciplined, Balanced Approach Strong Financial Position Supports Internally Funded Growth ~$3.4B And Long-Term Value Creation on a per Share Basis Net cash1 position as at September 30, 2026 51% Primary Value Creation Excess Capital 1 Capital Focus 2 Investments 3 Returns Fre
Slide 73: High-Quality, Resilient & Positioned for Sustainable Growth
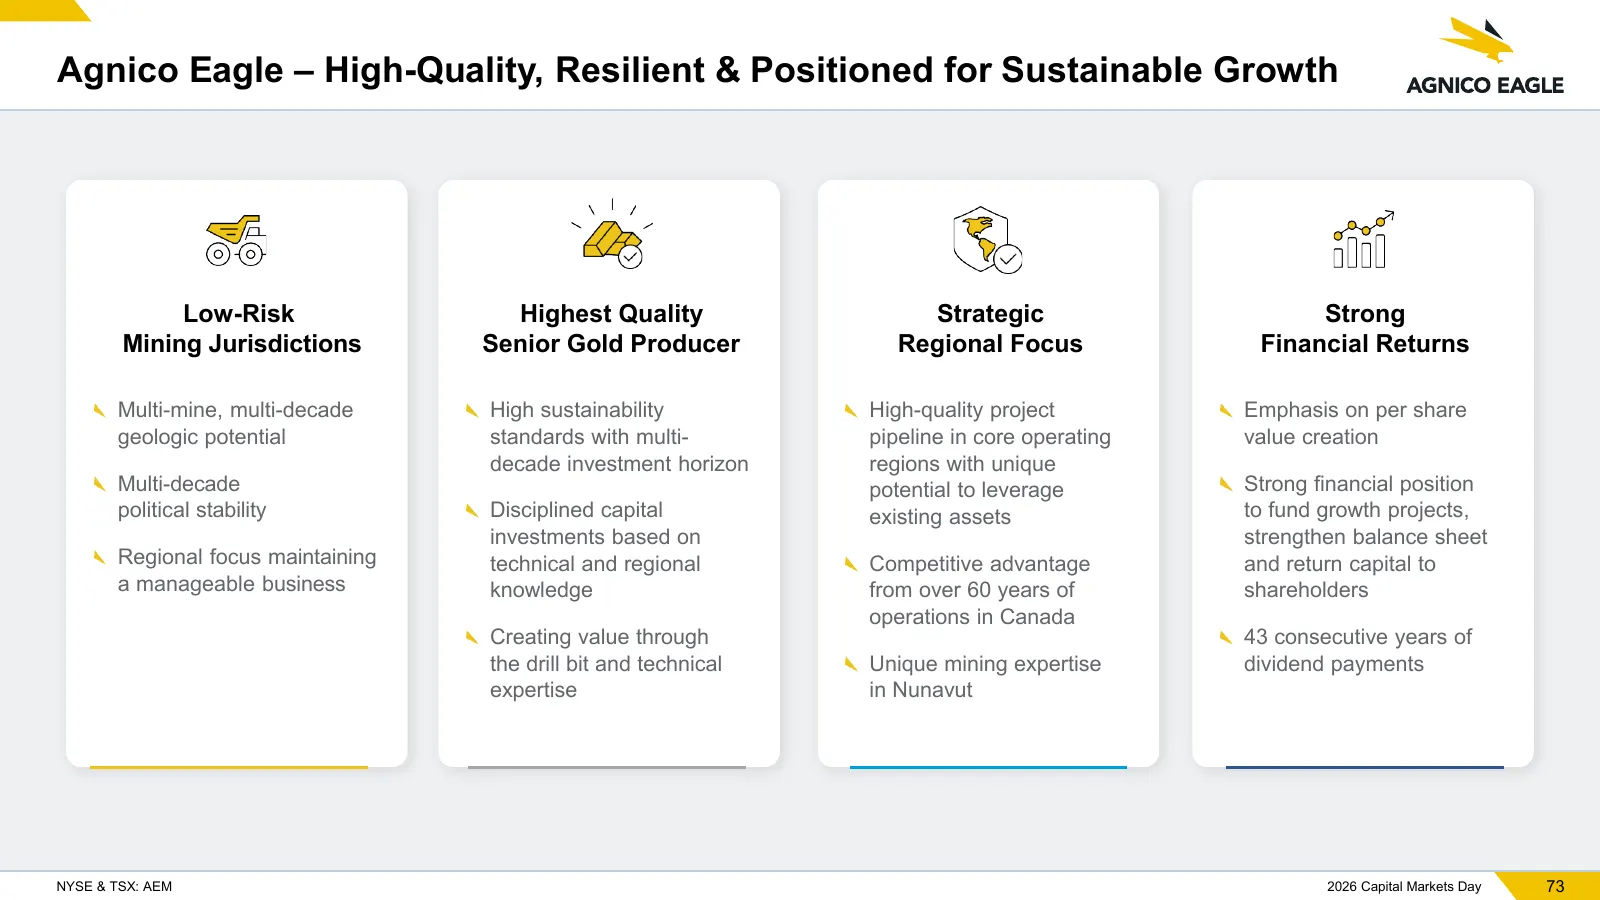
Agnico Eagle – High-Quality, Resilient & Positioned for Sustainable Growth Low-Risk Highest Quality Strategic Strong Mining Jurisdictions Senior Gold Producer Regional Focus Financial Returns Multi-mine, multi-decade High sustainability High-quality project Emphasis on per share geologic potential s
Slide 74: Appendix
NYSE & TSX: AEM Appendix
Slide 75: A Team with a Strong Track Record
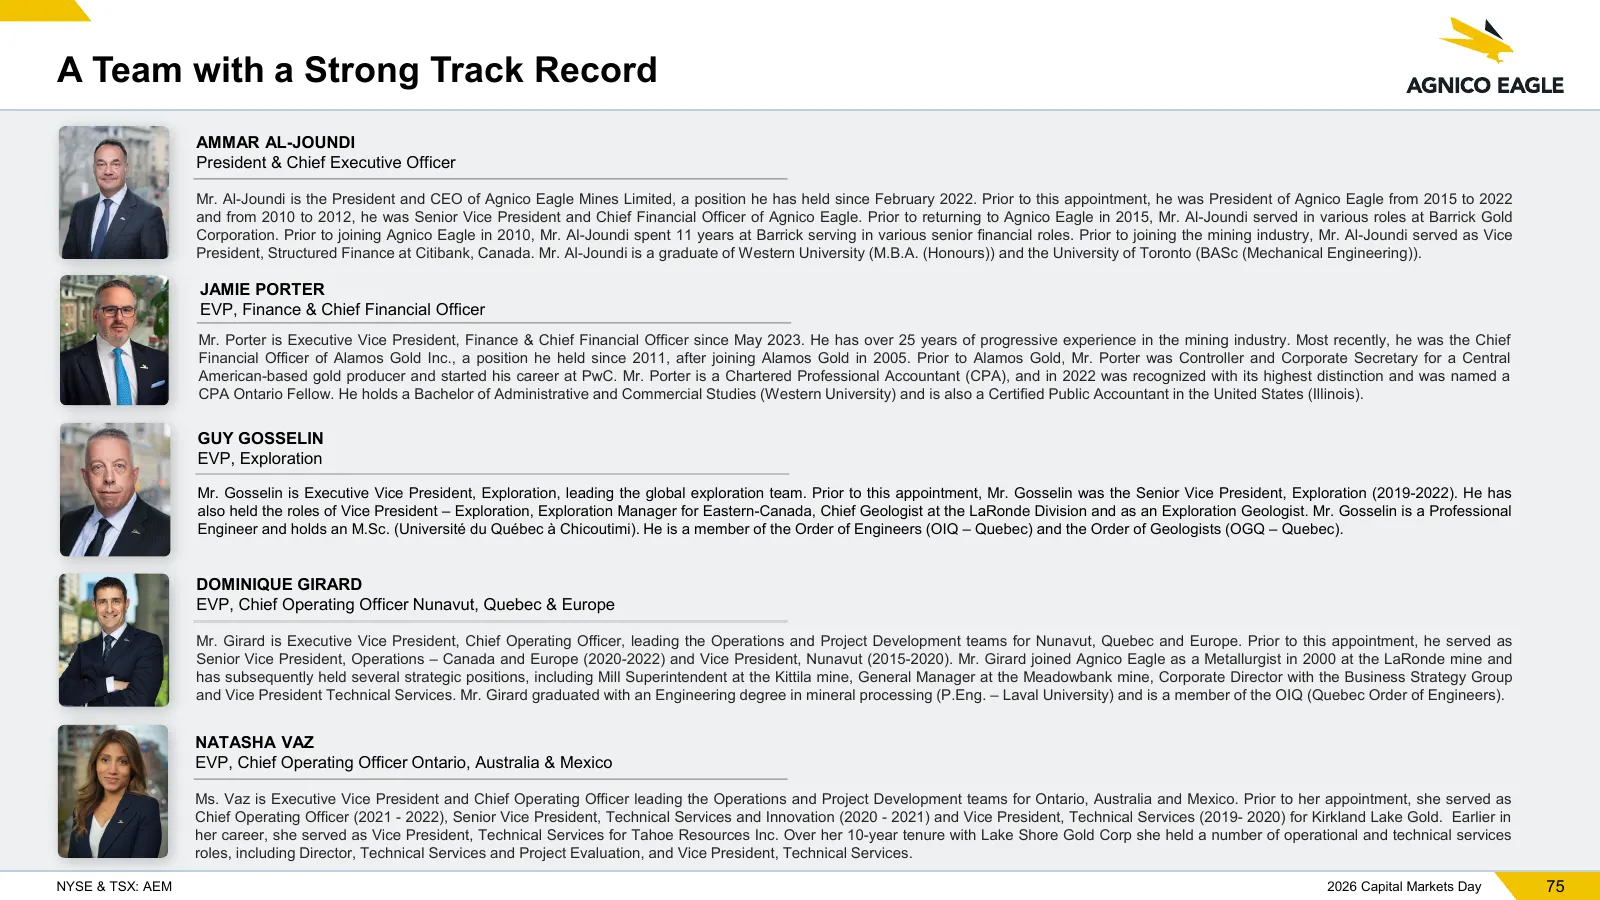
A Team with a Strong Track Record AMMAR AL-JOUNDI President & Chief Executive Officer Mr. Al-Joundi is the President and CEO of Agnico Eagle Mines Limited, a position he has held since February 2022. Prior to this appointment, he was President of Agnico Eagle from 2015 to 2022 and from 2010 to 2012,
Slide 76: A Team with a Strong Track Record
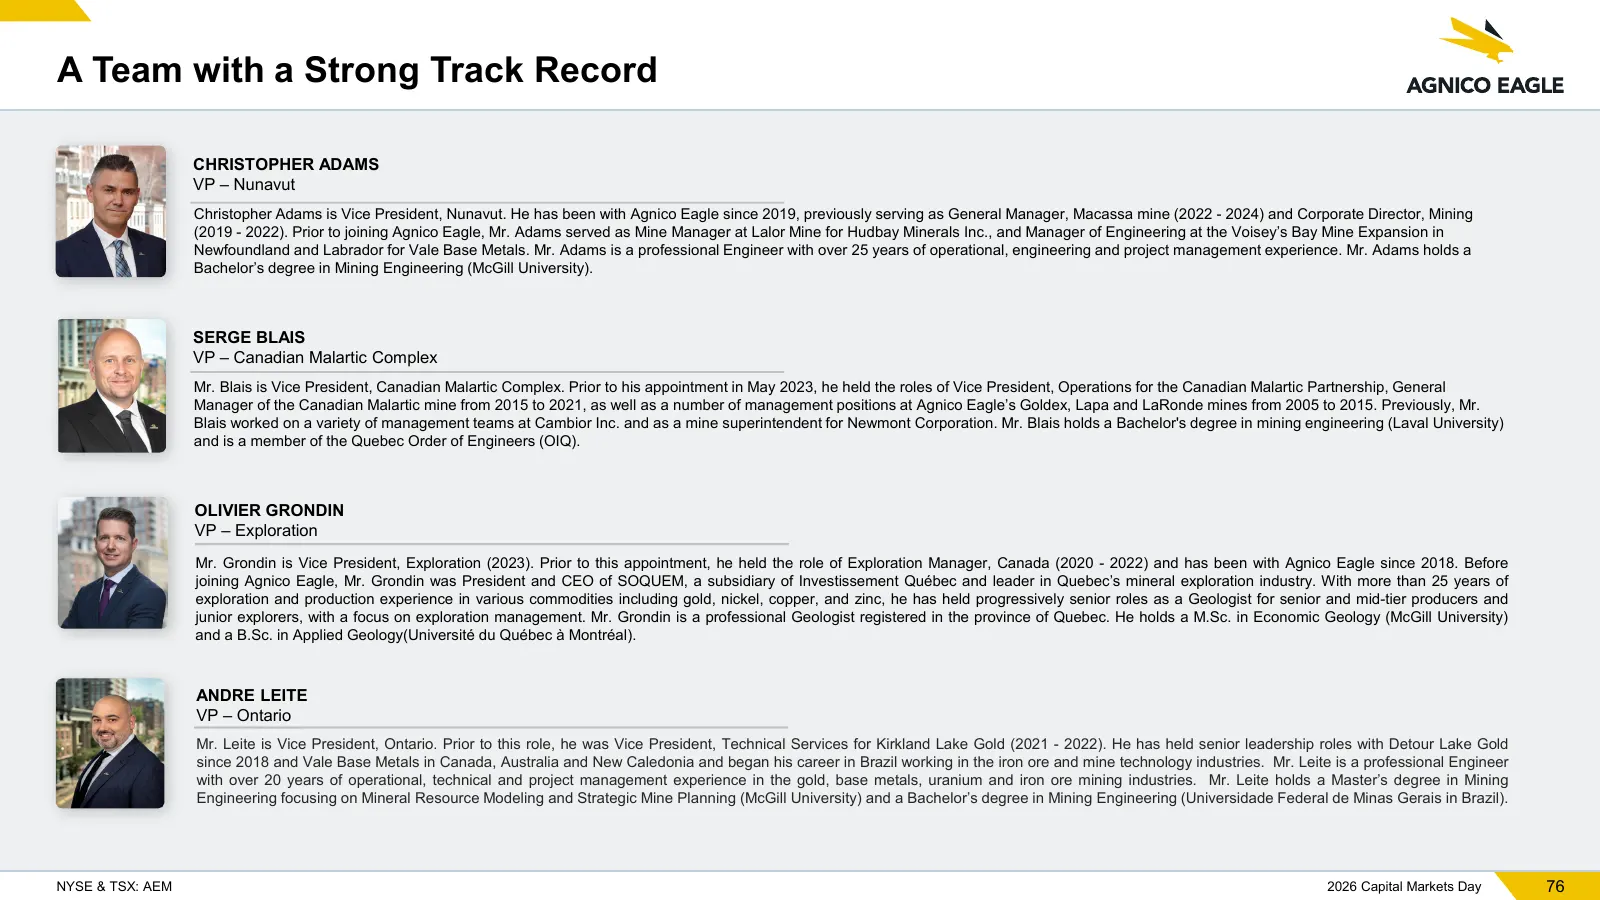
A Team with a Strong Track Record CHRISTOPHER ADAMS VP – Nunavut Christopher Adams is Vice President, Nunavut. He has been with Agnico Eagle since 2019, previously serving as General Manager, Macassa mine (2022 - 2024) and Corporate Director, Mining (2019 - 2022). Prior to joining Agnico Eagle, Mr.
Slide 77: A Team with a Strong Track Record
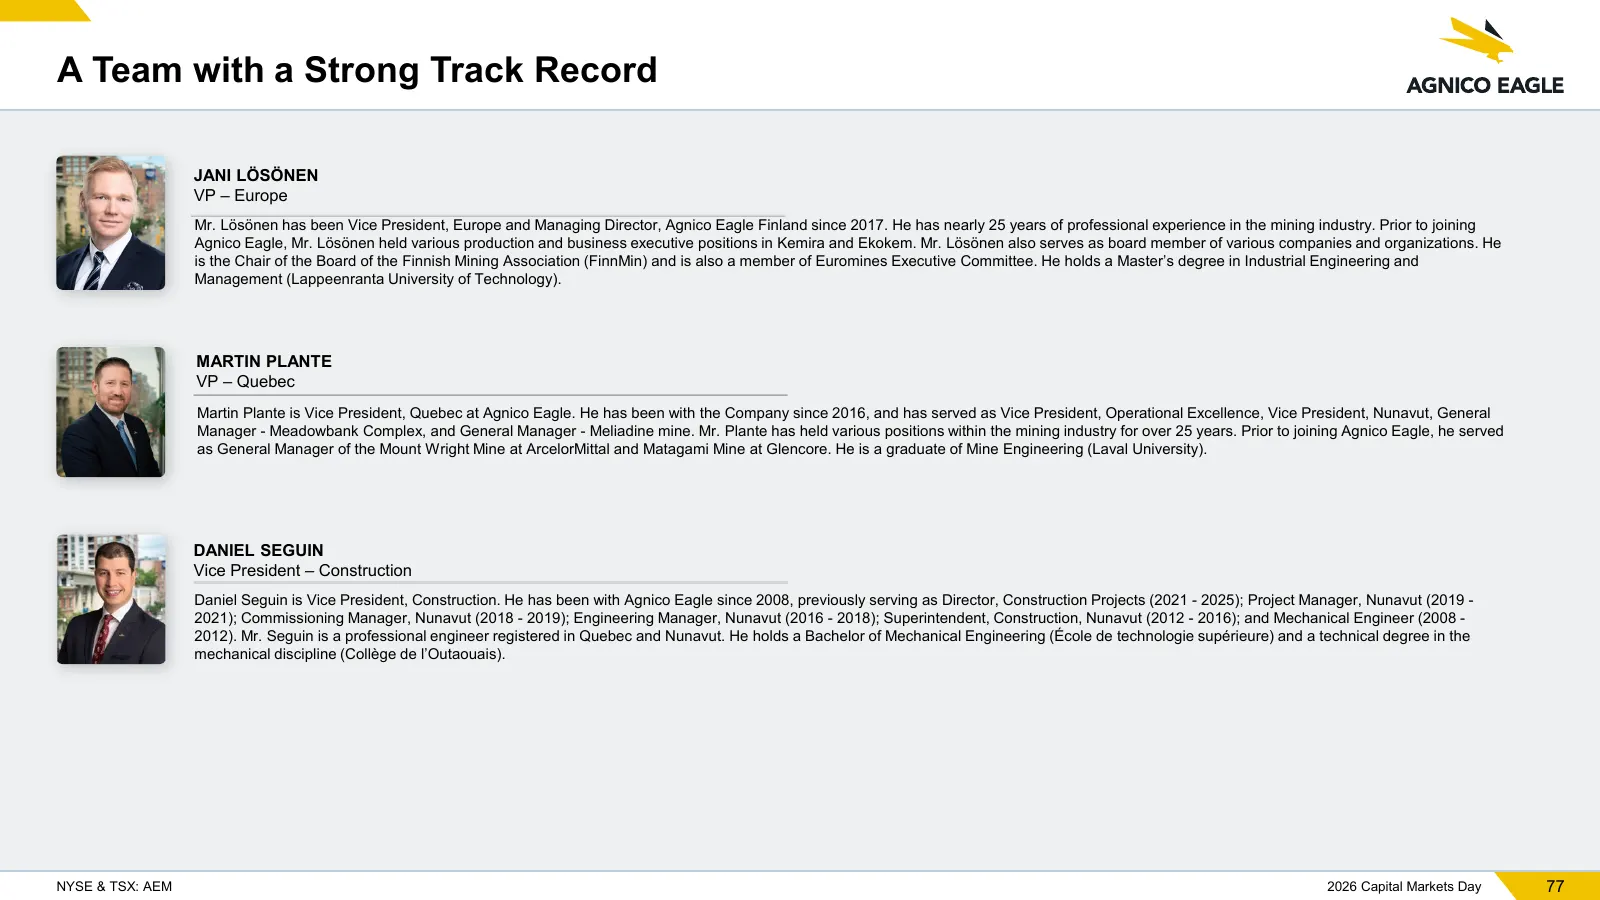
A Team with a Strong Track Record JANI LÖSÖNEN VP – Europe Mr. Lösönen has been Vice President, Europe and Managing Director, Agnico Eagle Finland since 2017. He has nearly 25 years of professional experience in the mining industry. Prior to joining Agnico Eagle, Mr. Lösönen held various production
Slide 78: Hope Bay – Gold Mineral Reserves and Mineral Resources
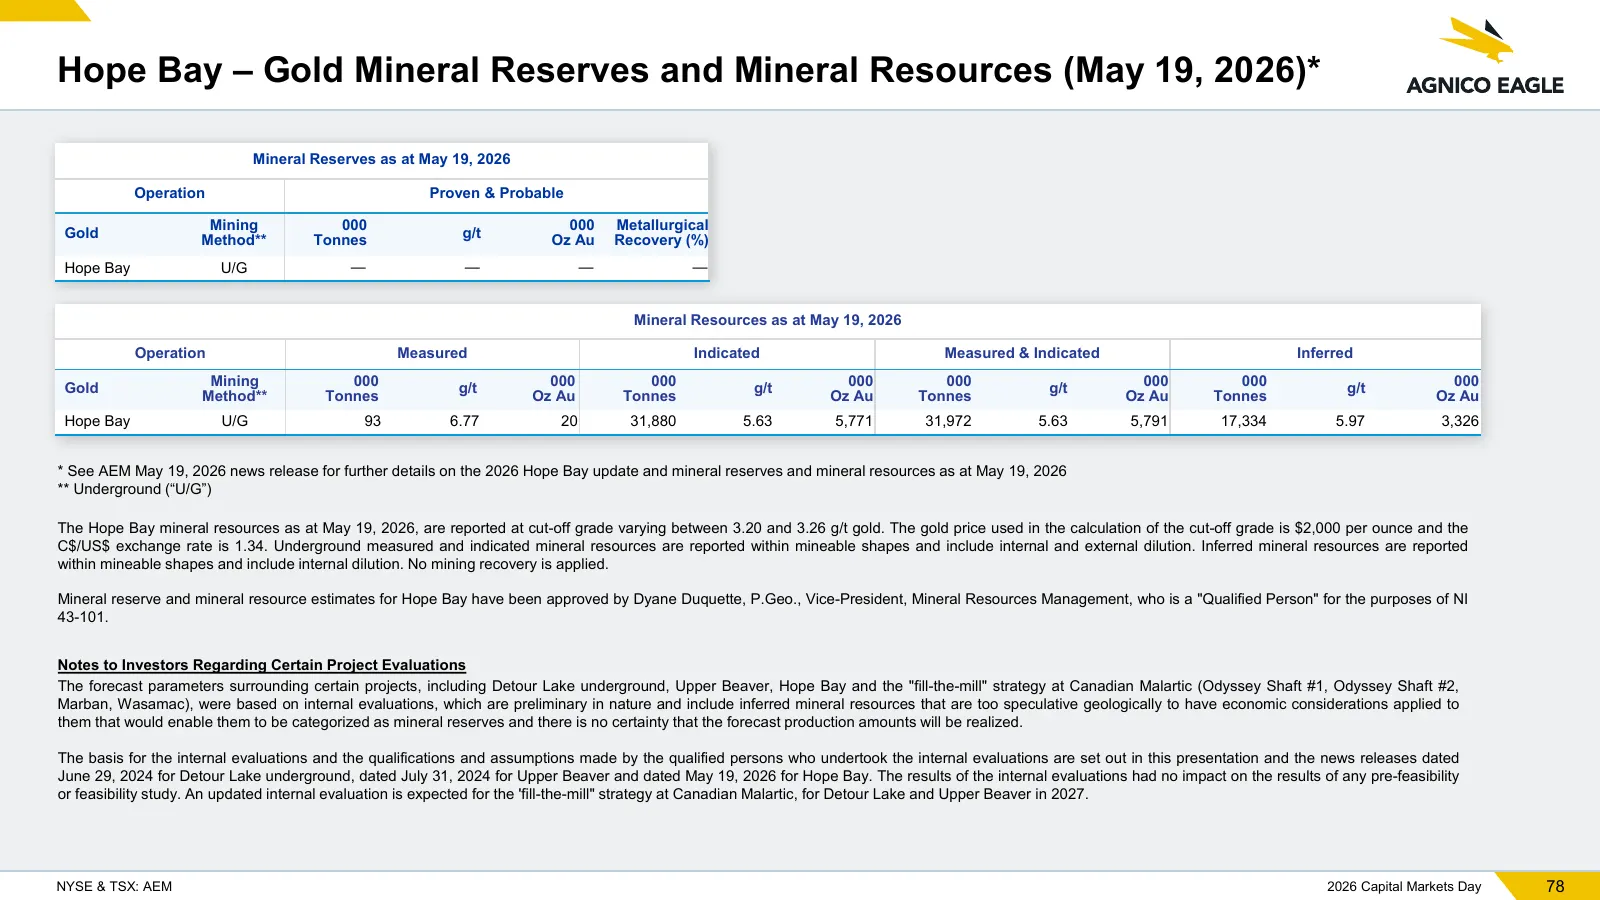
Hope Bay – Gold Mineral Reserves and Mineral Resources (May 19, 2026)* Mineral Reserves as at May 19, 2026 Operation Proven & Probable Gold Mining 000 g/t 000 Metallurgical Method** Tonnes Oz Au Recovery (%) Hope Bay U/G — — — — Mineral Resources as at May 19, 2026 Operation Measured Indicated Measu
Slide 79: 2025 Gold Mineral Reserves and Mineral Resources
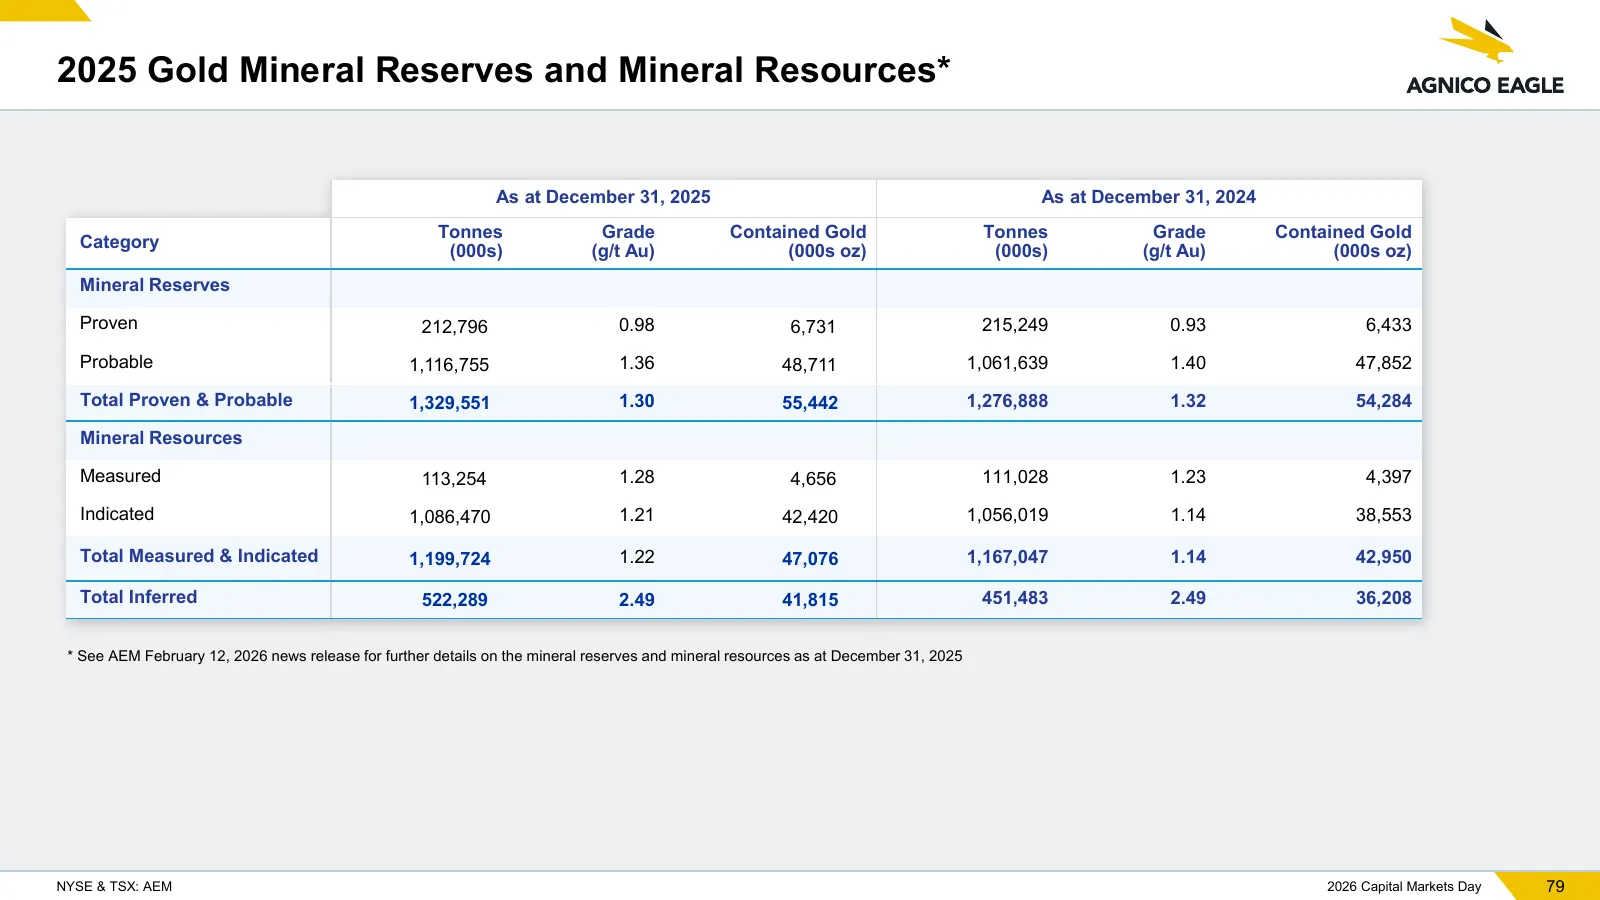
2025 Gold Mineral Reserves and Mineral Resources* As at December 31, 2025 As at December 31, 2024 Category Tonnes Grade Contained Gold Tonnes Grade Contained Gold (000s) (g/t Au) (000s oz) (000s) (g/t Au) (000s oz) Mineral Reserves Proven 212,796 0.98 6,731 215,249 0.93 6,433 Probable 1,116,755 1.36
Slide 80: 2025 Mineral Reserves and Mineral Resources
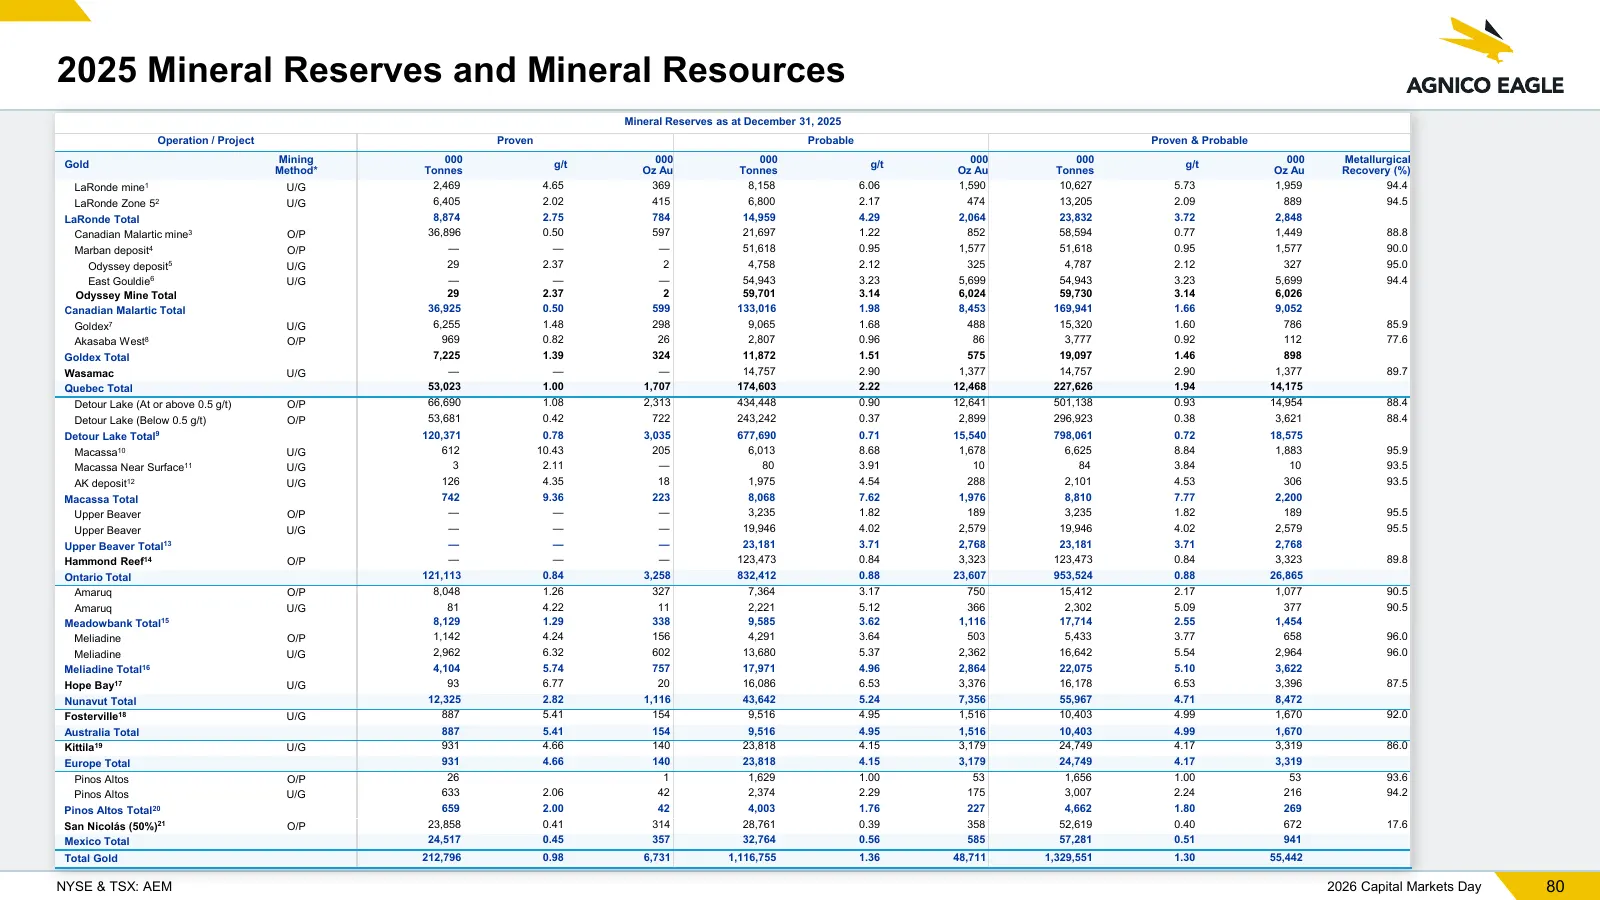
2025 Mineral Reserves and Mineral Resources Mineral Reserves as at December 31, 2025 Operation / Project Proven Probable Proven & Probable Mining 000 000 000 000 000 000 Metallurgical Gold g/t g/t g/t Method* Tonnes Oz Au Tonnes Oz Au Tonnes Oz Au Recovery (%) LaRonde mine1 U/G 2,469 4.65 369 8,158
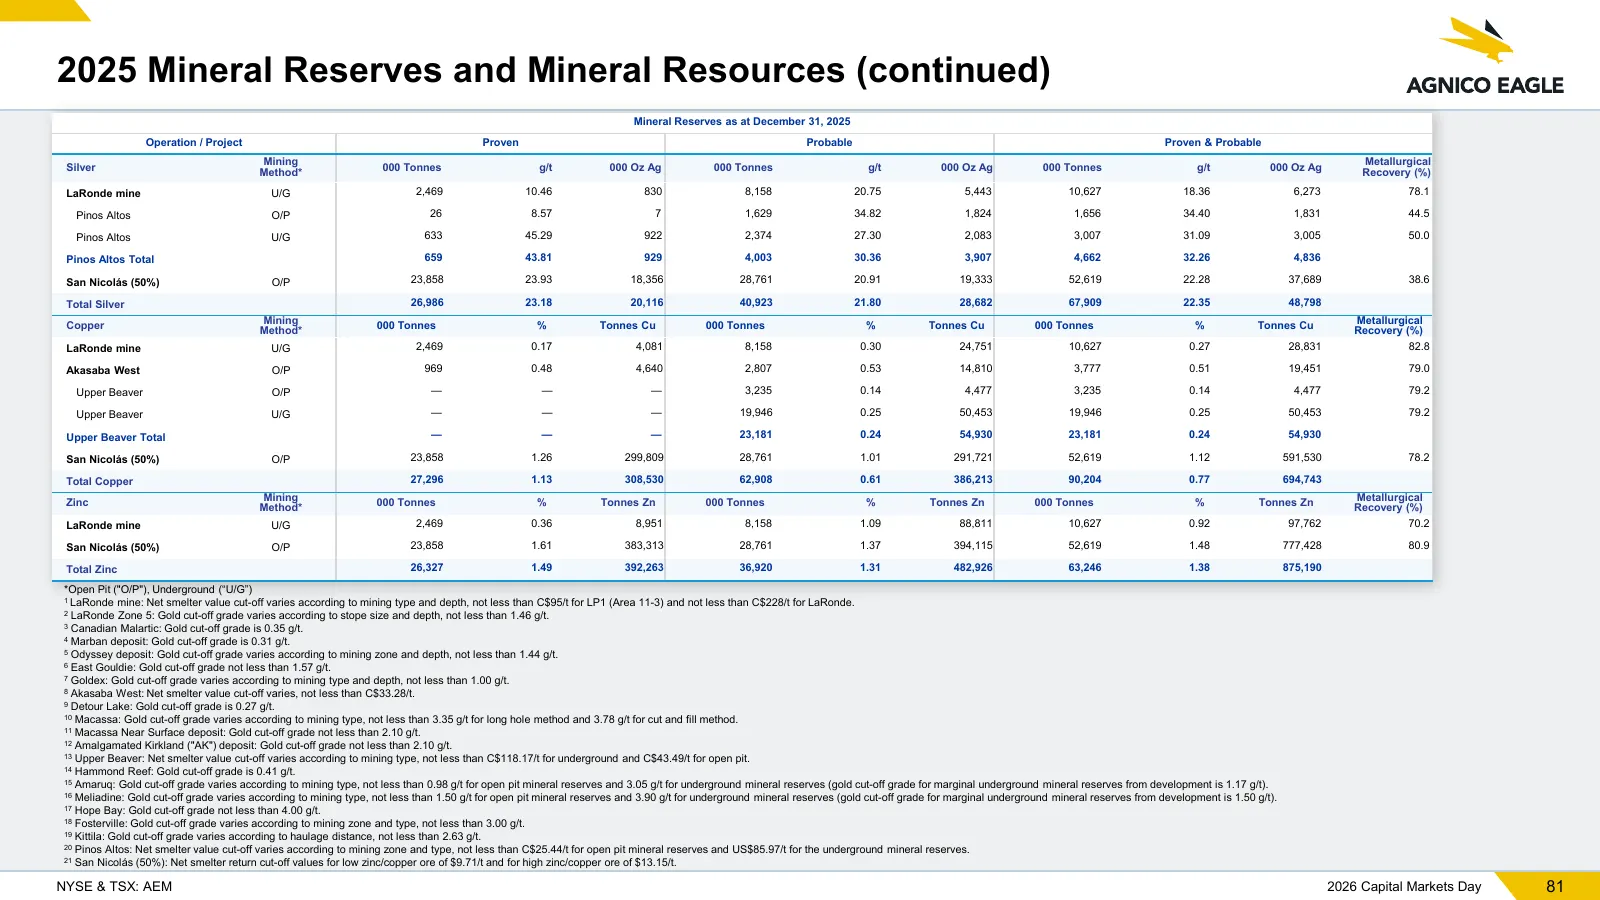
Slide 81: 2025 Mineral Reserves and Mineral Resources (continued)
2025 Mineral Reserves and Mineral Resources (continued) Mineral Reserves as at December 31, 2025 Operation / Project Proven Probable Proven & Probable Mining Metallurgical Silver 000 Tonnes g/t 000 Oz Ag 000 Tonnes g/t 000 Oz Ag 000 Tonnes g/t 000 Oz Ag Method* Recovery (%) LaRonde mine U/G 2,469 10
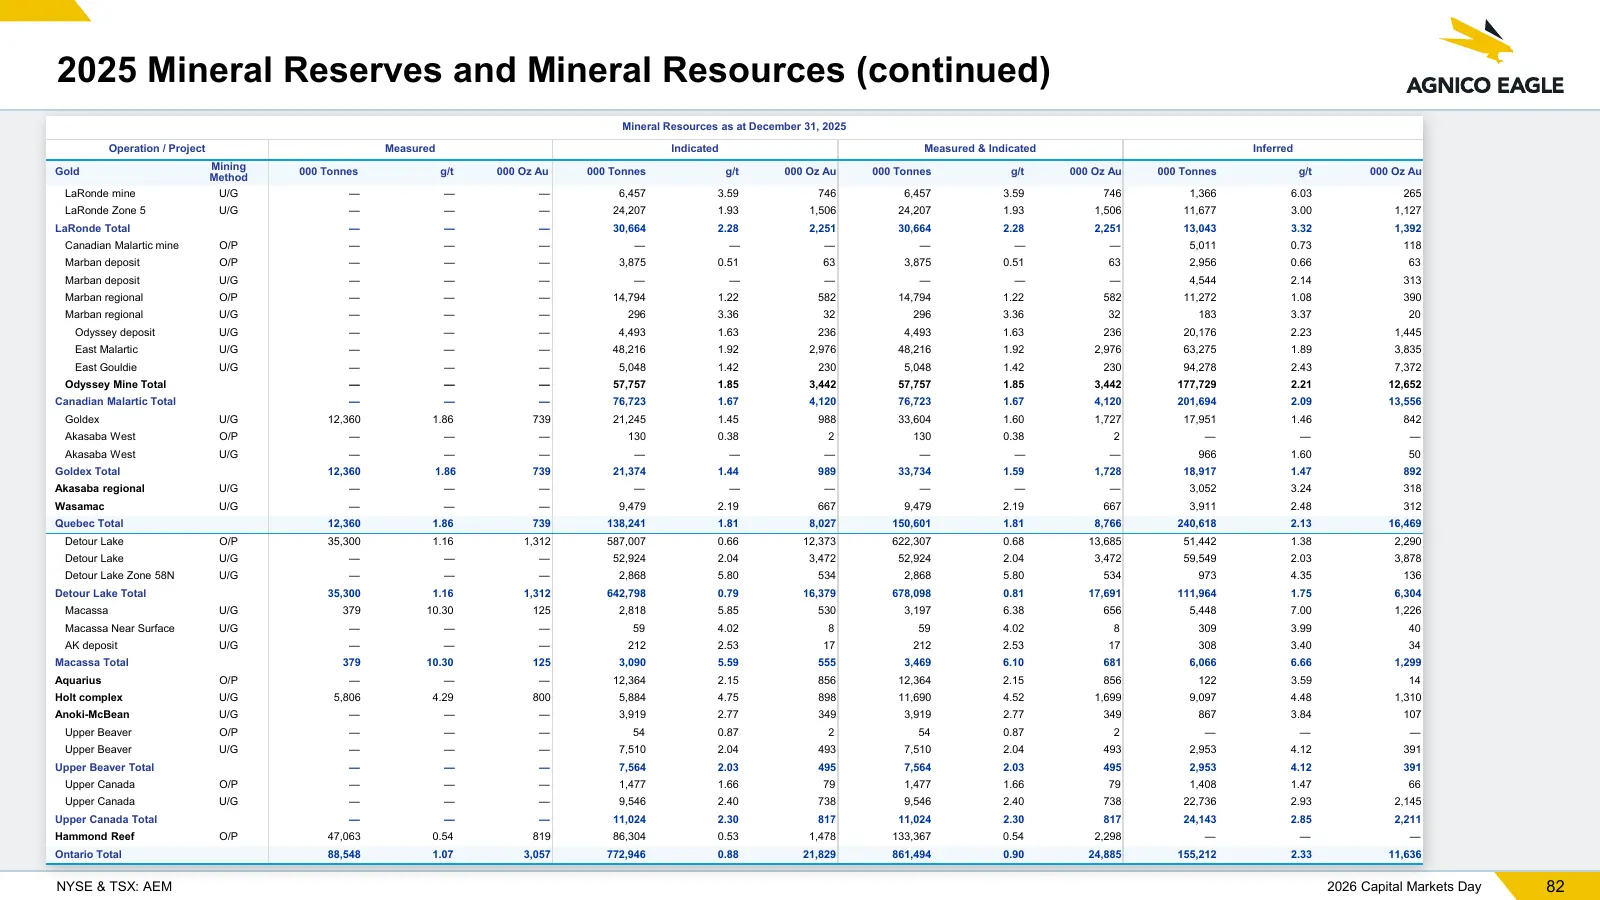
Slide 82: 2025 Mineral Reserves and Mineral Resources (continued)
2025 Mineral Reserves and Mineral Resources (continued) Mineral Resources as at December 31, 2025 Operation / Project Measured Indicated Measured & Indicated Inferred Mining Gold Method 000 Tonnes g/t 000 Oz Au 000 Tonnes g/t 000 Oz Au 000 Tonnes g/t 000 Oz Au 000 Tonnes g/t 000 Oz Au LaRonde mine U
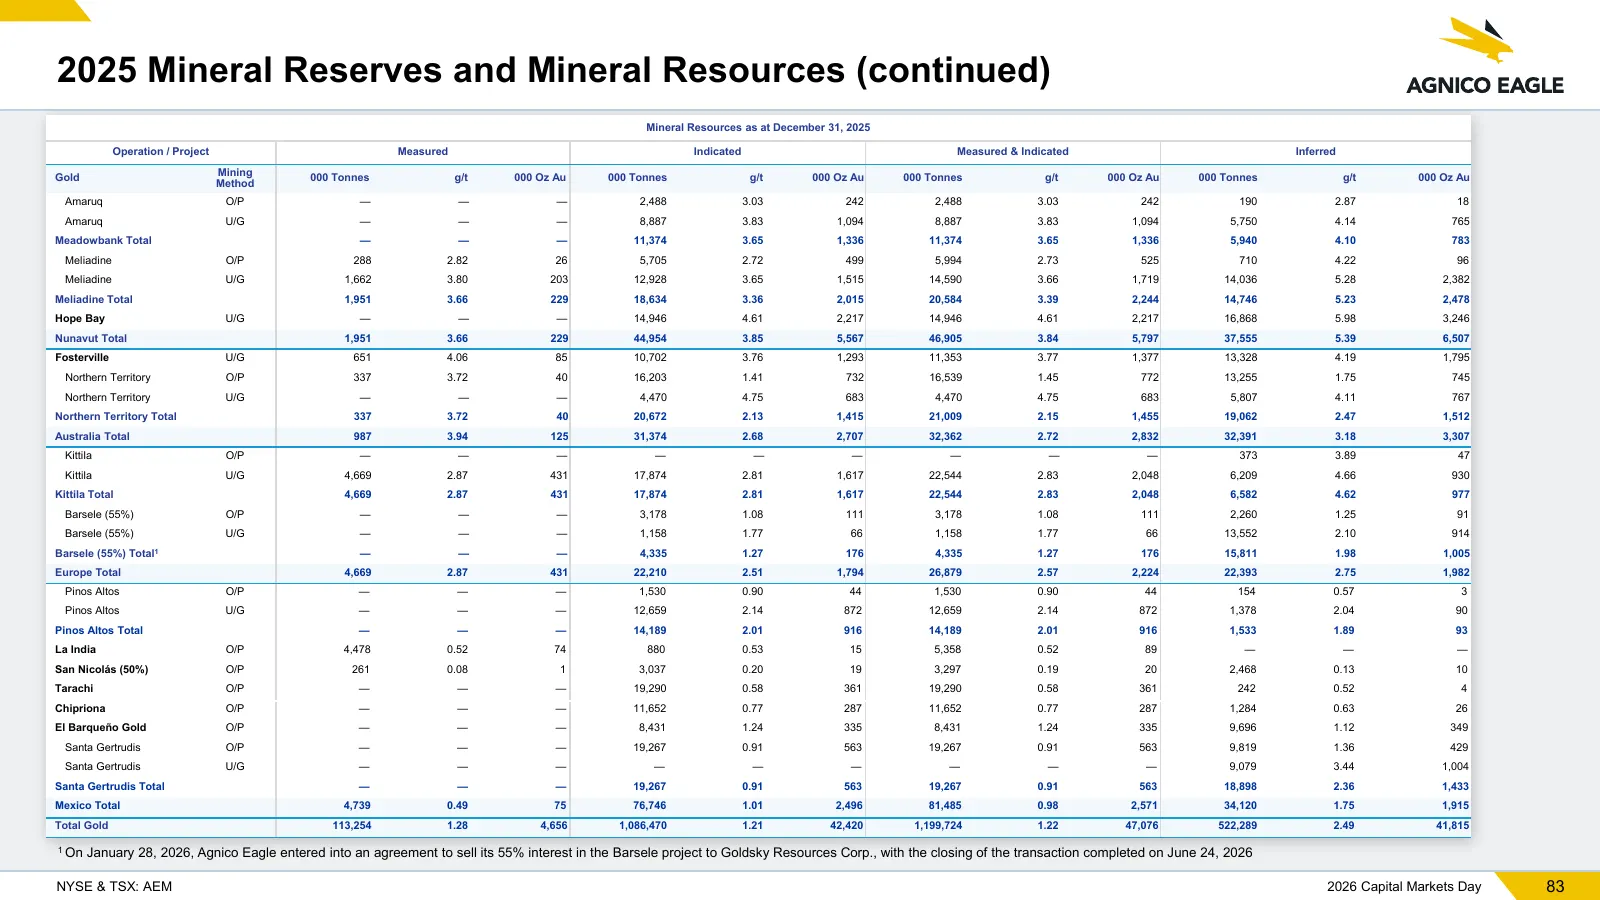
Slide 83: 2025 Mineral Reserves and Mineral Resources (continued)
2025 Mineral Reserves and Mineral Resources (continued) Mineral Resources as at December 31, 2025 Operation / Project Measured Indicated Measured & Indicated Inferred Mining Gold 000 Tonnes g/t 000 Oz Au 000 Tonnes g/t 000 Oz Au 000 Tonnes g/t 000 Oz Au 000 Tonnes g/t 000 Oz Au Method Amaruq O/P — —
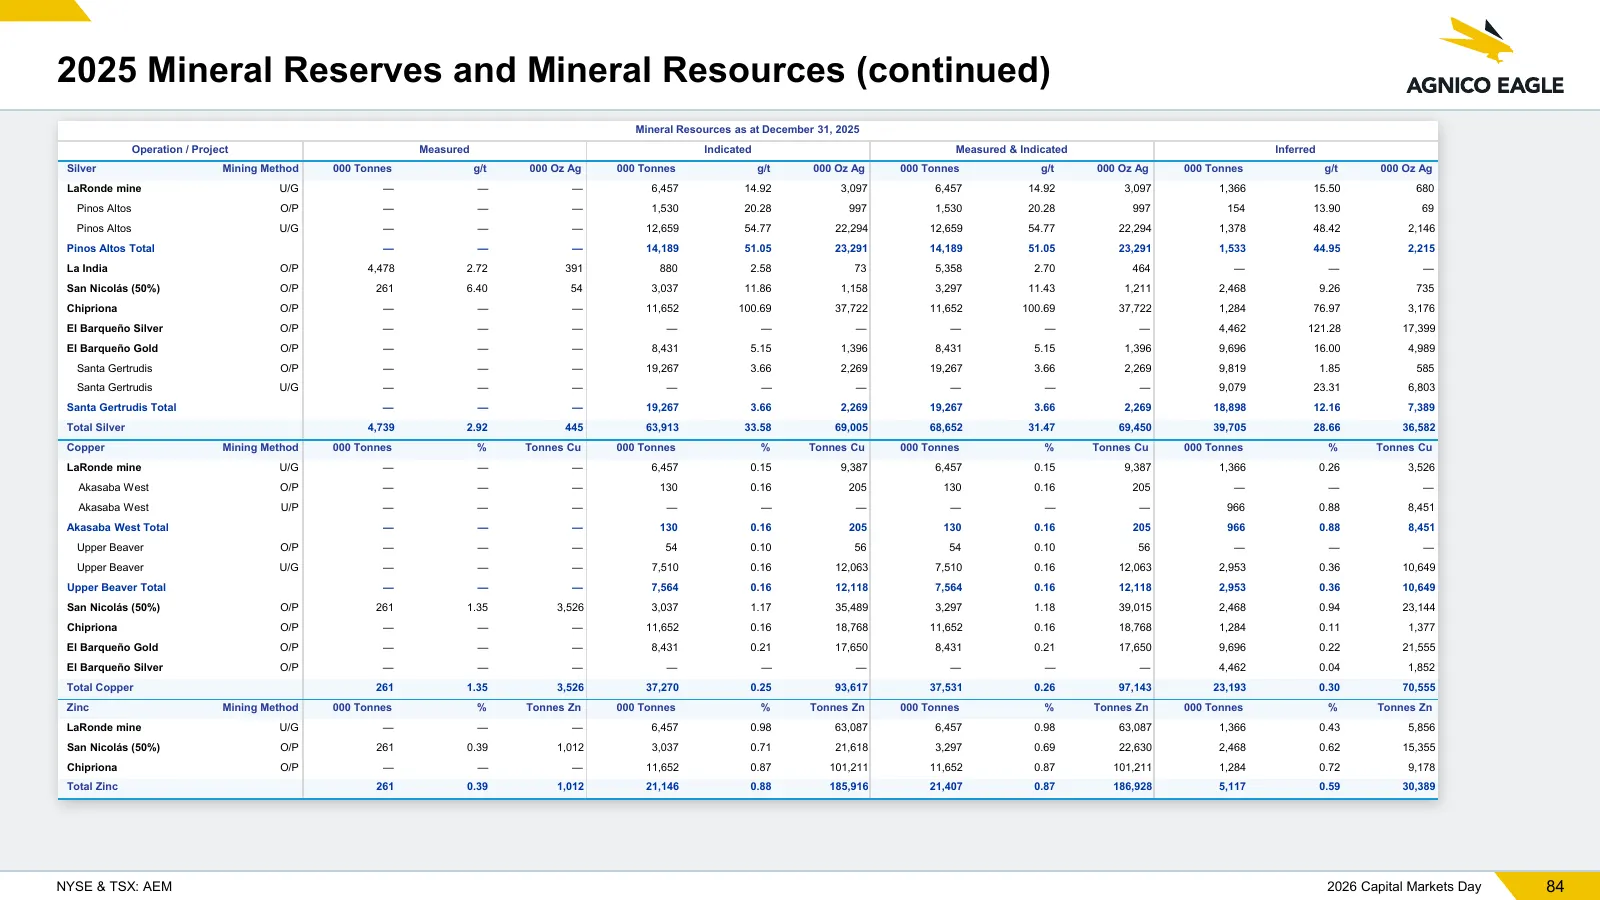
Slide 84: 2025 Mineral Reserves and Mineral Resources (continued)
2025 Mineral Reserves and Mineral Resources (continued) Mineral Resources as at December 31, 2025 Operation / Project Measured Indicated Measured & Indicated Inferred Silver Mining Method 000 Tonnes g/t 000 Oz Ag 000 Tonnes g/t 000 Oz Ag 000 Tonnes g/t 000 Oz Ag 000 Tonnes g/t 000 Oz Ag LaRonde mine
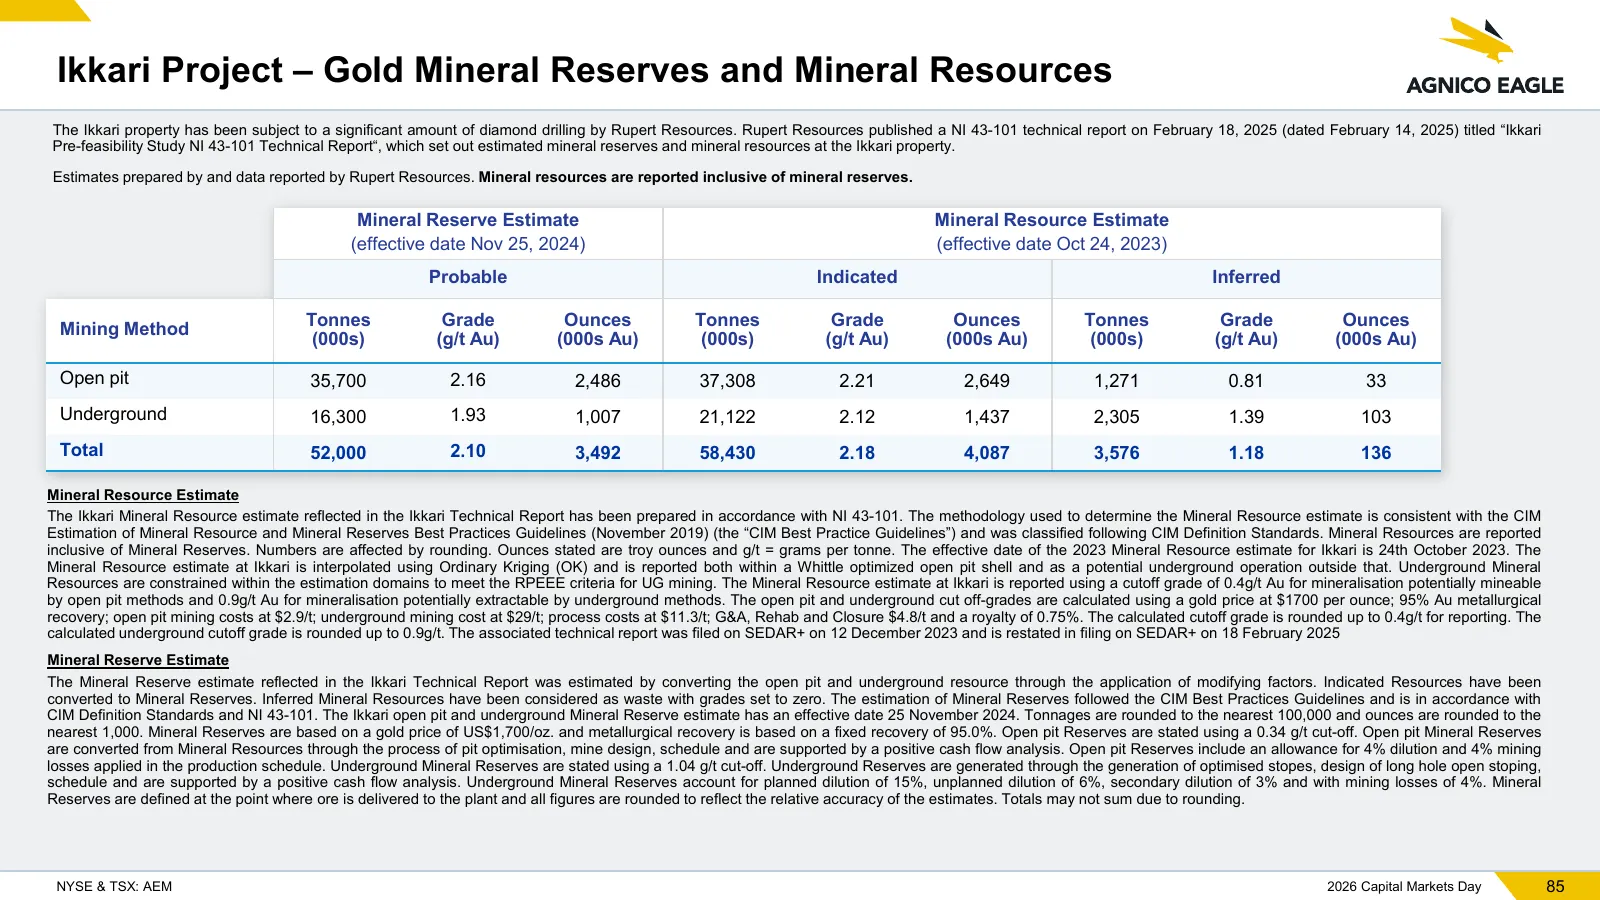
Slide 85: Ikkari Project – Gold Mineral Reserves and Mineral Resources
Ikkari Project – Gold Mineral Reserves and Mineral Resources The Ikkari property has been subject to a significant amount of diamond drilling by Rupert Resources. Rupert Resources published a NI 43-101 technical report on February 18, 2025 (dated February 14, 2025) titled “Ikkari Pre-feasibility Stu
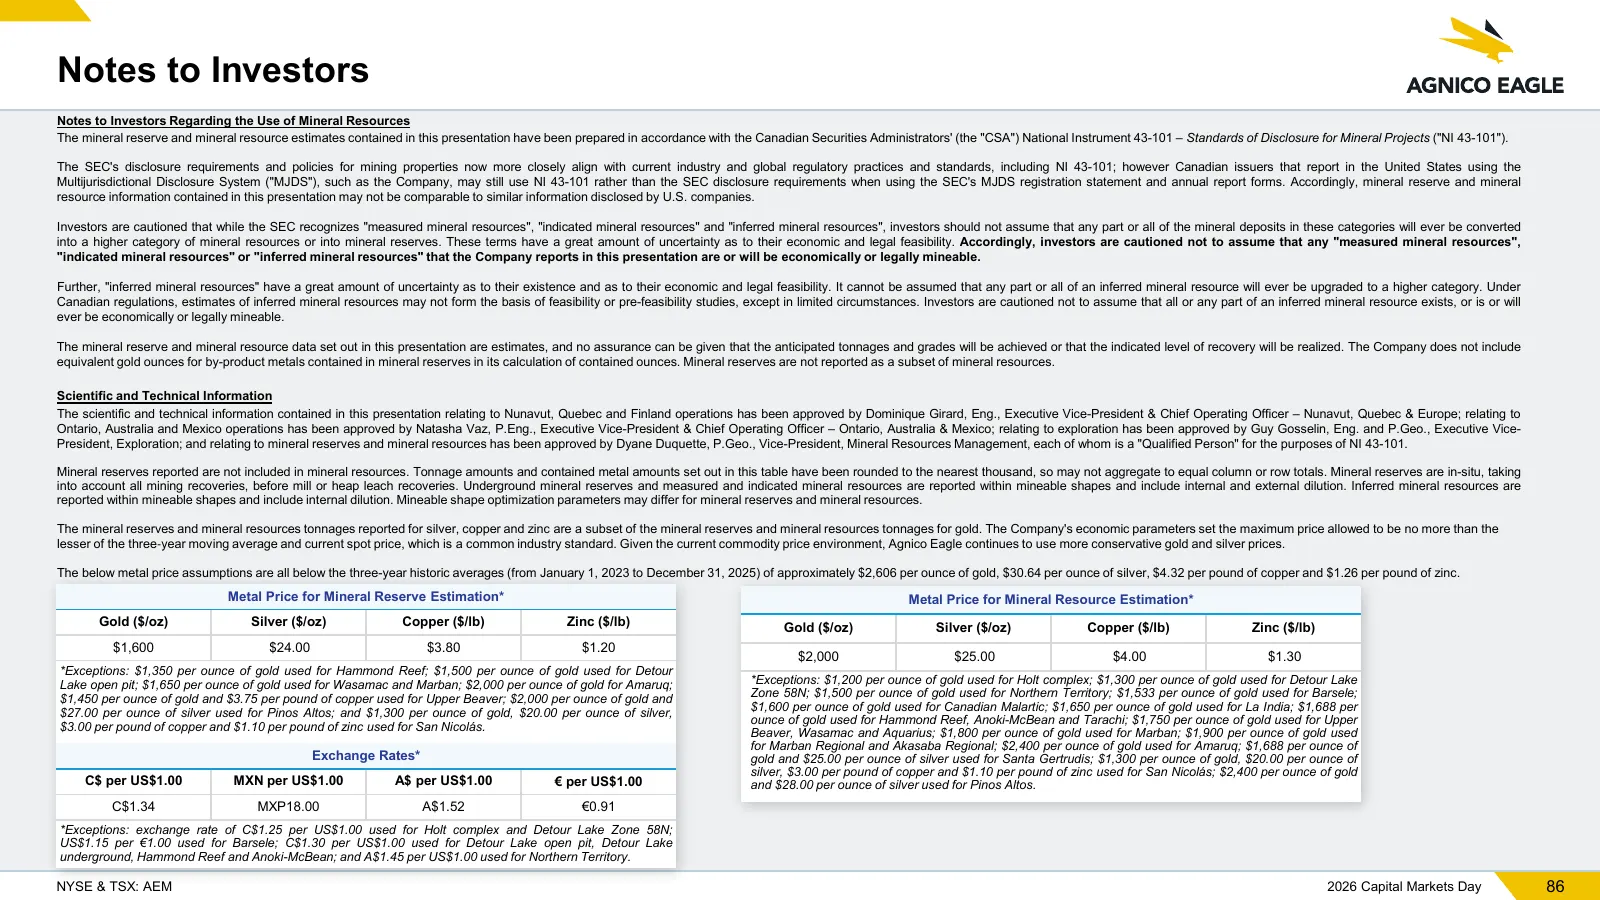
Slide 86: Notes to Investors
Notes to Investors Notes to Investors Regarding the Use of Mineral Resources The mineral reserve and mineral resource estimates contained in this presentation have been prepared in accordance with the Canadian Securities Administrators' (the "CSA") National Instrument 43-101 – Standards of Disclosur
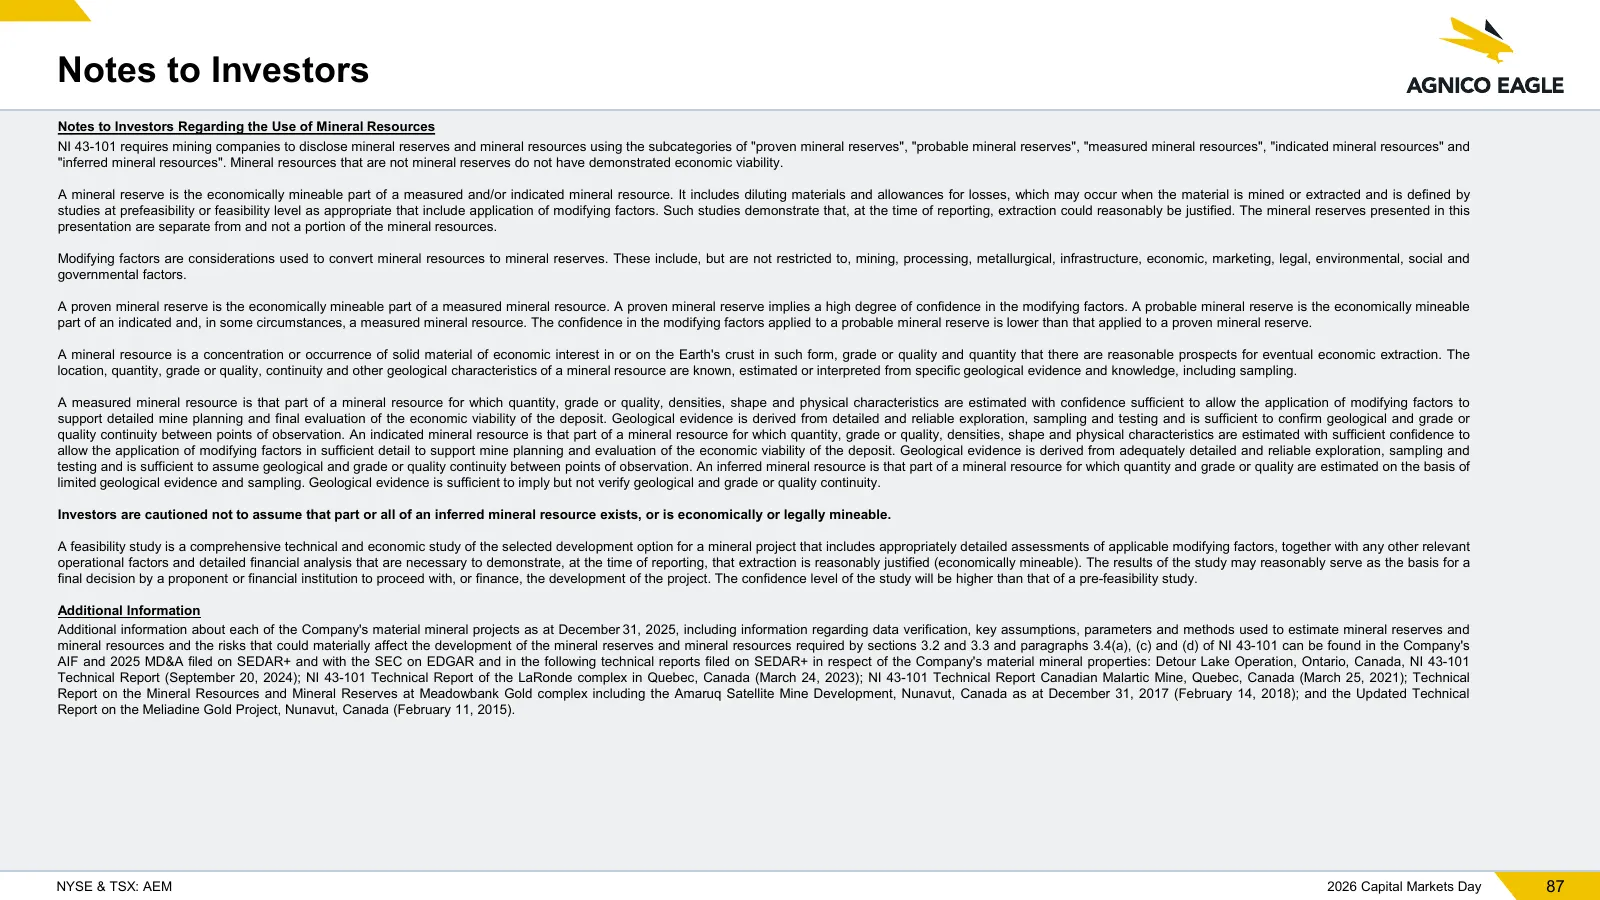
Slide 87: Notes to Investors
Notes to Investors Notes to Investors Regarding the Use of Mineral Resources NI 43-101 requires mining companies to disclose mineral reserves and mineral resources using the subcategories of "proven mineral reserves", "probable mineral reserves", "measured mineral resources", "indicated mineral reso
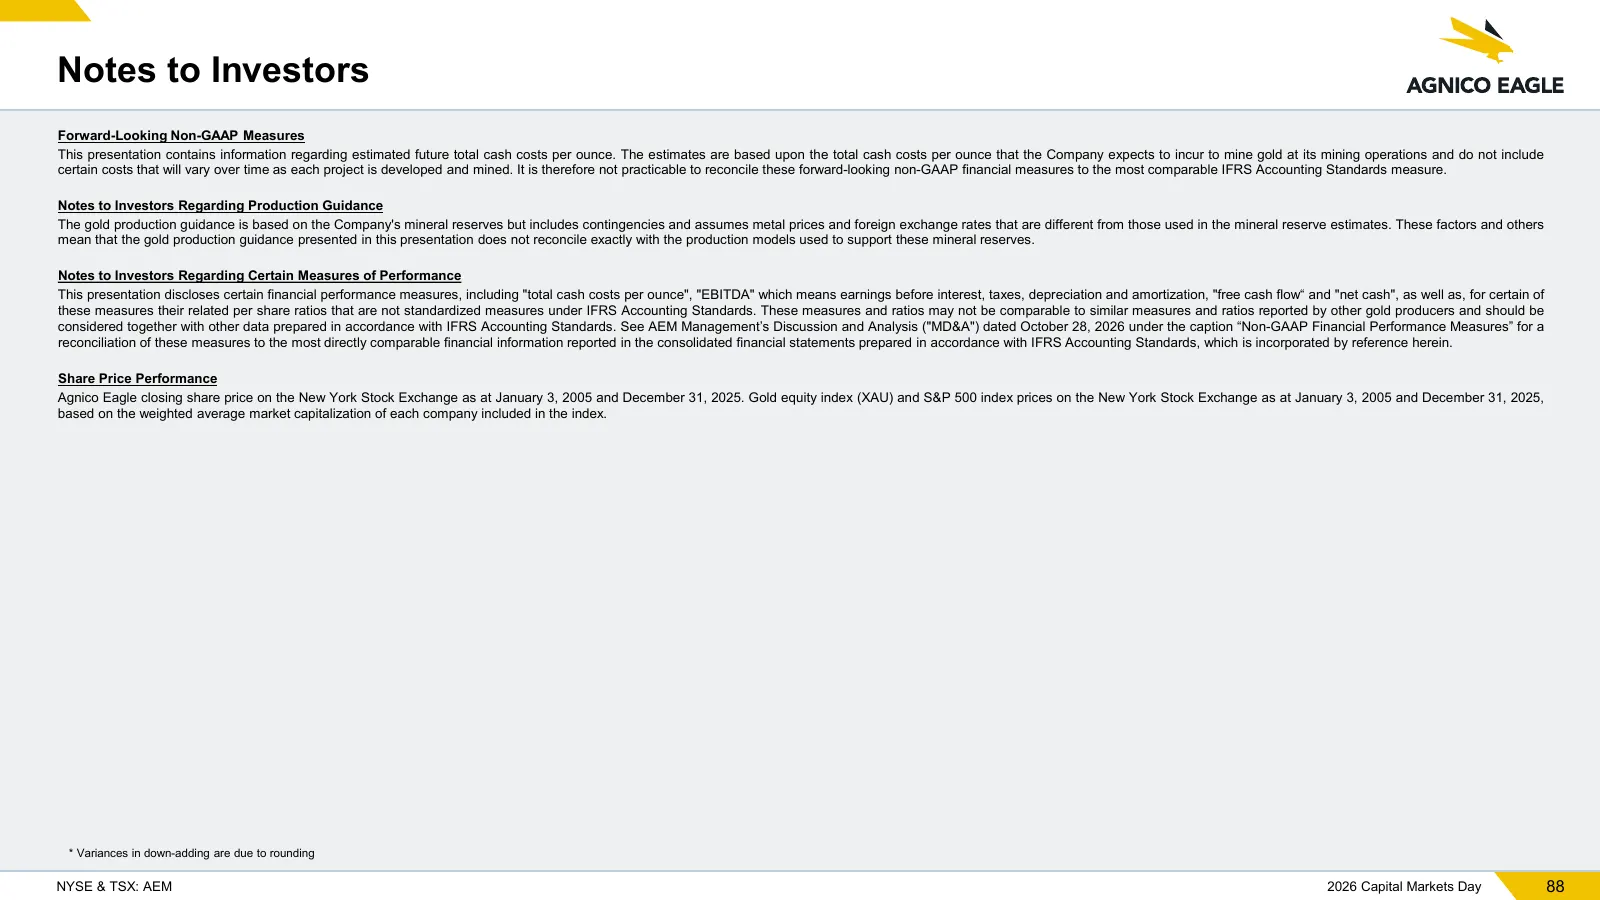
Slide 88: Notes to Investors
Notes to Investors Forward-Looking Non-GAAP Measures This presentation contains information regarding estimated future total cash costs per ounce. The estimates are based upon the total cash costs per ounce that the Company expects to incur to mine gold at its mining operations and do not include ce
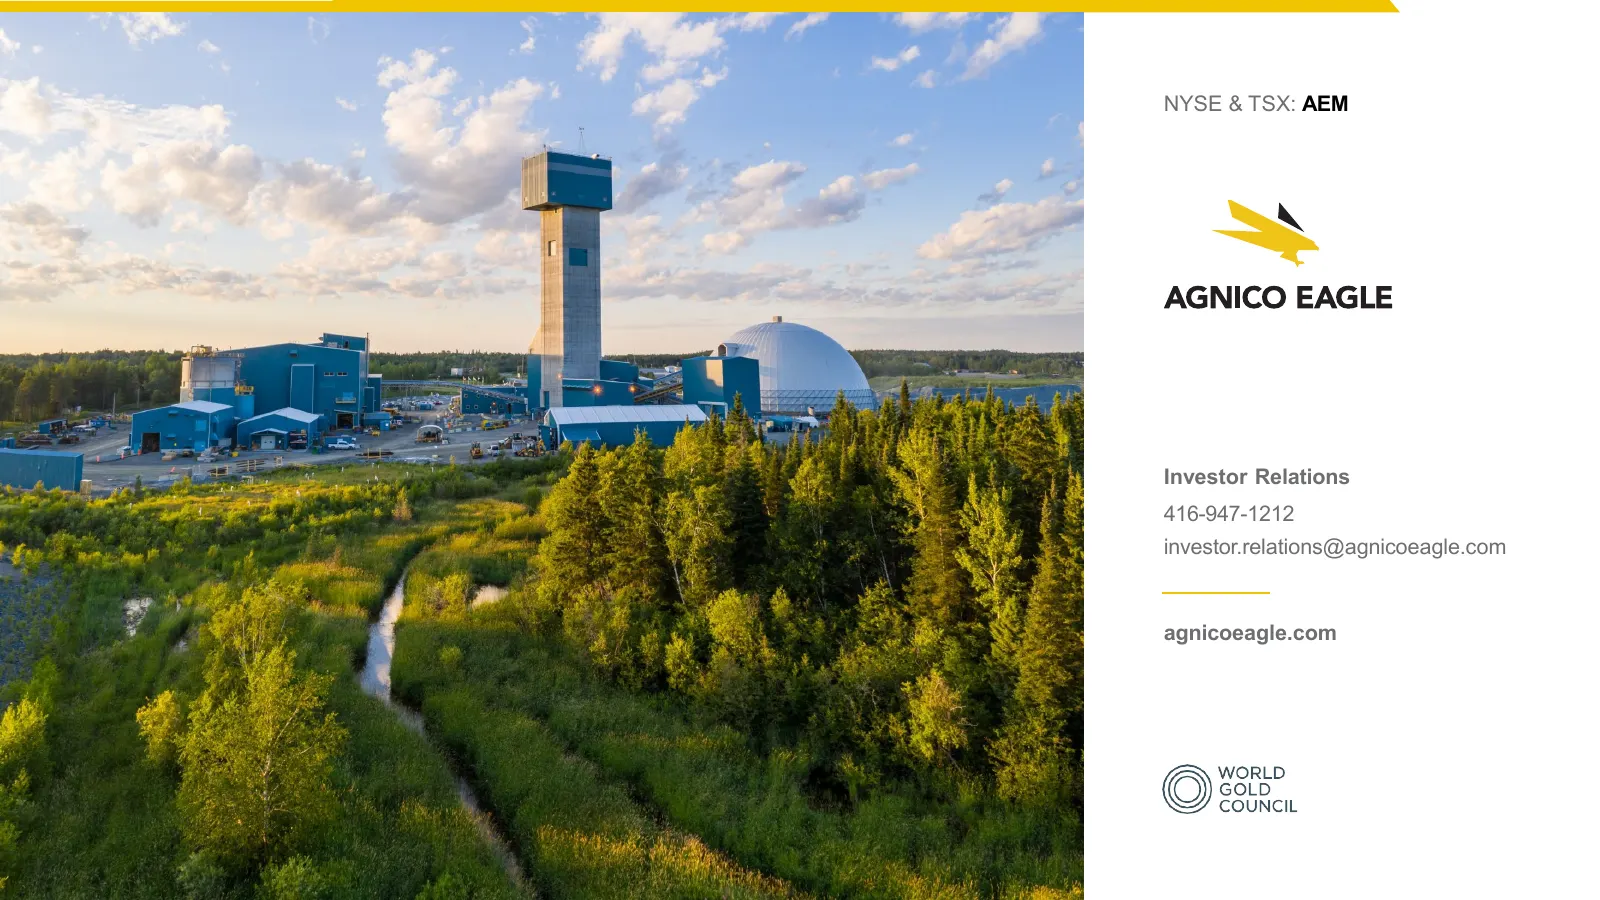
Slide 89: Investor Relations
NYSE & TSX: AEM Investor Relations 416-947-1212 investor.relations@agnicoeagle.com agnicoeagle.com
Source: company website, linked via 6ix News
More decks from OR Royalties Inc.
 Q3 2026 Earnings Presentation18 slides · Nov 12, 2026
 Investor Presentation (October 2026)29 slides · October 2026
 Q2 2026 Earnings Presentation17 slides · Aug 6, 2026
 Q1 2026 Earnings Presentation19 slides · May 7, 2026
 Q4 2025 Earnings Presentation20 slides · Feb 19, 2026
 Investor Day (November 2025)82 slides · Nov 10, 2025