Consti Oyj · OMXHEX:CONSTI
Consti Oyj — H1 2019 Earnings Presentation
25 slides from Consti Oyj's earnings presentation, Jul 26, 2019
Slide 1: Consti Group Plc Half-Year Financial Report 1 January – 30 June 2019
CONSTI GROUP PLC HALF-YEAR FINANCIAL REPORT 1 JANUARY – 30 JUNE 2019 CEO Esa Korkeela CFO Joni Sorsanen
Slide 2: Contents
CONTENTS 1. Highlights and Group performance 2. Cash flow and financial position 3. Market outlook, guidance and summary 4. Appendix 1 26 July 2019 Consti Group Plc / H1 Financial Report 2019
Slide 3: Highlights of the second quarter of 2019
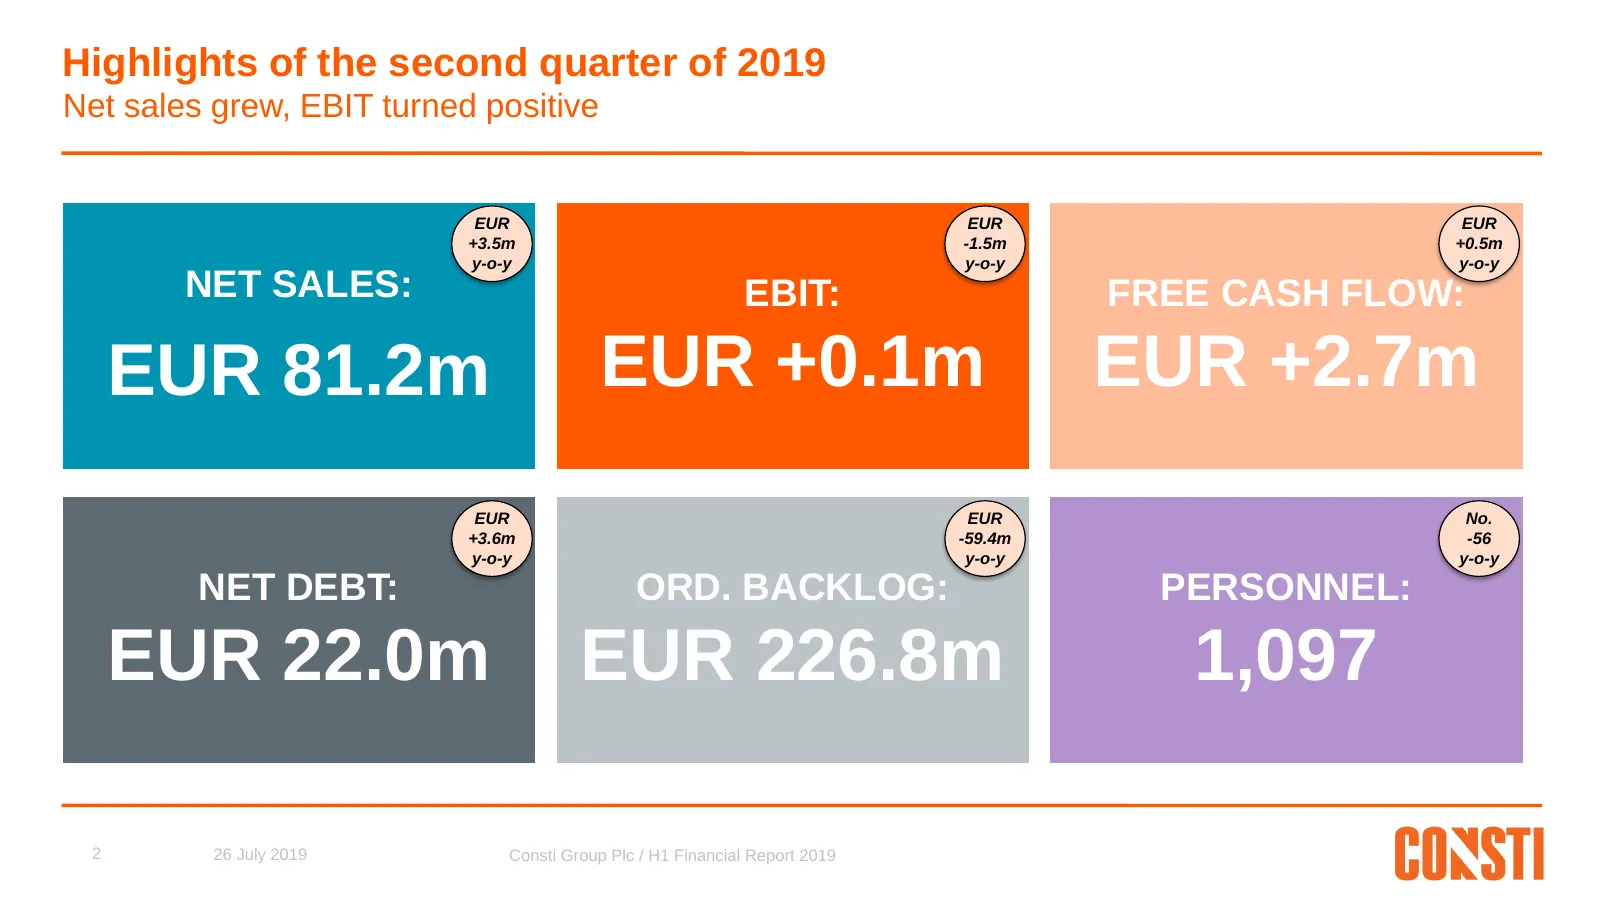
Highlights of the second quarter of 2019 Net sales grew, EBIT turned positive EUR EUR EUR +3.5m -1.5m +0.5m y-o-y y-o-y y-o-y NET SALES: EBIT: FREE CASH FLOW: EUR 81.2m EUR +0.1m EUR +2.7m EUR EUR No. +3.6m -59.4m -56 y-o-y y-o-y y-o-y NET DEBT: ORD. BACKLOG: PERSONNEL: EUR 22.0m EUR 226.8m 1,097 2
Slide 4: Quarterly performance overview
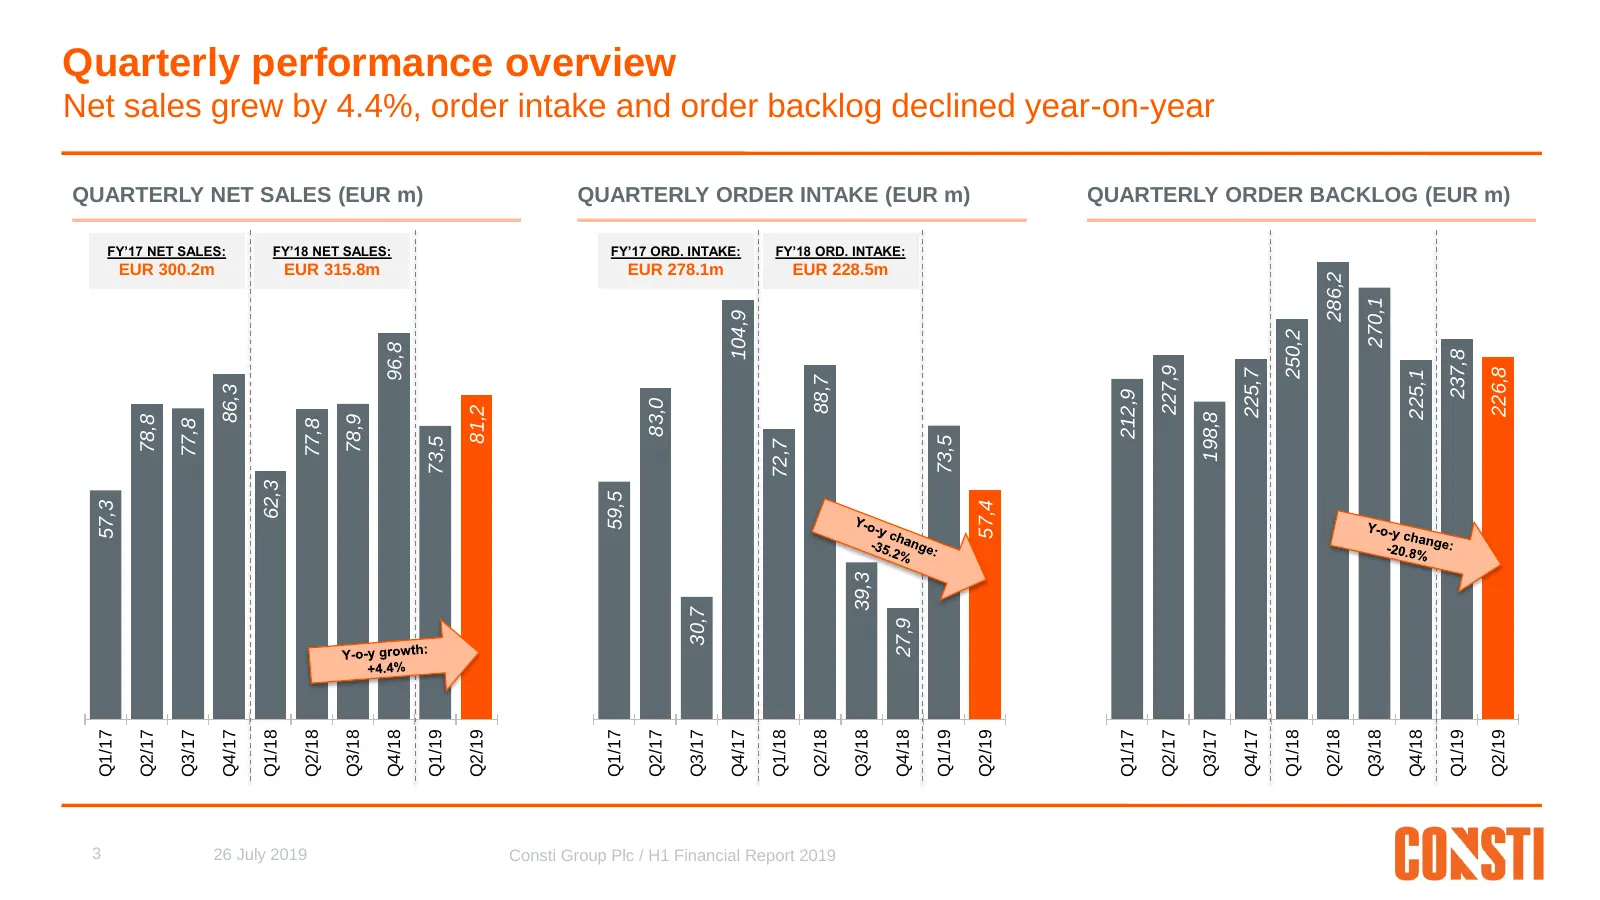
Quarterly performance overview Net sales grew by 4.4%, order intake and order backlog declined year-on-year QUARTERLY NET SALES (EUR m) QUARTERLY ORDER INTAKE (EUR m) QUARTERLY ORDER BACKLOG (EUR m) FY’17 NET SALES: FY’18 NET SALES: FY’17 ORD. INTAKE: FY’18 ORD. INTAKE: EUR 300.2m EUR 315.8m EUR 278
Slide 5: Quarterly net sales development
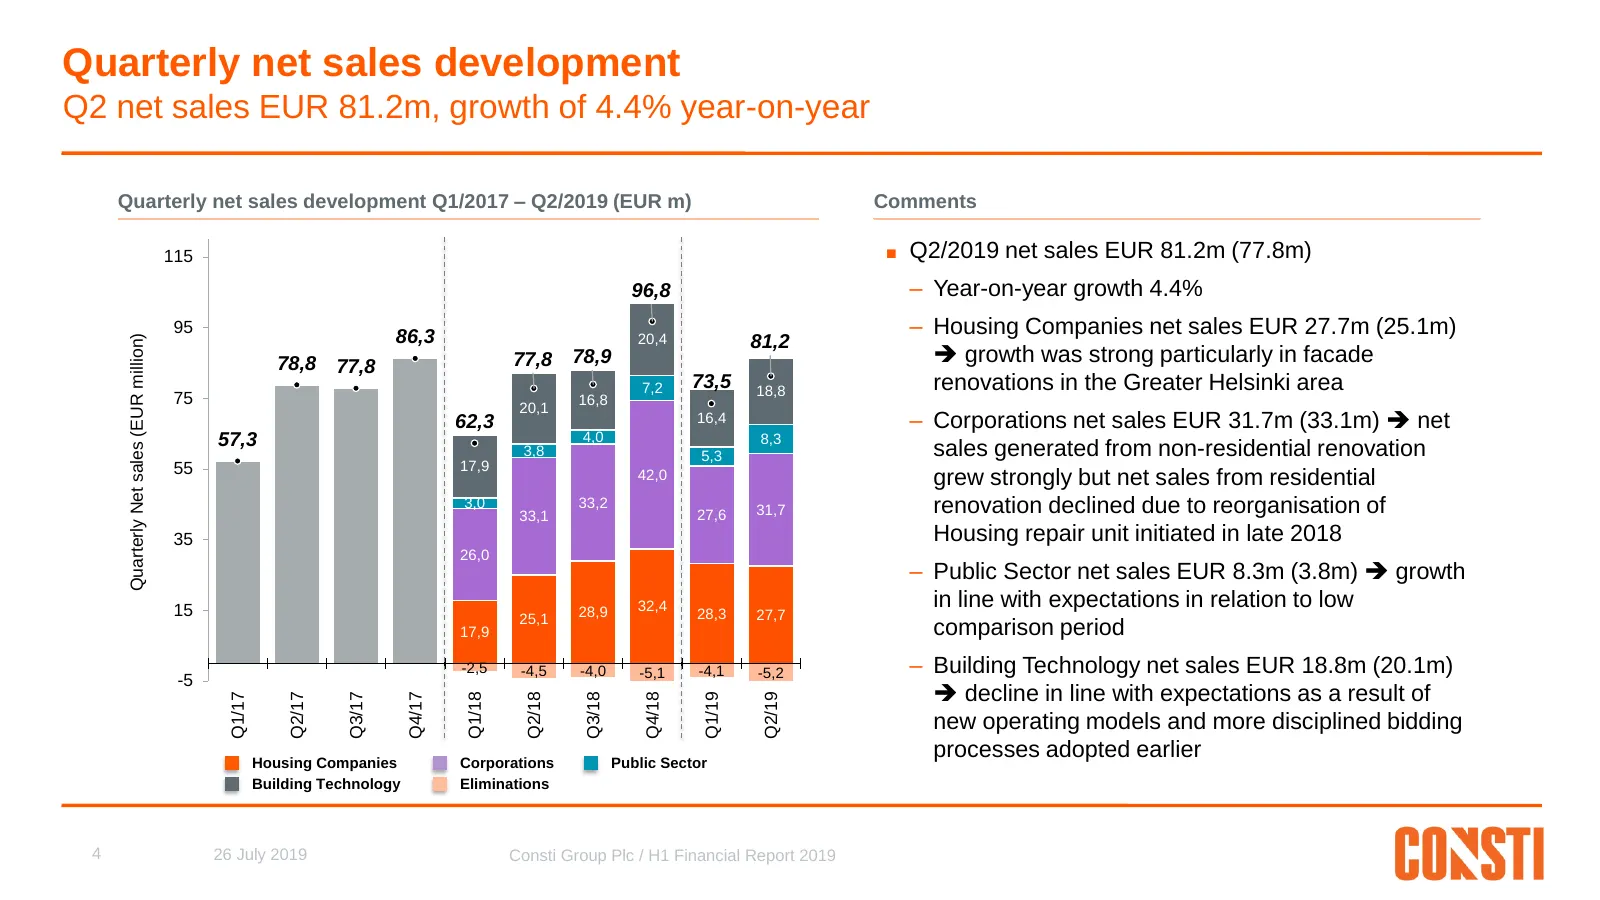
Quarterly net sales development Q2 net sales EUR 81.2m, growth of 4.4% year-on-year Quarterly net sales development Q1/2017 – Q2/2019 (EUR m) Comments 115 ■ Q2/2019 net sales EUR 81.2m (77.8m) 96,8 – Year-on-year growth 4.4% 95 86,3 – Housing Companies net sales EUR 27.7m (25.1m) Quarterly Net sales
Slide 6: EBIT development
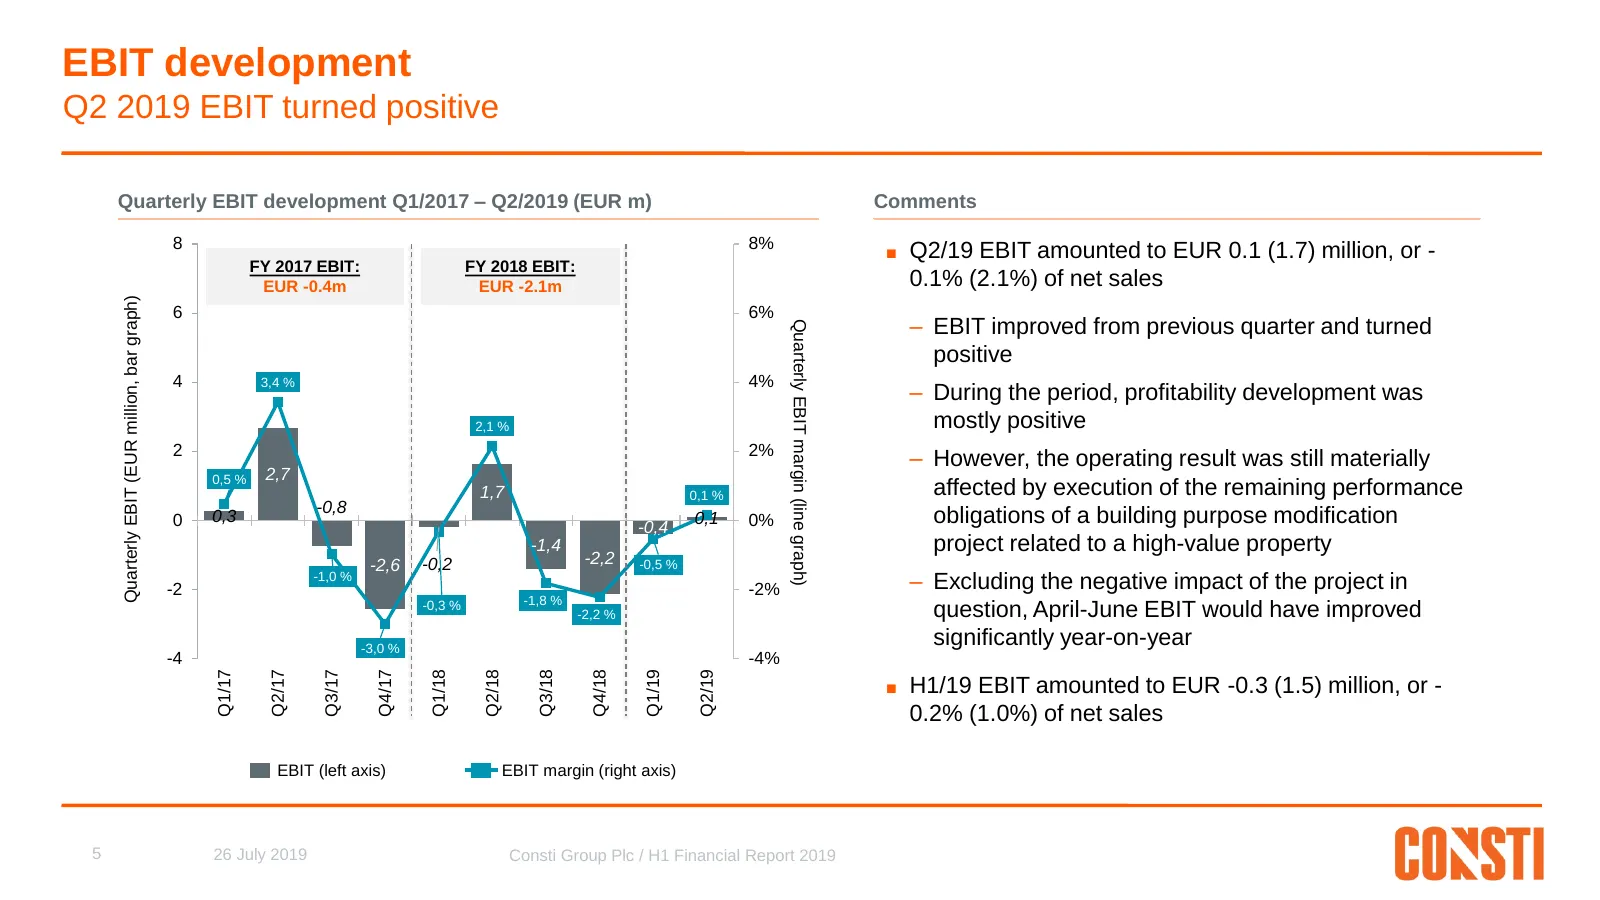
EBIT development Q2 2019 EBIT turned positive Quarterly EBIT development Q1/2017 – Q2/2019 (EUR m) Comments 8 8% ■ Q2/19 EBIT amounted to EUR 0.1 (1.7) million, or - FY 2017 EBIT: FY 2018 EBIT: EUR -0.4m EUR -2.1m 0.1% (2.1%) of net sales Quarterly EBIT (EUR million, bar graph) 6 6% – EBIT improved
Slide 7: Actions to improve profitability ongoing
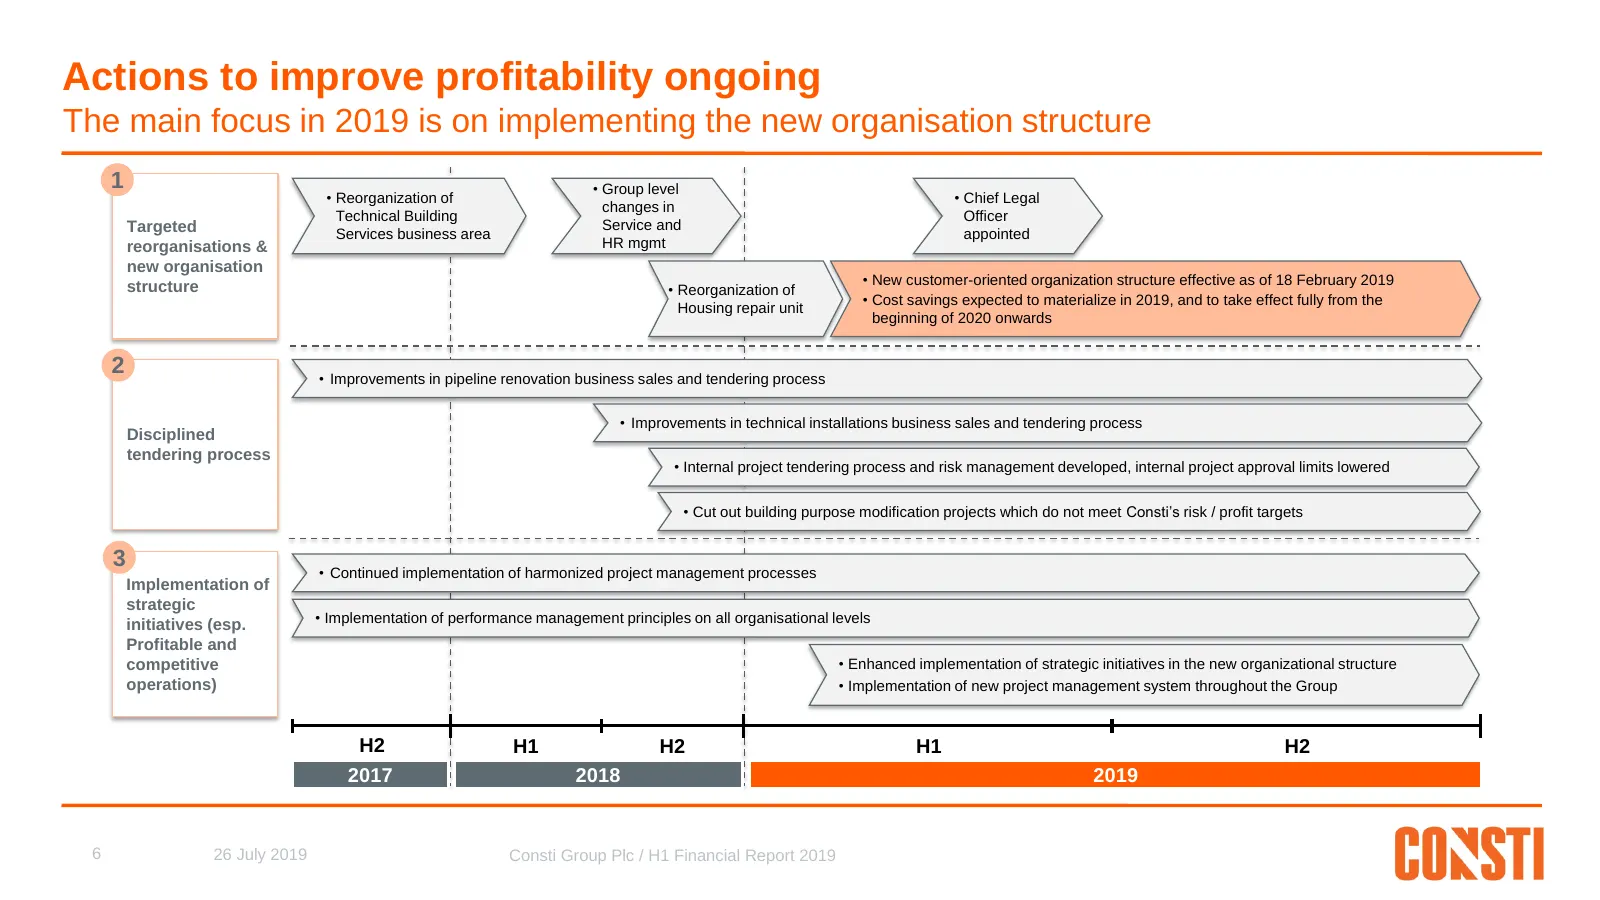
Actions to improve profitability ongoing The main focus in 2019 is on implementing the new organisation structure 1 • Group level • Reorganization of • Chief Legal changes in Technical Building Officer Targeted Service and Services business area appointed reorganisations & HR mgmt new organisation s
Slide 8: Implementation of new organisation structure progressing
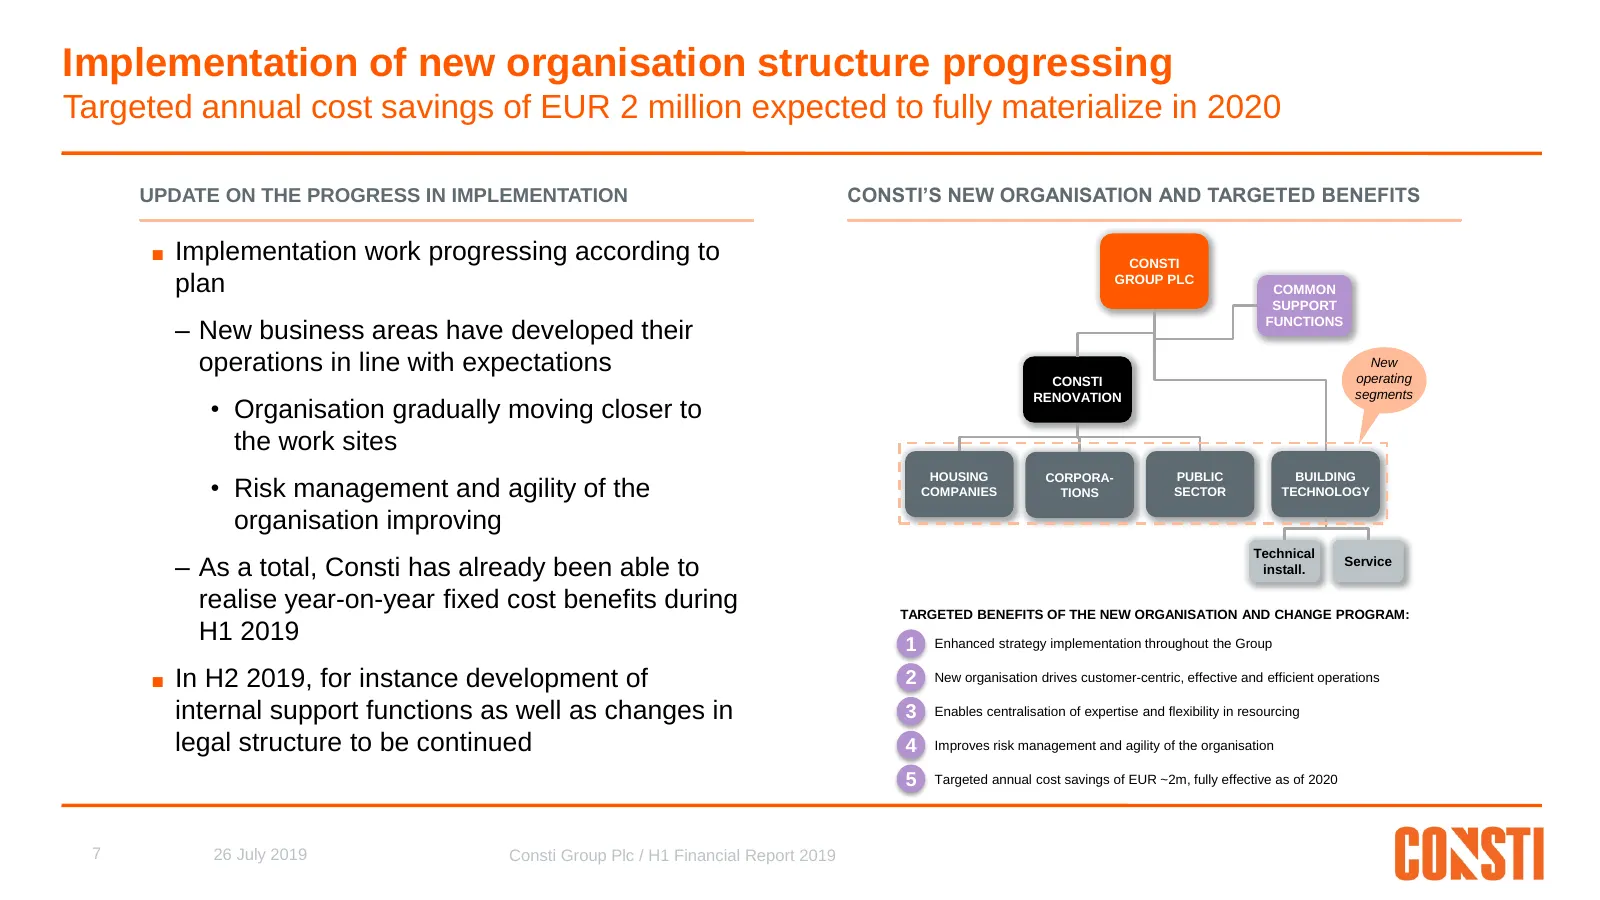
Implementation of new organisation structure progressing Targeted annual cost savings of EUR 2 million expected to fully materialize in 2020 UPDATE ON THE PROGRESS IN IMPLEMENTATION CONSTI’S NEW ORGANISATION AND TARGETED BENEFITS ■ Implementation work progressing according to CONSTI plan GROUP PLC C
Slide 9: Quarterly development in number of personnel
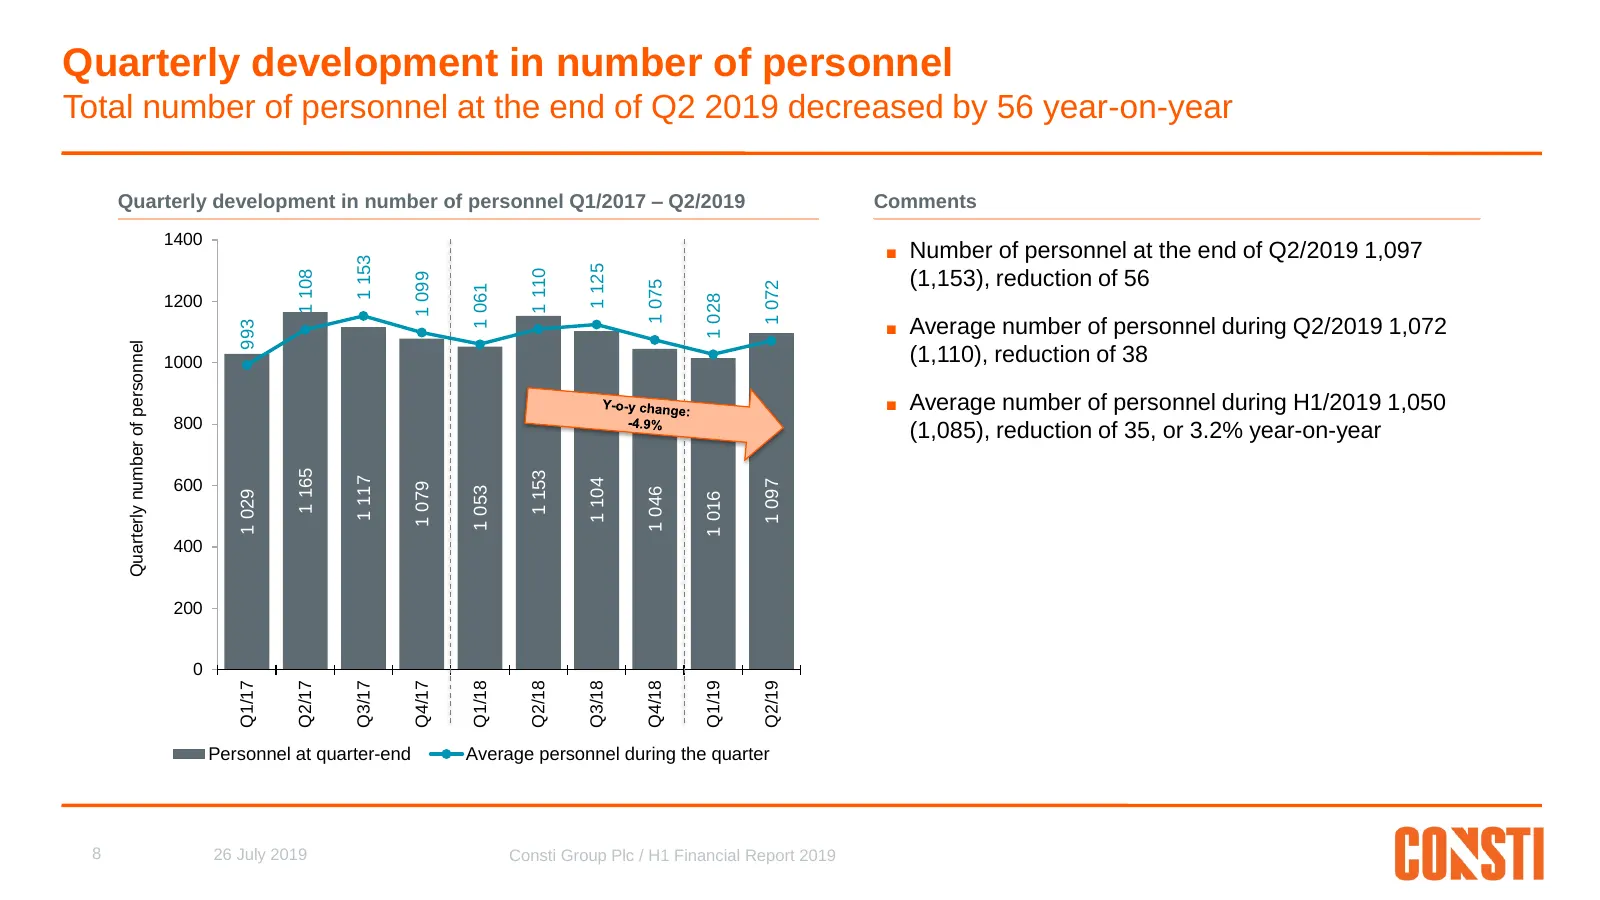
Quarterly development in number of personnel Total number of personnel at the end of Q2 2019 decreased by 56 year-on-year Quarterly development in number of personnel Q1/2017 – Q2/2019 Comments 1400 ■ Number of personnel at the end of Q2/2019 1,097 1 153 1 125 1 110 1 108 (1,153), reduction of 56 1
Slide 10: Quarterly order intake development
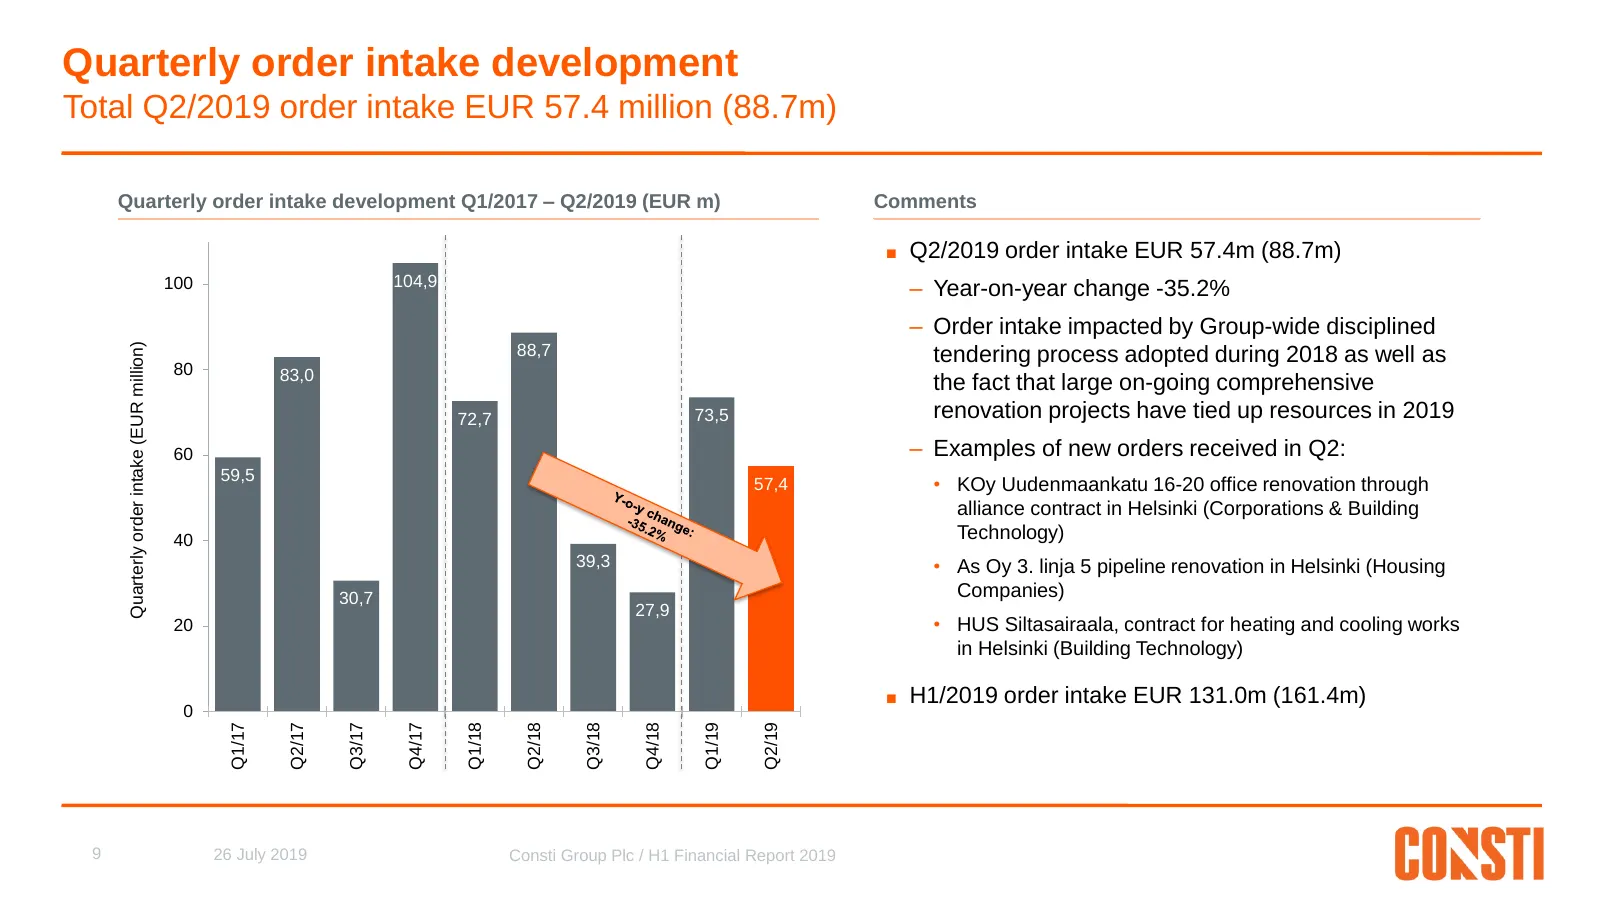
Quarterly order intake development Total Q2/2019 order intake EUR 57.4 million (88.7m) Quarterly order intake development Q1/2017 – Q2/2019 (EUR m) Comments ■ Q2/2019 order intake EUR 57.4m (88.7m) 104,9 100 – Year-on-year change -35.2% – Order intake impacted by Group-wide disciplined Quarterly ord
Slide 11: Quarterly order backlog development
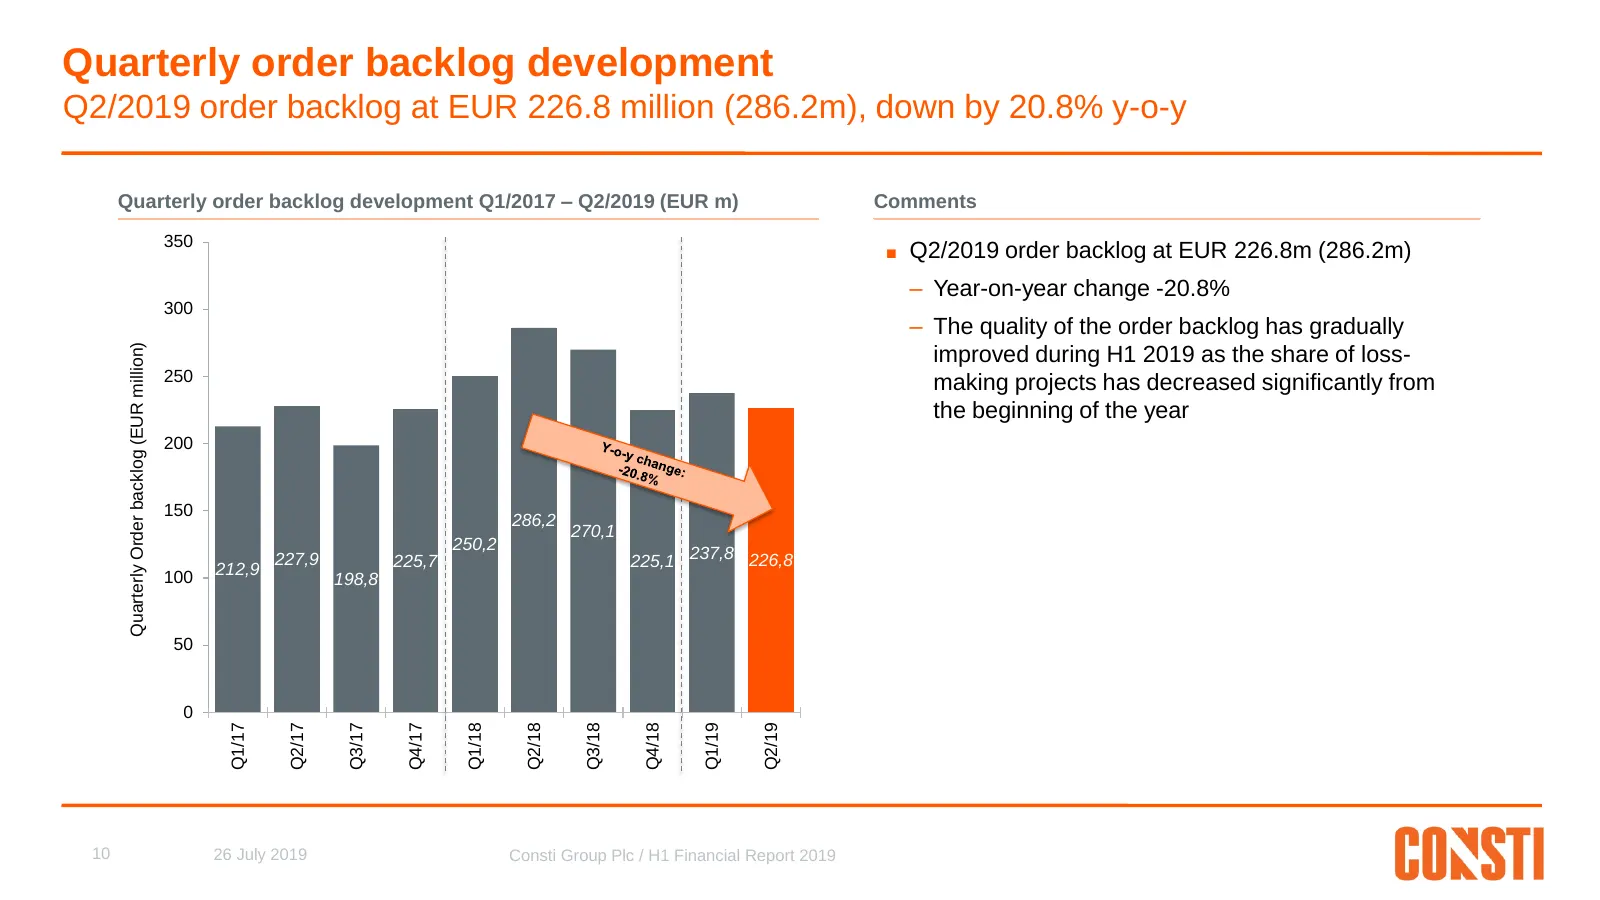
Quarterly order backlog development Q2/2019 order backlog at EUR 226.8 million (286.2m), down by 20.8% y-o-y Quarterly order backlog development Q1/2017 – Q2/2019 (EUR m) Comments 350 ■ Q2/2019 order backlog at EUR 226.8m (286.2m) – Year-on-year change -20.8% 300 – The quality of the order backlog h
Slide 12: Contents
CONTENTS 1. Highlights and Group performance 2. Cash flow and financial position 3. Market outlook, guidance and summary 4. Appendix 11 26 July 2019 Consti Group Plc / H1 Financial Report 2019
Slide 13: Quarterly free cash flow development
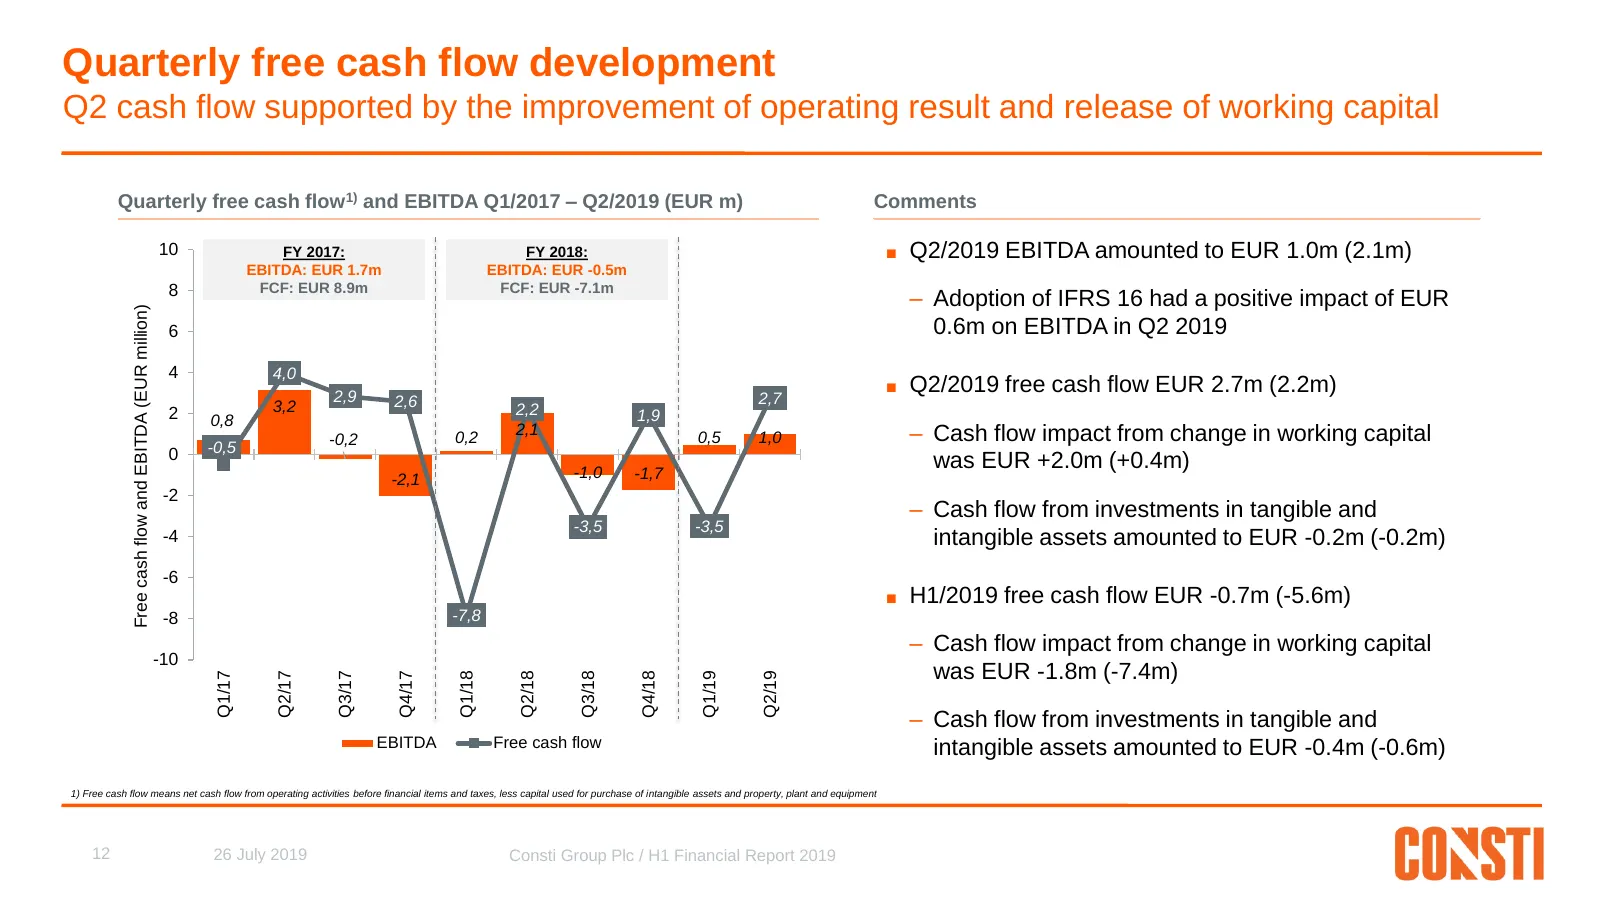
Quarterly free cash flow development Q2 cash flow supported by the improvement of operating result and release of working capital Quarterly free cash flow1) and EBITDA Q1/2017 – Q2/2019 (EUR m) Comments 10 FY 2017: FY 2018: ■ Q2/2019 EBITDA amounted to EUR 1.0m (2.1m) EBITDA: EUR 1.7m EBITDA: EUR -0
Slide 14: Quarterly net working capital development
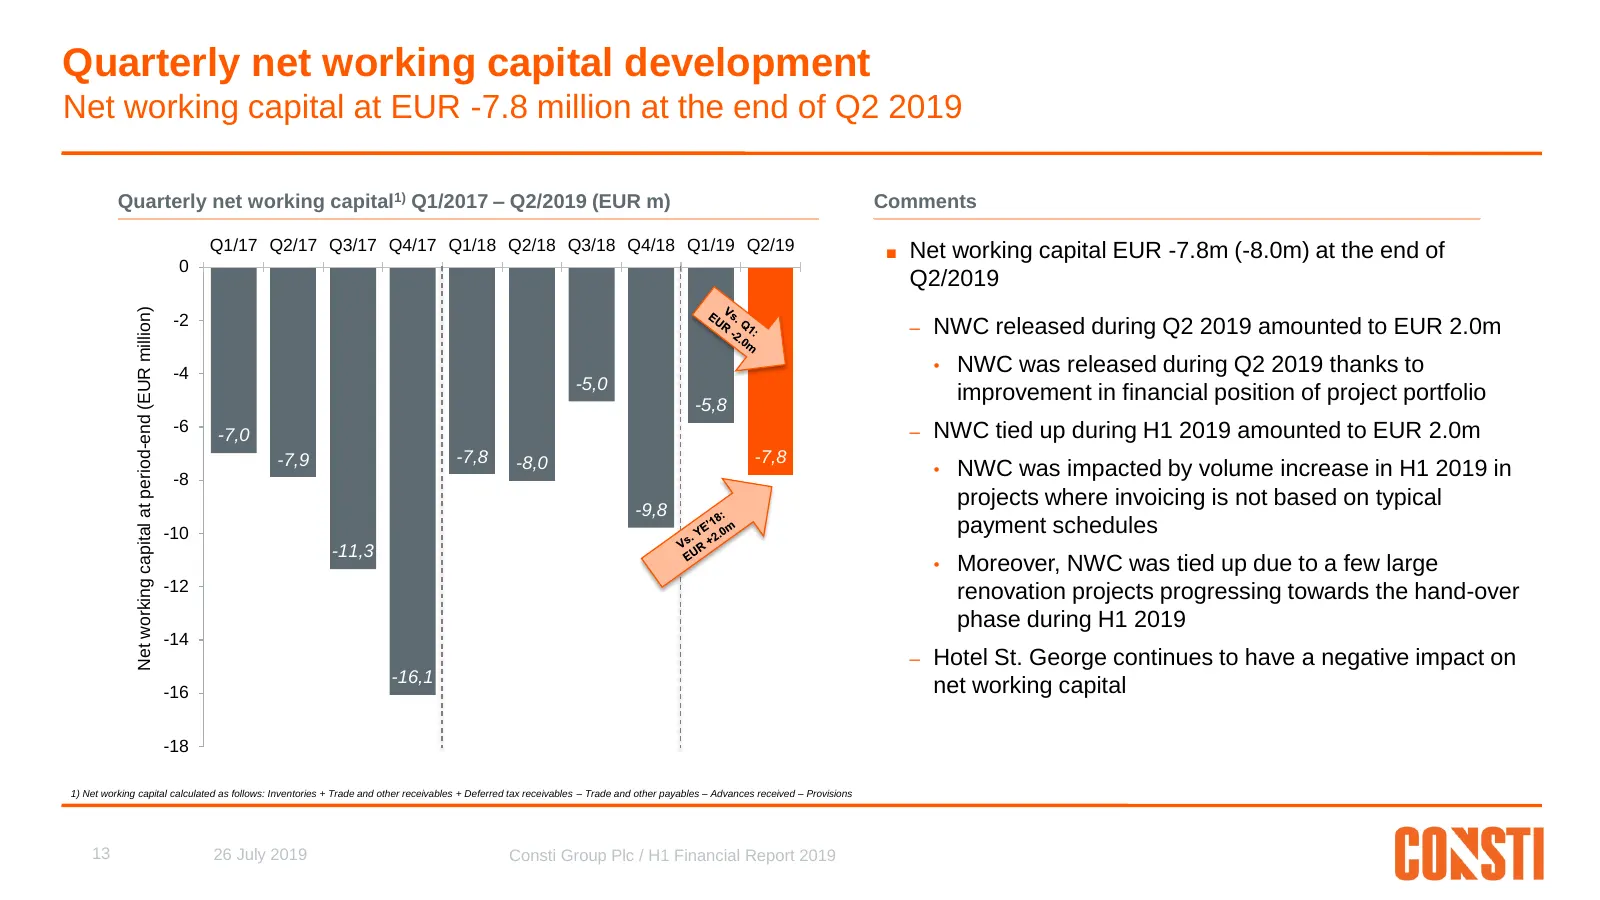
Quarterly net working capital development Net working capital at EUR -7.8 million at the end of Q2 2019 Quarterly net working capital1) Q1/2017 – Q2/2019 (EUR m) Comments Q1/17 Q2/17 Q3/17 Q4/17 Q1/18 Q2/18 Q3/18 Q4/18 Q1/19 Q2/19 ■ Net working capital EUR -7.8m (-8.0m) at the end of 0 Q2/2019 Net w
Slide 15: Quarterly balance sheet structure
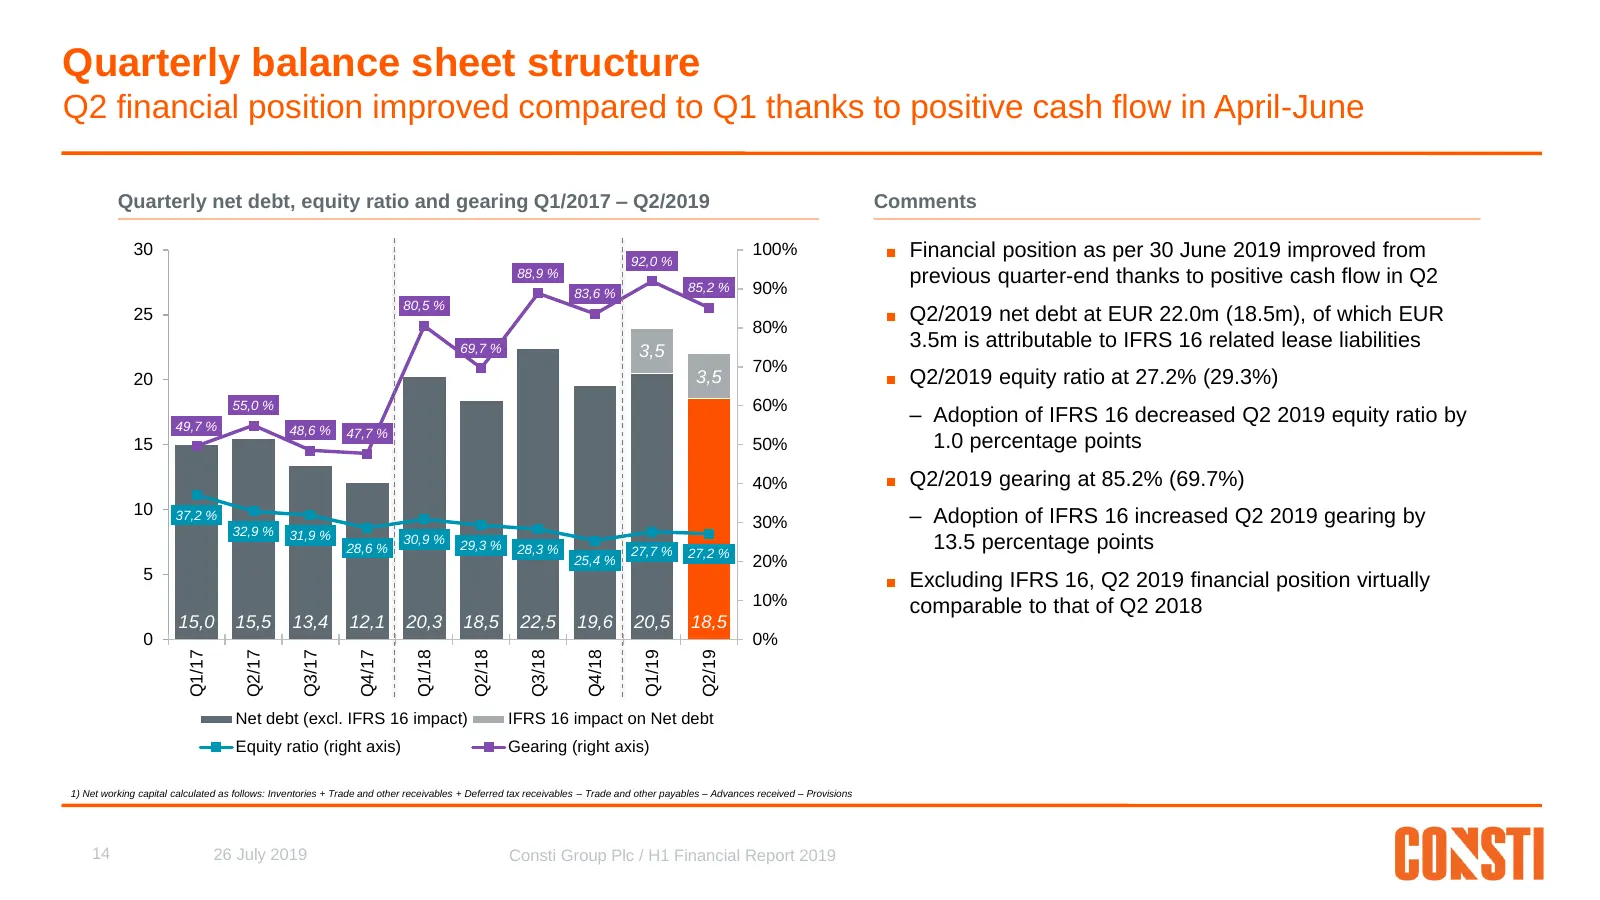
Quarterly balance sheet structure Q2 financial position improved compared to Q1 thanks to positive cash flow in April-June Quarterly net debt, equity ratio and gearing Q1/2017 – Q2/2019 Comments 30 100% ■ Financial position as per 30 June 2019 improved from 92,0 % 88,9 % previous quarter-end thanks
Slide 16: Contents
CONTENTS 1. Highlights and Group performance 2. Cash flow and financial position 3. Market outlook, guidance and summary 4. Appendix 15 26 July 2019 Consti Group Plc / H1 Financial Report 2019
Slide 17: Renovation market supported by a number of key structural growth drivers
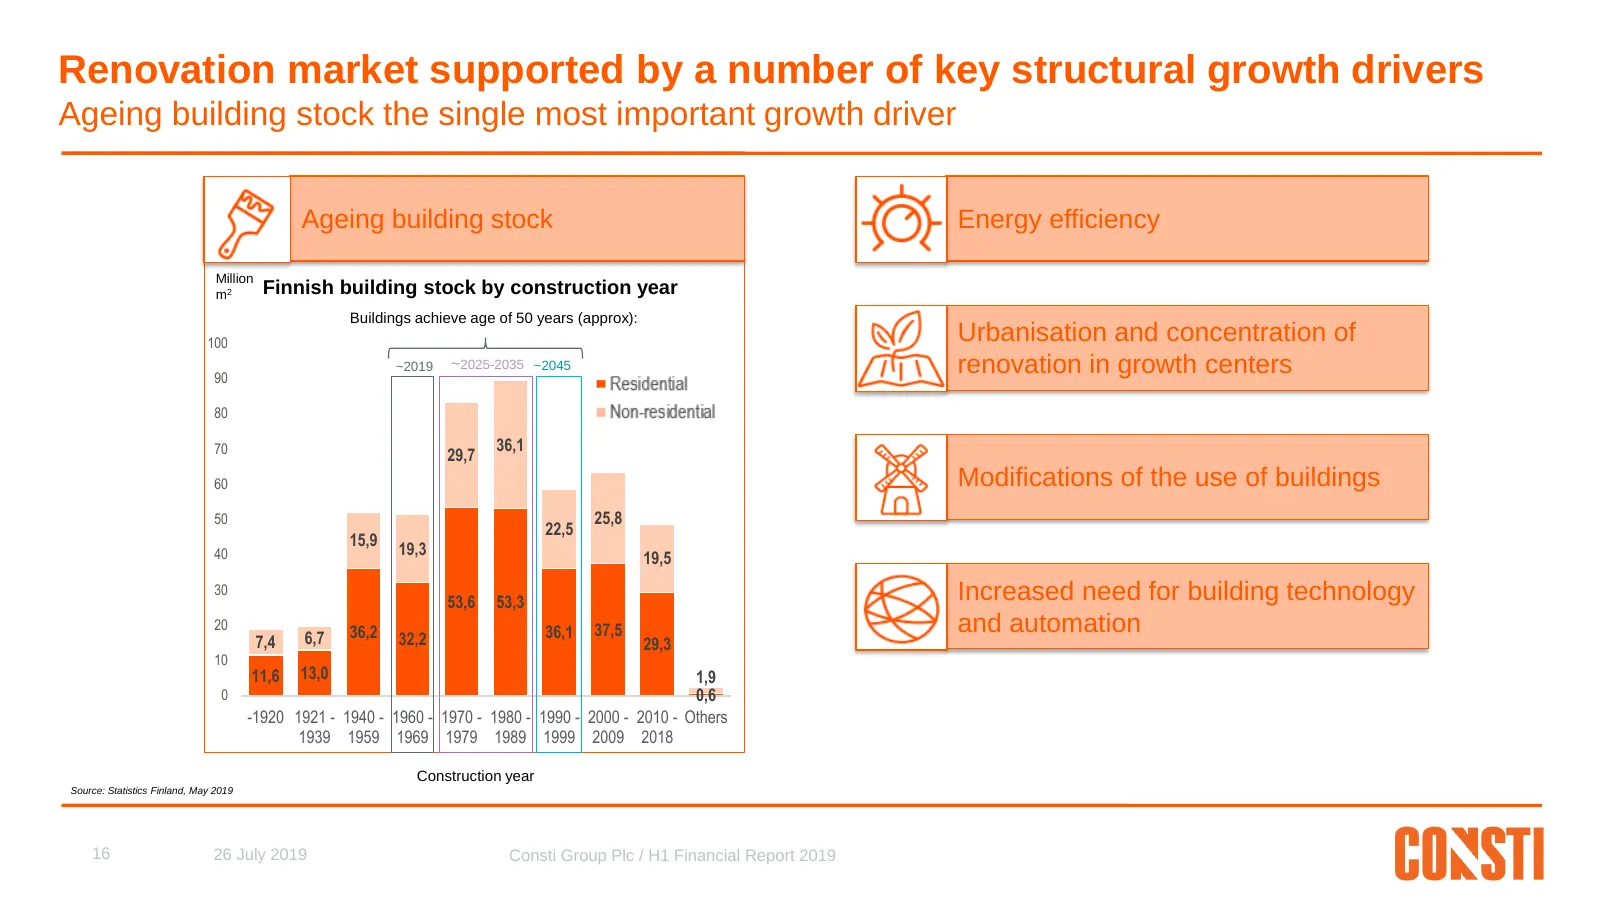
Renovation market supported by a number of key structural growth drivers Ageing building stock the single most important growth driver Ageing building stock Energy efficiency Million m2 Finnish building stock by construction year Buildings achieve age of 50 years (approx): 100 Urbanisation and conce
Slide 18: Construction confidence still strong in Finland but trend downwards
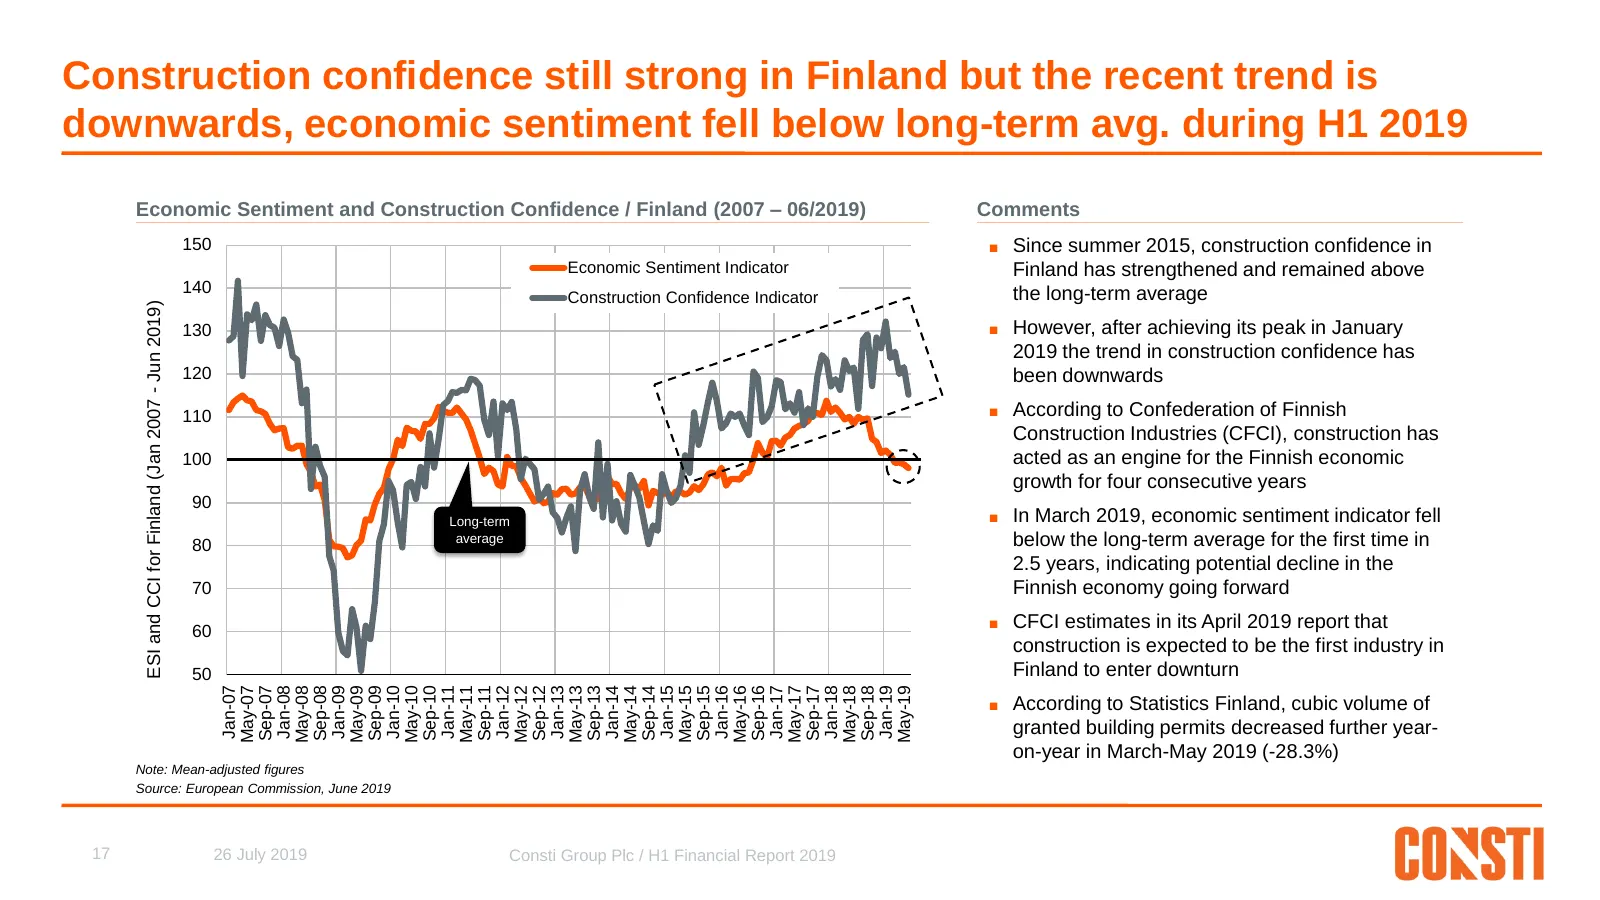
Construction confidence still strong in Finland but the recent trend is downwards, economic sentiment fell below long-term avg. during H1 2019 Economic Sentiment and Construction Confidence / Finland (2007 – 06/2019) Comments 150 ■ Since summer 2015, construction confidence in Economic Sentiment Ind
Slide 19: Stable growth in renovation expected to continue
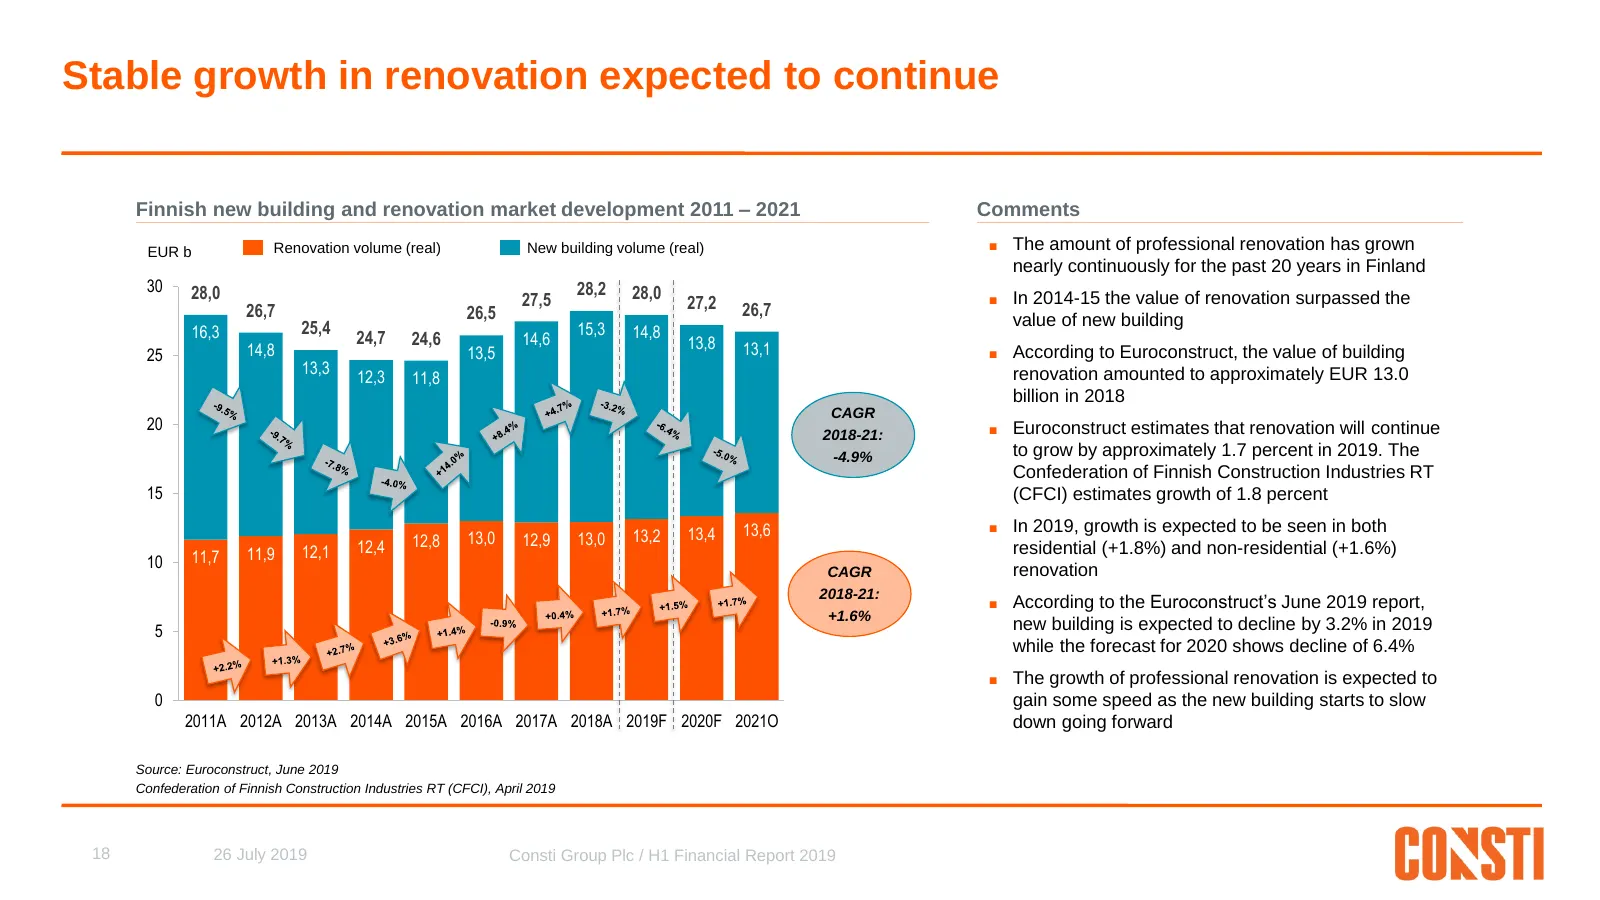
Stable growth in renovation expected to continue Finnish new building and renovation market development 2011 – 2021 Comments EUR b Renovation volume (real) New building volume (real) ■ The amount of professional renovation has grown nearly continuously for the past 20 years in Finland 30 28,0 28,2 2
Slide 20: Finnish renovation market highly fragmented
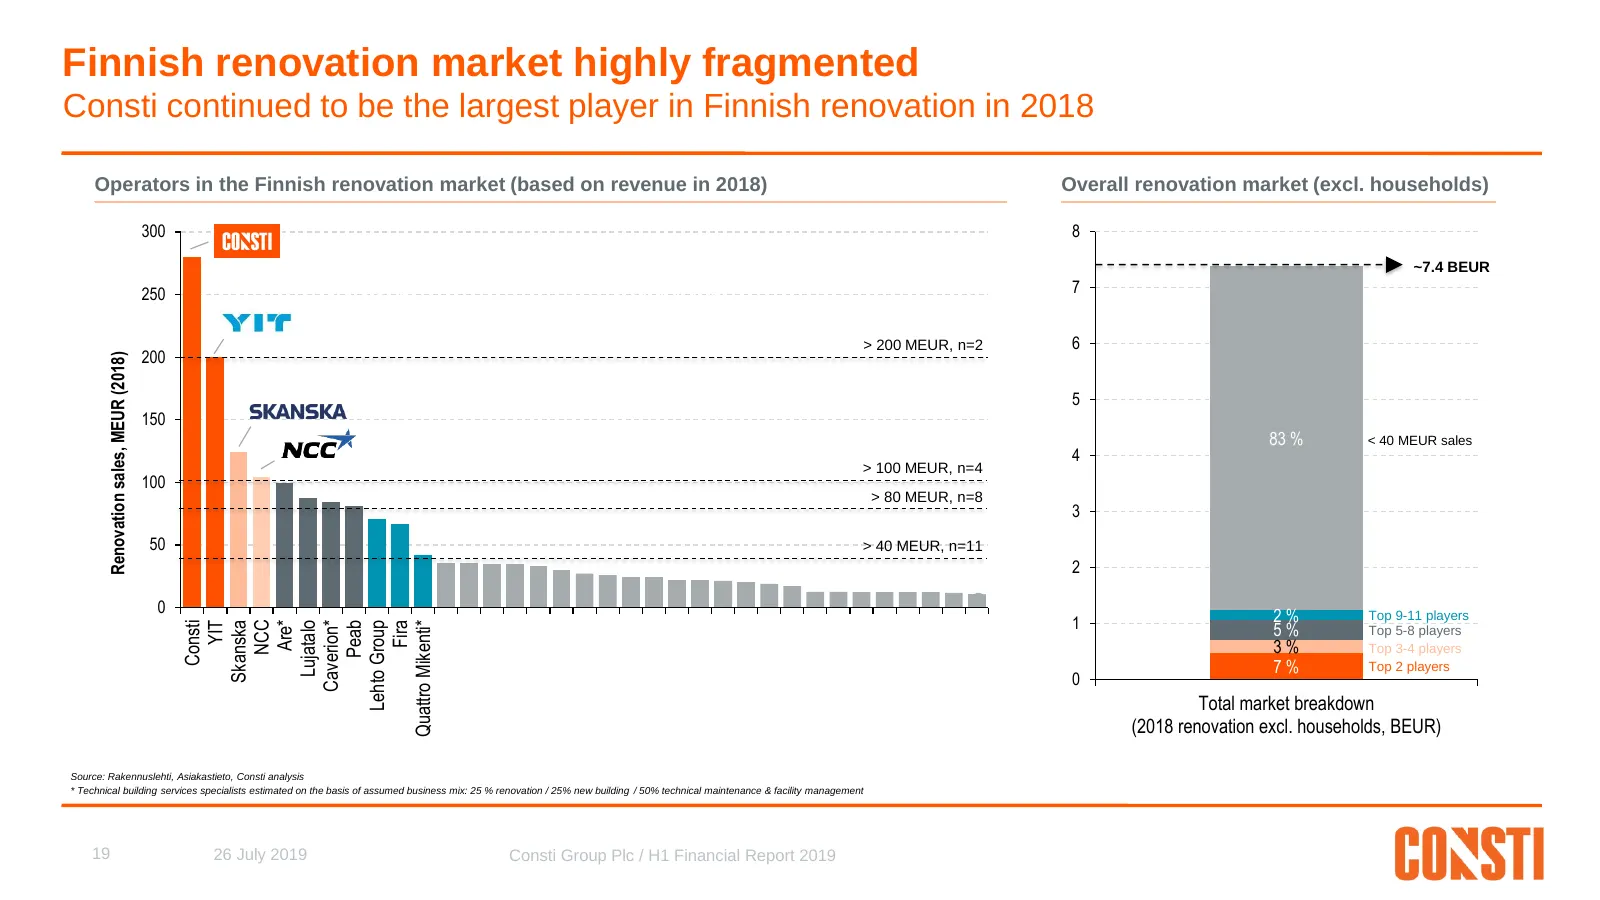
Finnish renovation market highly fragmented Consti continued to be the largest player in Finnish renovation in 2018 Operators in the Finnish renovation market (based on revenue in 2018) Overall renovation market (excl. households) 300 8 ~7.4 BEUR 250 7 EUR 145b EUR 130b EUR 45b EUR 40b > 200 MEUR, n
Slide 21: Outlook and guidance for 2019
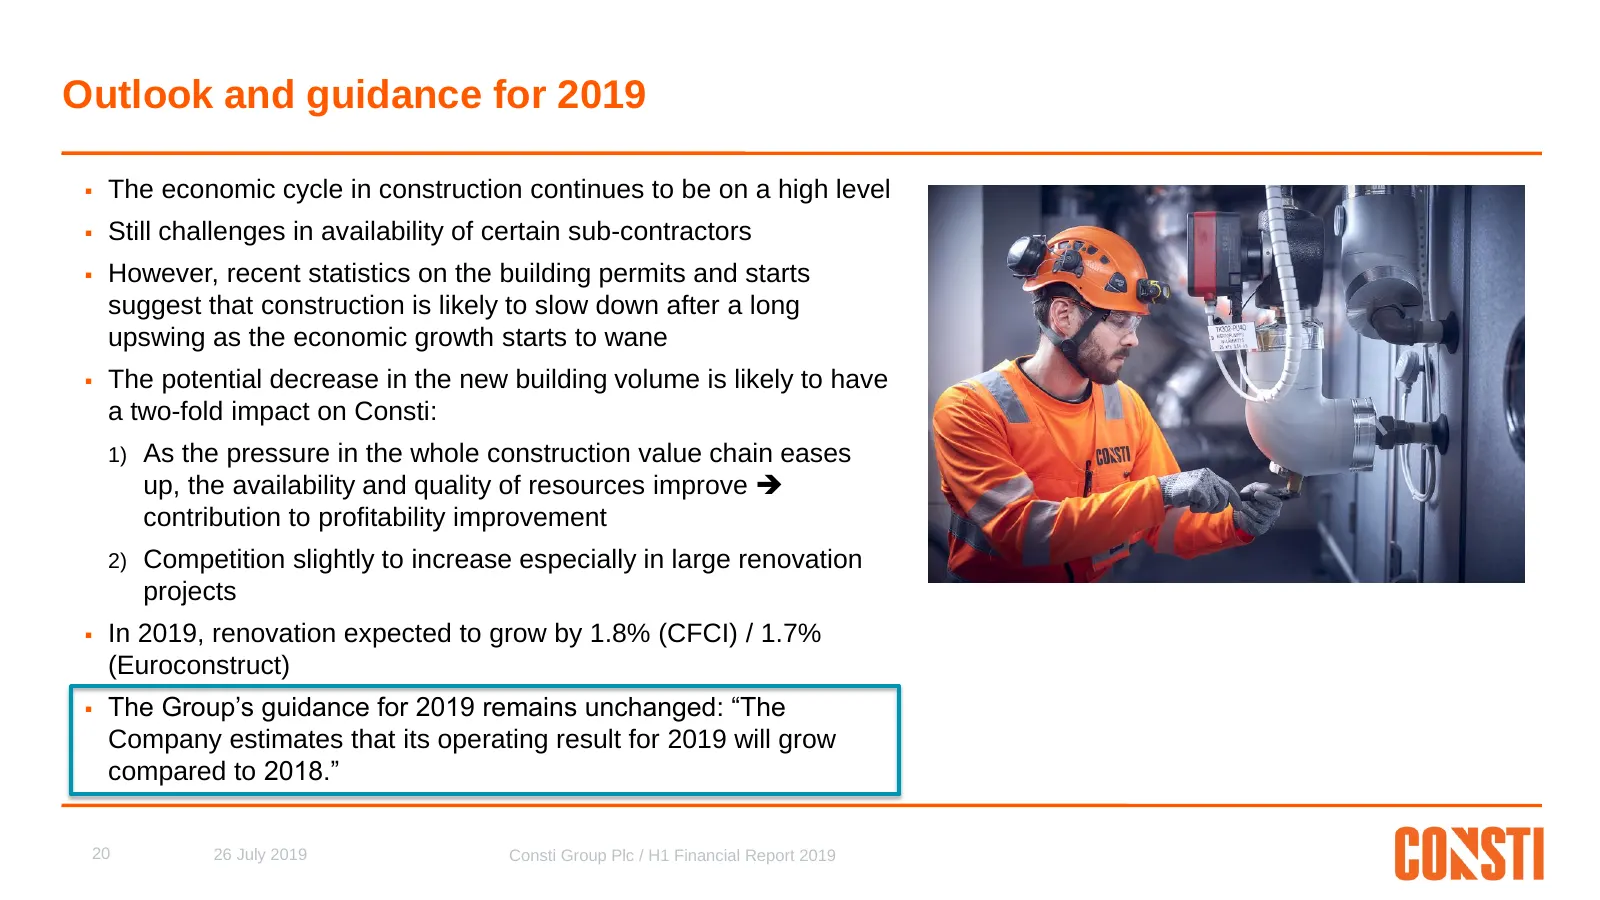
Outlook and guidance for 2019 The economic cycle in construction continues to be on a high level Still challenges in availability of certain sub-contractors However, recent statistics on the building permits and starts suggest that construction is likely to slow down after a long upswing as th
Slide 22: Summary
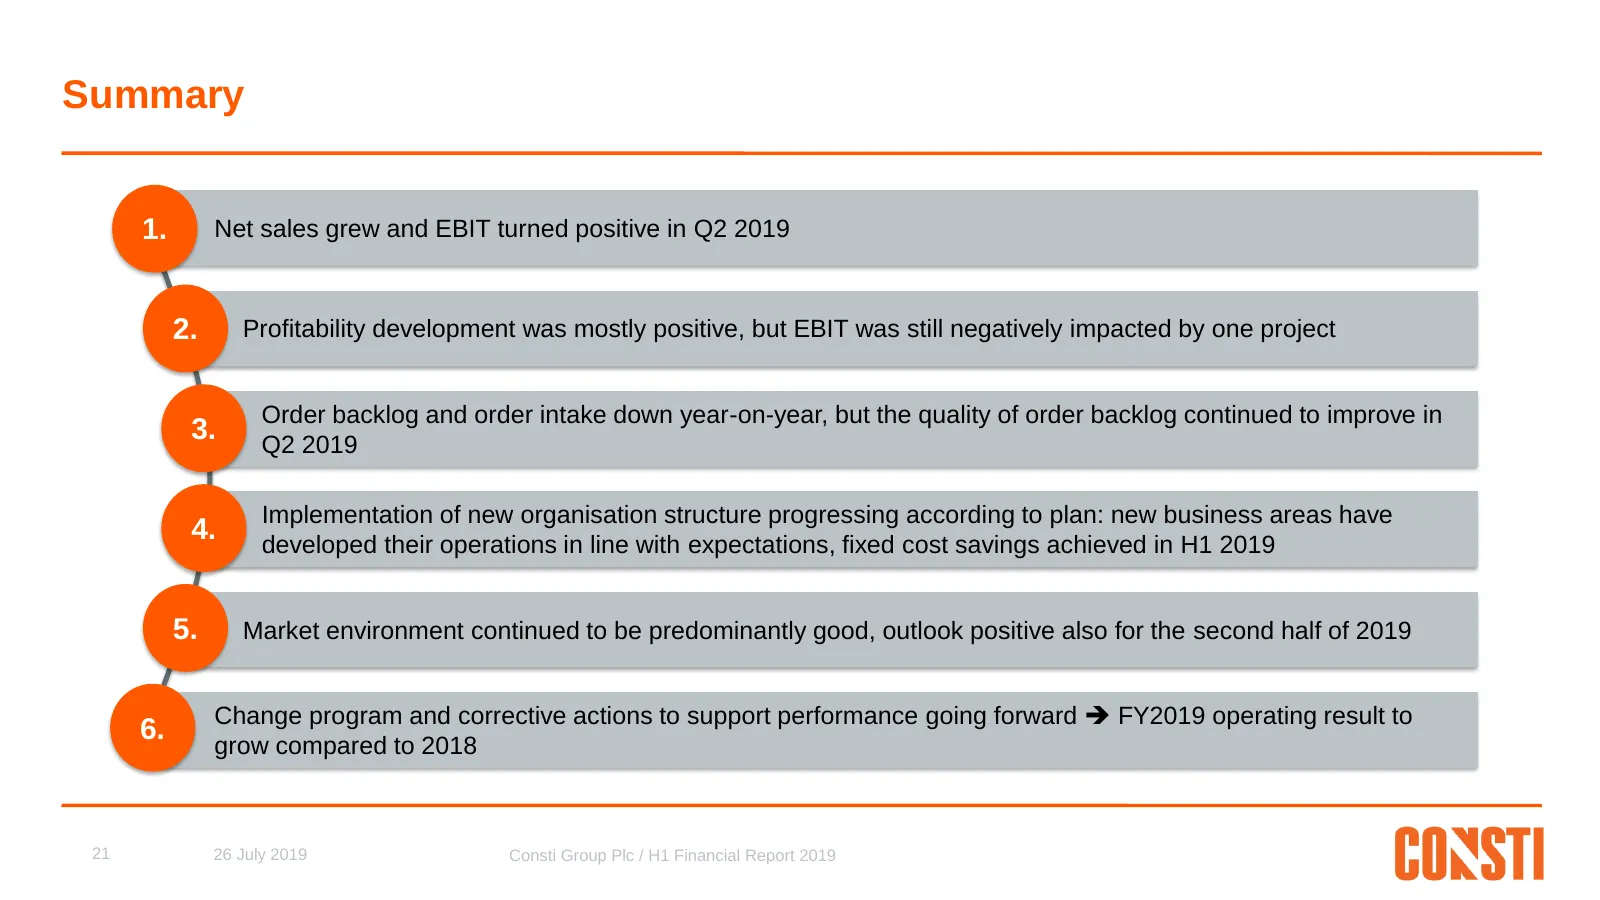
Summary 1. Net sales grew and EBIT turned positive in Q2 2019 2. Profitability development was mostly positive, but EBIT was still negatively impacted by one project Order backlog and order intake down year-on-year, but the quality of order backlog continued to improve in 3. Q2 2019 Implementation o
Slide 23: Contents
CONTENTS 1. Highlights and Group performance 2. Cash flow and financial position 3. Market outlook, guidance and summary 4. Appendix 22 26 July 2019 Consti Group Plc / H1 Financial Report 2019
Slide 24: March 2019 Debt Investor Presentation
23 March 2019 Debt Investor Presentation

Slide 25: Half-Year Financial Report Consti Group Plc
HALF-YEAR FINANCIAL REPORT 1-6/2019 CONSTI GROUP PLC H1 CONSTI GROUP PLC HOPEATIE 2 FI-00440, HELSINKI BUSINESS ID 2203605-05 WWW.CONSTI.FI 24 26 April 2019 Consti Group Plc / Interim Report 1-3/2019
Source: Internet Archive copy of investor.consti.fi
More decks from Consti Oyj
 Q3 2026 Earnings Presentation21 slides · Oct 23, 2026
 H1 2026 Earnings Presentation21 slides · Jul 17, 2026
 Q1 2026 Earnings Presentation21 slides · Apr 29, 2026
 Shareholder Meeting (April 2026)19 slides · Apr 9, 2026
 Investor Presentation (February 2026)26 slides · Feb 25, 2026
 FY2025 Earnings Presentation23 slides · Feb 6, 2026