Owens Corning Inc · NYSE:OC
Owens Corning — Q1 2026 Earnings Presentation
22 slides from Owens Corning's earnings presentation, May 6, 2026
Slide 1: First-Quarter 2026 Results
FIRST-QUARTER 2026 RESULTS Brian Chambers | Chair & Chief Executive Officer Todd Fister | Chief Financial & Operating Officer May 6, 2026 | Q1 2026
Slide 2: Forward-Looking Statements and Non-GAAP Measures
FORWARD-LOOKING STATEMENTS AND NON-GAAP MEASURES This presentation and the associated remarks contain forward-looking statements. We caution you against relying on these statements as they are subject to risks, uncertainties and other factors and actual results may differ materially from those resul
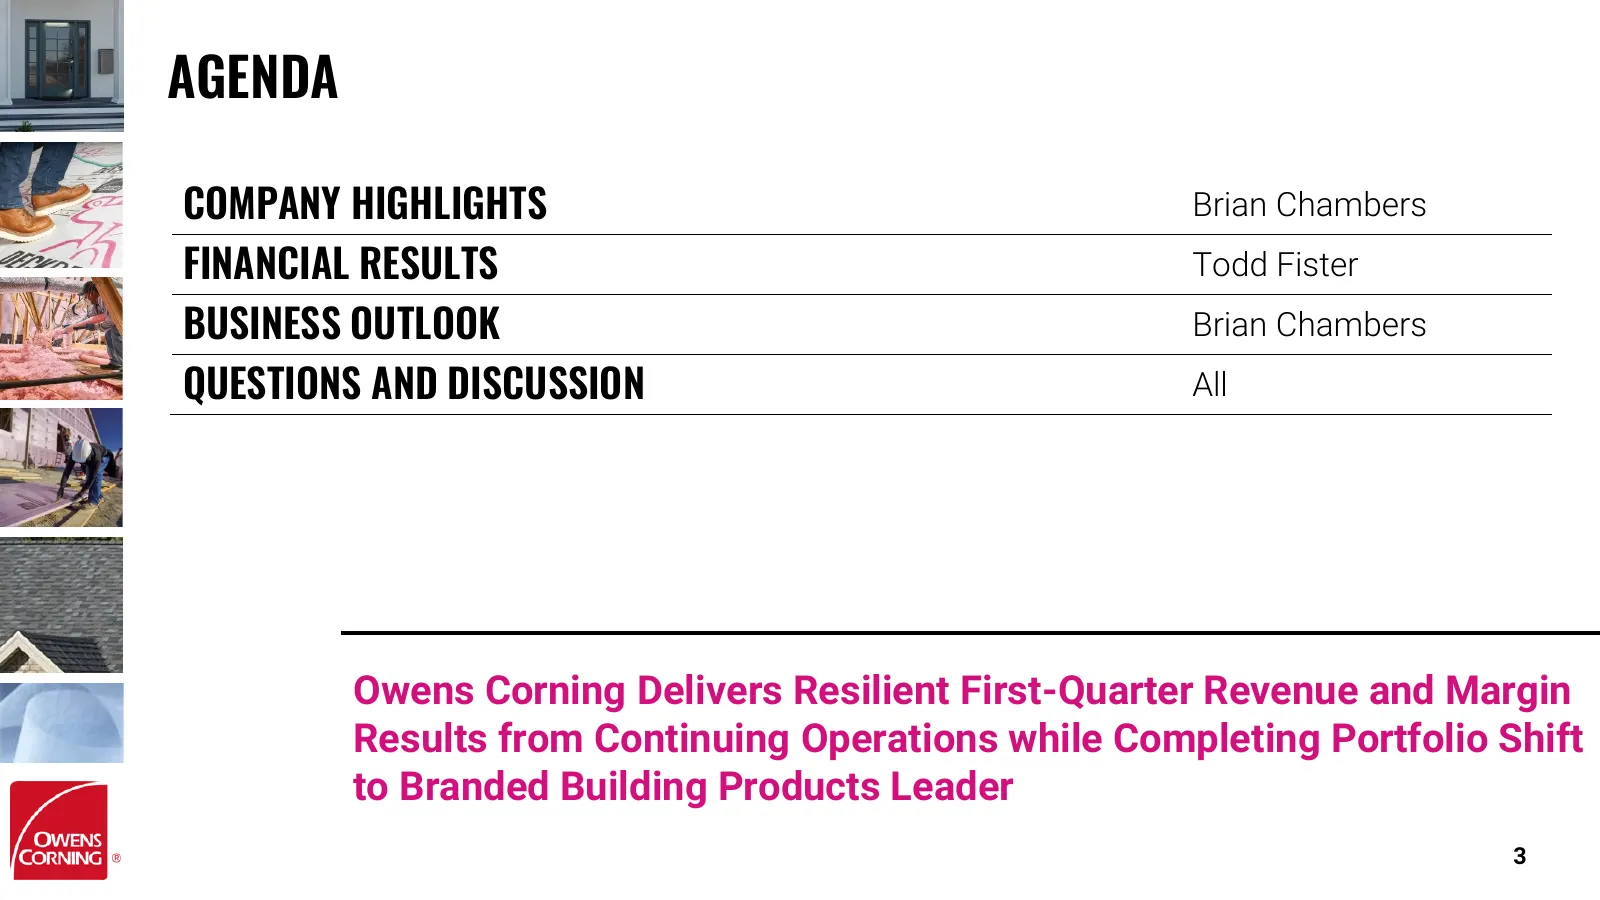
Slide 3: Agenda
AGENDA COMPANY HIGHLIGHTS Brian Chambers FINANCIAL RESULTS Todd Fister BUSINESS OUTLOOK Brian Chambers QUESTIONS AND DISCUSSION All Owens Corning Delivers Resilient First-Quarter Revenue and Margin Results from Continuing Operations while Completing Portfolio Shift to Branded Building Products Leade
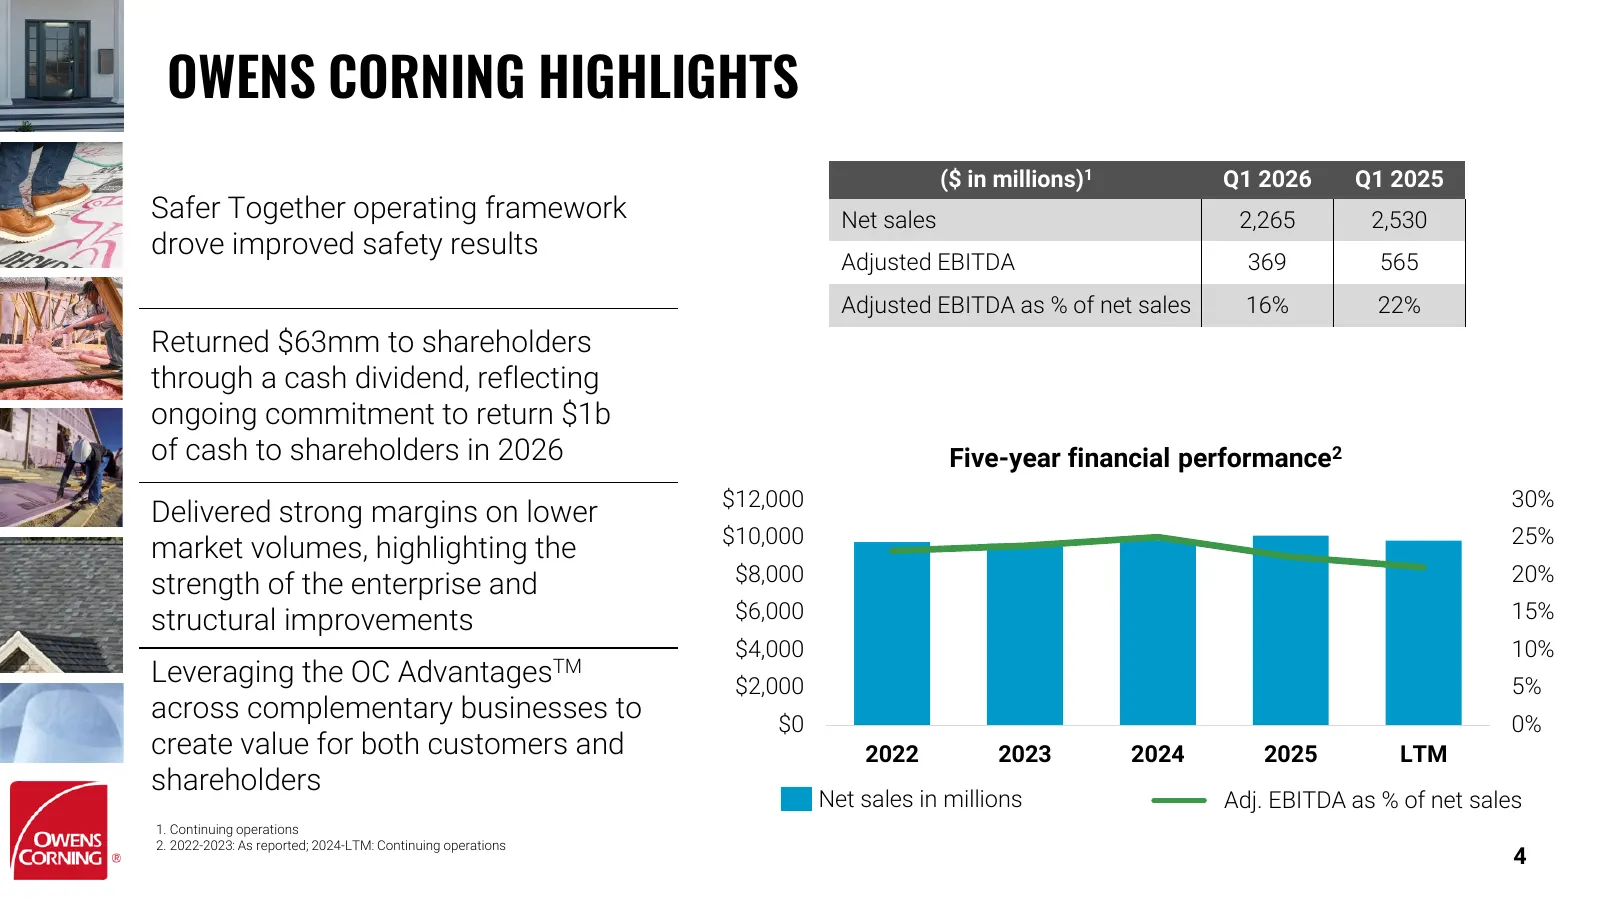
Slide 4: Owens Corning Highlights
OWENS CORNING HIGHLIGHTS ($ in millions)1 Q1 2026 Q1 2025 Safer Together operating framework Net sales 2,265 2,530 drove improved safety results Adjusted EBITDA 369 565 Adjusted EBITDA as % of net sales 16% 22% Returned $63mm to shareholders through a cash dividend, reflecting ongoing commitment to
Slide 5: Financial Summary
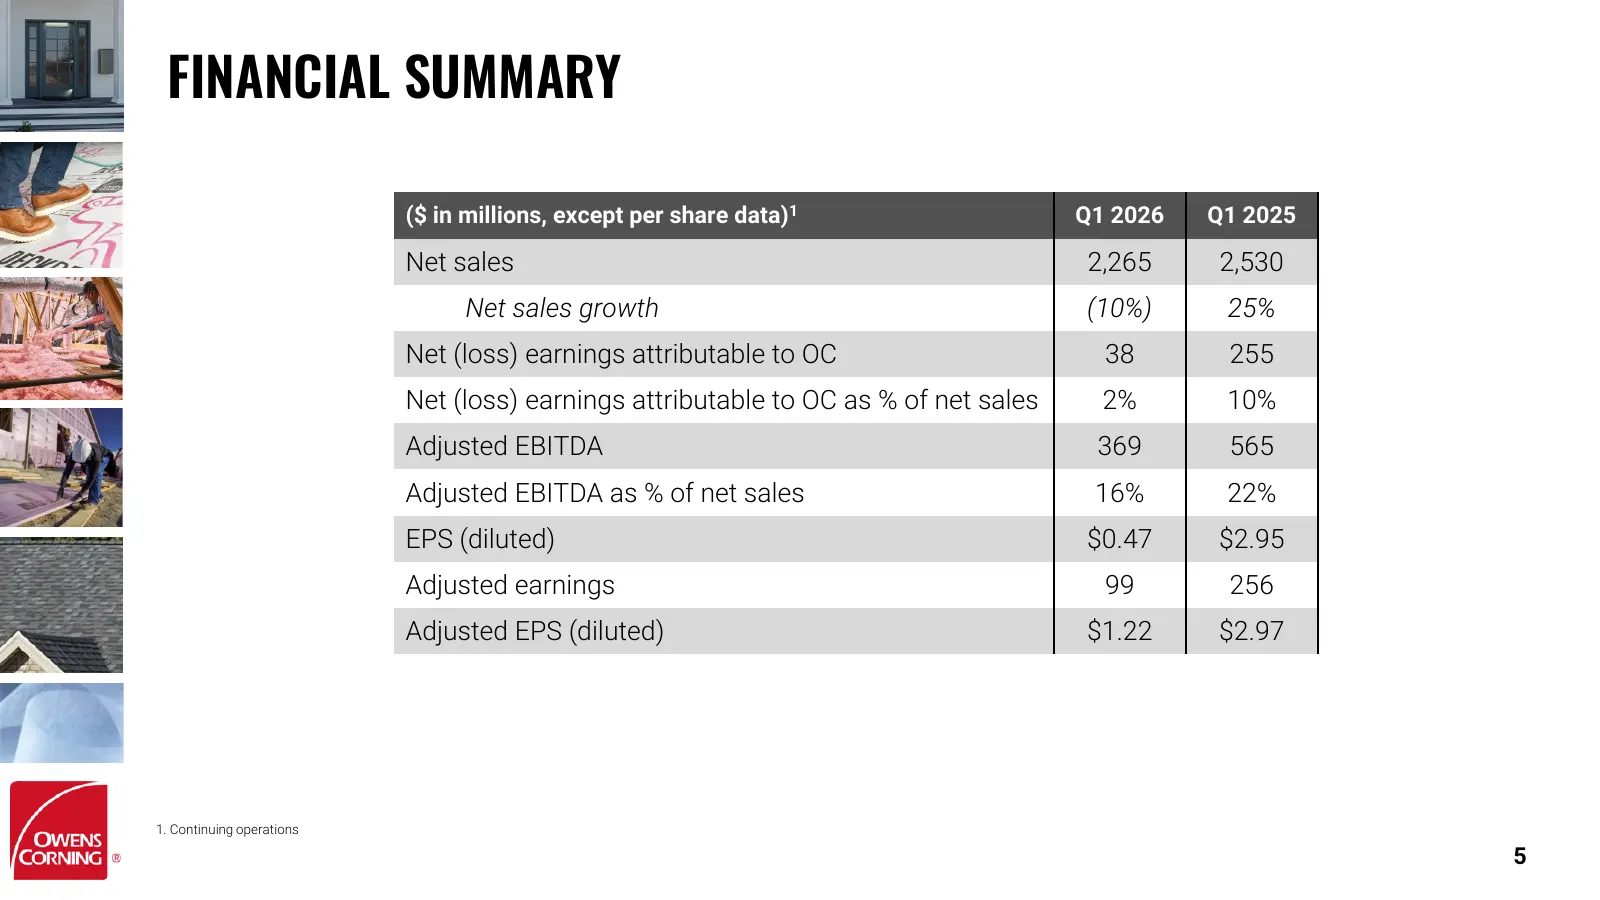
FINANCIAL SUMMARY ($ in millions, except per share data)1 Q1 2026 Q1 2025 Net sales 2,265 2,530 Net sales growth (10%) 25% Net (loss) earnings attributable to OC 38 255 Net (loss) earnings attributable to OC as % of net sales 2% 10% Adjusted EBITDA 369 565 Adjusted EBITDA as % of net sales 16% 22% E
Slide 6: Balance Sheet and Capital Deployment
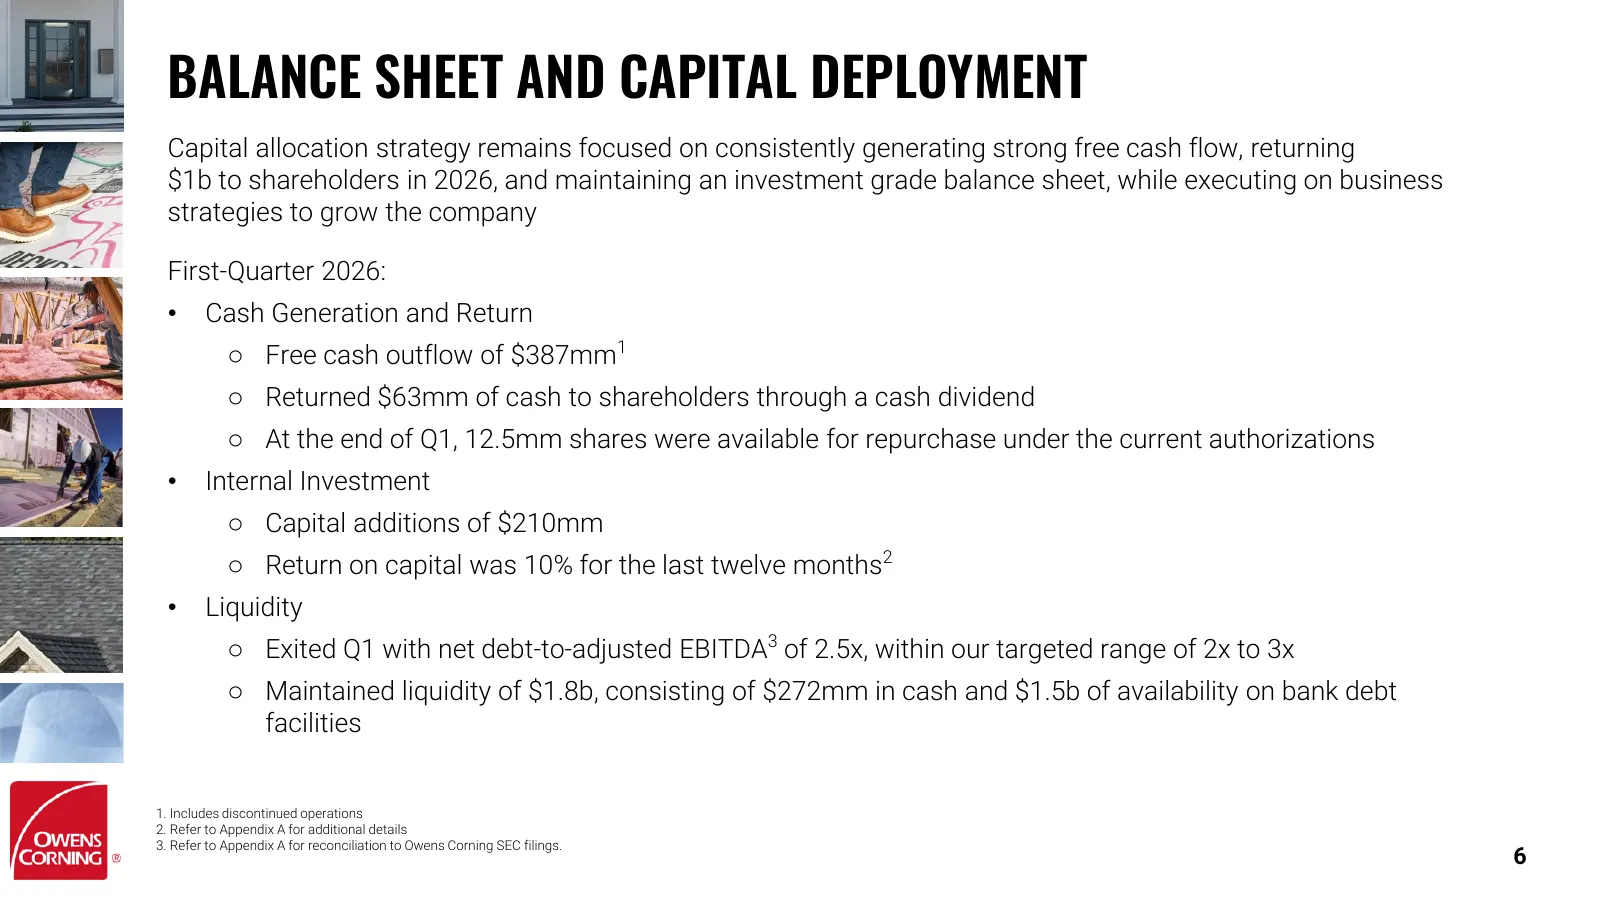
BALANCE SHEET AND CAPITAL DEPLOYMENT Capital allocation strategy remains focused on consistently generating strong free cash flow, returning $1b to shareholders in 2026, and maintaining an investment grade balance sheet, while executing on business strategies to grow the company First-Quarter 2026:
Slide 7: Roofing Business
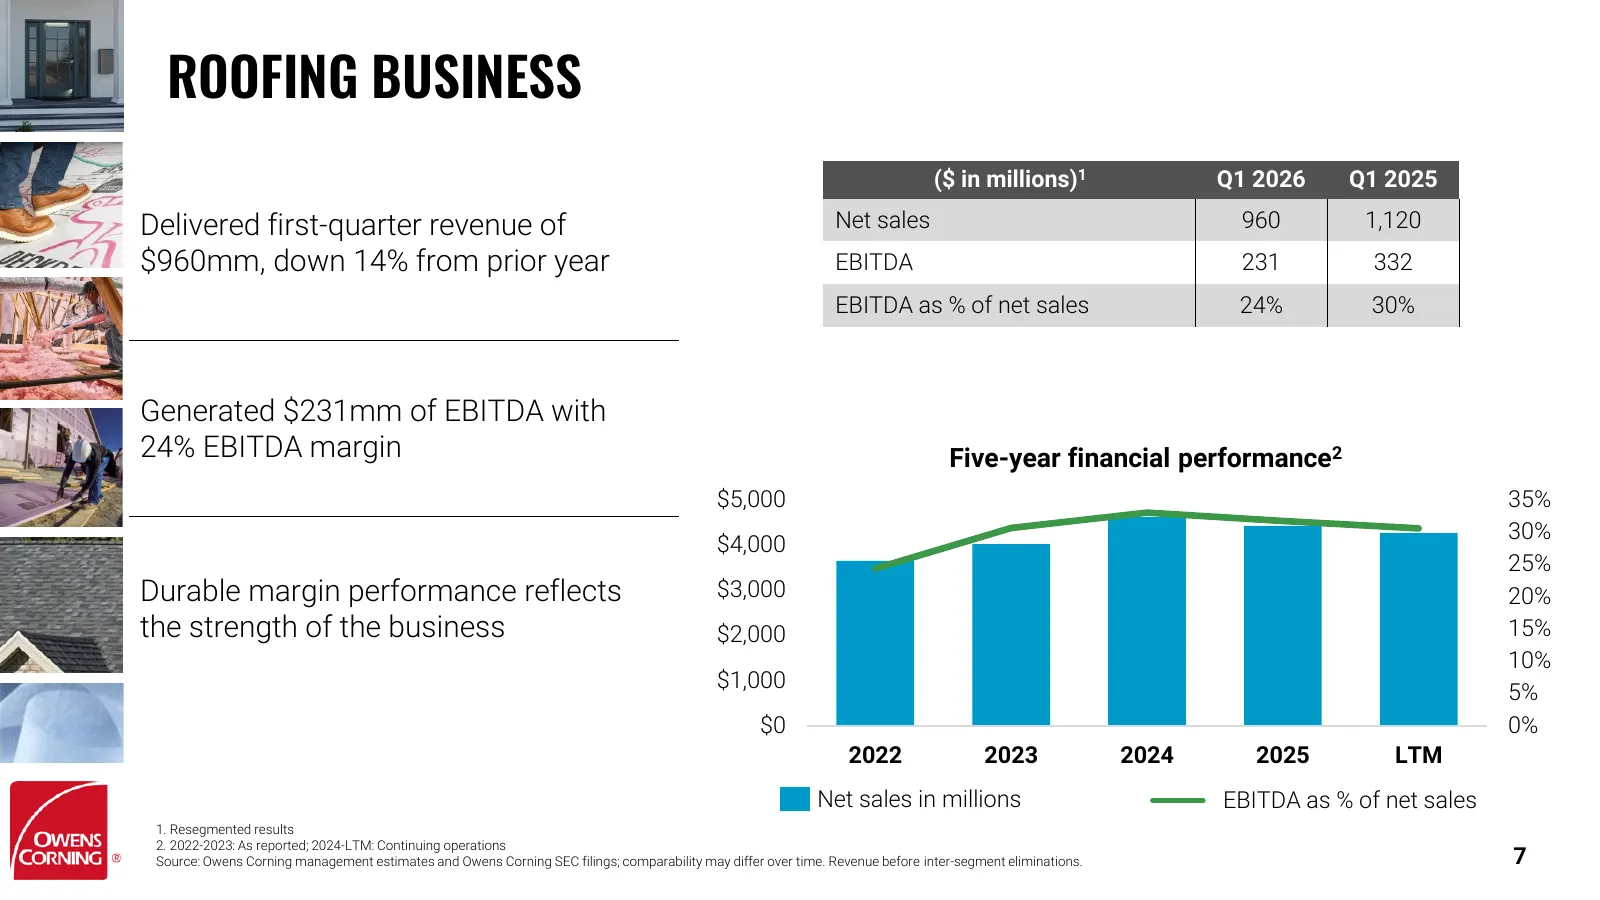
ROOFING BUSINESS ($ in millions)1 Q1 2026 Q1 2025 Delivered first-quarter revenue of Net sales 960 1,120 $960mm, down 14% from prior year EBITDA 231 332 EBITDA as % of net sales 24% 30% Generated $231mm of EBITDA with 24% EBITDA margin Five-year financial performance2 $5,000 35% 30% $4,000 25% Durab
Slide 8: Insulation Business
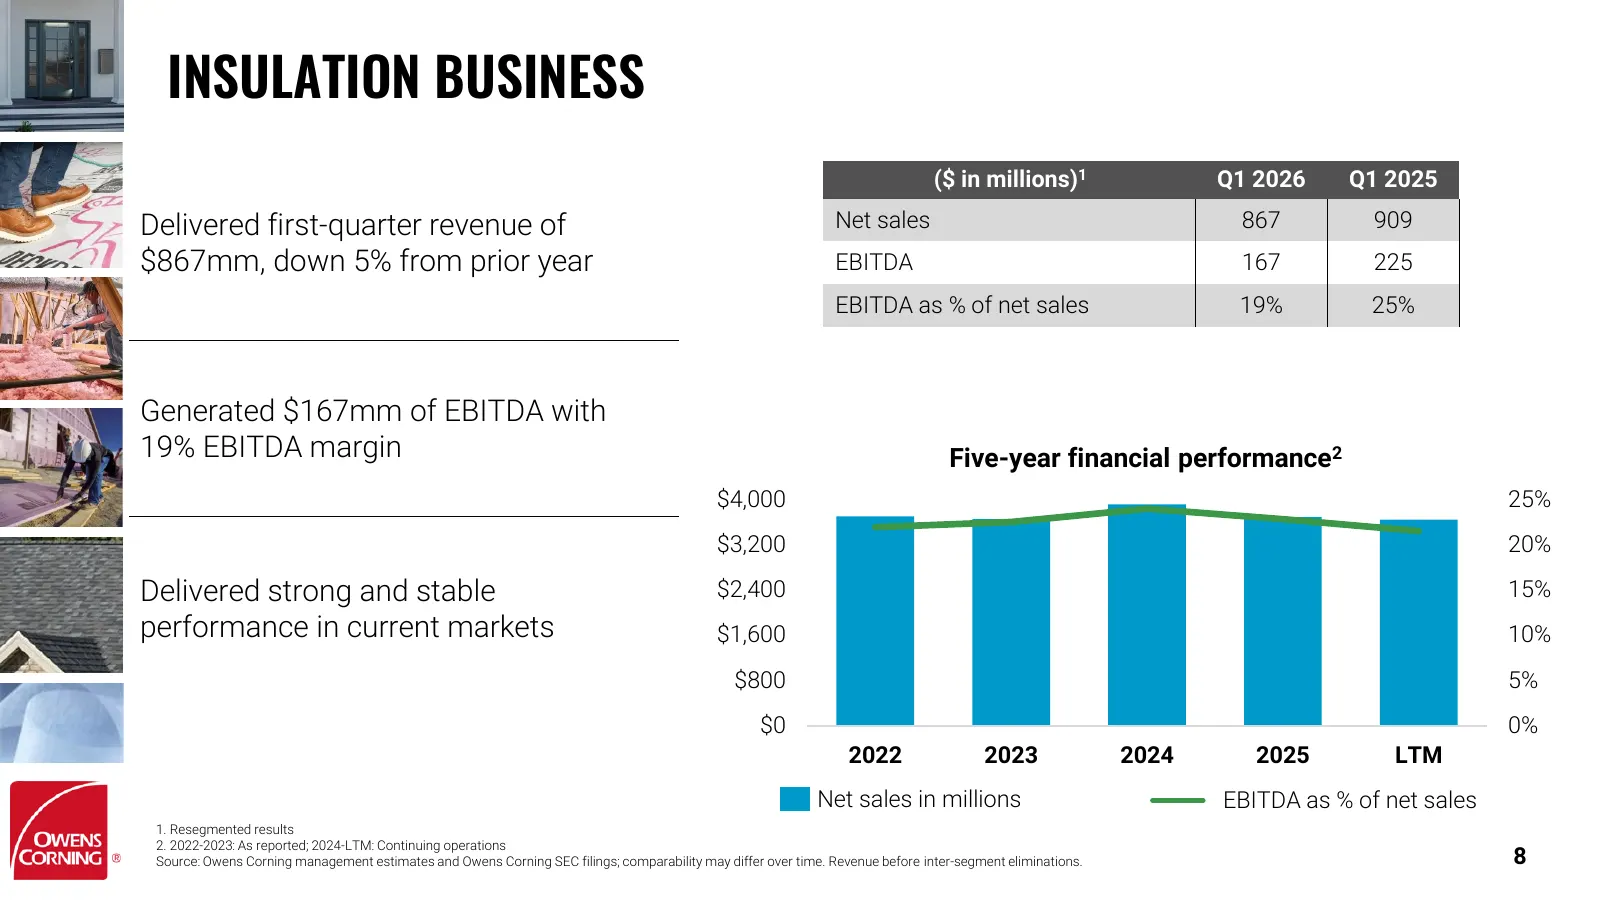
INSULATION BUSINESS ($ in millions)1 Q1 2026 Q1 2025 Delivered first-quarter revenue of Net sales 867 909 $867mm, down 5% from prior year EBITDA 167 225 EBITDA as % of net sales 19% 25% Generated $167mm of EBITDA with 19% EBITDA margin Five-year financial performance2 $4,000 25% $3,200 20% Delivered
Slide 9: Doors Business
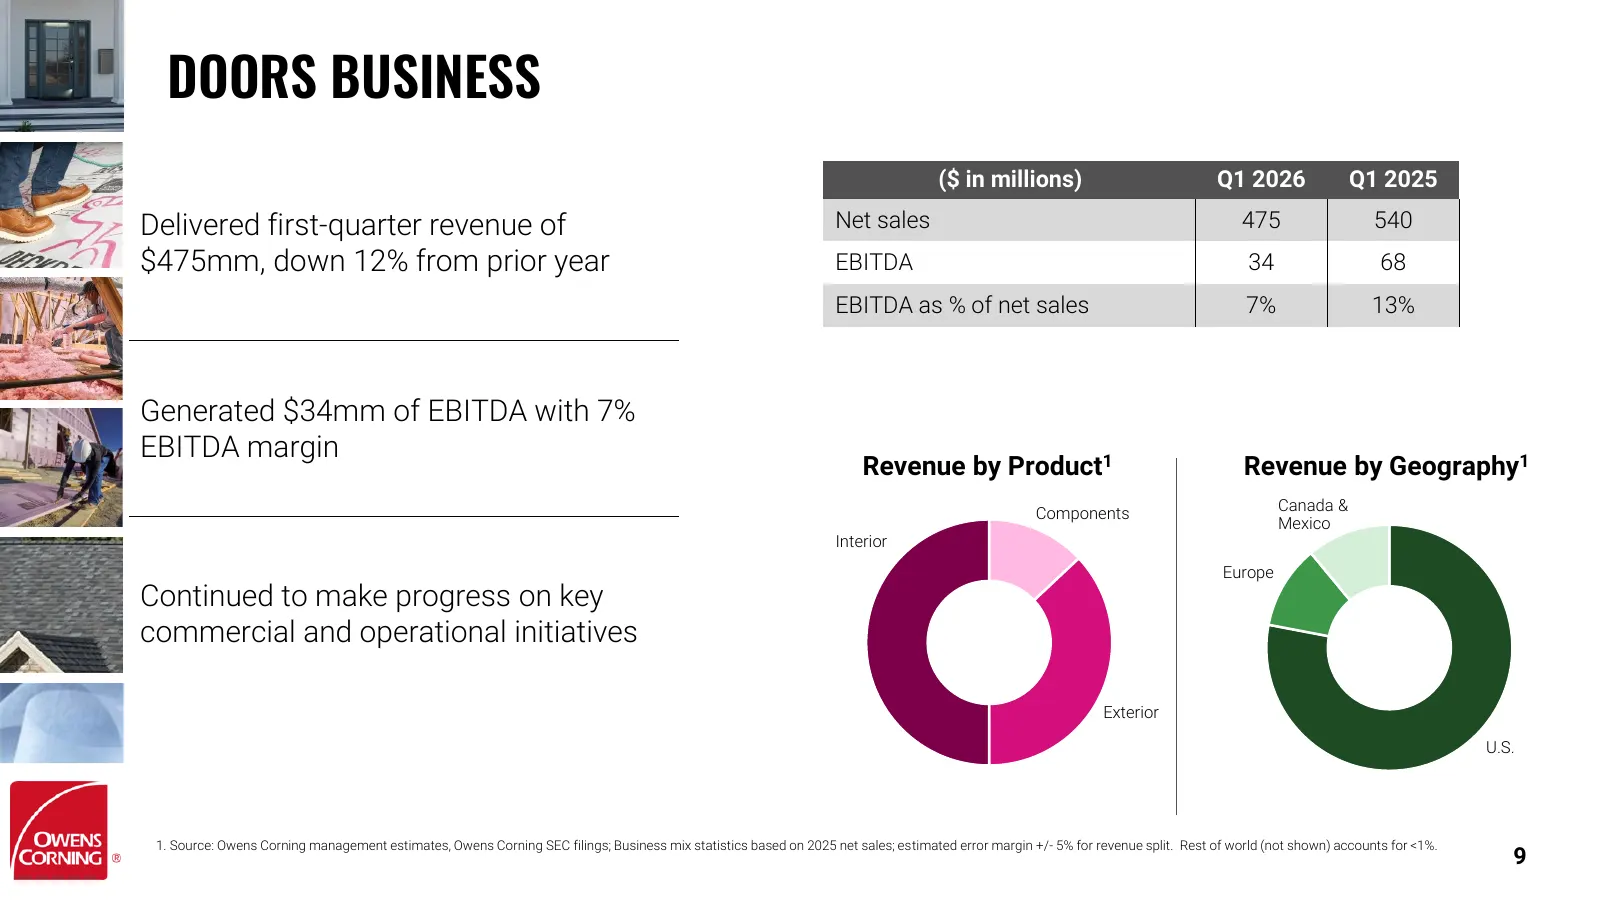
DOORS BUSINESS ($ in millions) Q1 2026 Q1 2025 Delivered first-quarter revenue of Net sales 475 540 $475mm, down 12% from prior year EBITDA 34 68 EBITDA as % of net sales 7% 13% Generated $34mm of EBITDA with 7% EBITDA margin Revenue by Product1 Revenue by Geography1 Components Canada & Mexico Inter
Slide 10: Full-Year 2026 Key Financial Outlook
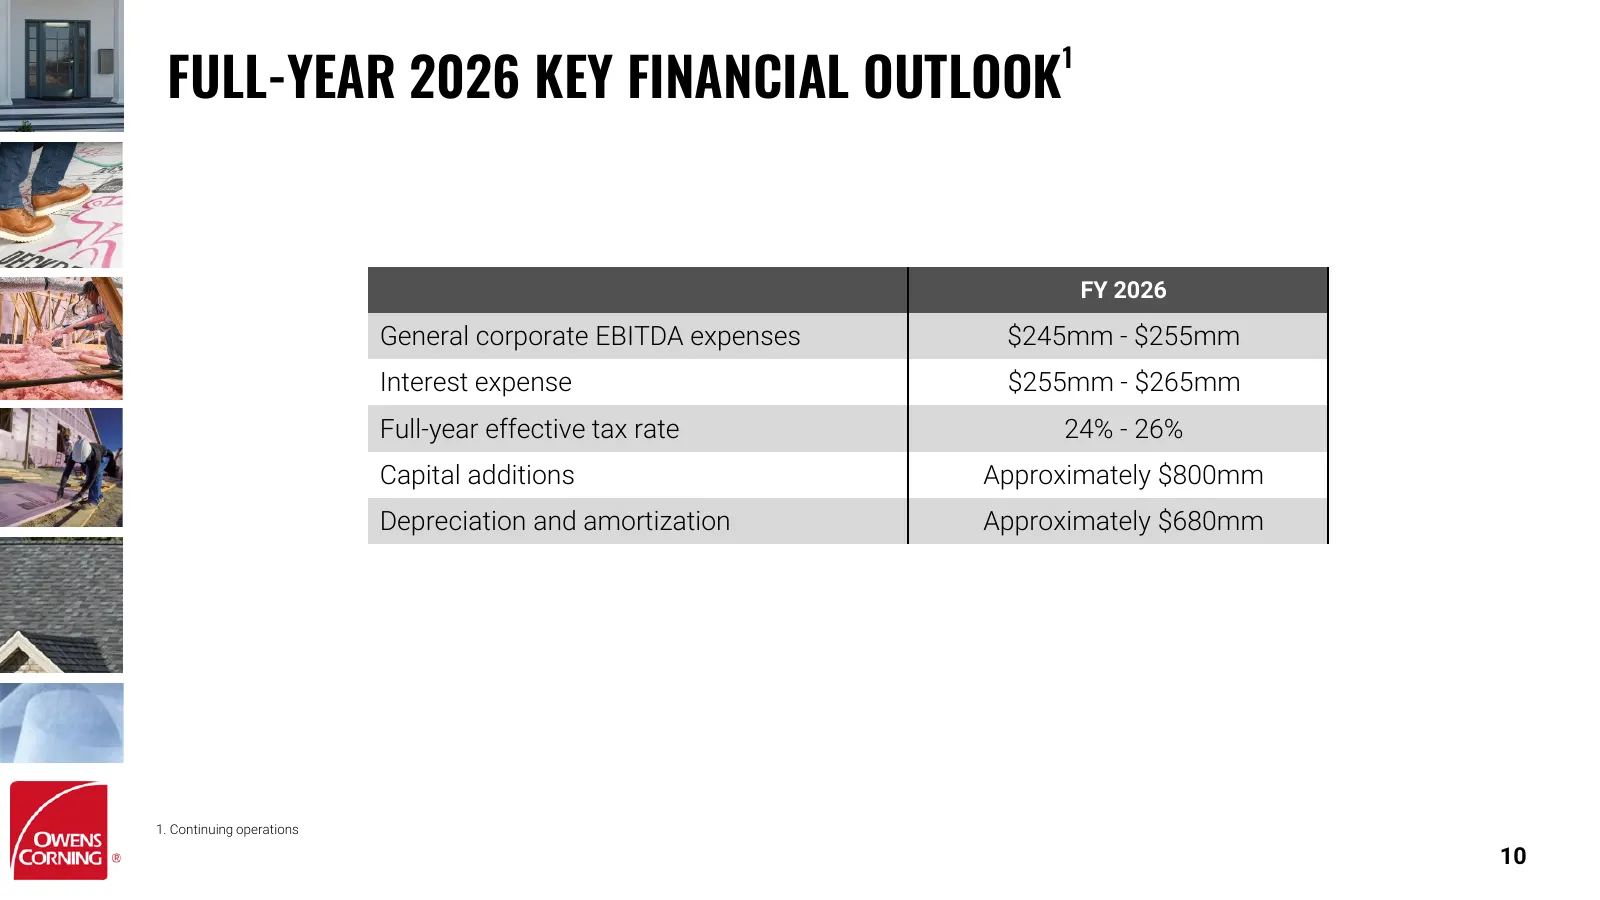
FULL-YEAR 2026 KEY FINANCIAL OUTLOOK 1 FY 2026 General corporate EBITDA expenses $245mm - $255mm Interest expense $255mm - $265mm Full-year effective tax rate 24% - 26% Capital additions Approximately $800mm Depreciation and amortization Approximately $680mm 1. Continuing operations 10
Slide 11: Q2 2026 Business Outlook
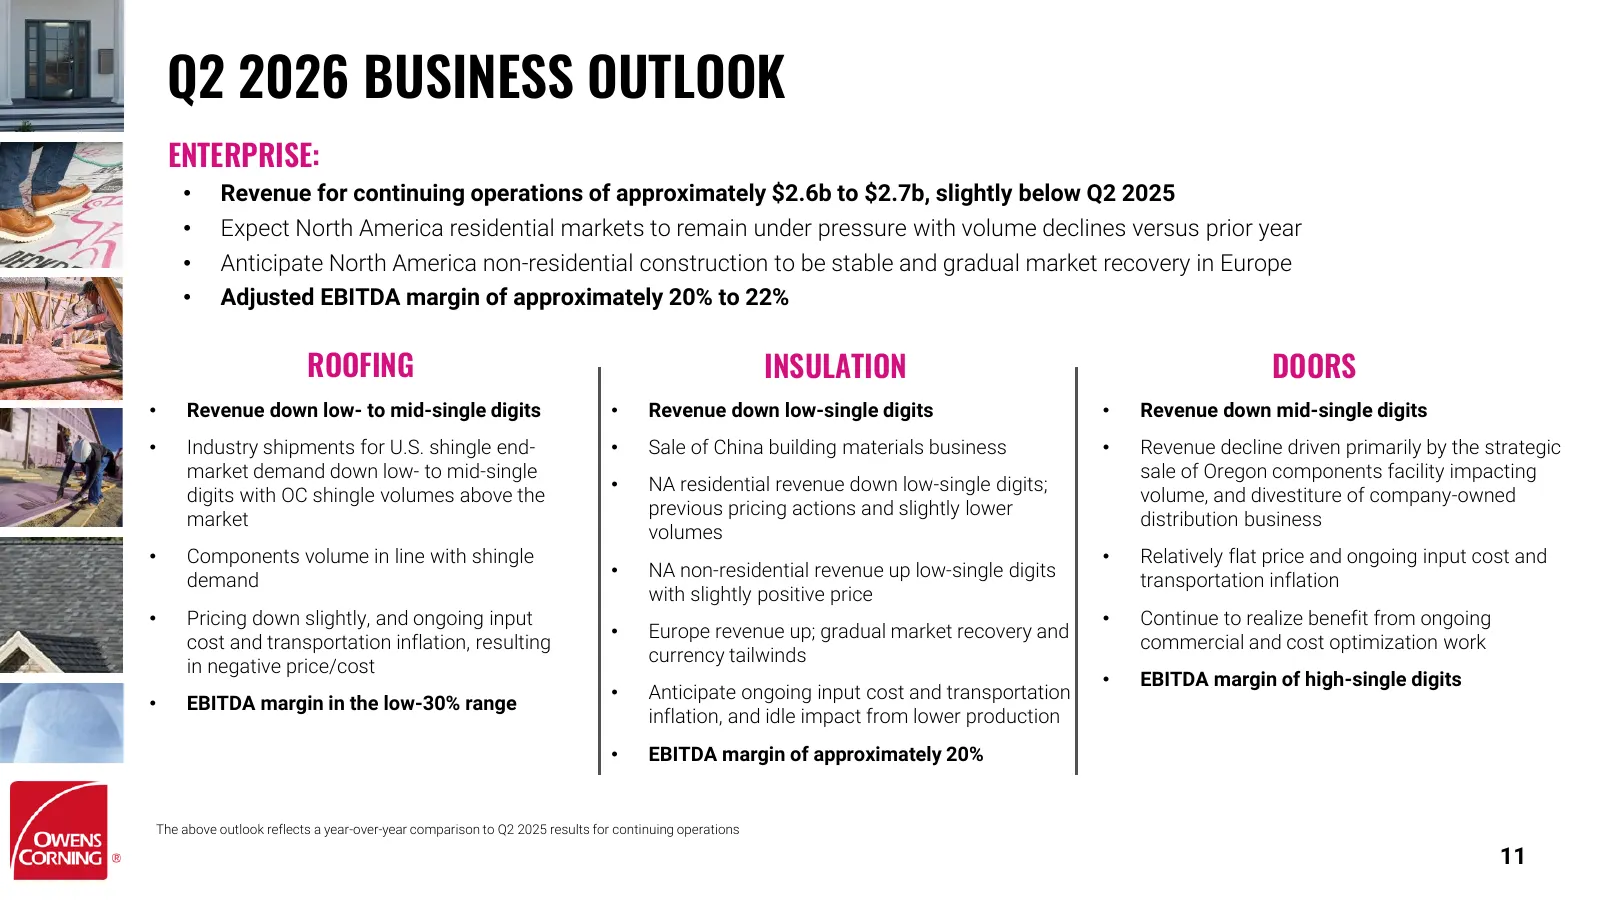
Q2 2026 BUSINESS OUTLOOK ENTERPRISE: • Revenue for continuing operations of approximately $2.6b to $2.7b, slightly below Q2 2025 • Expect North America residential markets to remain under pressure with volume declines versus prior year • Anticipate North America non-residential construction to be st

Slide 12: Questions and Discussion
QUESTIONS AND DISCUSSION
Slide 13: Appendix A: Non-GAAP Reconciliations – Table 1
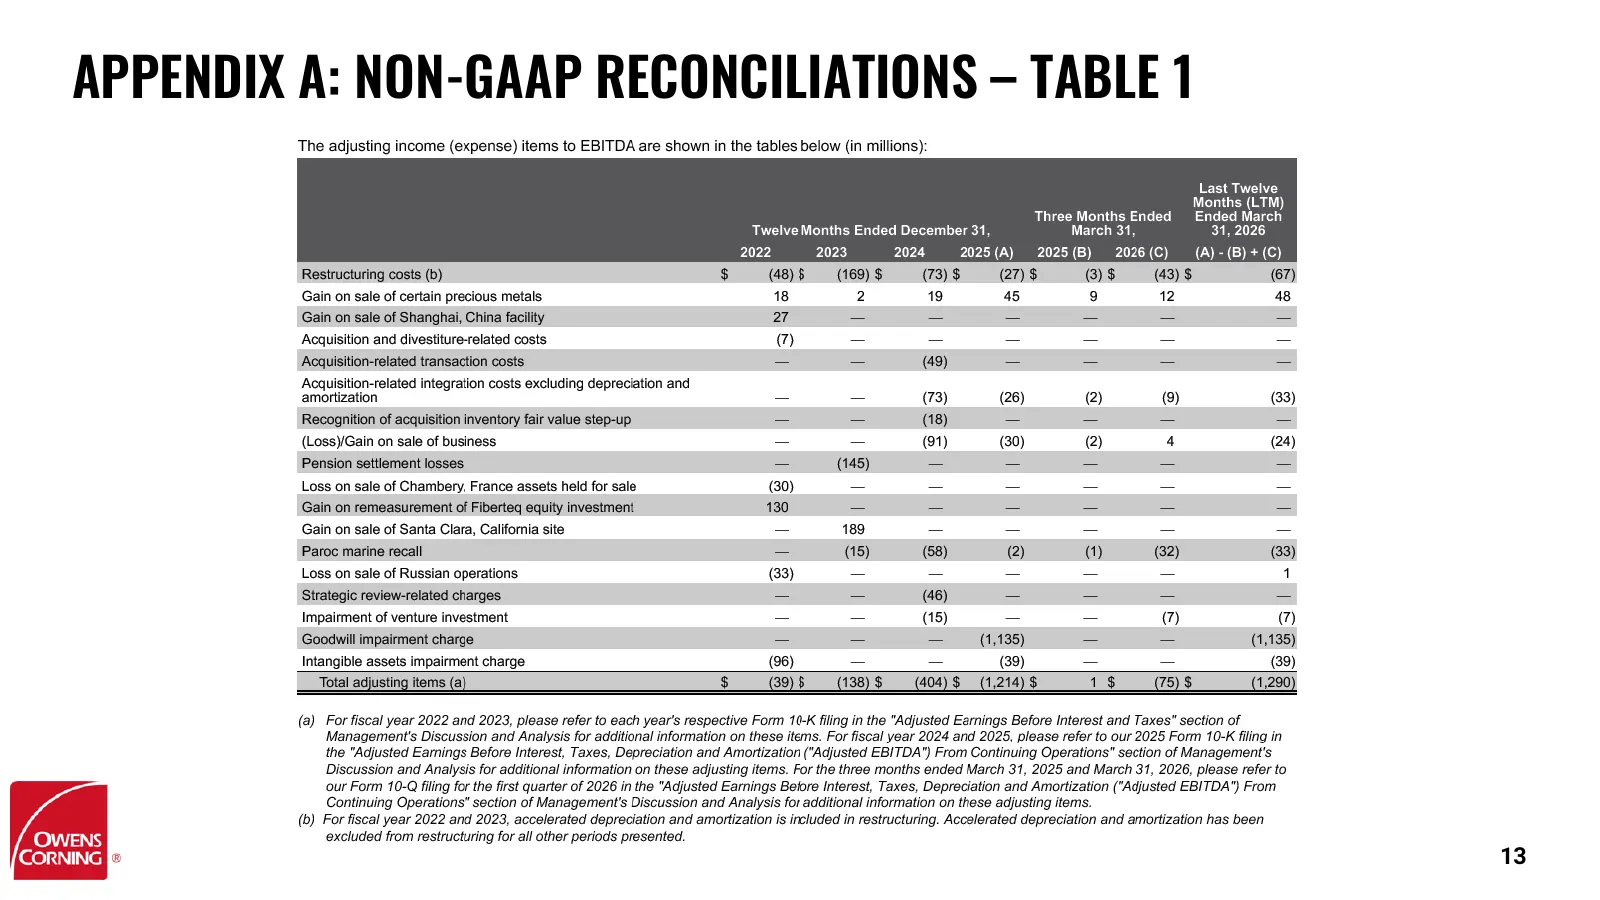
APPENDIX A: NON-GAAP RECONCILIATIONS – TABLE 1 13
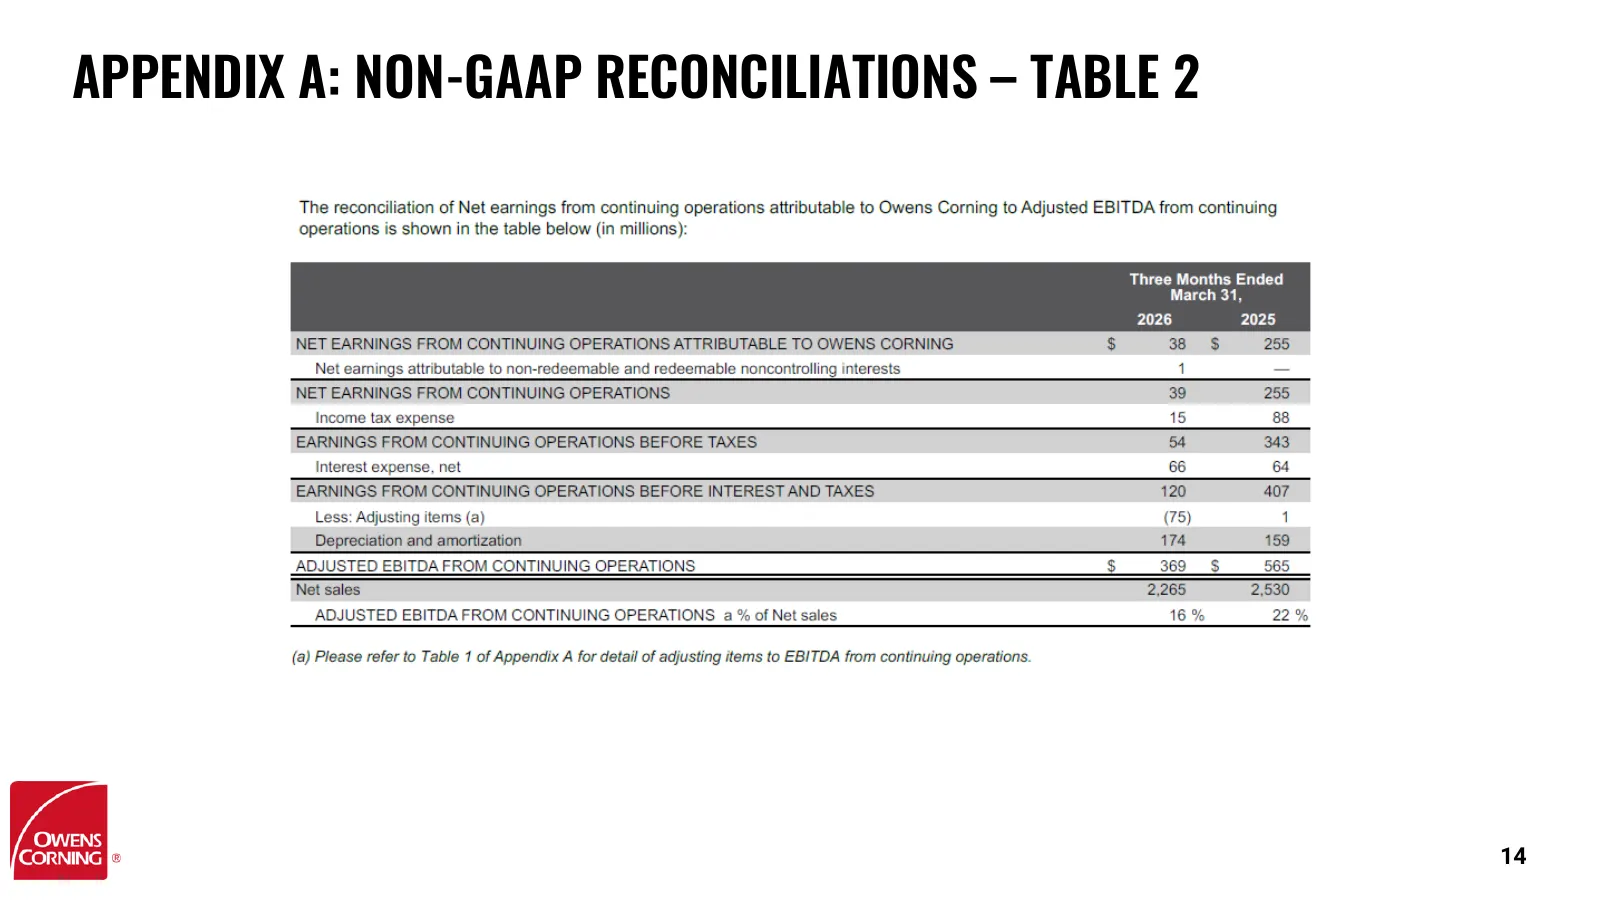
Slide 14: Appendix A: Non-GAAP Reconciliations – Table 2
APPENDIX A: NON-GAAP RECONCILIATIONS – TABLE 2 14
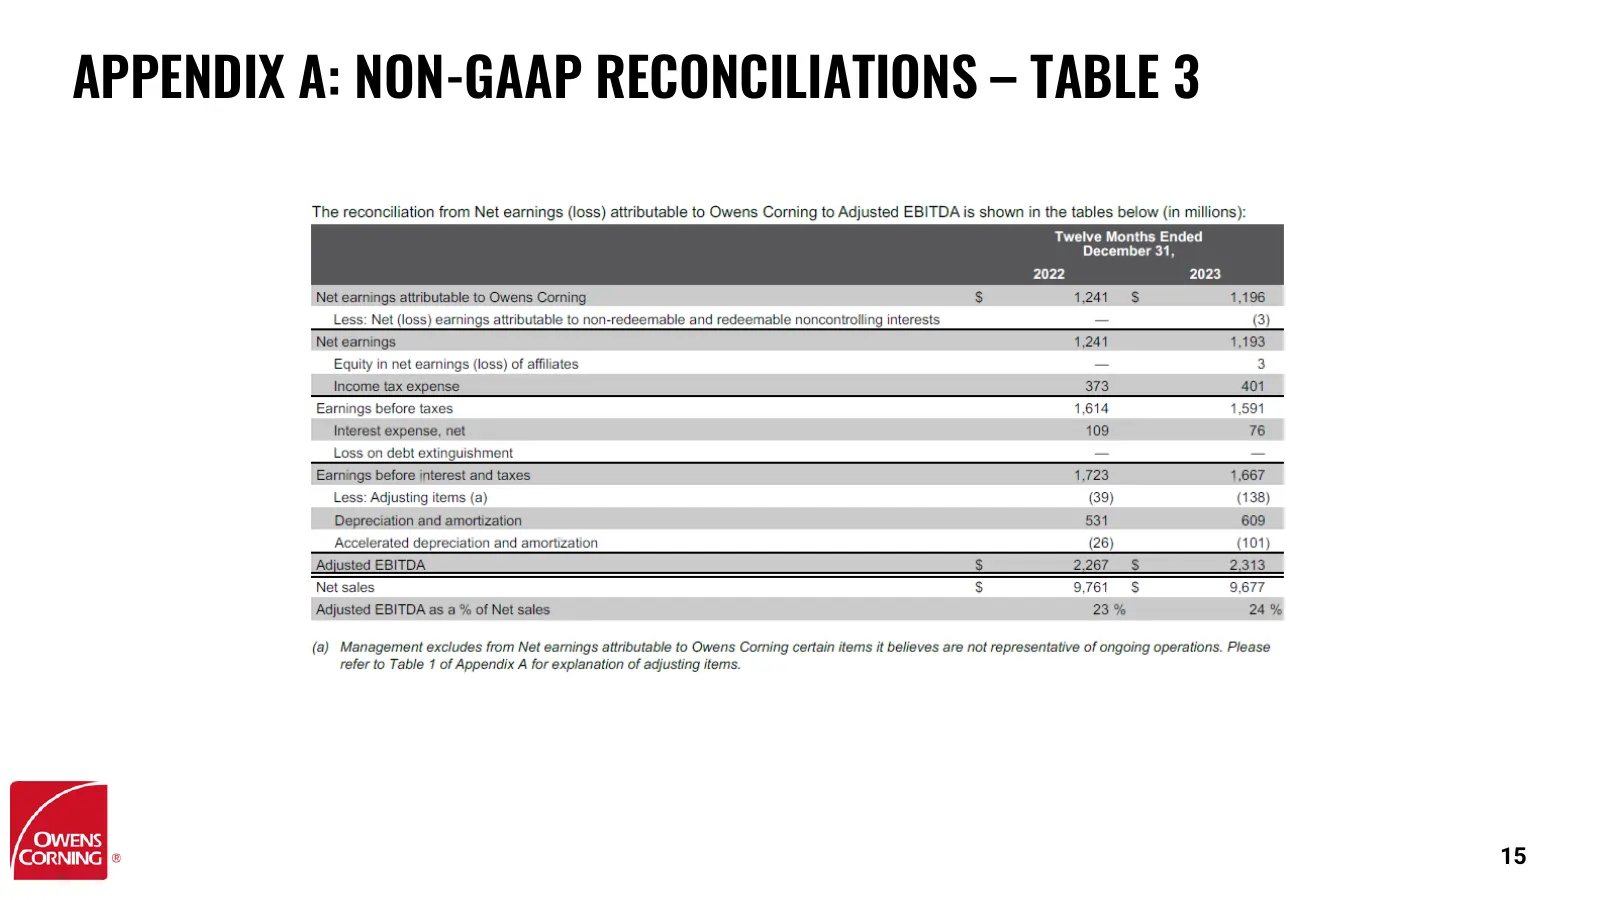
Slide 15: Appendix A: Non-GAAP Reconciliations – Table 3
APPENDIX A: NON-GAAP RECONCILIATIONS – TABLE 3 15
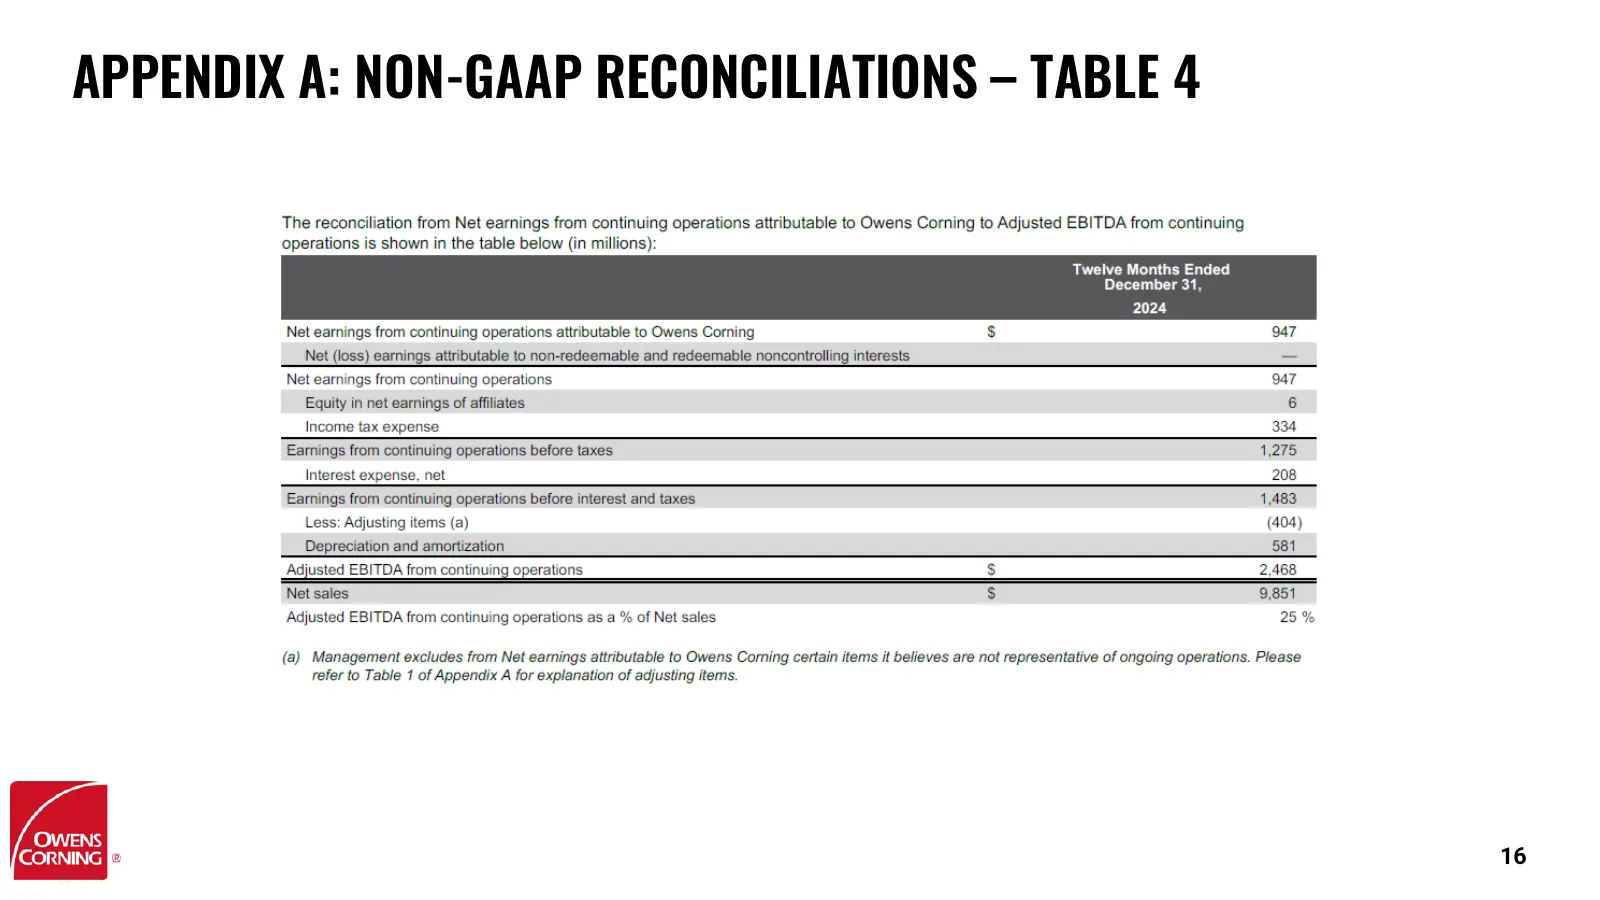
Slide 16: Appendix A: Non-GAAP Reconciliations – Table 4
APPENDIX A: NON-GAAP RECONCILIATIONS – TABLE 4 16
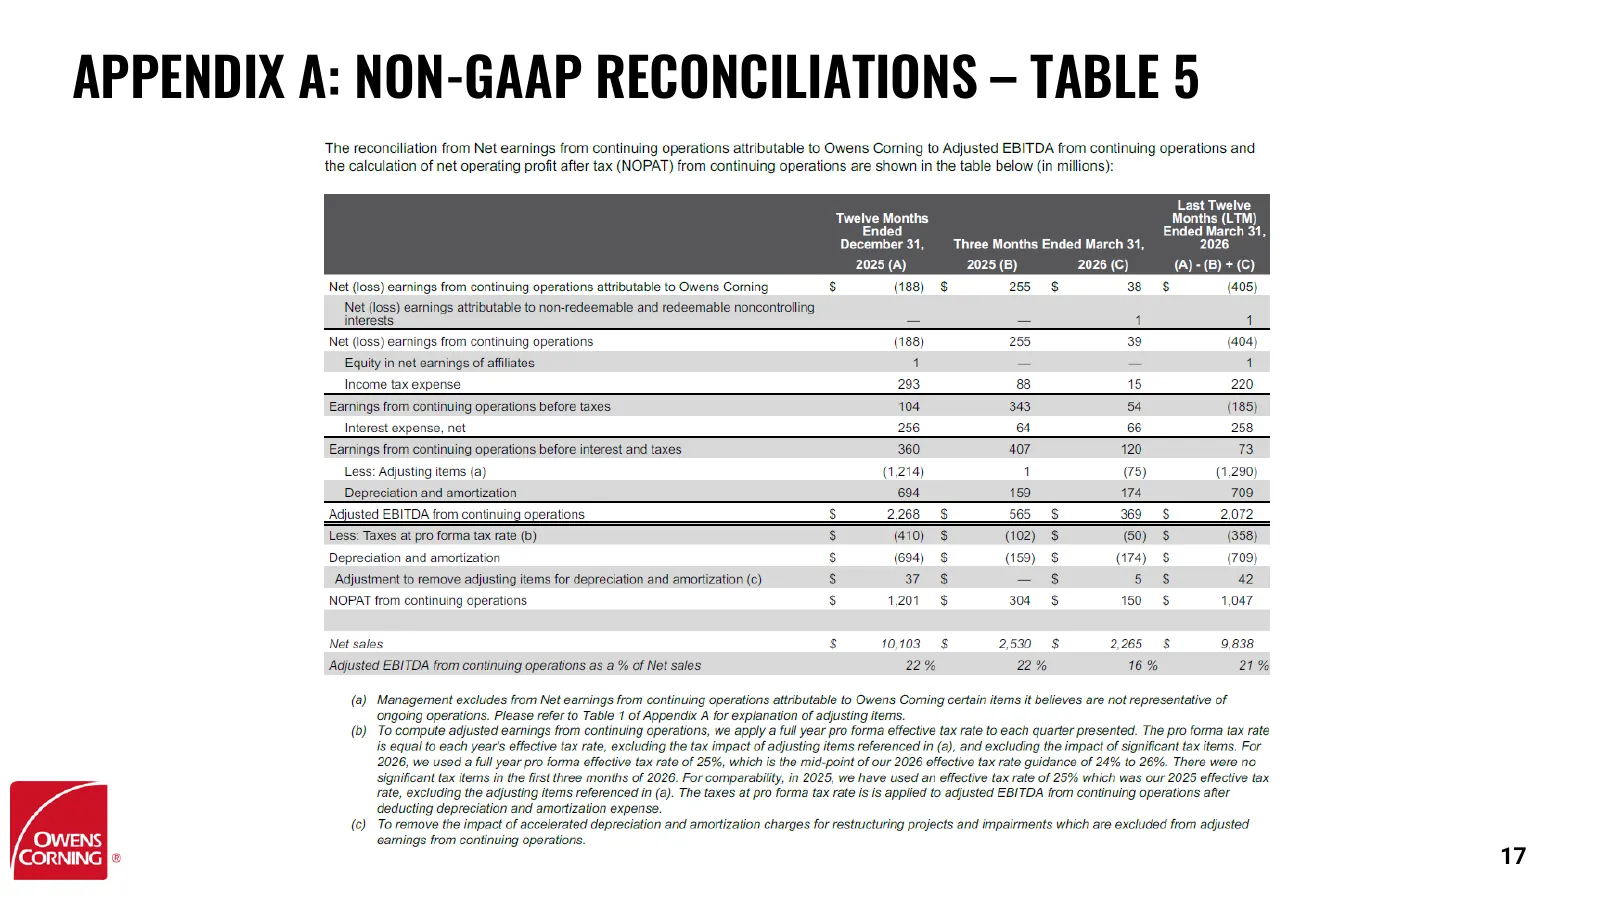
Slide 17: Appendix A: Non-GAAP Reconciliations – Table 5
APPENDIX A: NON-GAAP RECONCILIATIONS – TABLE 5 17
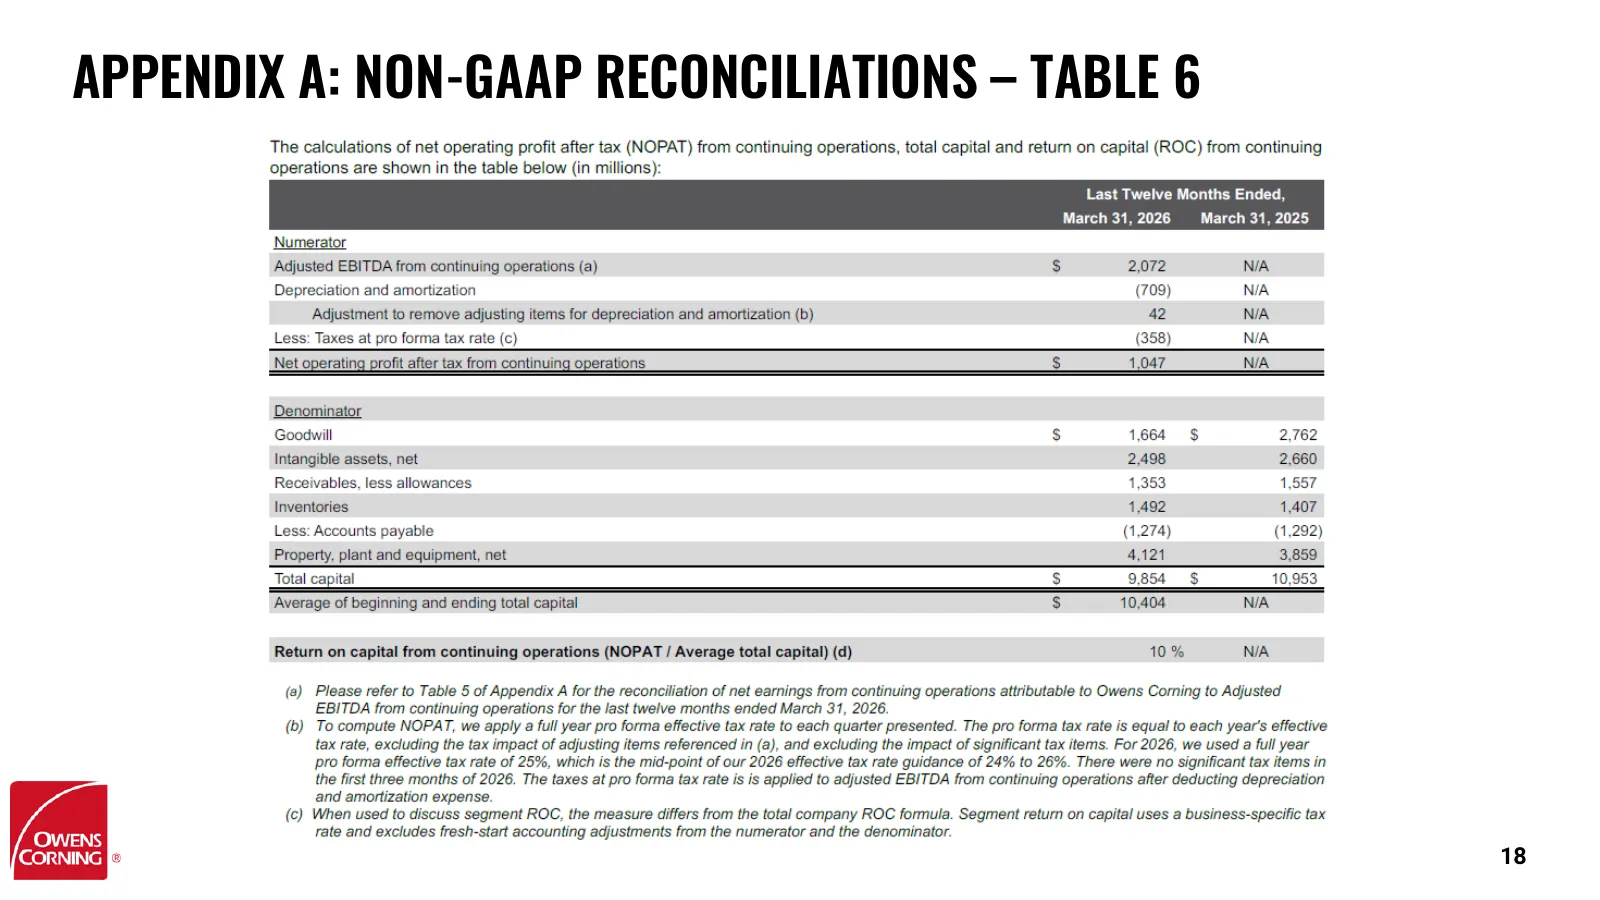
Slide 18: Appendix A: Non-GAAP Reconciliations – Table 6
APPENDIX A: NON-GAAP RECONCILIATIONS – TABLE 6 18
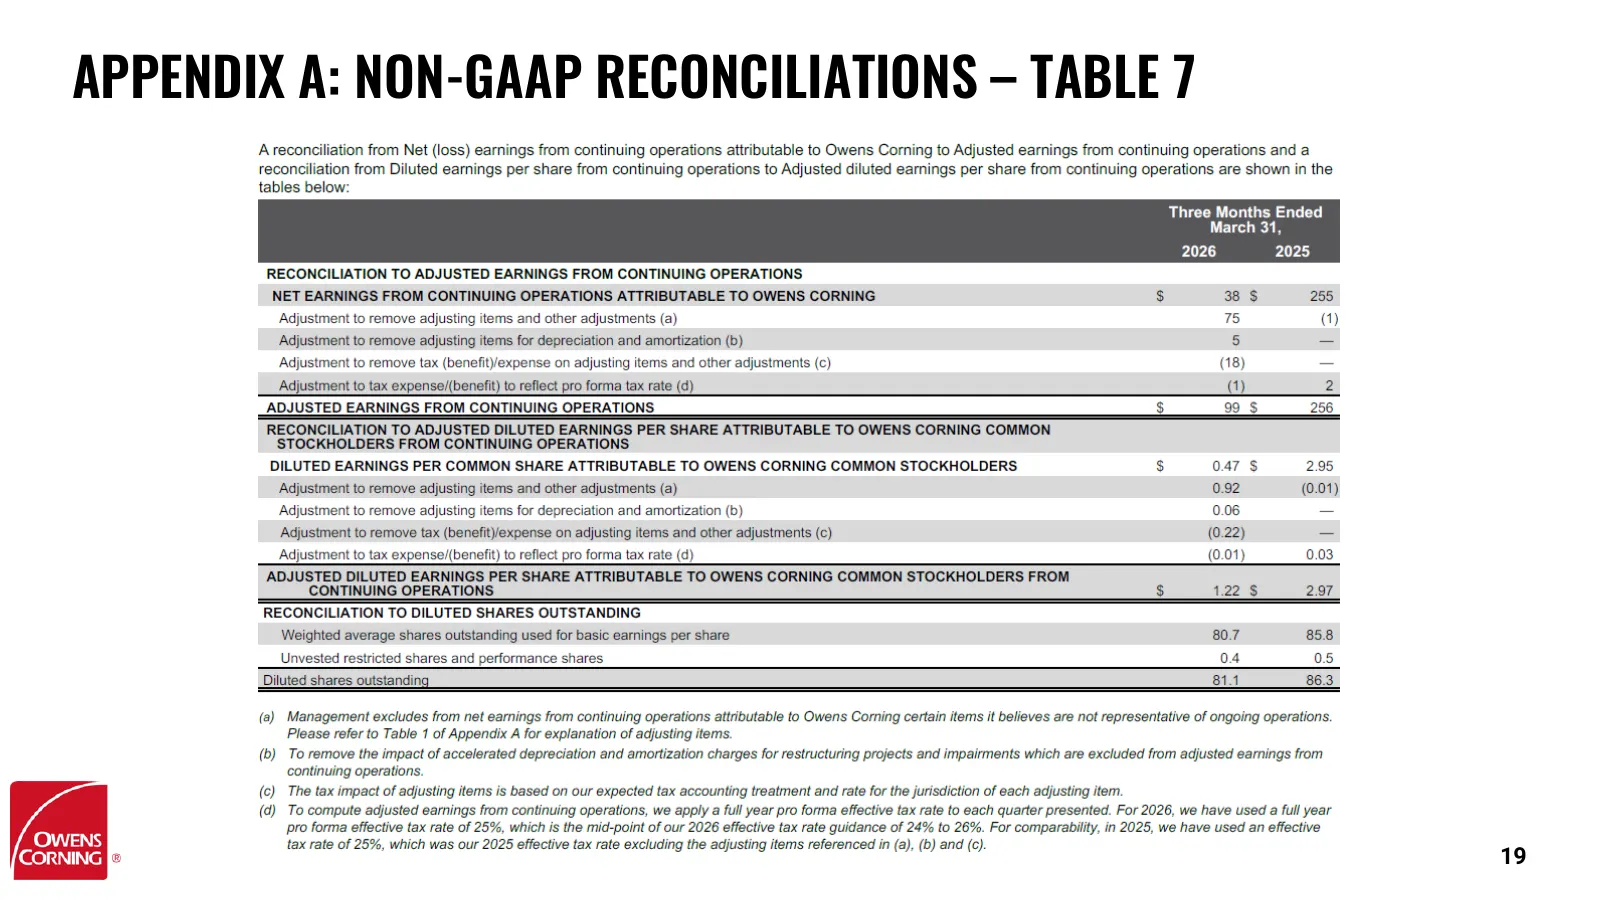
Slide 19: Appendix A: Non-GAAP Reconciliations – Table 7
APPENDIX A: NON-GAAP RECONCILIATIONS – TABLE 7 19
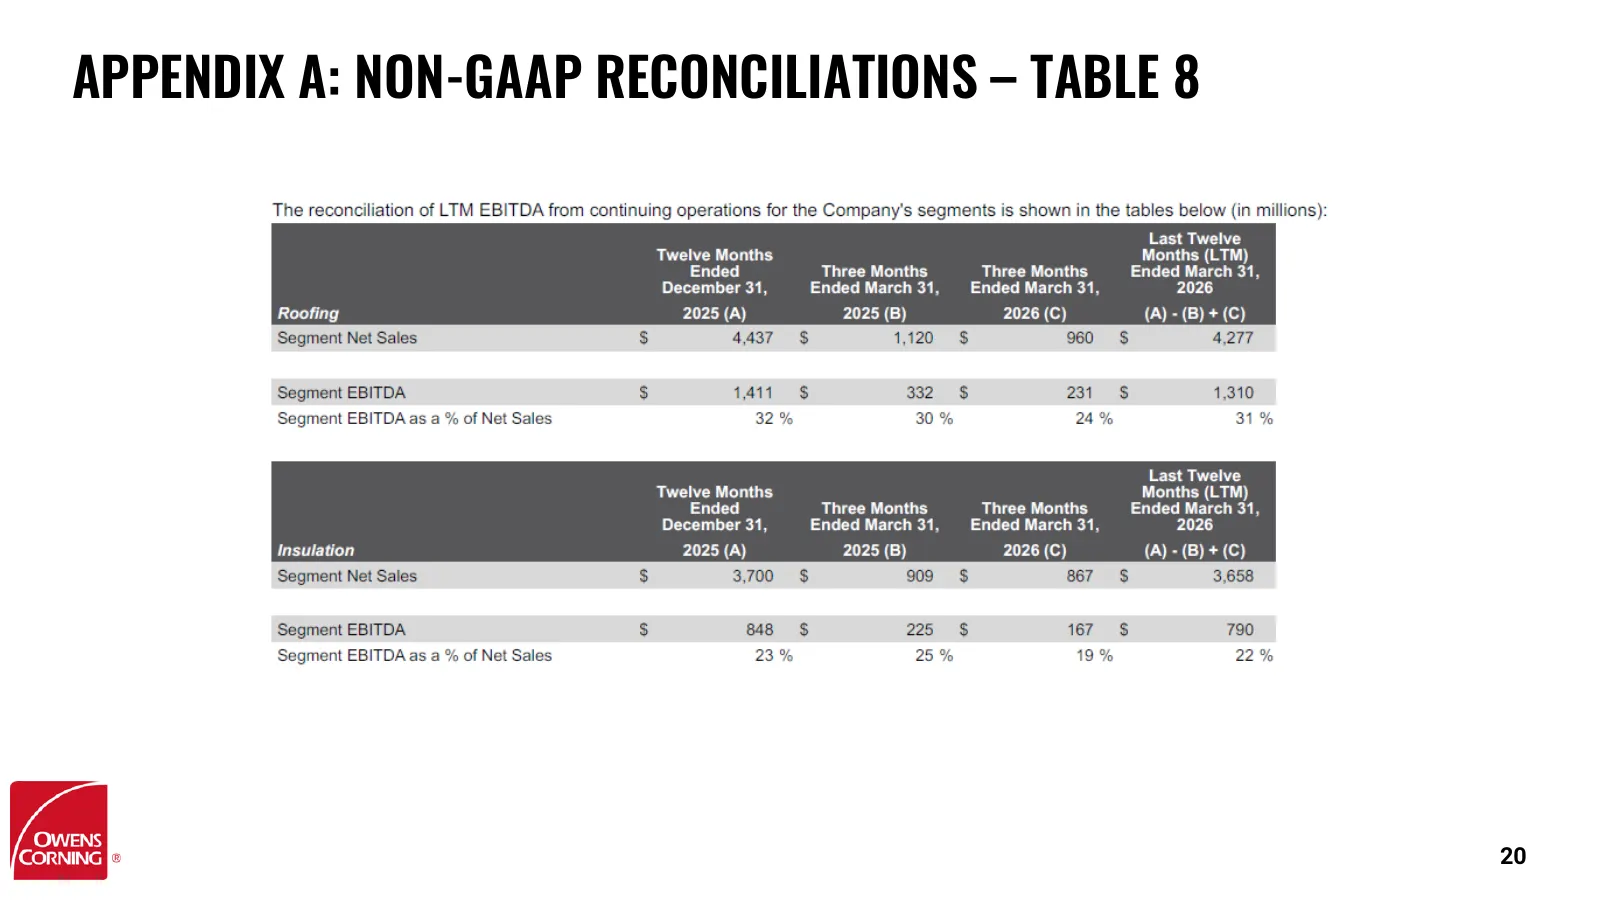
Slide 20: Appendix A: Non-GAAP Reconciliations – Table 8
APPENDIX A: NON-GAAP RECONCILIATIONS – TABLE 8 20
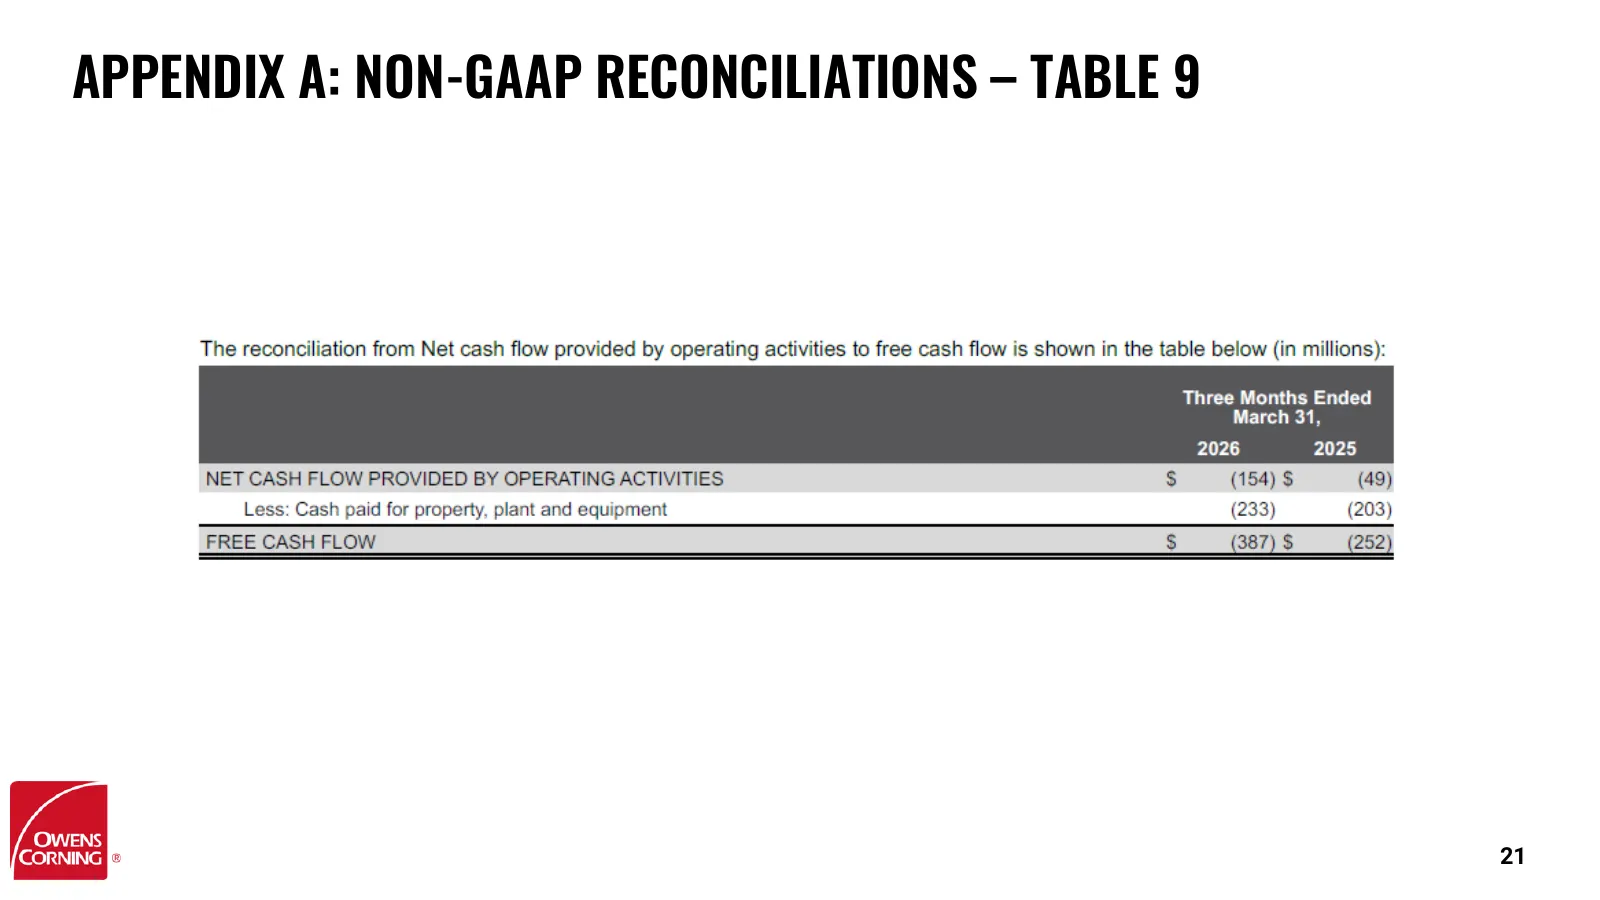
Slide 21: Appendix A: Non-GAAP Reconciliations – Table 9
APPENDIX A: NON-GAAP RECONCILIATIONS – TABLE 9 21
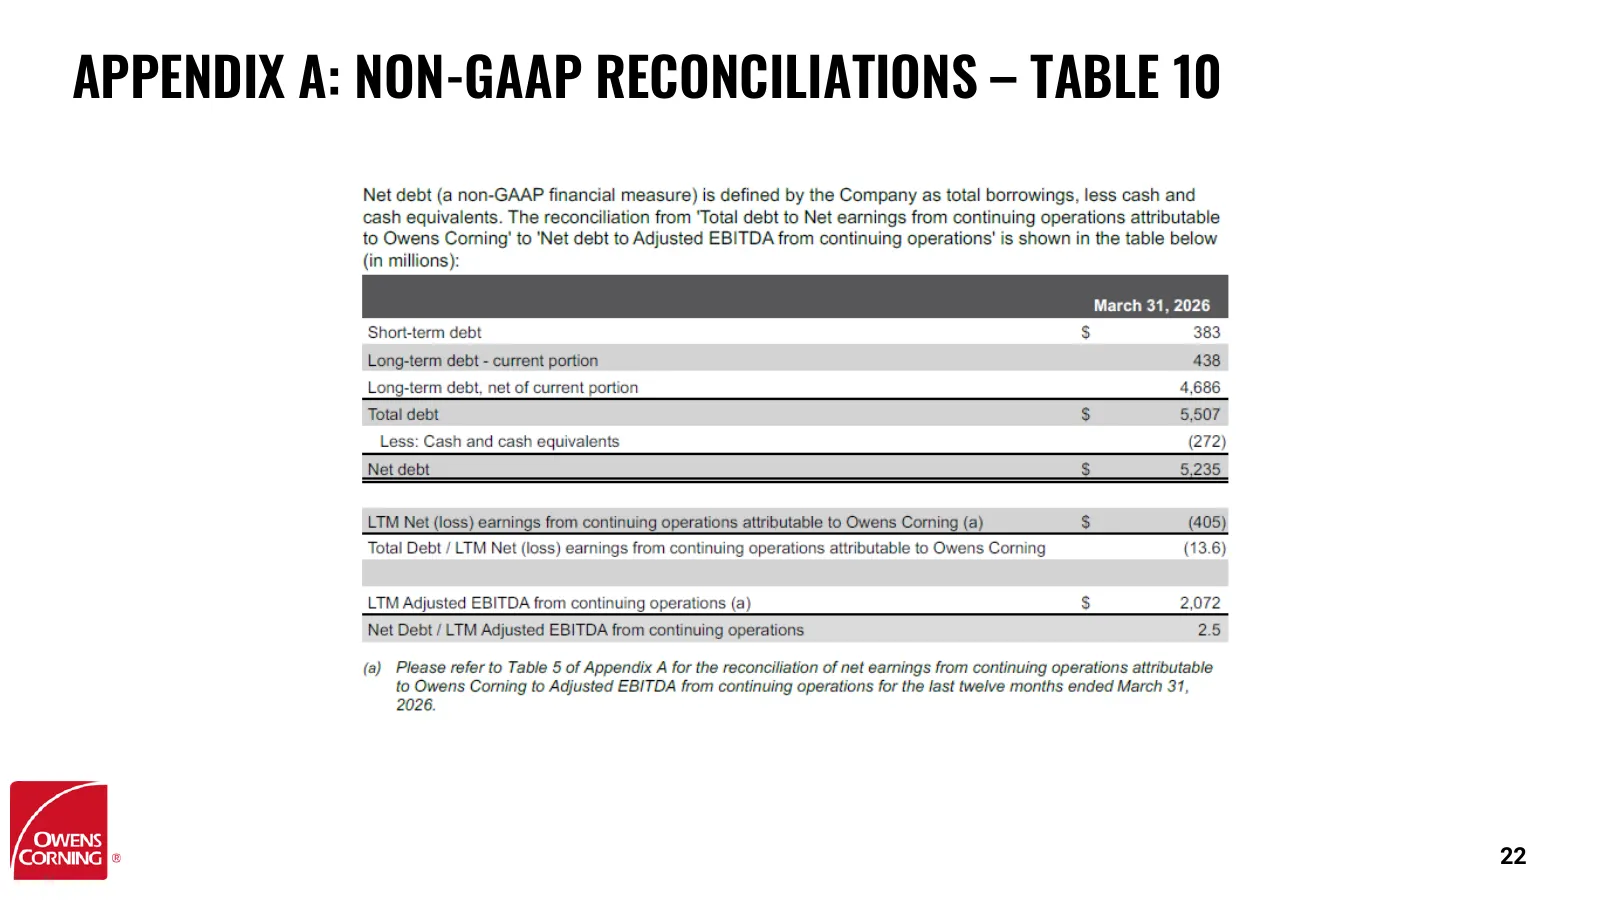
Slide 22: Appendix A: Non-GAAP Reconciliations – Table 10
APPENDIX A: NON-GAAP RECONCILIATIONS – TABLE 10 22
Source: Internet Archive copy of s21.q4cdn.com
More decks from Owens Corning Inc
 Baird Global Industrial Conference 202633 slides · Nov 11, 2026
 Q3 2026 Earnings Presentation20 slides · Nov 4, 2026
 Non-Deal Roadshow (August 2026)33 slides · Aug 6, 2026
 Q2 2026 Earnings Presentation22 slides · Aug 5, 2026
 Non-Deal Roadshow (May 2026)33 slides · May 28, 2026
 IR Roadshow Hosted by Deutsche Bank – Baltimore (March 11, 2026)31 slides · Mar 11, 2026