Owens Corning Inc · NYSE:OC
Owens Corning — Baird Global Industrial Conference 2026
33 slides from Owens Corning's conference presentation, Nov 11, 2026
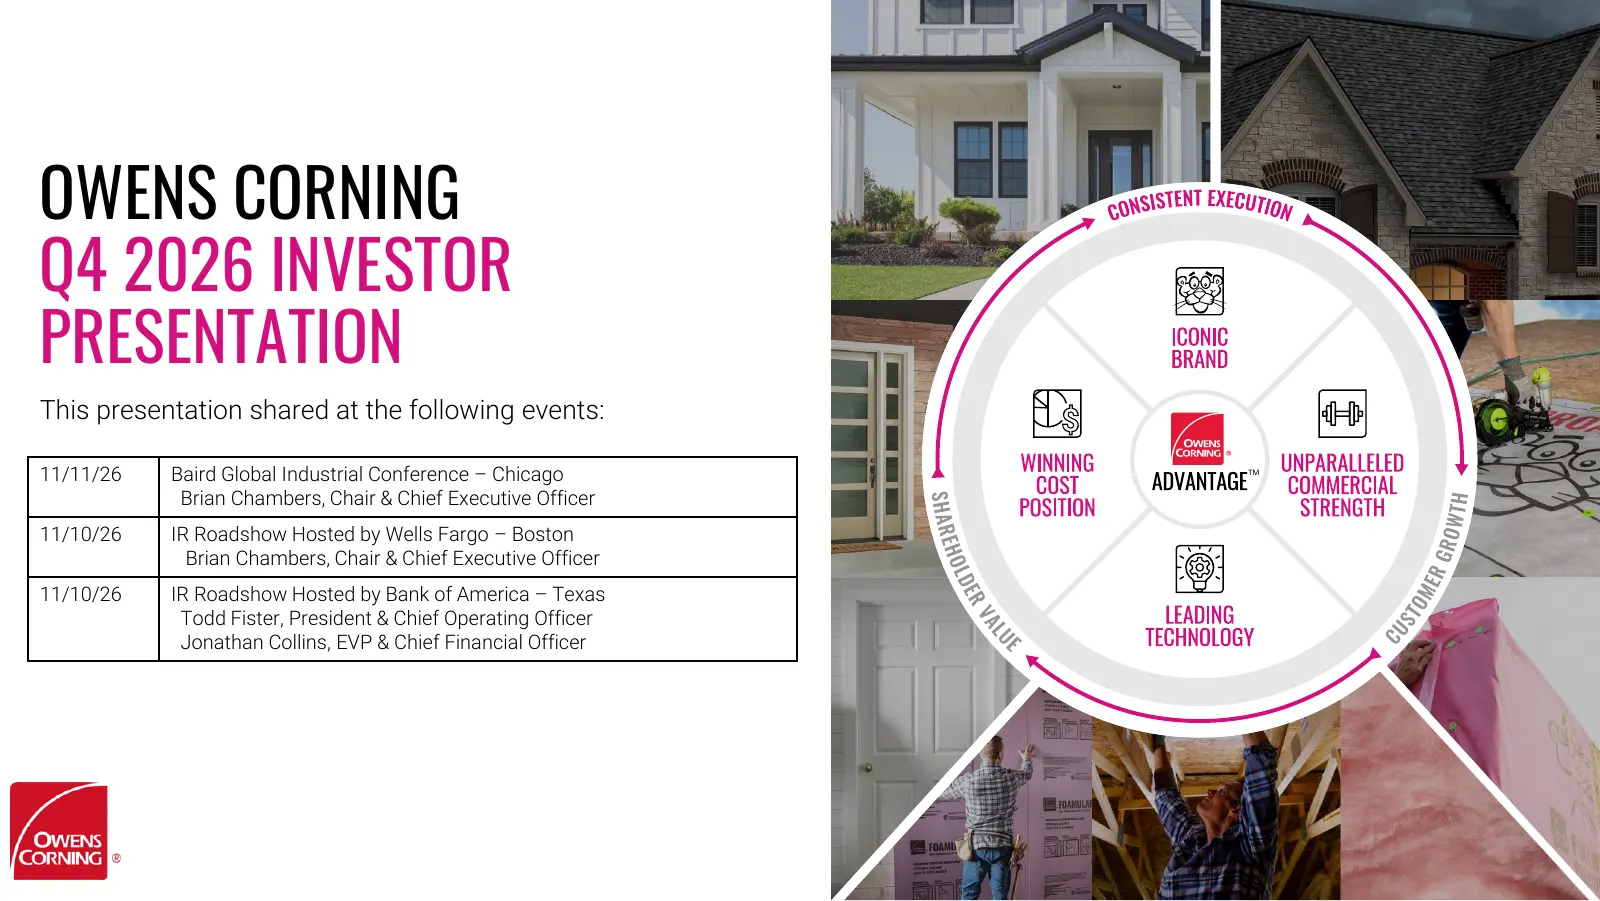
Slide 1: Owens Corning Q4 2026 Investor Presentation
OWENS CORNING Q4 2026 INVESTOR PRESENTATION This presentation shared at the following events: 11/11/26 Baird Global Industrial Conference – Chicago TM Brian Chambers, Chair & Chief Executive Officer 11/10/26 IR Roadshow Hosted by Wells Fargo – Boston Brian Chambers, Chair & Chief Executive Officer 1
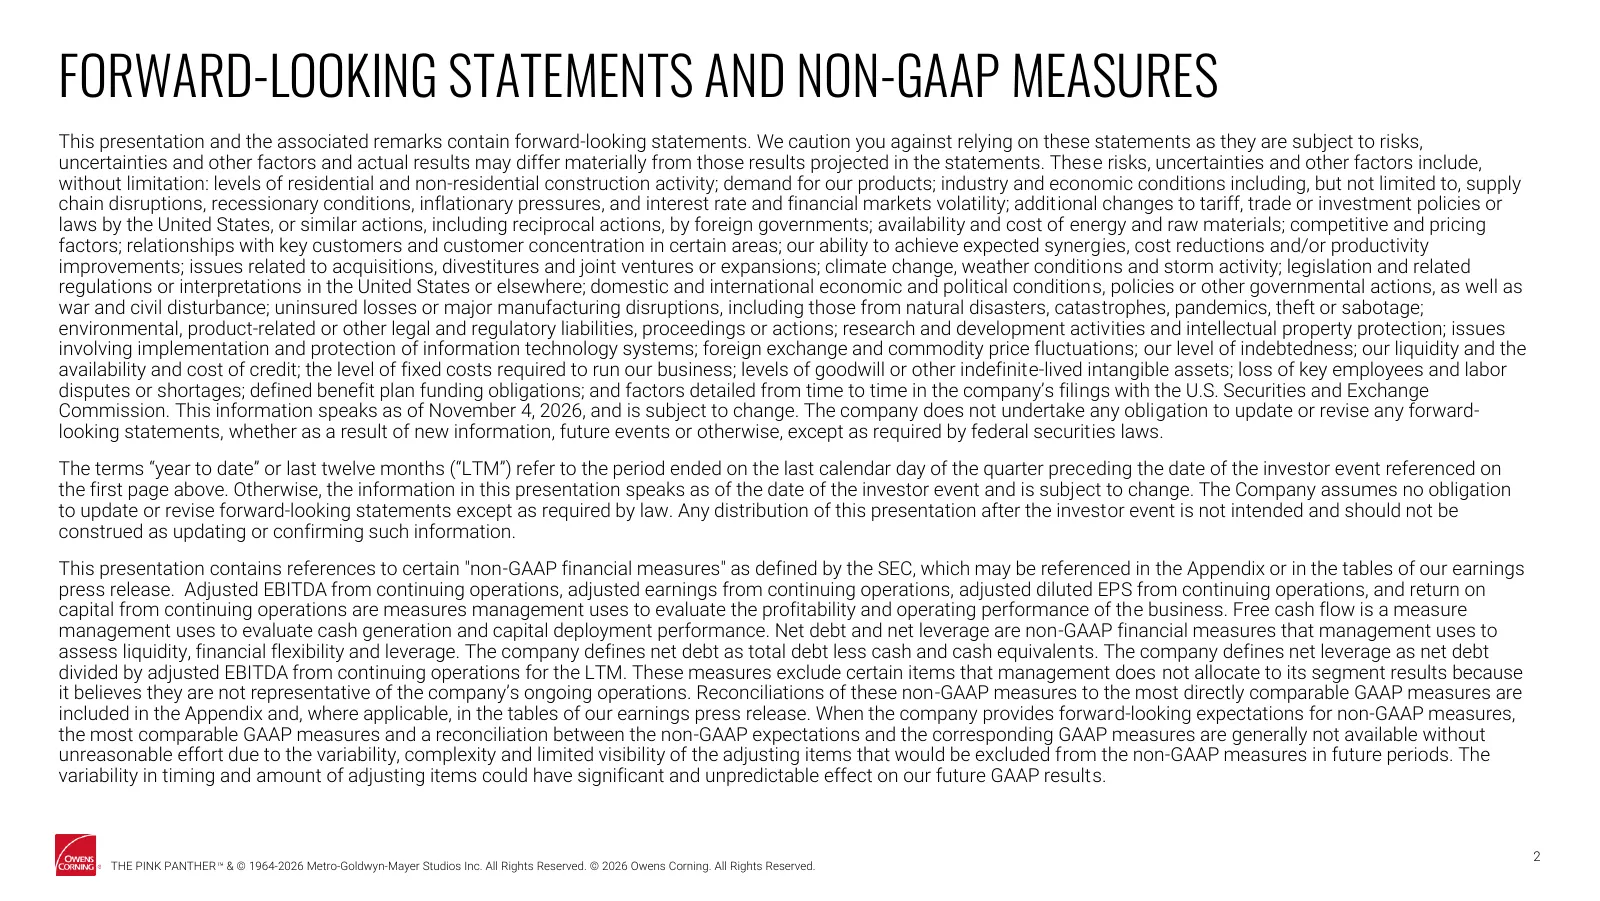
Slide 2: Forward-Looking Statements and Non-GAAP Measures
FORWARD-LOOKING STATEMENTS AND NON-GAAP MEASURES This presentation and the associated remarks contain forward-looking statements. We caution you against relying on these statements as they are subject to risks, uncertainties and other factors and actual results may differ materially from those resul
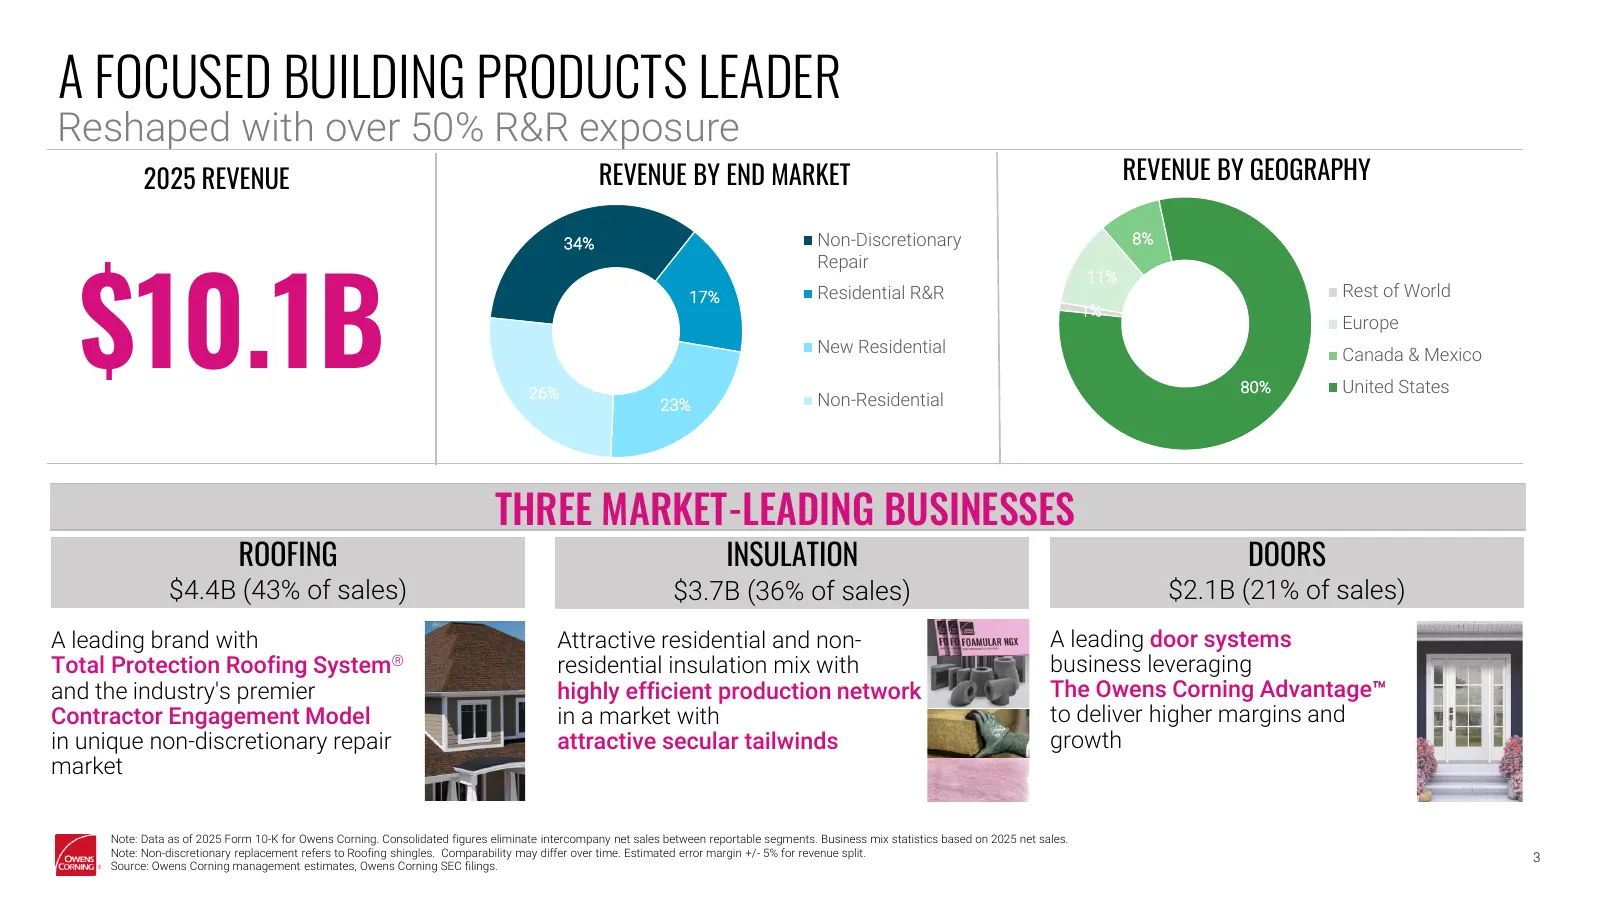
Slide 3: A Focused Building Products Leader
A FOCUSED BUILDING PRODUCTS LEADER Reshaped with over 50% R&R exposure 2025 REVENUE REVENUE BY END MARKET REVENUE BY GEOGRAPHY Non-Discretionary 8% $10.1B 34% Repair 11% 17% Residential R&R Rest of World 1% Europe New Residential Canada & Mexico 26% 80% United States 23% Non-Residential THREE MARKET
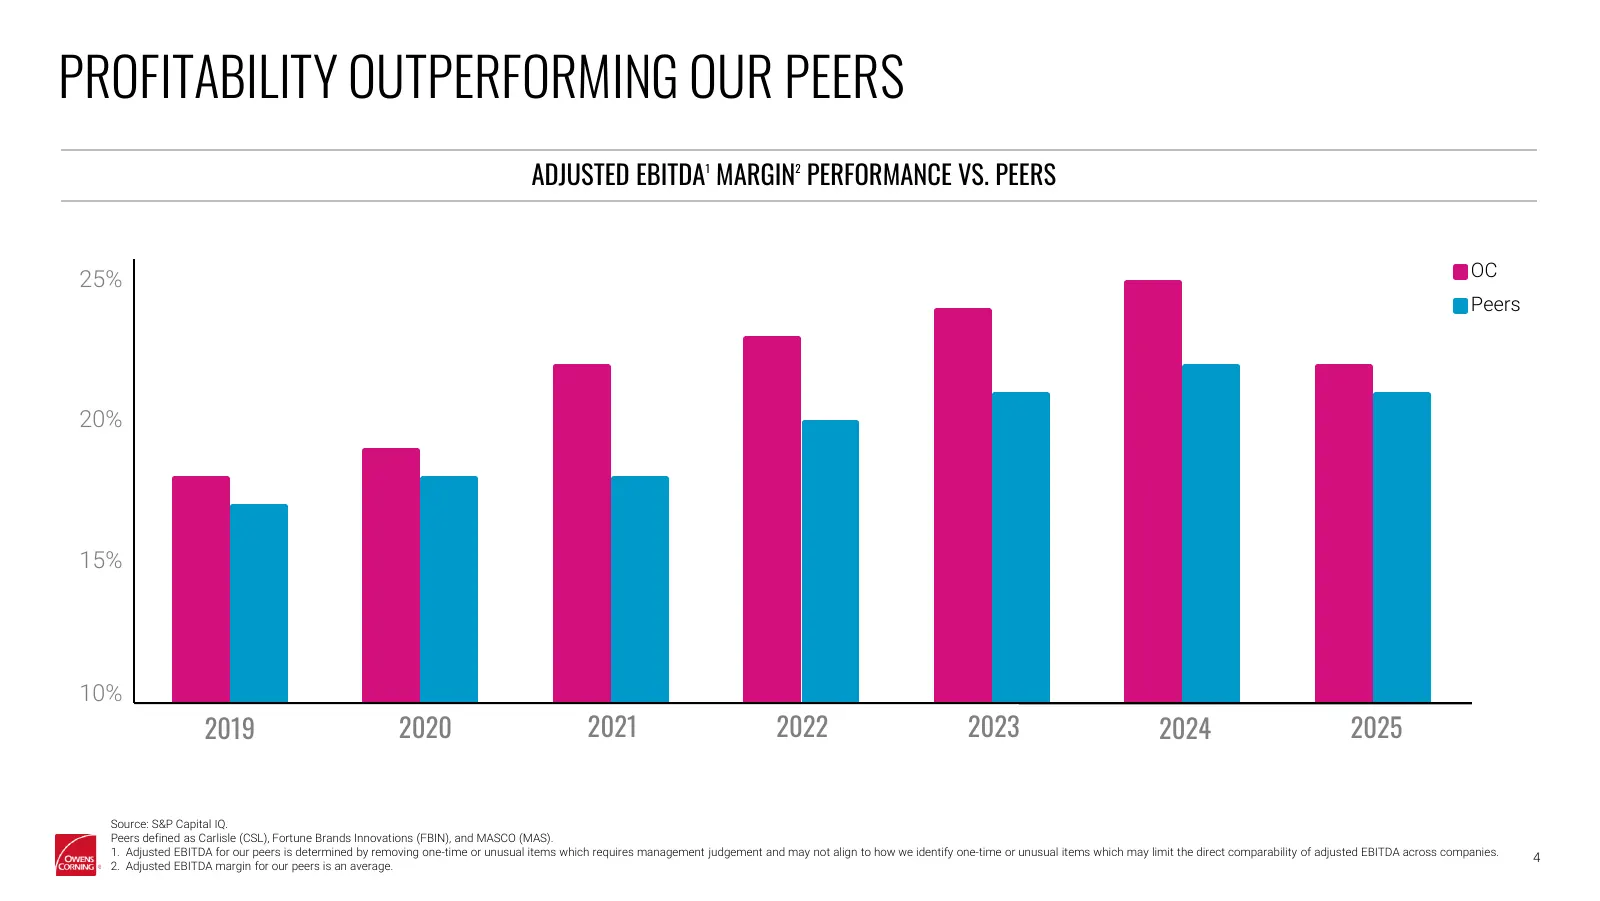
Slide 4: Profitability Outperforming Our Peers
PROFITABILITY OUTPERFORMING OUR PEERS ADJUSTED EBITDA1 MARGIN2 PERFORMANCE VS. PEERS 25% OC Peers 20% 15% 10% 2019 2020 2021 2022 2023 2024 2025 Source: S&P Capital IQ. Peers defined as Carlisle (CSL), Fortune Brands Innovations (FBIN), and MASCO (MAS). 1. Adjusted EBITDA for our peers is determined
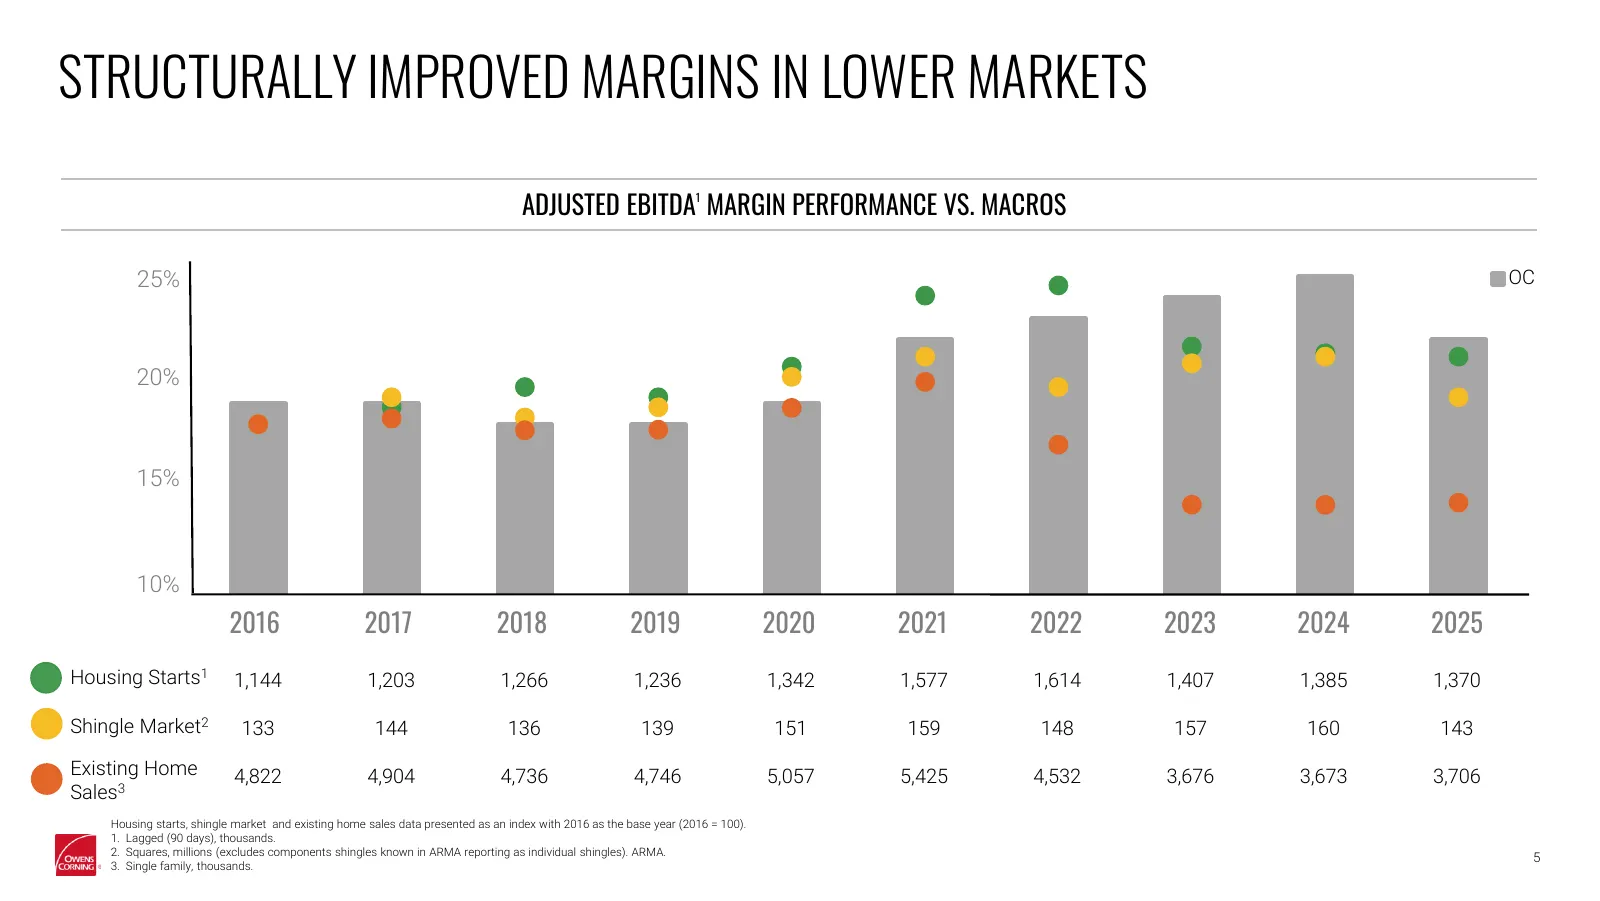
Slide 5: Structurally Improved Margins in Lower Markets
STRUCTURALLY IMPROVED MARGINS IN LOWER MARKETS ADJUSTED EBITDA1 MARGIN PERFORMANCE VS. MACROS 25% OC 20% 15% 10% 2016 2017 2018 2019 2020 2021 2022 2023 2024 2025 Housing Starts1 1,144 1,203 1,266 1,236 1,342 1,577 1,614 1,407 1,385 1,370 Shingle Market2 133 144 136 139 151 159 148 157 160 143 Exist
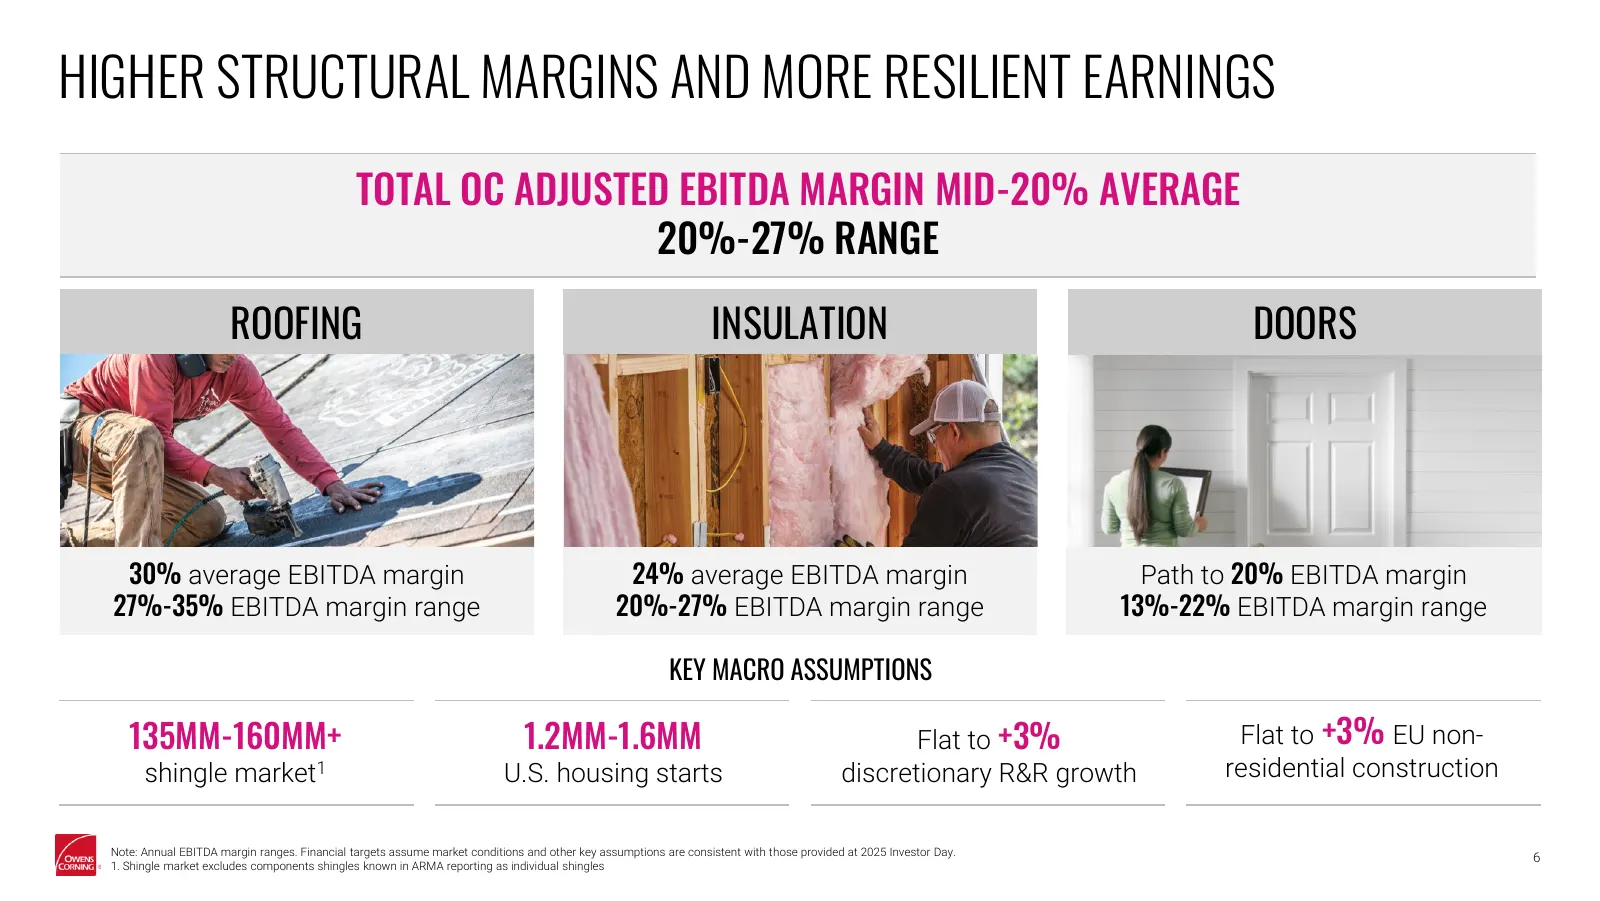
Slide 6: Higher Structural Margins and More Resilient Earnings
HIGHER STRUCTURAL MARGINS AND MORE RESILIENT EARNINGS TOTAL OC ADJUSTED EBITDA MARGIN MID-20% AVERAGE 20%-27% RANGE ROOFING INSULATION DOORS 30% average EBITDA margin 24% average EBITDA margin Path to 20% EBITDA margin 27%-35% EBITDA margin range 20%-27% EBITDA margin range 13%-22% EBITDA margin ran
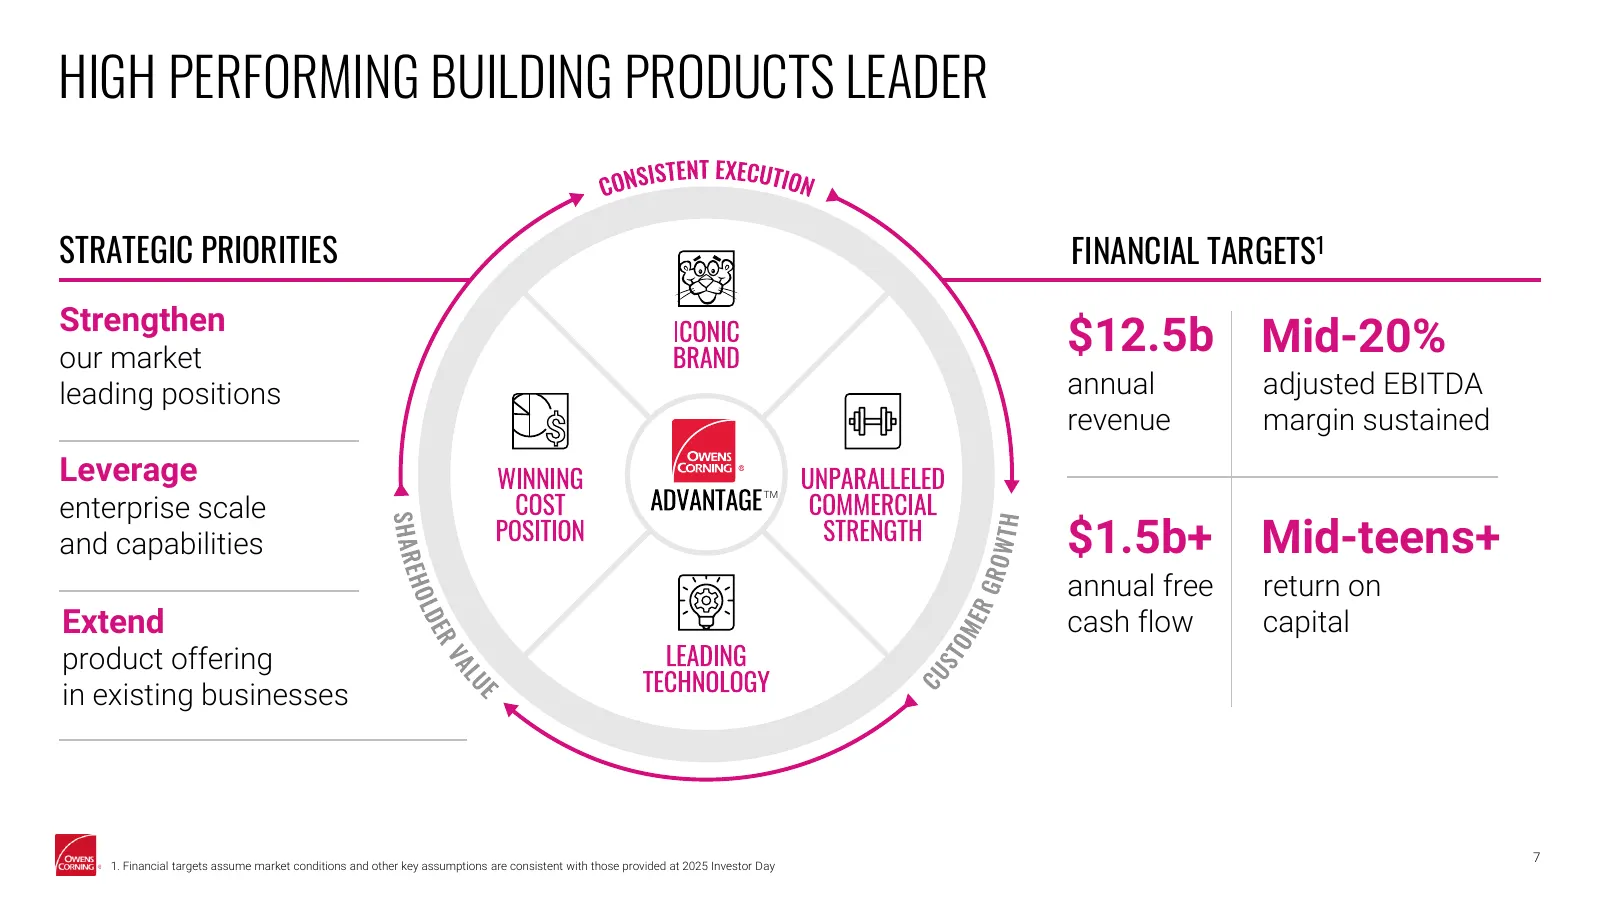
Slide 7: High Performing Building Products Leader
HIGH PERFORMING BUILDING PRODUCTS LEADER STRATEGIC PRIORITIES FINANCIAL TARGETS1 Strengthen our market $12.5b Mid-20% leading positions annual adjusted EBITDA revenue margin sustained Leverage TM enterprise scale and capabilities $1.5b+ Mid-teens+ annual free return on Extend cash flow capital produ
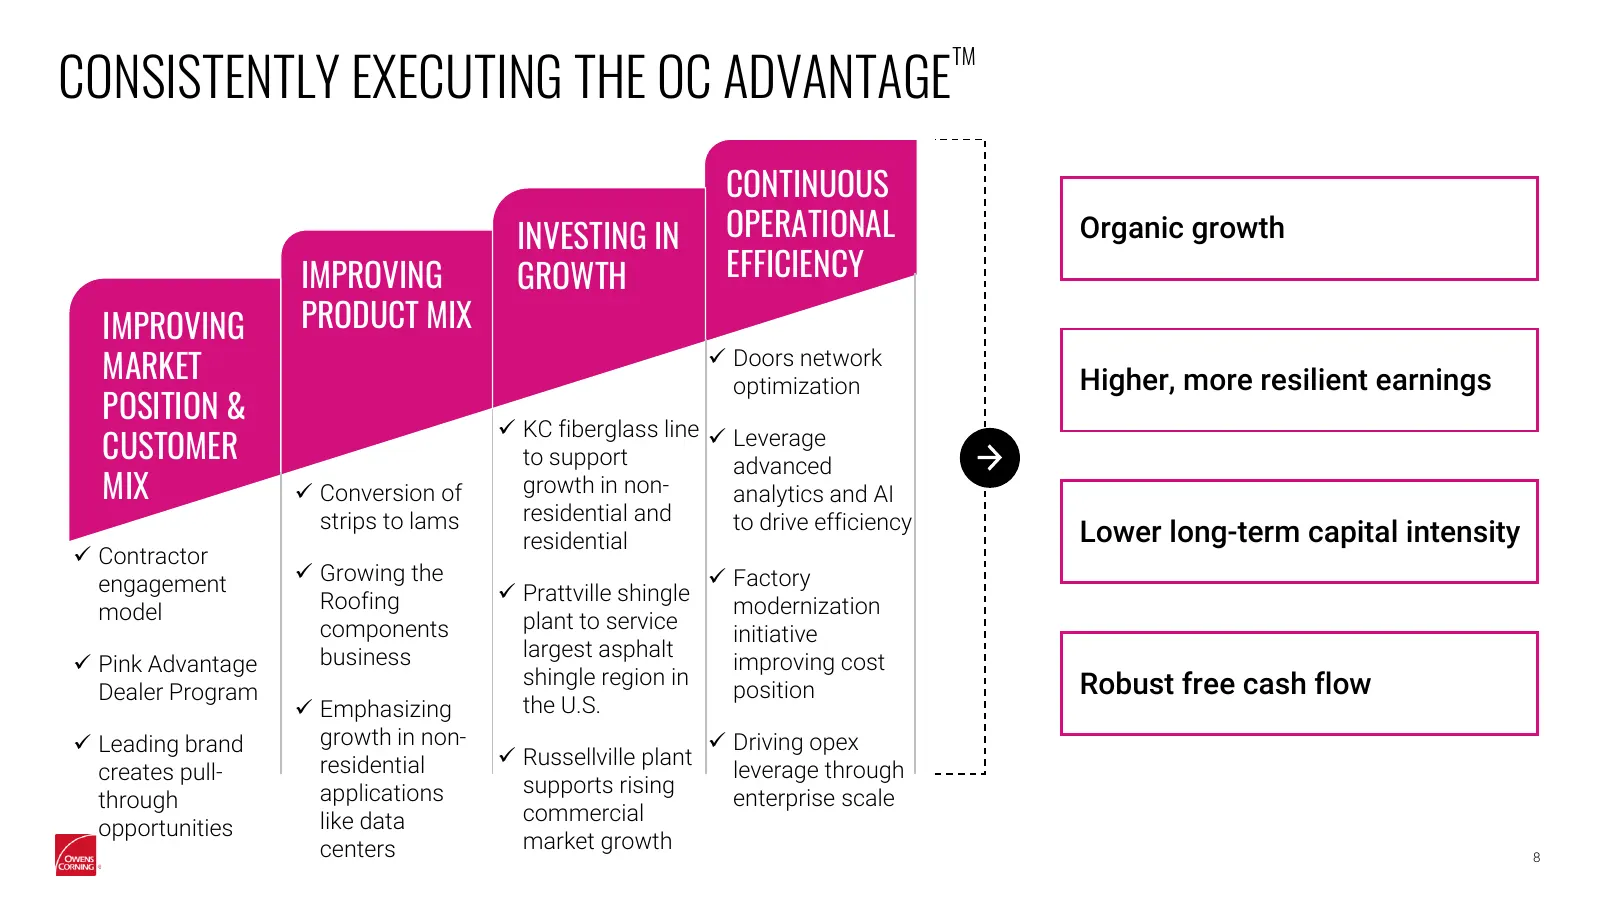
Slide 8: Consistently Executing the OC Advantage
CONSISTENTLY EXECUTING THE OC ADVANTAGE TM CONTINUOUS INVESTING IN OPERATIONAL Organic growth IMPROVING GROWTH EFFICIENCY IMPROVING PRODUCT MIX MARKET ✓ Doors network optimization Higher, more resilient earnings POSITION & ✓ KC fiberglass line ✓ Leverage CUSTOMER to support advanced MIX ✓ Conversion
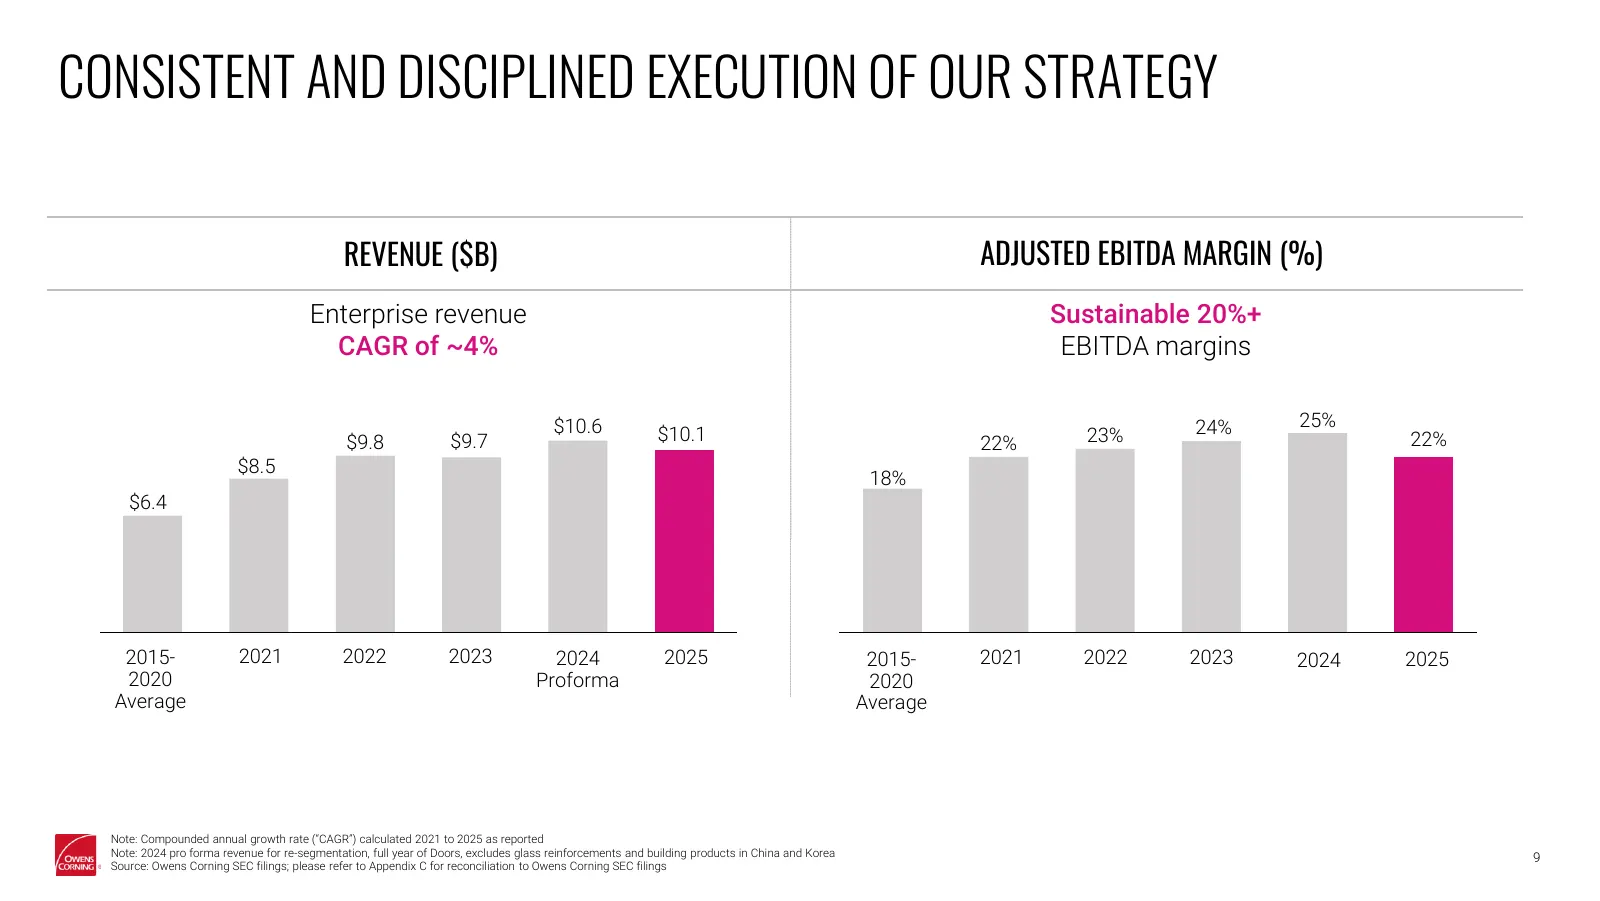
Slide 9: Consistent and Disciplined Execution of Our Strategy
CONSISTENT AND DISCIPLINED EXECUTION OF OUR STRATEGY REVENUE ($B) ADJUSTED EBITDA MARGIN (%) Enterprise revenue Sustainable 20%+ CAGR of ~4% EBITDA margins $10.6 24% 25% $9.8 $9.7 $10.1 22% 23% 22% $8.5 18% $6.4 2015- 2021 2022 2023 2024 2025 2015- 2021 2022 2023 2024 2025 2020 Proforma 2020 Average
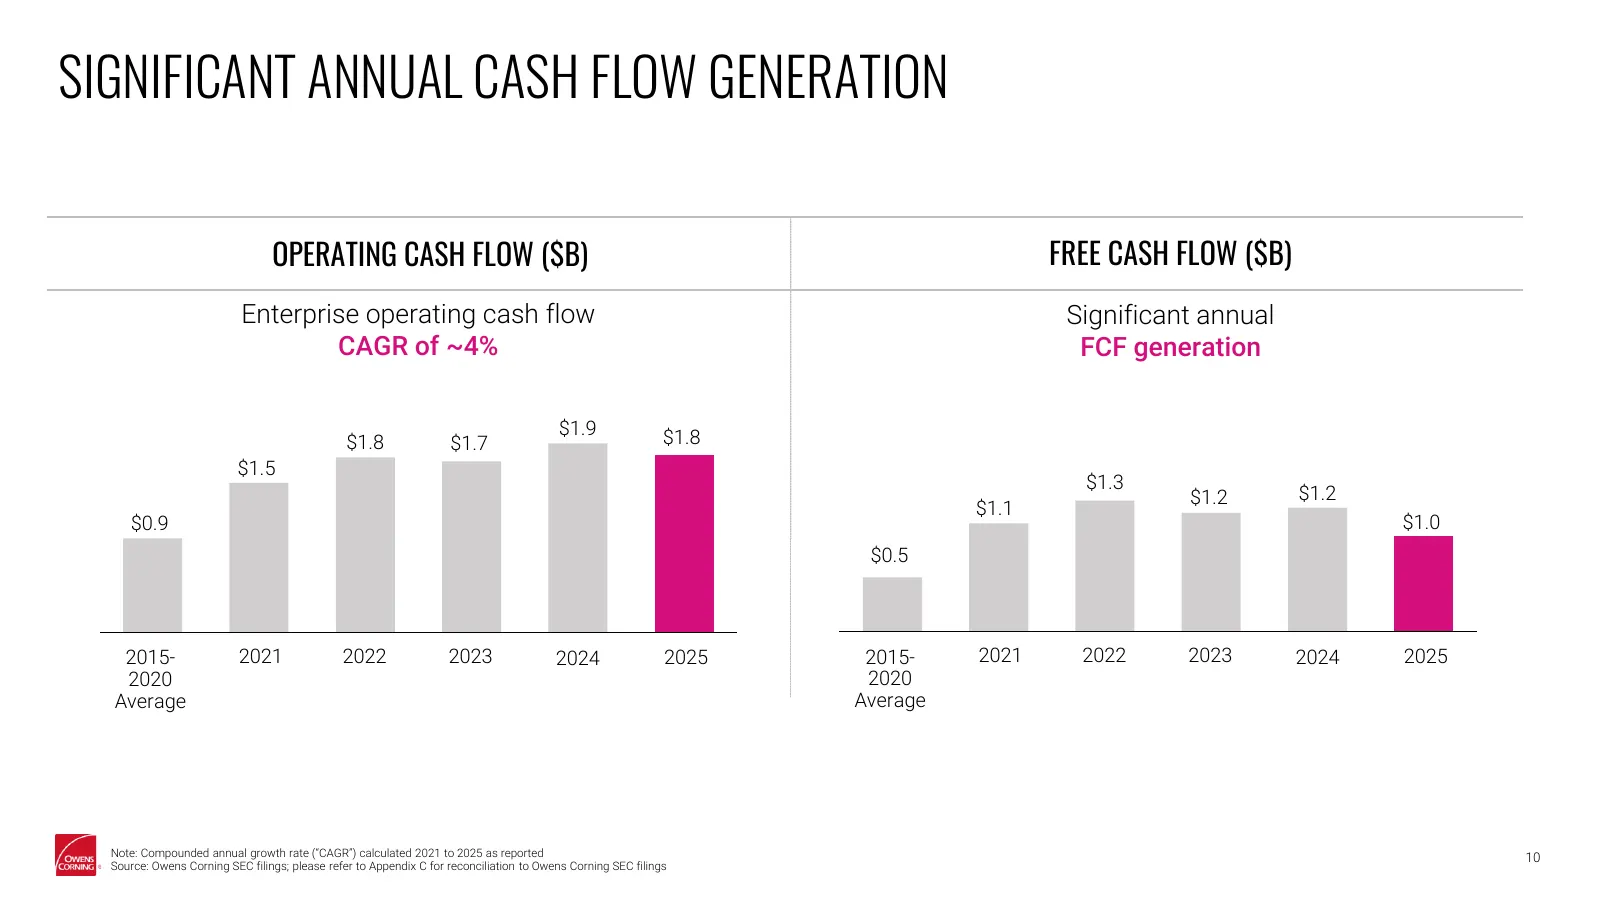
Slide 10: Significant Annual Cash Flow Generation
SIGNIFICANT ANNUAL CASH FLOW GENERATION OPERATING CASH FLOW ($B) FREE CASH FLOW ($B) Enterprise operating cash flow Significant annual CAGR of ~4% FCF generation $1.9 $1.8 $1.8 $1.7 $1.5 $1.3 $1.2 $1.2 $1.1 $0.9 $1.0 $0.5 2015- 2021 2022 2023 2024 2025 2015- 2021 2022 2023 2024 2025 2020 2020 Averag
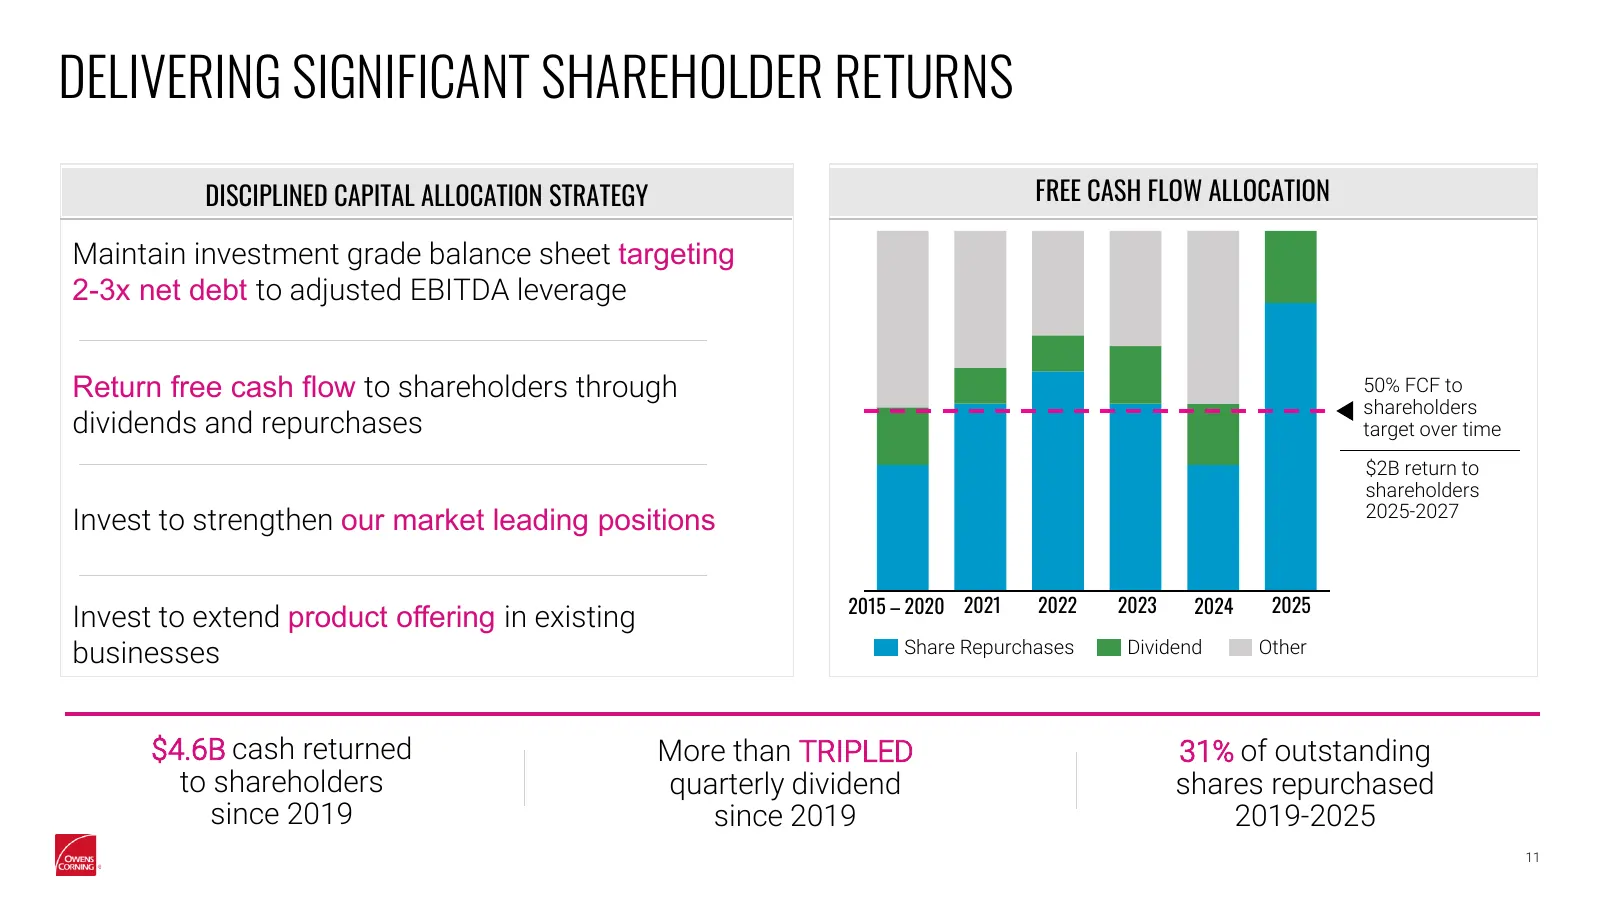
Slide 11: Delivering Significant Shareholder Returns
DELIVERING SIGNIFICANT SHAREHOLDER RETURNS DISCIPLINED CAPITAL ALLOCATION STRATEGY FREE CASH FLOW ALLOCATION Maintain investment grade balance sheet targeting 2-3x net debt to adjusted EBITDA leverage Return free cash flow to shareholders through 50% FCF to shareholders dividends and repurchases tar
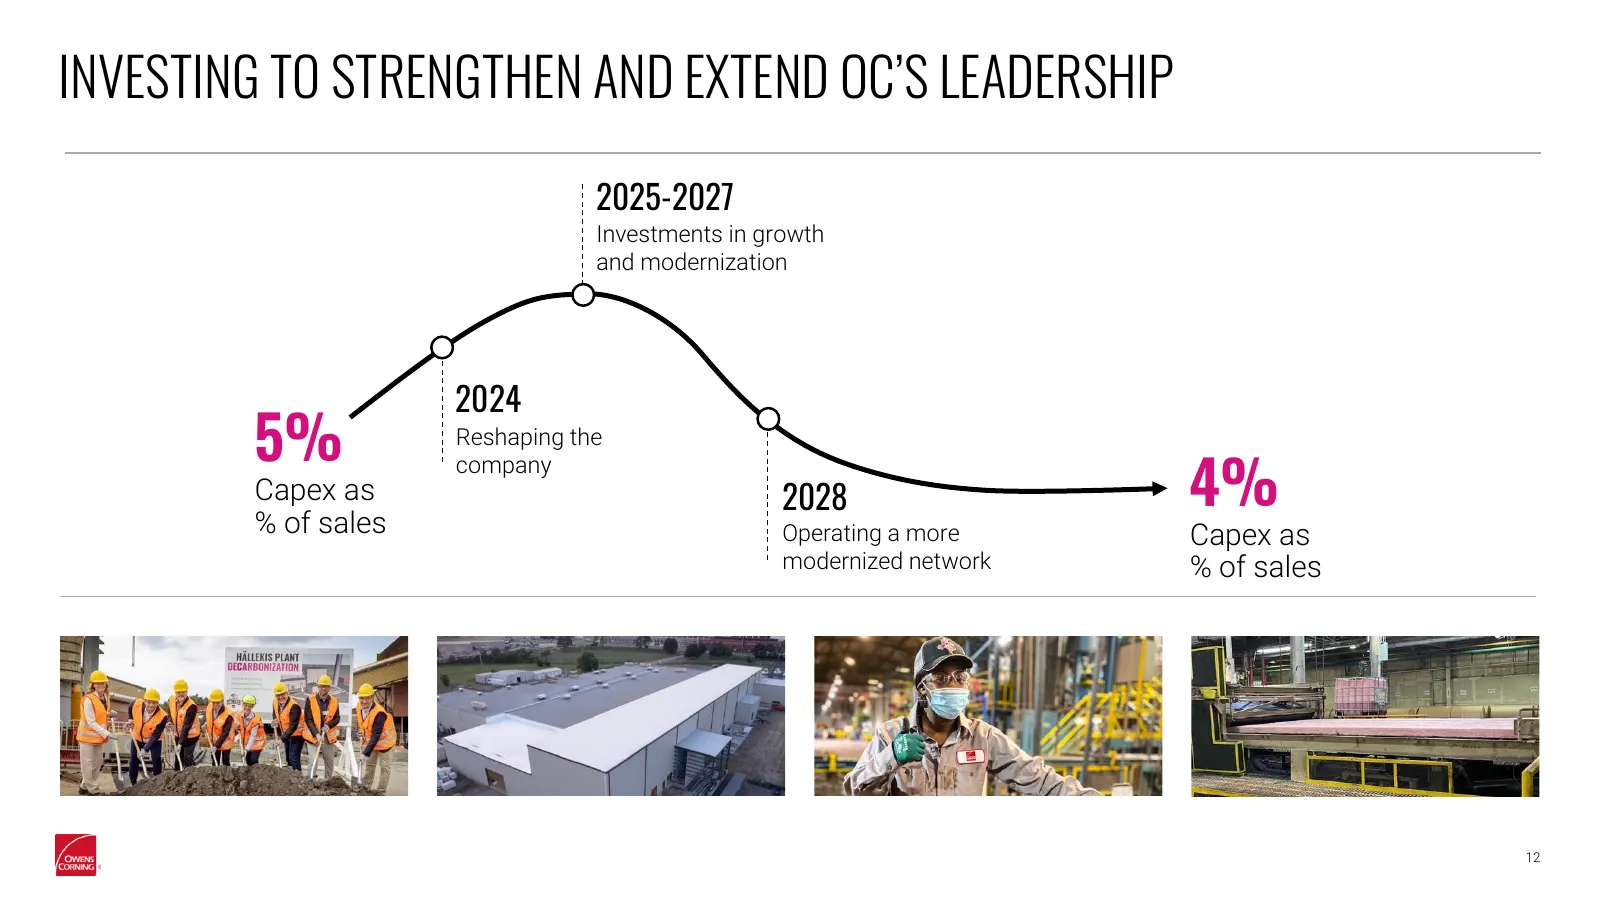
Slide 12: Investing to Strengthen and Extend OC's Leadership
INVESTING TO STRENGTHEN AND EXTEND OC’S LEADERSHIP 2025-2027 Investments in growth and modernization 2024 5% Reshaping the 4% company Capex as 2028 % of sales Operating a more Capex as modernized network % of sales 12
Slide 13: Leading Technology & Sustainability Position
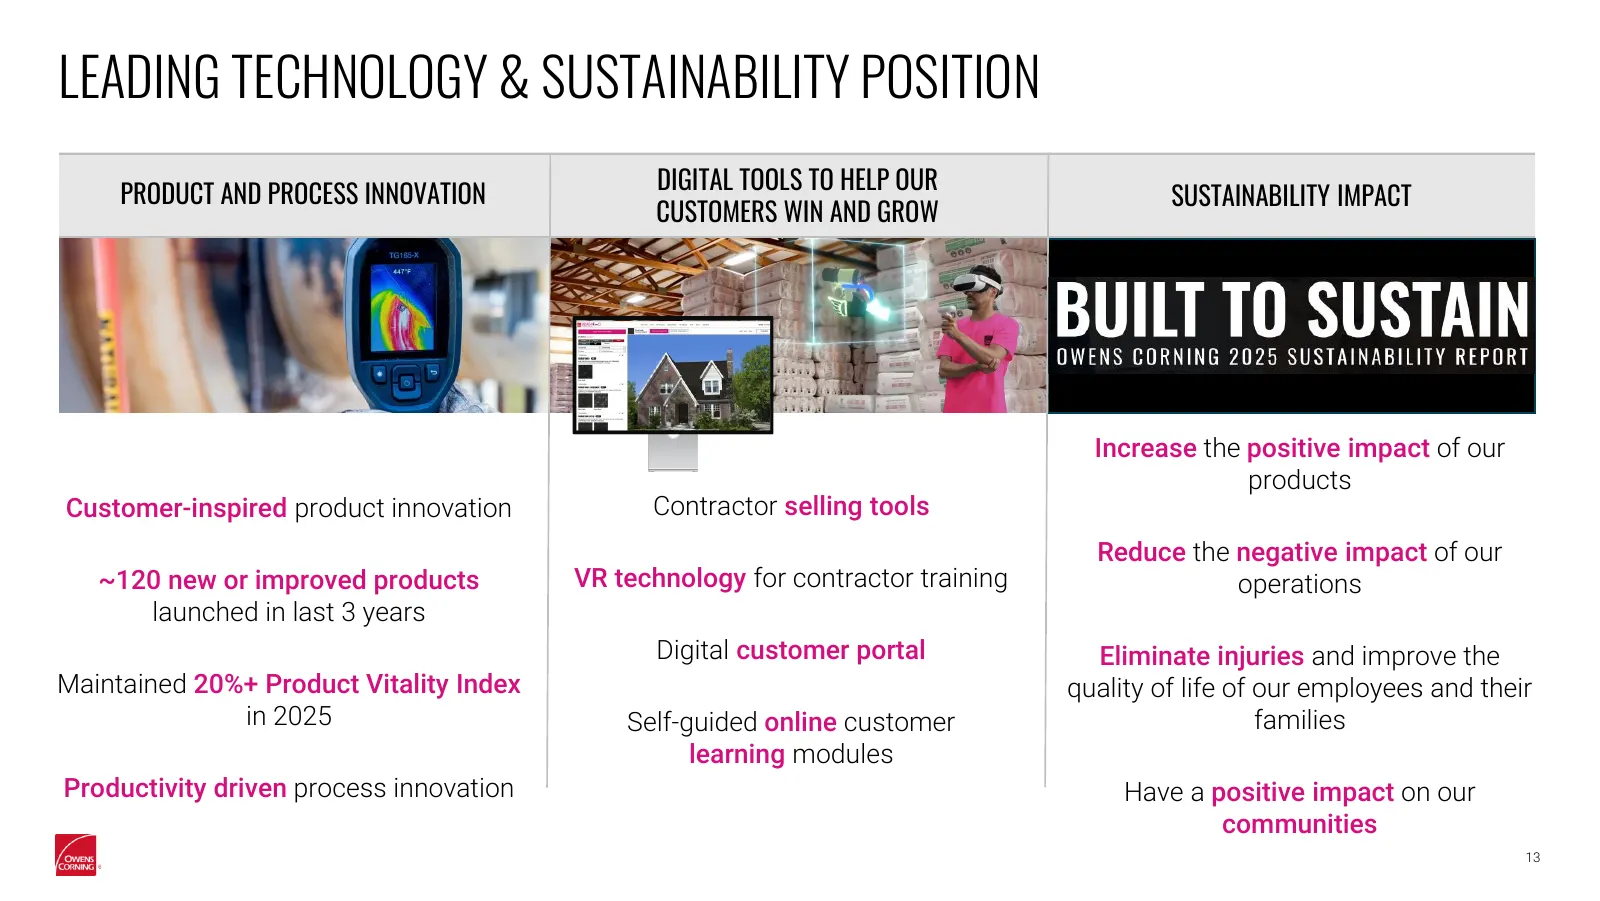
LEADING TECHNOLOGY & SUSTAINABILITY POSITION DIGITAL TOOLS TO HELP OUR PRODUCT AND PROCESS INNOVATION SUSTAINABILITY IMPACT CUSTOMERS WIN AND GROW Increase the positive impact of our products Customer-inspired product innovation Contractor selling tools Reduce the negative impact of our ~120 new or
Slide 14: Roofing Segment Overview
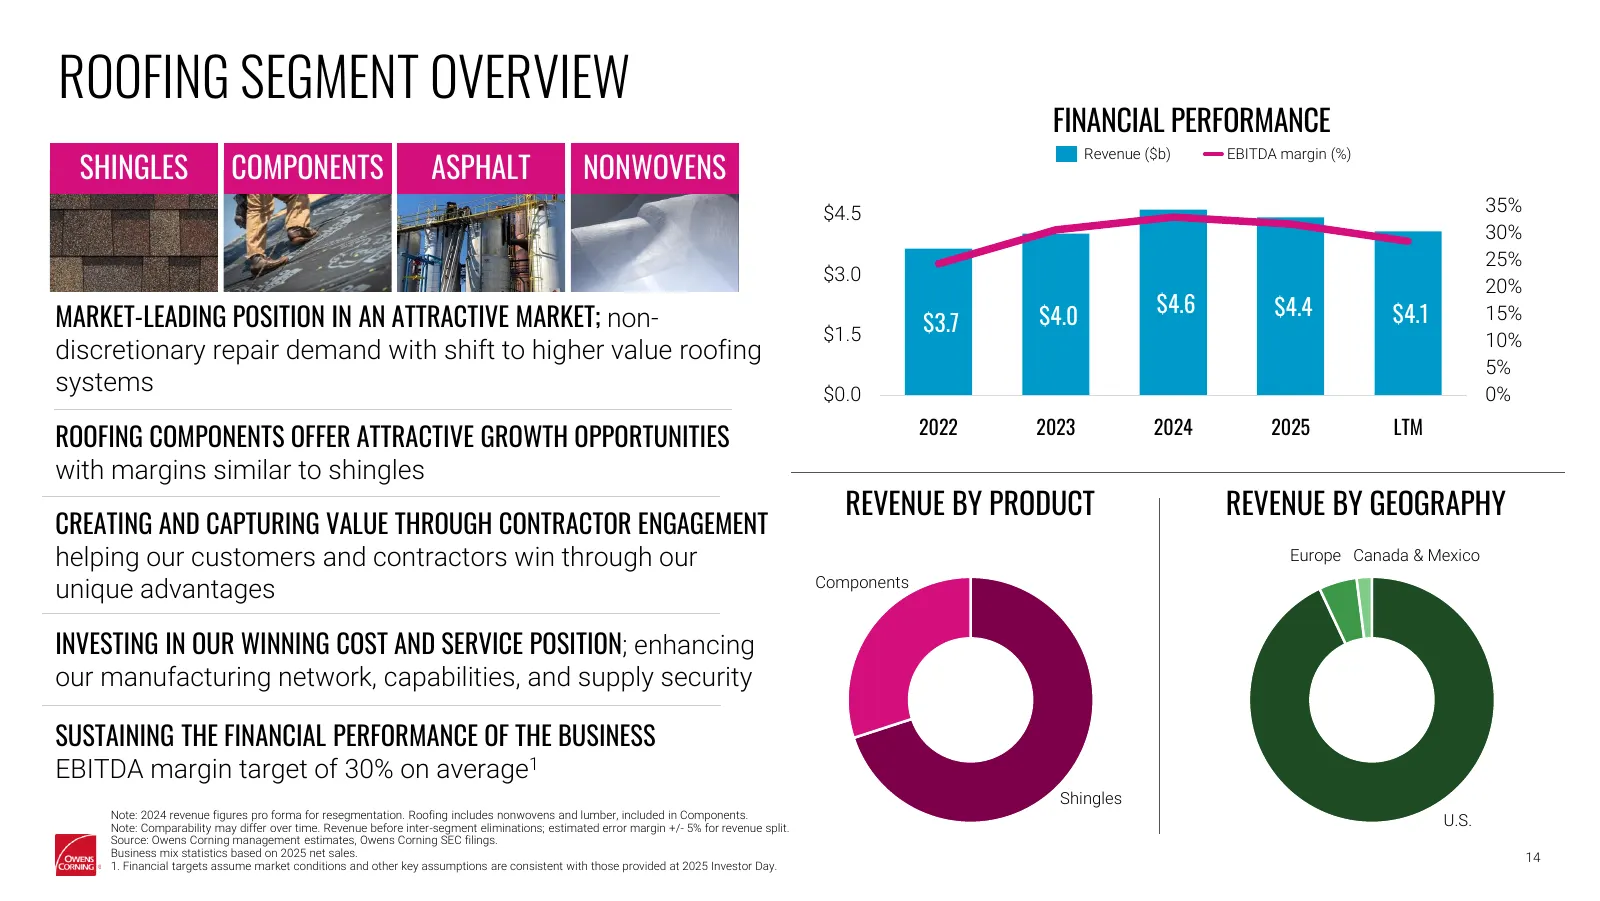
ROOFING SEGMENT OVERVIEW FINANCIAL PERFORMANCE SHINGLES COMPONENTS ASPHALT NONWOVENS Revenue ($b) EBITDA margin (%) $4.5 35% Thousands 30% 25% $3.0 20% $4.6 $4.4 MARKET-LEADING POSITION IN AN ATTRACTIVE MARKET; non- $3.7 $4.0 $4.1 15% $1.5 10% discretionary repair demand with shift to higher value r
Slide 15: Market-Leading Position in an Attractive Roofing Market
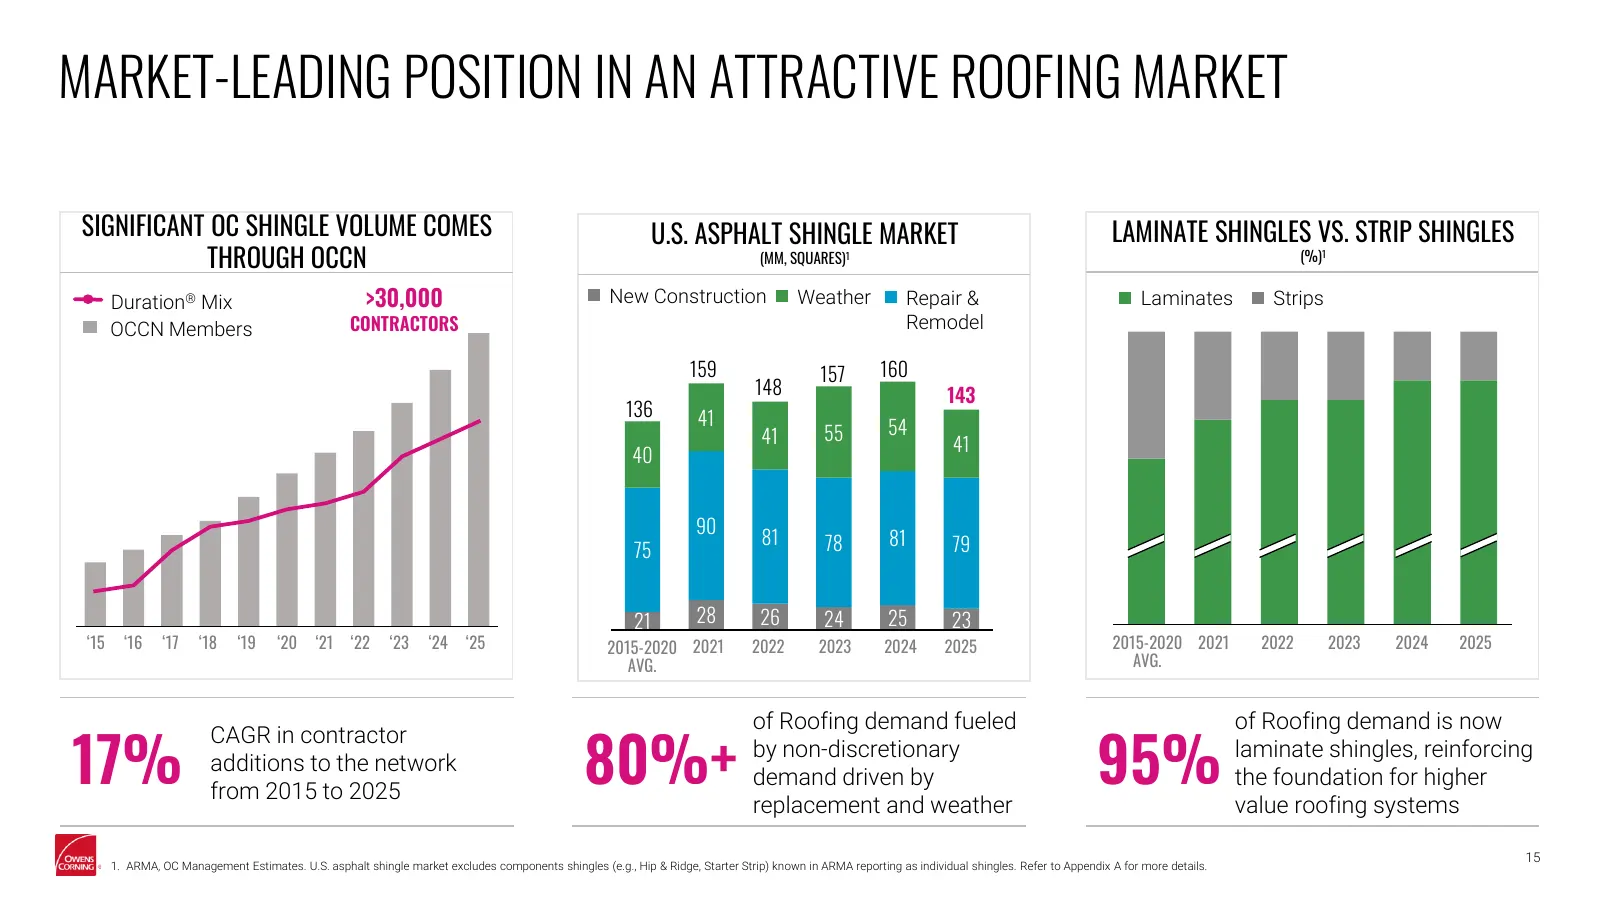
MARKET-LEADING POSITION IN AN ATTRACTIVE ROOFING MARKET SIGNIFICANT OC SHINGLE VOLUME COMES U.S. ASPHALT SHINGLE MARKET LAMINATE SHINGLES VS. STRIP SHINGLES THROUGH OCCN (MM, SQUARES)1 (%)1 Duration® Mix >30,000 New Construction Weather Repair & Laminates Strips OCCN Members CONTRACTORS Remodel 159
Slide 16: Insulation Segment Overview
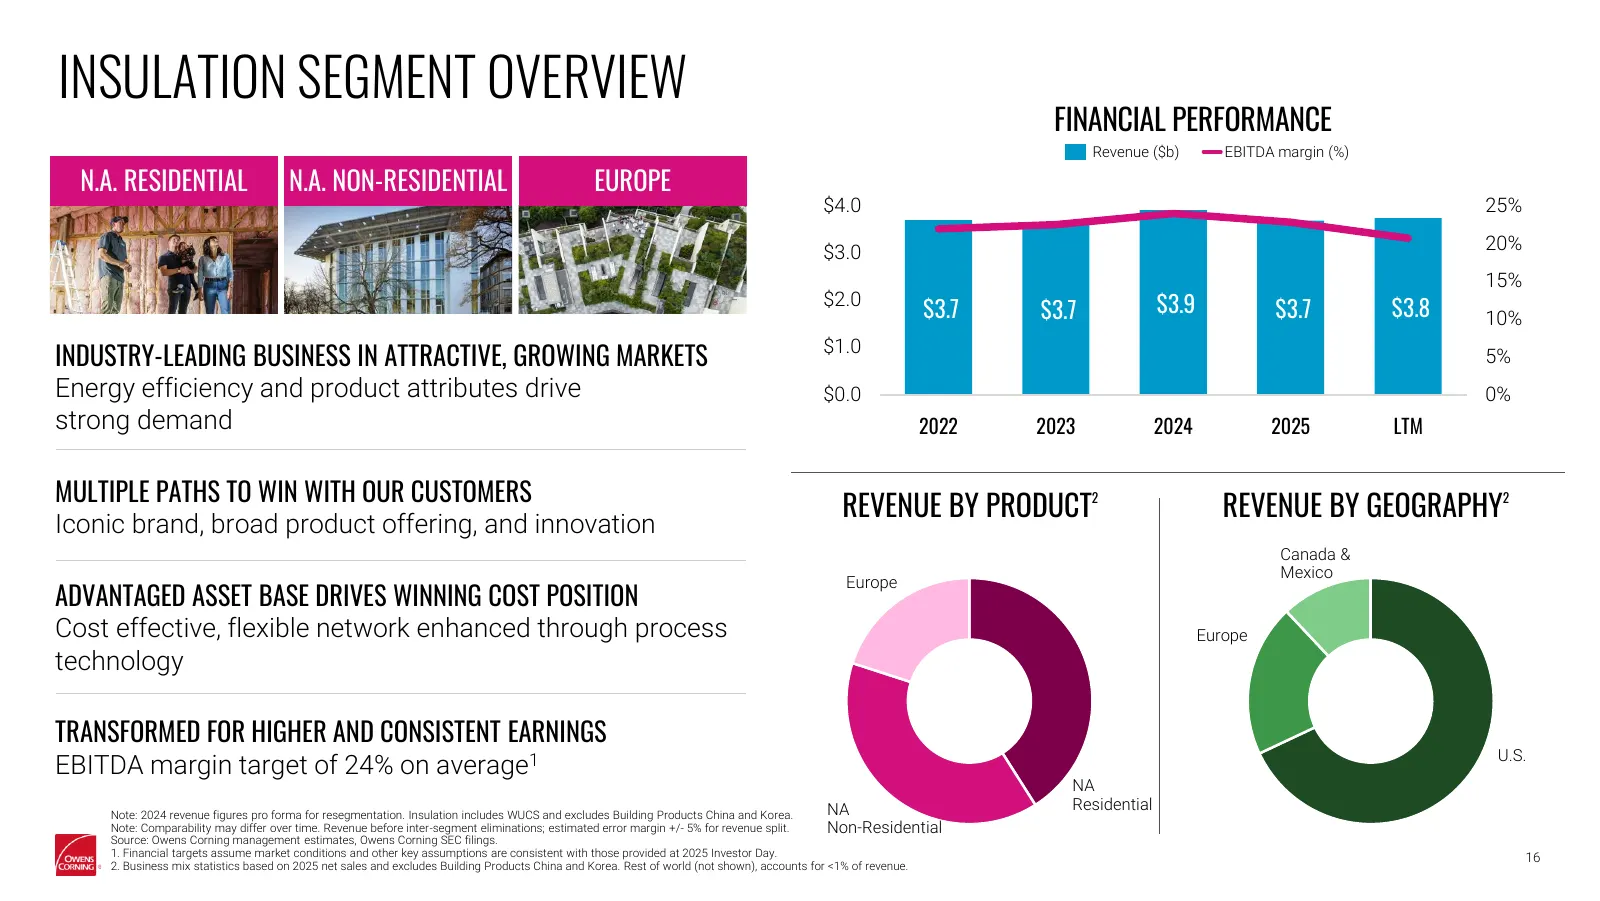
INSULATION SEGMENT OVERVIEW FINANCIAL PERFORMANCE Revenue ($b) EBITDA margin (%) N.A. RESIDENTIAL N.A. NON-RESIDENTIAL EUROPE $4.0 25% Thousands $3.0 20% 15% $2.0 $3.7 $3.7 $3.9 $3.7 $3.8 10% INDUSTRY-LEADING BUSINESS IN ATTRACTIVE, GROWING MARKETS $1.0 5% Energy efficiency and product attributes dr
Slide 17: Attractive Long-Term Secular Trends in Insulation
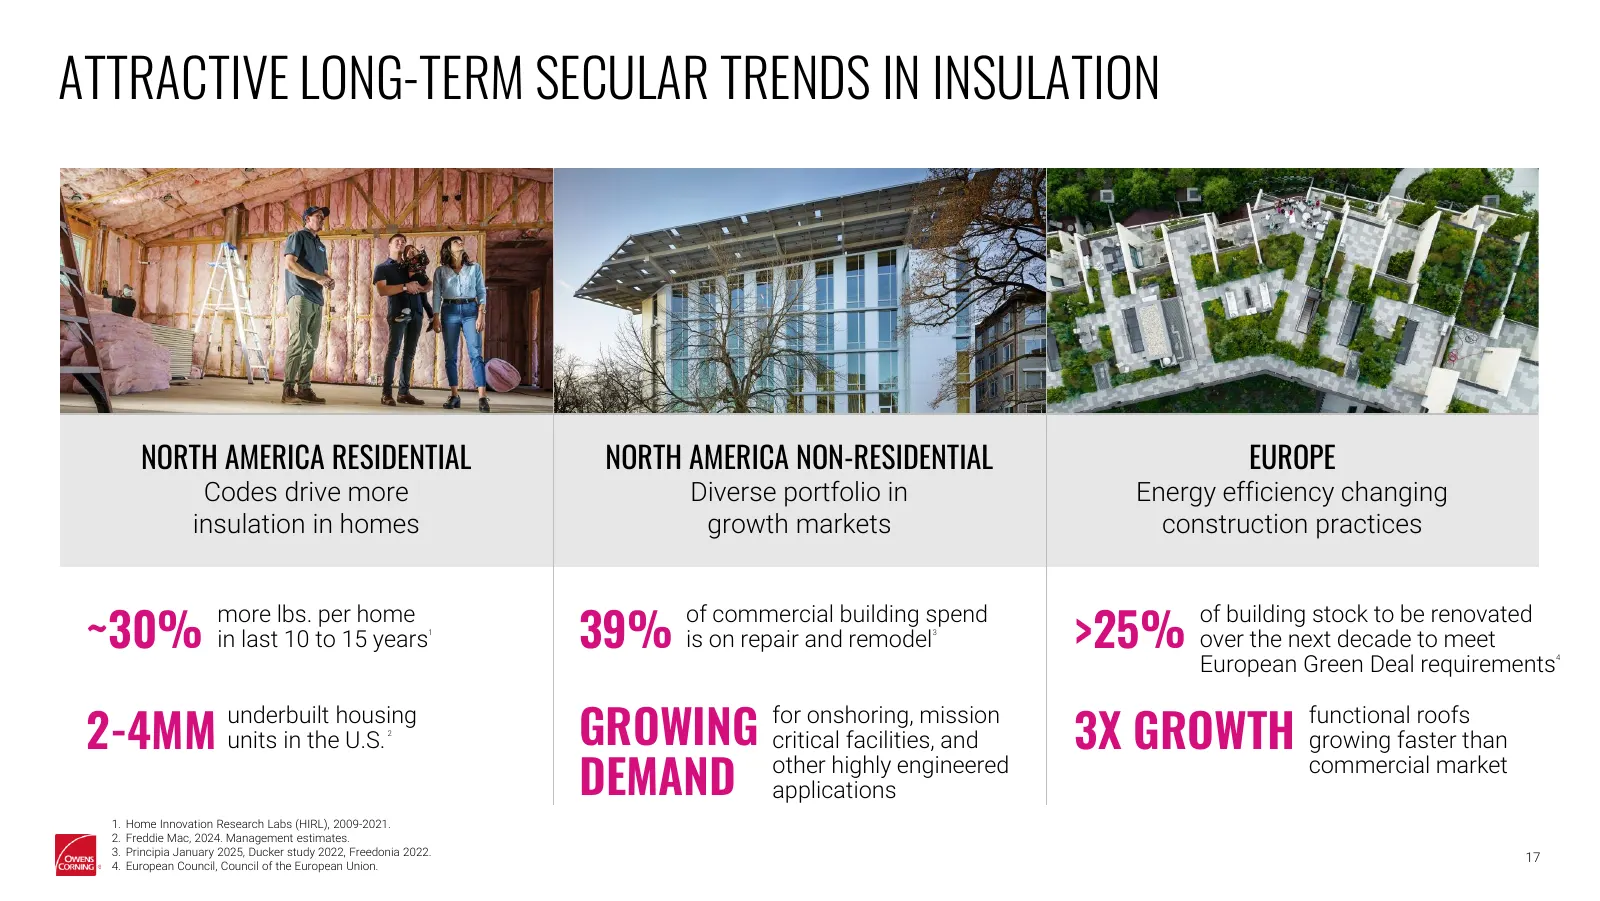
ATTRACTIVE LONG-TERM SECULAR TRENDS IN INSULATION NORTH AMERICA RESIDENTIAL NORTH AMERICA NON-RESIDENTIAL EUROPE Codes drive more Diverse portfolio in Energy efficiency changing insulation in homes growth markets construction practices ~30% 39% >25% more lbs. per home of commercial building spend of
Slide 18: Doors Segment Overview
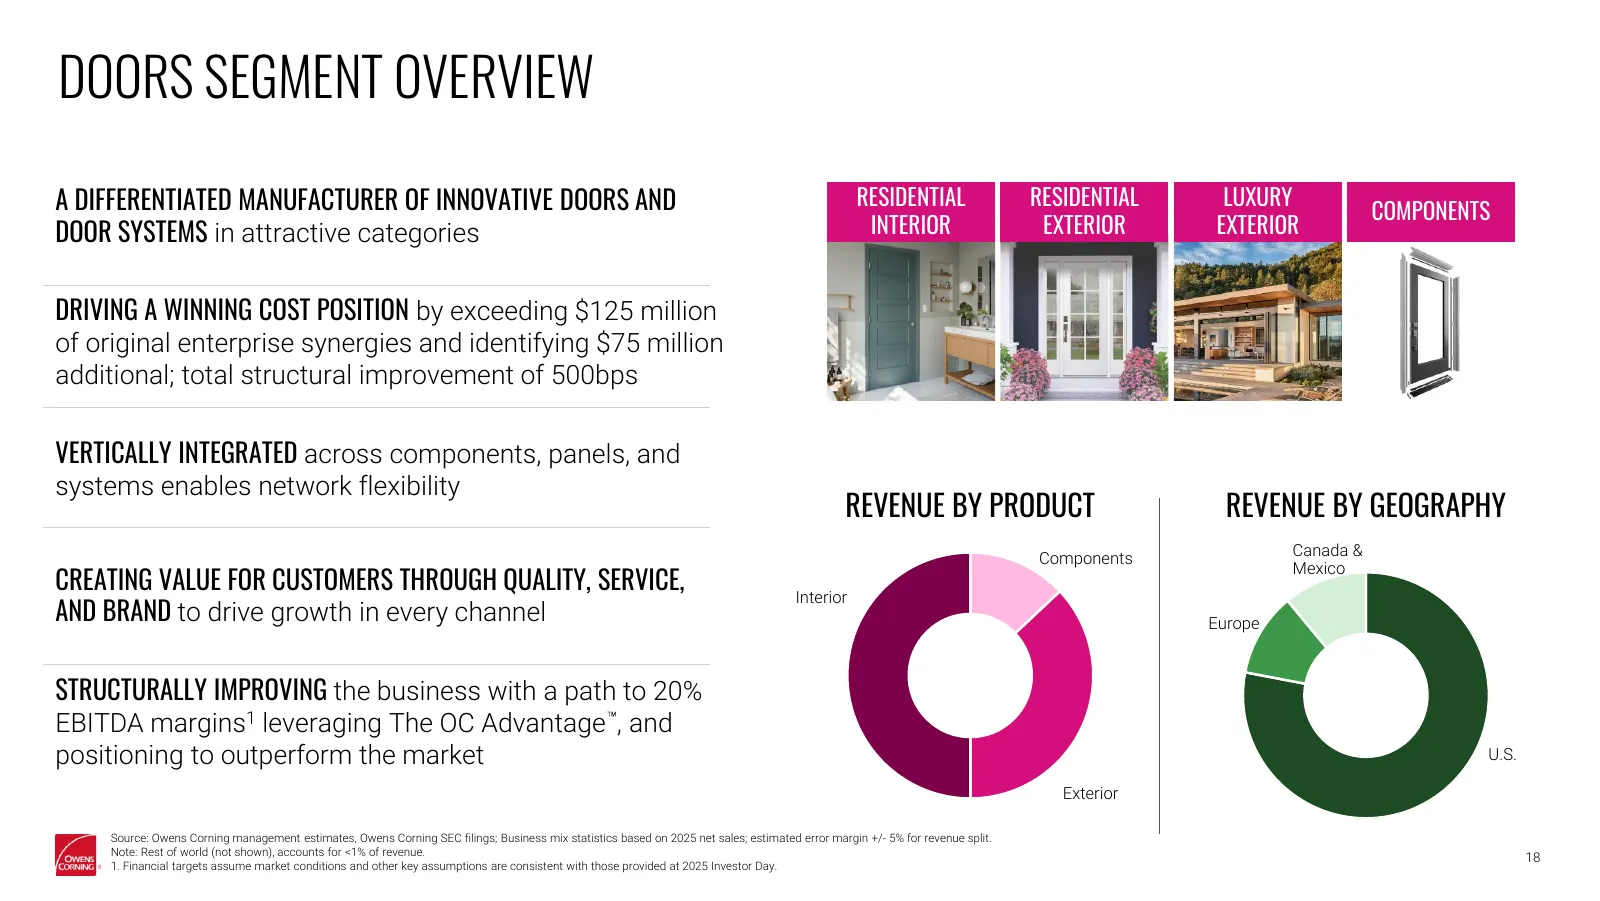
DOORS SEGMENT OVERVIEW A DIFFERENTIATED MANUFACTURER OF INNOVATIVE DOORS AND RESIDENTIAL RESIDENTIAL LUXURY COMPONENTS DOOR SYSTEMS in attractive categories INTERIOR EXTERIOR EXTERIOR DRIVING A WINNING COST POSITION by exceeding $125 million of original enterprise synergies and identifying $75 milli
Slide 19: Accelerating Doors Growth Through a Unique Go-to-Market Strategy
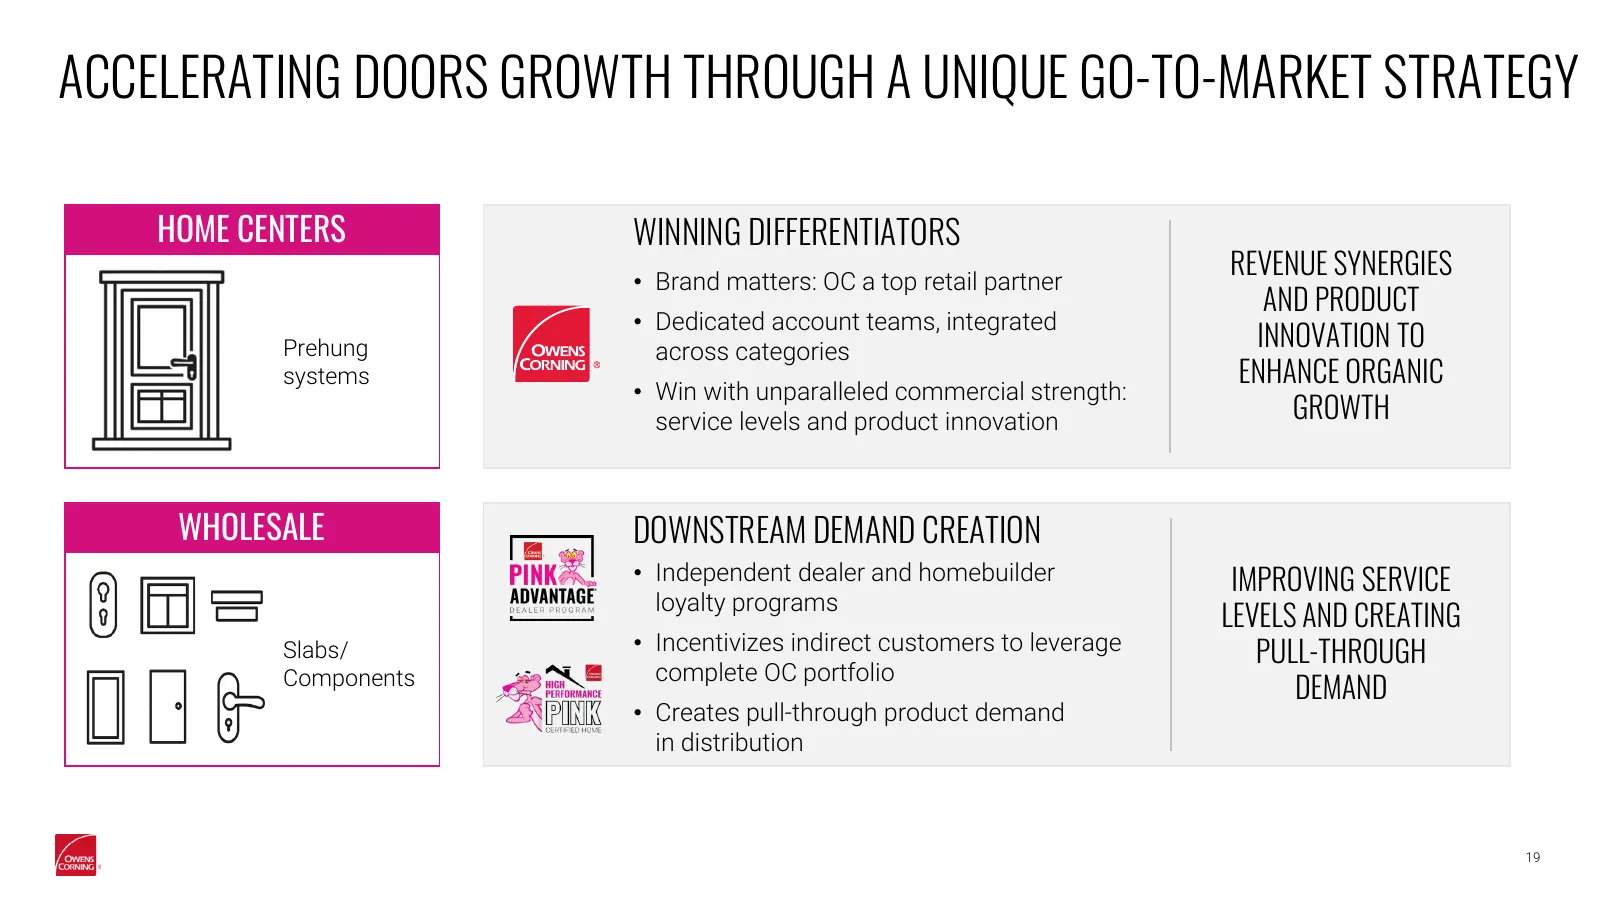
ACCELERATING DOORS GROWTH THROUGH A UNIQUE GO-TO-MARKET STRATEGY HOME CENTERS WINNING DIFFERENTIATORS • Brand matters: OC a top retail partner REVENUE SYNERGIES AND PRODUCT • Dedicated account teams, integrated Prehung across categories INNOVATION TO systems ENHANCE ORGANIC • Win with unparalleled c
Slide 20: Building a Winning Cost Position in Doors
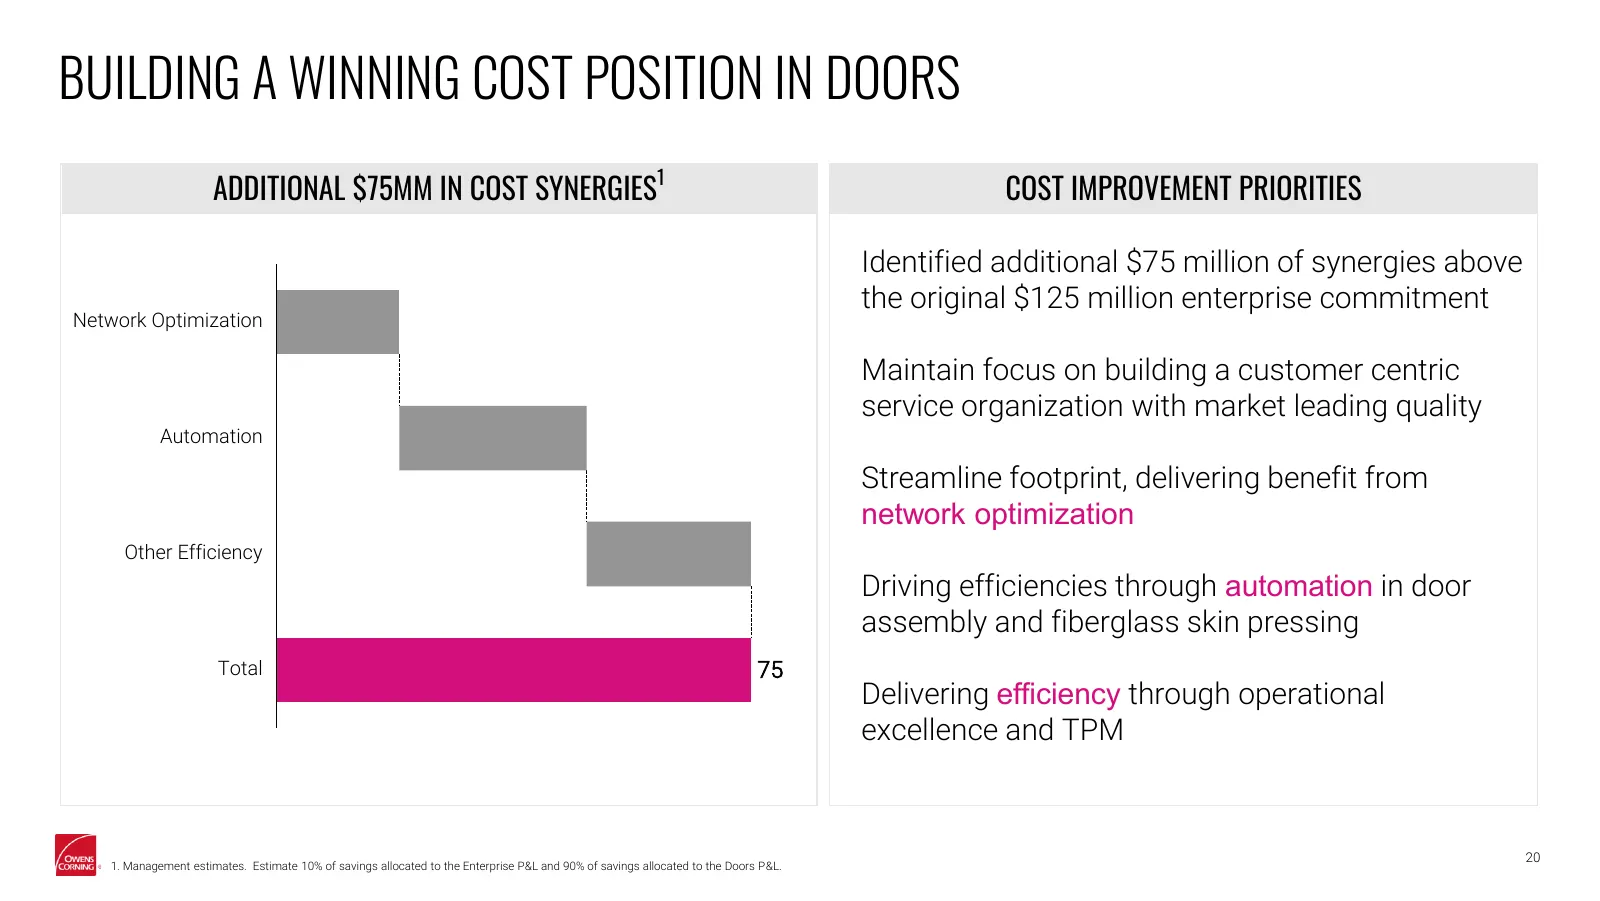
BUILDING A WINNING COST POSITION IN DOORS ADDITIONAL $75MM IN COST SYNERGIES1 COST IMPROVEMENT PRIORITIES Identified additional $75 million of synergies above the original $125 million enterprise commitment Network Optimization Maintain focus on building a customer centric service organization with
Slide 21: Appendix A: U.S. Roofing Market
APPENDIX A: U.S. ROOFING MARKET
Slide 22: Appendix A: U.S. Roofing Market
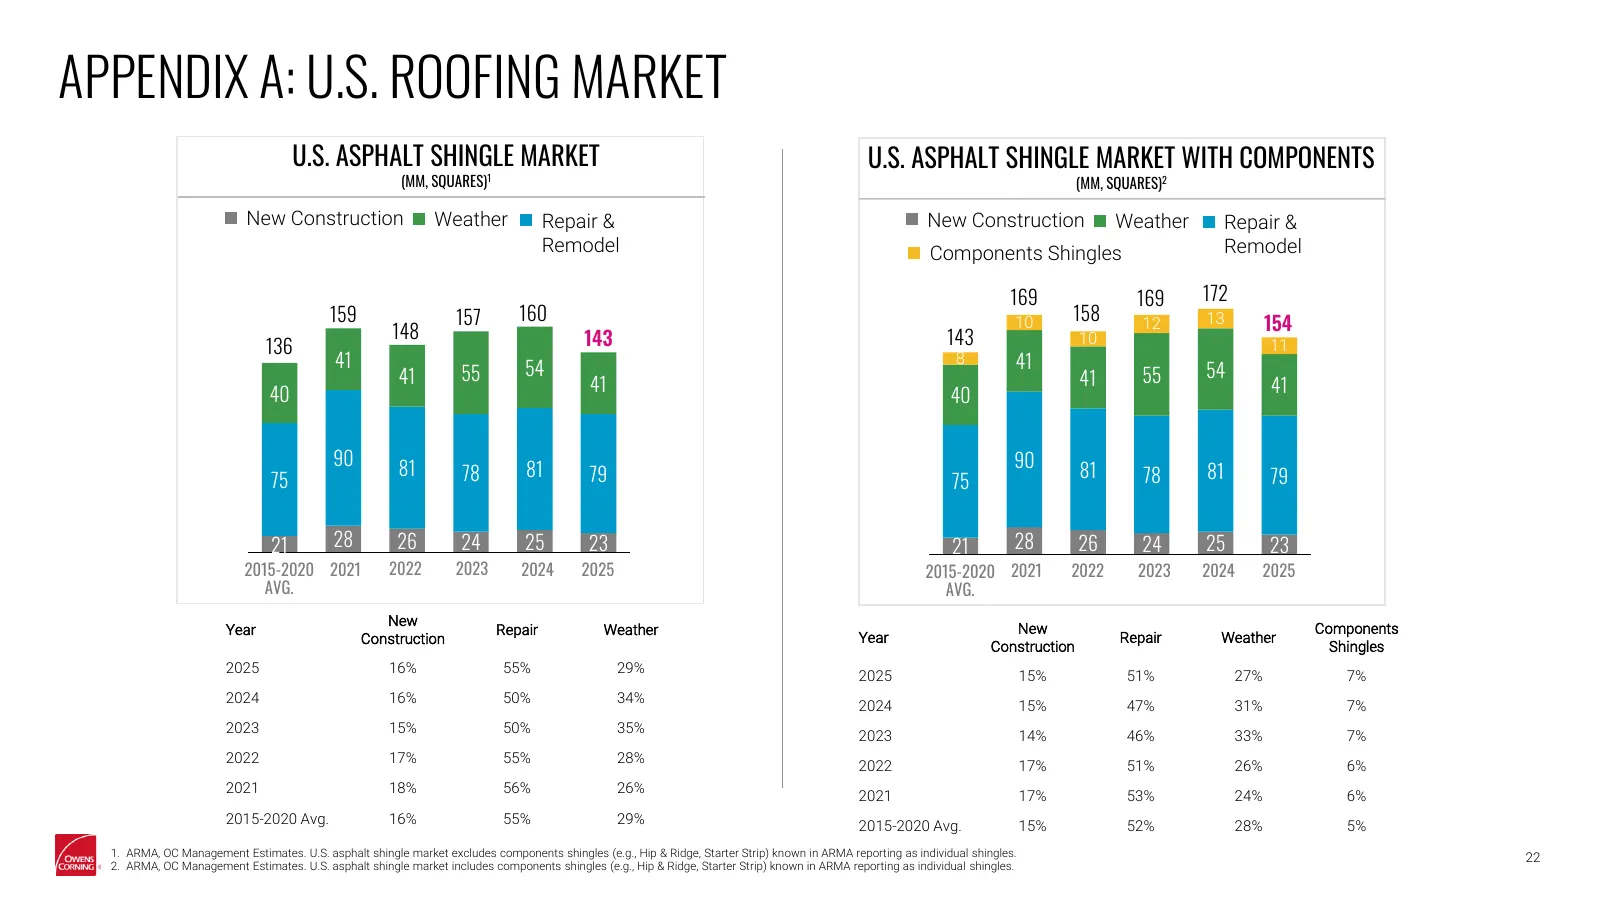
APPENDIX A: U.S. ROOFING MARKET U.S. ASPHALT SHINGLE MARKET U.S. ASPHALT SHINGLE MARKET WITH COMPONENTS (MM, SQUARES)1 (MM, SQUARES)2 New Construction Weather Repair & New Construction Weather Repair & Remodel Components Shingles Remodel 169 169 172 159 157 160 158 148 10 12 13 154 136 143 143 10 11
Slide 23: Appendix B: Additional Financial Information
APPENDIX B: ADDITIONAL FINANCIAL INFORMATION
Slide 24: Appendix B: Key Financial Data – Businesses
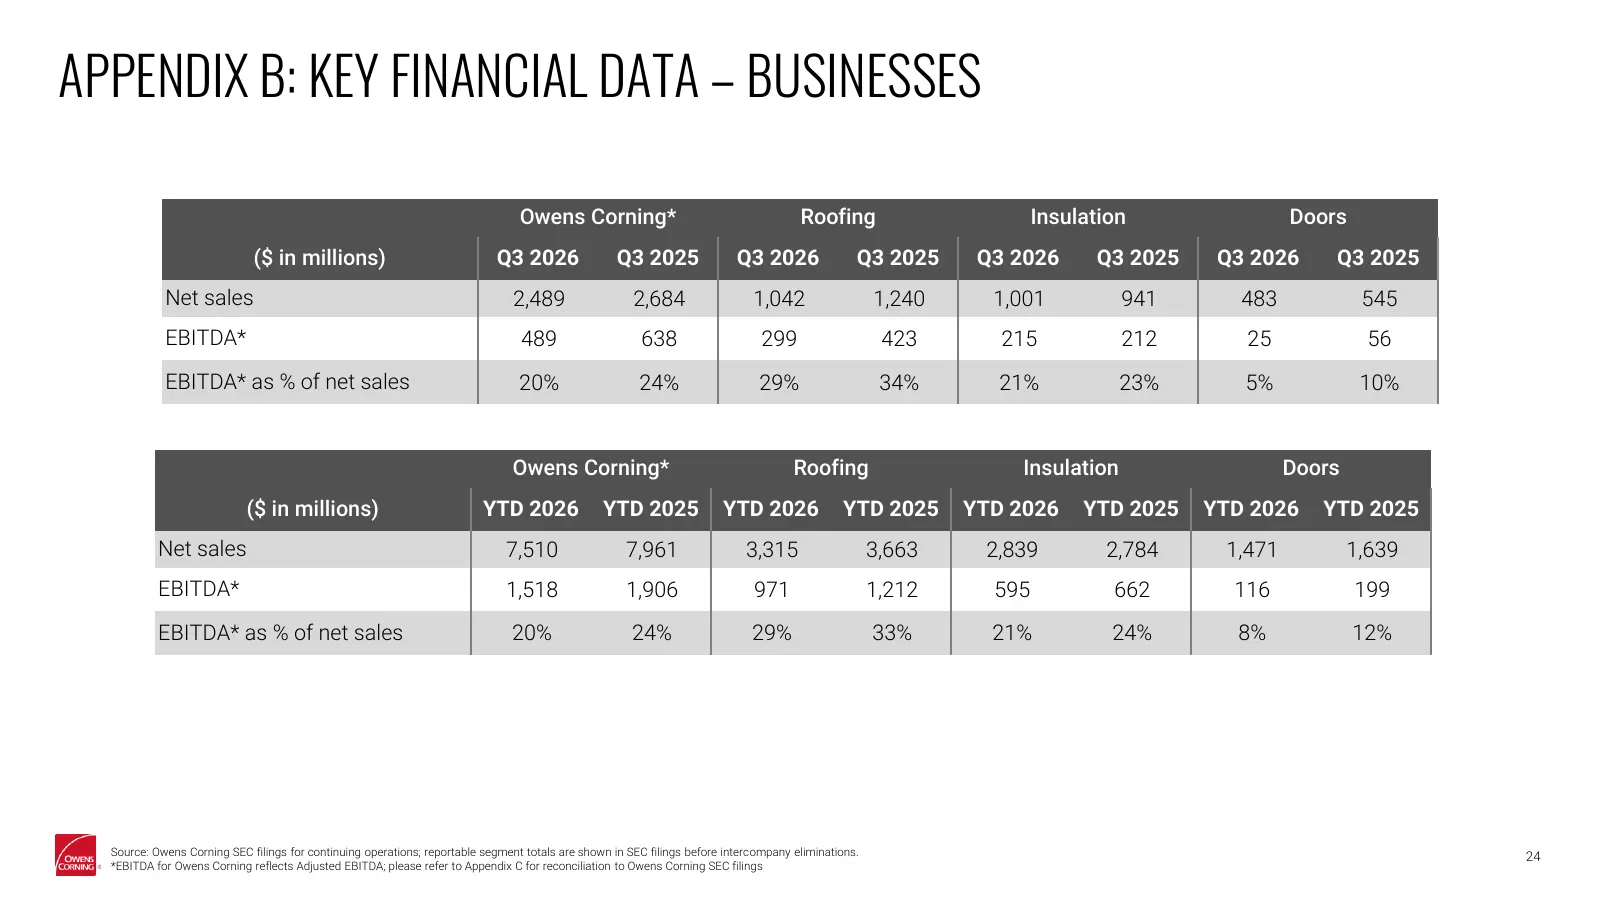
APPENDIX B: KEY FINANCIAL DATA – BUSINESSES Owens Corning* Roofing Insulation Doors ($ in millions) Q3 2026 Q3 2025 Q3 2026 Q3 2025 Q3 2026 Q3 2025 Q3 2026 Q3 2025 Net sales 2,489 2,684 1,042 1,240 1,001 941 483 545 EBITDA* 489 638 299 423 215 212 25 56 EBITDA* as % of net sales 20% 24% 29% 34% 21%
Slide 25: Appendix B: Key Financial Data – Disaggregated Revenue
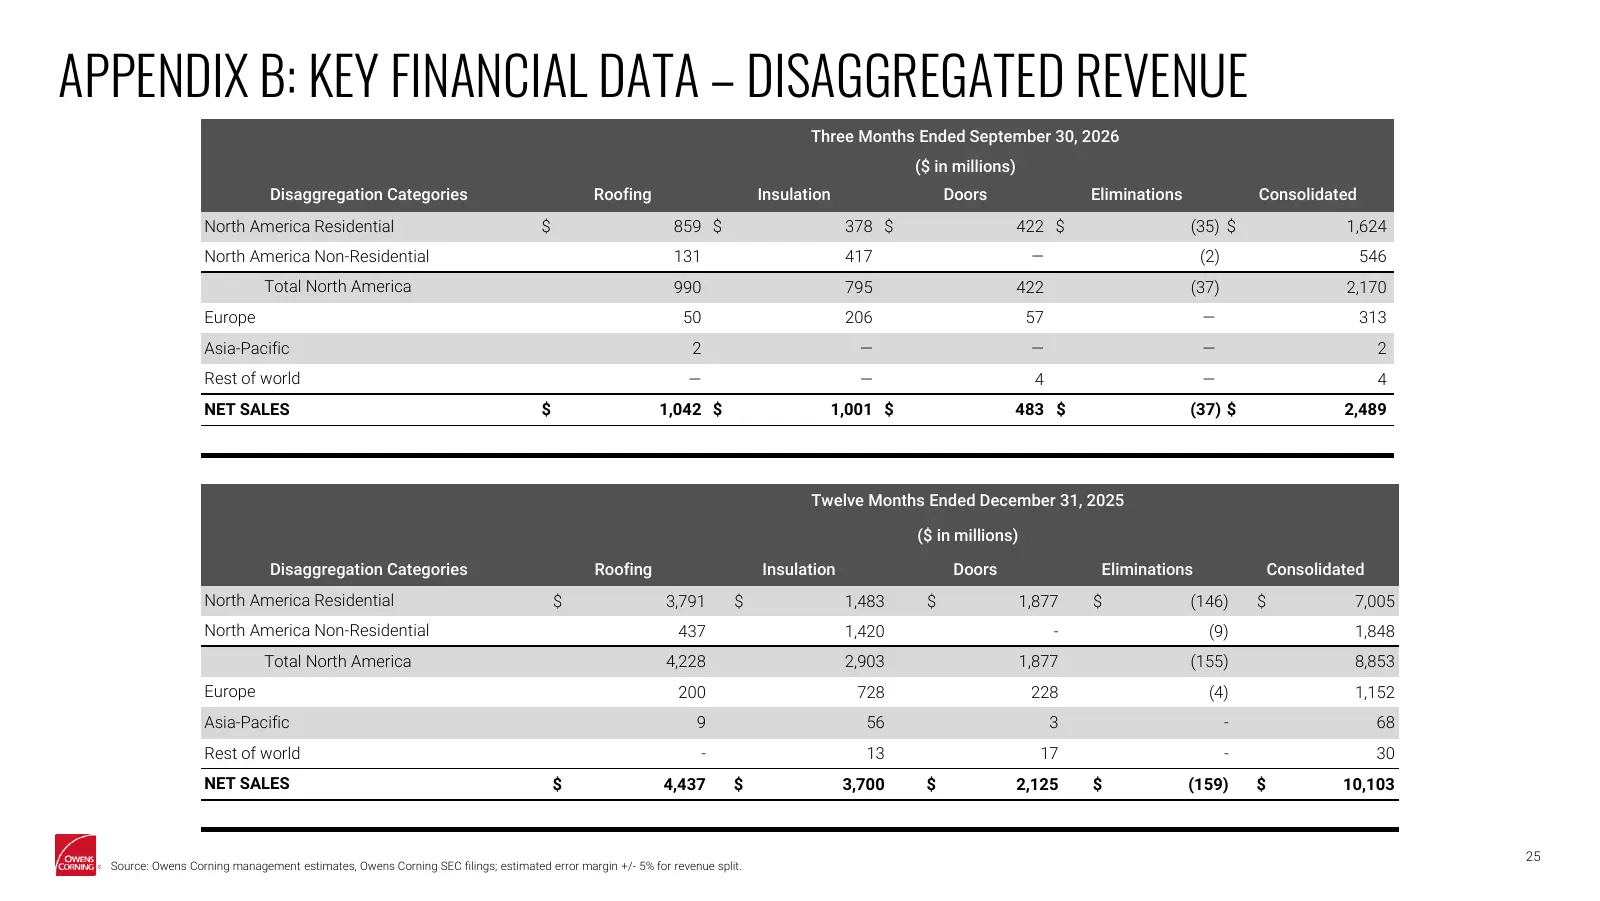
APPENDIX B: KEY FINANCIAL DATA – DISAGGREGATED REVENUE Three Months Ended September 30, 2026 ($ in millions) Disaggregation Categories Roofing Insulation Doors Eliminations Consolidated North America Residential $ 859 $ 378 $ 422 $ (35) $ 1,624 North America Non-Residential 131 417 — (2) 546 Total N
Slide 26: Appendix C: Non-GAAP Reconciliations
APPENDIX C: NON-GAAP RECONCILIATIONS
Slide 27: Appendix C: Non-GAAP Reconciliation – Table 1
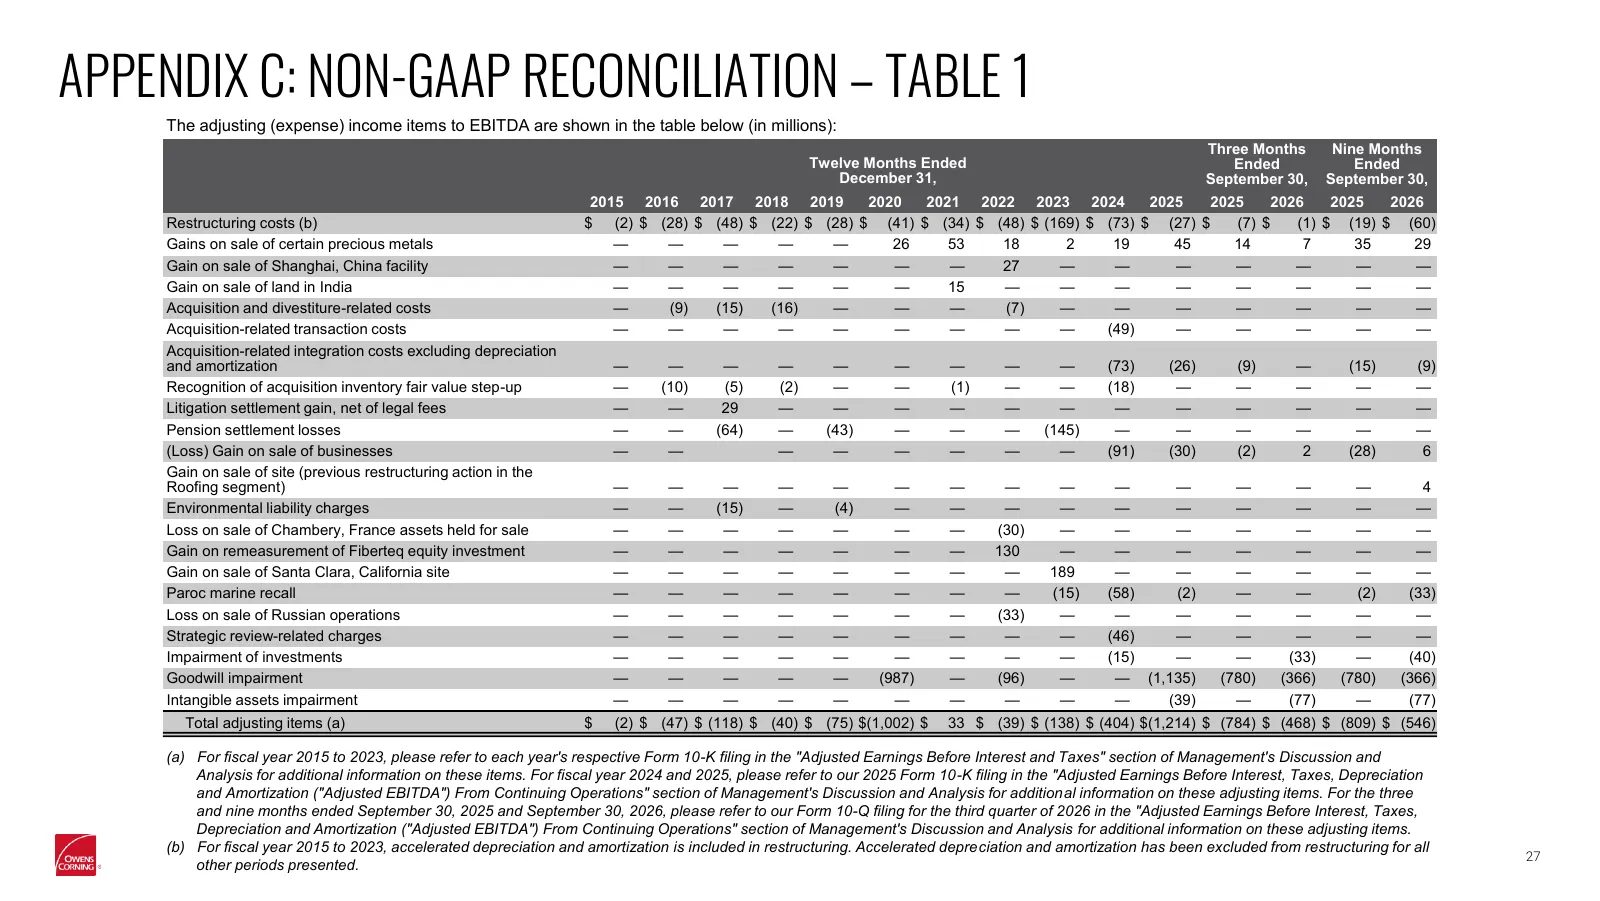
APPENDIX C: NON-GAAP RECONCILIATION – TABLE 1 The adjusting (expense) income items to EBITDA are shown in the table below (in millions): Three Months Nine Months Twelve Months Ended Ended Ended December 31, September 30, September 30, 2015 2016 2017 2018 2019 2020 2021 2022 2023 2024 2025 2025 2026
Slide 28: Appendix C: Non-GAAP Reconciliation – Table 2
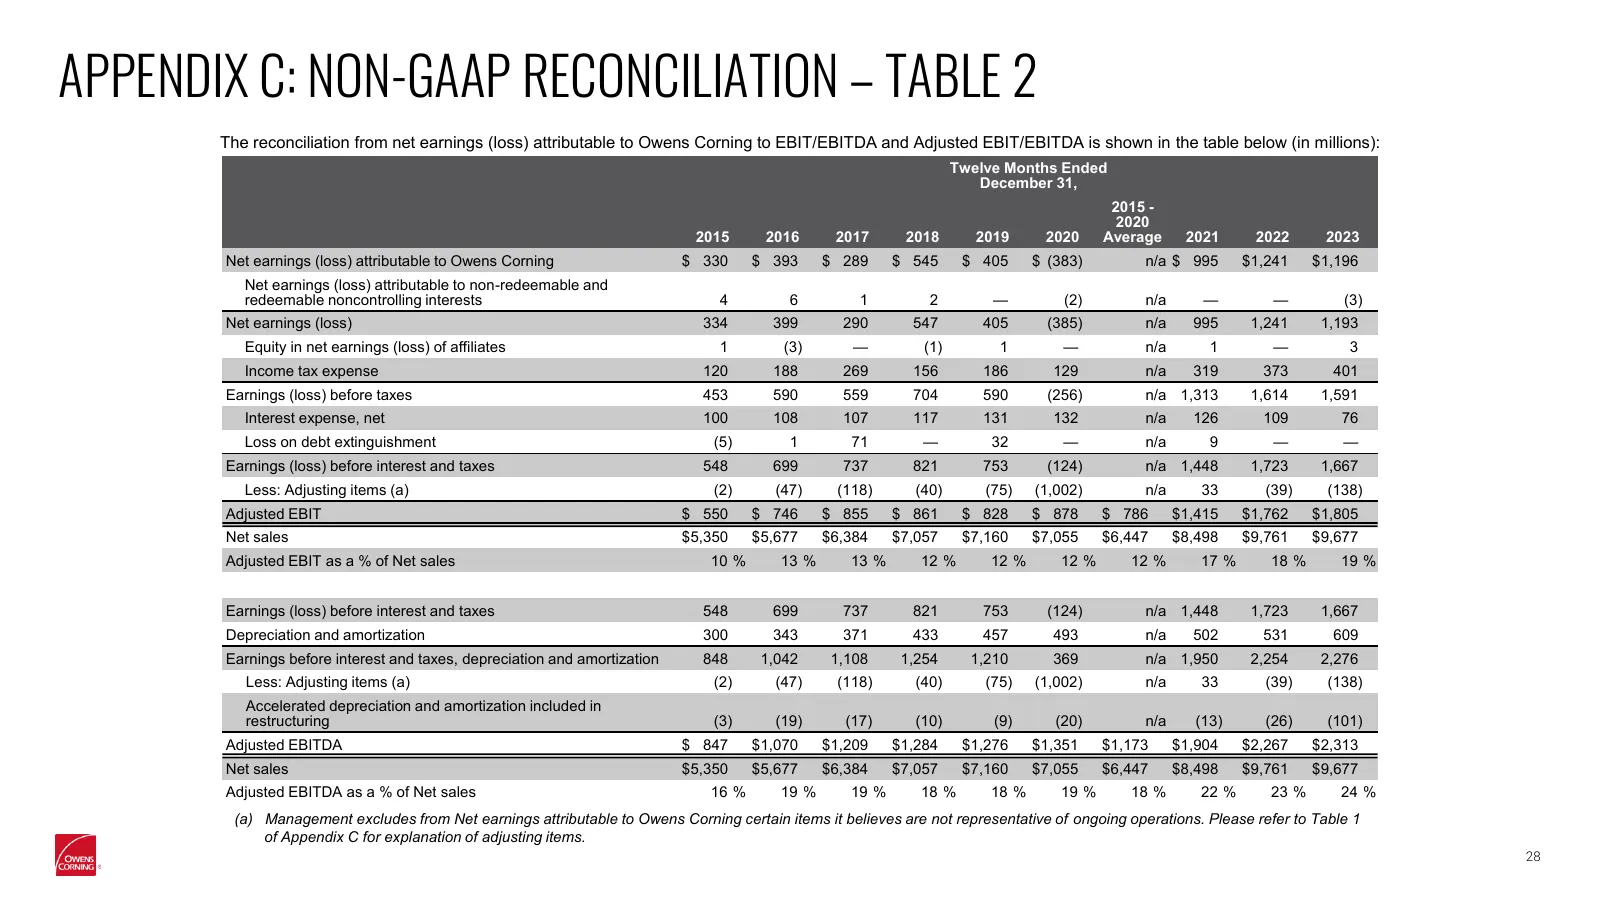
APPENDIX C: NON-GAAP RECONCILIATION – TABLE 2 The reconciliation from net earnings (loss) attributable to Owens Corning to EBIT/EBITDA and Adjusted EBIT/EBITDA is shown in the table below (in millions): Twelve Months Ended December 31, 2015 - 2020 2015 2016 2017 2018 2019 2020 Average 2021 2022 2023
Slide 29: Appendix C: Non-GAAP Reconciliation – Table 3
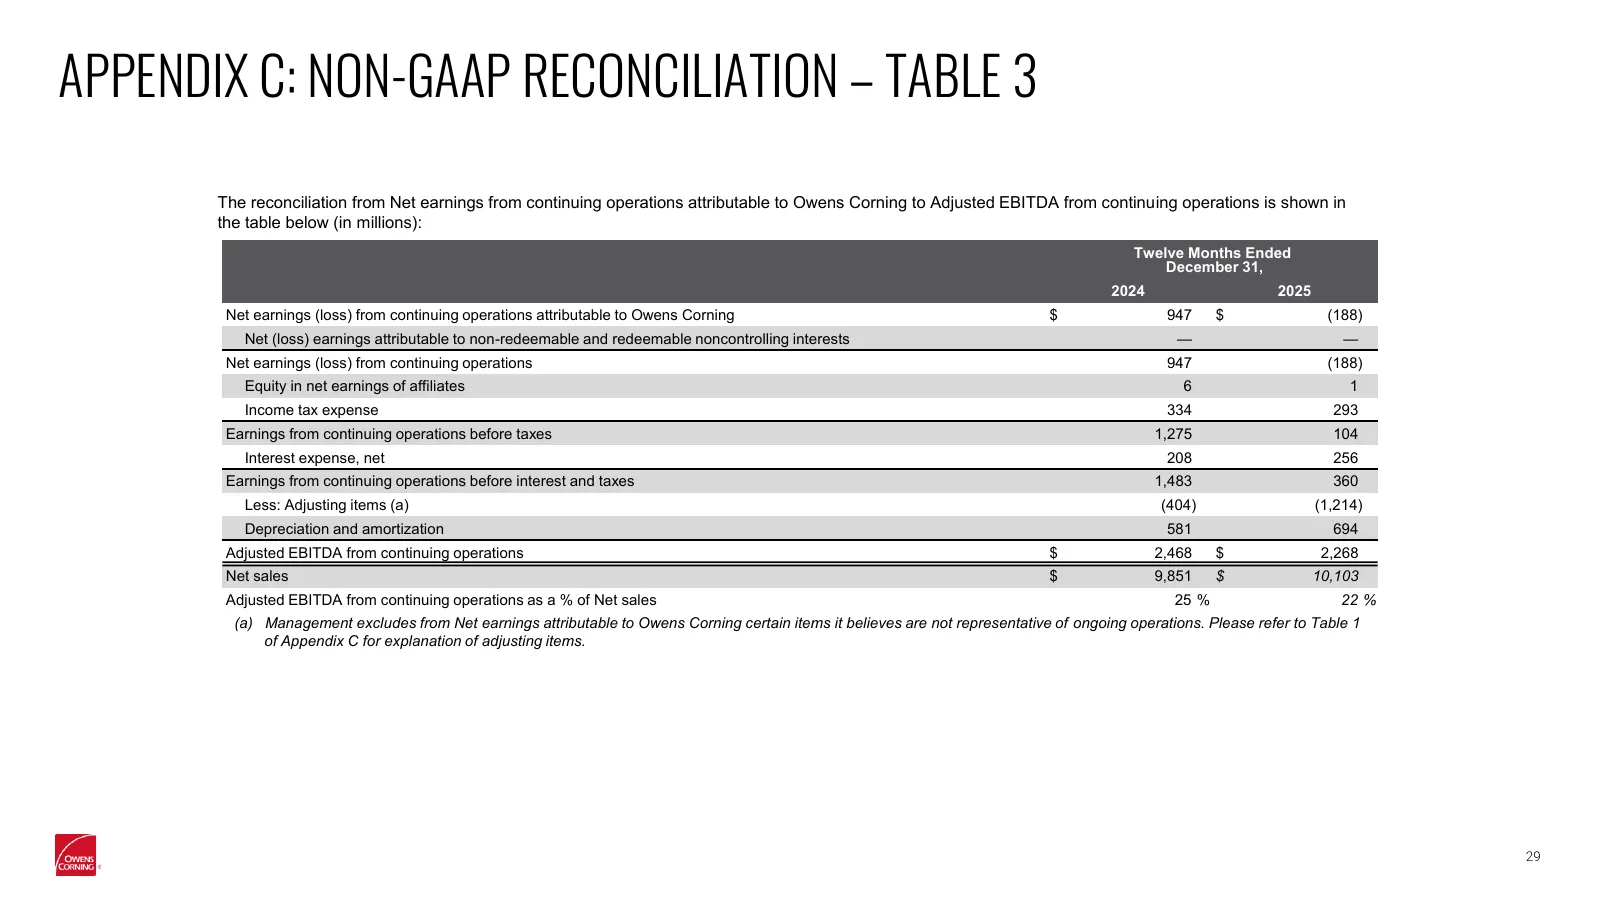
APPENDIX C: NON-GAAP RECONCILIATION – TABLE 3 The reconciliation from Net earnings from continuing operations attributable to Owens Corning to Adjusted EBITDA from continuing operations is shown in the table below (in millions): Twelve Months Ended December 31, 2024 2025 Net earnings (loss) from con
Slide 30: Appendix C: Non-GAAP Reconciliation – Table 4
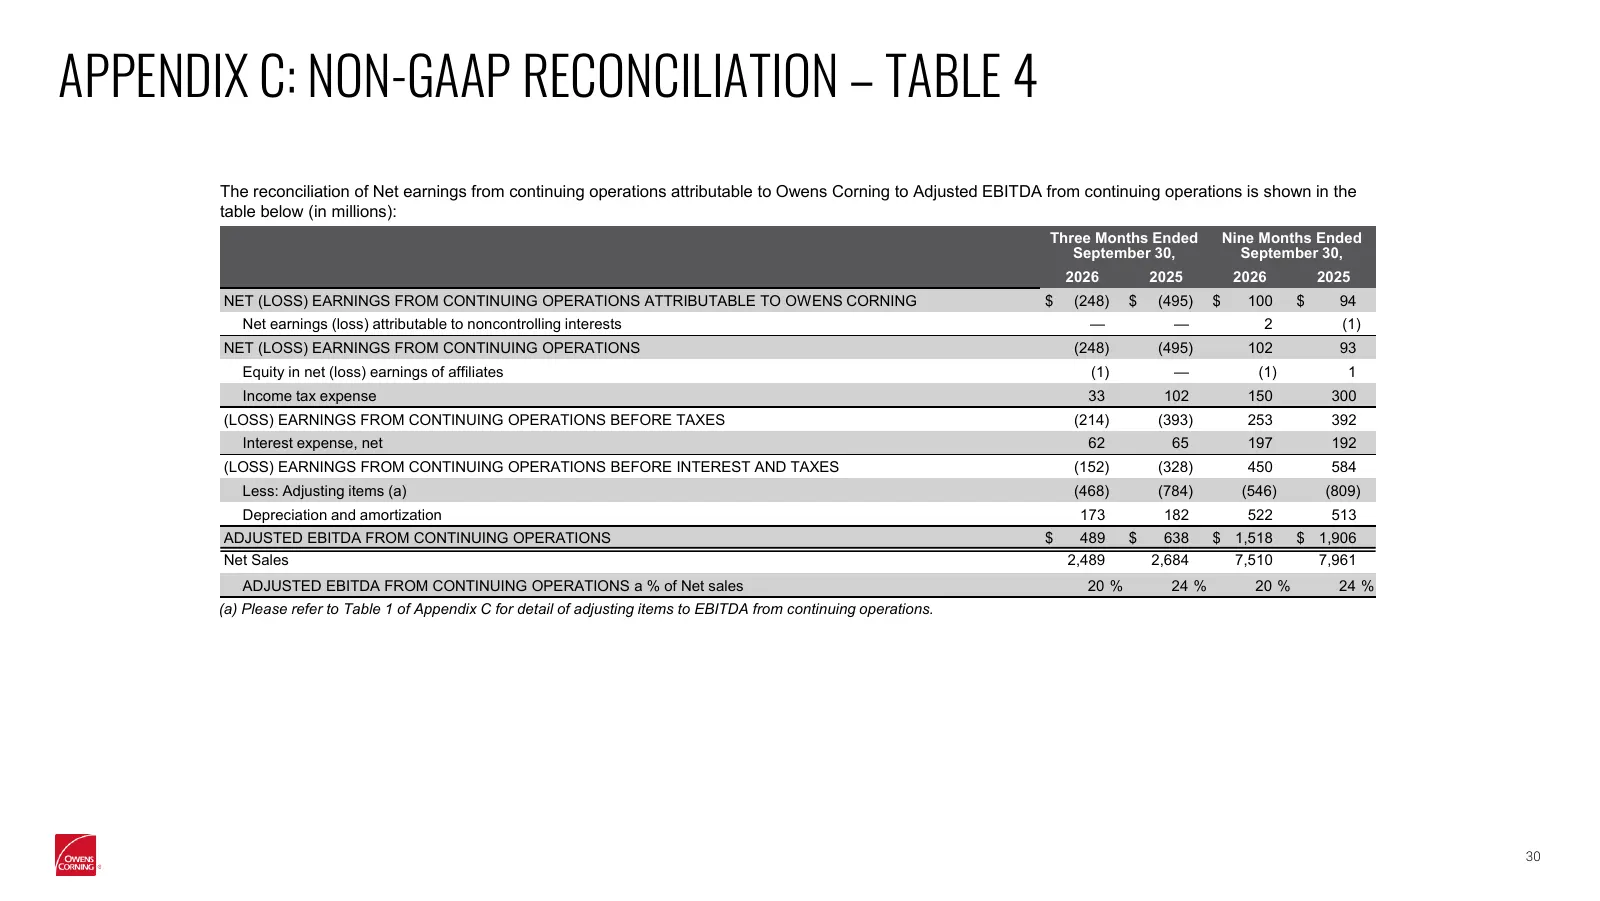
APPENDIX C: NON-GAAP RECONCILIATION – TABLE 4 The reconciliation of Net earnings from continuing operations attributable to Owens Corning to Adjusted EBITDA from continuing operations is shown in the table below (in millions): Three Months Ended Nine Months Ended September 30, September 30, 2026 202
Slide 31: Appendix C: Non-GAAP Reconciliation – Table 5
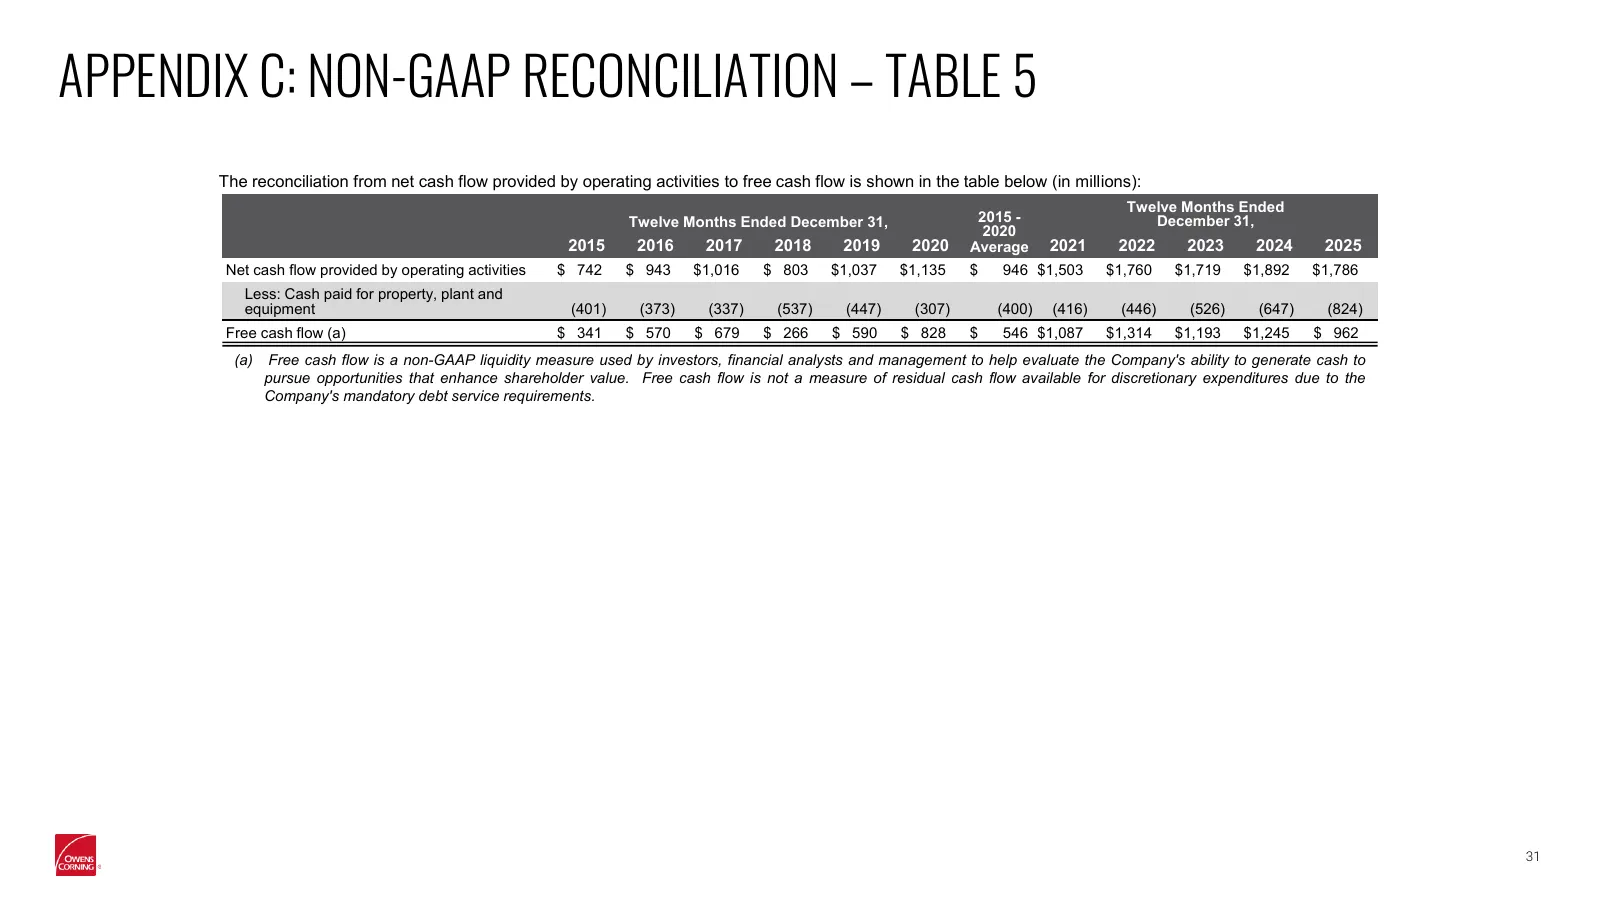
APPENDIX C: NON-GAAP RECONCILIATION – TABLE 5 The reconciliation from net cash flow provided by operating activities to free cash flow is shown in the table below (in millions): Twelve Months Ended Twelve Months Ended December 31, 2015 - December 31, 2020 2015 2016 2017 2018 2019 2020 Average 2021 2
Slide 32: Appendix C: Non-GAAP Reconciliation – Table 6
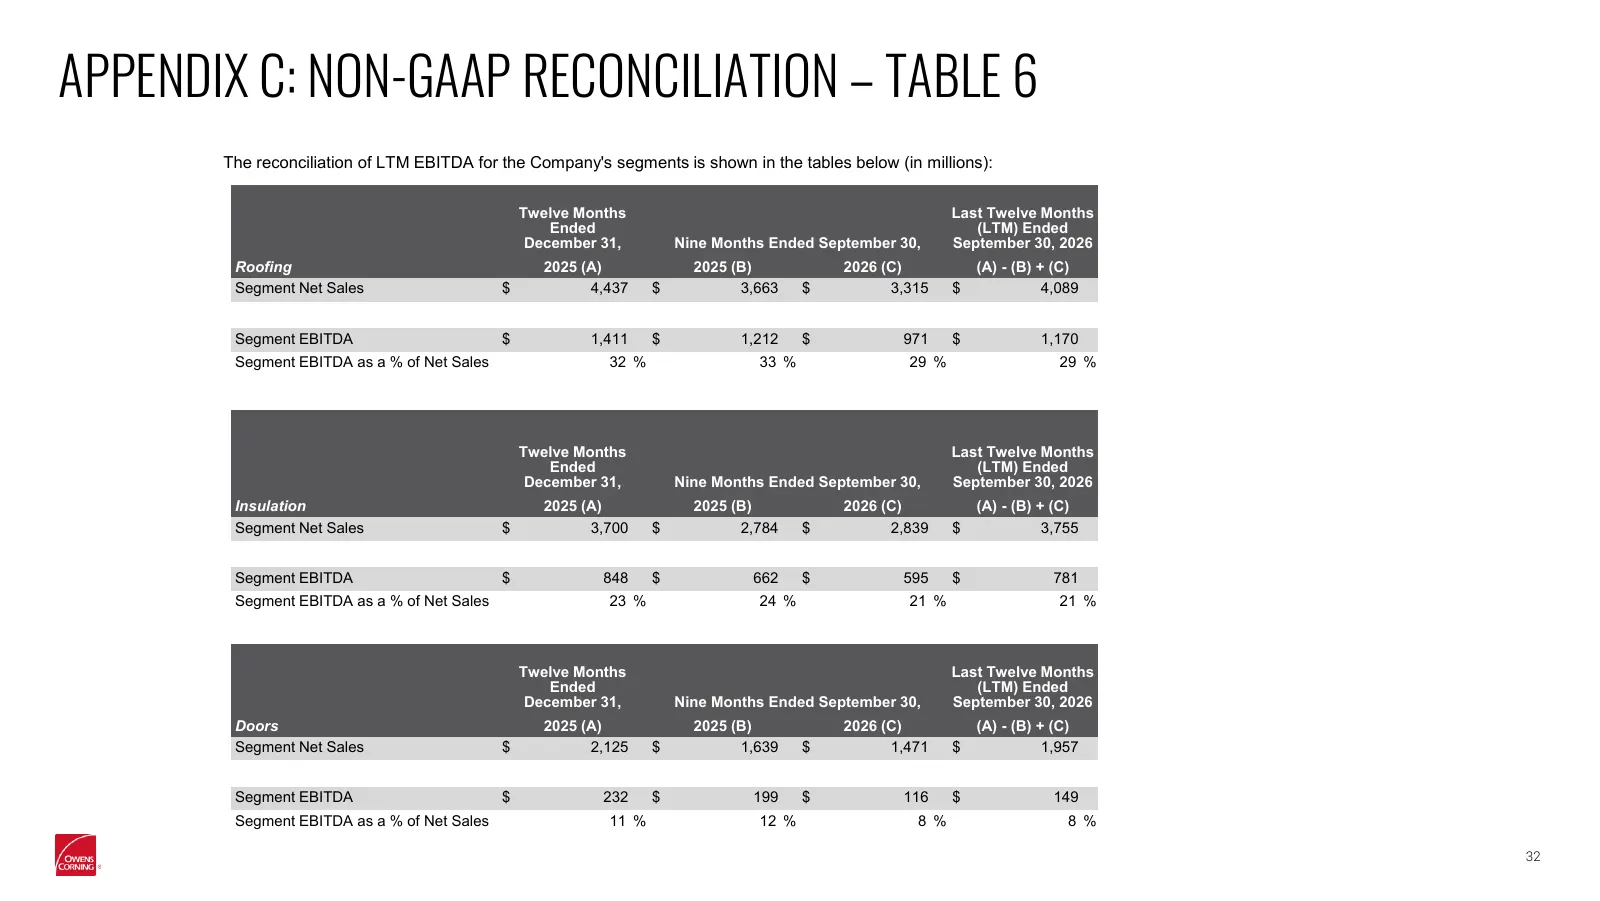
APPENDIX C: NON-GAAP RECONCILIATION – TABLE 6 The reconciliation of LTM EBITDA for the Company's segments is shown in the tables below (in millions): Twelve Months Last Twelve Months Ended (LTM) Ended December 31, Nine Months Ended September 30, September 30, 2026 Roofing 2025 (A) 2025 (B) 2026 (C)
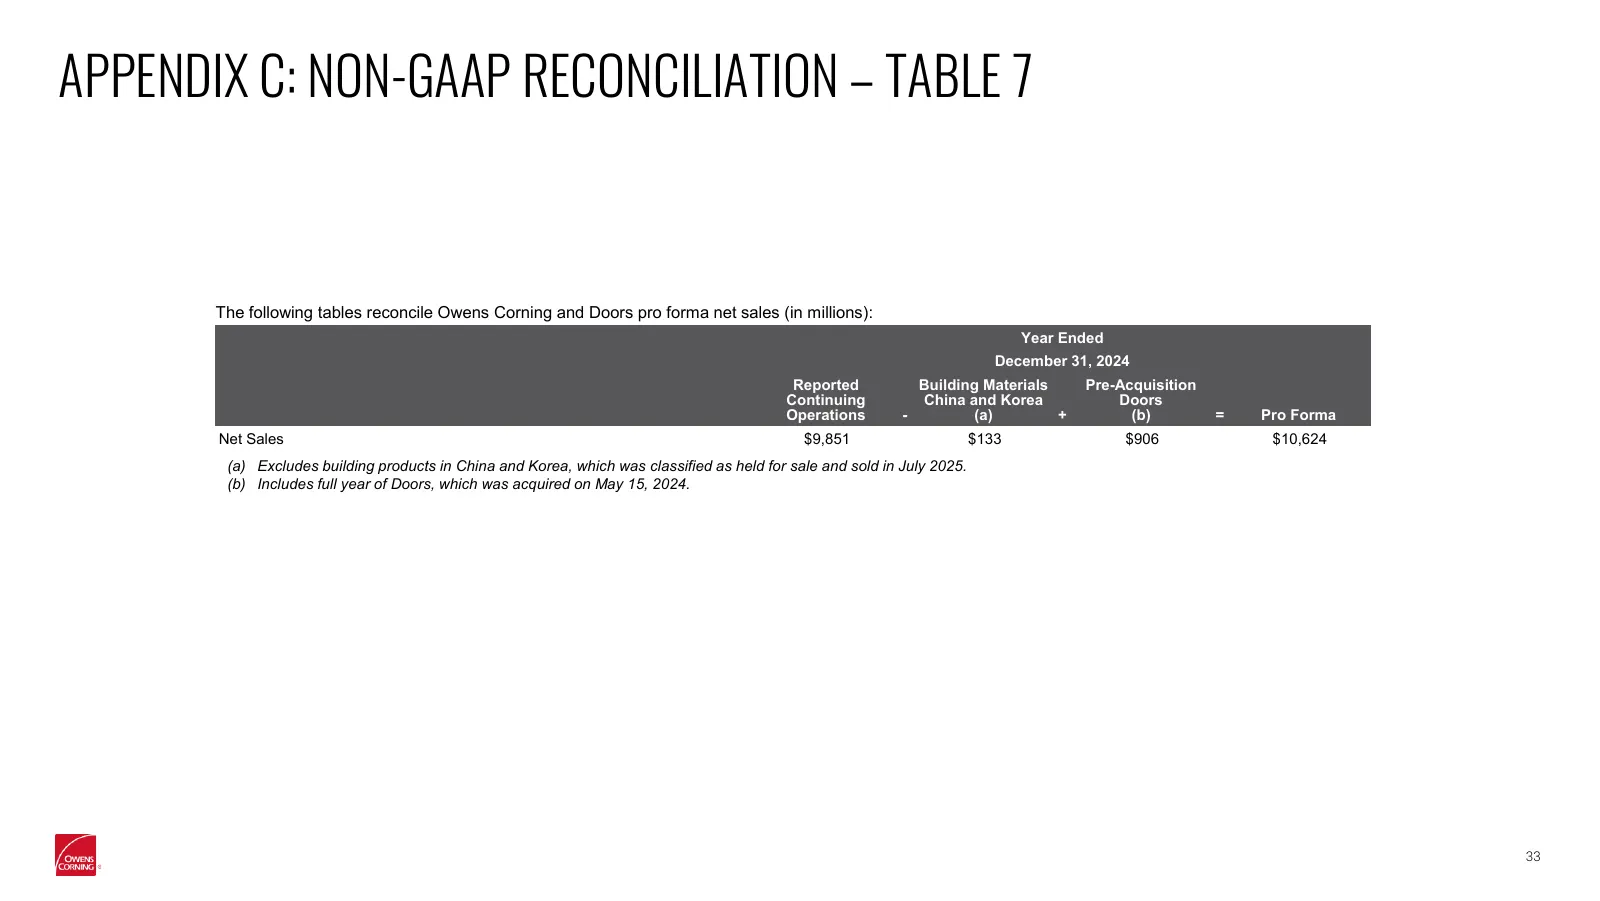
Slide 33: Appendix C: Non-GAAP Reconciliation – Table 7
APPENDIX C: NON-GAAP RECONCILIATION – TABLE 7 The following tables reconcile Owens Corning and Doors pro forma net sales (in millions): Year Ended December 31, 2024 Reported Building Materials Pre-Acquisition Continuing China and Korea Doors Operations - (a) + (b) = Pro Forma Net Sales $9,851 $133 $
Source: company website
More decks from Owens Corning Inc
 Q3 2026 Earnings Presentation20 slides · Nov 4, 2026
 Non-Deal Roadshow (August 2026)33 slides · Aug 6, 2026
 Q2 2026 Earnings Presentation22 slides · Aug 5, 2026
 Non-Deal Roadshow (May 2026)33 slides · May 28, 2026
 Q1 2026 Earnings Presentation22 slides · May 6, 2026
 IR Roadshow Hosted by Deutsche Bank – Baltimore (March 11, 2026)31 slides · Mar 11, 2026