Navistar International Corporation
Navistar International — Investor Day (September 2019)
100 slides from Navistar International's investor day presentation, Sep 19, 2019
Slide 1: Playing to Win: Marty Ketelaar, Investor Relations
PLAYING PEOPLE PERFORMANCE #1 CHOICE TO WIN MARTY KETELAAR Vice President, Investor Relations Navistar International Corporation Public

Slide 2: Welcome to the 2019 Investor Day
Navistar WELCOMES you to the 2019 Investor Day! Public
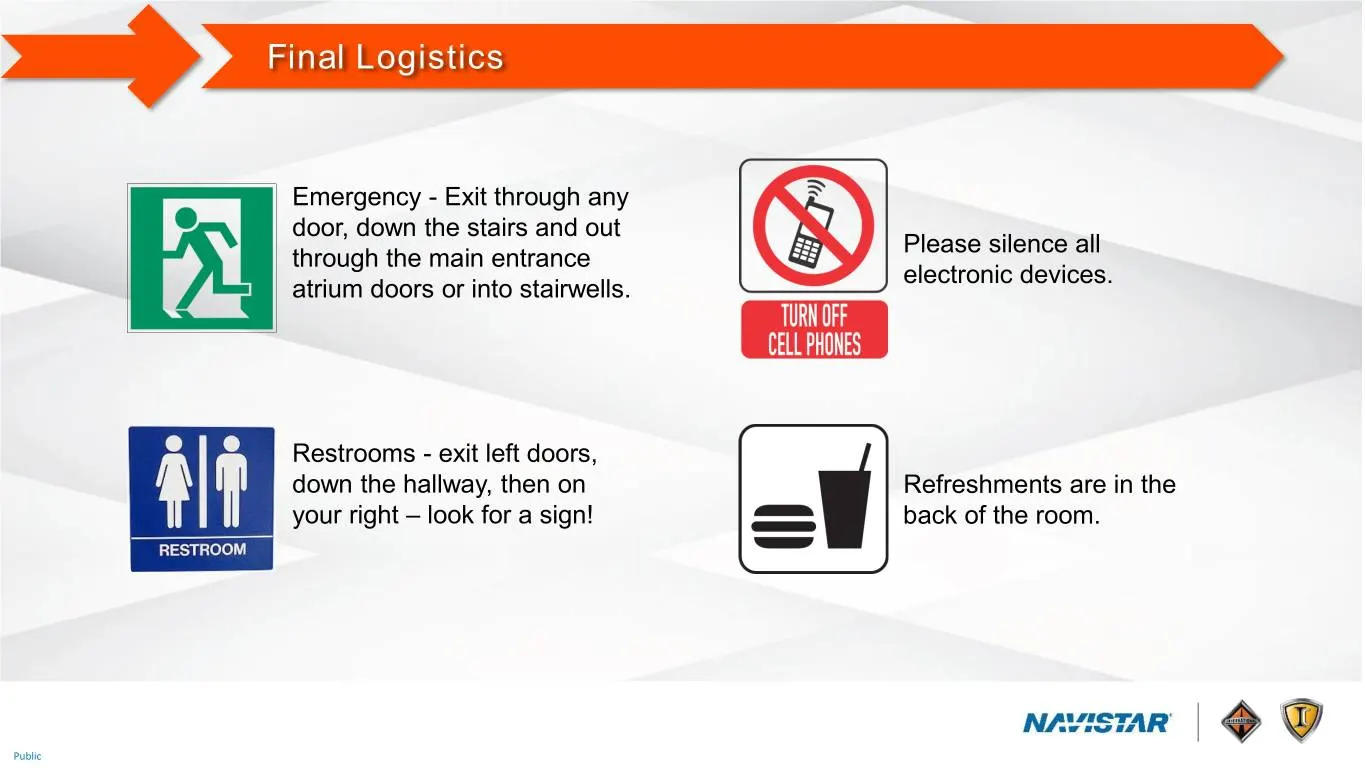
Slide 3: Final Logistics
Final Logistics Emergency - Exit through any door, down the stairs and out Please silence all through the main entrance electronic devices. atrium doors or into stairwells. Restrooms - exit left doors, down the hallway, then on Refreshments are in the your right – look for a sign! back of the room.
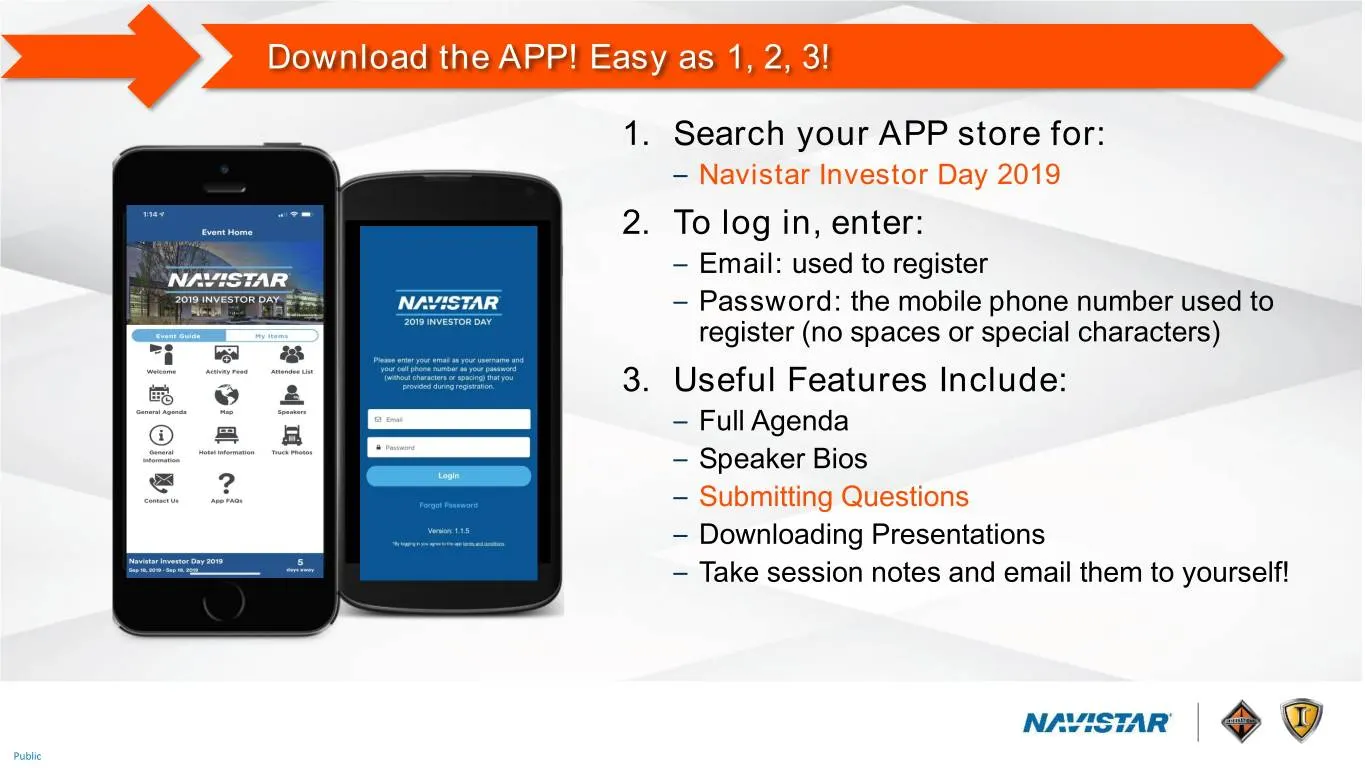
Slide 4: Download the App
Download the APP! Easy as 1, 2, 3! 1. Search your APP store for: – Navistar Investor Day 2019 2. To log in, enter: – Email: used to register – Password: the mobile phone number used to register (no spaces or special characters) 3. Useful Features Include: – Full Agenda – Speaker Bios – Submitting Qu
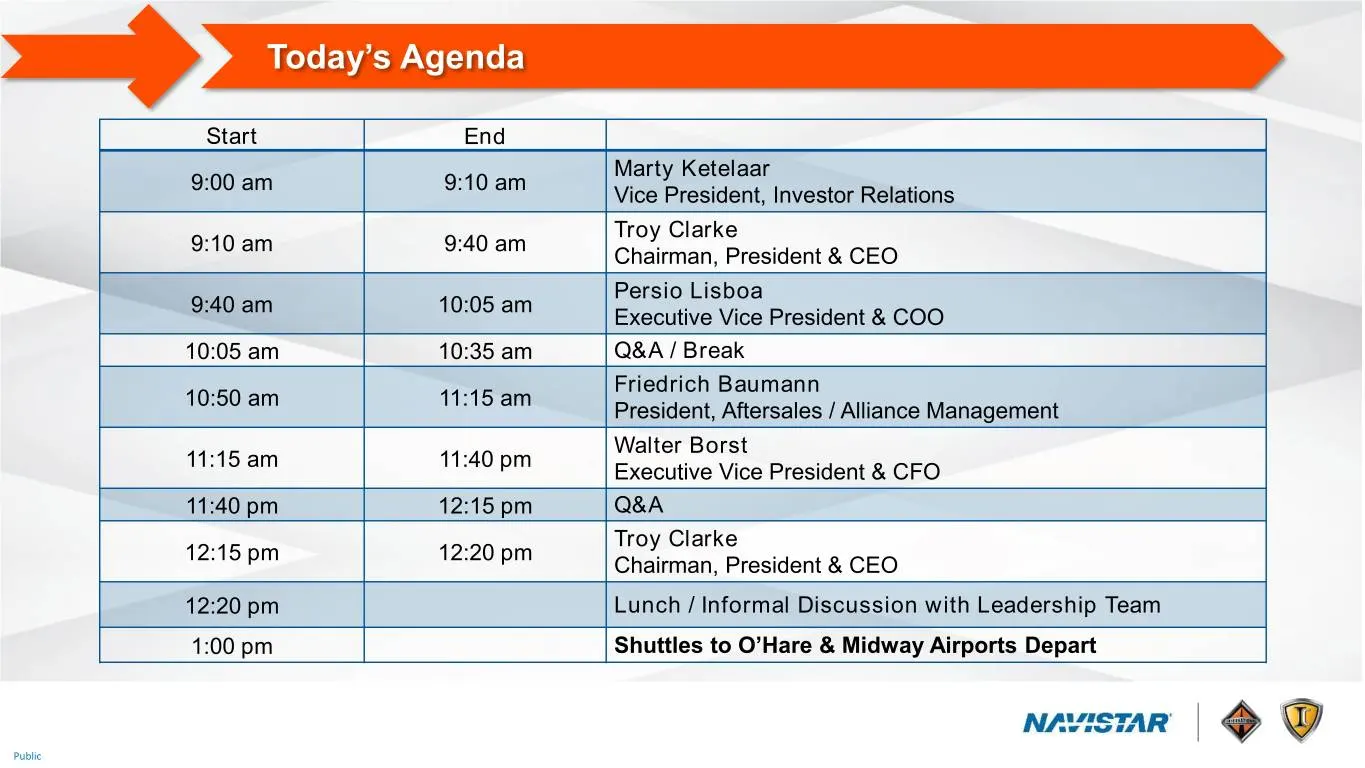
Slide 5: Today's Agenda
Today’s Agenda Start End Marty Ketelaar 9:00 am 9:10 am Vice President, Investor Relations Troy Clarke 9:10 am 9:40 am Chairman, President & CEO Persio Lisboa 9:40 am 10:05 am Executive Vice President & COO 10:05 am 10:35 am Q&A / Break Friedrich Baumann 10:50 am 11:15 am President, Aftersales / All
Slide 6: Safe Harbor Statement and Other Cautionary Notes
Safe Harbor Statement and Other Cautionary Notes Information provided and statements contained in this presentation that are not purely historical are forward-looking statements within the meaning of Section 27A of the Securities Act of 1933, as amended ("Securities Act"), Section 21E of the Securit
Slide 7: Troy Clarke, Chairman, President and CEO
PLAYING PEOPLENAVISTARPERFORMANCE 4.0 #1 CHOICE TO WIN TROY CLARKE Chairman, President and CEO Navistar International Corporation Public

Slide 8: Insert video here
Insert video here Public

Slide 9: It's Not About Us, It's About Them
IT’S NOT ABOUT US IT’S ABOUT THEM Public
Slide 10: Who We Are, Shifting Gears, Navistar 4.0
WHO WE ARE: Meet Today’s Navistar SHIFTING GEARS: Preparing for Tomorrow NAVISTAR 4.0: Achieving our Vision Public
Slide 11: pOEs. UNAYISTAR
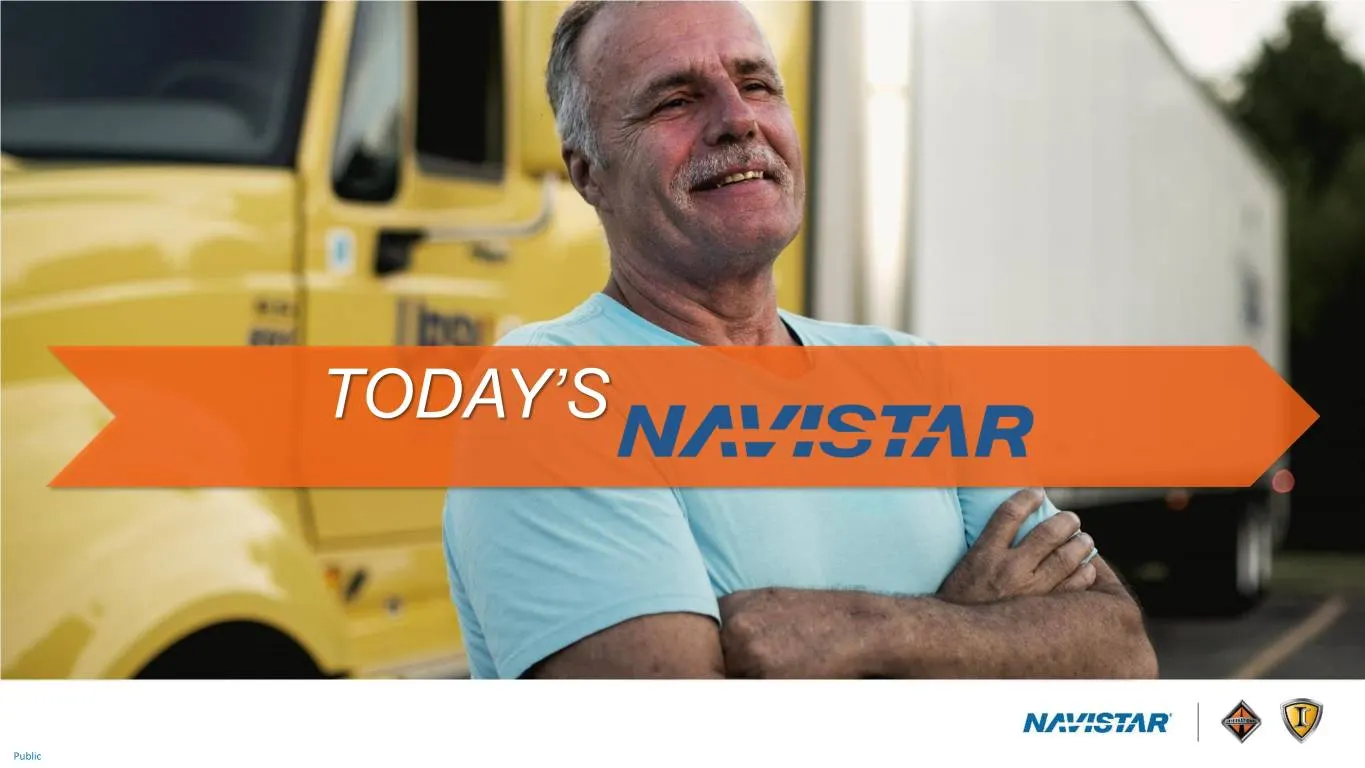
= \ pOEs. UNAYISTAR NAVISTAR | oO
Slide 12: Today's Navistar: A Leading North American Truck Manufacturer
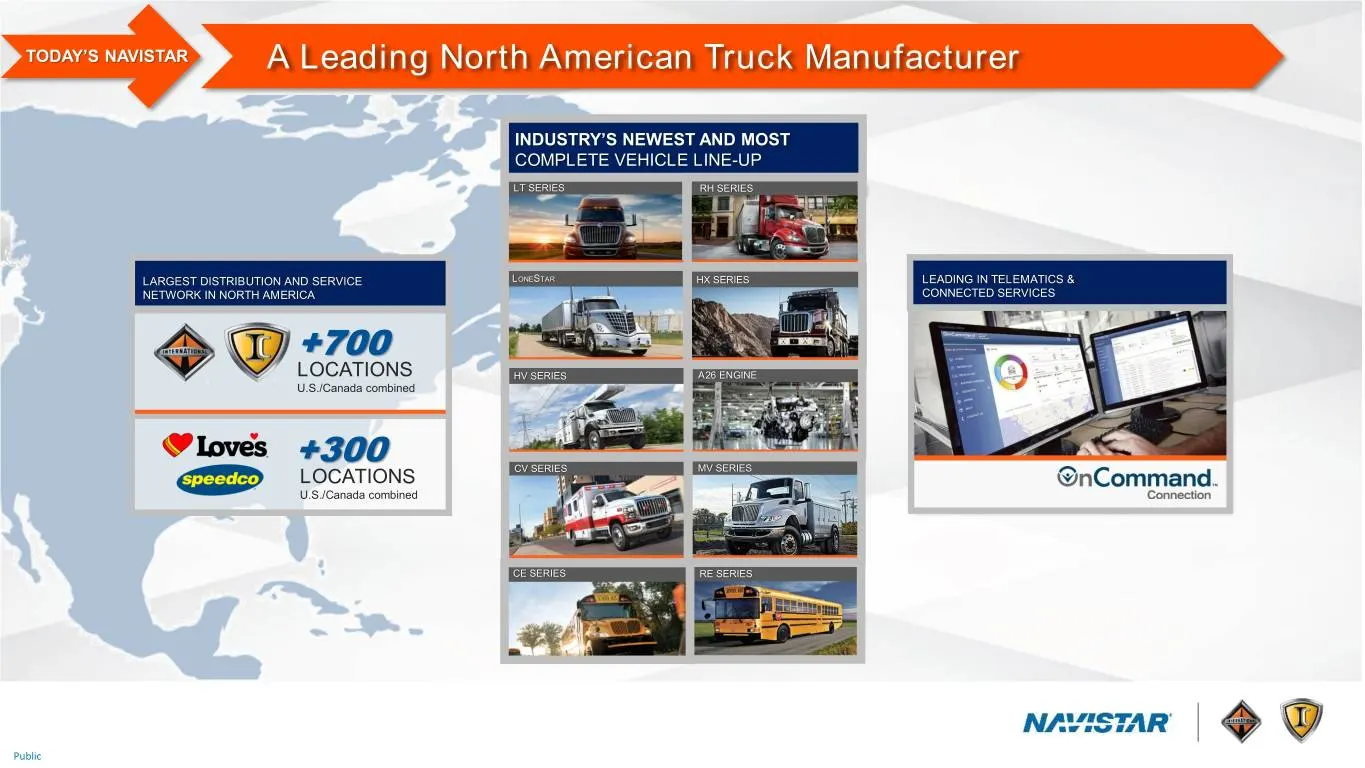
TODAY’S NAVISTAR A Leading North American Truck Manufacturer INDUSTRY’S NEWEST AND MOST COMPLETE VEHICLE LINE-UP LT SERIES RH SERIES LARGEST DISTRIBUTION AND SERVICE LONESTAR HX SERIES LEADING IN TELEMATICS & NETWORK IN NORTH AMERICA CONNECTED SERVICES +700 LOCATIONS HV SERIES A26 ENGINE U.S./Canada
Slide 13: Today's Navistar: Operational Footprint
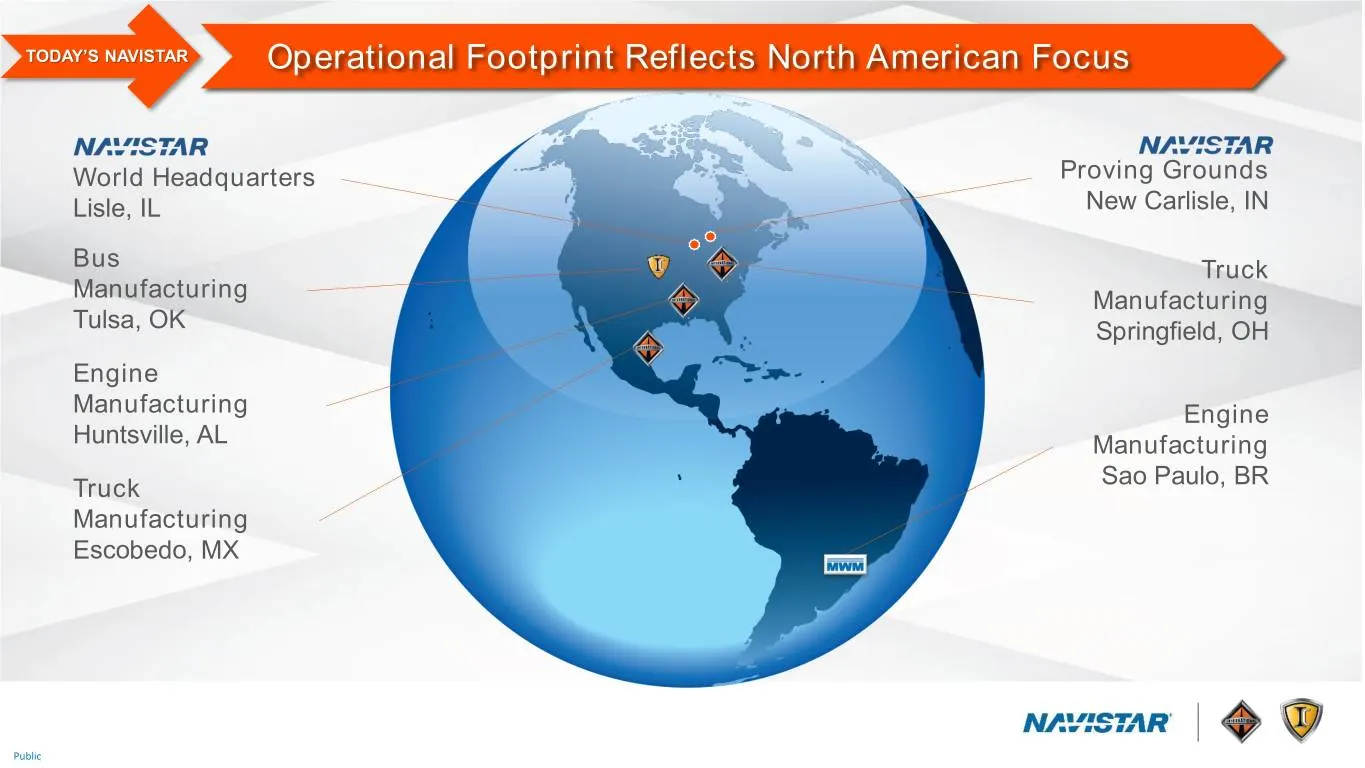
TODAY’S NAVISTAR Operational Footprint Reflects North American Focus World Headquarters Proving Grounds Lisle, IL New Carlisle, IN Bus Truck Manufacturing Manufacturing Tulsa, OK Springfield, OH Engine Manufacturing Engine Huntsville, AL Manufacturing Truck Sao Paulo, BR Manufacturing Escobedo, MX P
Slide 14: Serving a Diverse Customer Base Across Industries
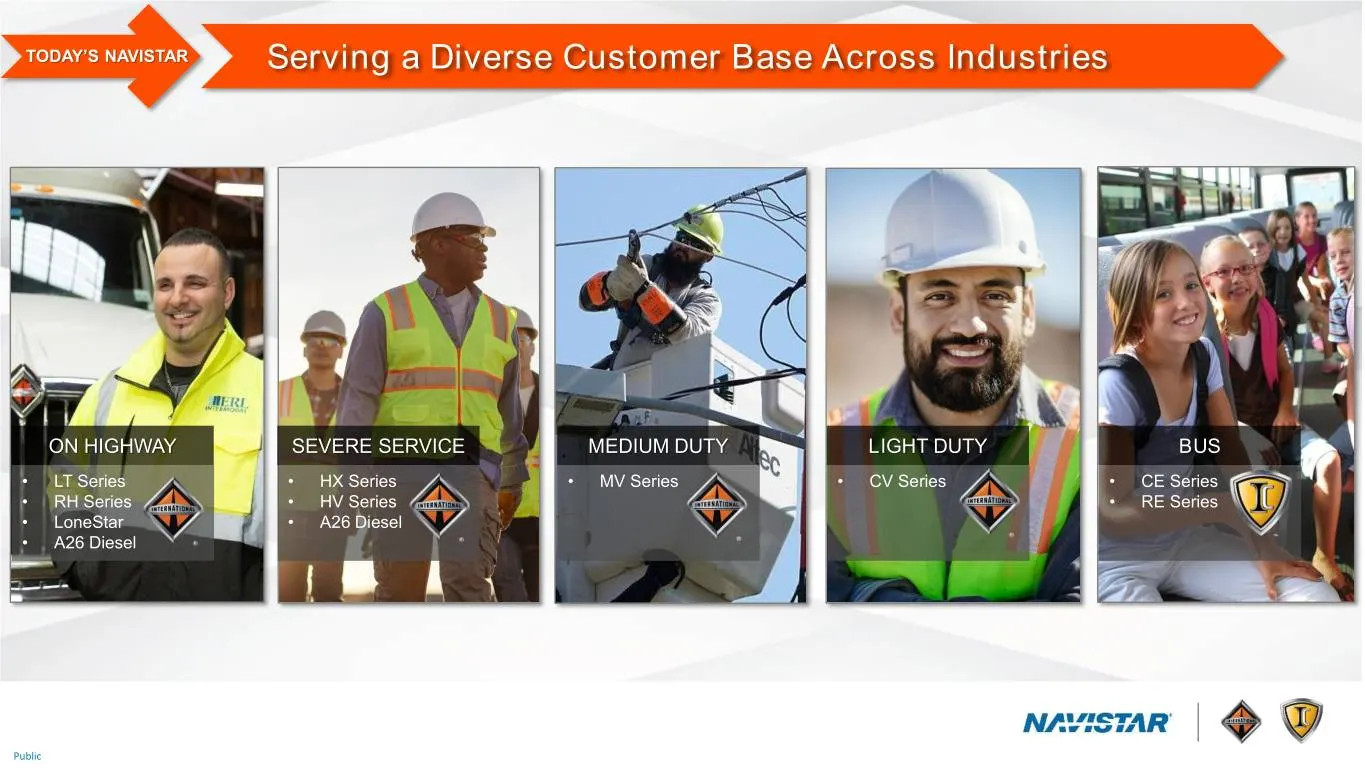
TODAY’S NAVISTAR Serving a Diverse Customer Base Across Industries ON HIGHWAY SEVERE SERVICE MEDIUM DUTY LIGHT DUTY BUS • LT Series • HX Series • MV Series • CV Series • CE Series • RH Series • HV Series • RE Series • LoneStar • A26 Diesel • A26 Diesel Public
Slide 15: Providing Transportation Solutions to Leading Fleets
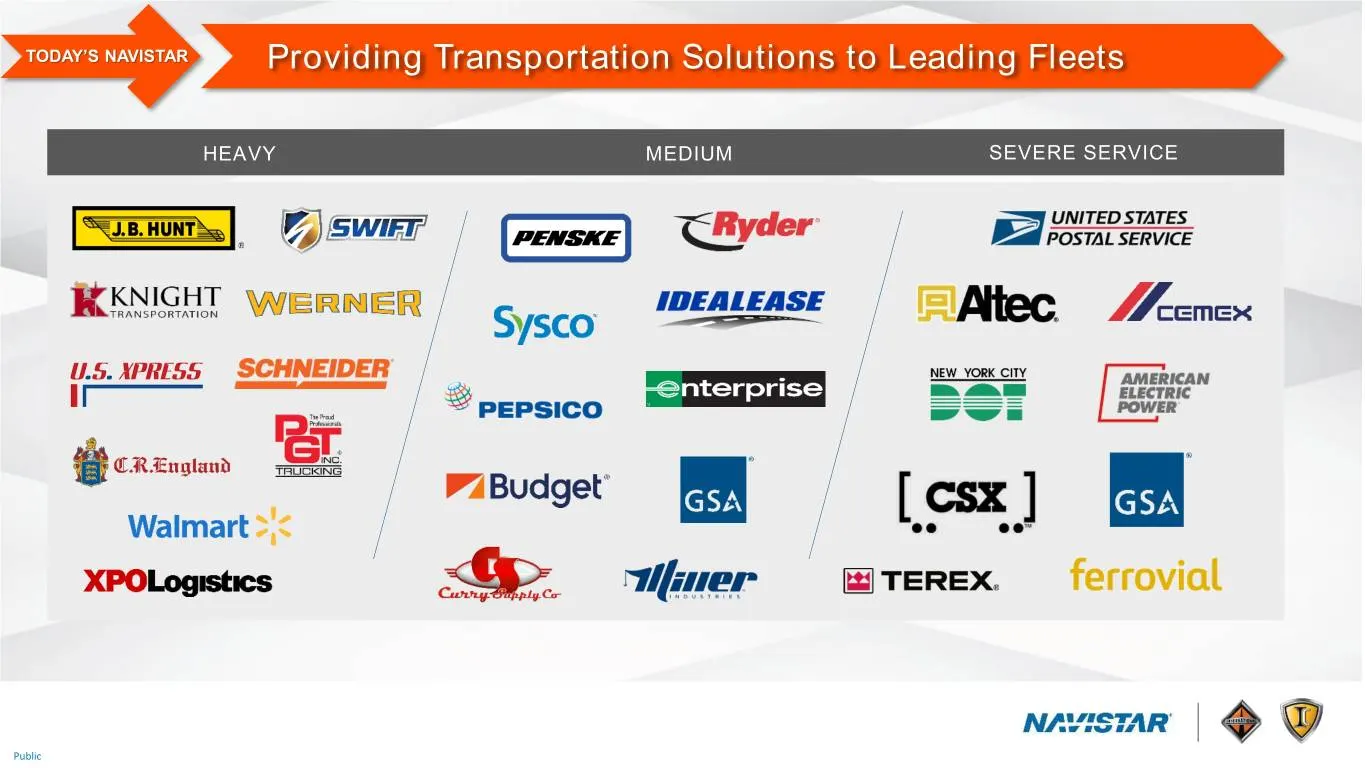
TODAY’S NAVISTAR Providing Transportation Solutions to Leading Fleets HEAVY MEDIUM SEVERE SERVICE Public
Slide 16: Momentum with Profitable Share Growth Across Segments
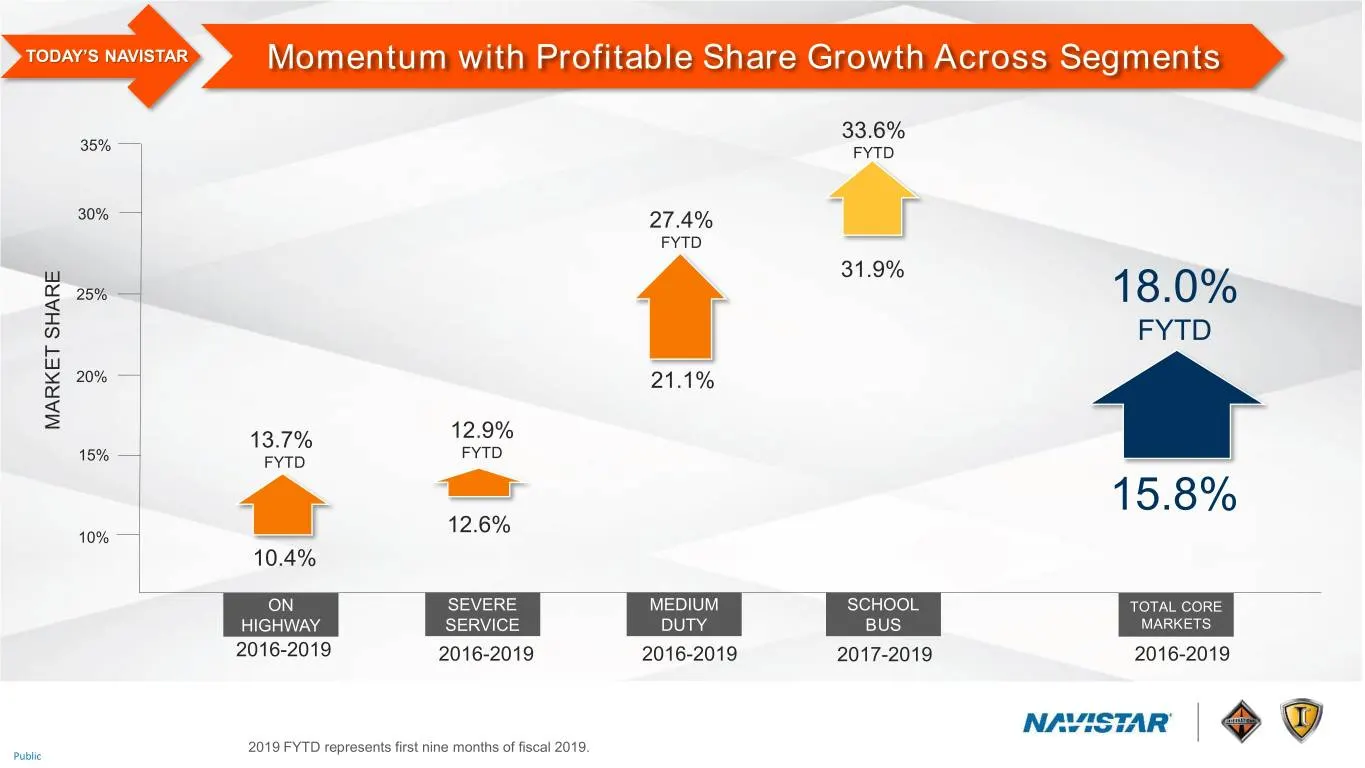
TODAY’S NAVISTAR Momentum with Profitable Share Growth Across Segments 33.6% 35% FYTD 30% 27.4% FYTD 31.9% 25% 18.0% FYTD 20% 21.1% MARKET SHARE MARKET 13.7% 12.9% FYTD 15% FYTD 15.8% 12.6% 10% 10.4% ON SEVERE MEDIUM SCHOOL TOTAL CORE HIGHWAY SERVICE DUTY BUS MARKETS 2016-2019 2016-2019 2016-2019 20
Slide 17: TRATON Alliance Delivering Today
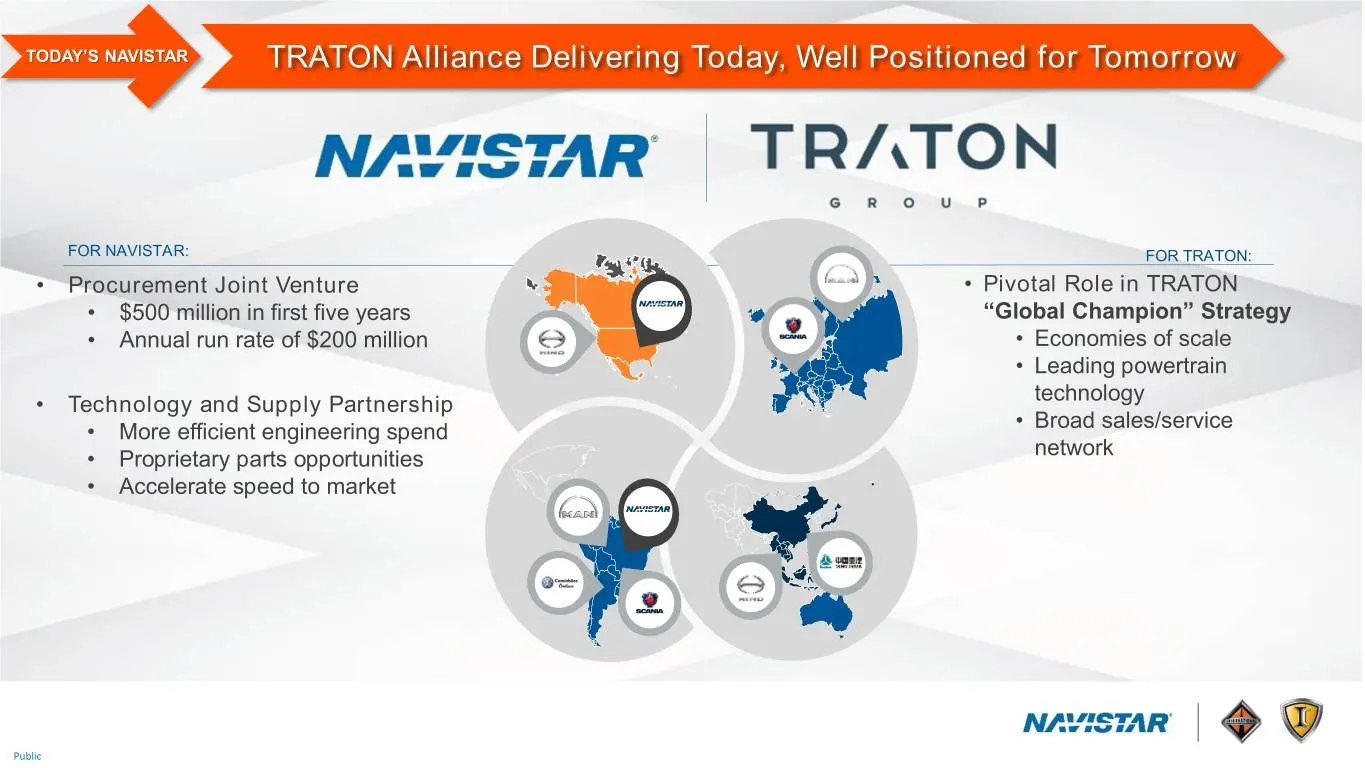
TODAY’S NAVISTAR TRATON Alliance Delivering Today, Well Positioned for Tomorrow FOR NAVISTAR: FOR TRATON: • Procurement Joint Venture • Pivotal Role in TRATON • $500 million in first five years “Global Champion” Strategy • Annual run rate of $200 million • Economies of scale • Leading powertrain tec
Slide 18: Pleased with Progress but Further Work is Required
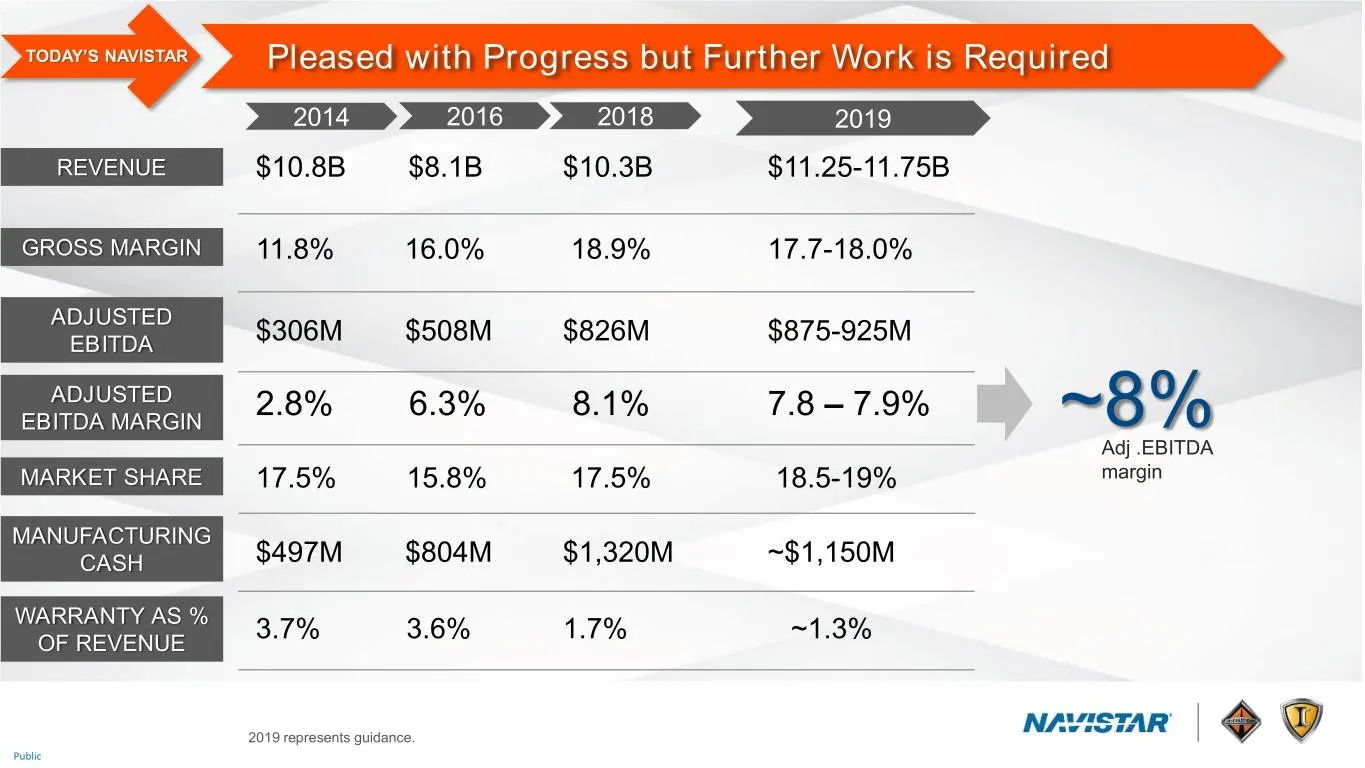
TODAY’S NAVISTAR Pleased with Progress but Further Work is Required 2014 2016 2018 2019 REVENUE $10.8B $8.1B $10.3B $11.25-11.75B GROSS MARGIN 11.8% 16.0% 18.9% 17.7-18.0% ADJUSTED EBITDA $306M $508M $826M $875-925M ADJUSTED 2.8% 6.3% 8.1% 7.8 – 7.9% EBITDA MARGIN ~8% Adj .EBITDA MARKET SHARE 17.5%
Slide 19: 2020-2022: Shifting Gears, Preparing for Tomorrow
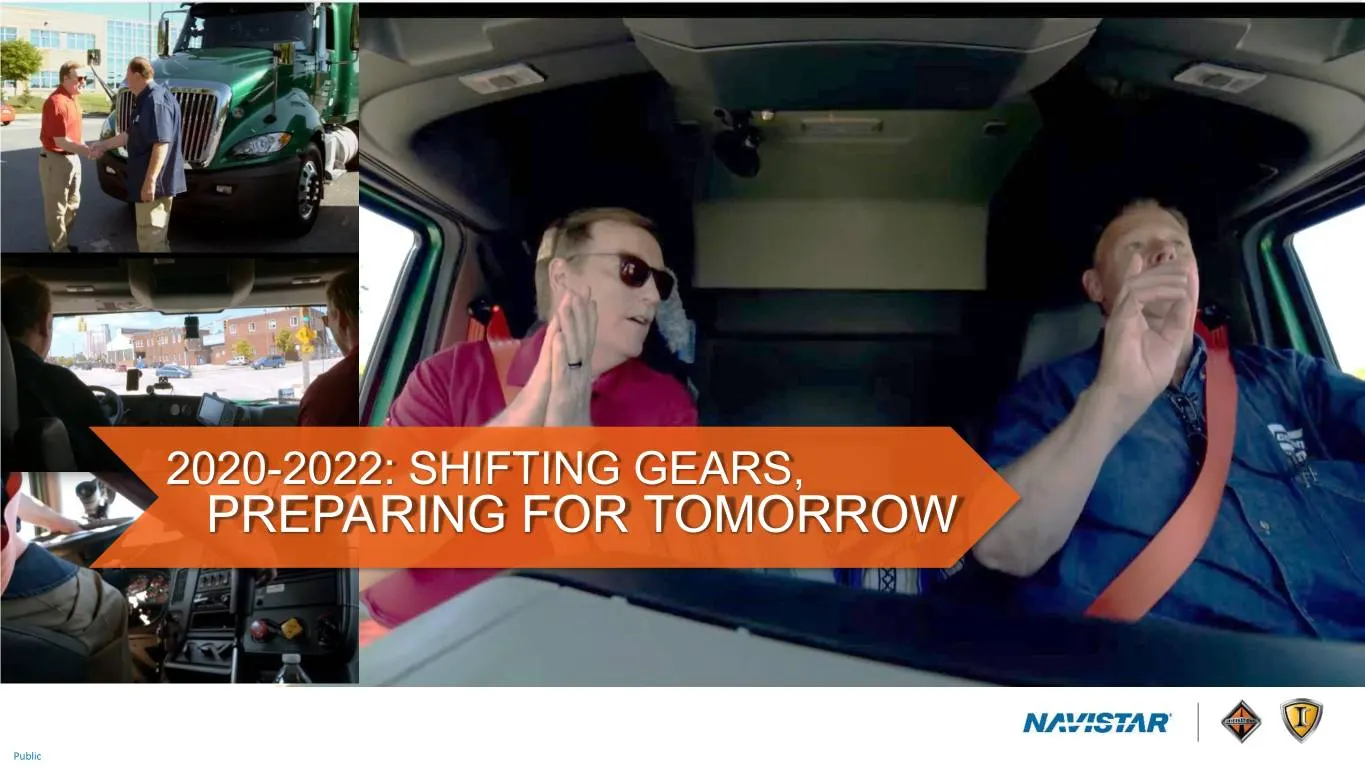
2020-2022: SHIFTING GEARS, PREPARING FOR TOMORROW Public
Slide 20: North American Market Entering a Transition Period
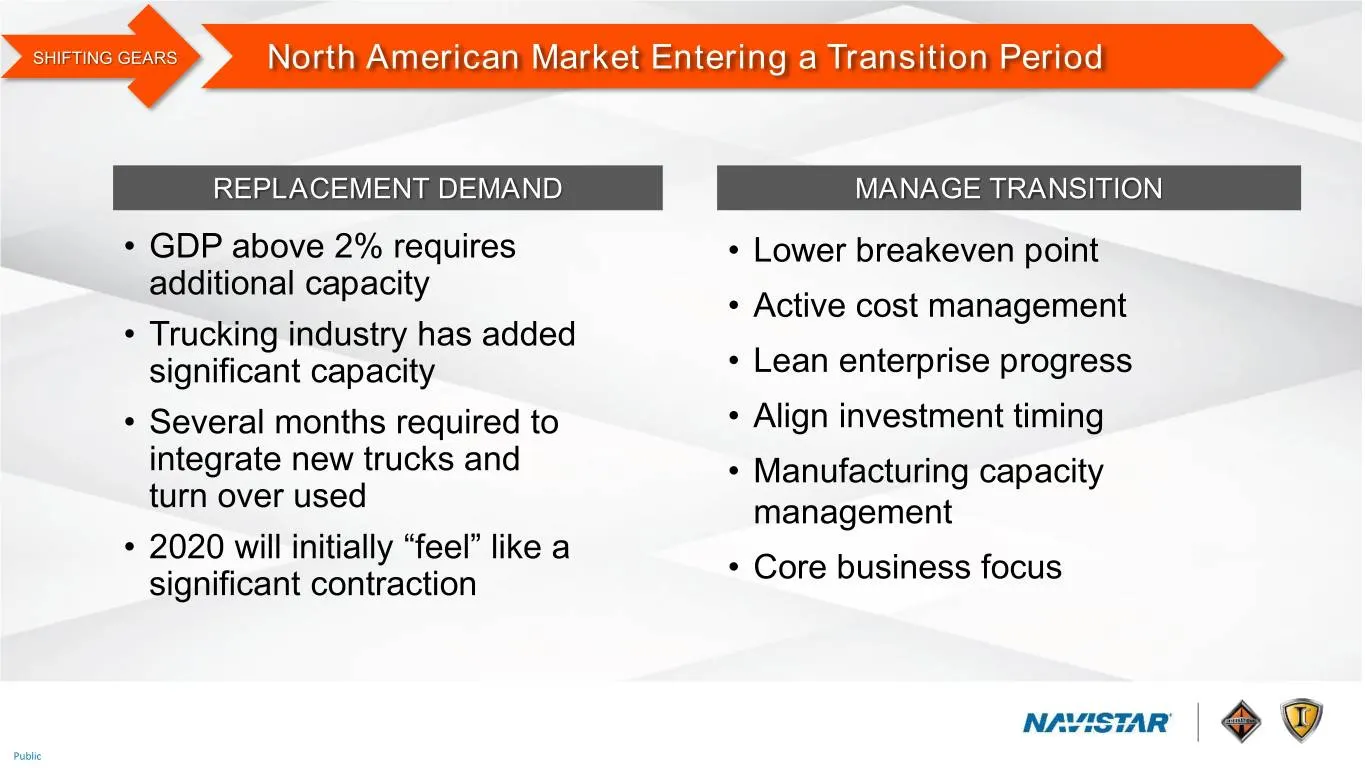
SHIFTING GEARS North American Market Entering a Transition Period REPLACEMENT DEMAND MANAGE TRANSITION • GDP above 2% requires • Lower breakeven point additional capacity • Active cost management • Trucking industry has added significant capacity • Lean enterprise progress • Several months required
Slide 21: Industry Volume Projected to Fall Into Normal Range in 2020
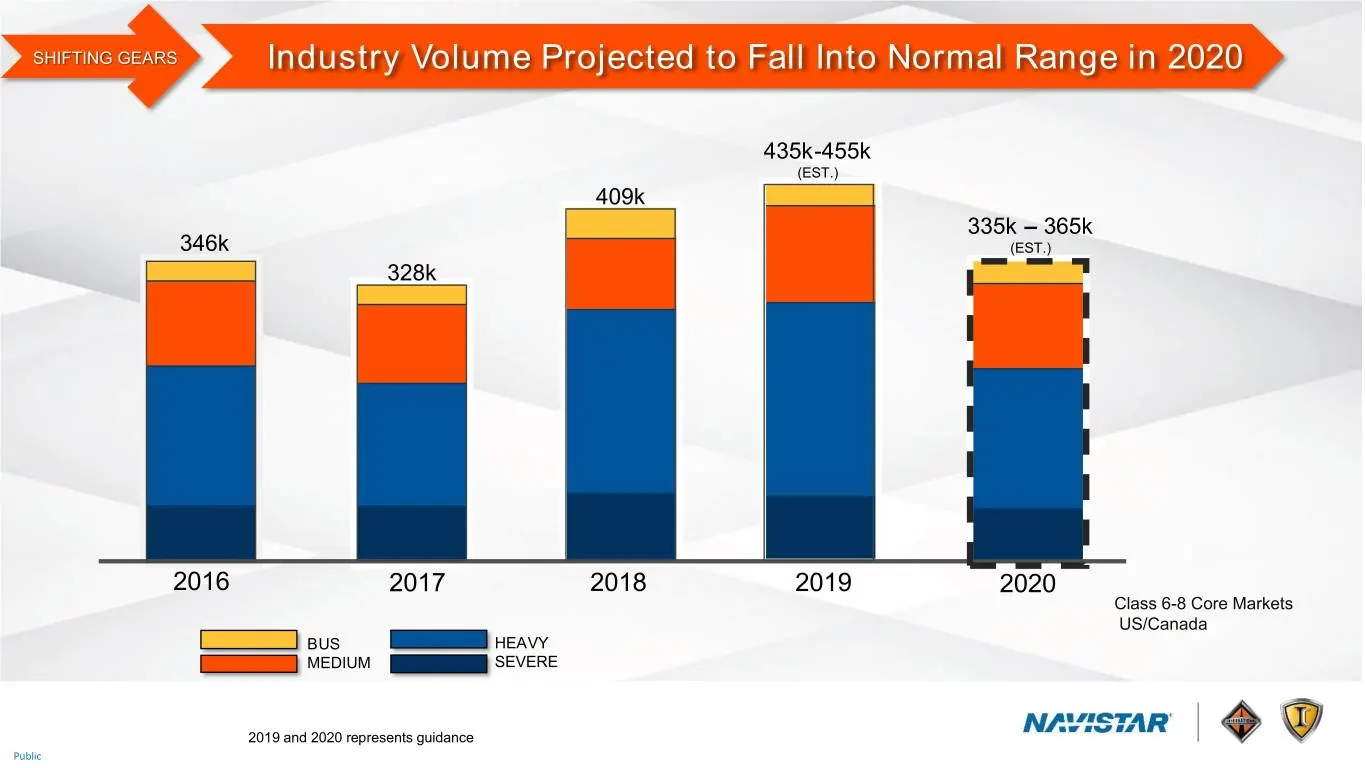
SHIFTING GEARS Industry Volume Projected to Fall Into Normal Range in 2020 435k-455k (EST.) 409k 335k – 365k 346k (EST.) 328k 2016 2017 2018 2019 2020 Class 6-8 Core Markets US/Canada BUS HEAVY MEDIUM SEVERE 2019 and 2020 represents guidance Public
Slide 22: Grow Share and Margin Through Industry Transition
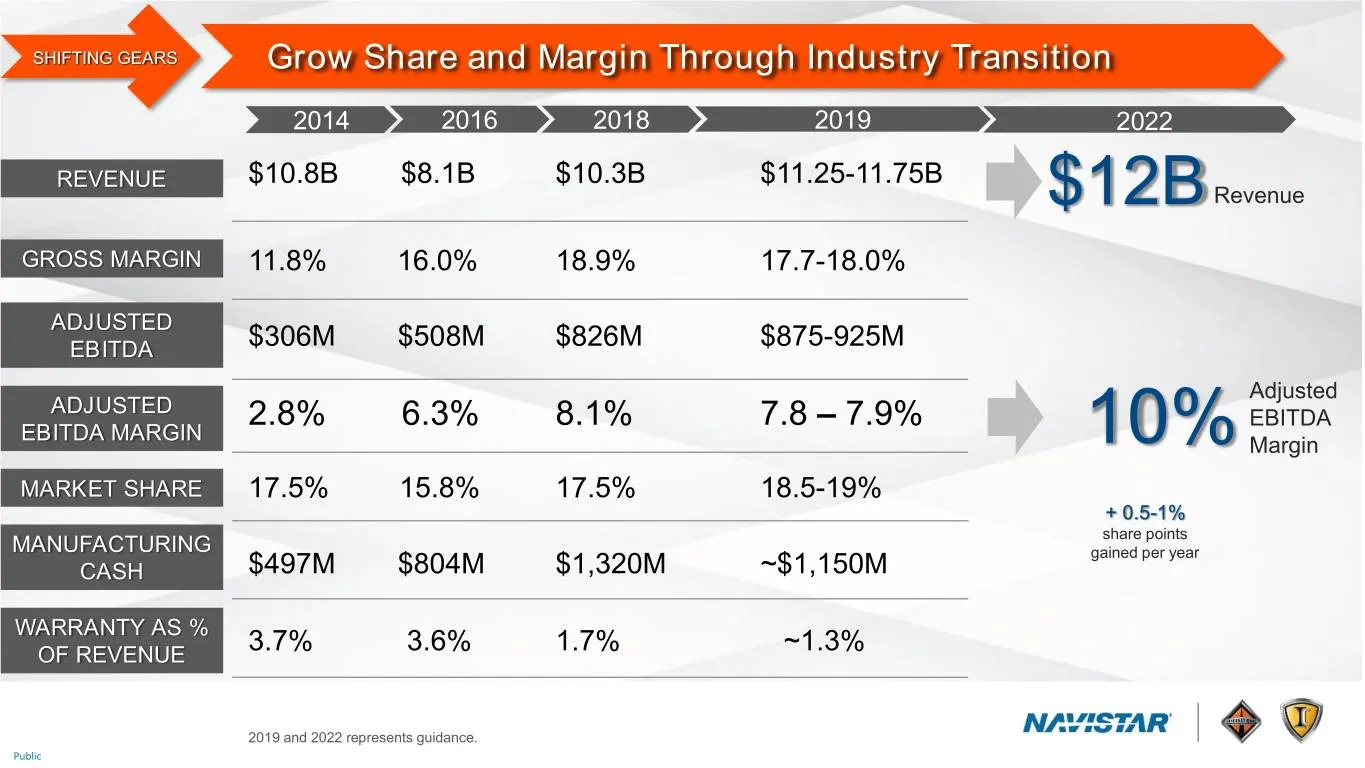
SHIFTING GEARS Grow Share and Margin Through Industry Transition 2014 2016 2018 2019 2022 REVENUE $10.8B $8.1B $10.3B $11.25-11.75B $12B Revenue GROSS MARGIN 11.8% 16.0% 18.9% 17.7-18.0% ADJUSTED EBITDA $306M $508M $826M $875-925M Adjusted ADJUSTED 2.8% 6.3% 8.1% 7.8 – 7.9% EBITDA EBITDA MARGIN 10%
Slide 23: Achieving Our Vision: 4.0
ACHIEVING OUR VISION: 4.0 Public
Slide 24: Macrotrends Impacting Economy and Culture
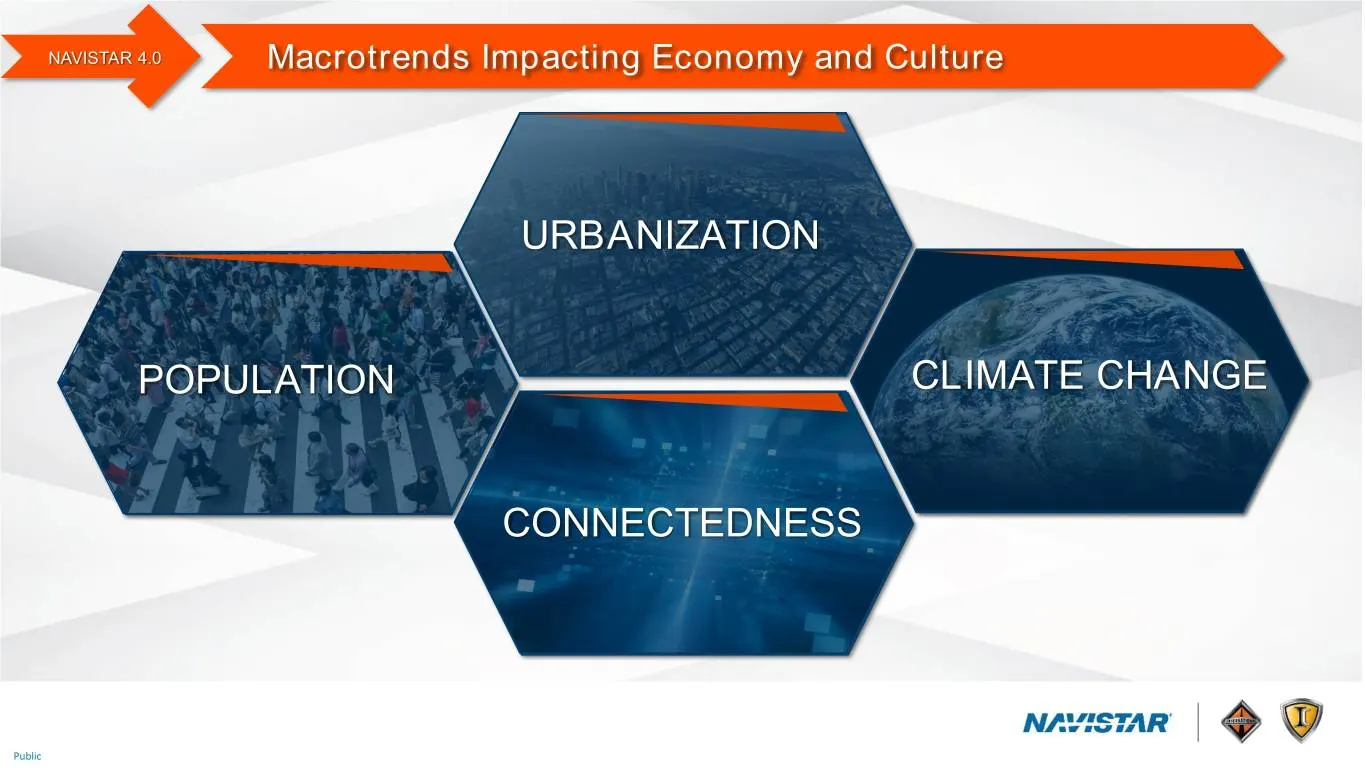
NAVISTAR 4.0 Macrotrends Impacting Economy and Culture URBANIZATION POPULATION CLIMATE CHANGE CONNECTEDNESS Public
Slide 25: Macrotrends Inform Evolving Transportation Landscape
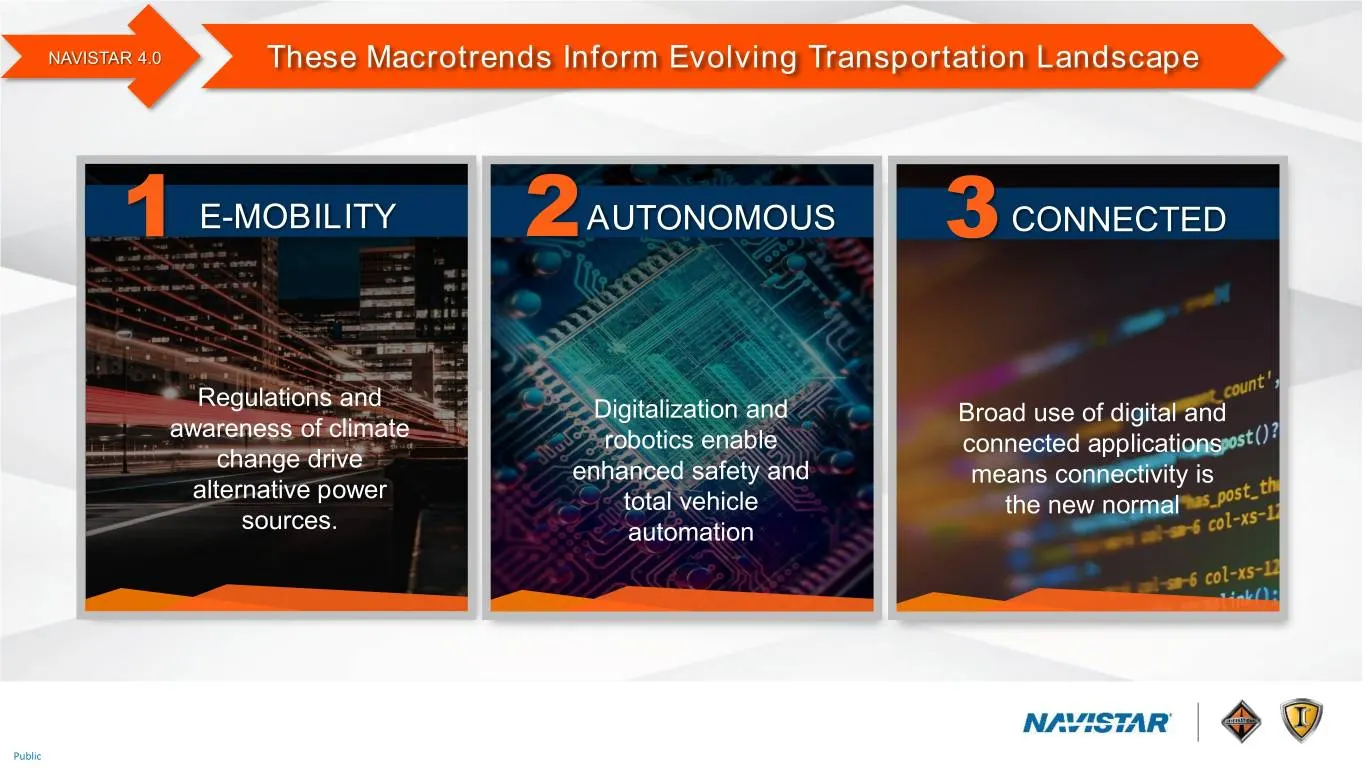
NAVISTAR 4.0 These Macrotrends Inform Evolving Transportation Landscape 1 E-MOBILITY 2 AUTONOMOUS 3 CONNECTED Regulations and Digitalization and Broad use of digital and awareness of climate robotics enable connected applications change drive enhanced safety and means connectivity is alternative pow
Slide 26: eMobility: Electric Trucks and Buses
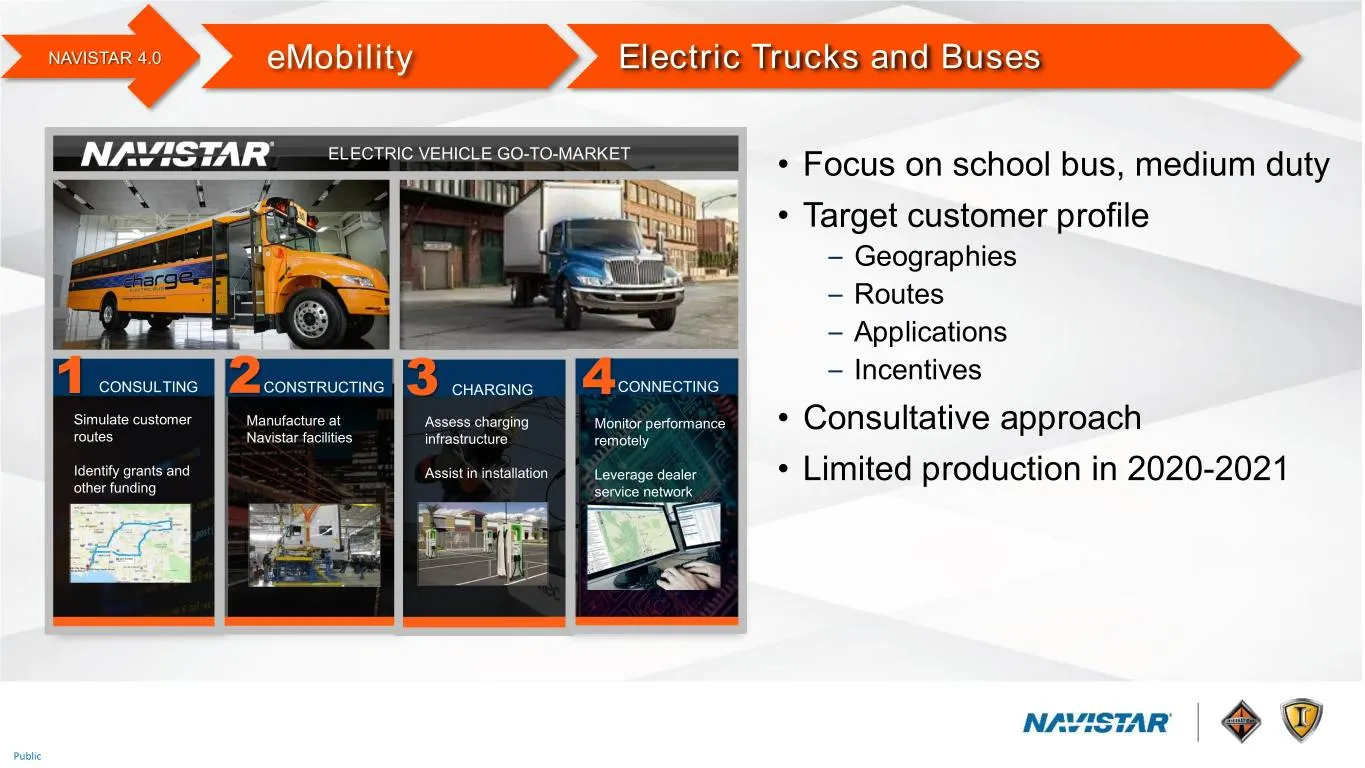
NAVISTAR 4.0 eMobility Electric Trucks and Buses ELECTRIC VEHICLE GO-TO-MARKET • Focus on school bus, medium duty • Target customer profile – Geographies – Routes – Applications – Incentives 1 CONSULTING 2CONSTRUCTING 3 CHARGING 4CONNECTING Simulate customer Manufacture at Assess charging Monitor pe
Slide 27: Autonomous: ADAS and Autonomous Trucks
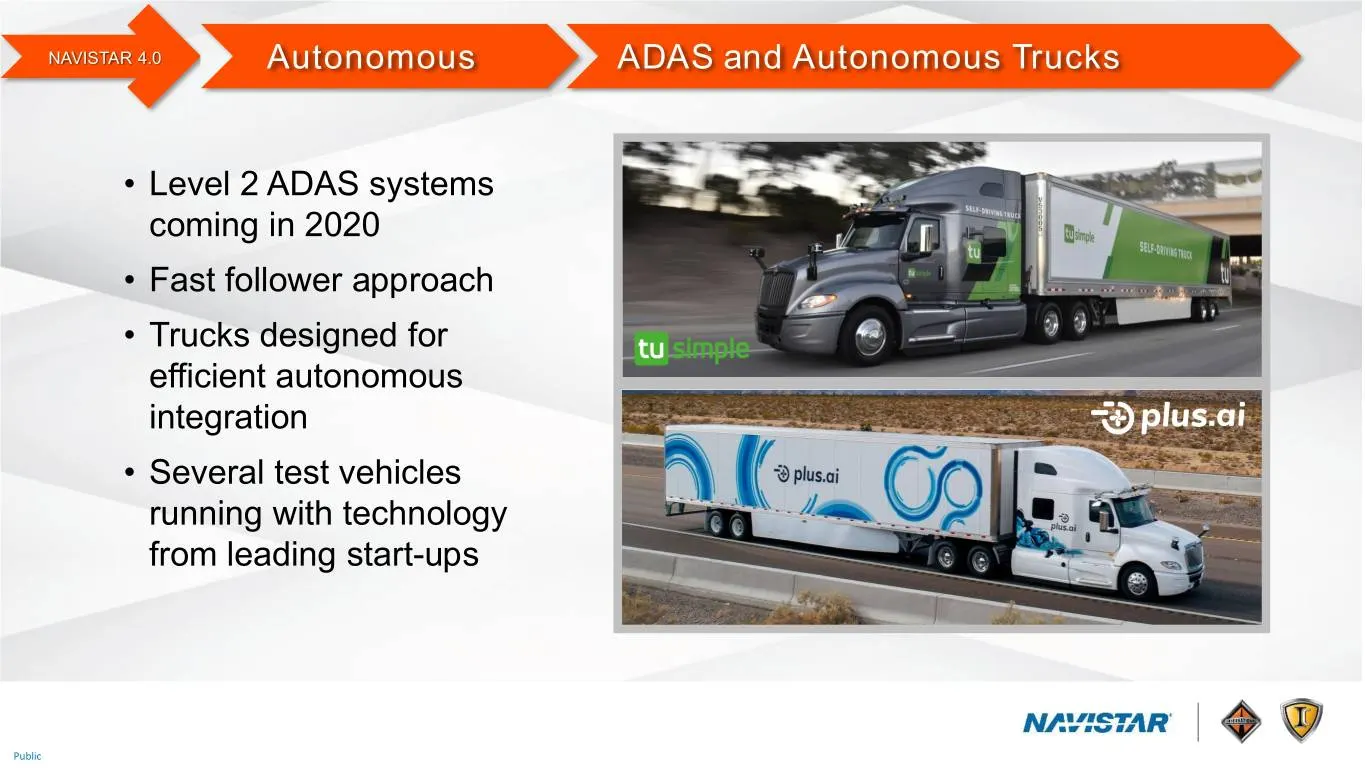
NAVISTAR 4.0 Autonomous ADAS and Autonomous Trucks • Level 2 ADAS systems coming in 2020 • Fast follower approach • Trucks designed for efficient autonomous integration • Several test vehicles running with technology from leading start-ups Public
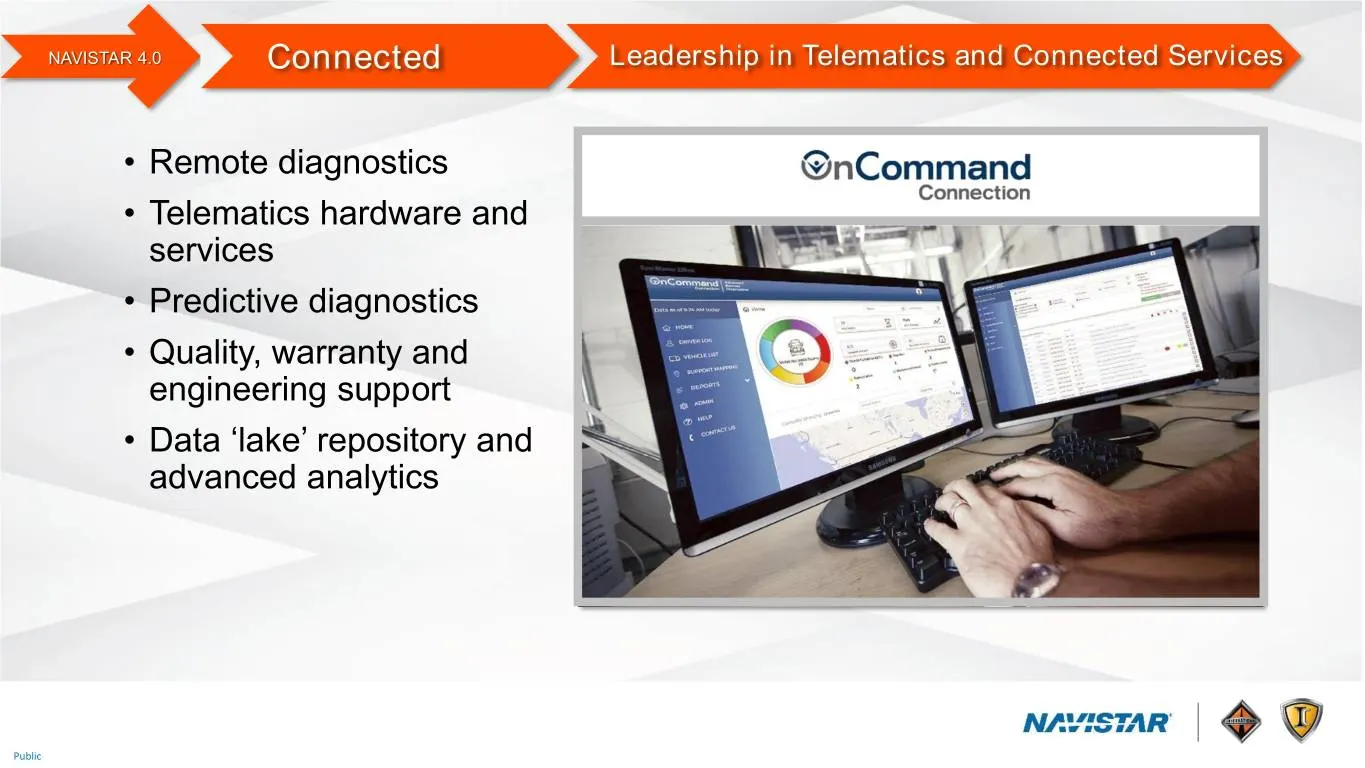
Slide 28: Connected: Leadership in Telematics and Connected Services
NAVISTAR 4.0 Connected Leadership in Telematics and Connected Services • Remote diagnostics • Telematics hardware and services • Predictive diagnostics • Quality, warranty and engineering support • Data ‘lake’ repository and advanced analytics Public
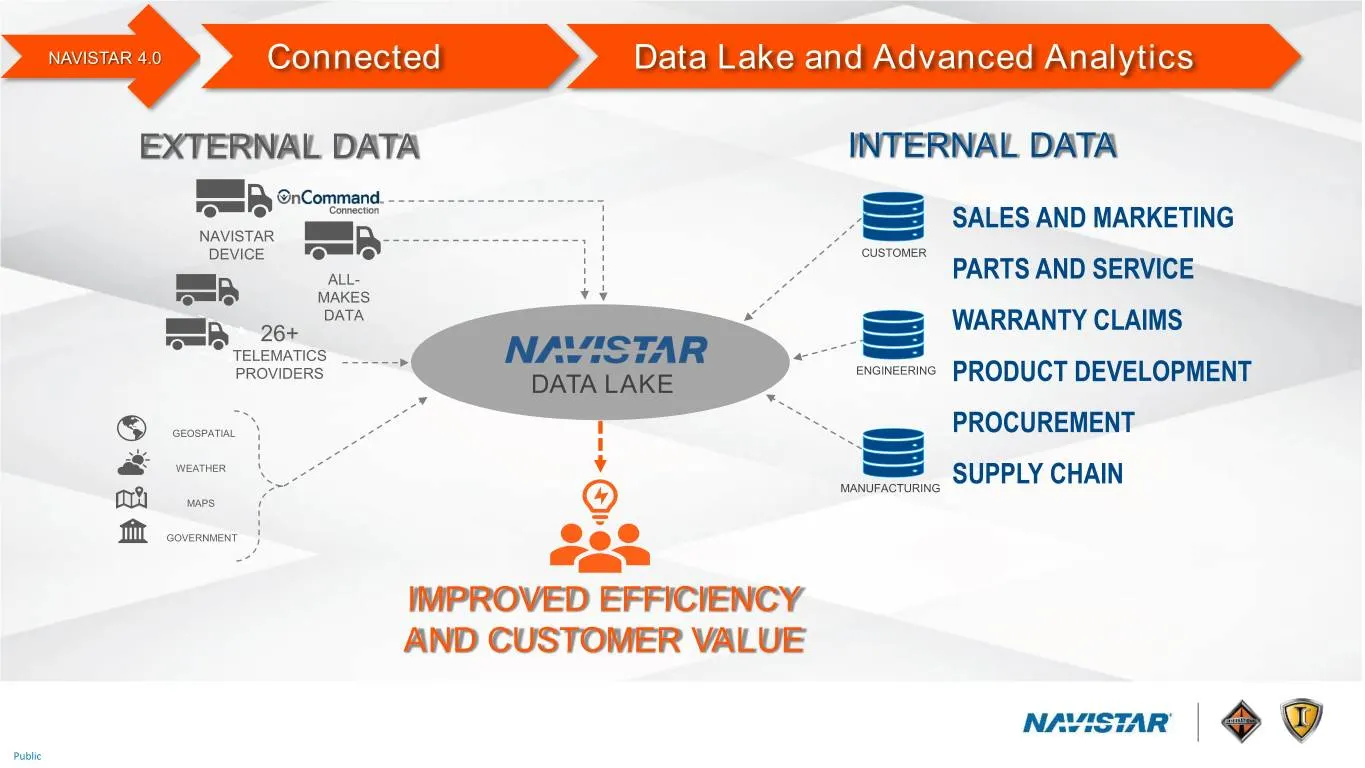
Slide 29: Connected: Data Lake and Advanced Analytics
NAVISTAR 4.0 Connected Data Lake and Advanced Analytics EXTERNAL DATA INTERNAL DATA SALES AND MARKETING NAVISTAR DEVICE CUSTOMER ALL- PARTS AND SERVICE MAKES DATA 26+ WARRANTY CLAIMS TELEMATICS ENGINEERING PROVIDERS DATA LAKE PRODUCT DEVELOPMENT GEOSPATIAL PROCUREMENT WEATHER MANUFACTURING SUPPLY CH
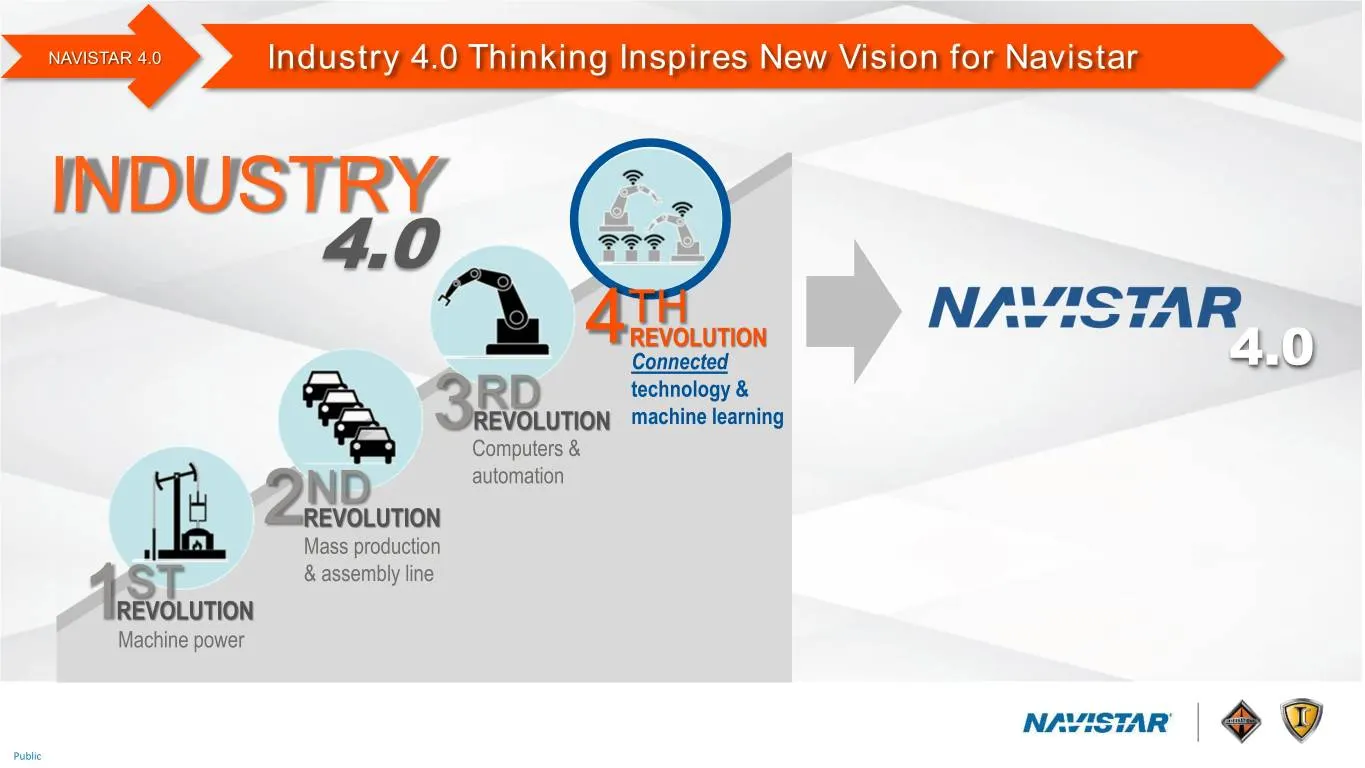
Slide 30: Industry 4.0 Thinking Inspires New Vision for Navistar
NAVISTAR 4.0 Industry 4.0 Thinking Inspires New Vision for Navistar INDUSTRY 4.0 TH 4REVOLUTION Connected 4.0 RD technology & 3REVOLUTION machine learning Computers & ND automation 2REVOLUTION Mass production ST & assembly line 1REVOLUTION Machine power Public
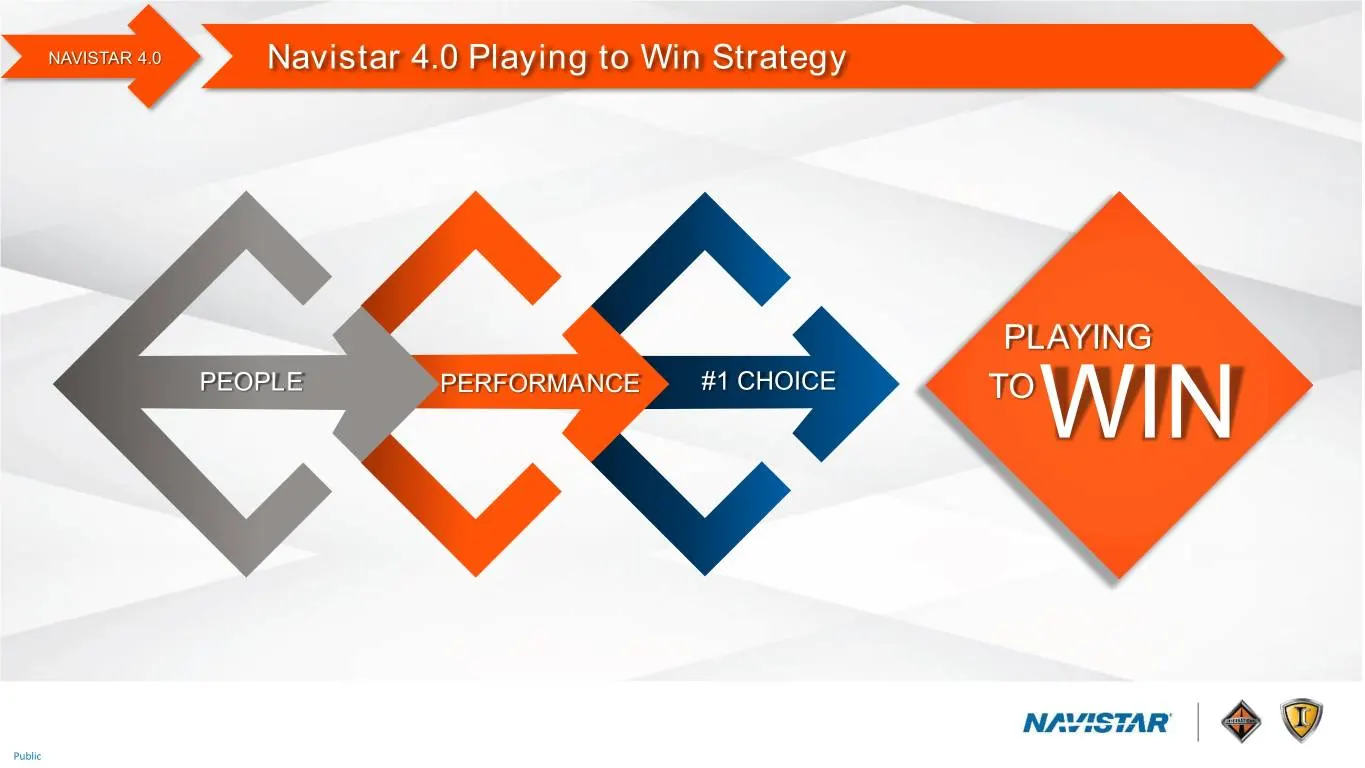
Slide 31: Navistar 4.0 Playing to Win Strategy
NAVISTAR 4.0 Navistar 4.0 Playing to Win Strategy PLAYING PEOPLE PERFORMANCE #1 CHOICE TO WIN Public
Slide 32: Strategic Transformation Requires Focus
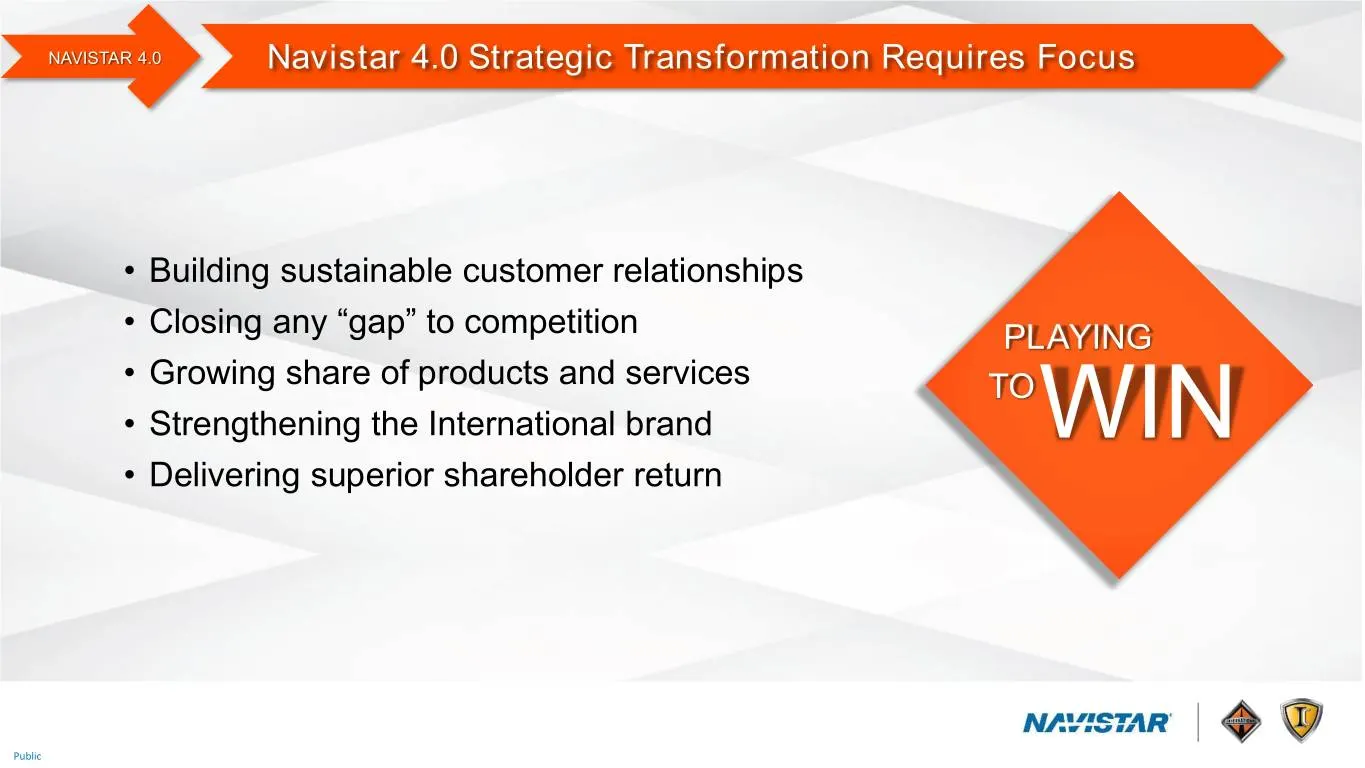
NAVISTAR 4.0 Navistar 4.0 Strategic Transformation Requires Focus • Building sustainable customer relationships • Closing any “gap” to competition PLAYING • Growing share of products and services TO • Strengthening the International brand WIN • Delivering superior shareholder return Public
Slide 33: Playing to Win Means The Best Team Wins
NAVISTAR 4.0 Playing to Win Means The Best Team Wins • We choose to work in teams • Strong values and culture PEOPLE • Lean enterprise • Develop or recruit key leadership Public
Slide 34: Strong Senior Leadership Team
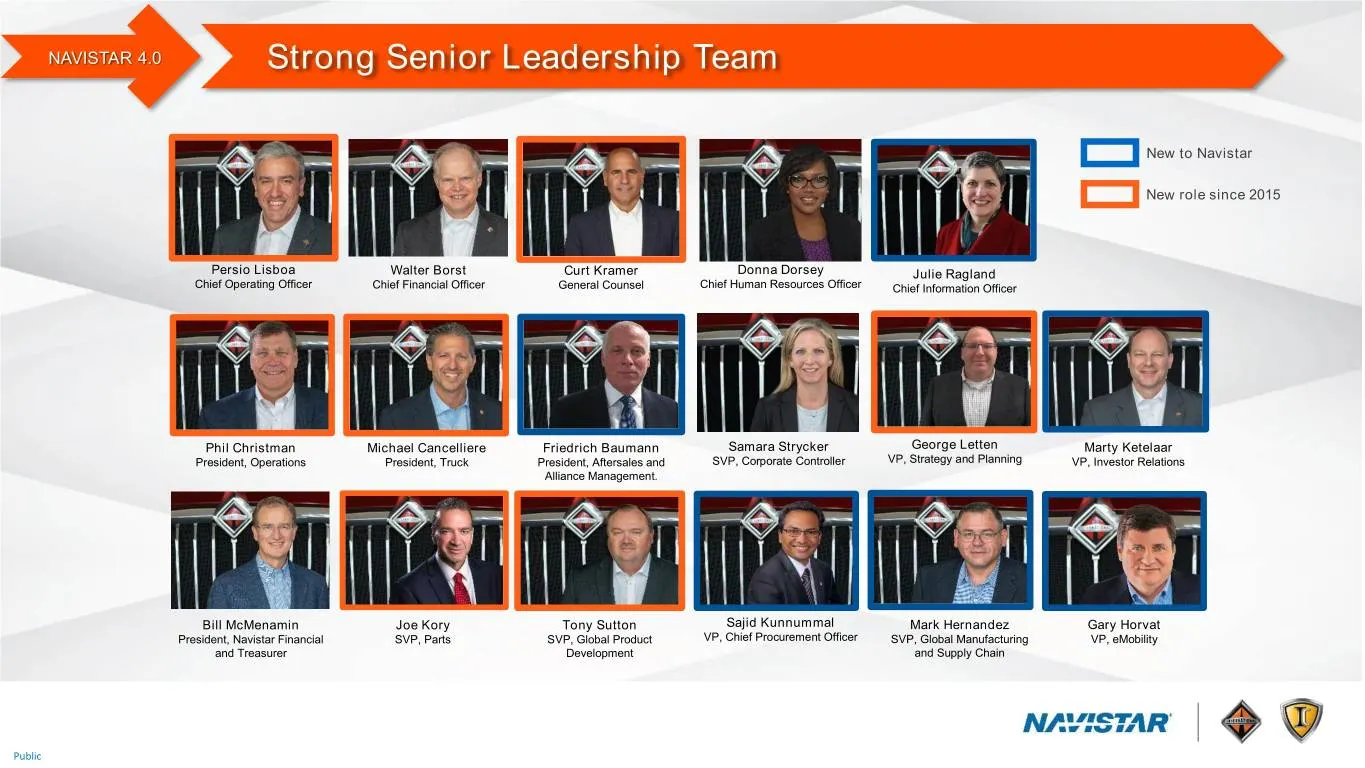
NAVISTAR 4.0 Strong Senior Leadership Team New to Navistar New role since 2015 Persio Lisboa Walter Borst Curt Kramer Donna Dorsey Julie Ragland Chief Operating Officer Chief Financial Officer General Counsel Chief Human Resources Officer Chief Information Officer Phil Christman Michael Cancelliere
Slide 35: Creating a Sustainable Performance Advantage
NAVISTAR 4.0 Creating a Sustainable Performance Advantage • Integrated Powertrains • Enterprise Platform Strategy PERFORMANCE • Advanced Modular Architecture • Integrated Manufacturing • Aftersales Acceleration Public
Slide 36: Customers See Us as the #1 Choice
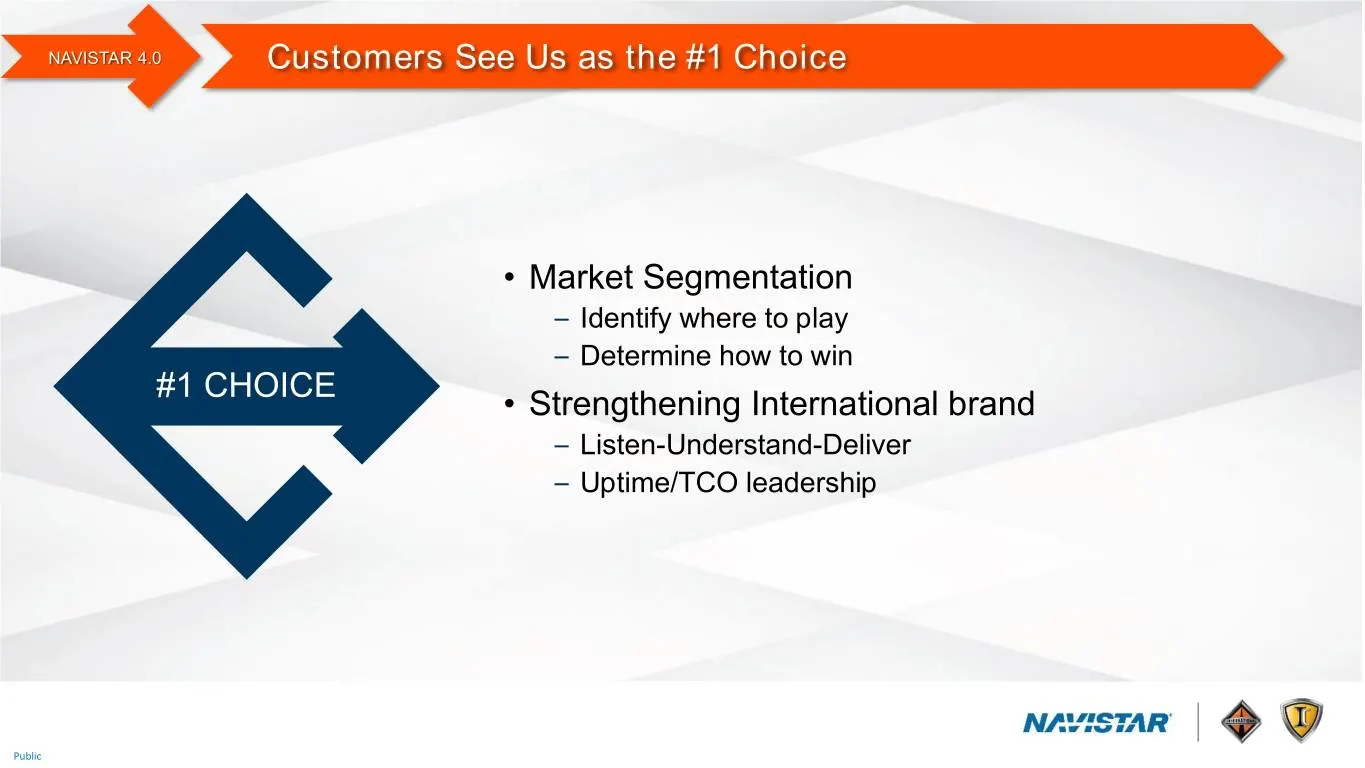
NAVISTAR 4.0 Customers See Us as the #1 Choice • Market Segmentation – Identify where to play – Determine how to win #1 CHOICE • Strengthening International brand – Listen-Understand-Deliver – Uptime/TCO leadership Public
Slide 37: Navistar 4.0 Improves Adj. EBITDA Margin by Percentage Points
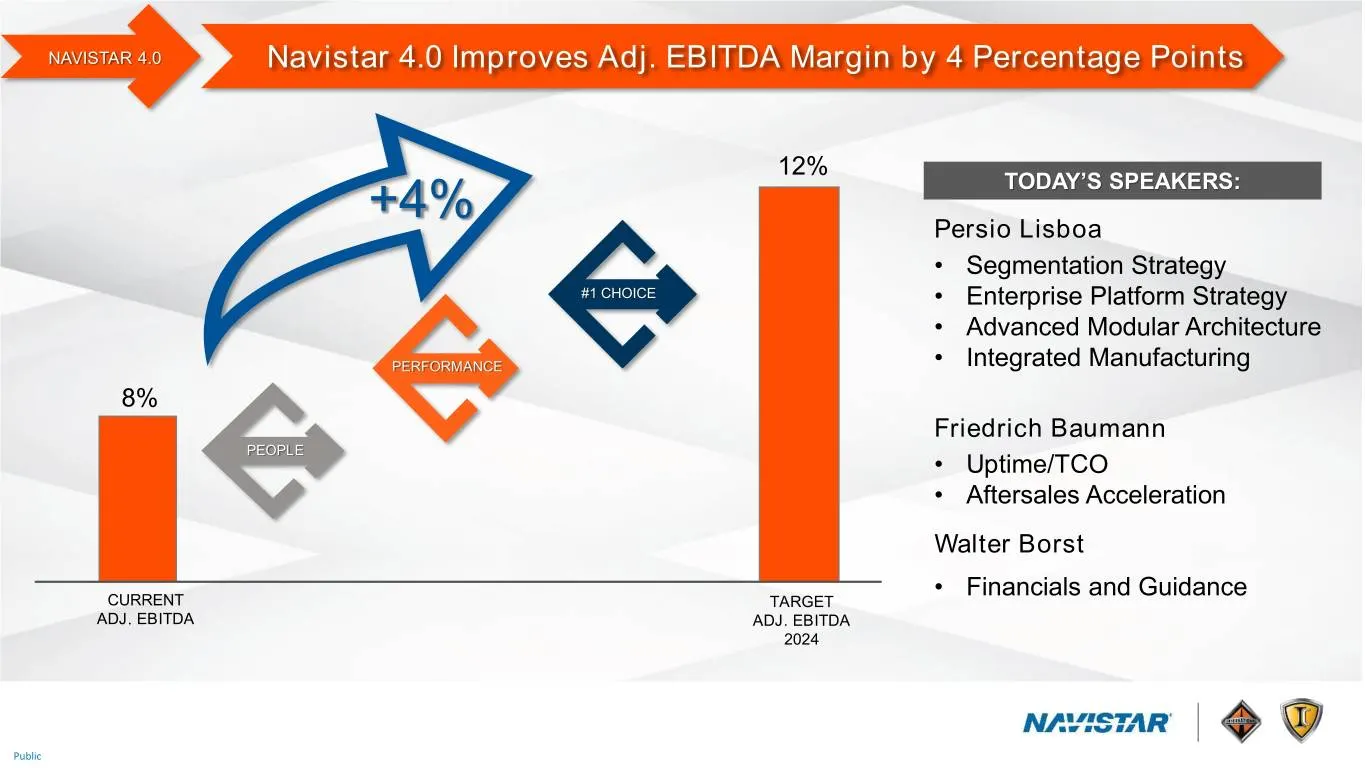
NAVISTAR 4.0 Navistar 4.0 Improves Adj. EBITDA Margin by 4 Percentage Points 12% +4% TODAY’S SPEAKERS: Persio Lisboa • Segmentation Strategy #1 CHOICE • Enterprise Platform Strategy • Advanced Modular Architecture PERFORMANCE • Integrated Manufacturing 8% Friedrich Baumann PEOPLE • Uptime/TCO • Afte
Slide 38: Navistar 4.0: The Right Vision, The Right Strategy
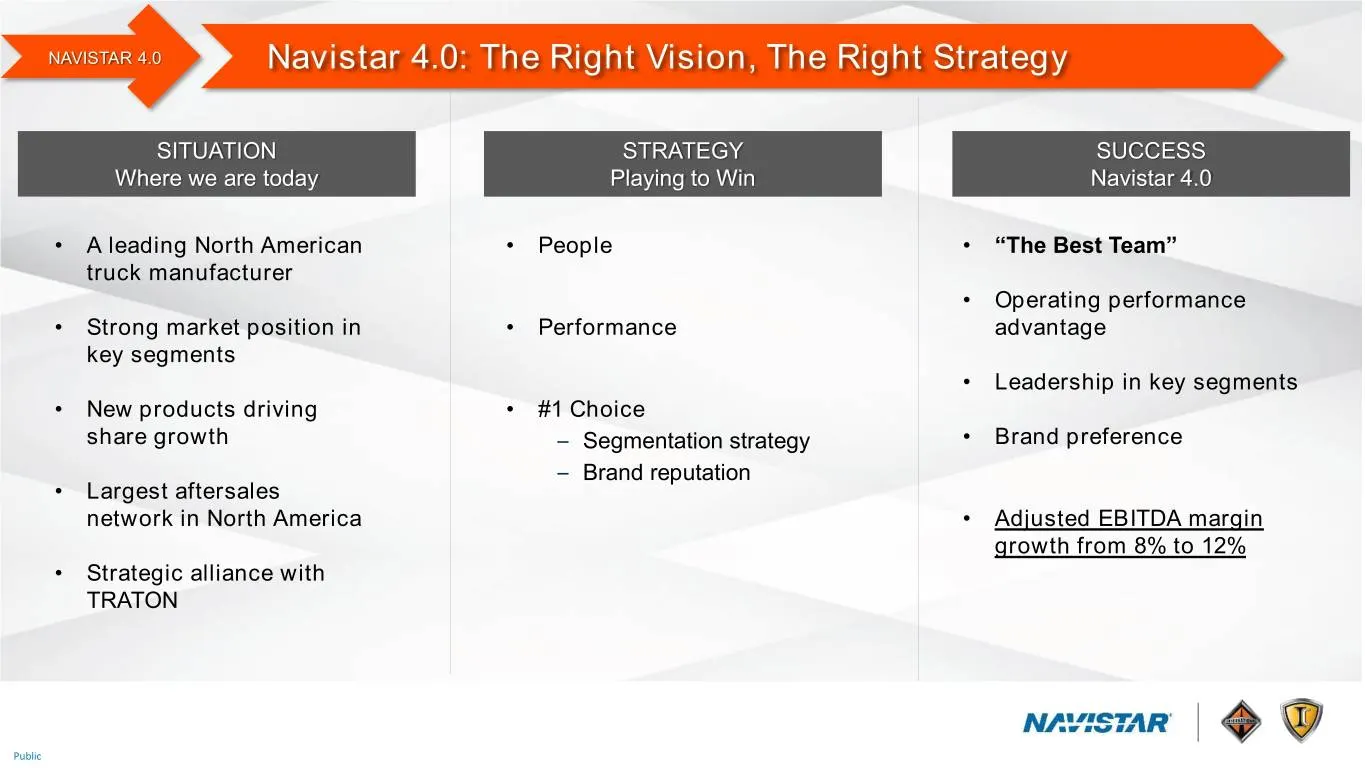
NAVISTAR 4.0 Navistar 4.0: The Right Vision, The Right Strategy SITUATION STRATEGY SUCCESS Where we are today Playing to Win Navistar 4.0 • A leading North American • People • “The Best Team” truck manufacturer • Operating performance • Strong market position in • Performance advantage key segments

Slide 39: Navistar U
NAVISTAR U
Slide 40: Persio Lisboa, EVP and Chief Operating Officer
PLAYING PEOPLE PERFORMANCE #1 CHOICE TO WIN PERSIO LISBOA Executive Vice President and Chief Operating Officer Navistar International Corporation Public
Slide 41: Navistar 4.0 – Roadmap to Sustainable Leadership
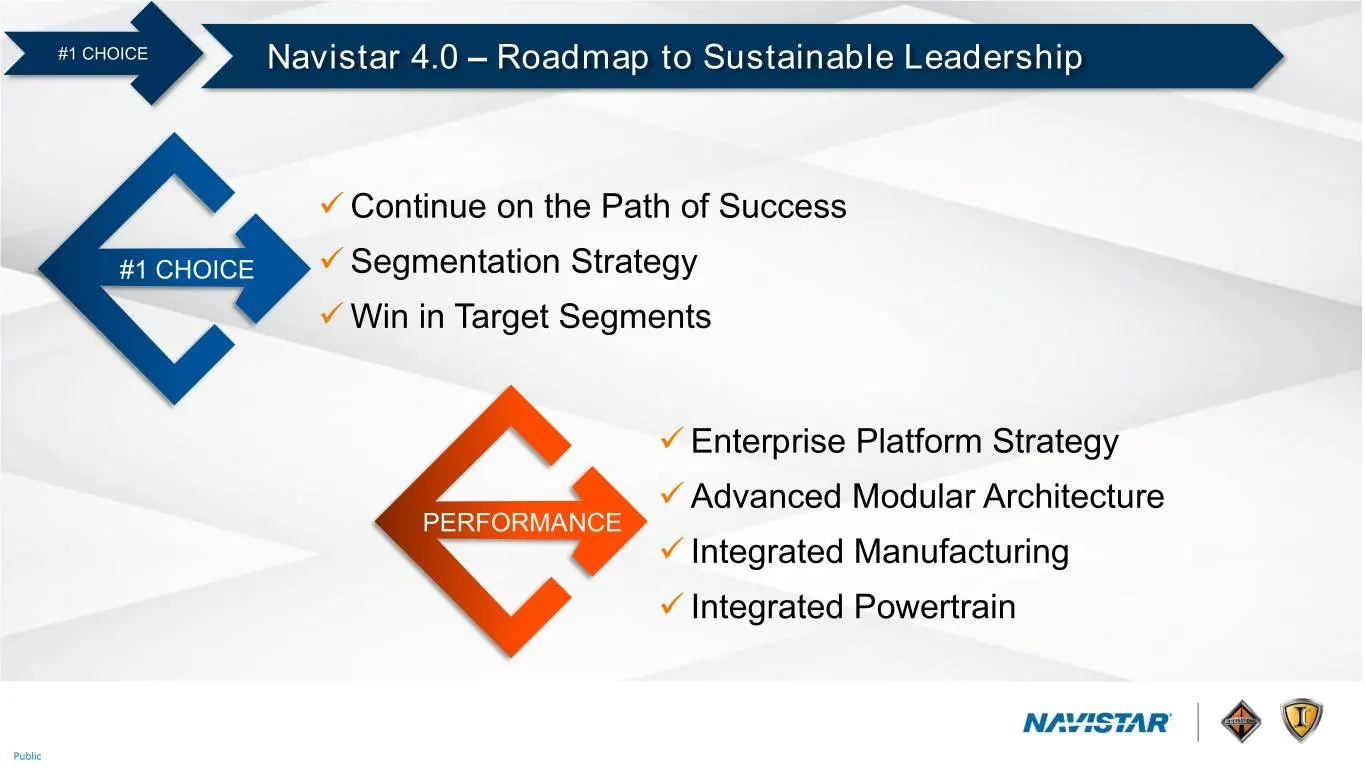
#1 CHOICE Navistar 4.0 – Roadmap to Sustainable Leadership ✓ Continue on the Path of Success #1 CHOICE ✓ Segmentation Strategy ✓ Win in Target Segments ✓ Enterprise Platform Strategy ✓ Advanced Modular Architecture PERFORMANCE ✓ Integrated Manufacturing ✓ Integrated Powertrain Public

Slide 42: #1 Choice
#1 CHOICE Public
Slide 43: Continue on the Path of Success
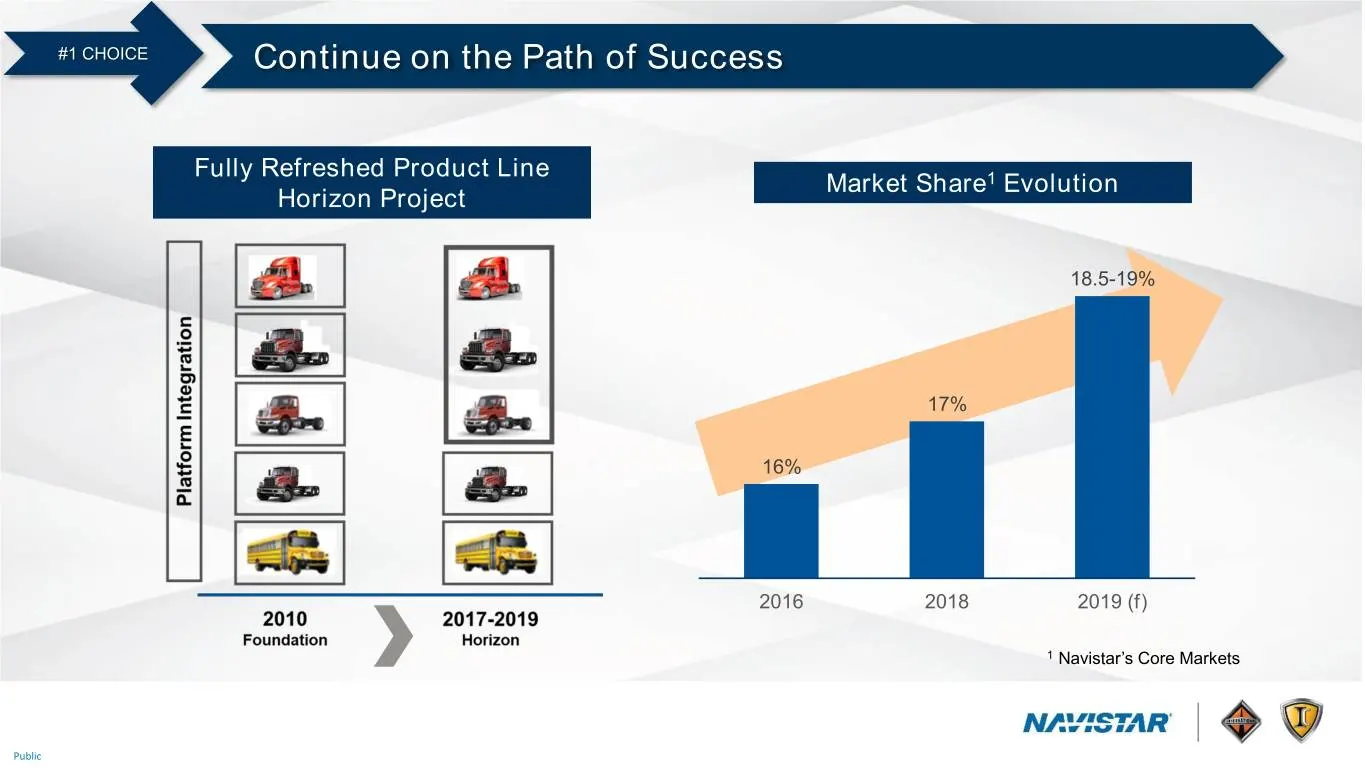
#1 CHOICE Continue on the Path of Success Fully Refreshed Product Line Market Share1 Evolution Horizon Project 18.5-19% 17% 16% 2016 2018 2019 (f) 1 Navistar’s Core Markets Public
Slide 44: Segmentation Strategy: Where to Play
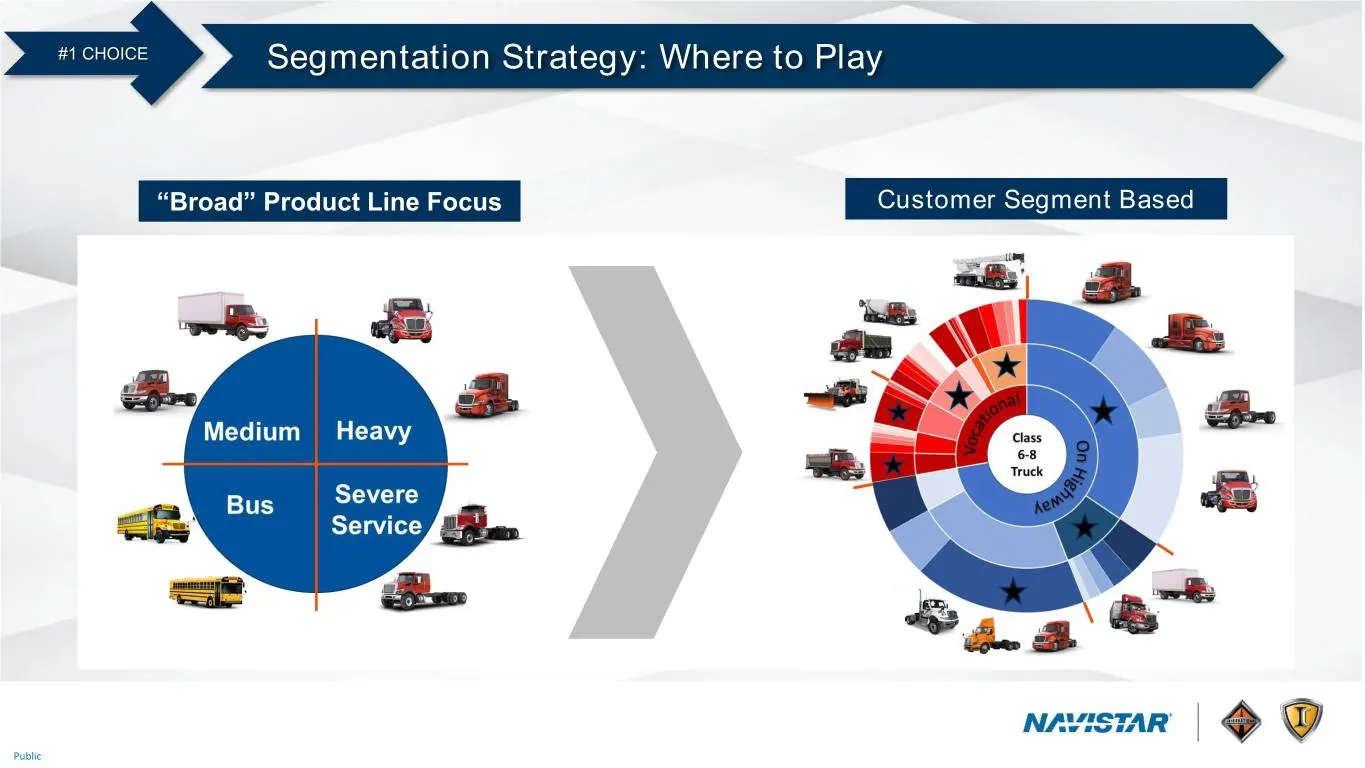
#1 CHOICE Segmentation Strategy: Where to Play “Broad” Product Line Focus Customer Segment Based Public
Slide 45: Segmentation Strategy: Playing to Our Strengths
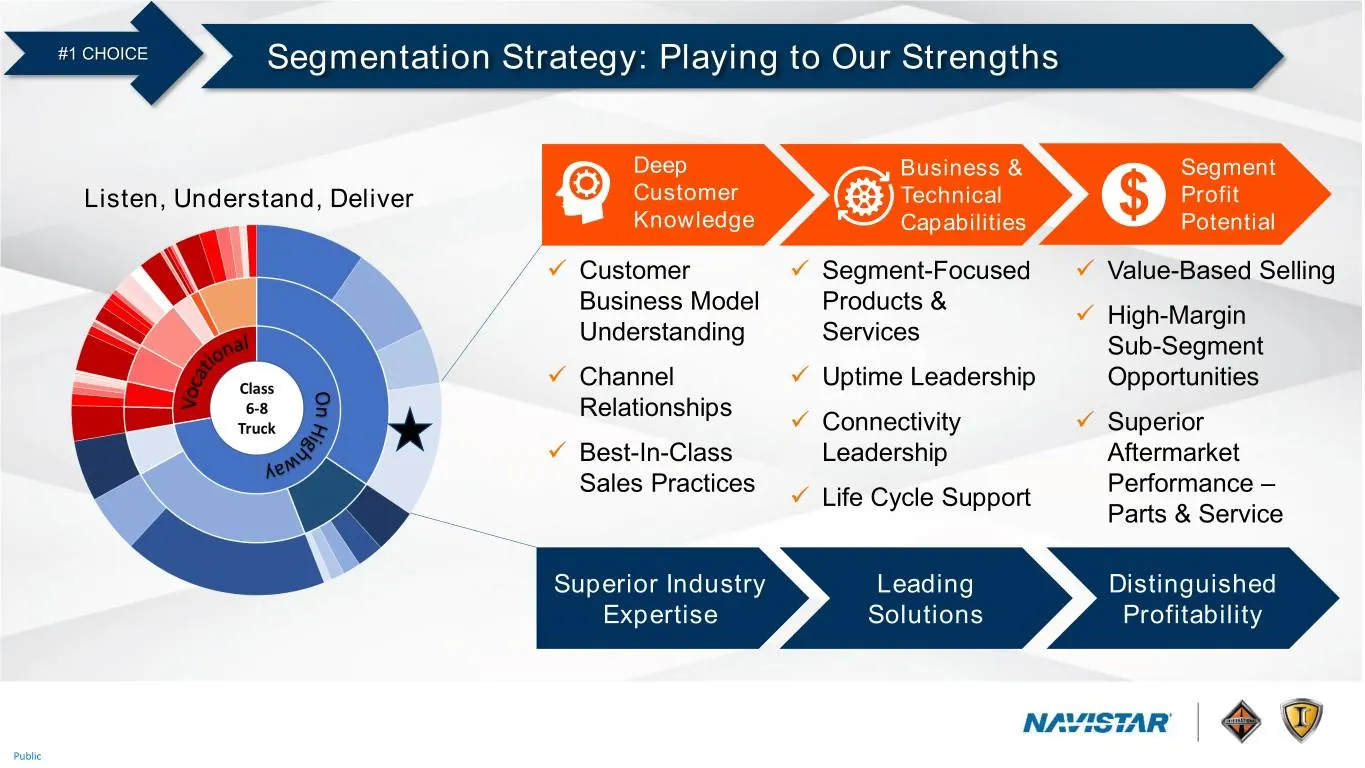
#1 CHOICE Segmentation Strategy: Playing to Our Strengths Deep Business & Segment Listen, Understand, Deliver Customer Technical Profit Knowledge Capabilities Potential ✓ Customer ✓ Segment-Focused ✓ Value-Based Selling Business Model Products & ✓ High-Margin Understanding Services Sub-Segment ✓ Cha
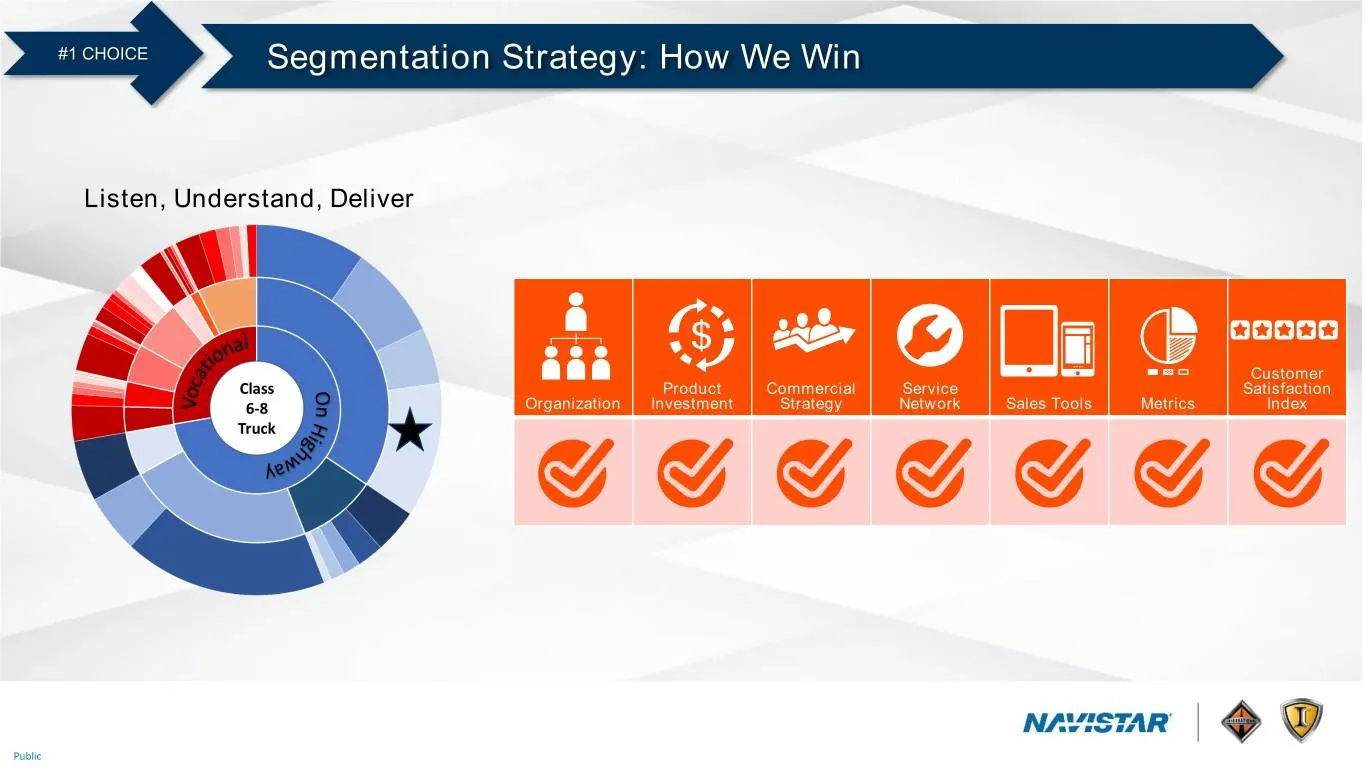
Slide 46: Segmentation Strategy: How We Win
#1 CHOICE Segmentation Strategy: How We Win Listen, Understand, Deliver Customer Product Commercial Service Satisfaction Organization Investment Strategy Network Sales Tools Metrics Index Public
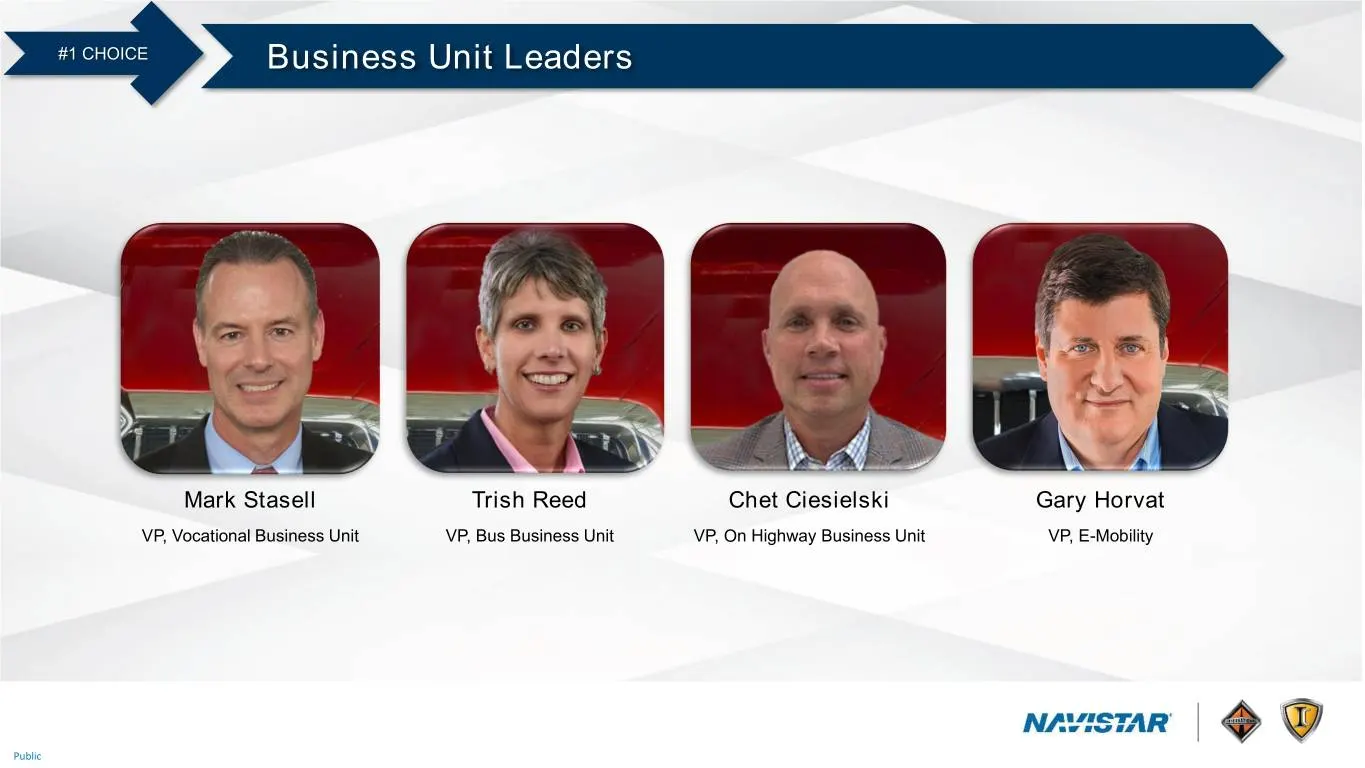
Slide 47: Business Unit Leaders
#1 CHOICE Business Unit Leaders Mark Stasell Trish Reed Chet Ciesielski Gary Horvat VP, Vocational Business Unit VP, Bus Business Unit VP, On Highway Business Unit VP, E-Mobility Public
Slide 48: Performance
ae : | se dies ie PERFORMANCE
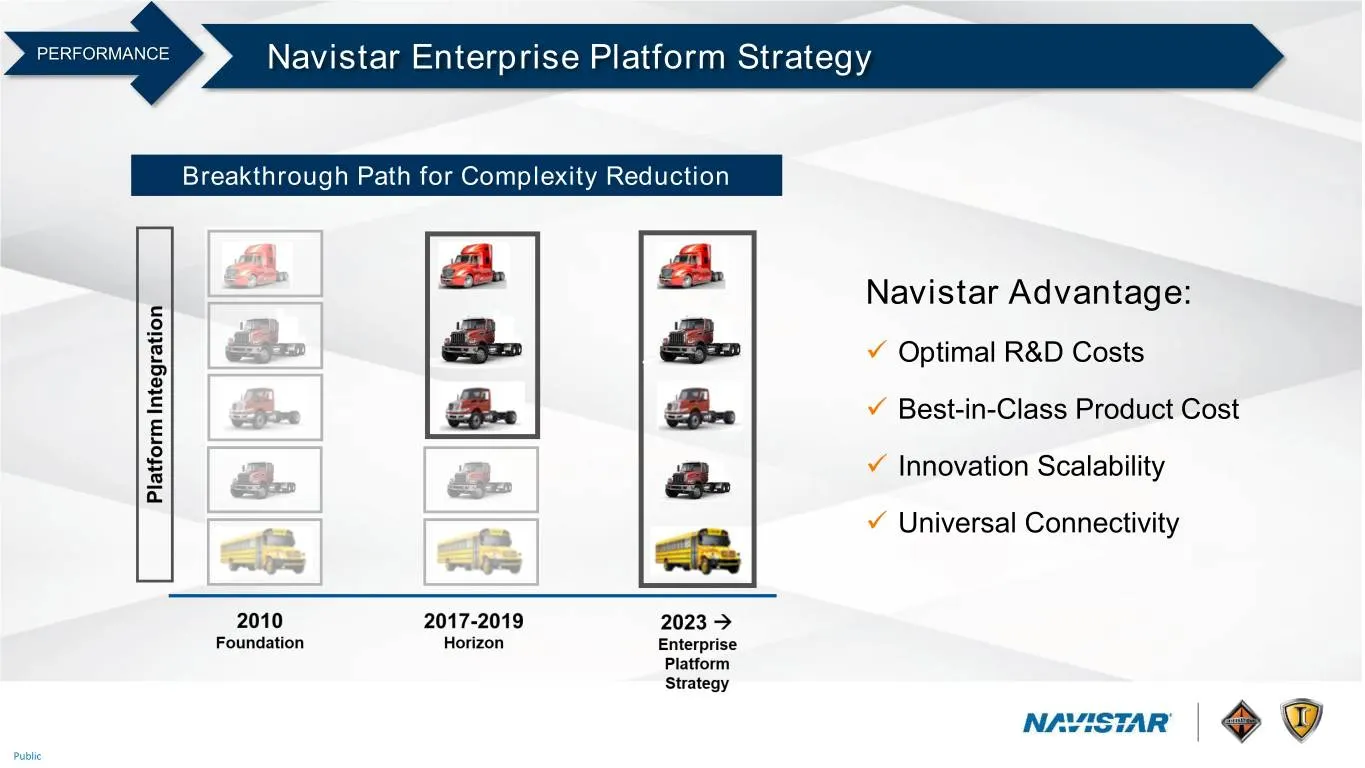
Slide 49: Navistar Enterprise Platform Strategy
PERFORMANCE Navistar Enterprise Platform Strategy Breakthrough Path for Complexity Reduction Navistar Advantage: ✓ Optimal R&D Costs ✓ Best-in-Class Product Cost ✓ Innovation Scalability ✓ Universal Connectivity Public
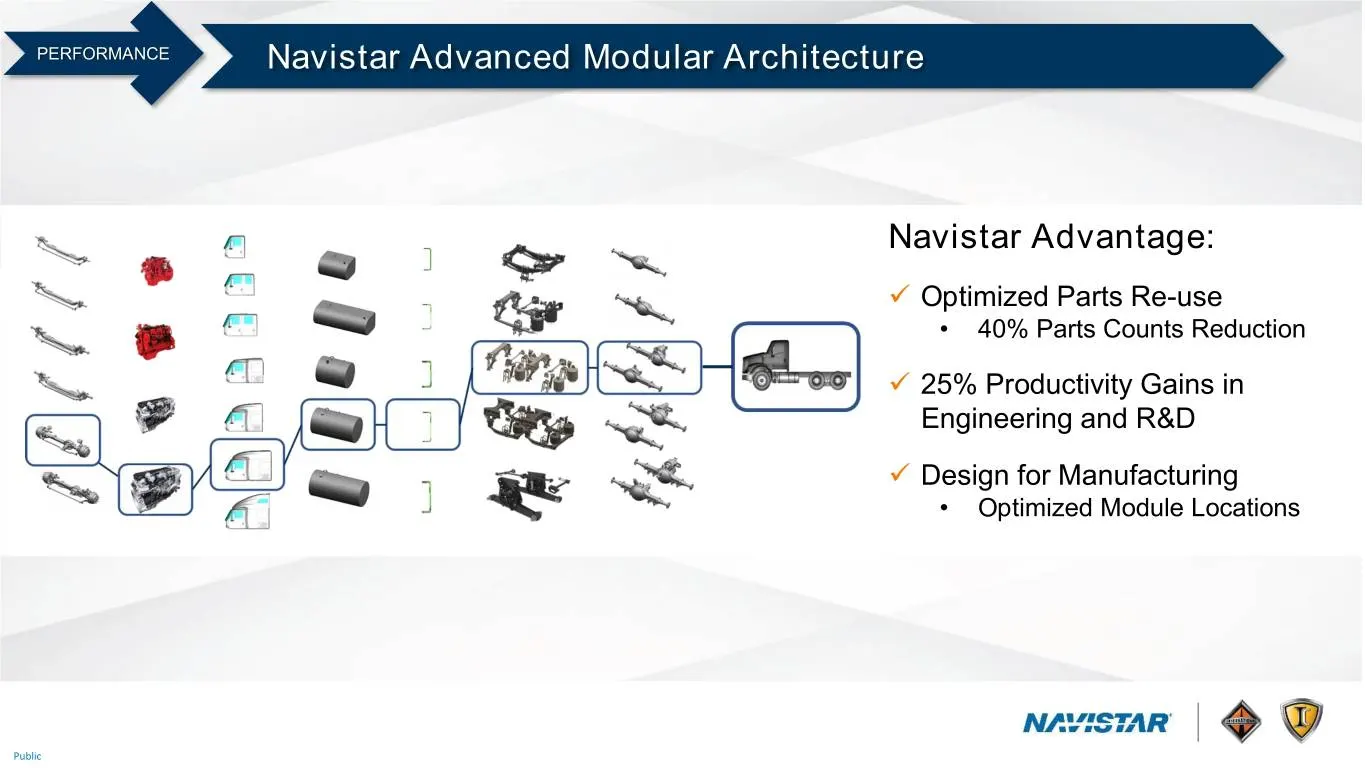
Slide 50: Navistar Advanced Modular Architecture
PERFORMANCE Navistar Advanced Modular Architecture Navistar Advantage: ✓ Optimized Parts Re-use • 40% Parts Counts Reduction ✓ 25% Productivity Gains in Engineering and R&D ✓ Design for Manufacturing • Optimized Module Locations Public
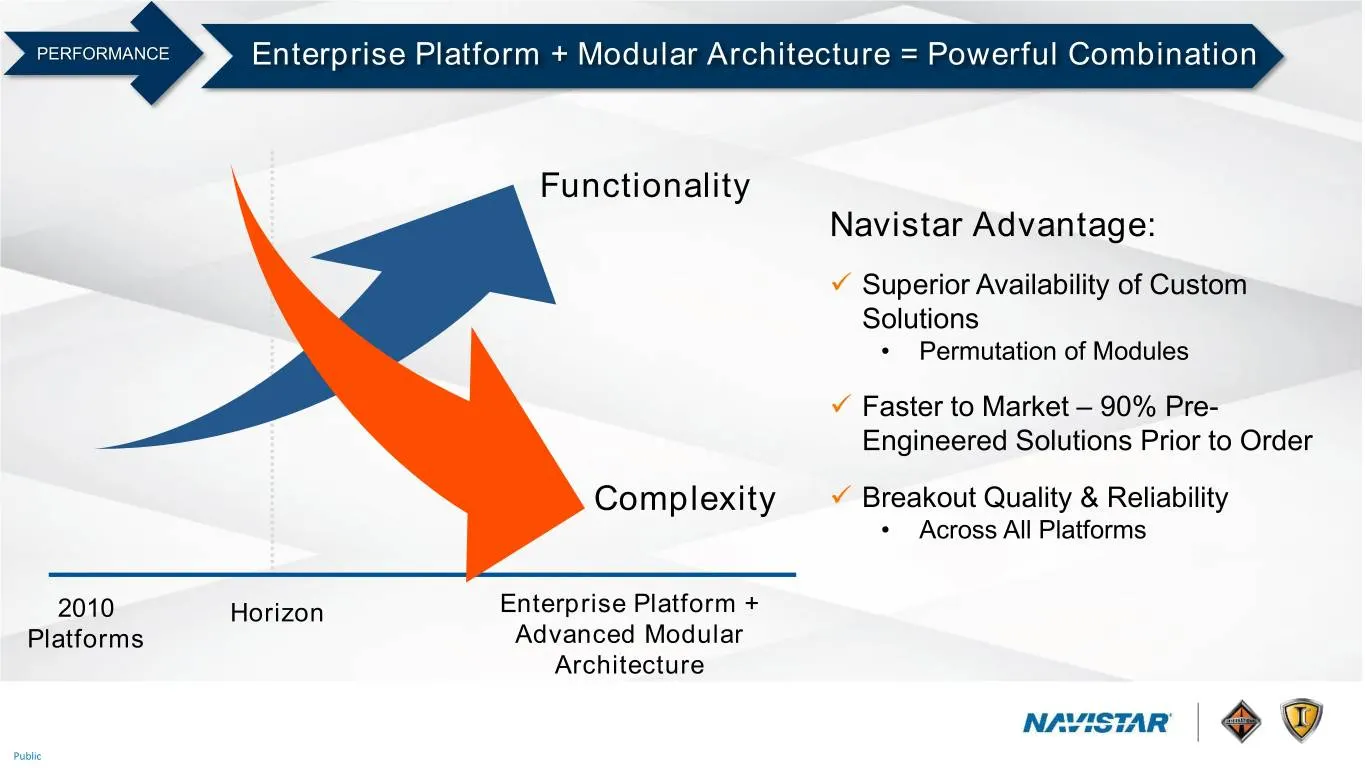
Slide 51: Enterprise Platform + Modular Architecture = Powerful Combination
PERFORMANCE Enterprise Platform + Modular Architecture = Powerful Combination Functionality Navistar Advantage: ✓ Superior Availability of Custom Solutions • Permutation of Modules ✓ Faster to Market – 90% Pre- Engineered Solutions Prior to Order Complexity ✓ Breakout Quality & Reliability • Across
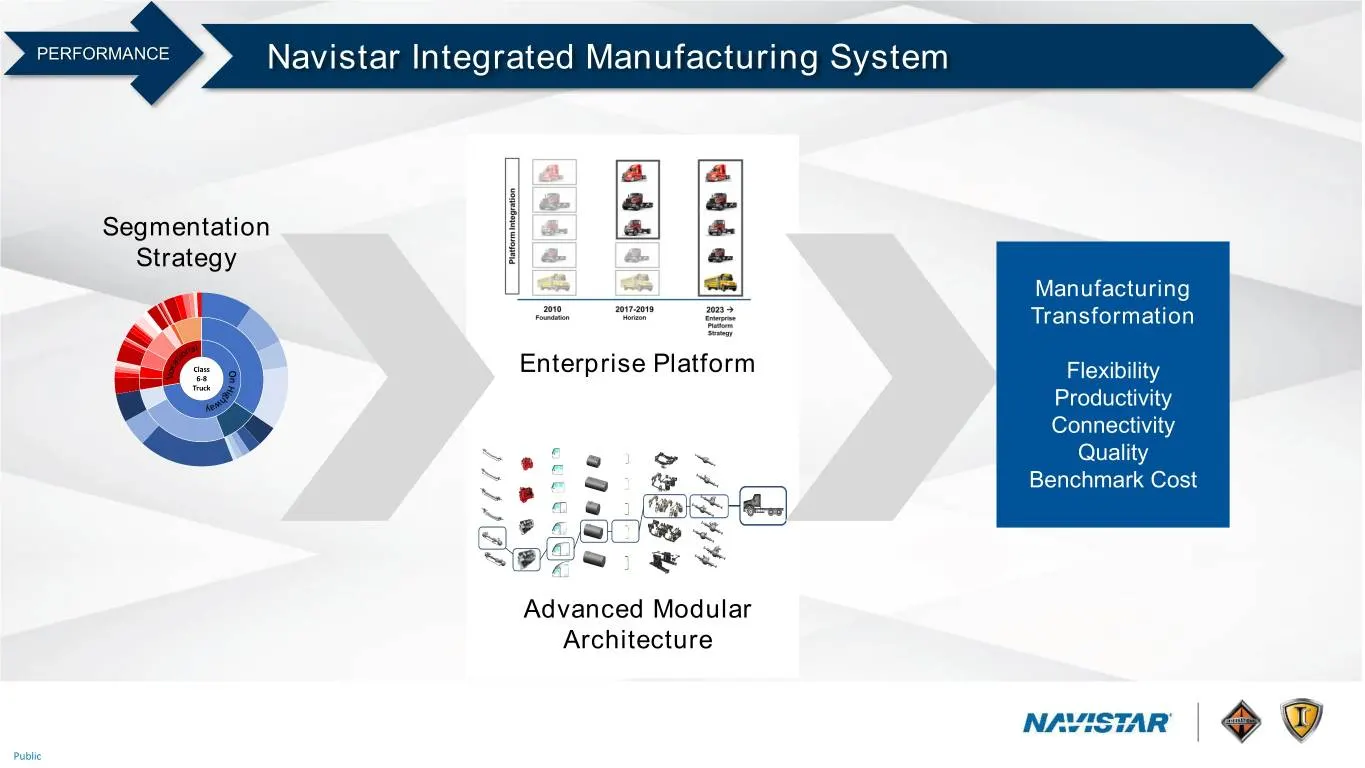
Slide 52: Navistar Integrated Manufacturing System
PERFORMANCE Navistar Integrated Manufacturing System Segmentation Strategy Manufacturing Transformation Enterprise Platform Flexibility Productivity Connectivity Quality Benchmark Cost Advanced Modular Architecture Public
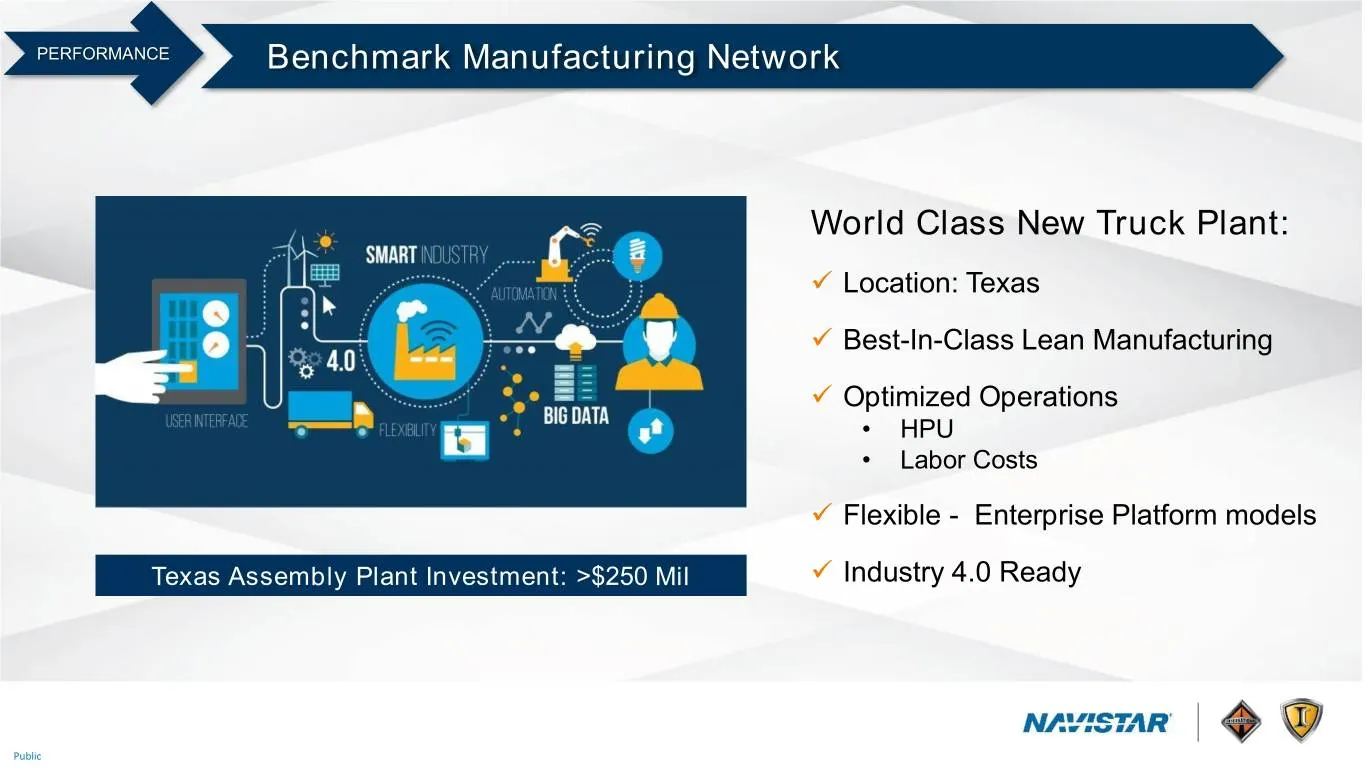
Slide 53: Benchmark Manufacturing Network
PERFORMANCE Benchmark Manufacturing Network World Class New Truck Plant: ✓ Location: Texas ✓ Best-In-Class Lean Manufacturing ✓ Optimized Operations • HPU • Labor Costs ✓ Flexible - Enterprise Platform models Texas Assembly Plant Investment: >$250 Mil ✓ Industry 4.0 Ready Public
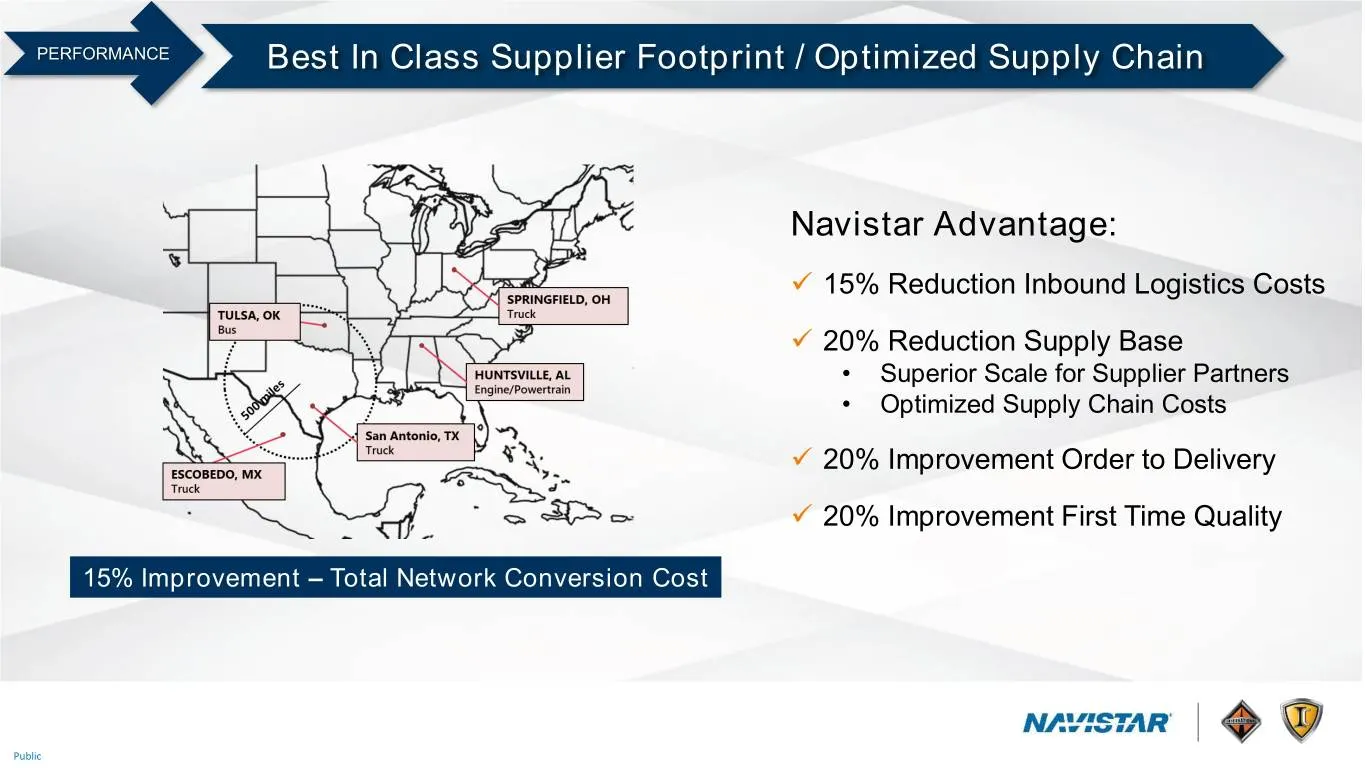
Slide 54: Best In Class Supplier Footprint / Optimized Supply Chain
PERFORMANCE Best In Class Supplier Footprint / Optimized Supply Chain Navistar Advantage: ✓ 15% Reduction Inbound Logistics Costs ✓ 20% Reduction Supply Base • Superior Scale for Supplier Partners • Optimized Supply Chain Costs ✓ 20% Improvement Order to Delivery ✓ 20% Improvement First Time Quality
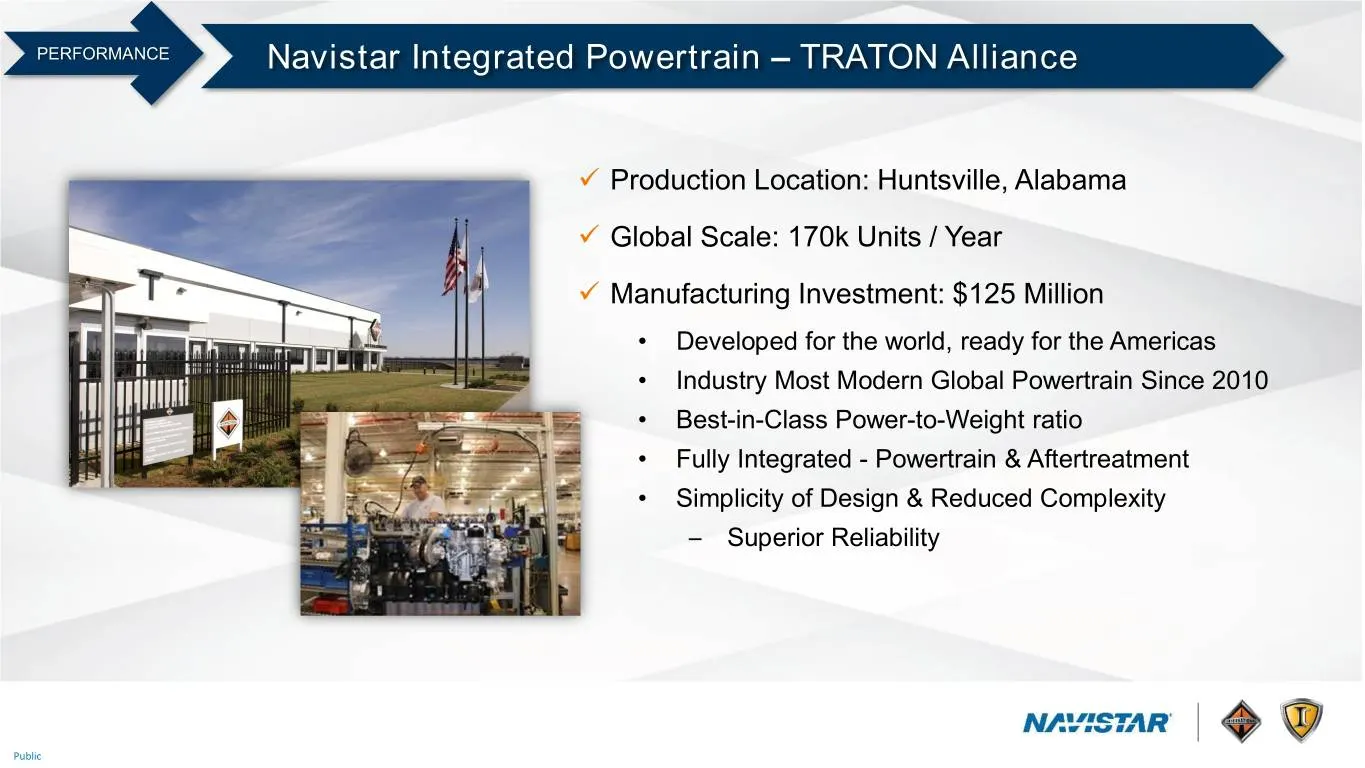
Slide 55: Navistar Integrated Powertrain – TRATON Alliance
PERFORMANCE Navistar Integrated Powertrain – TRATON Alliance ✓ Production Location: Huntsville, Alabama ✓ Global Scale: 170k Units / Year ✓ Manufacturing Investment: $125 Million • Developed for the world, ready for the Americas • Industry Most Modern Global Powertrain Since 2010 • Best-in-Class Pow
Slide 56: Navistar 4.0 – Playing to Win Key Takeaways
Navistar 4.0 – Playing to Win Key Takeaways ✓ Solid Foundation ✓ Tracking Record ✓ Customer Centric Segmentation ✓ Market Share ✓ Enterprise Platform Strategy ✓ Breakthrough Scale ✓ Advanced Modular Architecture ✓ Superior Customer Value ✓ Integrated Powertrain ✓ Global Scale, Profitability and Part
Slide 57: Question and Answer
PLAYING PEOPLE PERFORMANCE #1 CHOICE TO WIN QUESTION AND ANSWER Public

Slide 58: Navistar U
NAVISTAR U
Slide 59: Friedrich Baumann, September 19, 2019
PLAYING PEOPLE PERFORMANCE #1 CHOICE TO WIN FRIEDRICH BAUMANN September 19, 2019 Public
Slide 60: Vision 2025: The Customer at the Center of What We Do
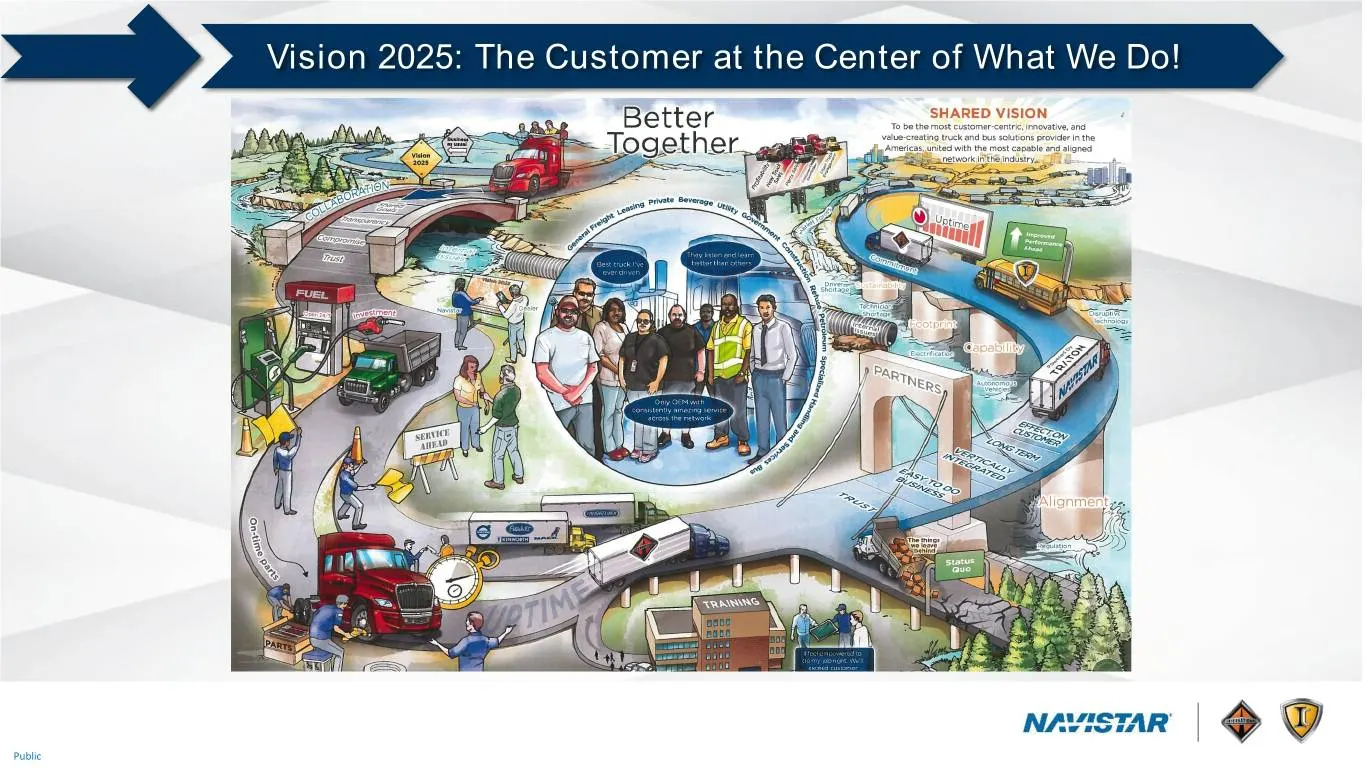
Vision 2025: The Customer at the Center of What We Do! Design will replace 2025 Poster Public
Slide 61: Vision 2025 is the Backbone to Aftersales Acceleration
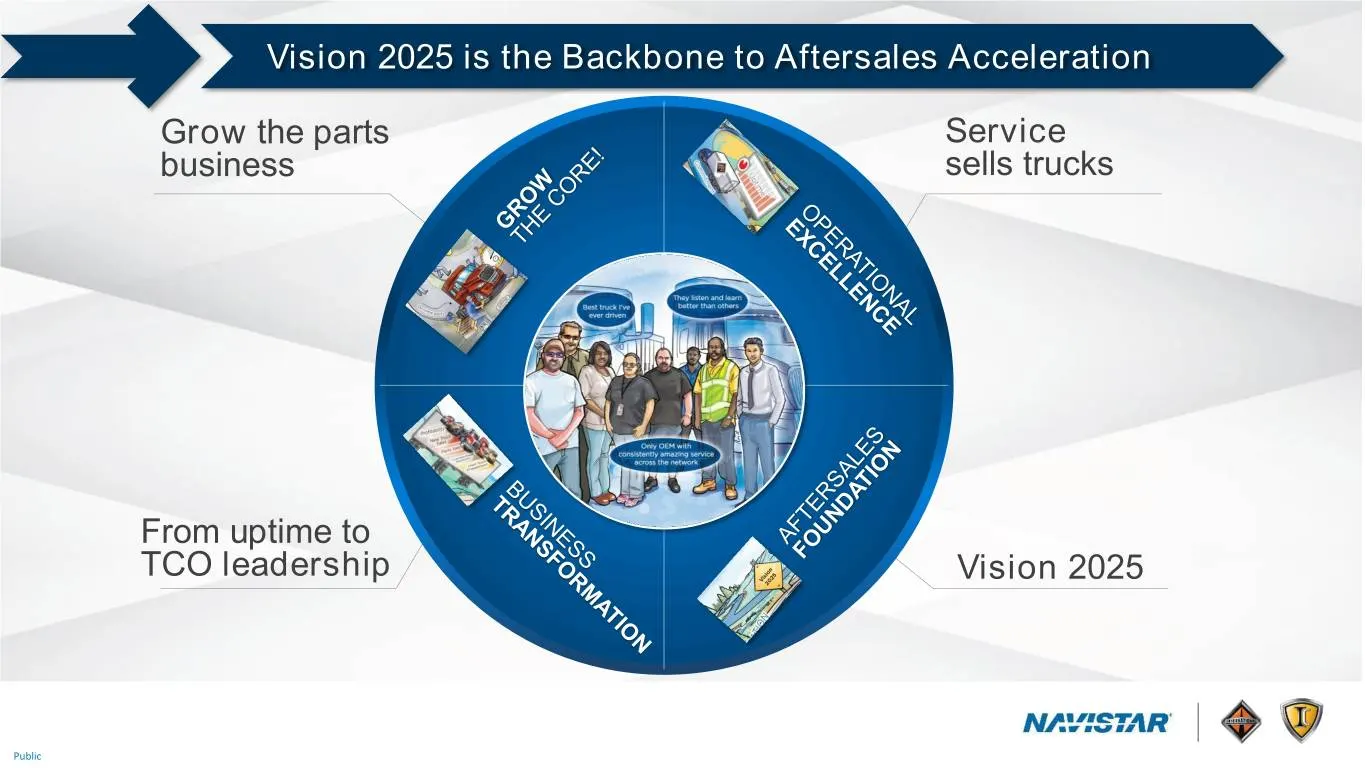
Vision 2025 is the Backbone to Aftersales Acceleration Grow the parts Service business sells trucks From uptime to TCO leadership Vision 2025 Public
Slide 62: Parts: Growth and New Initiatives Outpace the Runoff
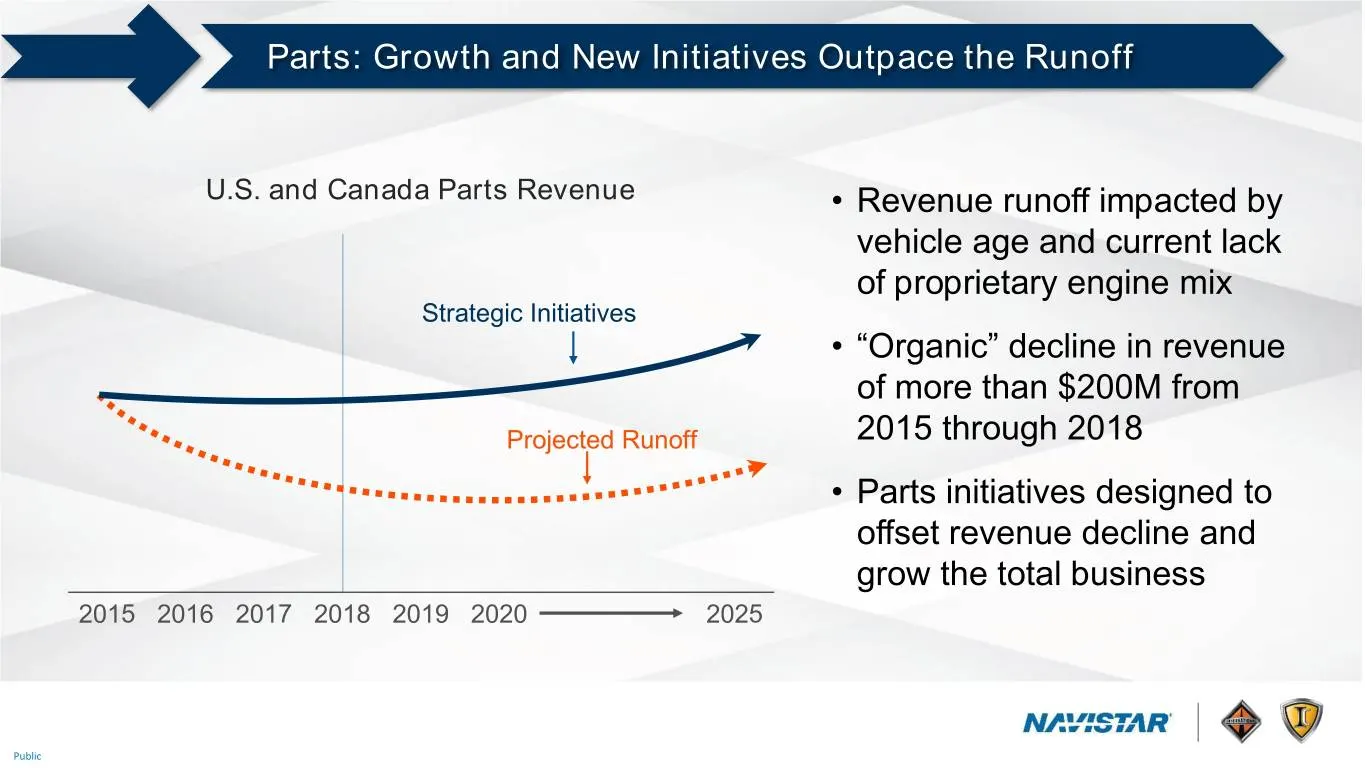
Parts: Growth and New Initiatives Outpace the Runoff U.S. and Canada Parts Revenue • Revenue runoff impacted by vehicle age and current lack of proprietary engine mix Strategic Initiatives • “Organic” decline in revenue of more than $200M from Projected Runoff 2015 through 2018 • Parts initiatives d
Slide 63: Parts: Organically Grow the Parts Business
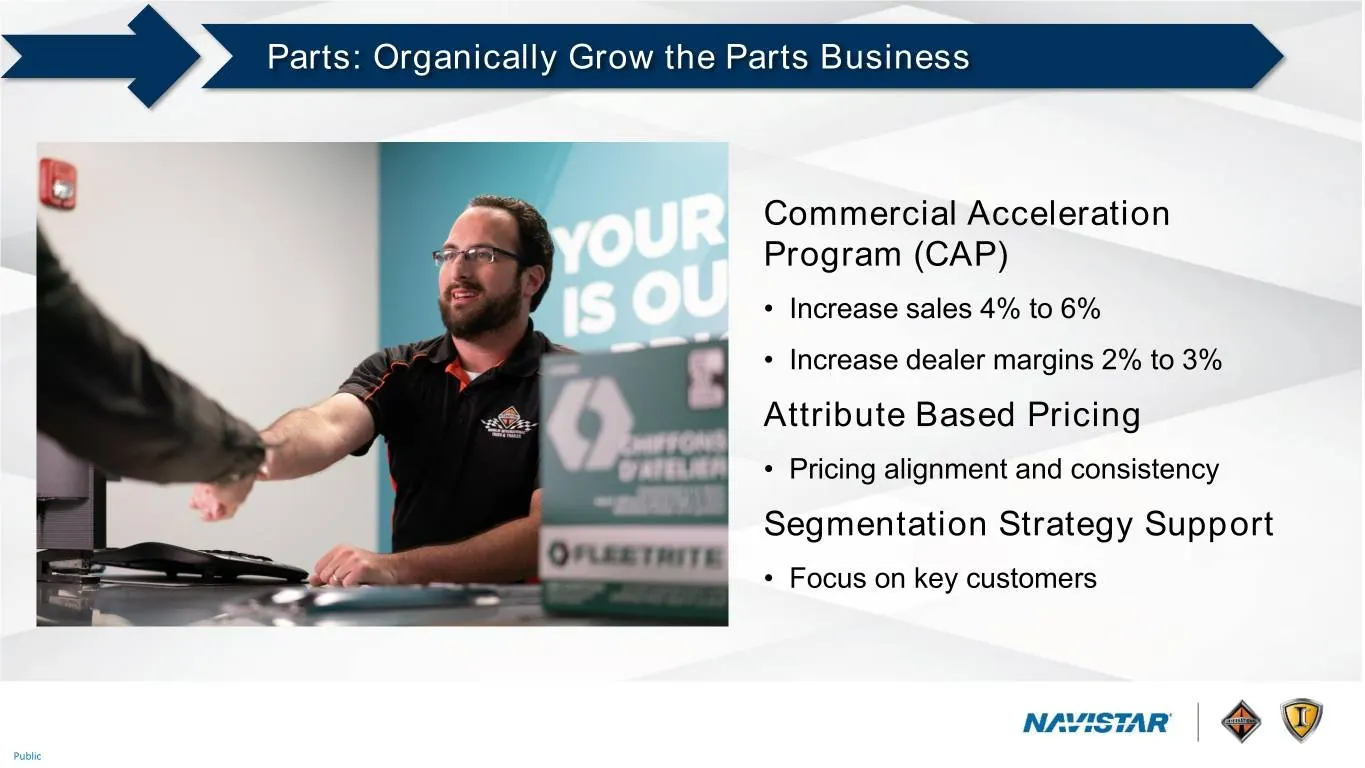
Parts: Organically Grow the Parts Business Commercial Acceleration Program (CAP) • Increase sales 4% to 6% • Increase dealer margins 2% to 3% Attribute Based Pricing • Pricing alignment and consistency Segmentation Strategy Support • Focus on key customers Public
Slide 64: Parts: Integrated Powertrain Will Increase Proprietary Parts
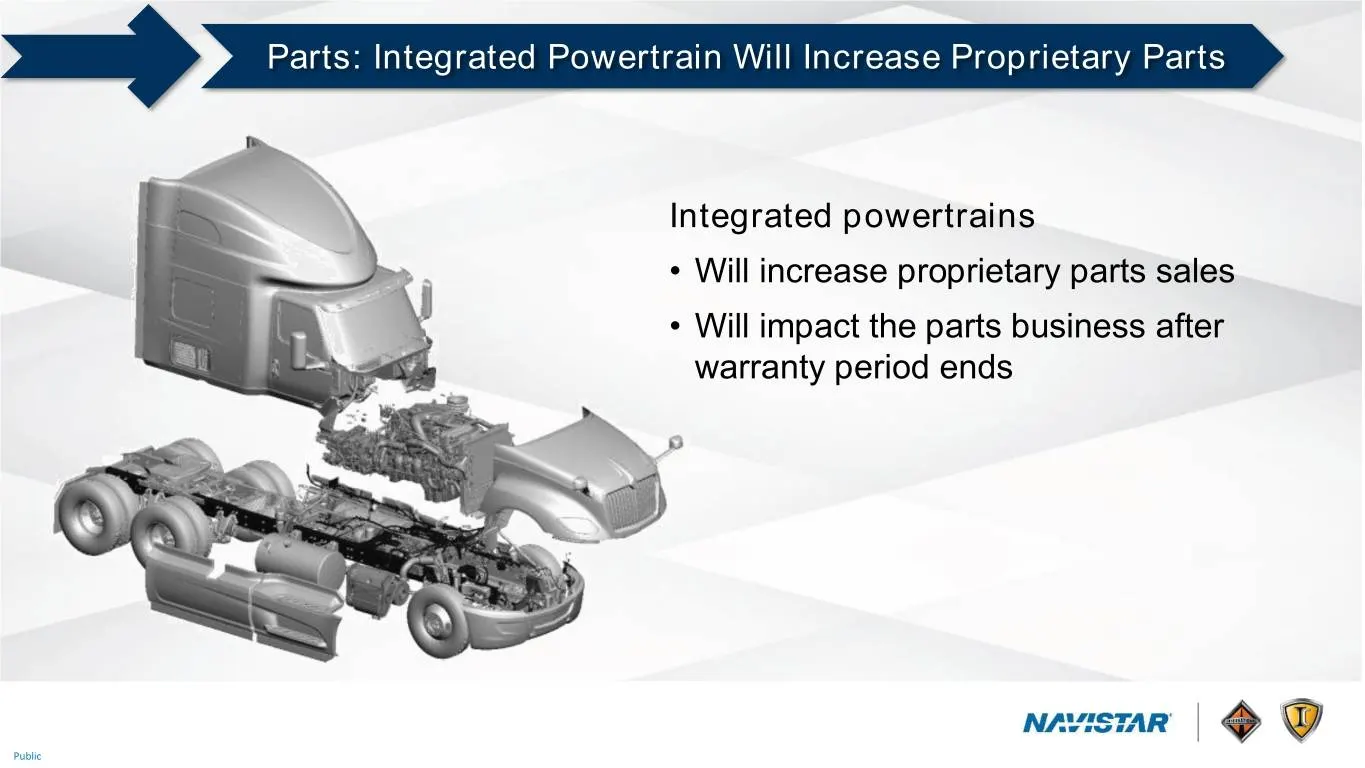
Parts: Integrated Powertrain Will Increase Proprietary Parts Integrated powertrains • Will increase proprietary parts sales • Will impact the parts business after warranty period ends Public
Slide 65: Grow the Parts Business: Fleetrite and ReNEWed Brands
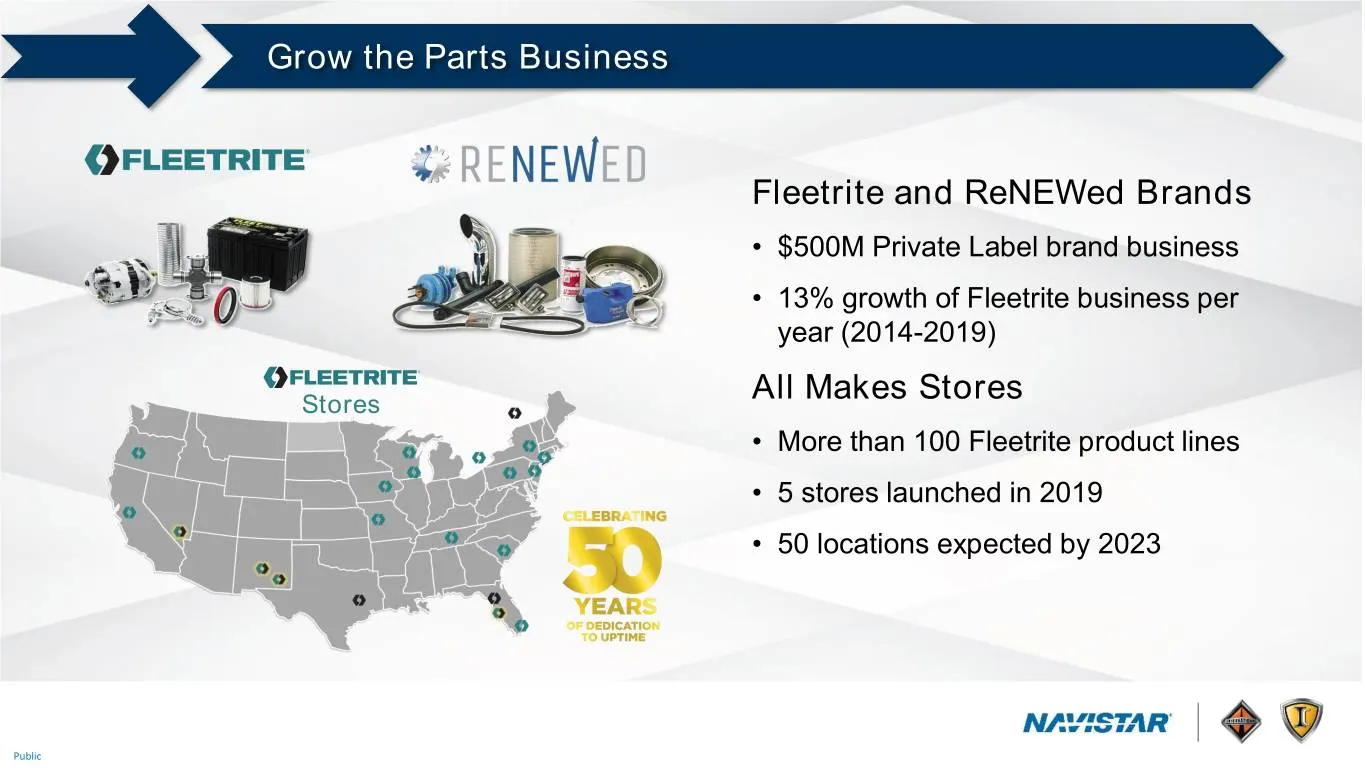
Grow the Parts Business Fleetrite and ReNEWed Brands • $500M Private Label brand business • 13% growth of Fleetrite business per year (2014-2019) Stores All Makes Stores • More than 100 Fleetrite product lines • 5 stores launched in 2019 • 50 locations expected by 2023 Public
Slide 66: Parts: RepairLink E-Commerce
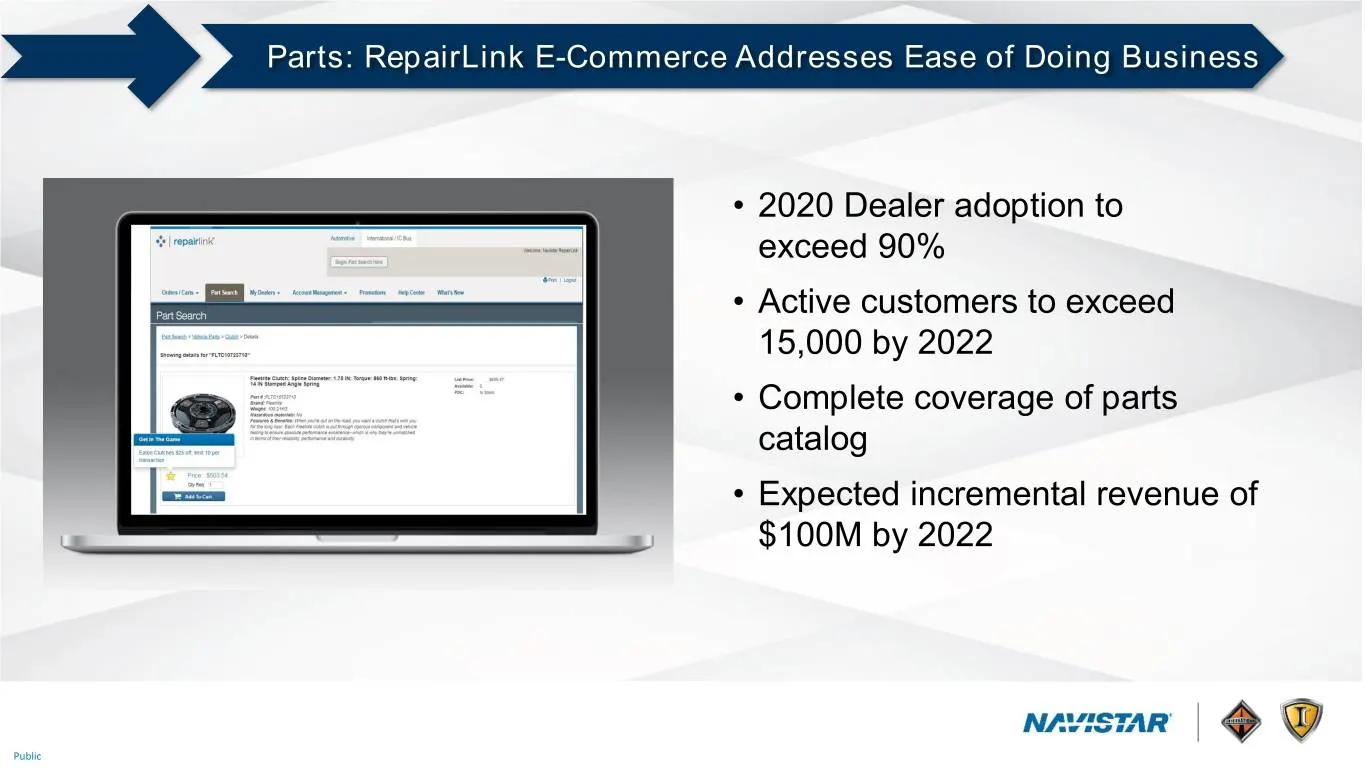
Parts: RepairLink E-Commerce Addresses Ease of Doing Business • 2020 Dealer adoption to exceed 90% • Active customers to exceed 15,000 by 2022 • Complete coverage of parts catalog • Expected incremental revenue of $100M by 2022 Public
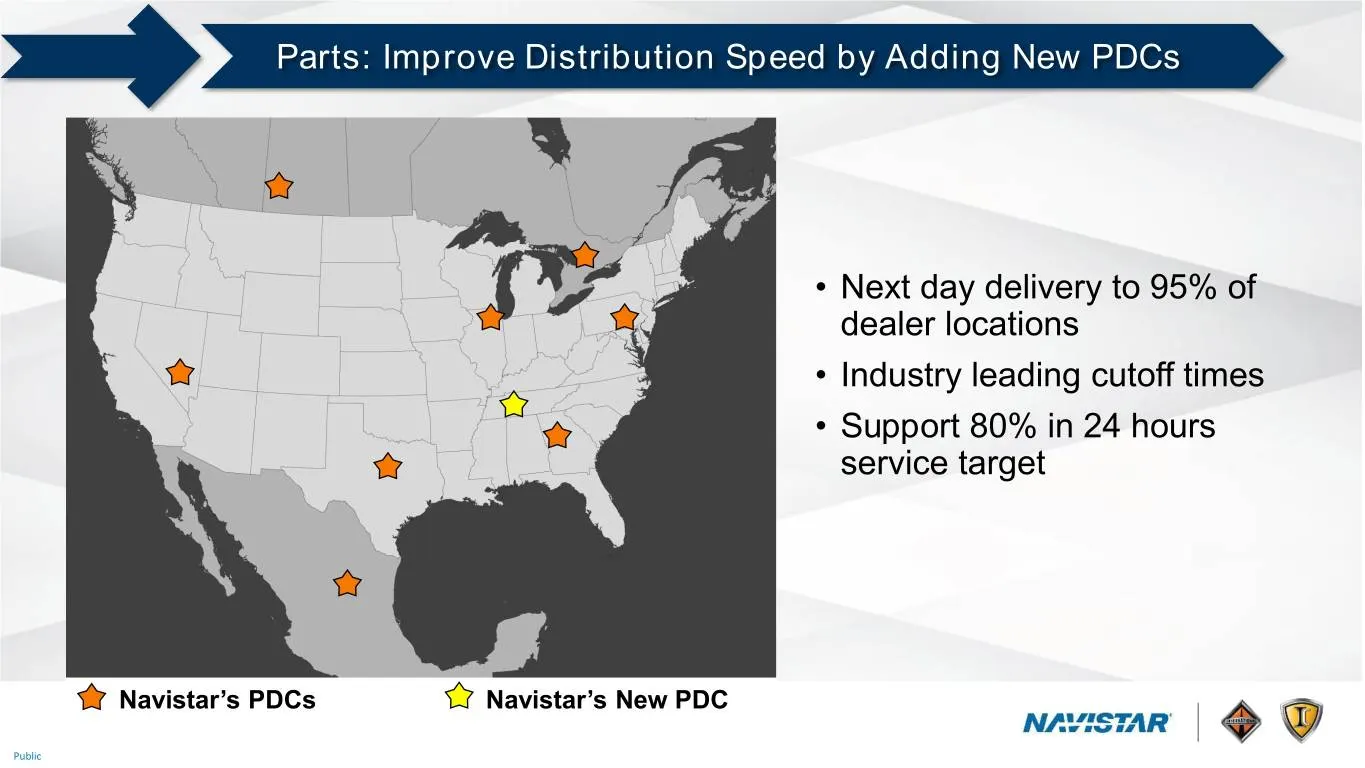
Slide 67: Parts: Improve Distribution Speed by Adding New PDCs
Parts: Improve Distribution Speed by Adding New PDCs • Next day delivery to 95% of dealer locations • Industry leading cutoff times • Support 80% in 24 hours service target Navistar’s PDCs Navistar’s New PDC Public
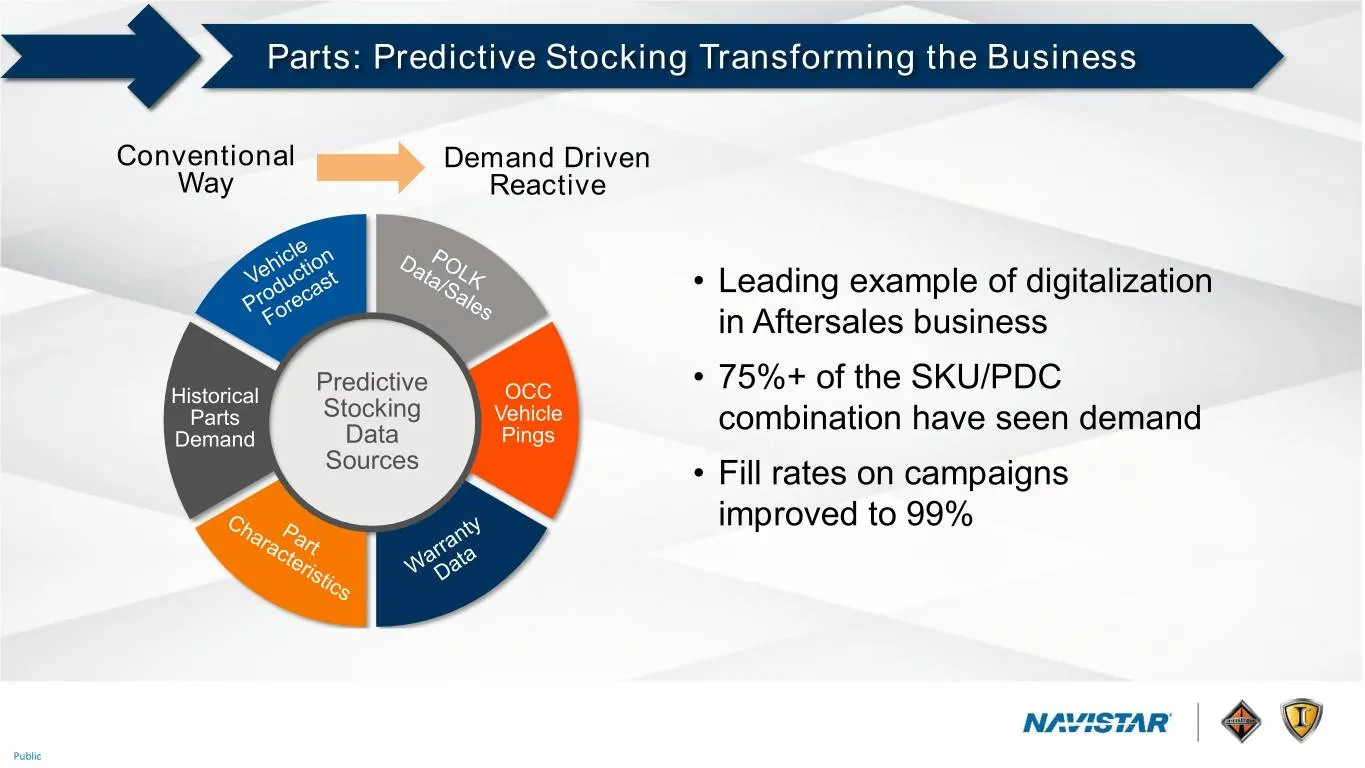
Slide 68: Parts: Predictive Stocking Transforming the Business
Parts: Predictive Stocking Transforming the Business Conventional Demand Driven Way Reactive • Leading example of digitalization in Aftersales business Predictive • 75%+ of the SKU/PDC Historical OCC Parts Stocking Vehicle combination have seen demand Demand Data Pings Sources • Fill rates on campai
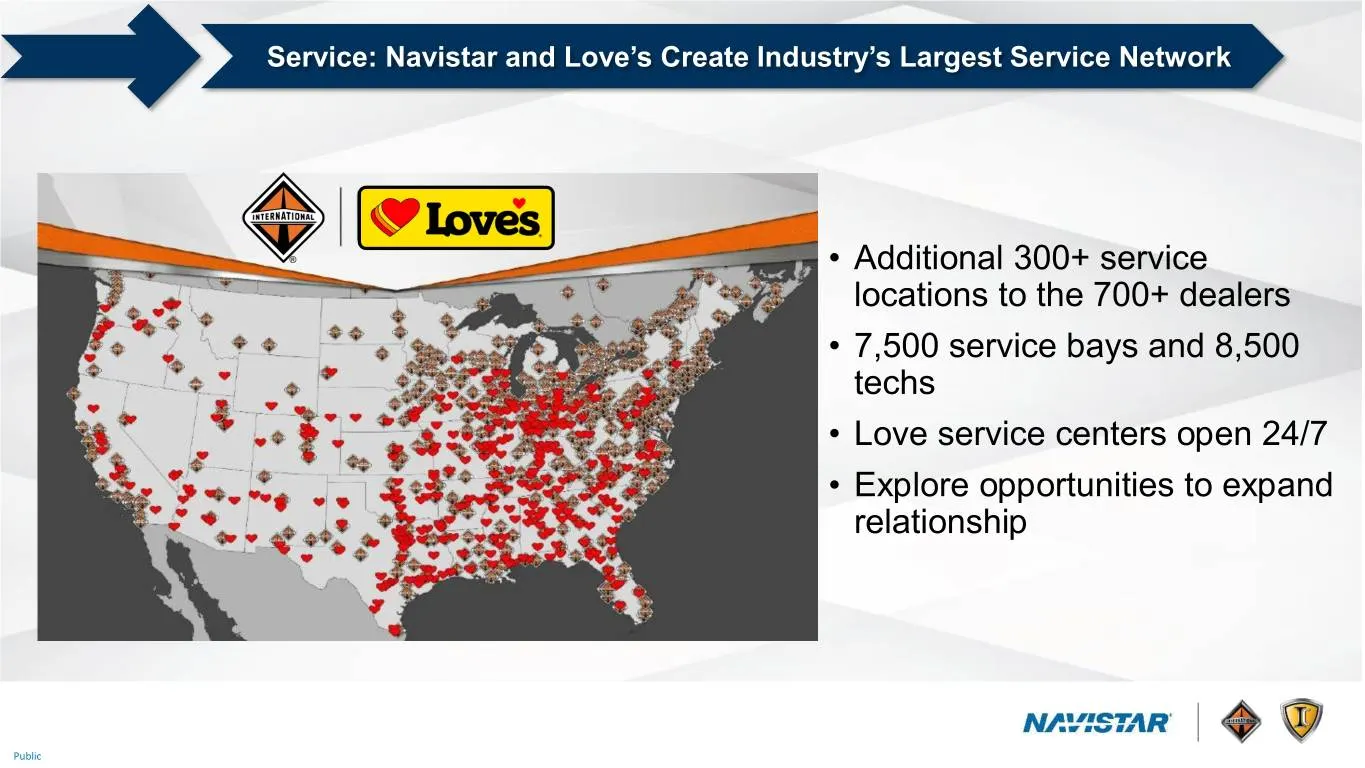
Slide 69: Service: Navistar and Love's Create Industry's Largest Service Network
Service: Navistar and Love’s Create Industry’s Largest Service Network • Additional 300+ service locations to the 700+ dealers • 7,500 service bays and 8,500 techs • Love service centers open 24/7 • Explore opportunities to expand relationship Public
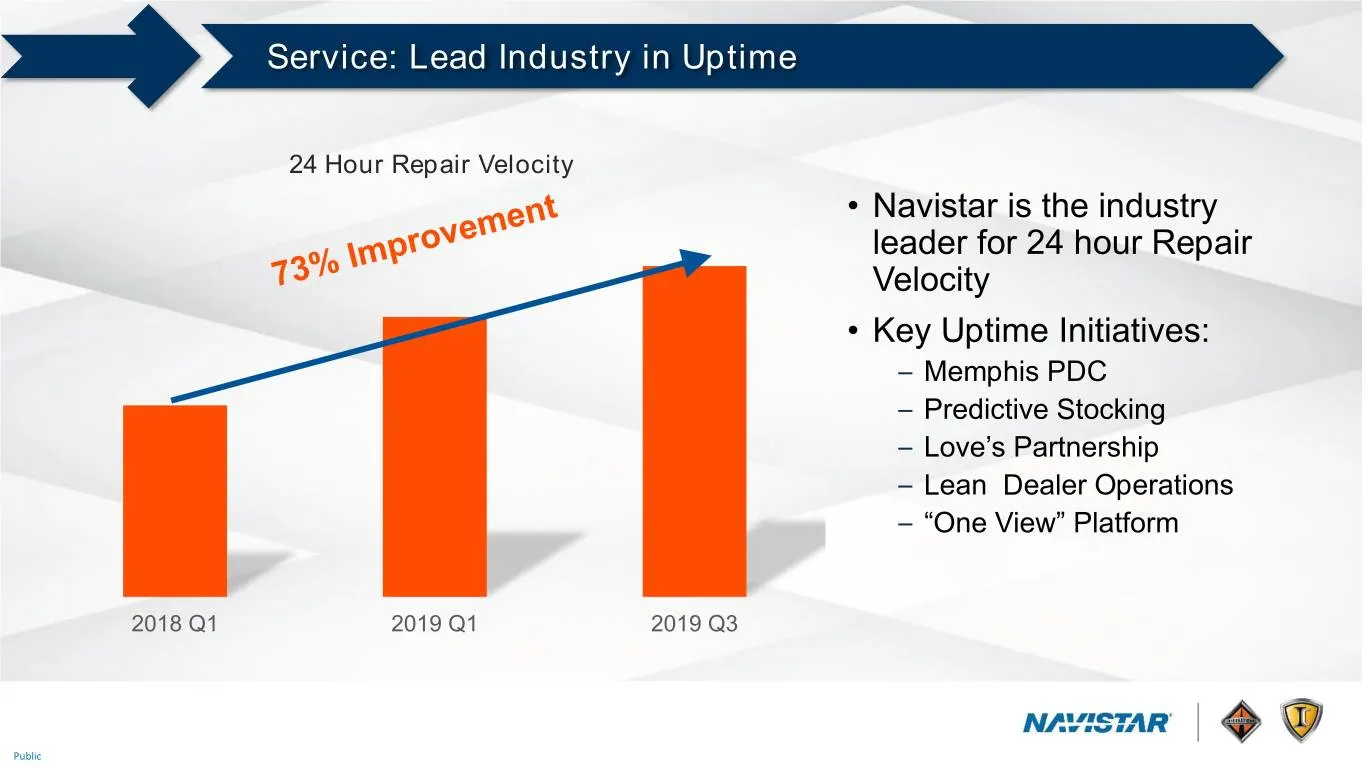
Slide 70: Service: Lead Industry in Uptime Hour Repair Velocity
Service: Lead Industry in Uptime 24 Hour Repair Velocity • Navistar is the industry leader for 24 hour Repair Velocity • Key Uptime Initiatives: – Memphis PDC – Predictive Stocking – Love’s Partnership – Lean Dealer Operations – “One View” Platform 2018 Q1 2019 Q1 2019 Q3 Public
Slide 71: Service: Creating New Level of Service Transparency
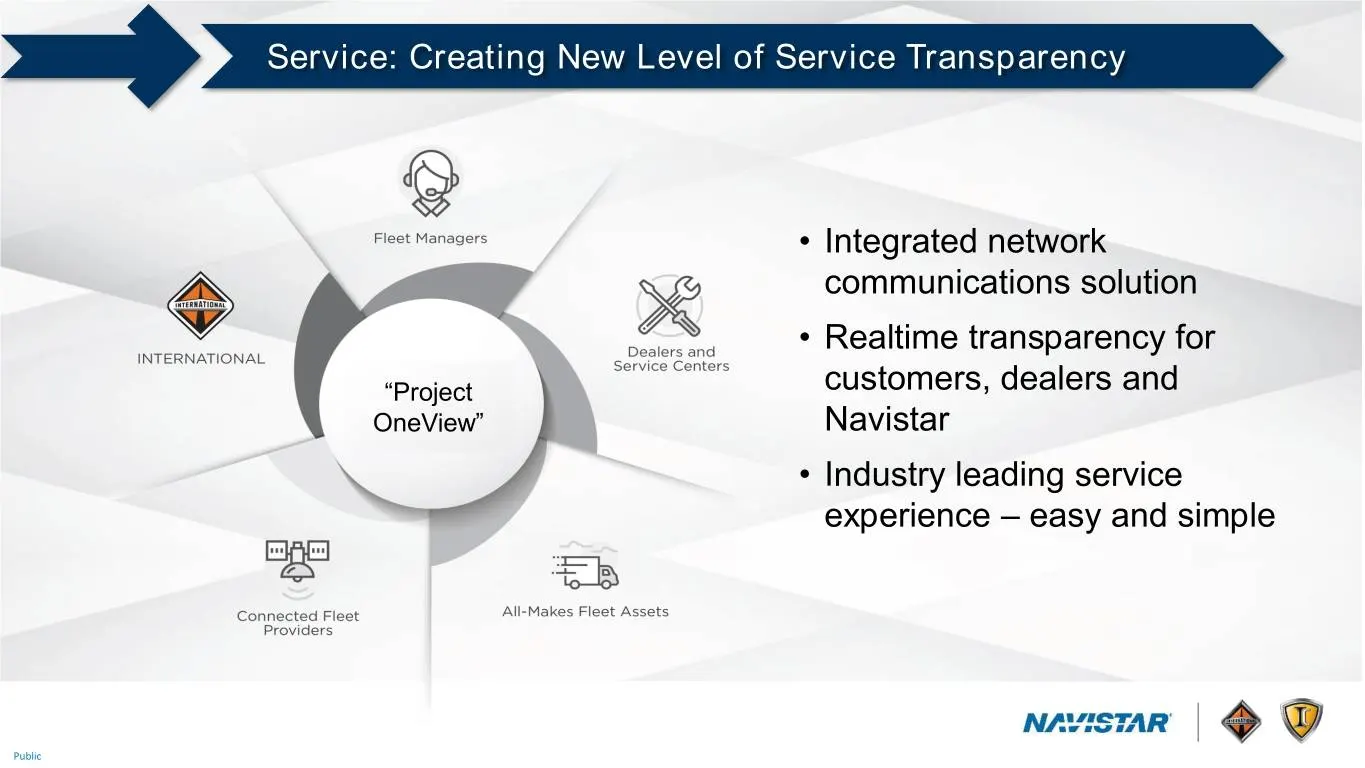
Service: Creating New Level of Service Transparency • Integrated network communications solution • Realtime transparency for “Project customers, dealers and OneView” Navistar • Industry leading service experience – easy and simple Public
Slide 72: Warranty: Best In Class Warranty Exposure
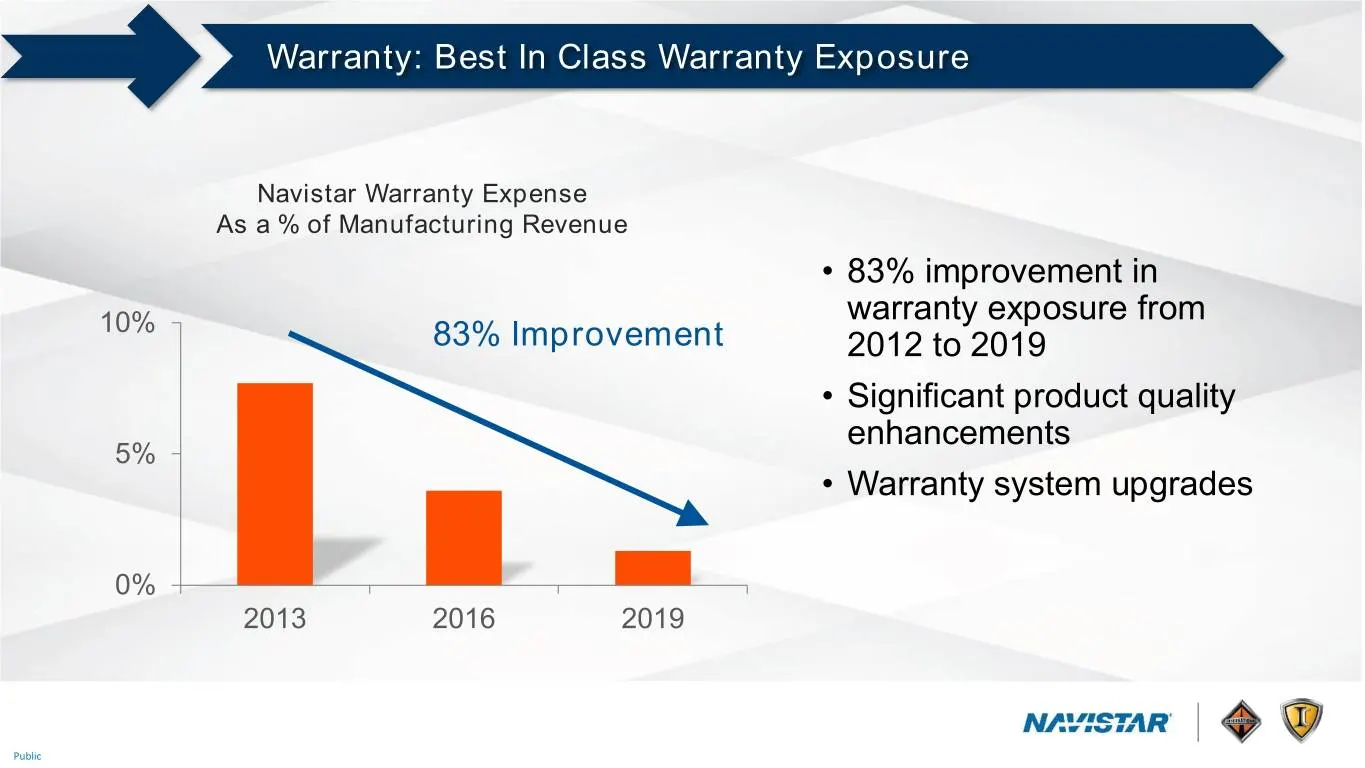
Warranty: Best In Class Warranty Exposure Navistar Warranty Expense As a % of Manufacturing Revenue • 83% improvement in 10% warranty exposure from 83% Improvement 2012 to 2019 • Significant product quality enhancements 5% • Warranty system upgrades 0% 2013 2016 2019 Public
Slide 73: TCO: Moving From Uptime to TCO Leader
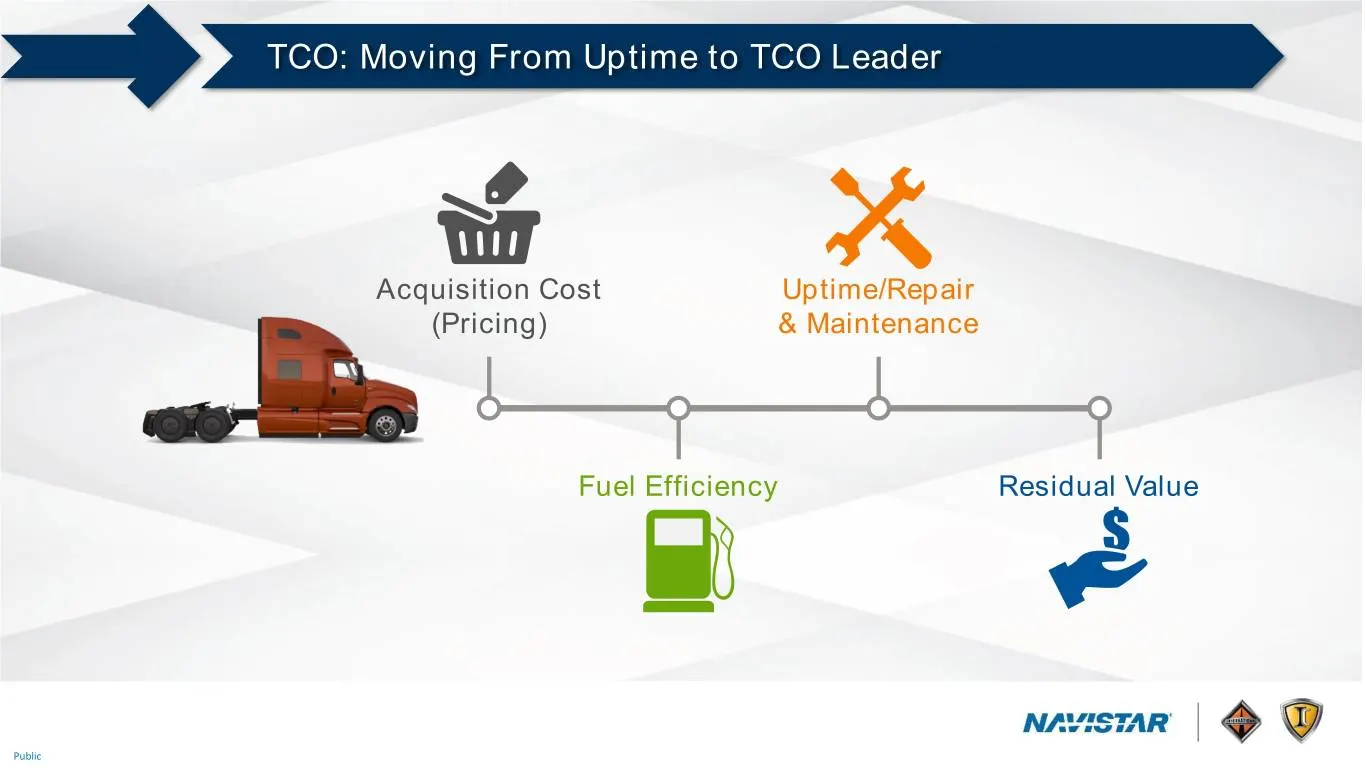
TCO: Moving From Uptime to TCO Leader Acquisition Cost Uptime/Repair (Pricing) & Maintenance Fuel Efficiency Residual Value Public
Slide 74: Aftersales Acceleration
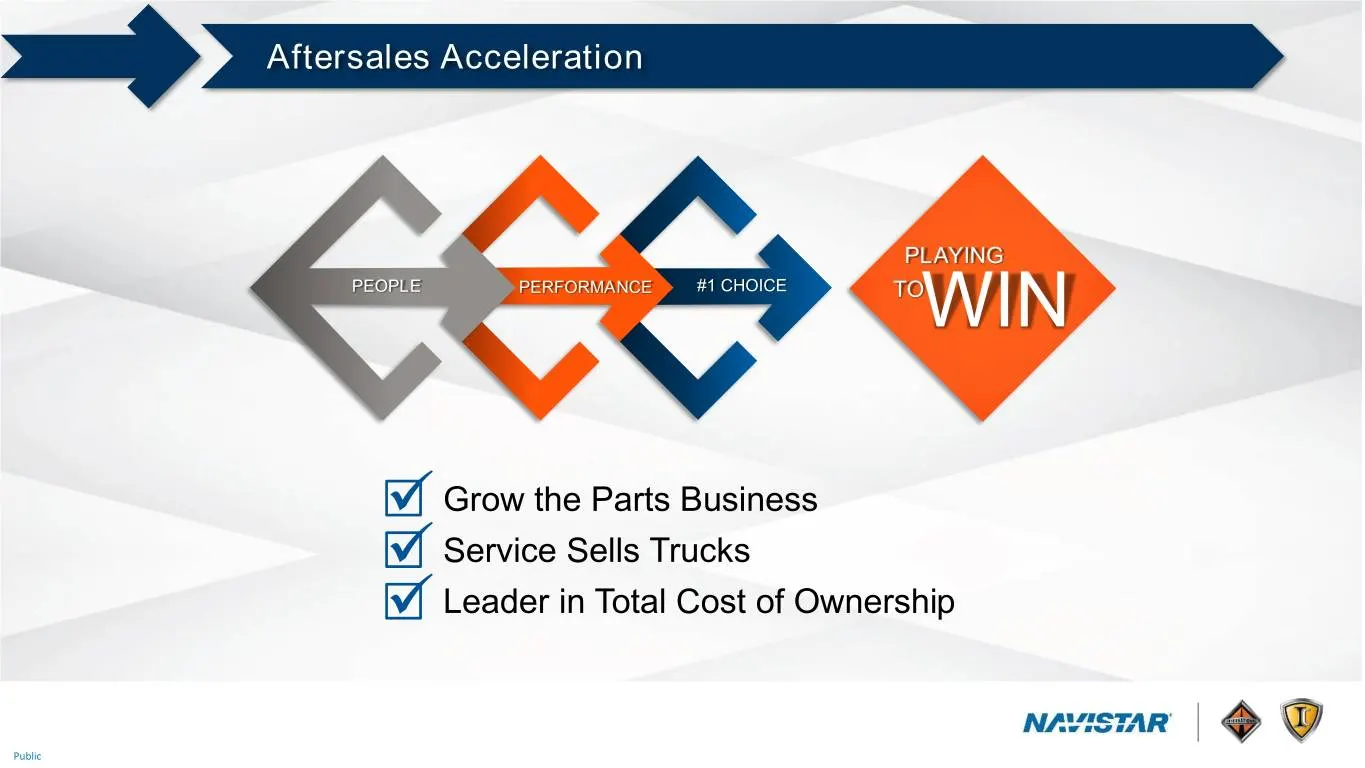
Aftersales Acceleration PLAYING PEOPLE PERFORMANCE #1 CHOICE TOWIN Grow the Parts Business Service Sells Trucks Leader in Total Cost of Ownership Public
Slide 75: Walter Borst, EVP and CFO
PLAYING PEOPLE PERFORMANCE #1 CHOICE TO WIN WALTER BORST Executive Vice President and CFO Navistar International Corporation Public
Slide 76: Agenda: Past, Future, Near-Term, Balance Sheet
Agenda Past Future Near-Term Balance Sheet Public
Slide 77: Past: Accomplishments on Our Journey
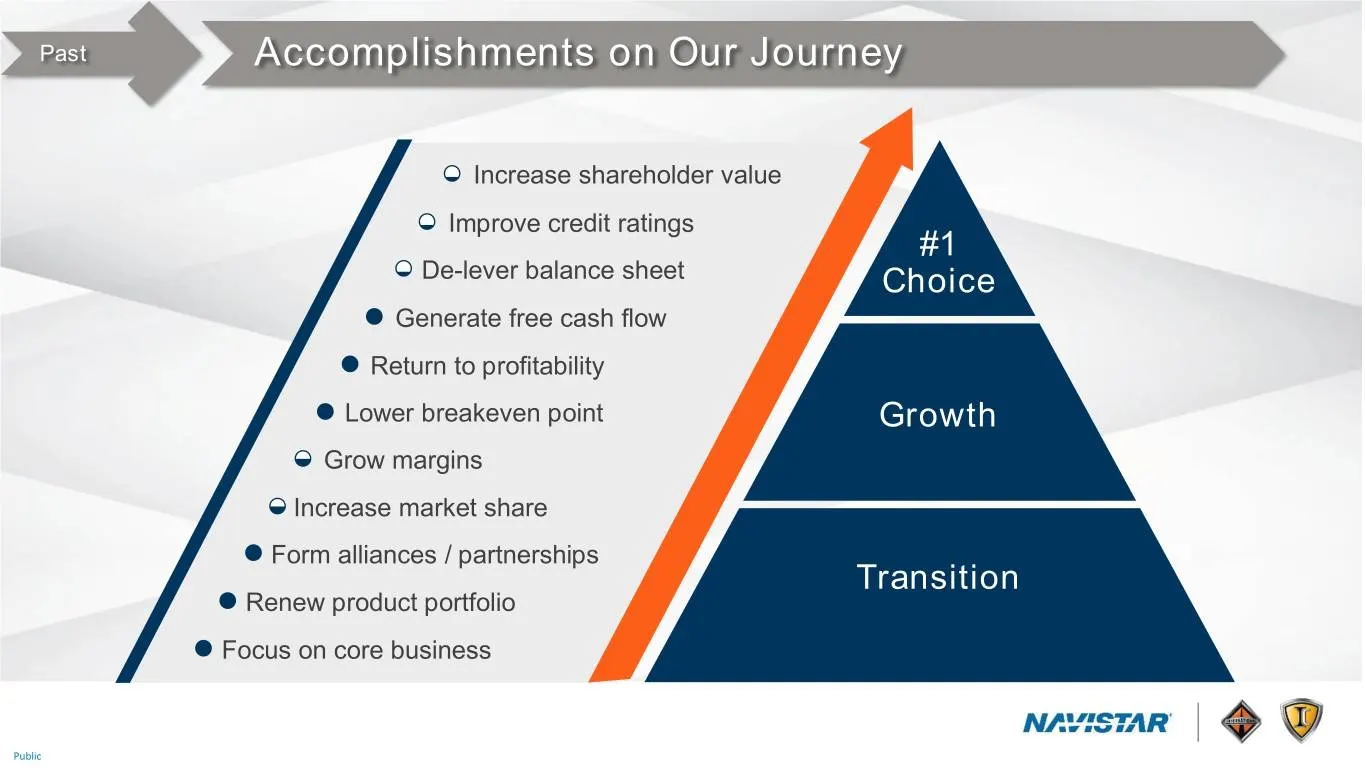
Past Accomplishments on Our Journey Increase shareholder value Improve credit ratings #1 De-lever balance sheet Choice Generate free cash flow Return to profitability Lower breakeven point Growth Grow margins Increase market share Form alliances / partnerships Transition Renew product portfolio Focu
Slide 78: Past: Financial Breakthrough
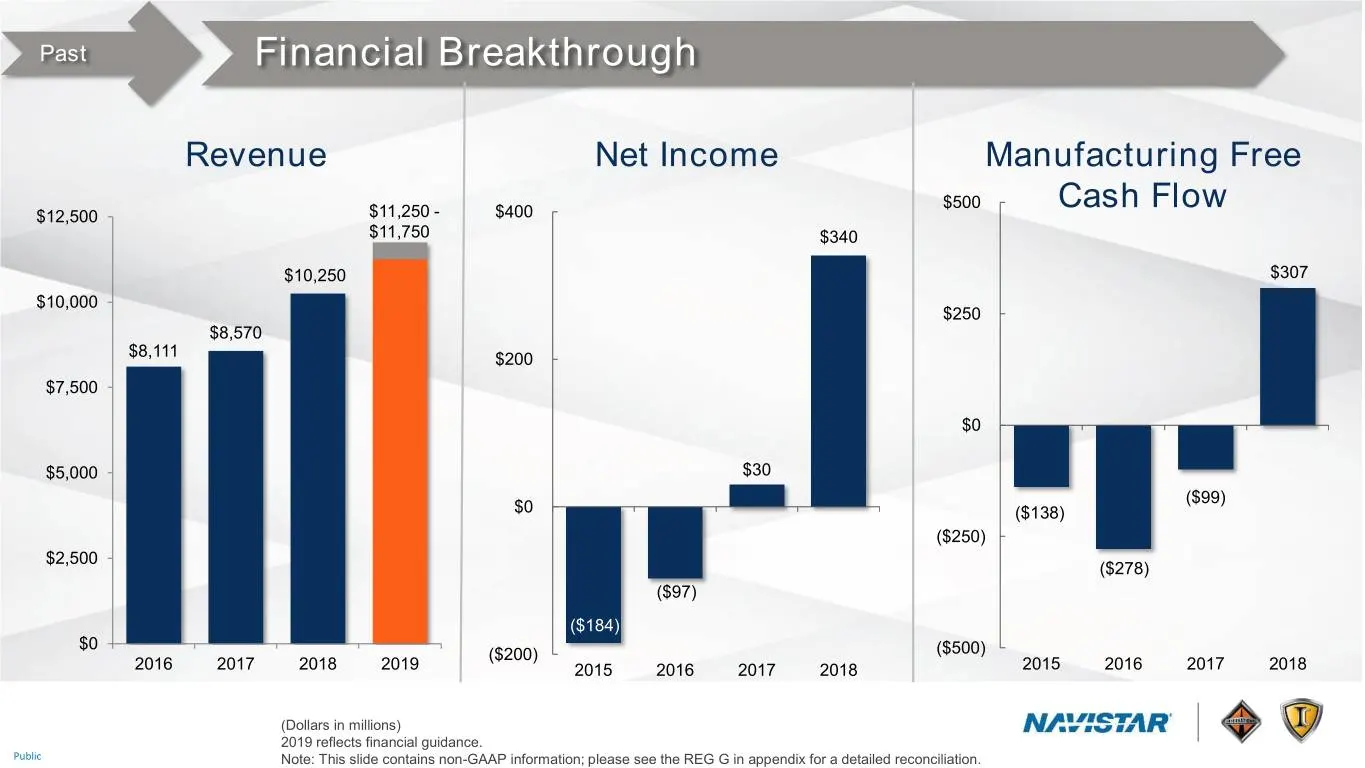
Past Financial Breakthrough Revenue Net Income Manufacturing Free $500 Cash Flow $12,500 $11,250 - $400 $11,750 $340 $10,250 $307 $10,000 $250 $8,570 $8,111 $200 $7,500 $0 $5,000 $30 ($99) $0 ($138) ($250) $2,500 ($278) ($97) ($184) $0 ($200) ($500) 2016 2017 2018 2019 2015 2016 2017 2018 2015 2016
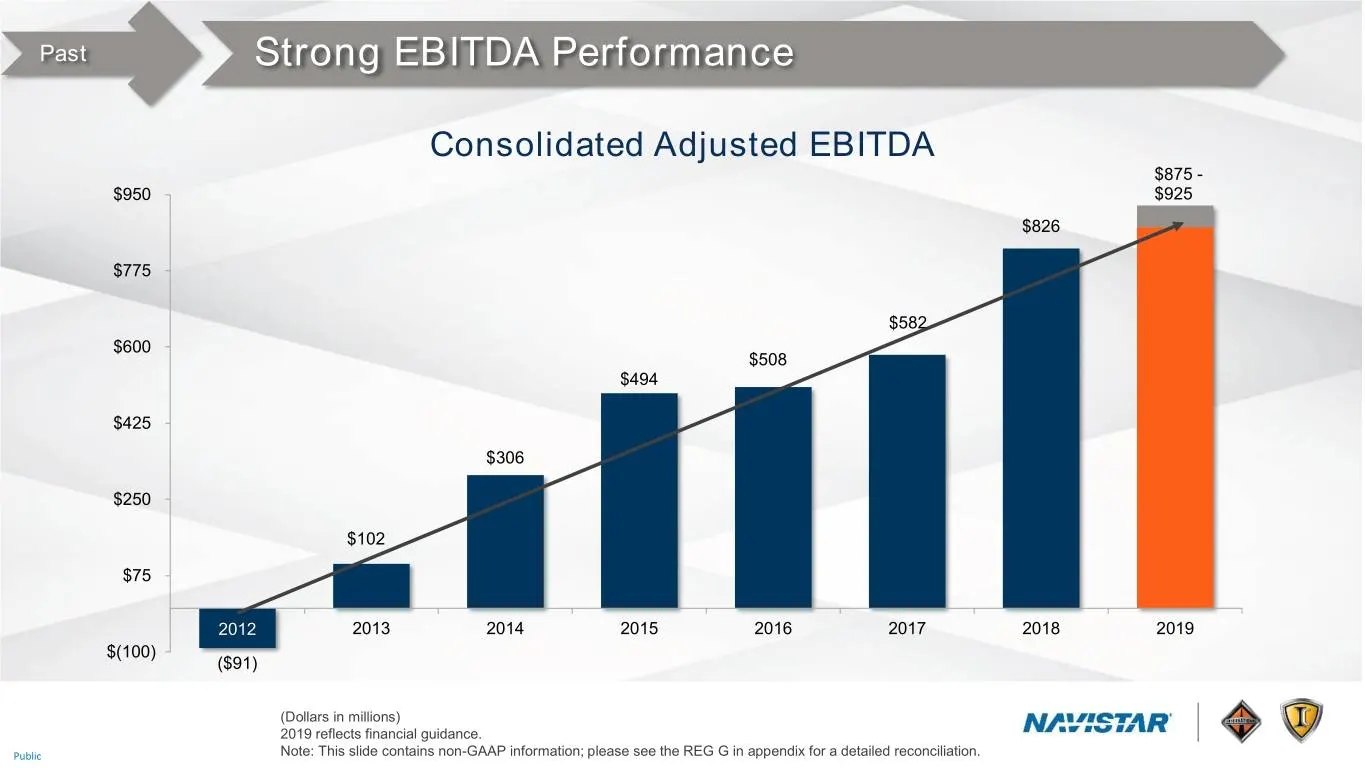
Slide 79: Past: Strong EBITDA Performance
Past Strong EBITDA Performance Consolidated Adjusted EBITDA $875 - $950 $925 $826 $775 $582 $600 $508 $494 $425 $306 $250 $102 $75 2012 2013 2014 2015 2016 2017 2018 2019 $(100) ($91) (Dollars in millions) 2019 reflects financial guidance. Public Note: This slide contains non-GAAP information; pleas
Slide 80: Agenda: Past, Future, Near-Term, Balance Sheet
Agenda Past Future Near-Term Balance Sheet Public
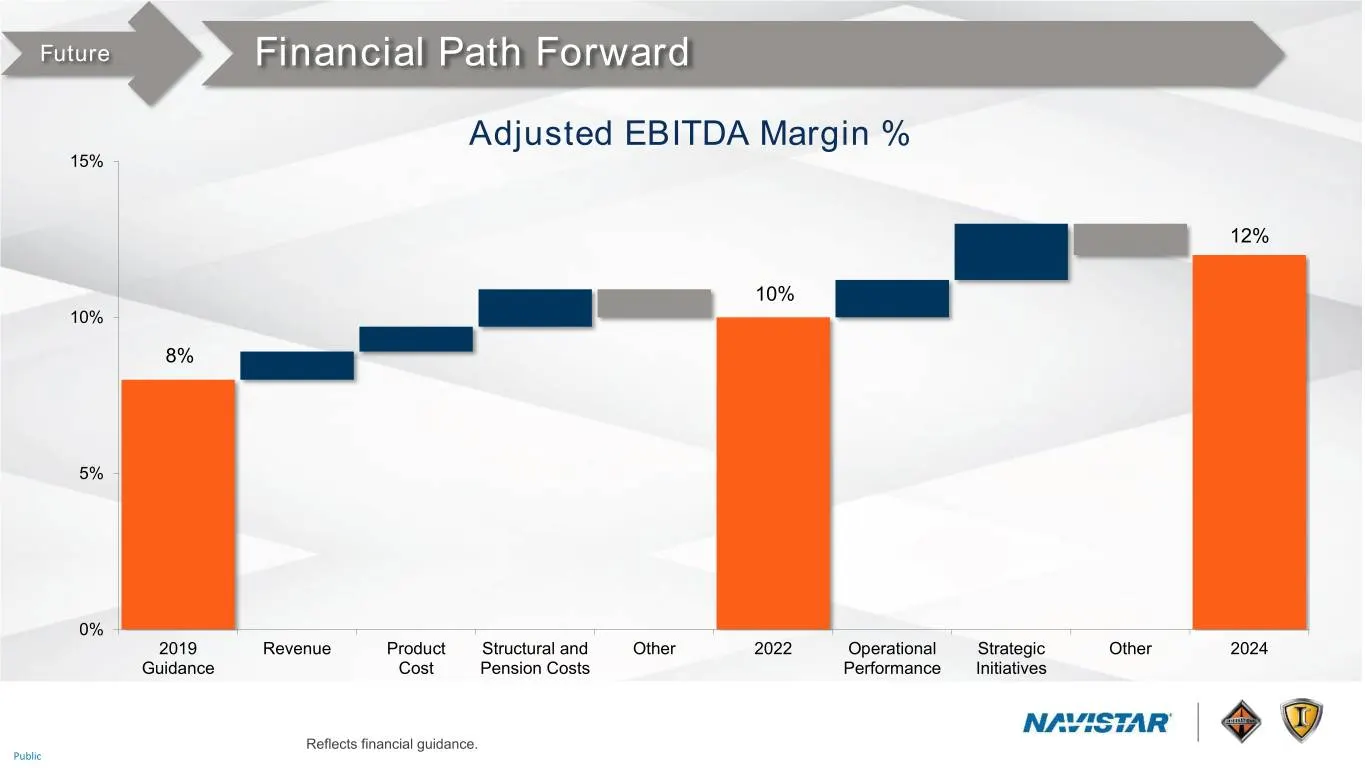
Slide 81: Future: Financial Path Forward
Future Financial Path Forward Adjusted EBITDA Margin % 15% 12% 10% 10% 8% 5% 0% 2019 Revenue Product Structural and Other 2022 Operational Strategic Other 2024 Guidance Cost Pension Costs Performance Initiatives Reflects financial guidance. Public
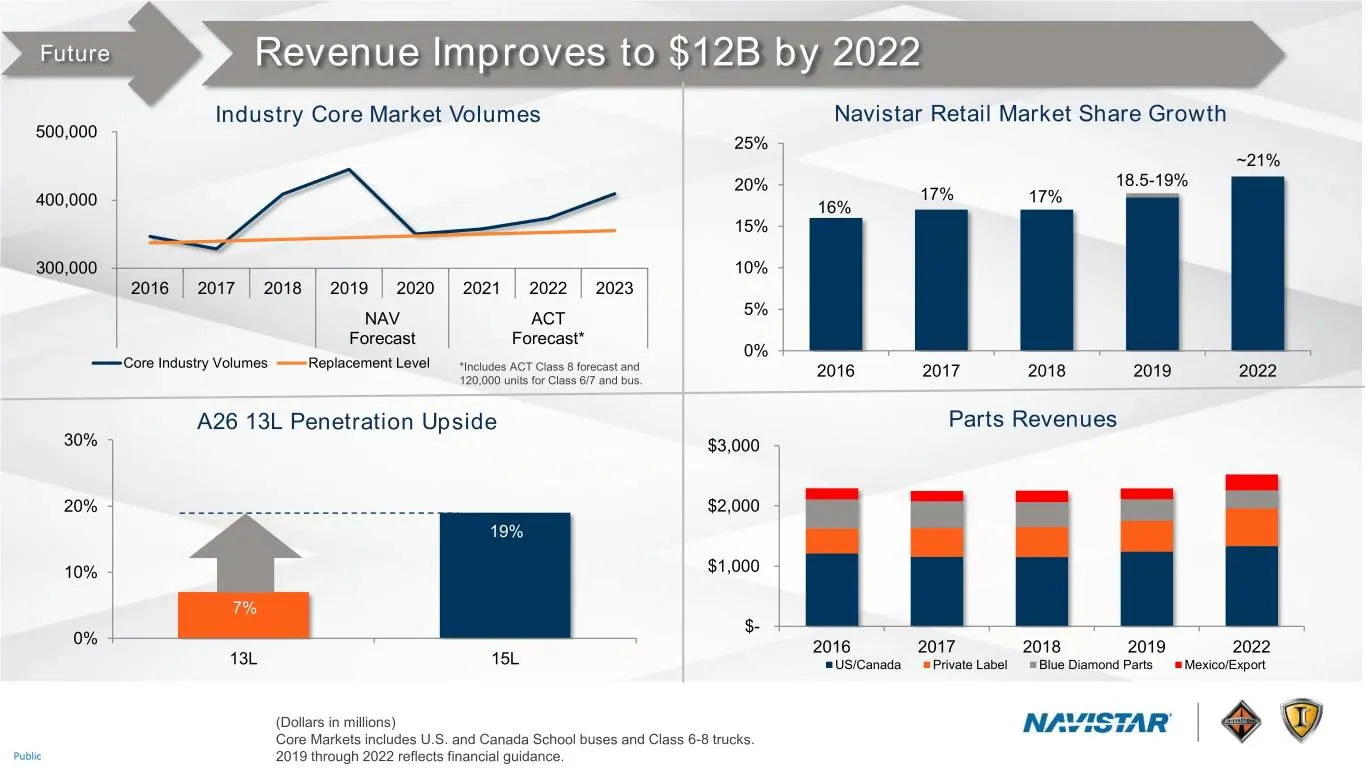
Slide 82: Future: Revenue Improves to $12B by 2022
Future Revenue Improves to $12B by 2022 Industry Core Market Volumes Navistar Retail Market Share Growth 500,000 25% ~21% 20% 18.5-19% 17% 17% 400,000 16% 15% 300,000 10% 2016 2017 2018 2019 2020 2021 2022 2023 5% NAV ACT Forecast Forecast* 0% Core Industry Volumes Replacement Level *Includes ACT Cl
Slide 83: Future: Strategic Initiatives Drive Lower Product Costs
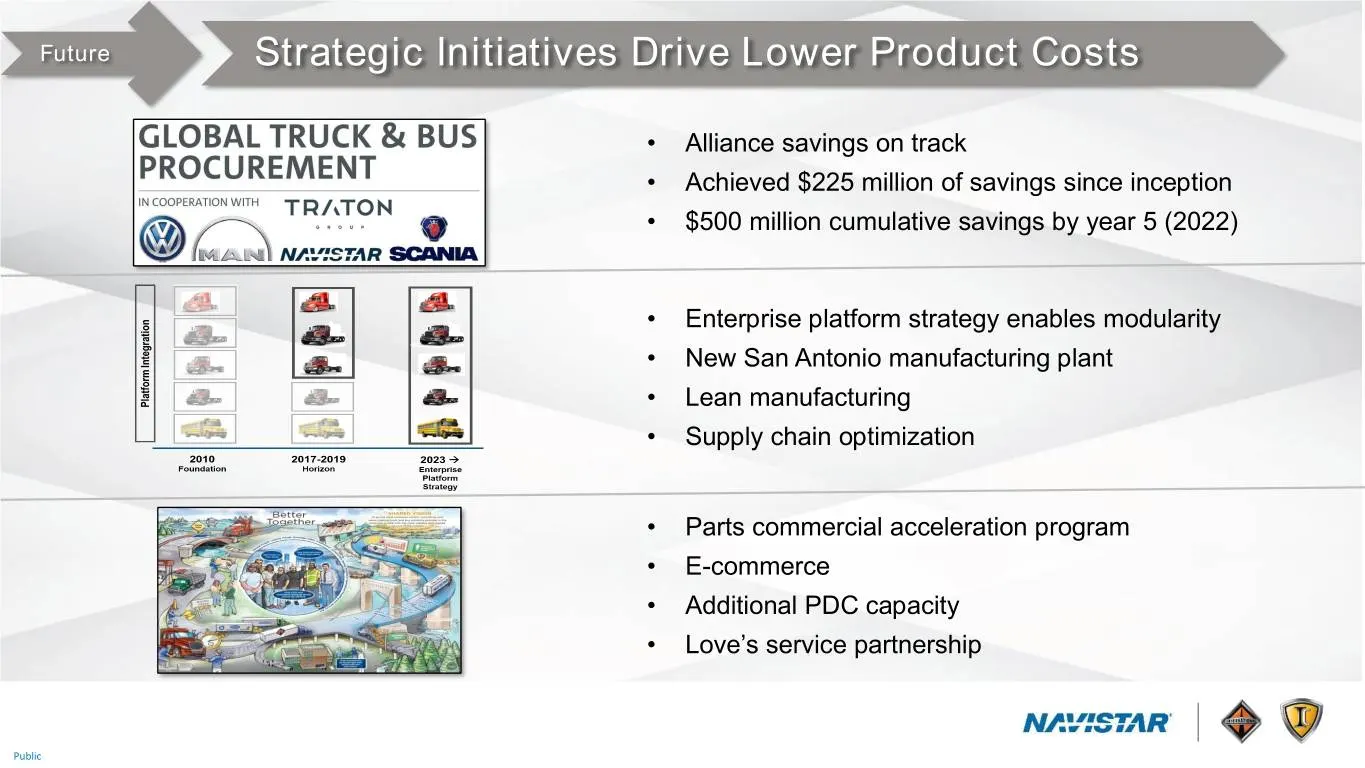
Future Strategic Initiatives Drive Lower Product Costs • Alliance savings on track • Achieved $225 million of savings since inception • $500 million cumulative savings by year 5 (2022) • Enterprise platform strategy enables modularity • New San Antonio manufacturing plant • Lean manufacturing • Supp
Slide 84: Future: Intense Focus on Costs to Fund Growth Initiatives
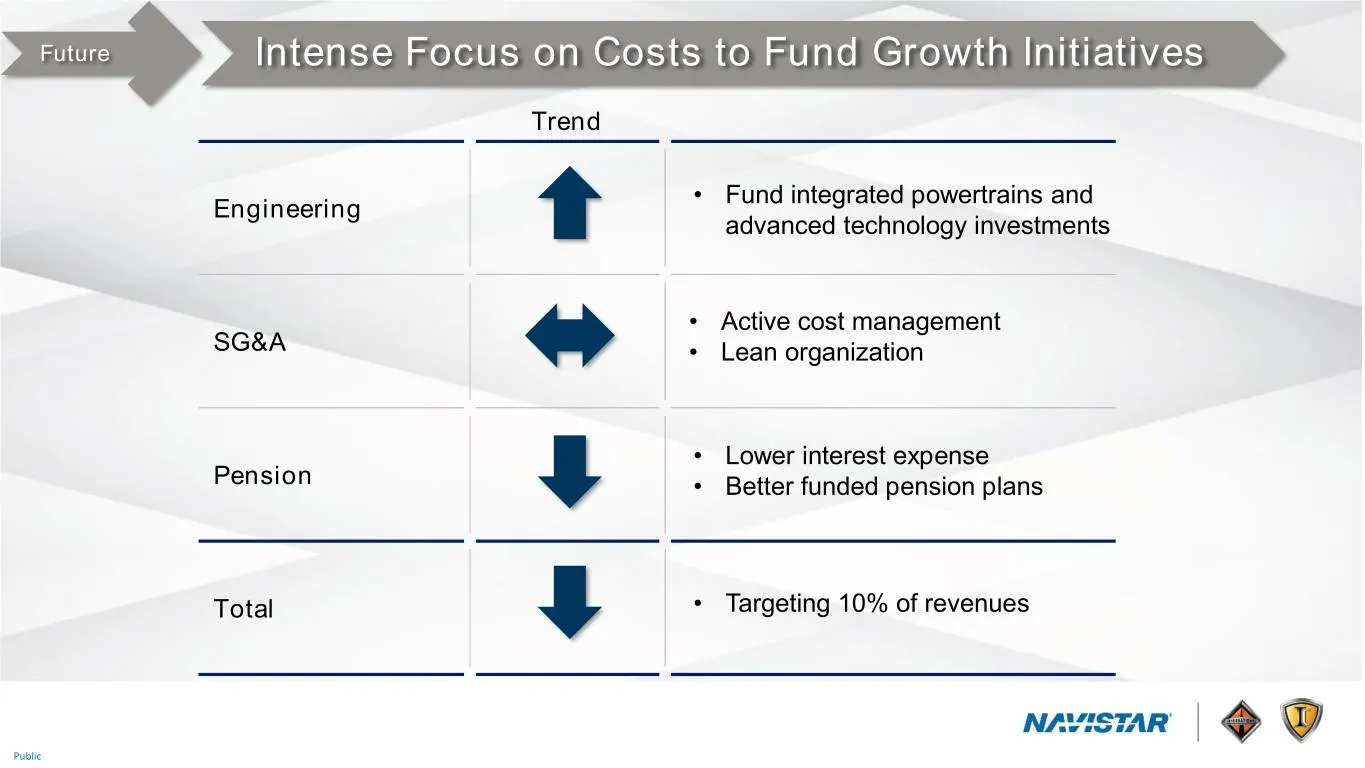
Future Intense Focus on Costs to Fund Growth Initiatives Trend • Fund integrated powertrains and Engineering advanced technology investments • Active cost management SG&A • Lean organization • Lower interest expense Pension • Better funded pension plans Total • Targeting 10% of revenues Public
Slide 85: Agenda: Past, Future, Near-Term, Balance Sheet
Agenda Past Future Near-Term Balance Sheet Public
Slide 86: Near-Term: Cycle Exposure Reduced through Class 6/7 and Bus Franchise
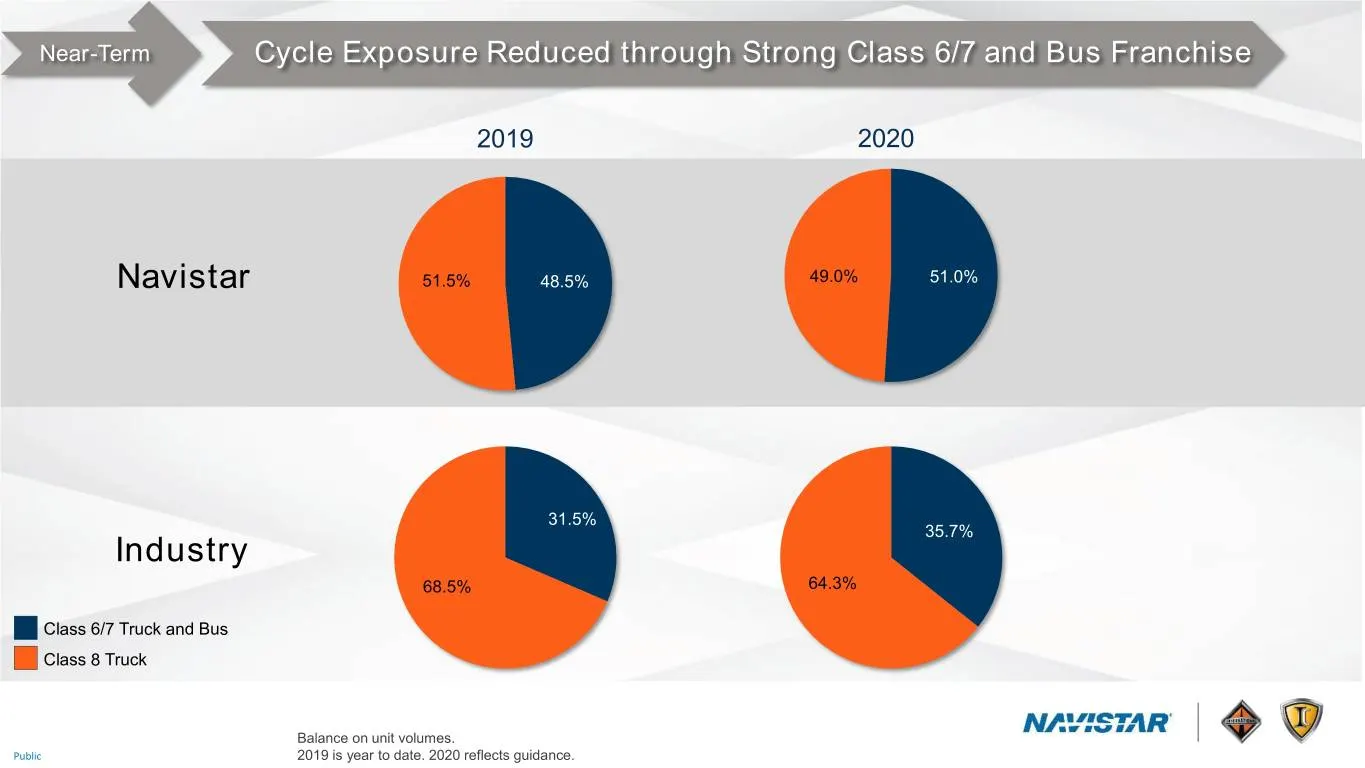
Near-Term Cycle Exposure Reduced through Strong Class 6/7 and Bus Franchise 2019 2020 Navistar 51.5% 48.5% 49.0% 51.0% 31.5% 35.7% Industry 68.5% 64.3% Class 6/7 Truck and Bus Class 8 Truck Balance on unit volumes. Public 2019 is year to date. 2020 reflects guidance.
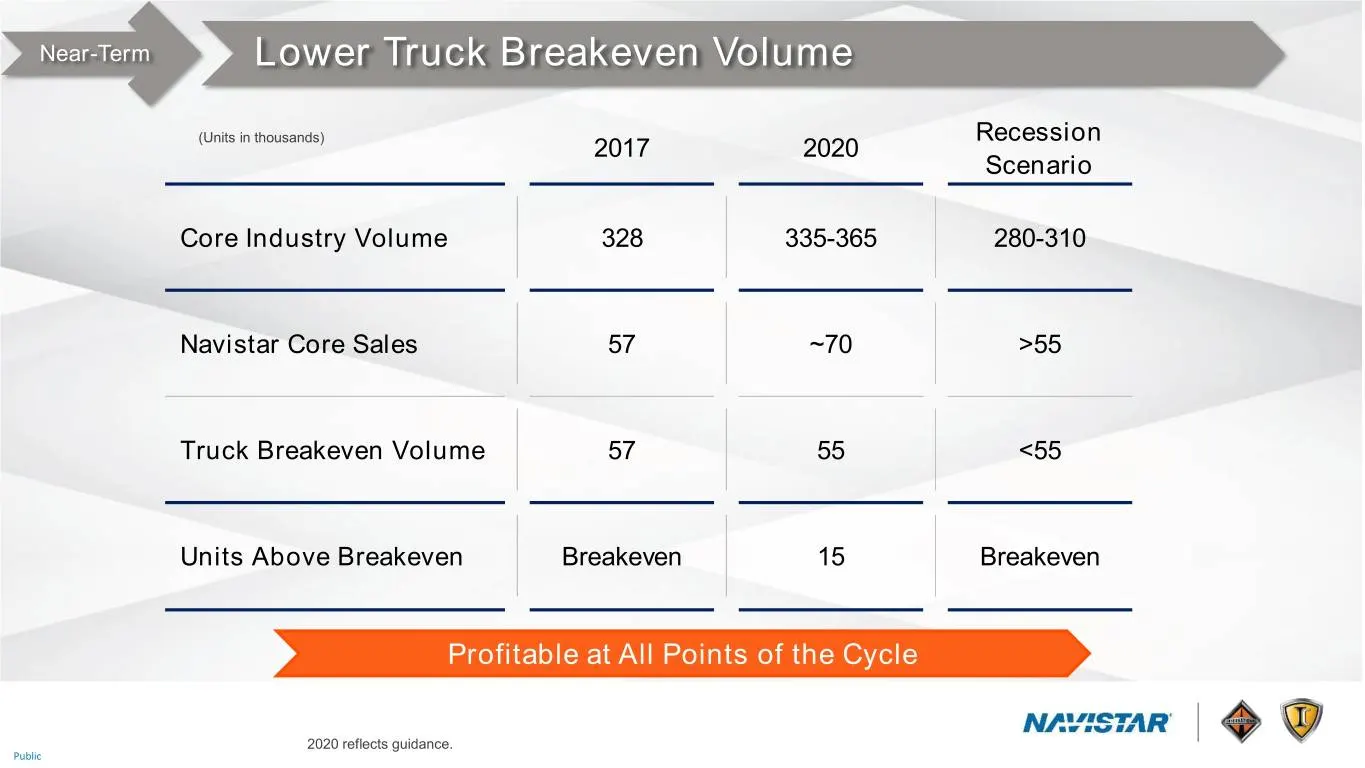
Slide 87: Near-Term: Lower Truck Breakeven Volume
Near-Term Lower Truck Breakeven Volume (Units in thousands) Recession 2017 2020 Scenario Core Industry Volume 328 335-365 280-310 Navistar Core Sales 57 ~70 >55 Truck Breakeven Volume 57 55 <55 Units Above Breakeven Breakeven 15 Breakeven Profitable at All Points of the Cycle 2020 reflects guidance.
Slide 88: Agenda: Past, Future, Near-Term, Balance Sheet
Agenda Past Future Near-Term Balance Sheet Public
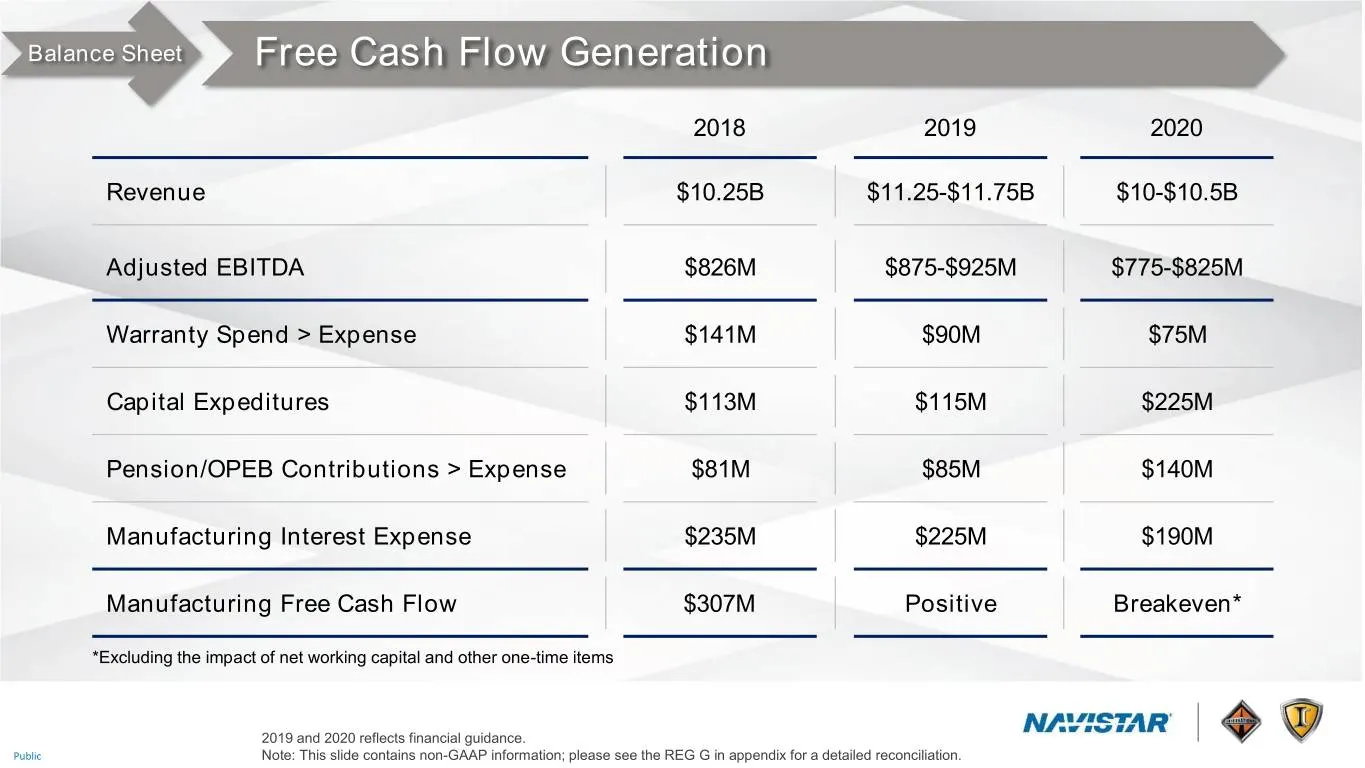
Slide 89: Balance Sheet: Free Cash Flow Generation
Balance Sheet Free Cash Flow Generation 2018 2019 2020 Revenue $10.25B $11.25-$11.75B $10-$10.5B Adjusted EBITDA $826M $875-$925M $775-$825M Warranty Spend > Expense $141M $90M $75M Capital Expeditures $113M $115M $225M Pension/OPEB Contributions > Expense $81M $85M $140M Manufacturing Interest Expe
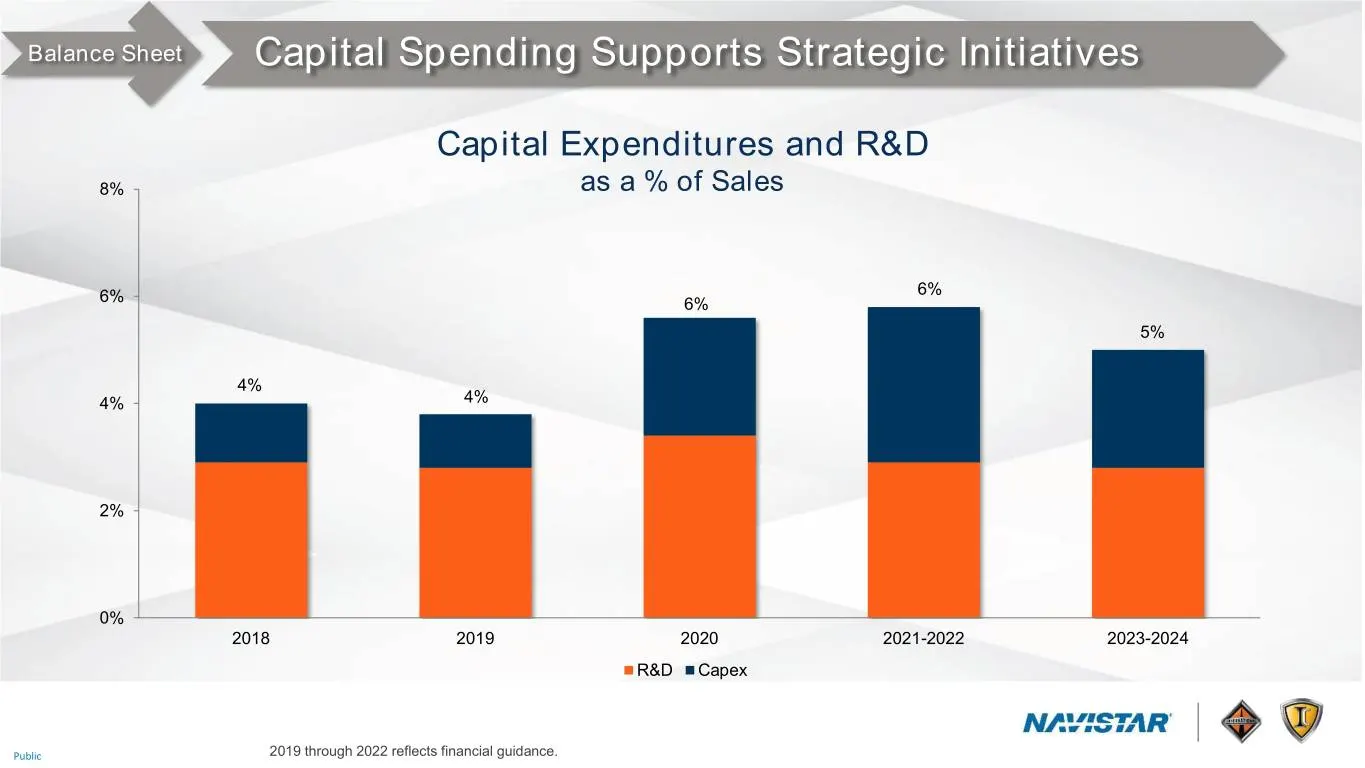
Slide 90: Balance Sheet: Capital Spending Supports Strategic Initiatives
Balance Sheet Capital Spending Supports Strategic Initiatives Capital Expenditures and R&D 8% as a % of Sales 6% 6% 6% 5% 4% 4% 4% 2% 0% 2018 2019 2020 2021-2022 2023-2024 R&D Capex Public 2019 through 2022 reflects financial guidance.
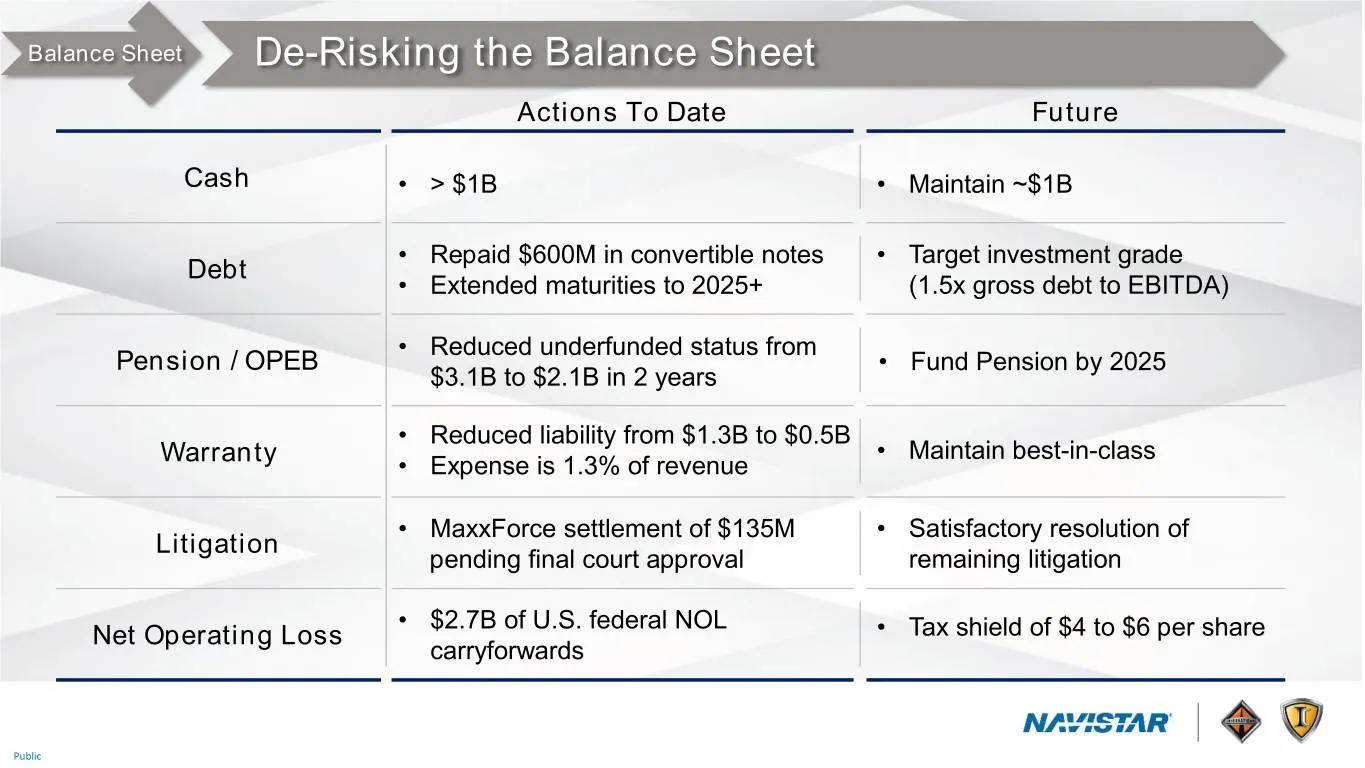
Slide 91: Balance Sheet: De-Risking the Balance Sheet
Balance Sheet De-Risking the Balance Sheet Actions To Date Future Cash • > $1B • Maintain ~$1B • Repaid $600M in convertible notes • Target investment grade Debt • Extended maturities to 2025+ (1.5x gross debt to EBITDA) • Reduced underfunded status from Pension / OPEB • Fund Pension by 2025 $3.1B t
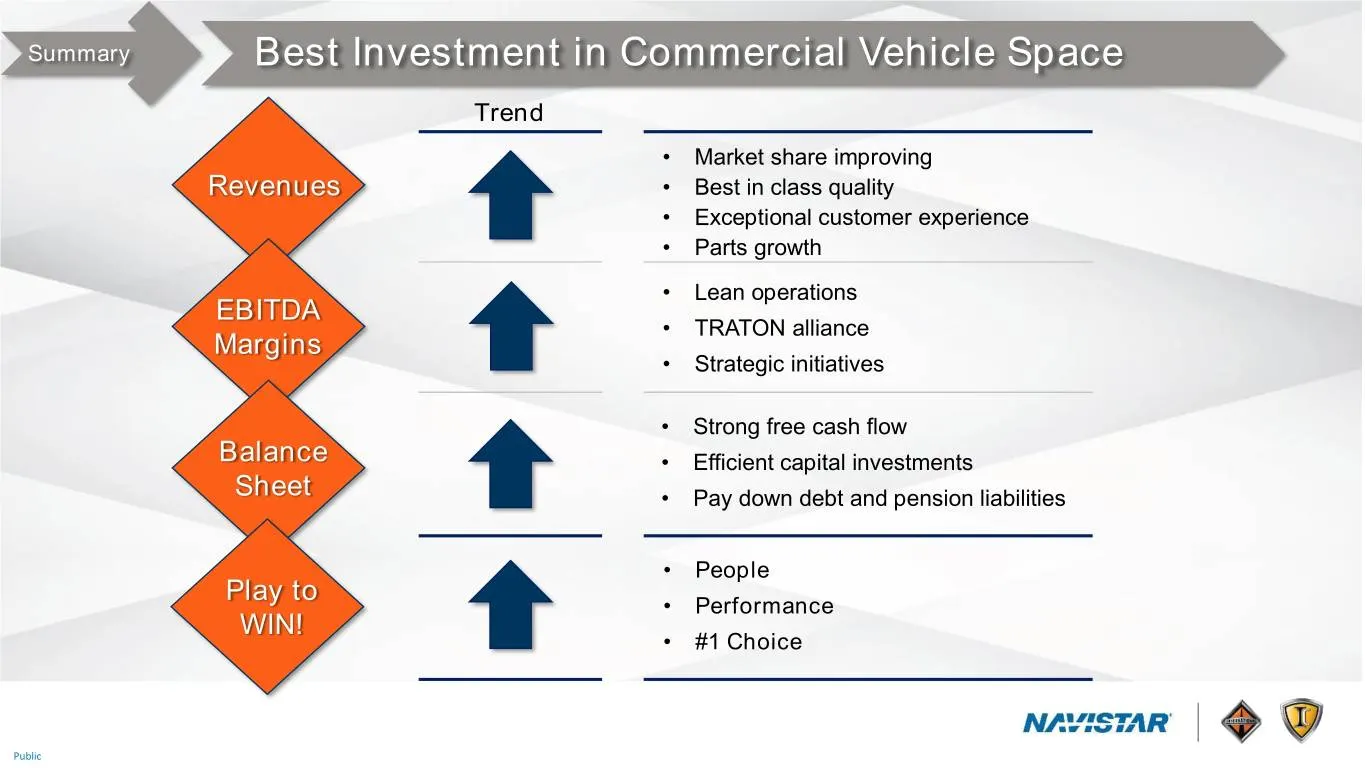
Slide 92: Summary: Best Investment in Commercial Vehicle Space
Summary Best Investment in Commercial Vehicle Space Trend • Market share improving Revenues • Best in class quality • Exceptional customer experience • Parts growth • Lean operations EBITDA • TRATON alliance Margins • Strategic initiatives • Strong free cash flow Balance • Efficient capital investme
Slide 93: Question and Answer
PLAYING PEOPLE PERFORMANCE #1 CHOICE TO WIN QUESTION AND ANSWER Public

Slide 94: Navistar U
NAVISTAR U

Slide 95: Appendix
dix en App Wey NAY ~~ STA. r\9Q
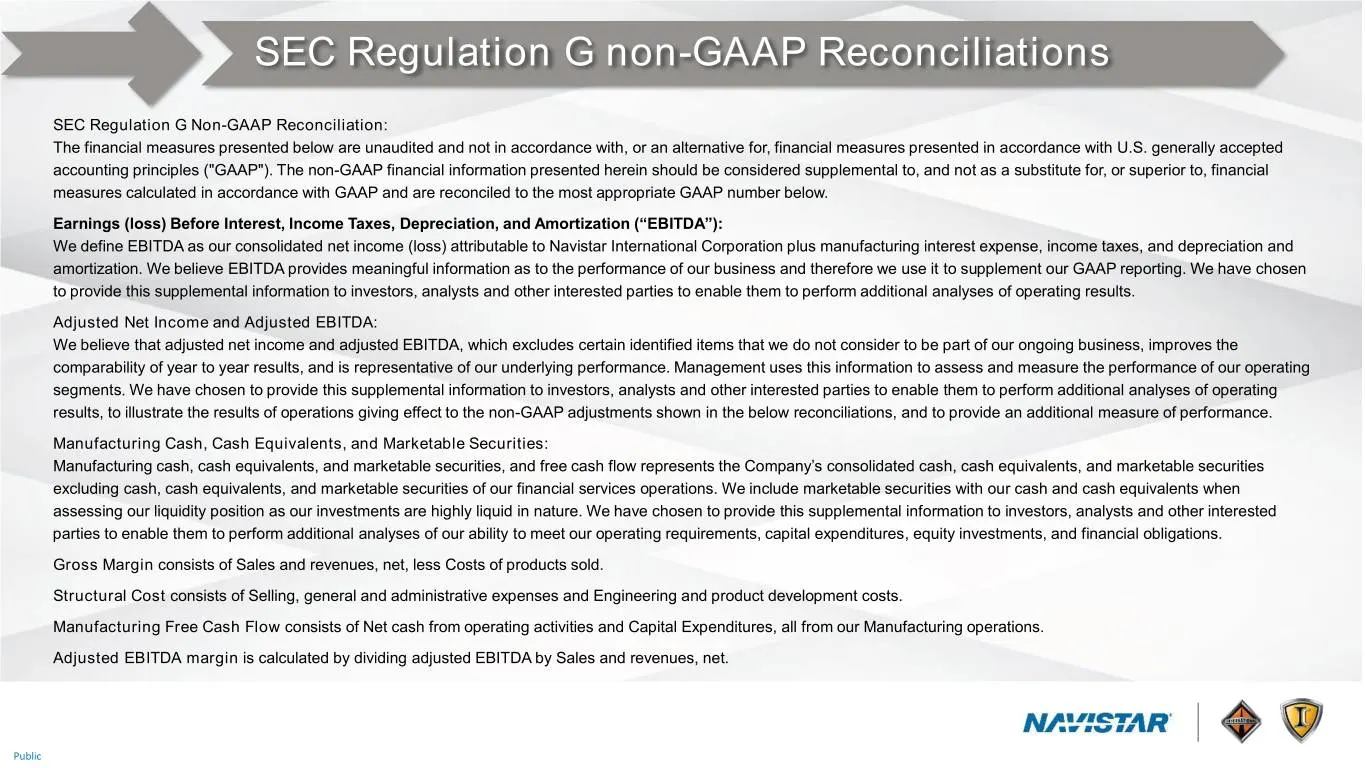
Slide 96: SEC Regulation G non-GAAP Reconciliations
SEC Regulation G non-GAAP Reconciliations SEC Regulation G Non-GAAP Reconciliation: The financial measures presented below are unaudited and not in accordance with, or an alternative for, financial measures presented in accordance with U.S. generally accepted accounting principles ("GAAP"). The non-
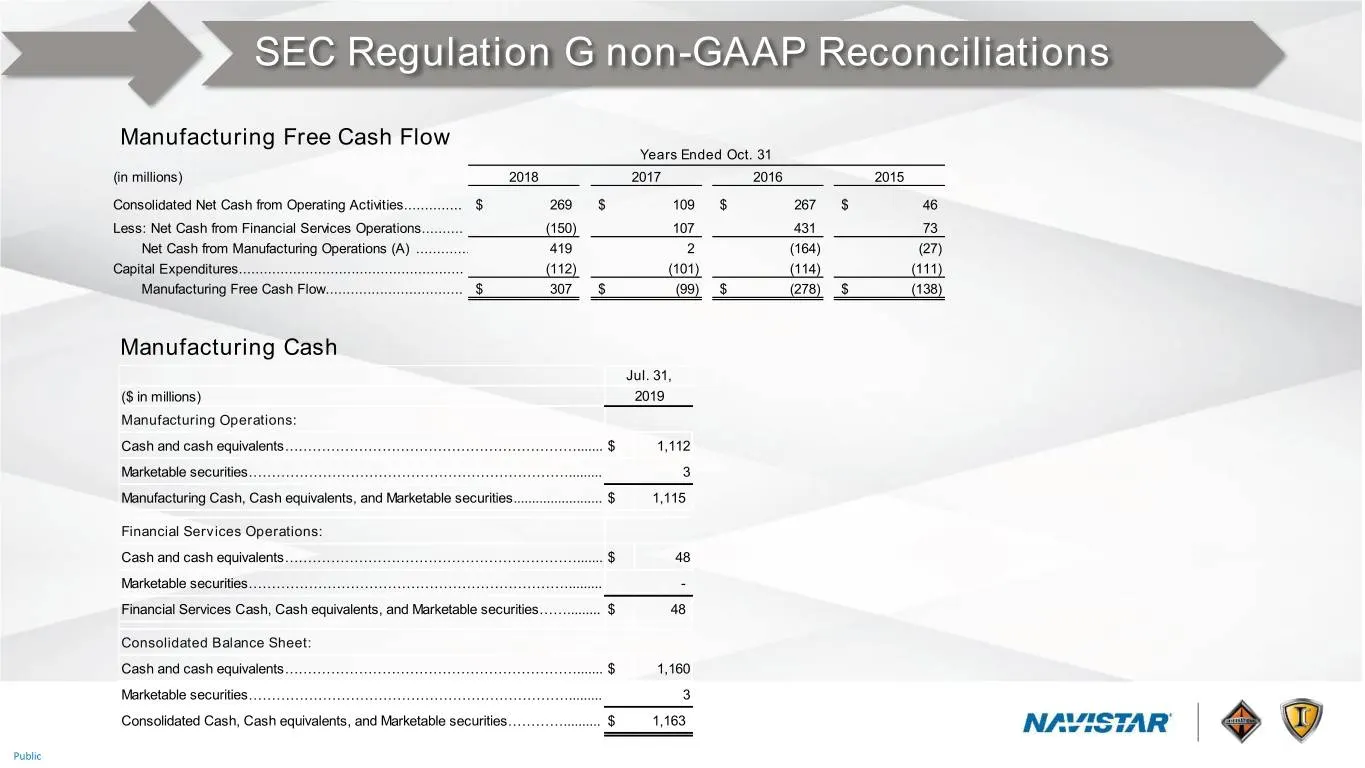
Slide 97: SEC Regulation G non-GAAP Reconciliations: Manufacturing Free Cash Flow
SEC Regulation G non-GAAP Reconciliations Manufacturing Free Cash Flow Years Ended Oct. 31 (in millions) 2018 2017 2016 2015 Consolidated Net Cash from Operating Activities.............. $ 269 $ 109 $ 267 $ 46 Less: Net Cash from Financial Services Operations.......... (150) 107 431 73 Net Cash from
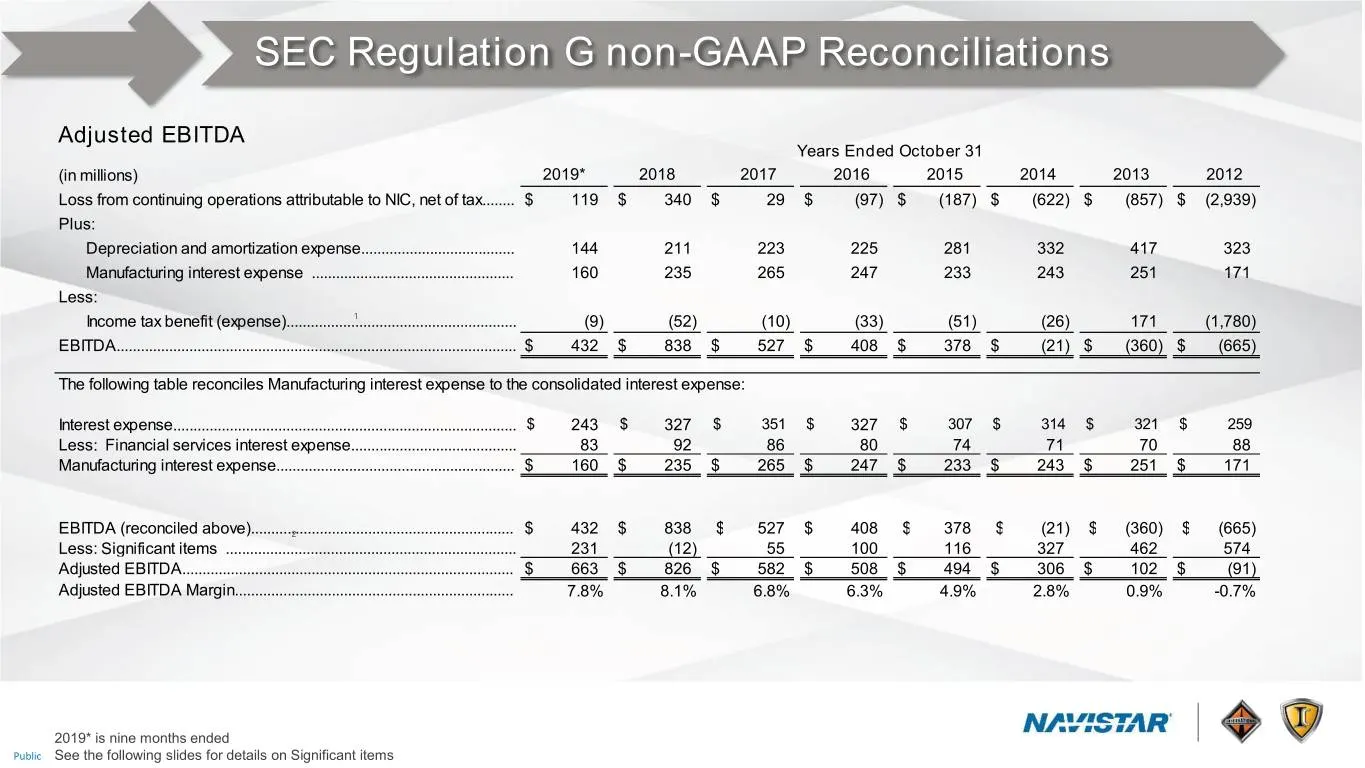
Slide 98: SEC Regulation G non-GAAP Reconciliations: Adjusted EBITDA
SEC Regulation G non-GAAP Reconciliations Adjusted EBITDA Years Ended October 31 (in millions) 2019* 2018 2017 2016 2015 2014 2013 2012 Loss from continuing operations attributable to NIC, net of tax........ $ 119 $ 340 $ 29 $ (97) $ (187) $ (622) $ (857) $ (2,939) Plus: Depreciation and amortizatio
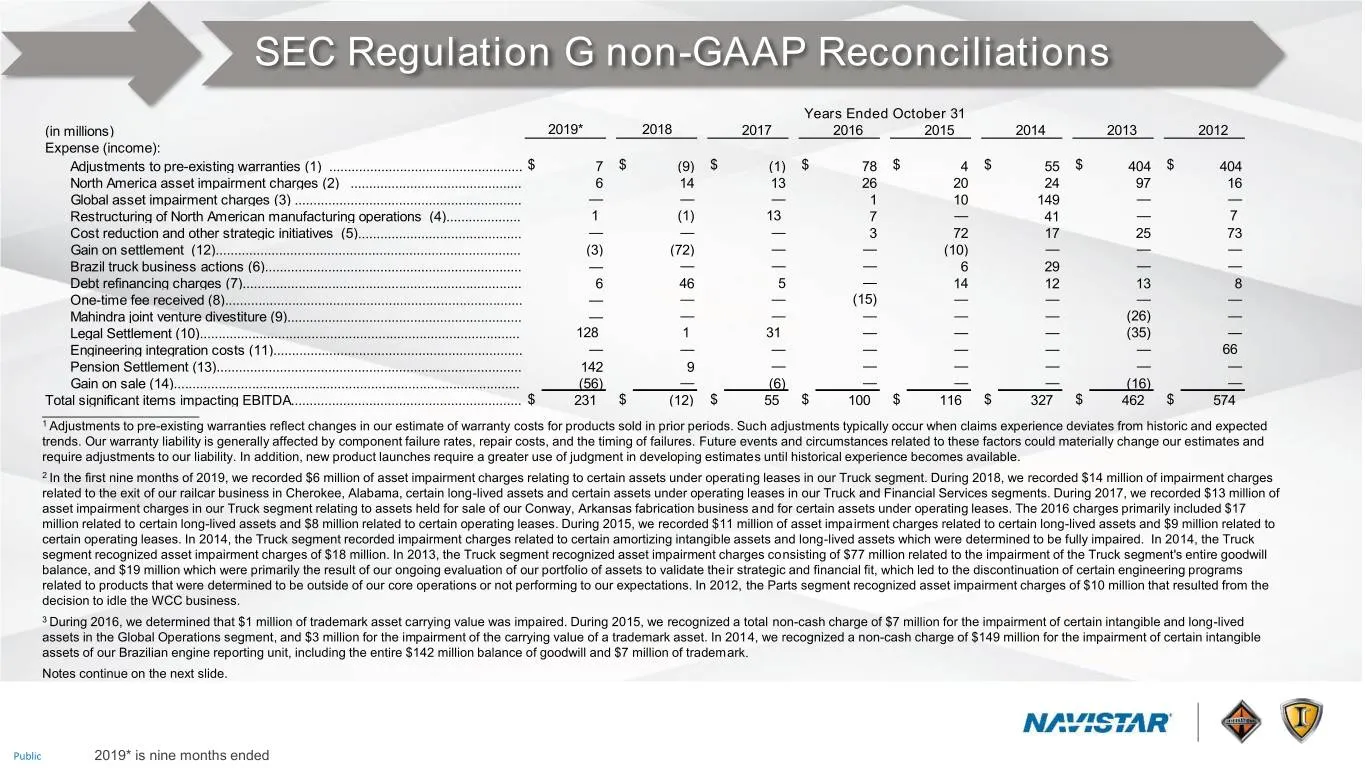
Slide 99: SEC Regulation G non-GAAP Reconciliations
SEC Regulation G non-GAAP Reconciliations Years Ended October 31 (in millions) 2019* 2018 2017 2016 2015 2014 2013 2012 Expense (income): Adjustments to pre-existing warranties (1) .................................................... $ 7 $ (9) $ (1) $ 78 $ 4 $ 55 $ 404 $ 404 North America asset impa
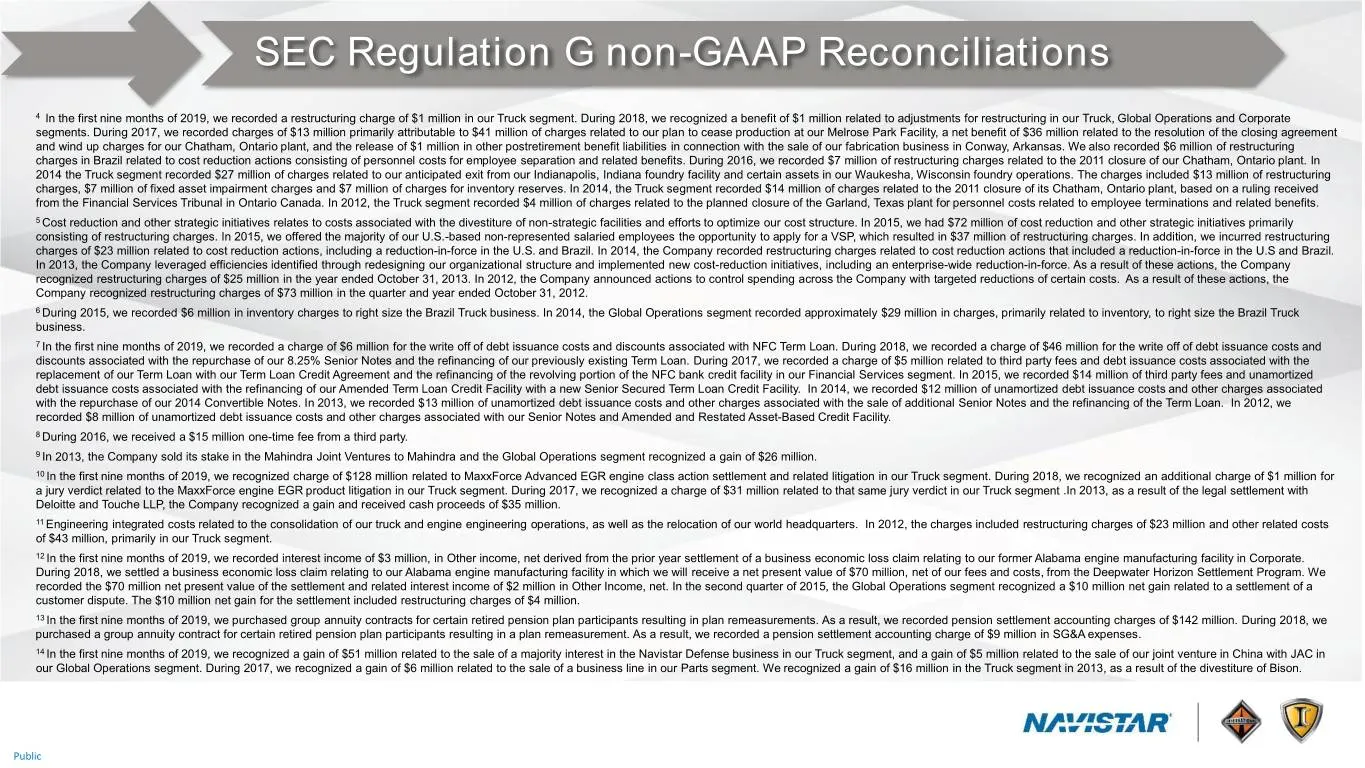
Slide 100: SEC Regulation G non-GAAP Reconciliations
SEC Regulation G non-GAAP Reconciliations 4 In the first nine months of 2019, we recorded a restructuring charge of $1 million in our Truck segment. During 2018, we recognized a benefit of $1 million related to adjustments for restructuring in our Truck, Global Operations and Corporate segments. Dur
Source: SEC EDGAR · 8-K filed Sep 19, 2019
More decks from Navistar International Corporation
 Q2 2021 Earnings Presentation20 slides · Jun 8, 2021
 Q1 2021 Earnings Presentation20 slides · Mar 9, 2021
 Q4 2020 Earnings Presentation22 slides · Dec 17, 2020
 Q3 2020 Earnings Presentation21 slides · Sep 9, 2020
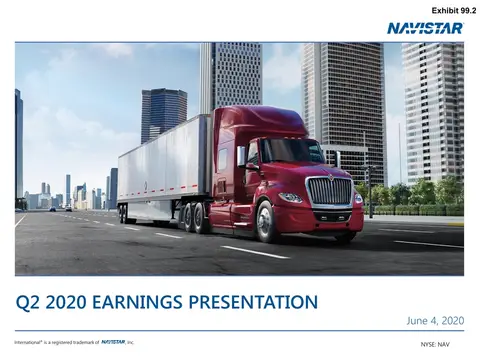 Q2 2020 Earnings Presentation21 slides · Jun 4, 2020
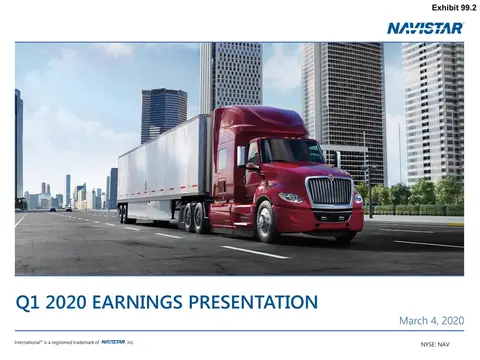 Q1 2020 Earnings Presentation21 slides · Mar 4, 2020