comScore, Inc. · NASDAQ:SCOR
comScore — Conference Presentation (June 2011)
34 slides from comScore's conference presentation, Jun 6, 2011

Slide 1: The State of Online Video in Germany
The State of Online Video in Germany Understanding and Unlocking the Potential Marc Gosschalk, 6th June 2011 Senior Analyst, Video Metrix 2.0 Product Management

Slide 2: What Makes the Video Universe so Uniquely Powerful?
What Makes the Video Universe so Uniquely Powerful? • Online video content is ubiquitously accessible and ever increasingly monetisable • Online video advertising is an impactant format that has the potential to be effectively planned and understood © comScore, Inc. Proprietary and Confidential. 2

Slide 3: A More Monetisable Marketplace
The State of Online Video in Germany A More Monetisable Marketplace © comScore, Inc. Proprietary and Confidential. 3
Slide 4: Video is the Here and Now
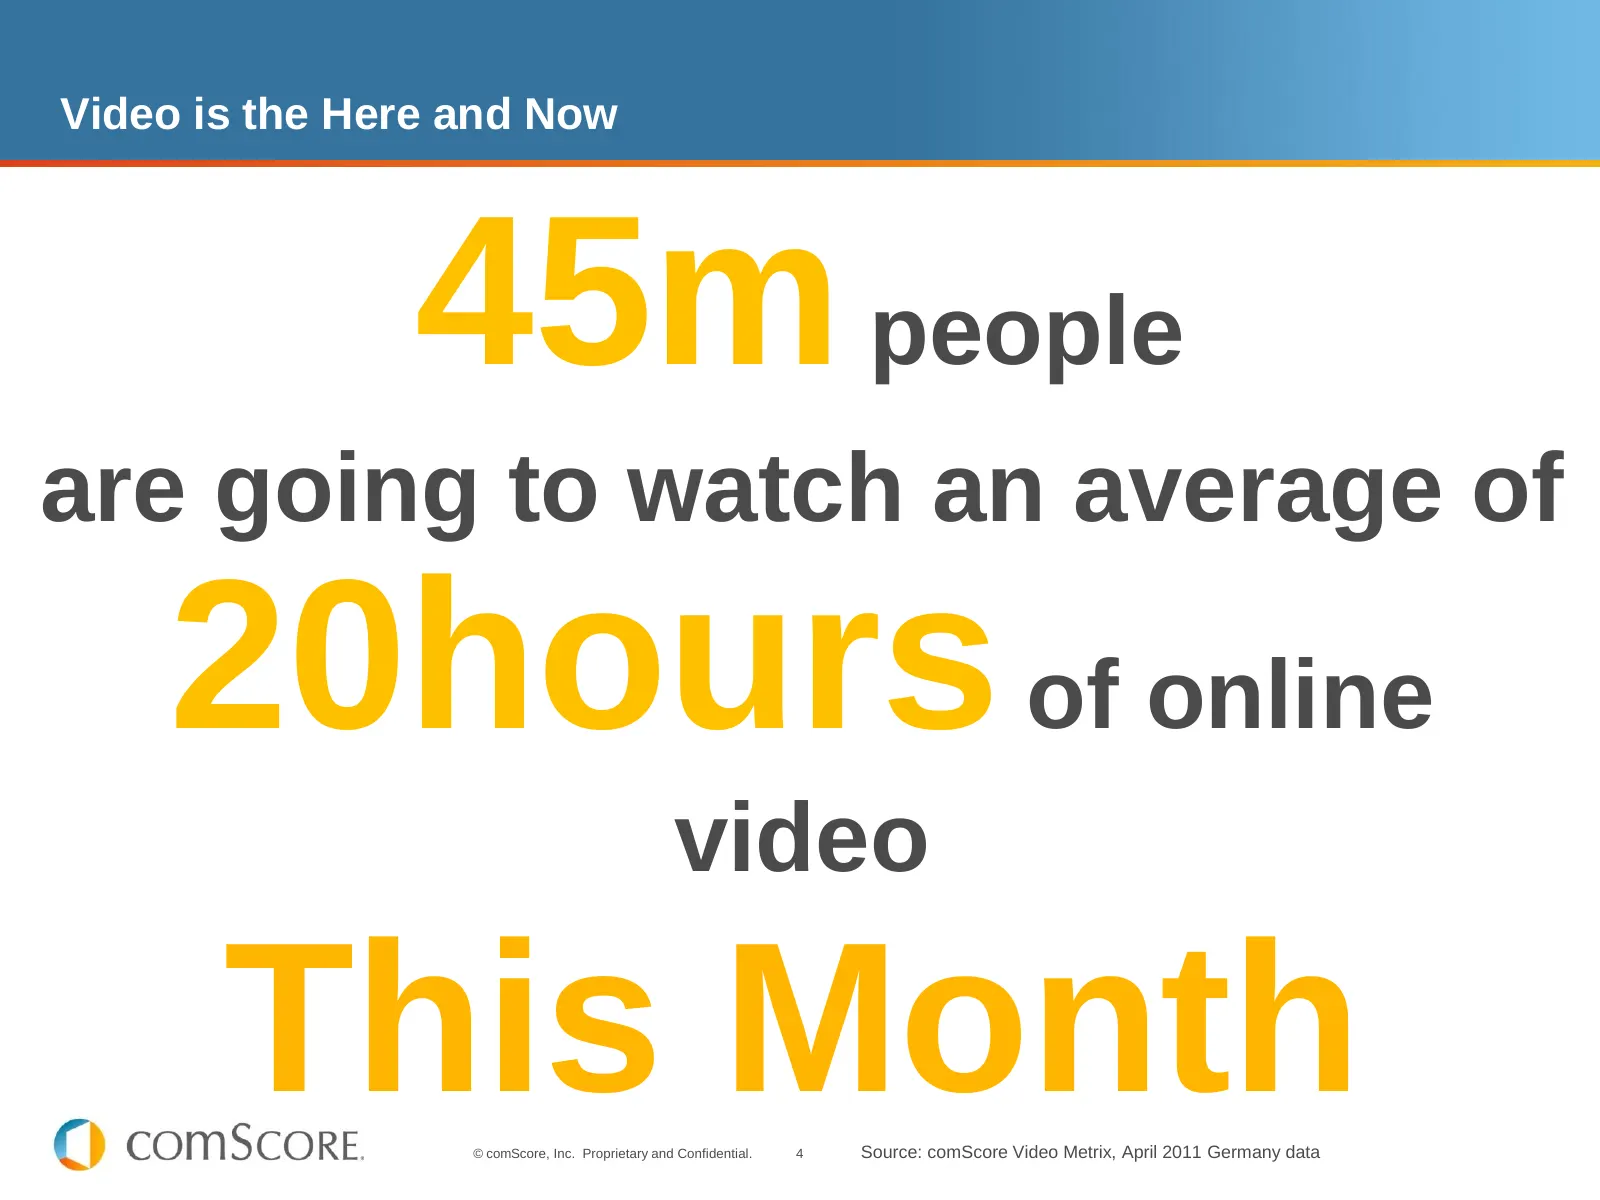
Video is the Here and Now 45m people are going to watch an average of 20hours of online video This Month © comScore, Inc. Proprietary and Confidential. 4 Source: comScore Video Metrix, April 2011 Germany data
Slide 5: Young Males Dominate Online Video
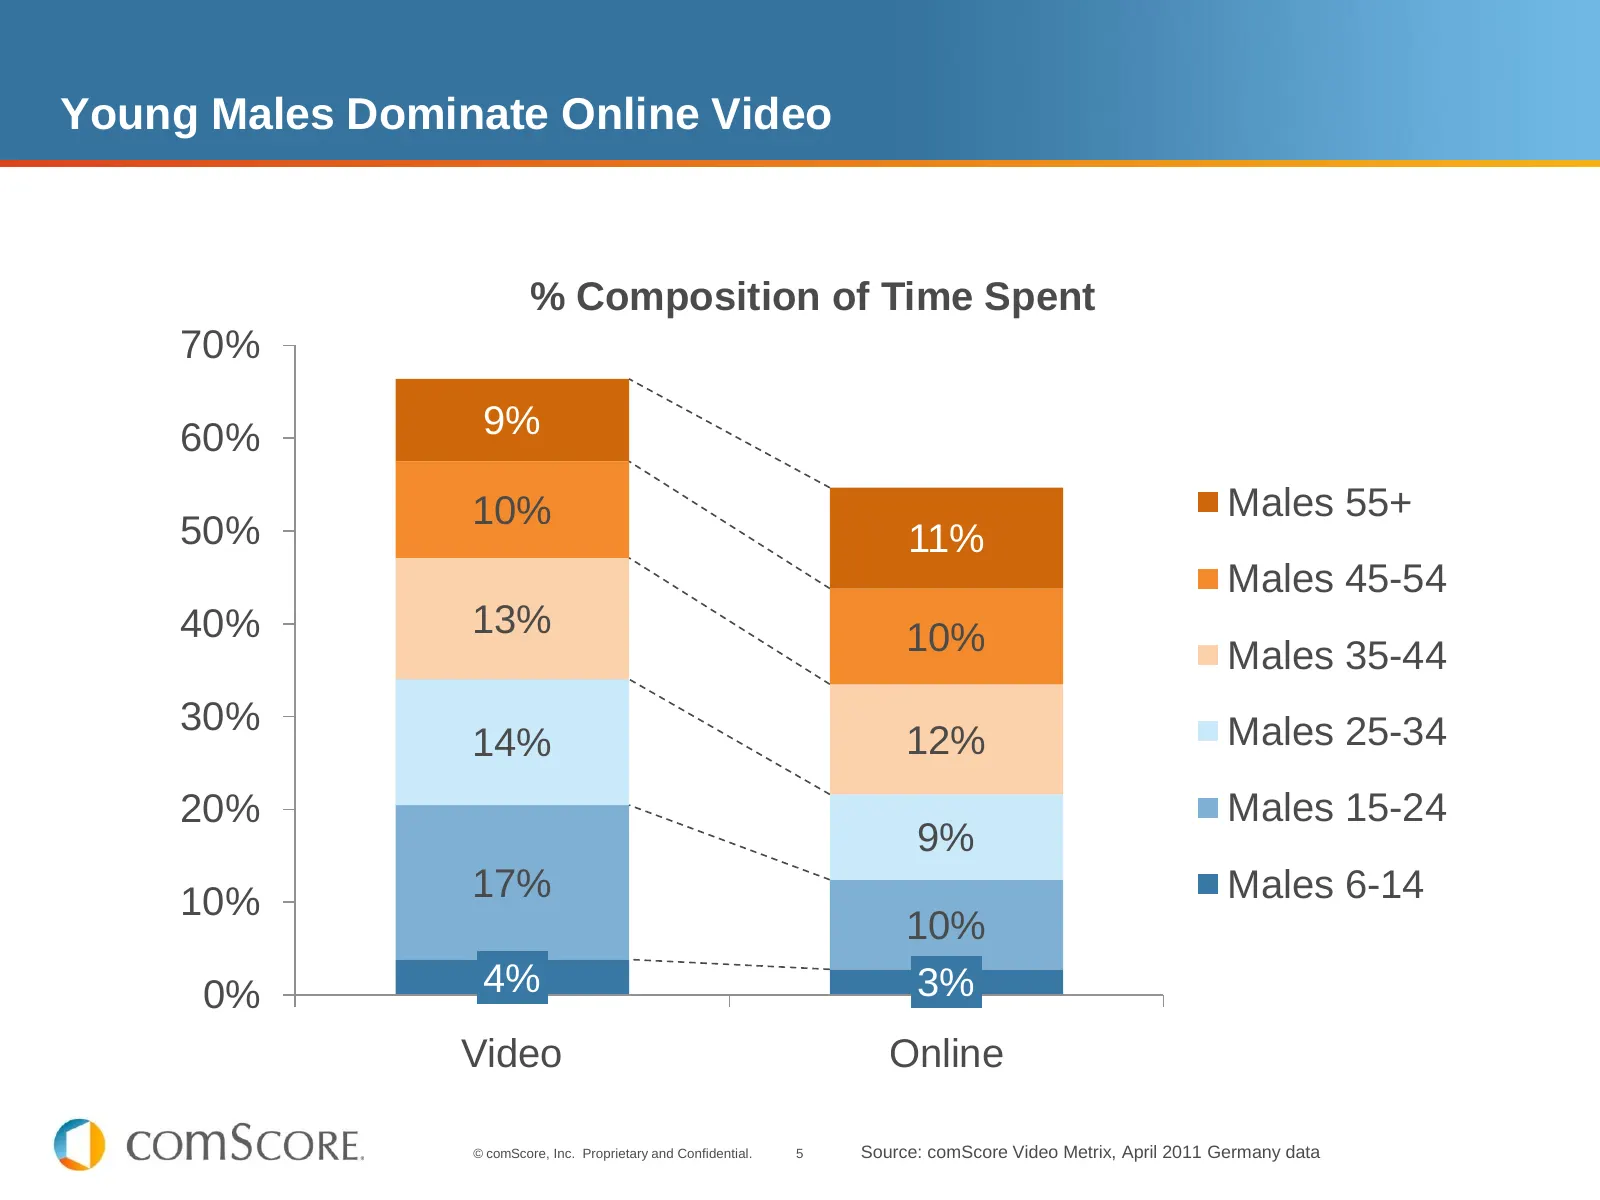
Young Males Dominate Online Video % Composition of Time Spent 70% 60% 9% 10% Males 55+ 50% 11% Males 45-54 40% 13% 10% Males 35-44 30% Males 25-34 14% 12% 20% Males 15-24 9% 10% 17% Males 6-14 10% 0% 4% 3% Video Online © comScore, Inc. Proprietary and Confidential. 5 Source: comScore Video Metrix, A
Slide 6: But Online TV Consumption is Split Amongst Males and Females
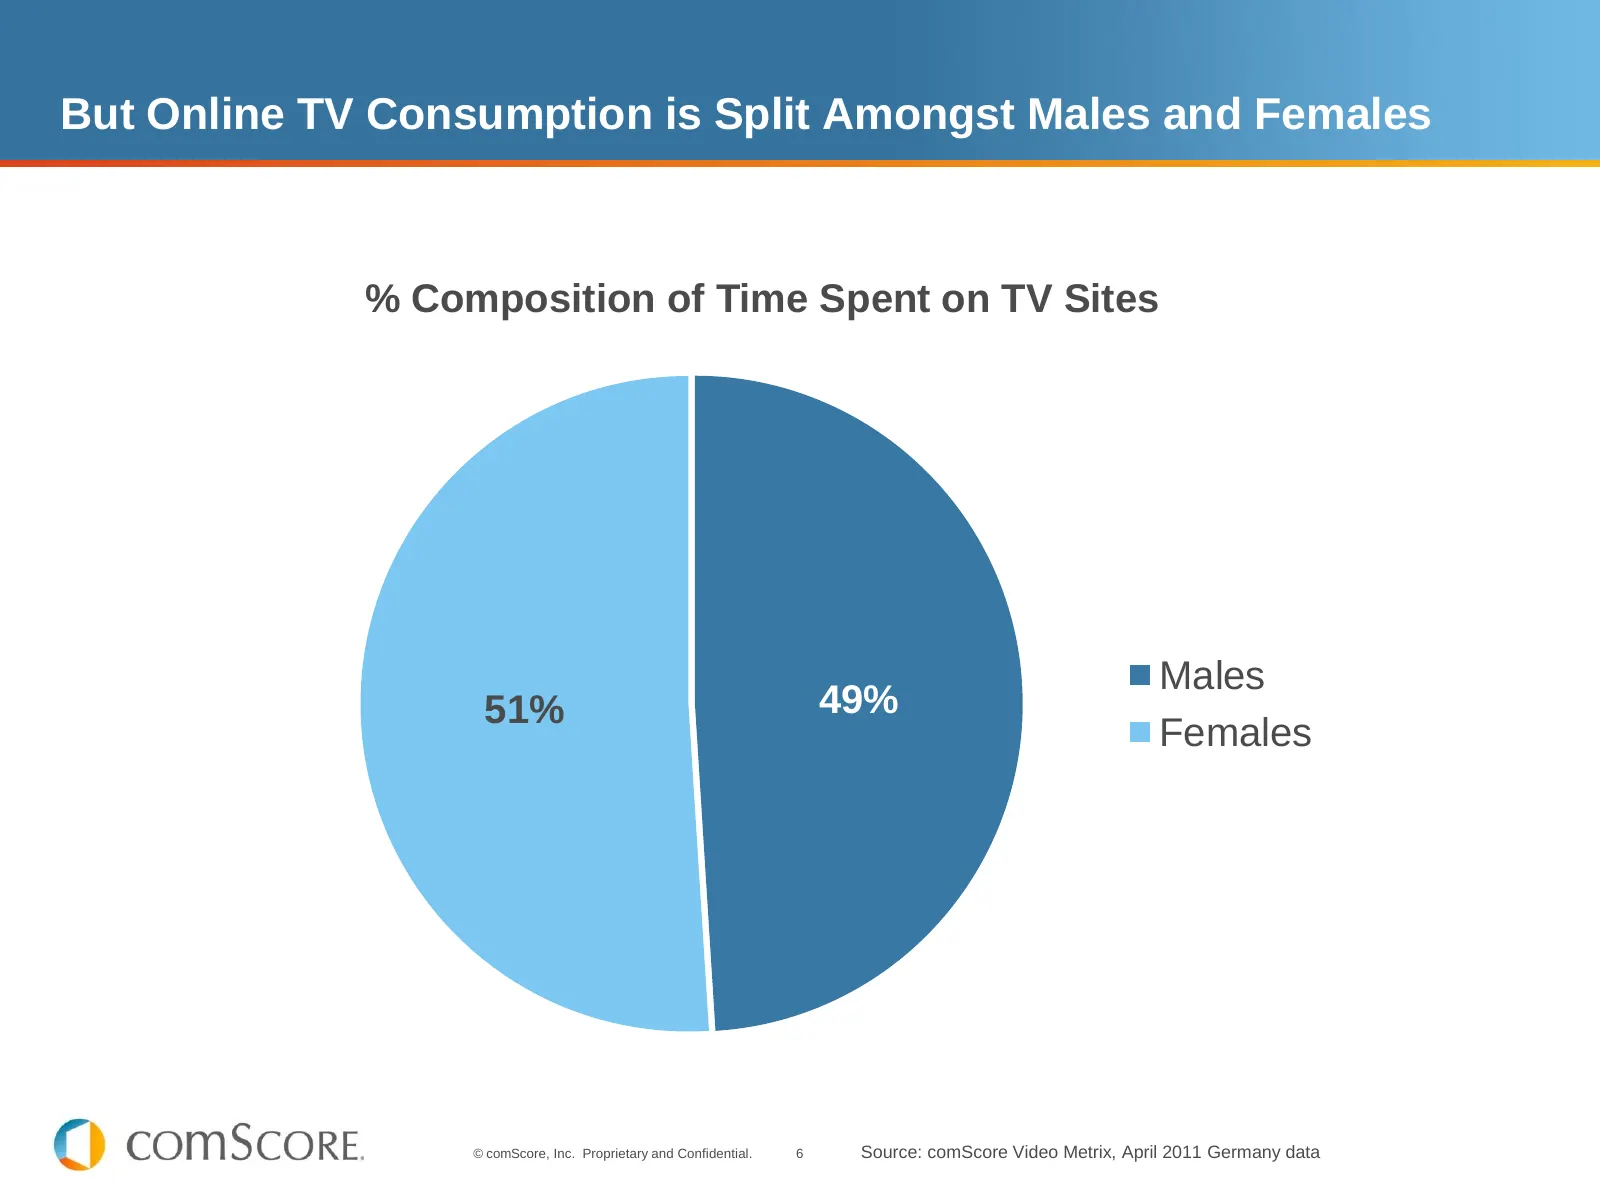
But Online TV Consumption is Split Amongst Males and Females % Composition of Time Spent on TV Sites Males 51% 49% Females © comScore, Inc. Proprietary and Confidential. 6 Source: comScore Video Metrix, April 2011 Germany data
Slide 7: Viewers Watching a Mixture of UGC and Premium Content
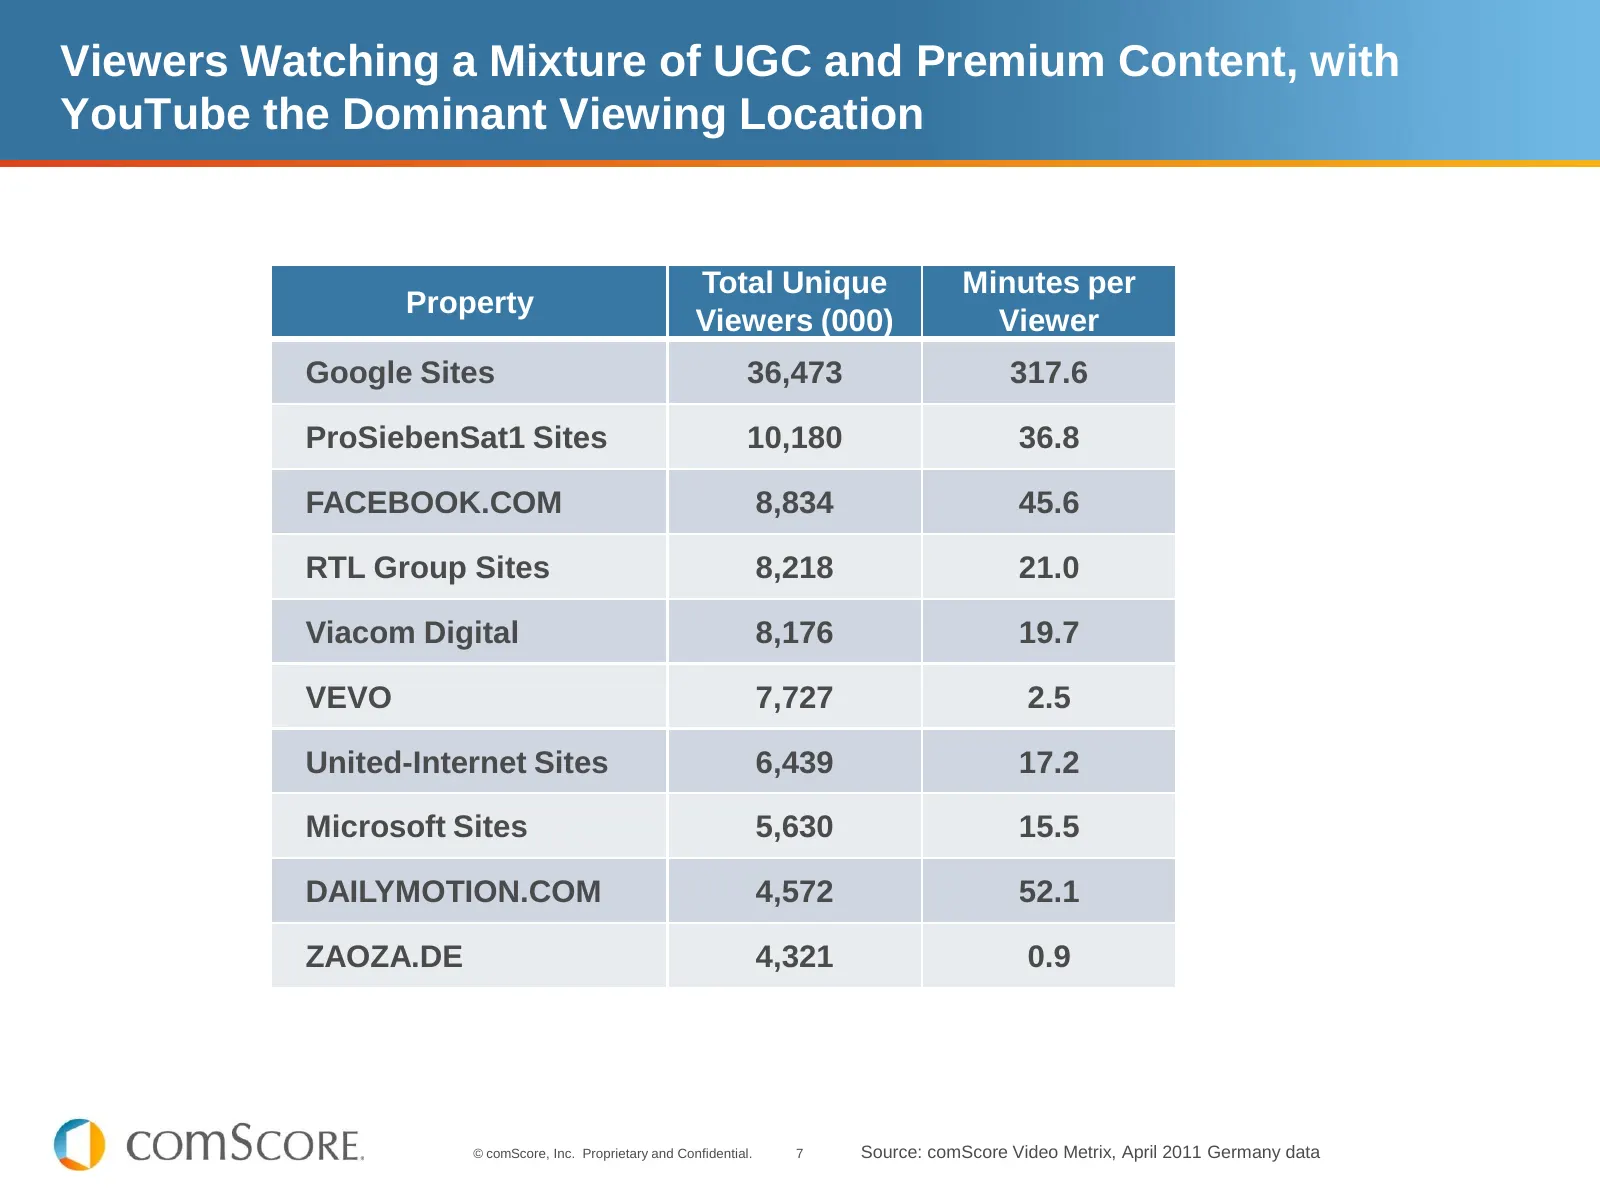
Viewers Watching a Mixture of UGC and Premium Content, with YouTube the Dominant Viewing Location Total Unique Minutes per Property Viewers (000) Viewer Google Sites 36,473 317.6 ProSiebenSat1 Sites 10,180 36.8 FACEBOOK.COM 8,834 45.6 RTL Group Sites 8,218 21.0 Viacom Digital 8,176 19.7 VEVO 7,727 2
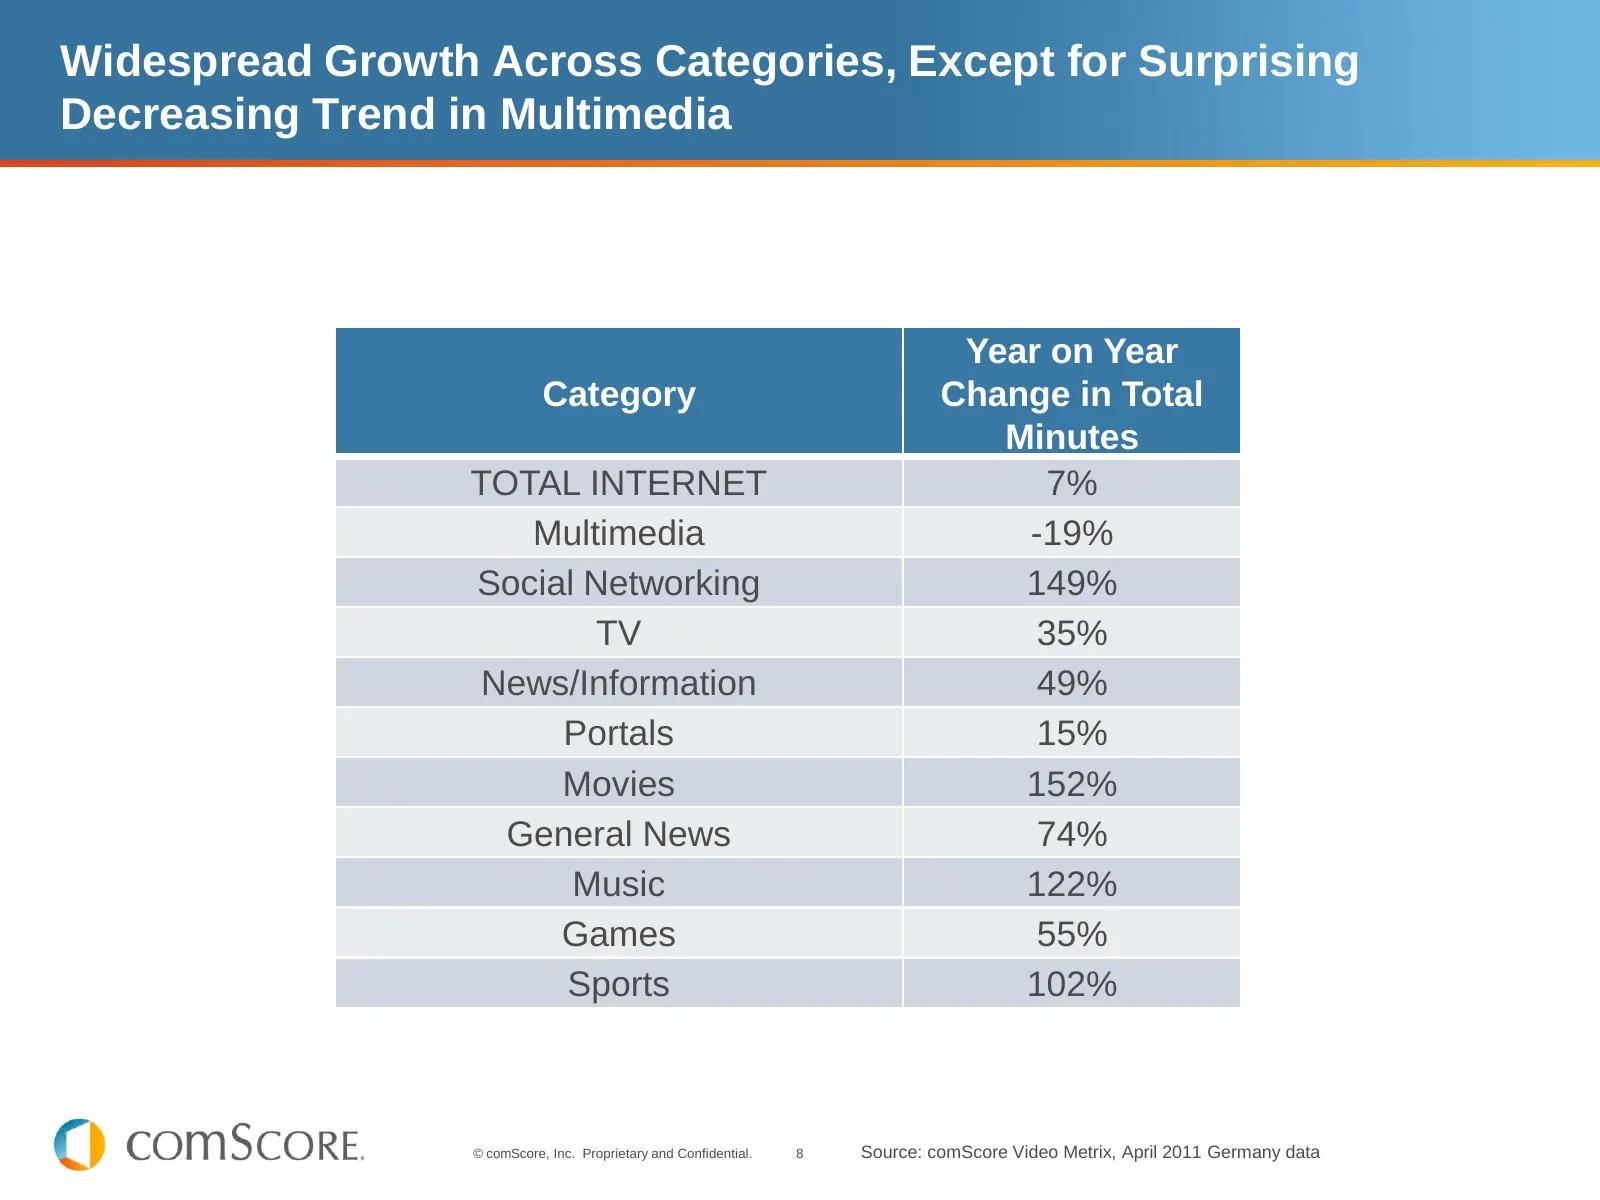
Slide 8: Widespread Growth Across Categories, Except Decreasing Multimedia
Widespread Growth Across Categories, Except for Surprising Decreasing Trend in Multimedia Year on Year Category Change in Total Minutes TOTAL INTERNET 7% Multimedia -19% Social Networking 149% TV 35% News/Information 49% Portals 15% Movies 152% General News 74% Music 122% Games 55% Sports 102% © com
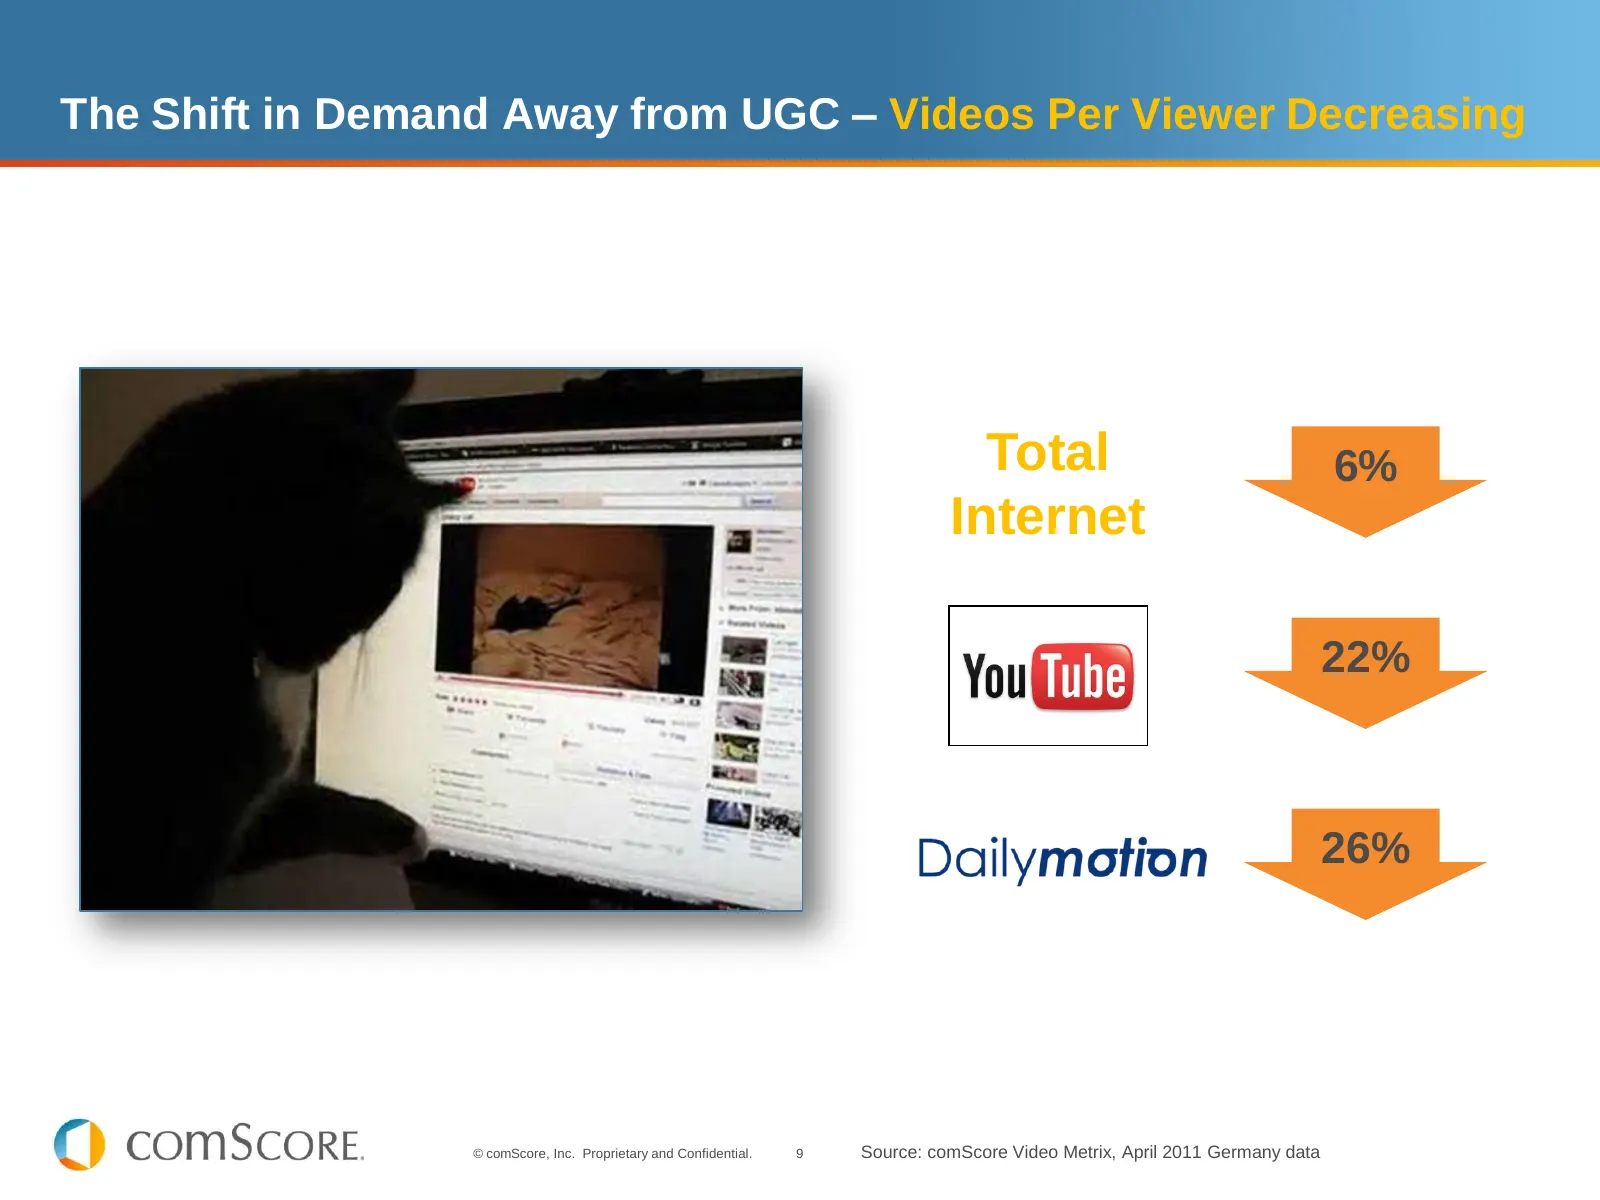
Slide 9: The Shift in Demand Away from UGC – Videos Per Viewer Decreasing
The Shift in Demand Away from UGC – Videos Per Viewer Decreasing Total 6% Internet 22% 26% © comScore, Inc. Proprietary and Confidential. 9 Source: comScore Video Metrix, April 2011 Germany data
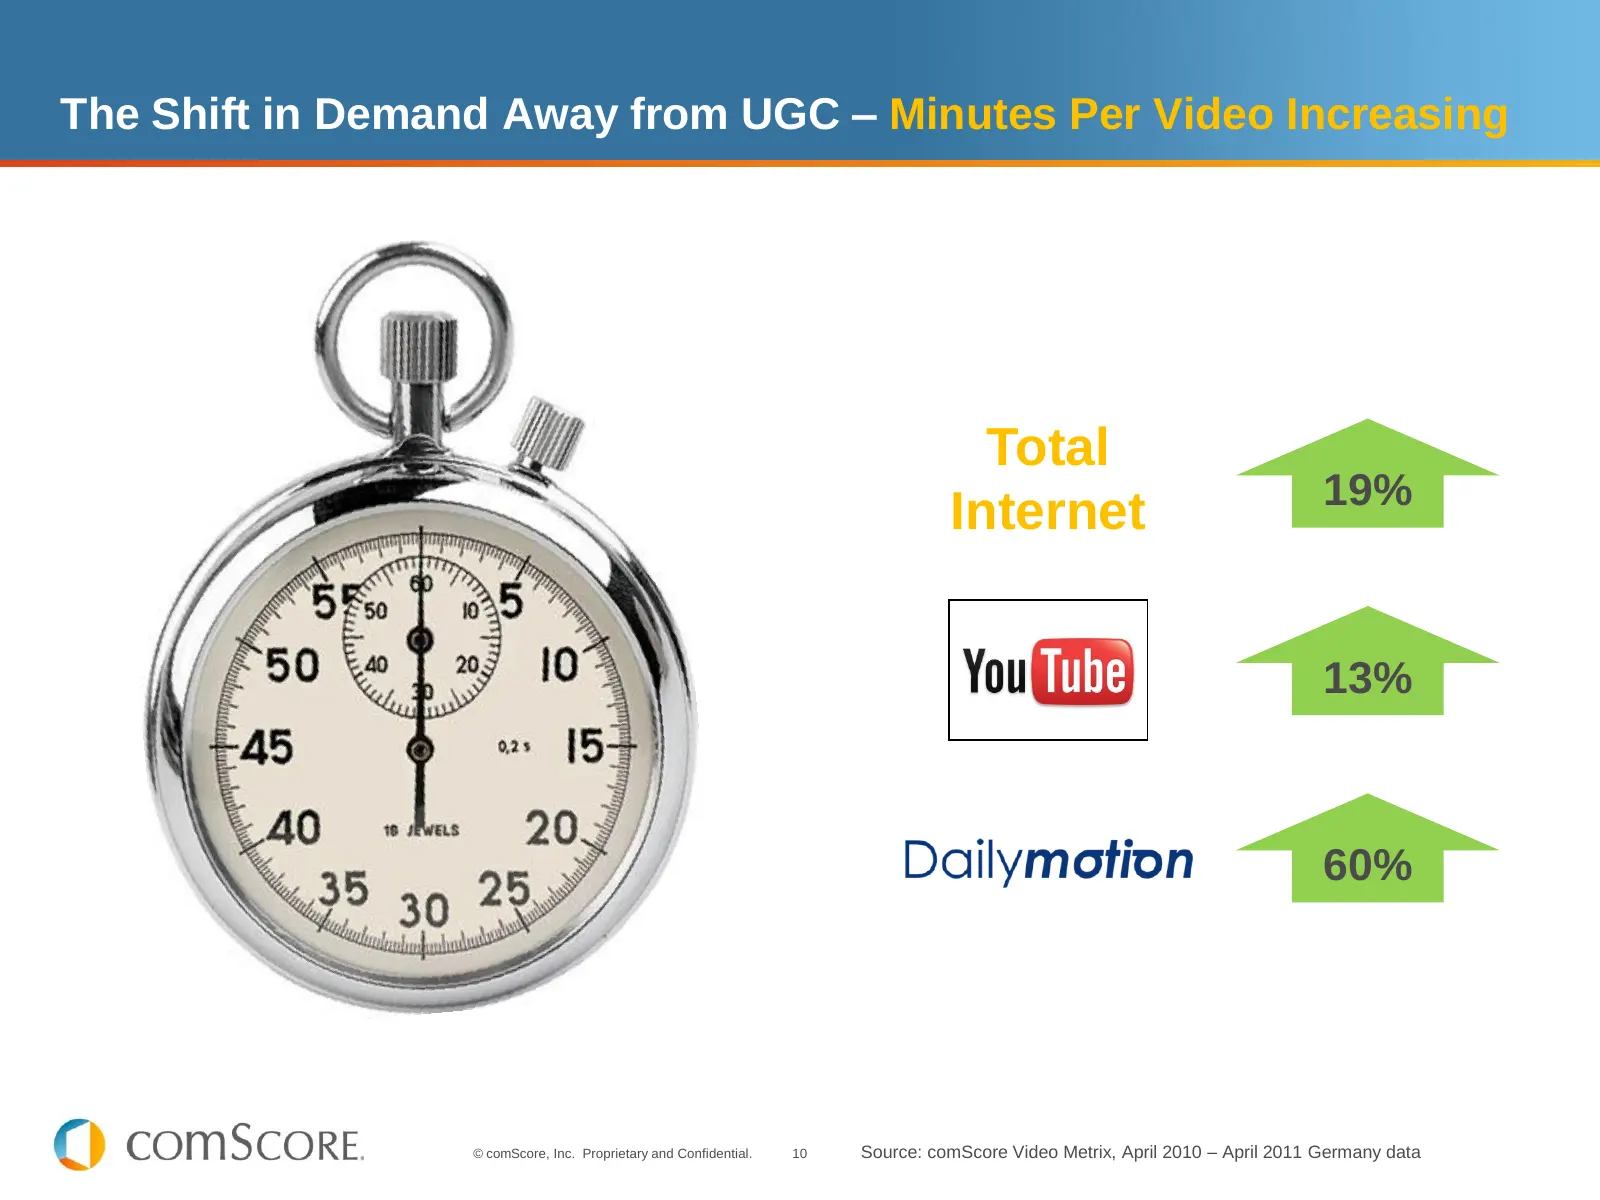
Slide 10: The Shift in Demand Away from UGC – Minutes Per Video Increasing
The Shift in Demand Away from UGC – Minutes Per Video Increasing Total 19% Internet 13% 60% © comScore, Inc. Proprietary and Confidential. 10 Source: comScore Video Metrix, April 2010 – April 2011 Germany data
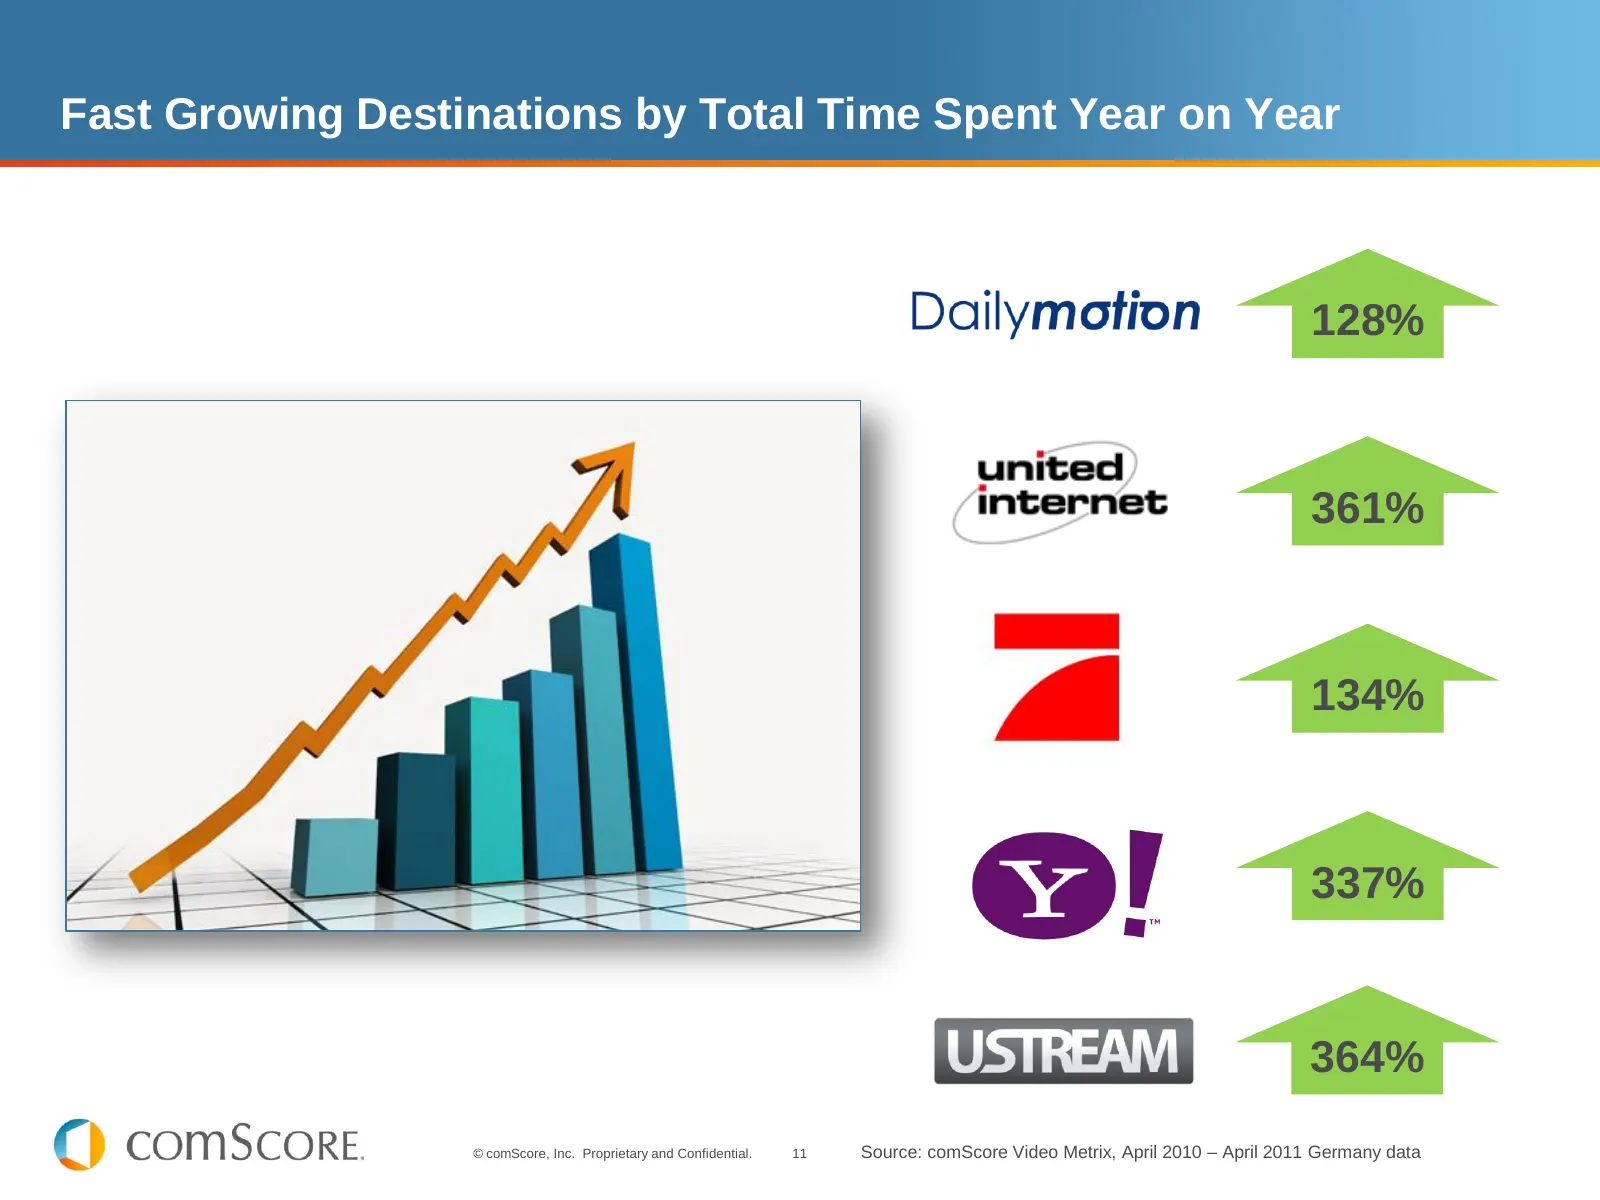
Slide 11: Fast Growing Destinations by Total Time Spent Year on Year
Fast Growing Destinations by Total Time Spent Year on Year 128% 361% 134% 337% 364% © comScore, Inc. Proprietary and Confidential. 11 Source: comScore Video Metrix, April 2010 – April 2011 Germany data
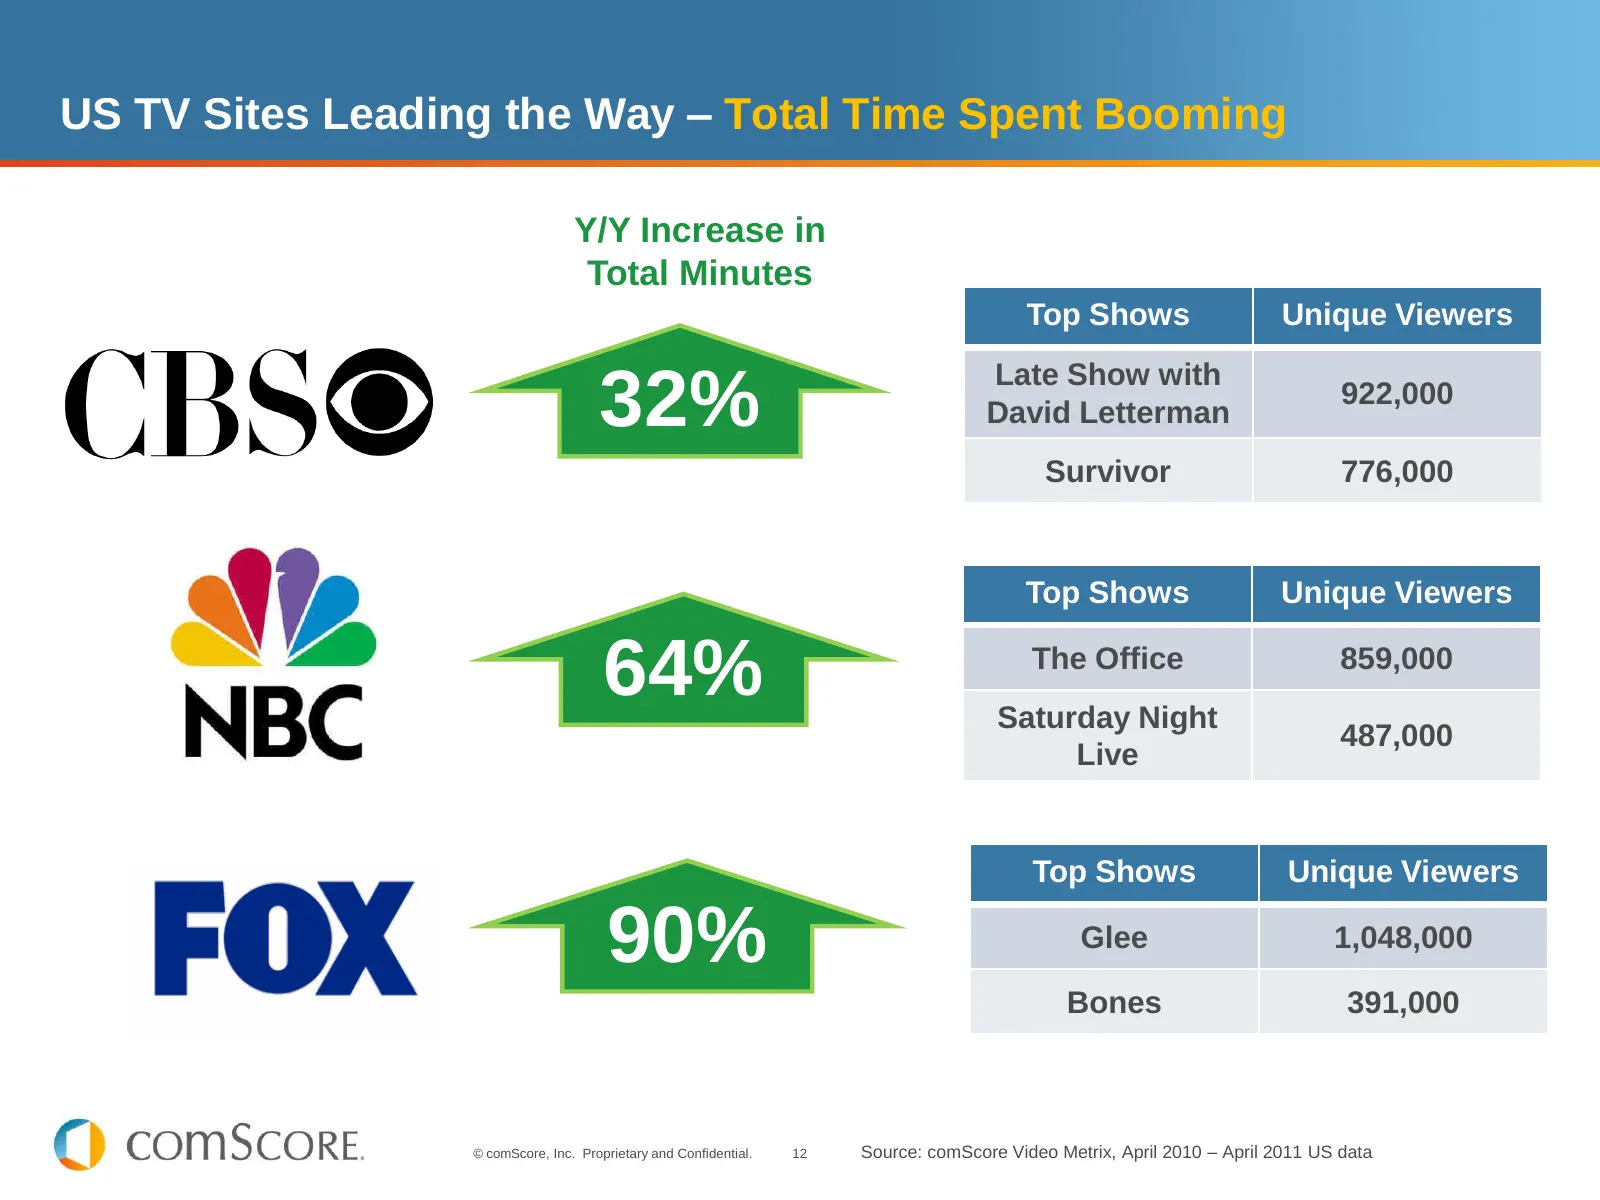
Slide 12: US TV Sites Leading the Way – Total Time Spent Booming
US TV Sites Leading the Way – Total Time Spent Booming Y/Y Increase in Total Minutes Top Shows Unique Viewers Late Show with 32% David Letterman 922,000 Survivor 776,000 Top Shows Unique Viewers 64% The Office Saturday Night 859,000 487,000 Live Top Shows Unique Viewers 90% Glee 1,048,000 Bones 391,

Slide 13: International Learnings
International Learnings The Gap in Online Video Advertising Understanding the Medium © comScore, Inc. Proprietary and Confidential. 13
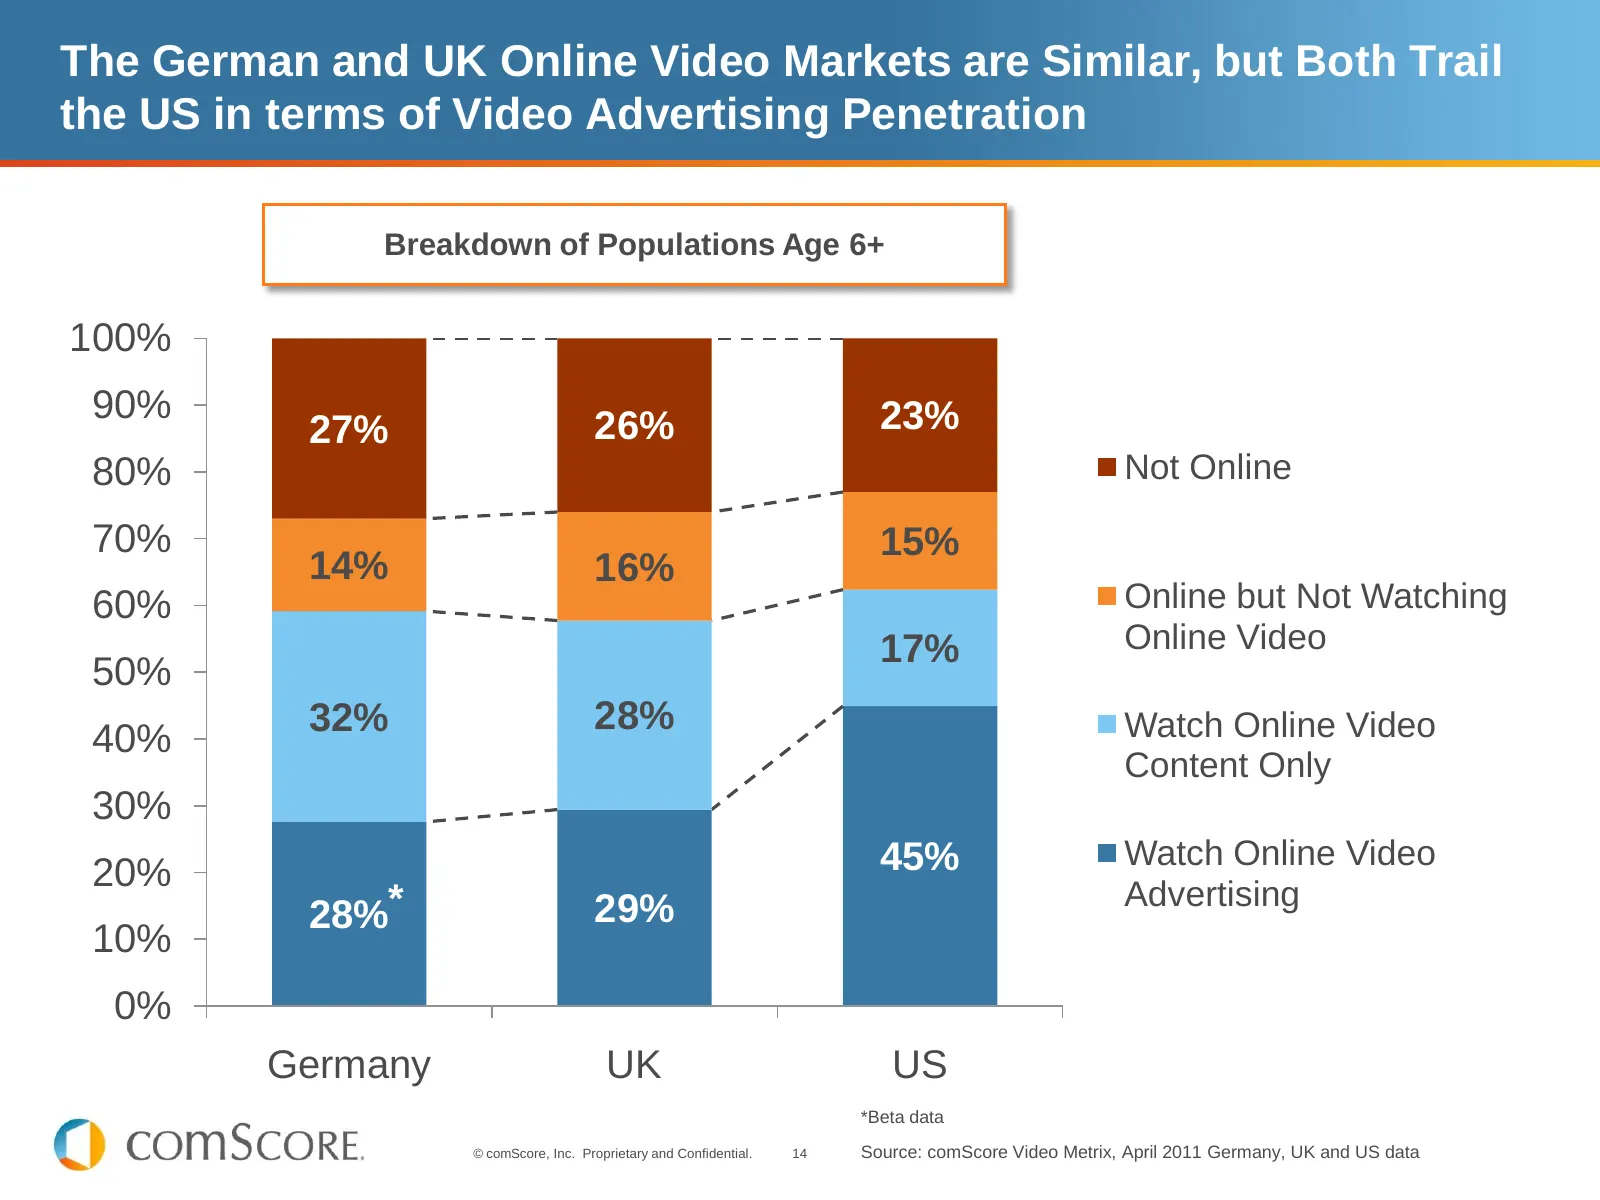
Slide 14: The German and UK Online Video Markets are Similar, but Both Trail the US
The German and UK Online Video Markets are Similar, but Both Trail the US in terms of Video Advertising Penetration Breakdown of Populations Age 6+ 100% 90% 23% 27% 26% 80% Not Online 70% 15% 14% 16% 60% Online but Not Watching 17% Online Video 50% 32% 28% Watch Online Video 40% Content Only 30% 45%
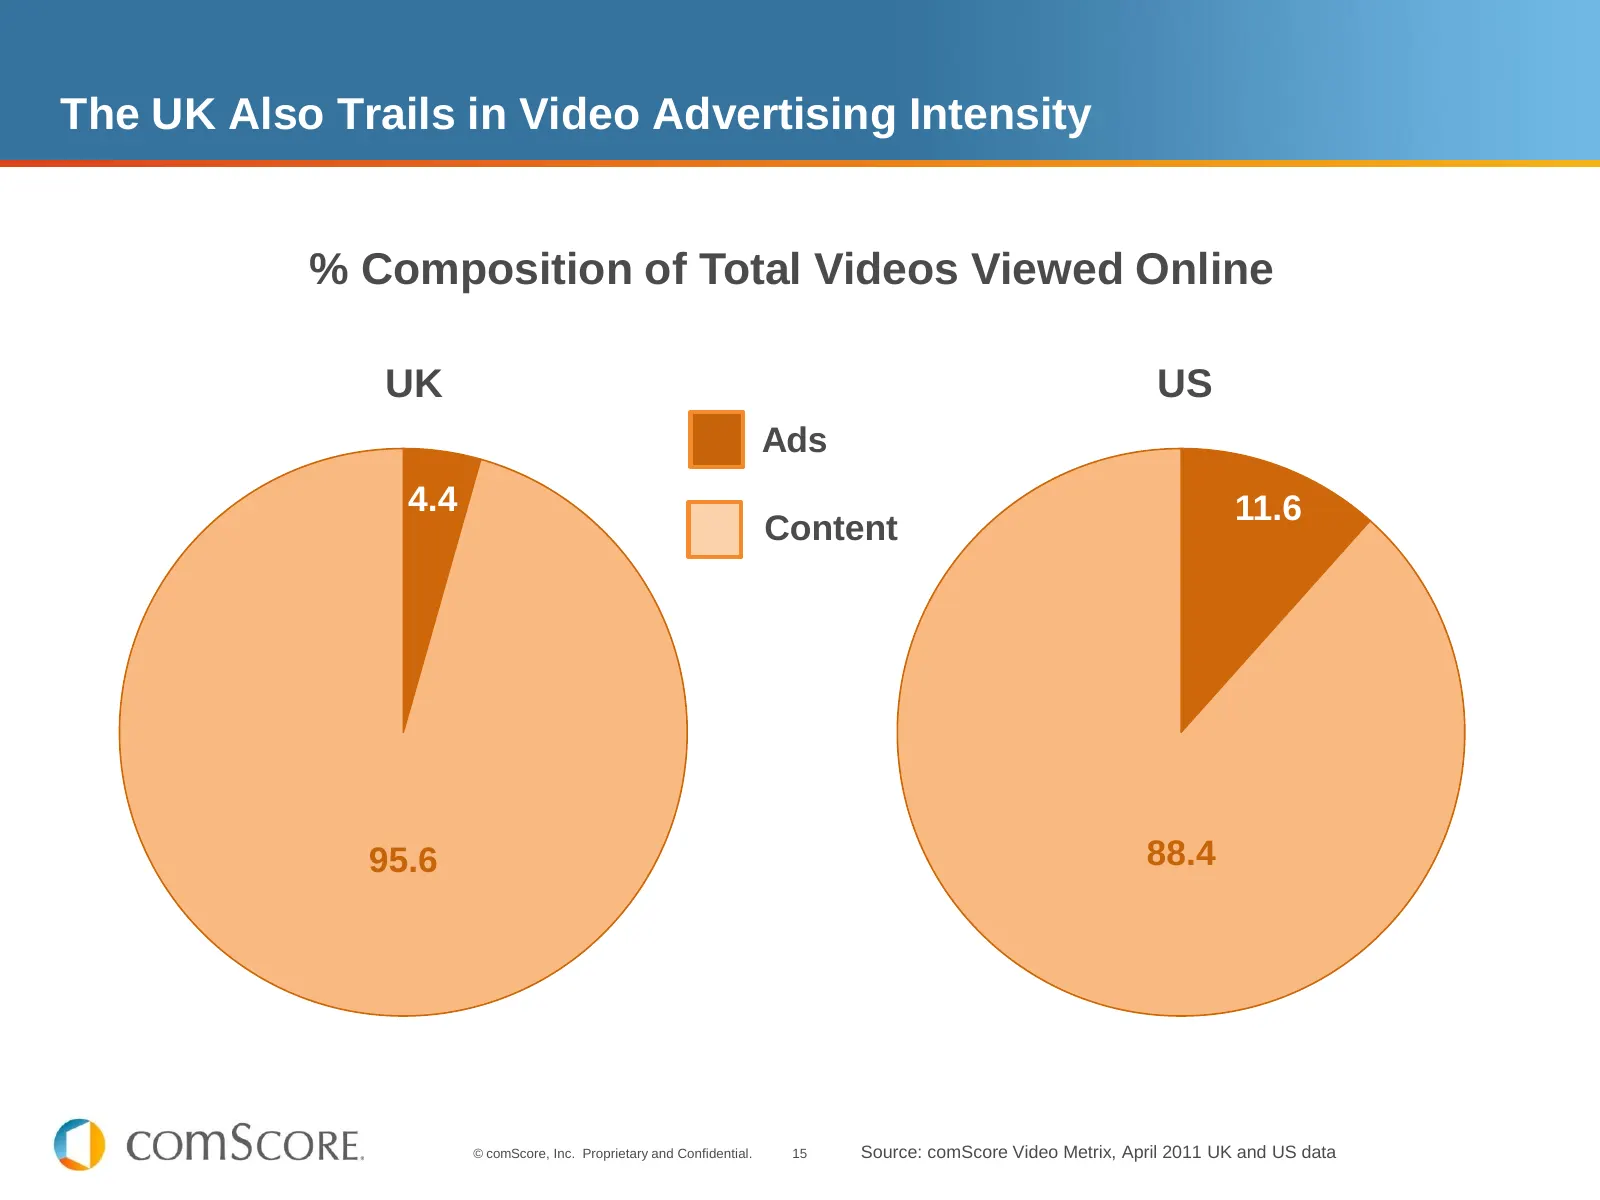
Slide 15: The UK Also Trails in Video Advertising Intensity
The UK Also Trails in Video Advertising Intensity % Composition of Total Videos Viewed Online UK US 4.4 % Ads 4.4 11.6 Content 95.6 88.4 © comScore, Inc. Proprietary and Confidential. 15 Source: comScore Video Metrix, April 2011 UK and US data
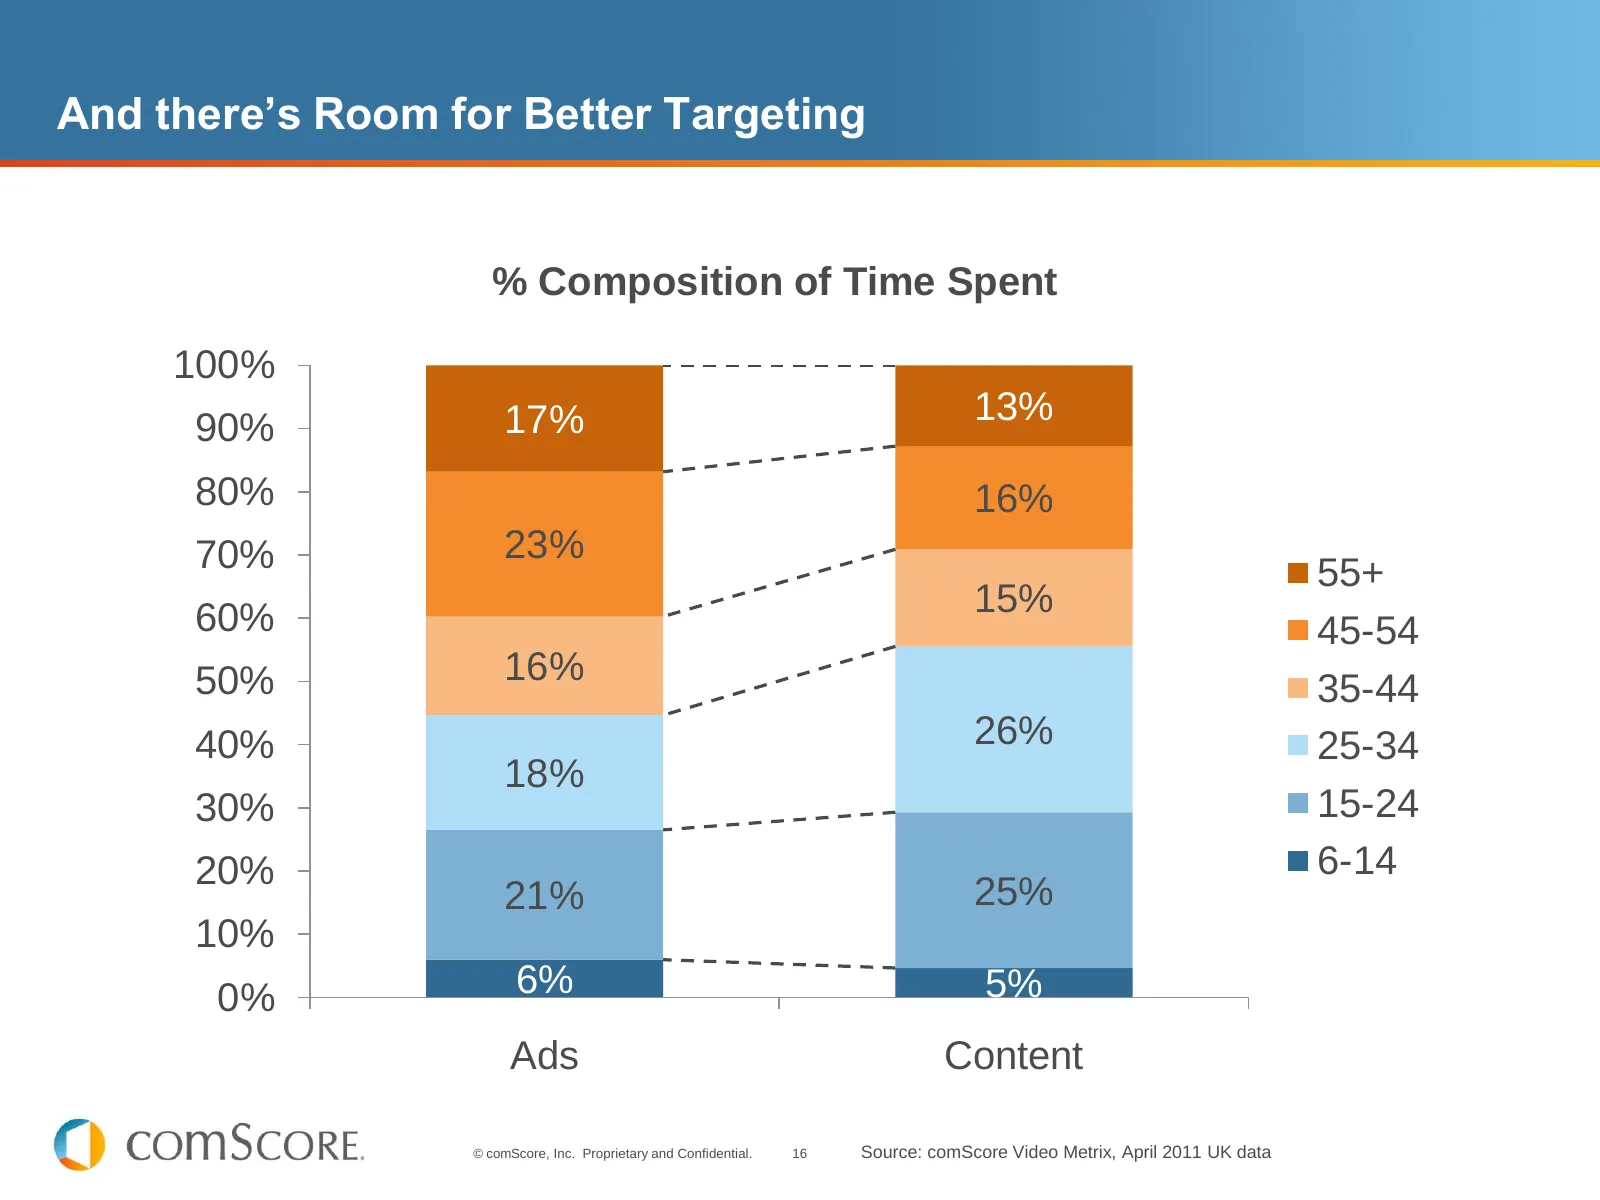
Slide 16: And there’s Room for Better Targeting
And there’s Room for Better Targeting % Composition of Time Spent 100% 17% 13% 90% 80% 16% 70% 23% 55+ 60% 15% 45-54 50% 16% 35-44 40% 26% 25-34 18% 30% 15-24 20% 6-14 21% 25% 10% 0% 6% 5% Ads Content © comScore, Inc. Proprietary and Confidential. 16 Source: comScore Video Metrix, April 2011 UK data
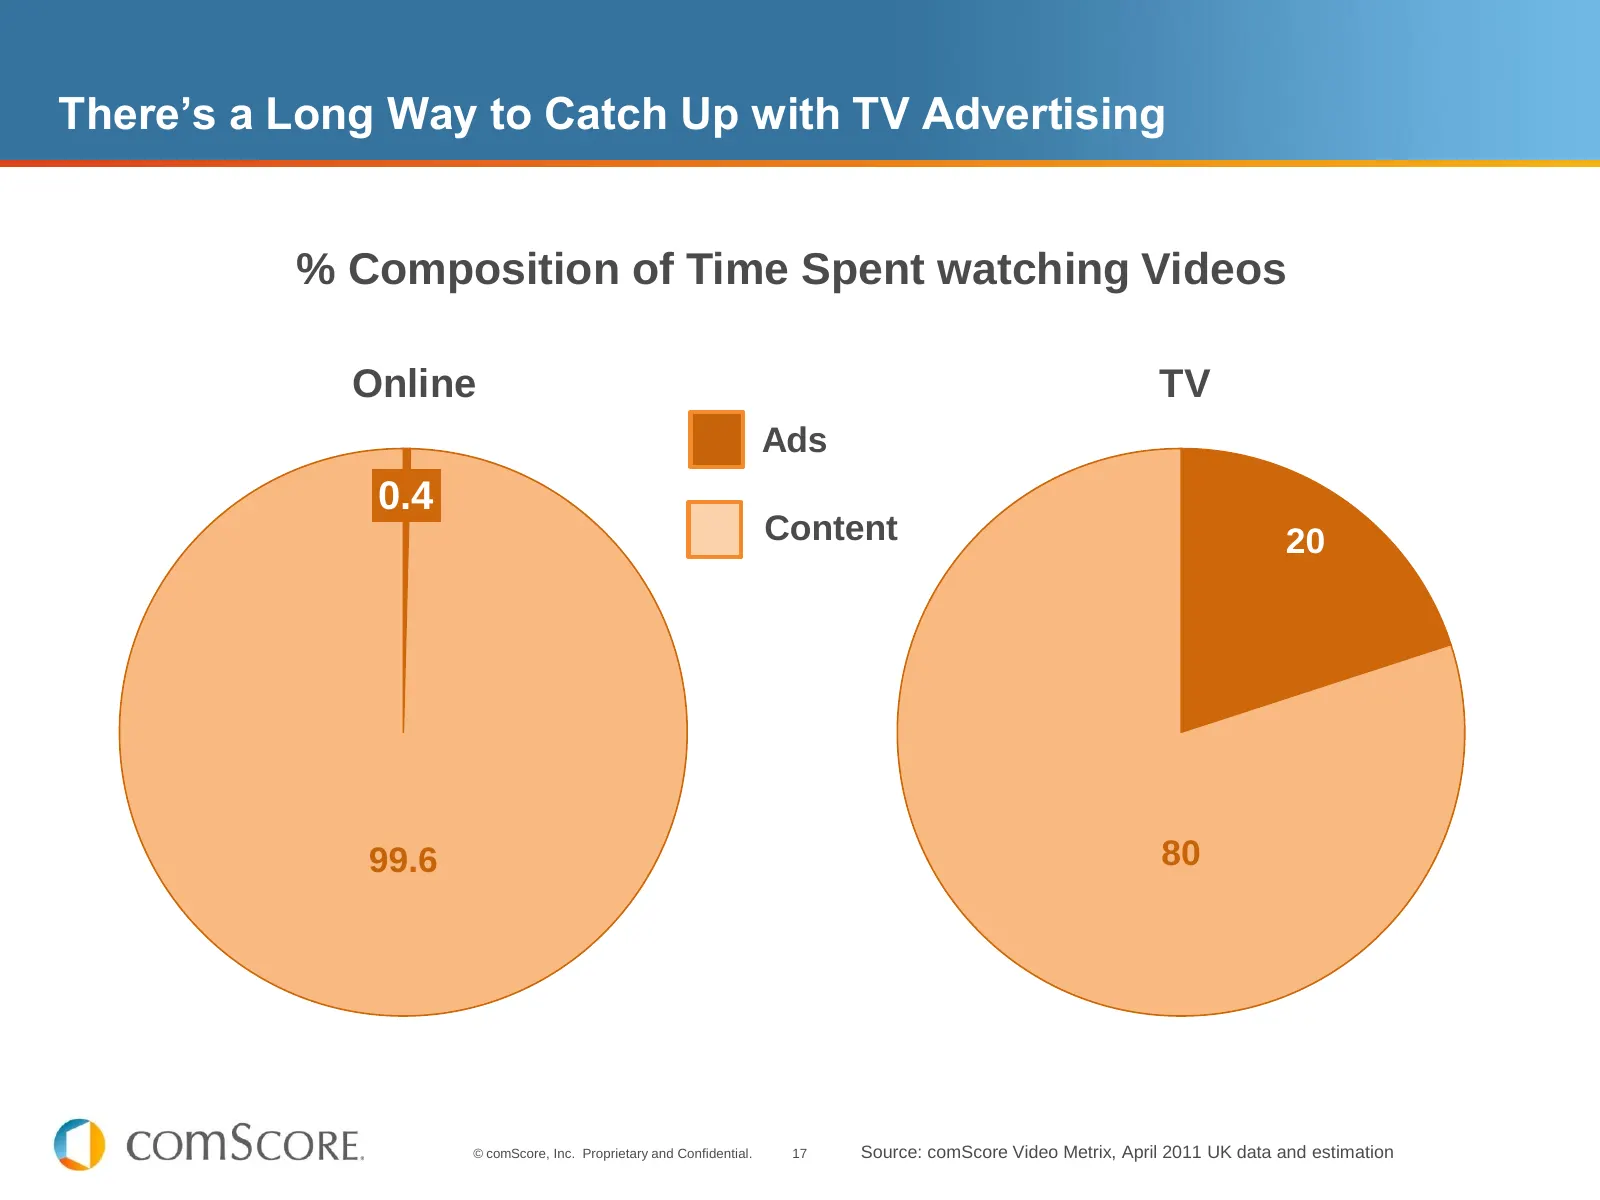
Slide 17: There’s a Long Way to Catch Up with TV Advertising
There’s a Long Way to Catch Up with TV Advertising % Composition of Time Spent watching Videos Online TV Ads 0.4 Content 20 20 99.6 80 © comScore, Inc. Proprietary and Confidential. 17 Source: comScore Video Metrix, April 2011 UK data and estimation
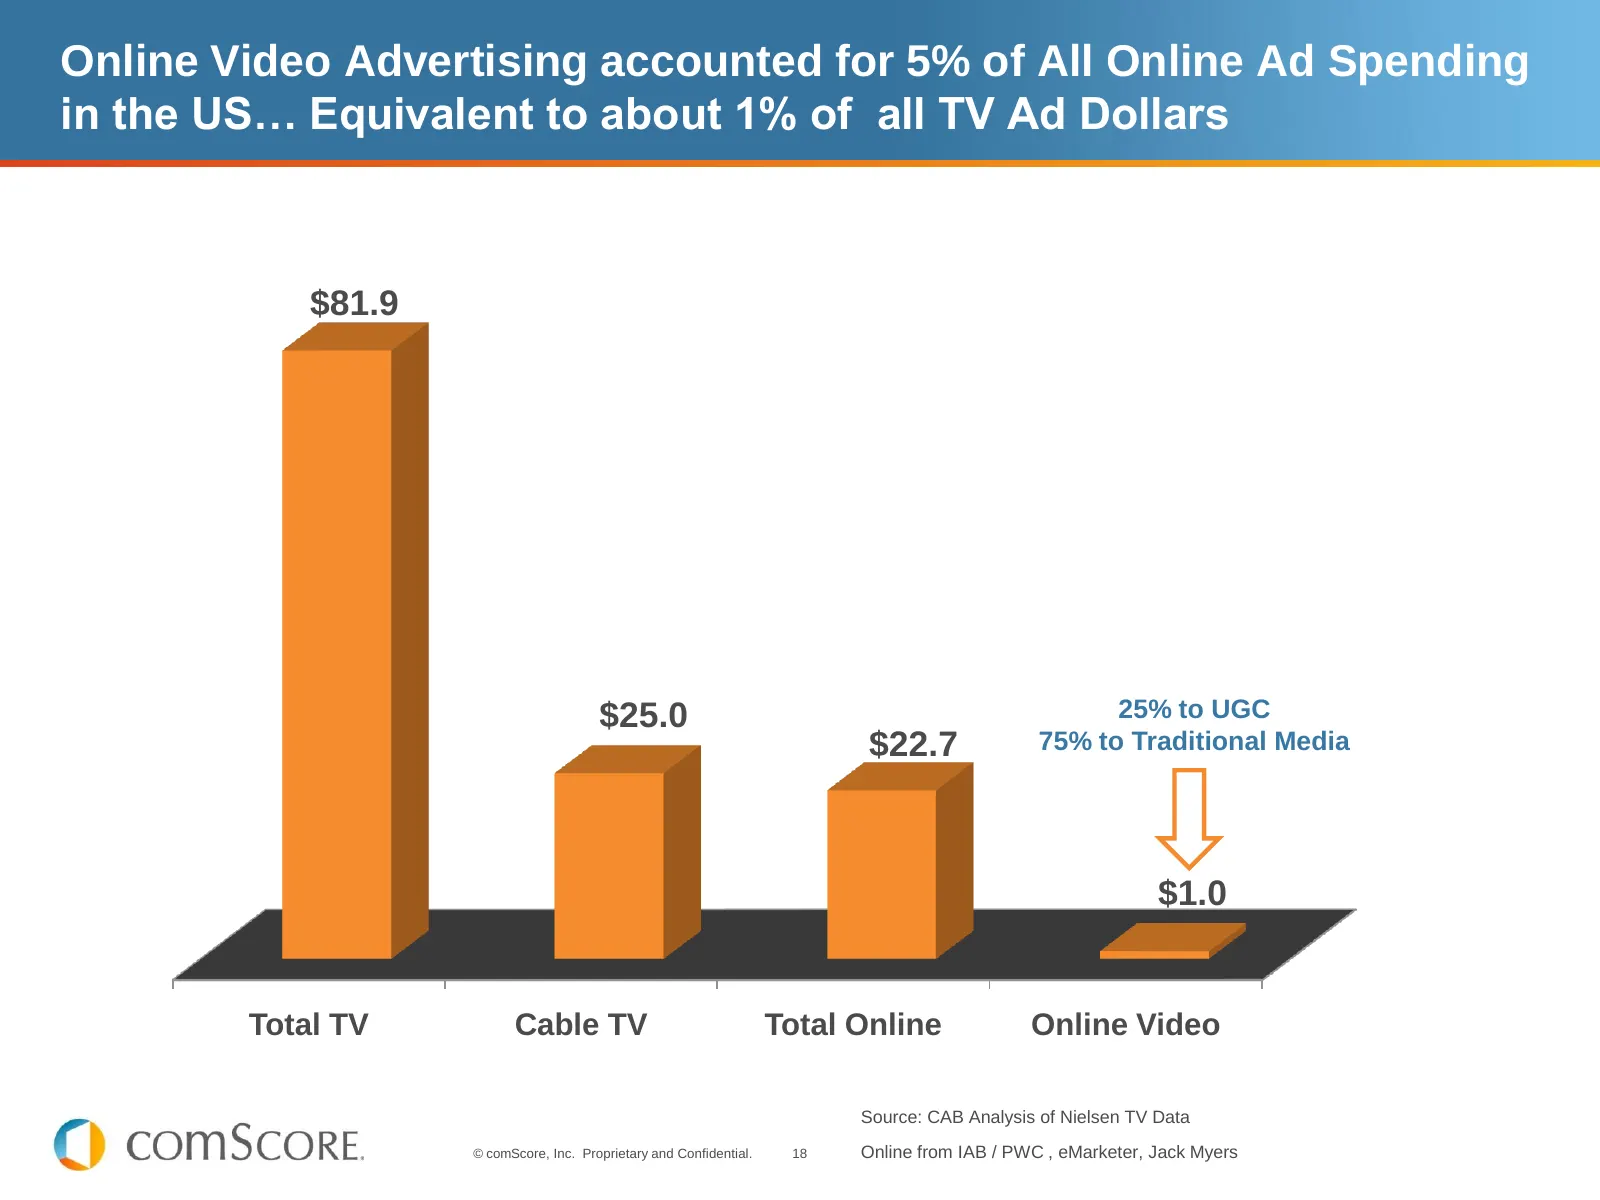
Slide 18: Online Video Advertising Accounted for 5% of All Online Ad Spending in the US
Online Video Advertising accounted for 5% of All Online Ad Spending in the US… Equivalent to about 1% of all TV Ad Dollars $81.9 $25.0 25% to UGC $22.7 75% to Traditional Media $1.0 Total TV Cable TV Total Online Online Video Source: CAB Analysis of Nielsen TV Data © comScore, Inc. Proprietary and C
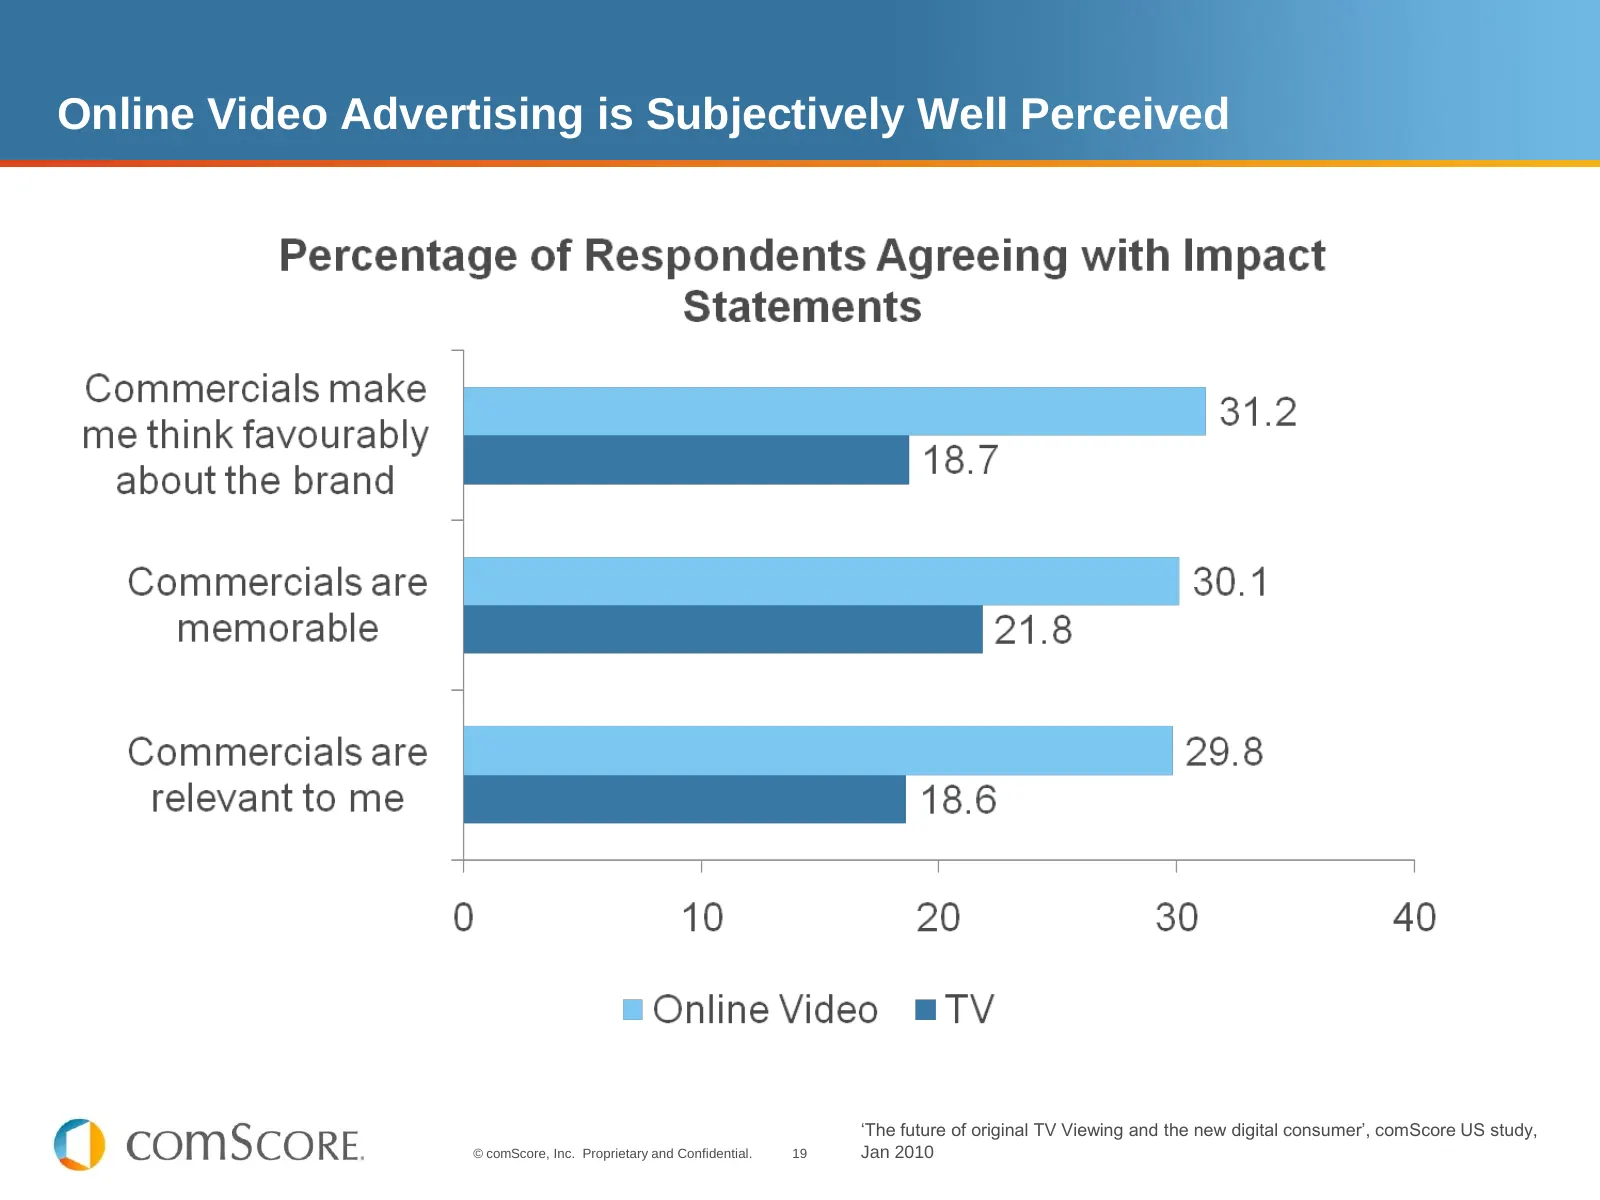
Slide 19: Online Video Advertising is Subjectively Well Perceived
Online Video Advertising is Subjectively Well Perceived ‘The future of original TV Viewing and the new digital consumer’, comScore US study, © comScore, Inc. Proprietary and Confidential. 19 Jan 2010
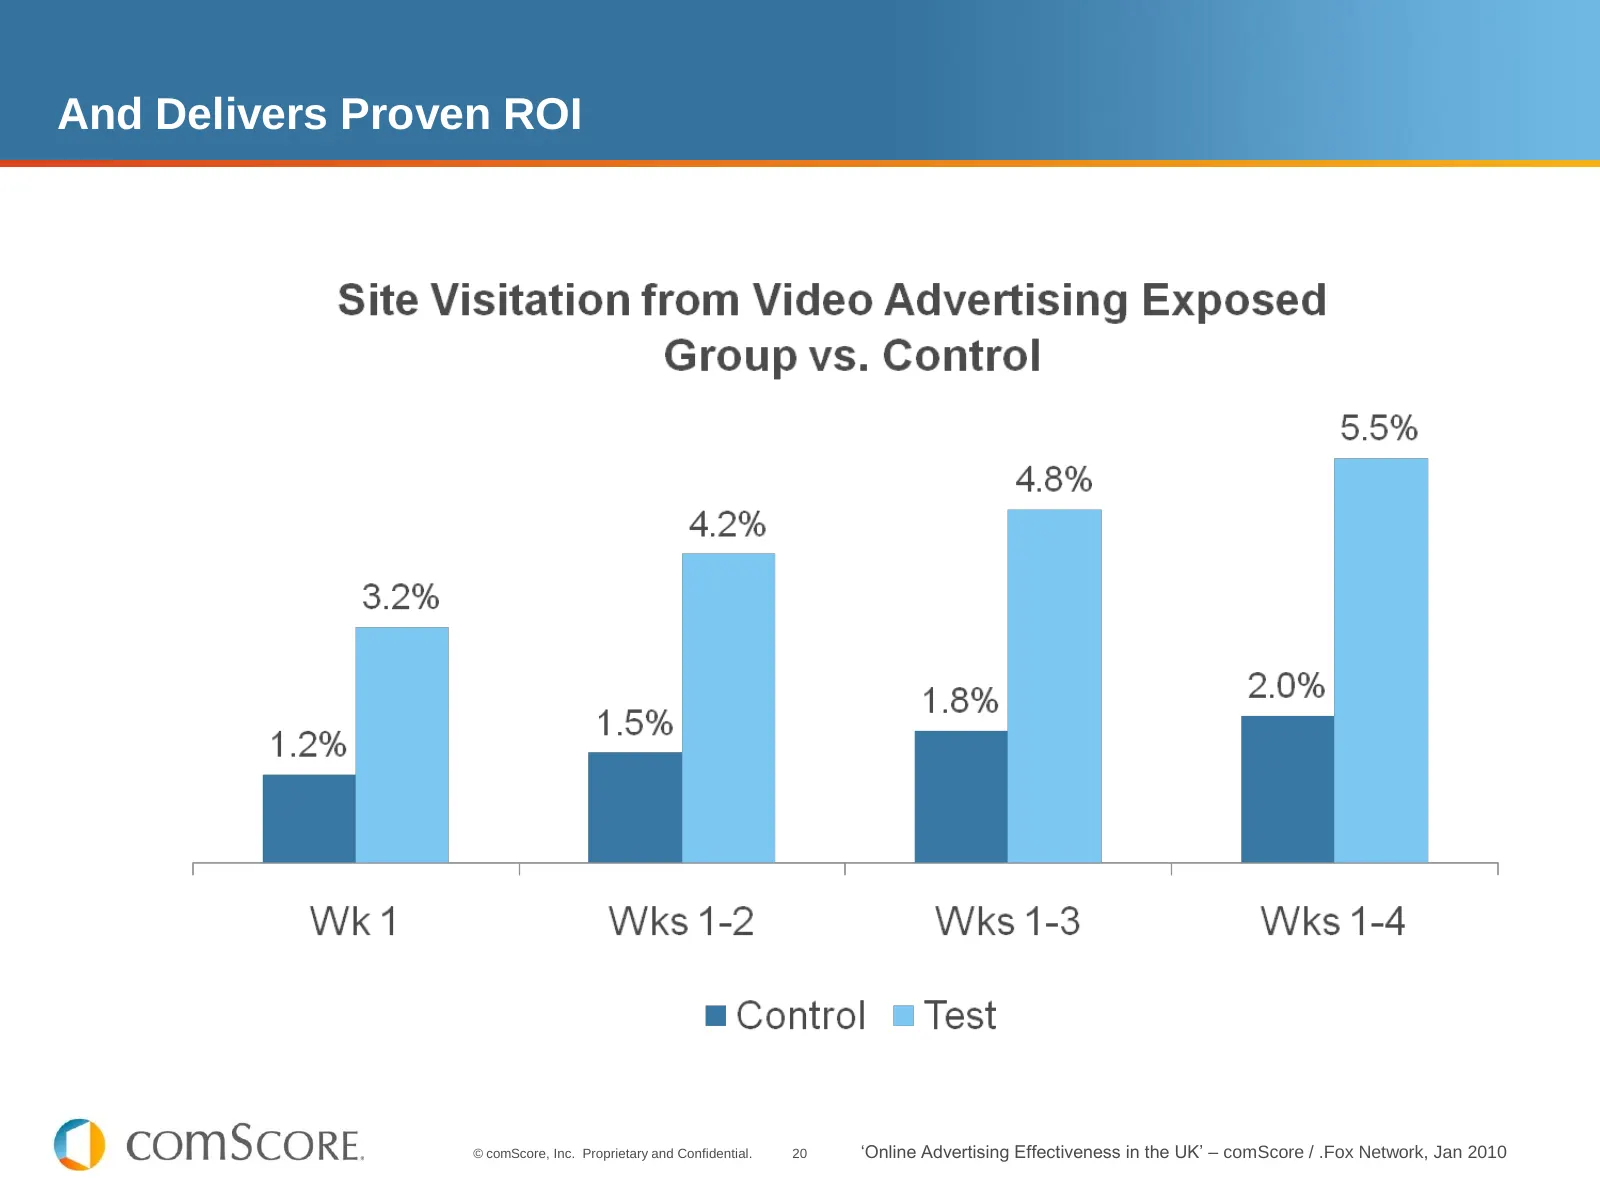
Slide 20: And Delivers Proven ROI
And Delivers Proven ROI © comScore, Inc. Proprietary and Confidential. 20 ‘Online Advertising Effectiveness in the UK’ – comScore / .Fox Network, Jan 2010
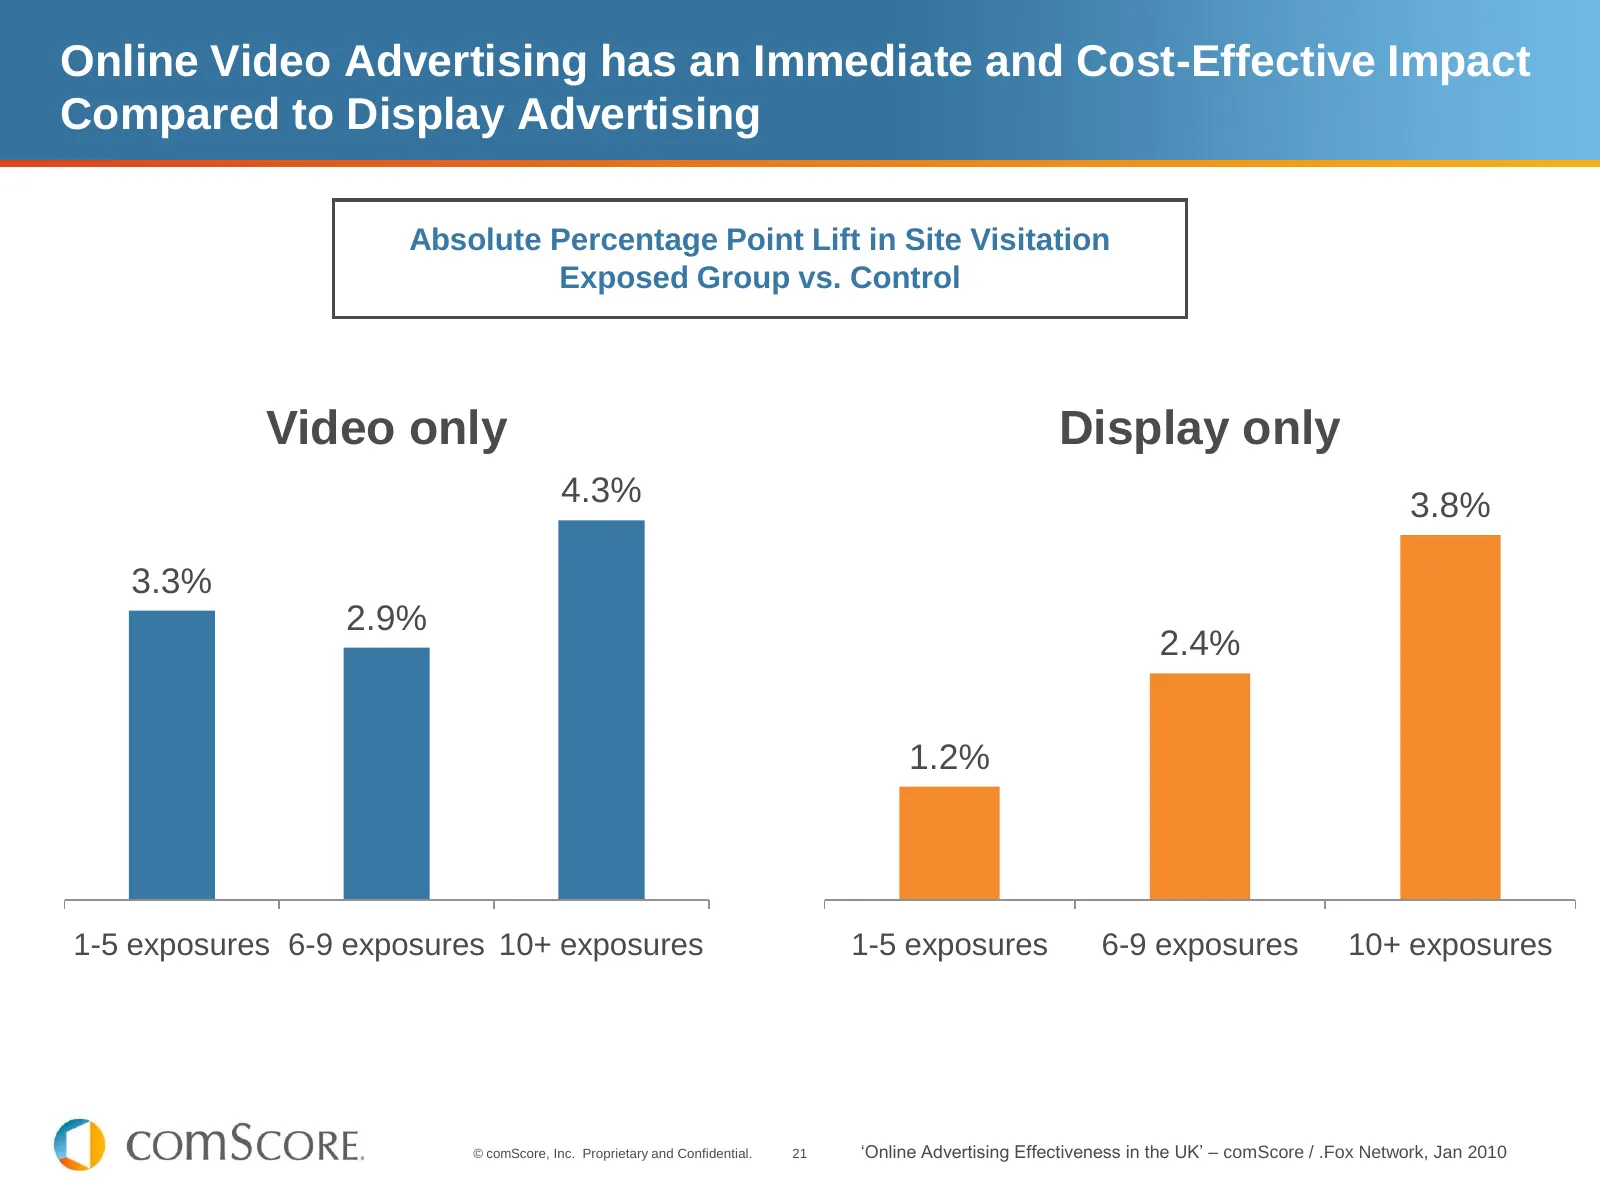
Slide 21: Online Video Advertising has an Immediate and Cost-Effective Impact
Online Video Advertising has an Immediate and Cost-Effective Impact Compared to Display Advertising Absolute Percentage Point Lift in Site Visitation Exposed Group vs. Control Video only Display only 4.3% 3.8% 3.3% 2.9% 2.4% 1.2% 1-5 exposures 6-9 exposures 10+ exposures 1-5 exposures 6-9 exposures
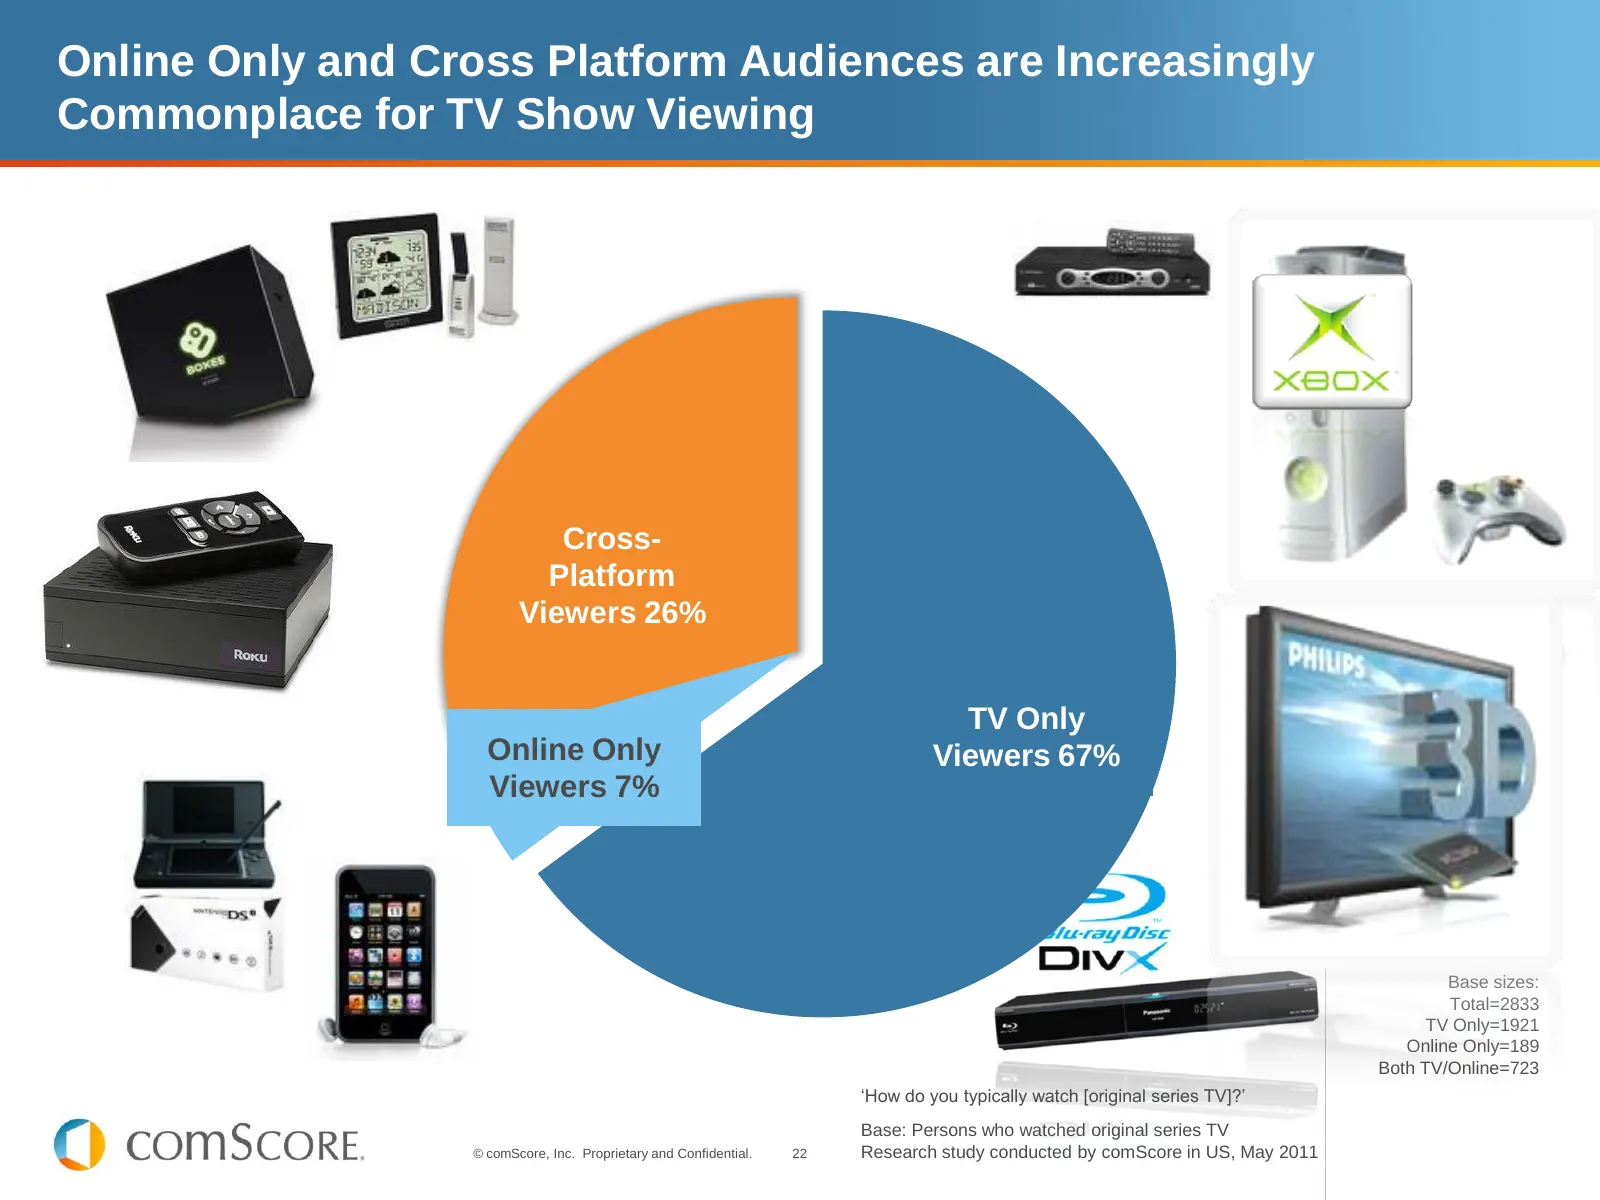
Slide 22: Online Only and Cross Platform Audiences are Increasingly Commonplace
Online Only and Cross Platform Audiences are Increasingly Commonplace for TV Show Viewing Online-Only Cross Platform 0 Viewers TV Viewers 29%0% 6% Cross Platform Cross- Viewers Platform 29% Viewers 26% TV Only TV-Only Viewers Online-Only Online Only Viewers 65%67% TVViewers Viewers7% 6% Base sizes:
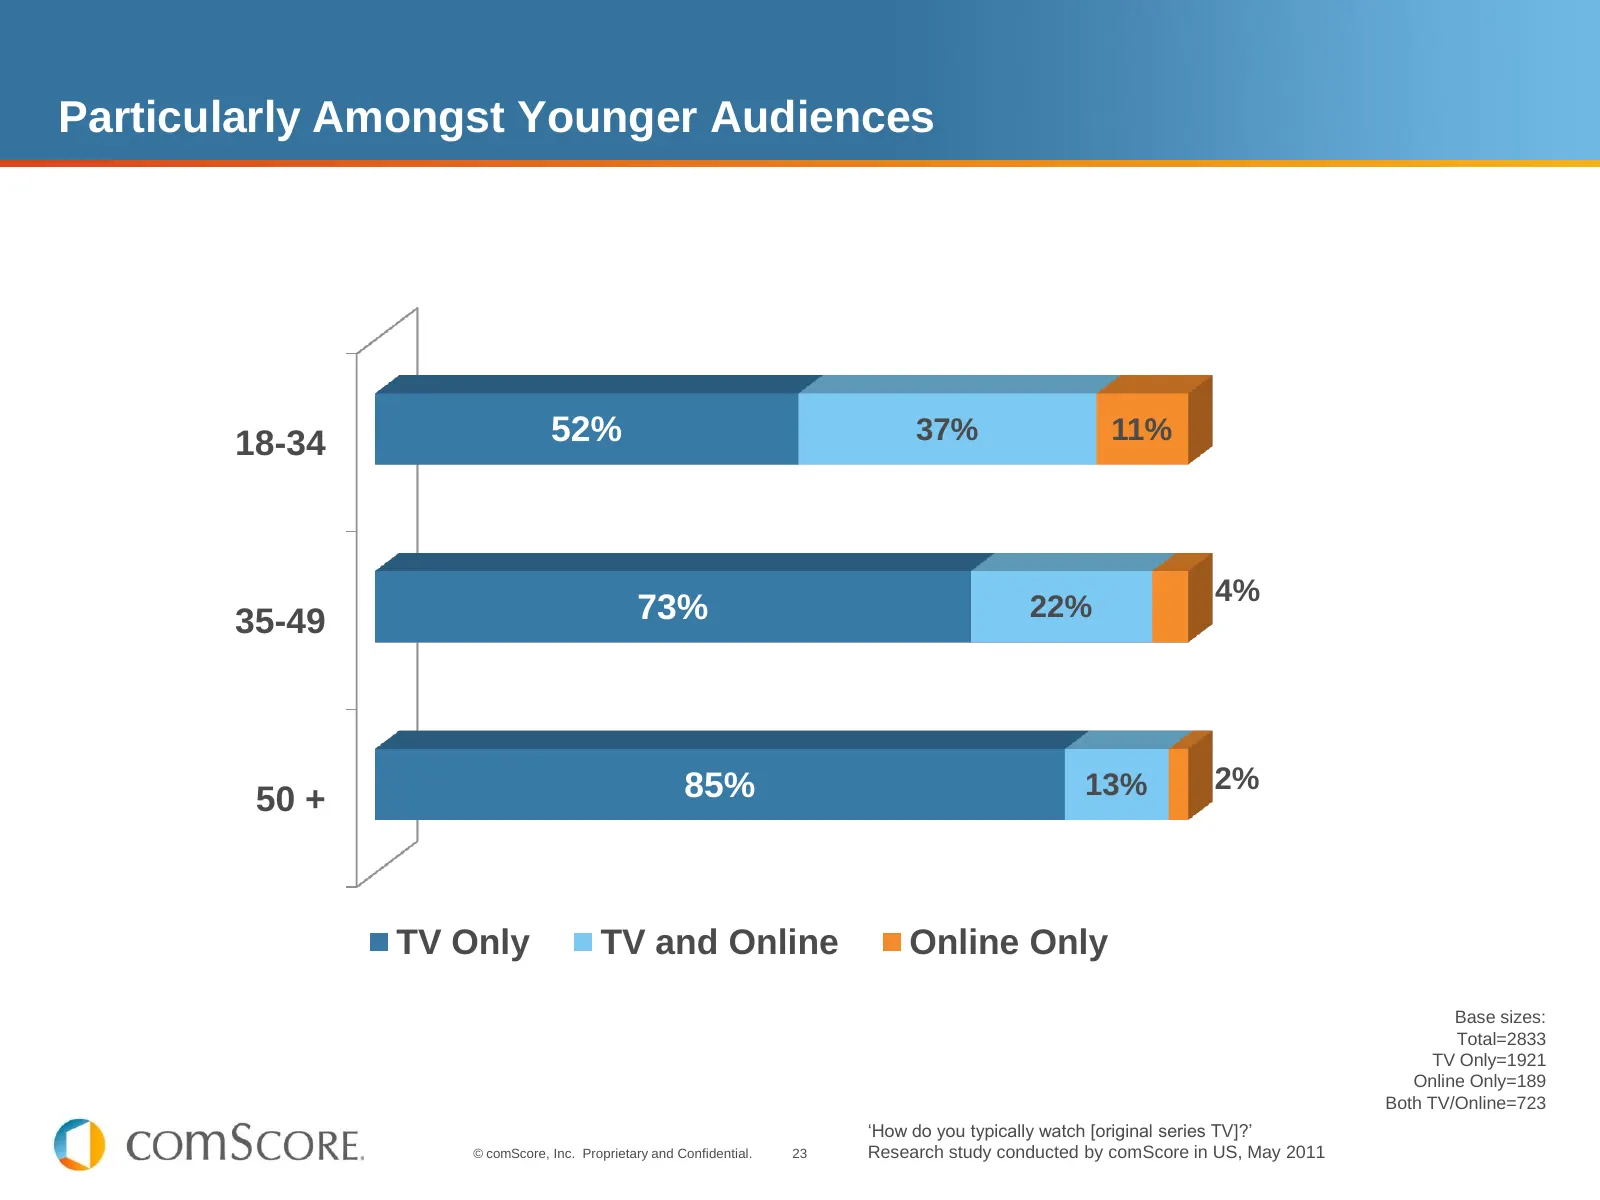
Slide 23: Particularly Amongst Younger Audiences
Particularly Amongst Younger Audiences 18-34 52% 37% 11% 4% 35-49 73% 22% 85% 13% 2% 50 + TV Only TV and Online Online Only Base sizes: Total=2833 TV Only=1921 Online Only=189 Both TV/Online=723 ‘How do you typically watch [original series TV]?’ © comScore, Inc. Proprietary and Confidential. 23 Rese
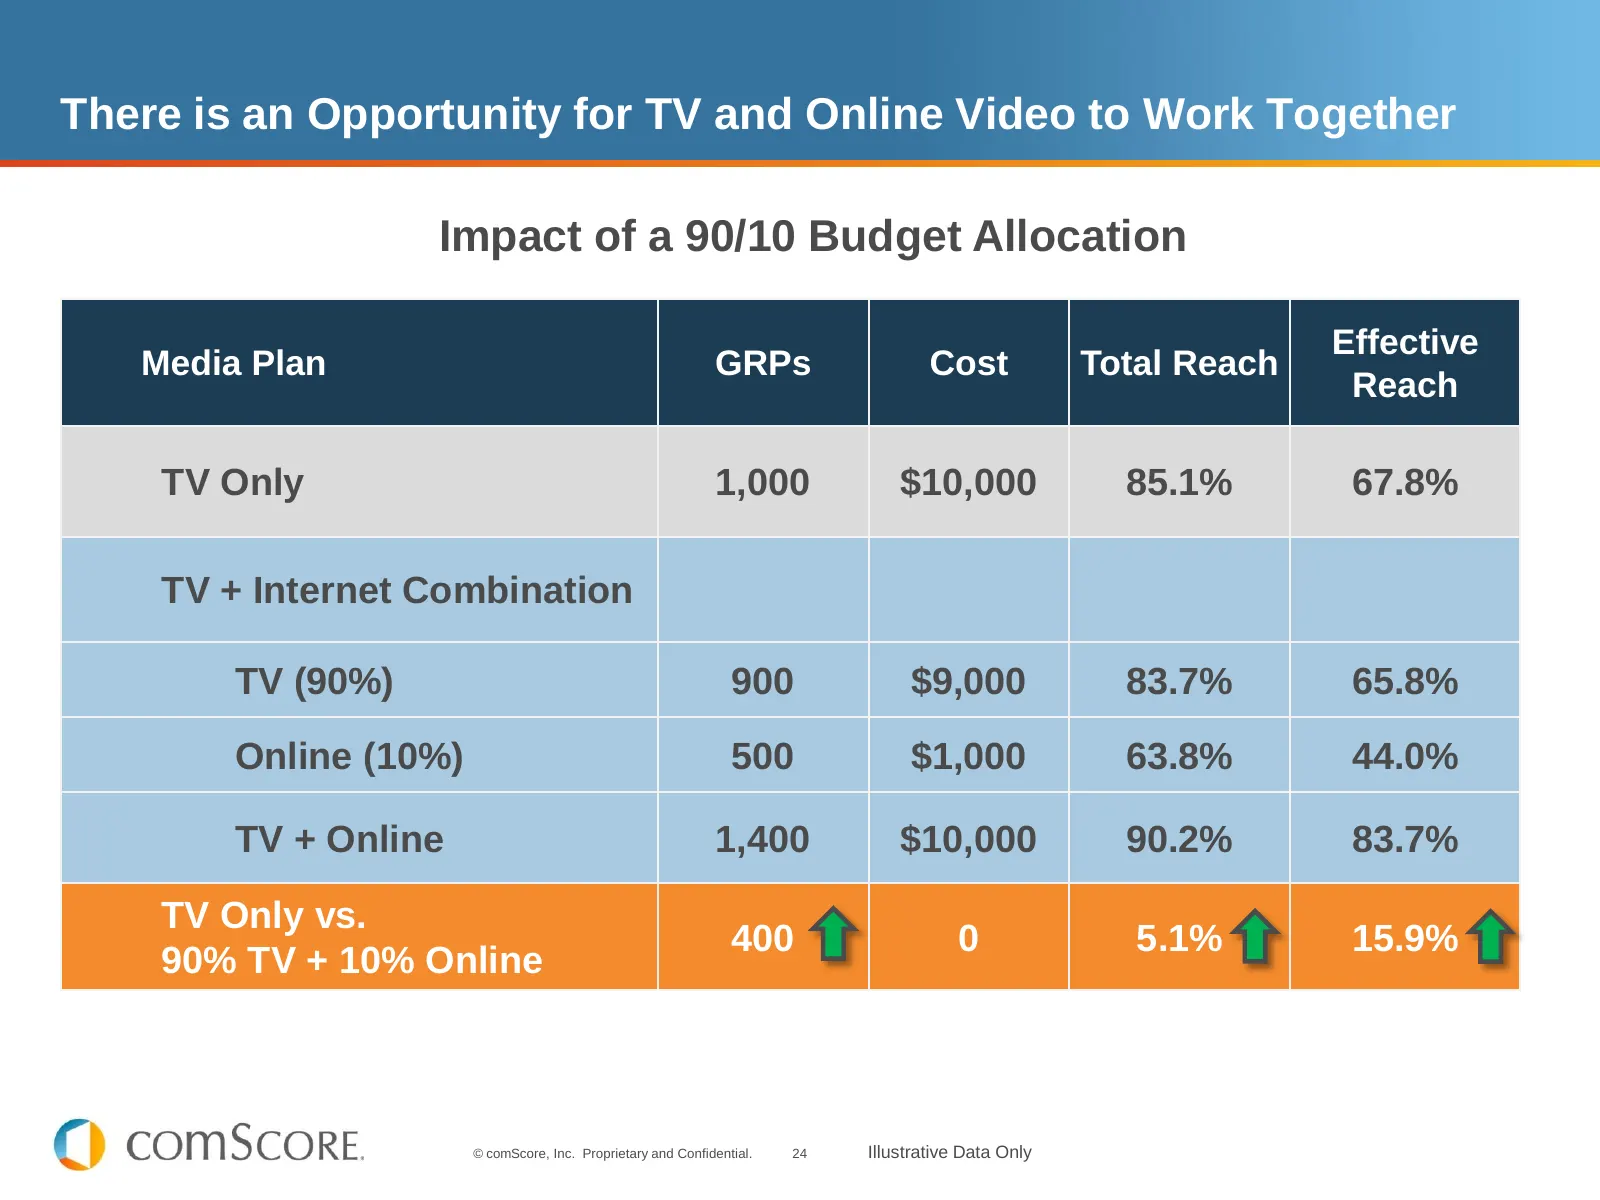
Slide 24: There is an Opportunity for TV and Online Video to Work Together
There is an Opportunity for TV and Online Video to Work Together Impact of a 90/10 Budget Allocation Effective Media Plan GRPs Cost Total Reach Reach TV Only 1,000 $10,000 85.1% 67.8% TV + Internet Combination TV (90%) 900 $9,000 83.7% 65.8% Online (10%) 500 $1,000 63.8% 44.0% TV + Online 1,400 $10,
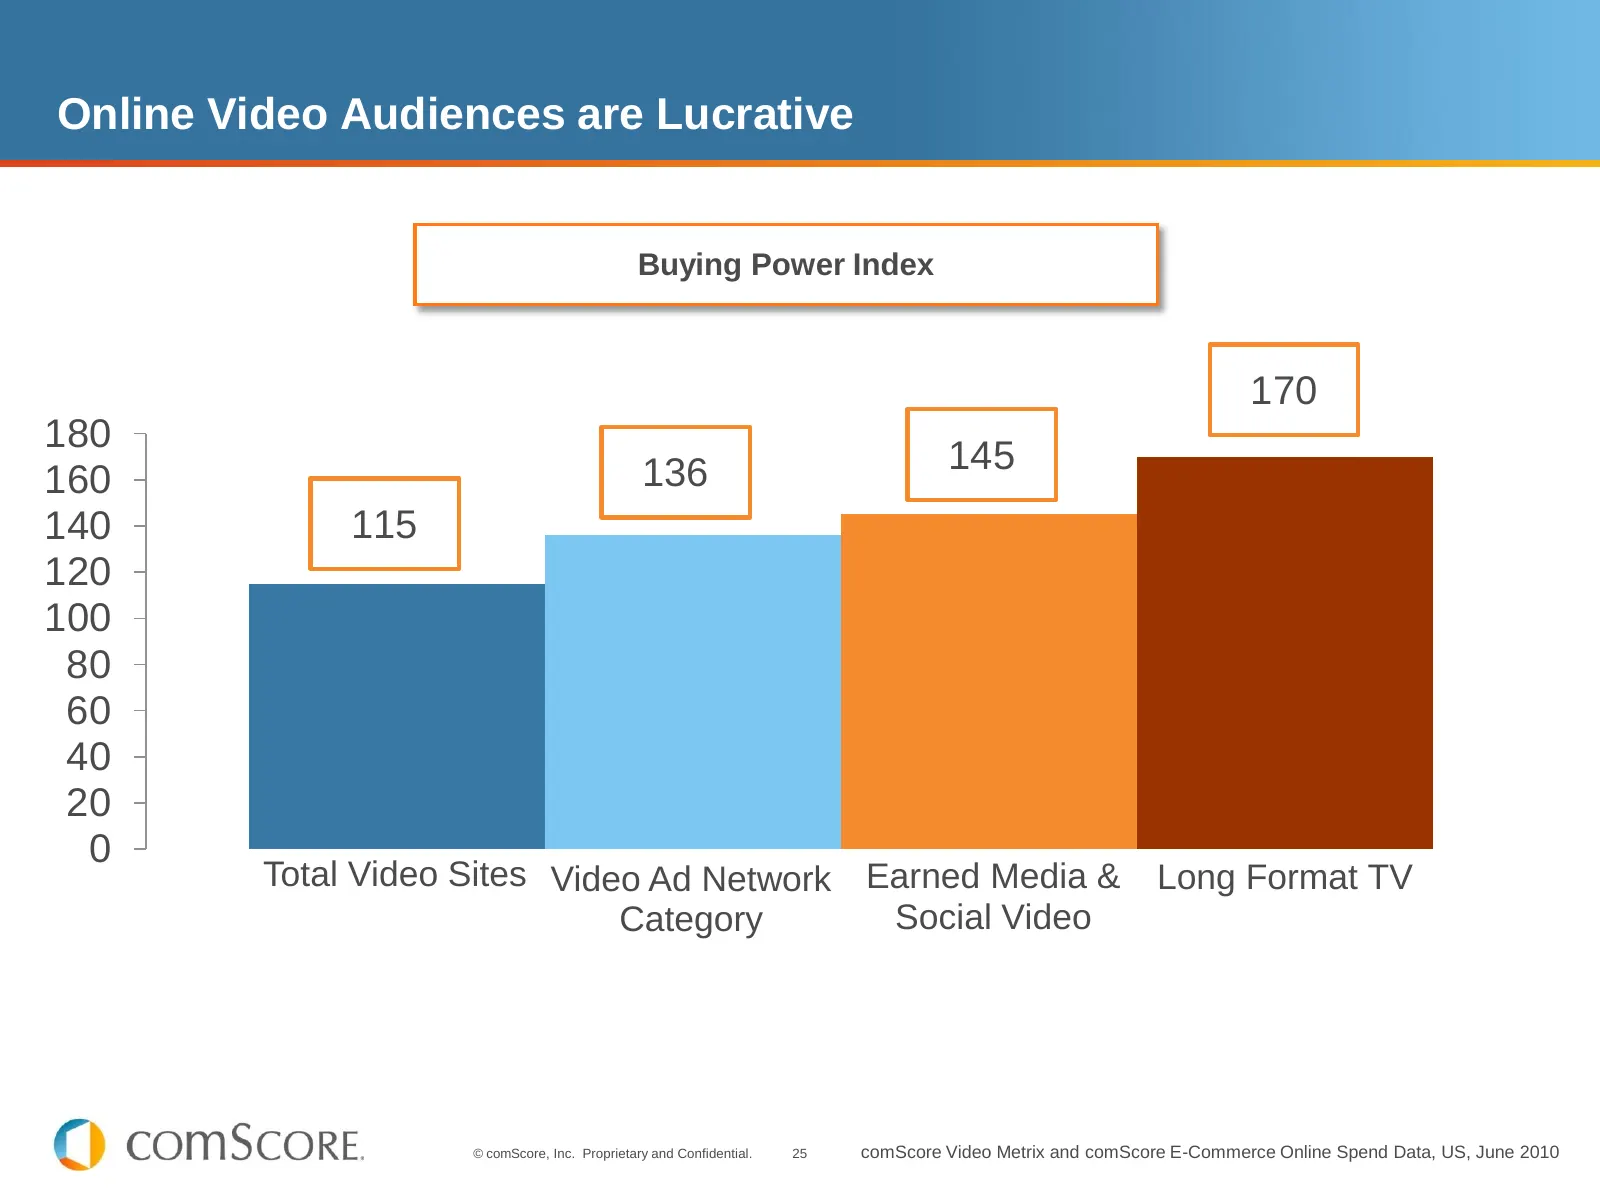
Slide 25: Online Video Audiences are Lucrative
Online Video Audiences are Lucrative Buying Power Index 170 180 136 145 160 140 115 120 100 80 60 40 20 0 Total Video Sites Video Ad Network Earned Media & Long Format TV Category Social Video © comScore, Inc. Proprietary and Confidential. 25 comScore Video Metrix and comScore E-Commerce Online Spen
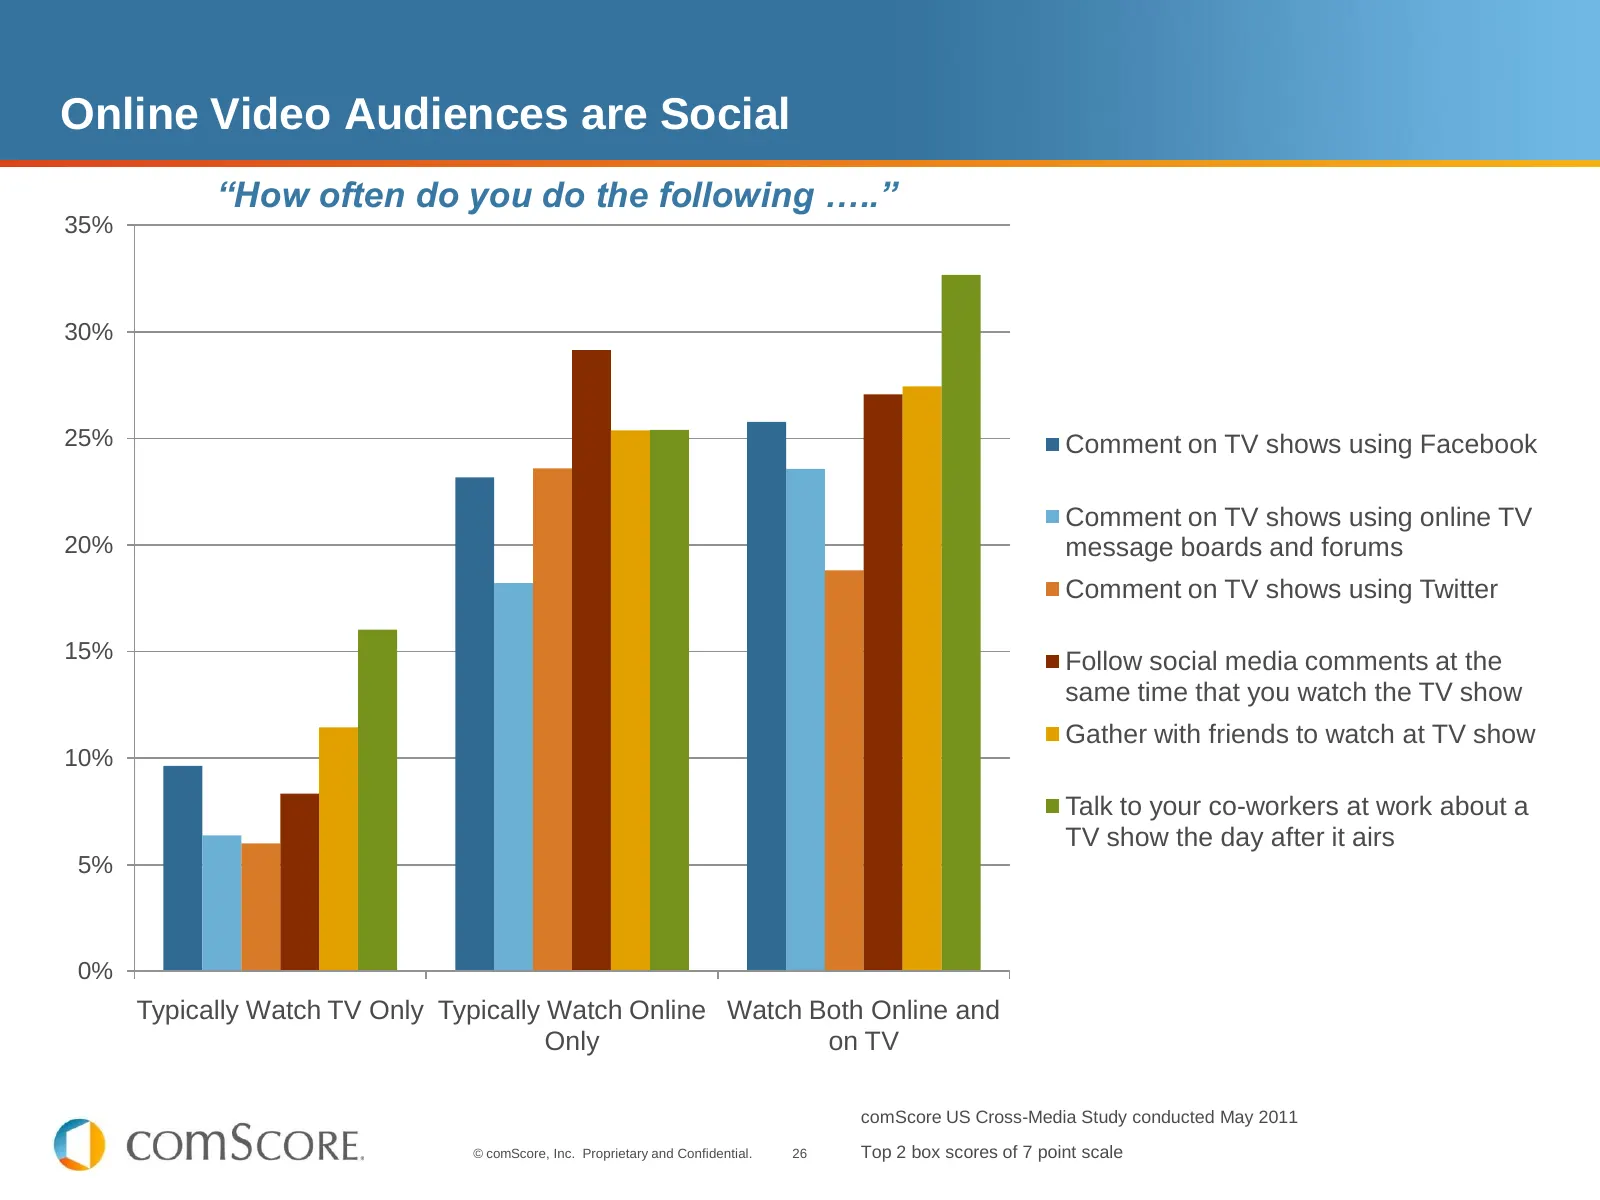
Slide 26: Online Video Audiences are Social
Online Video Audiences are Social “How often do you do the following …..” 35% 30% 25% Comment on TV shows using Facebook Comment on TV shows using online TV 20% message boards and forums Comment on TV shows using Twitter 15% Follow social media comments at the same time that you watch the TV show Ga
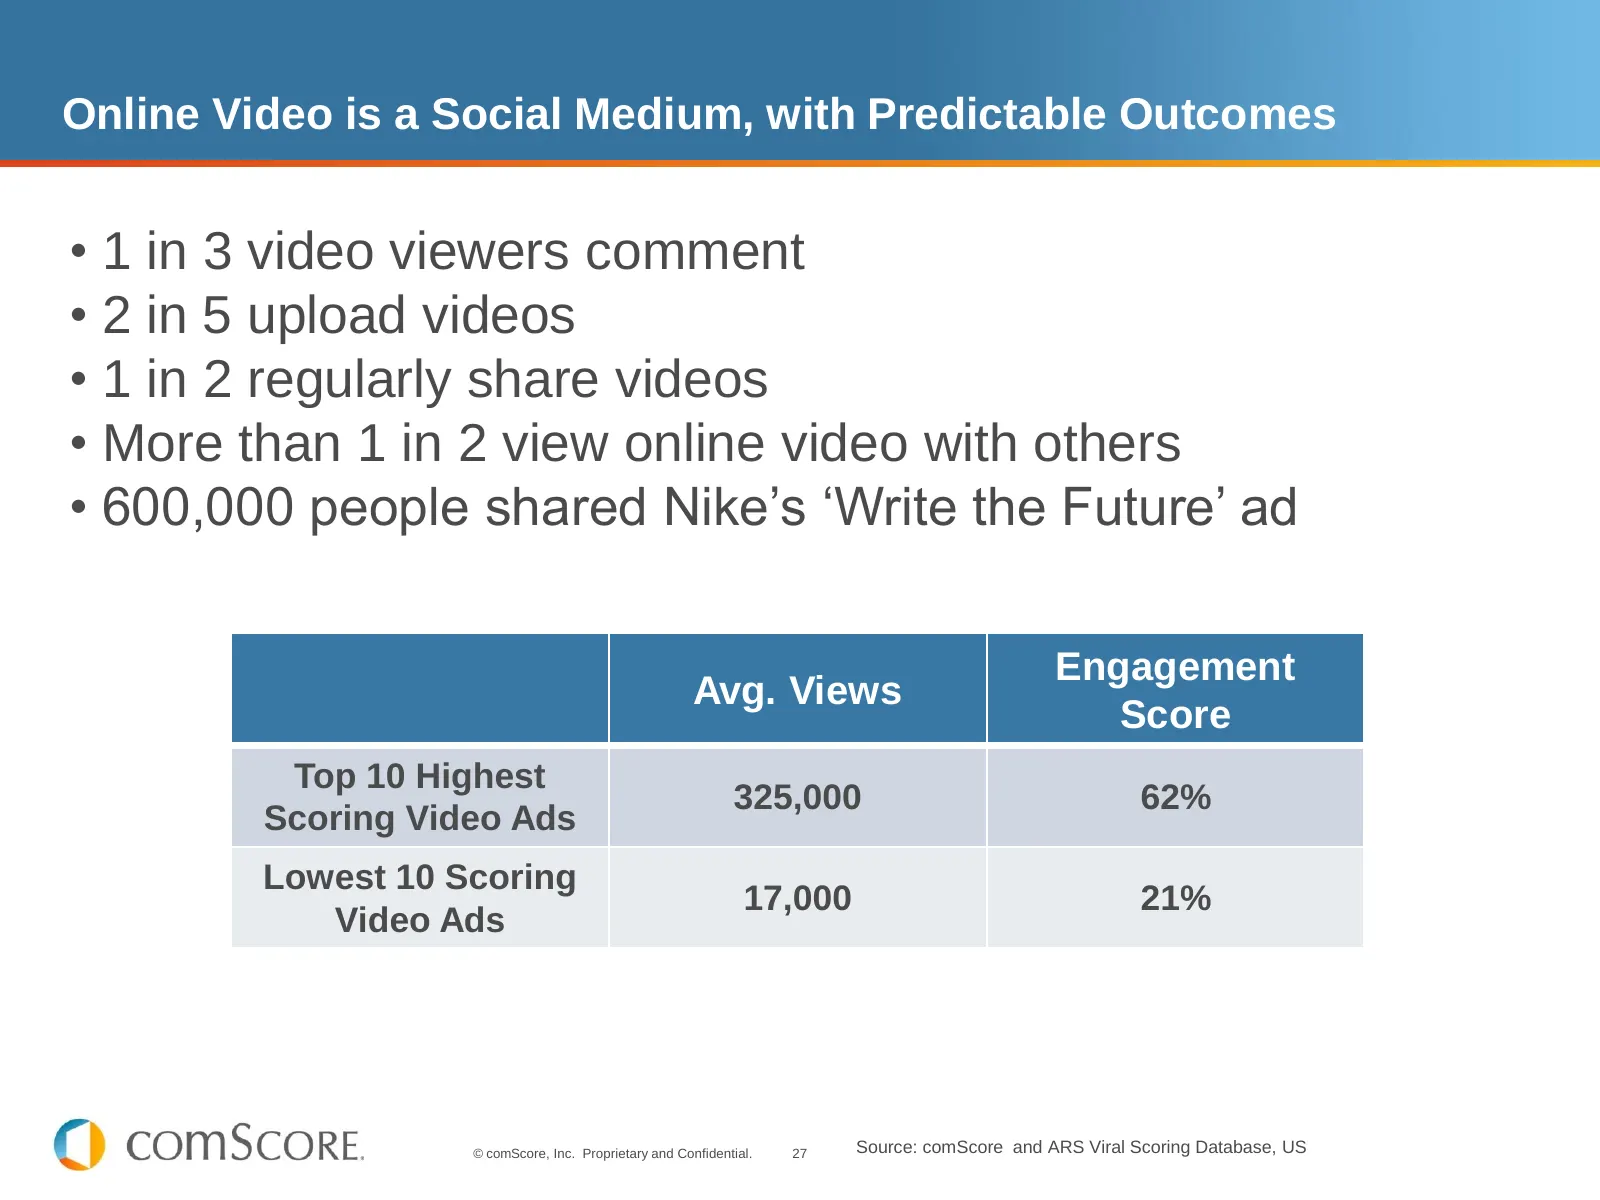
Slide 27: Online Video is a Social Medium, with Predictable Outcomes
Online Video is a Social Medium, with Predictable Outcomes • 1 in 3 video viewers comment • 2 in 5 upload videos • 1 in 2 regularly share videos • More than 1 in 2 view online video with others • 600,000 people shared Nike’s ‘Write the Future’ ad Engagement Avg. Views Score Top 10 Highest 325,000 62
Slide 28: Understanding Online Video: The Value of Transparency
Understanding Online Video The Value of Transparency © comScore, Inc. Proprietary and Confidential. 28
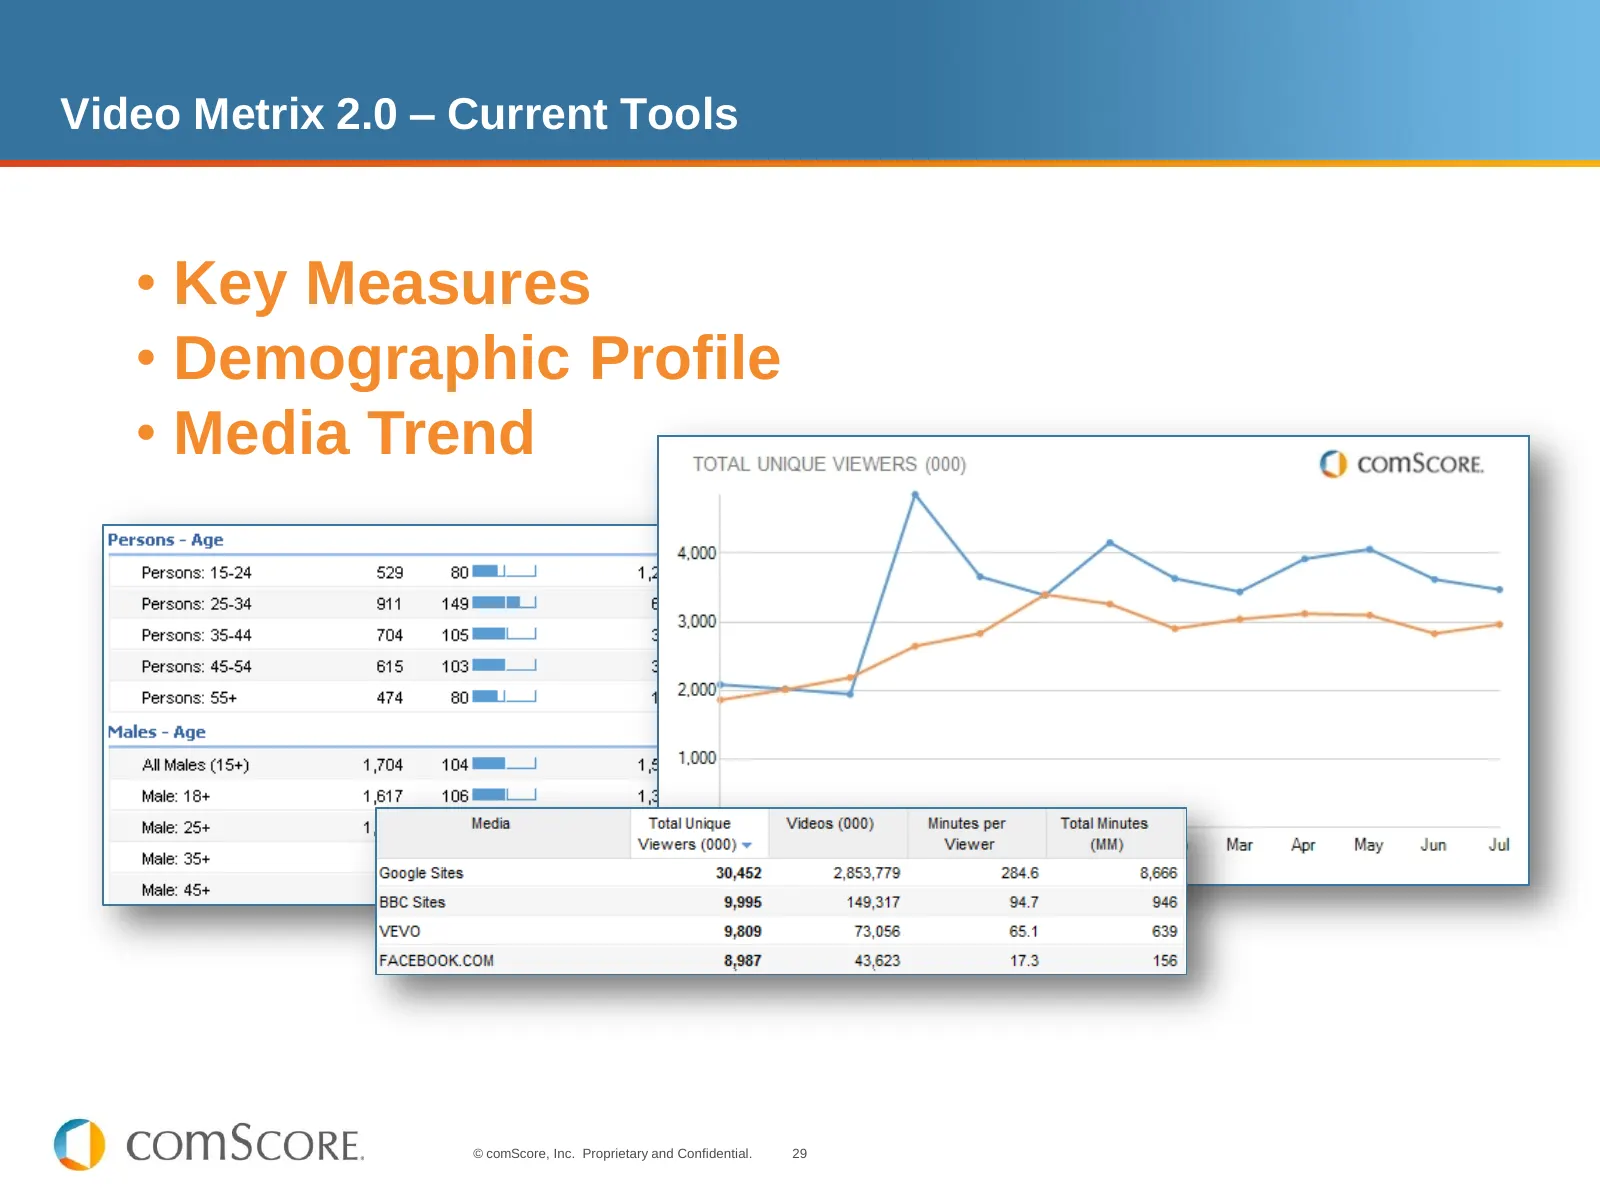
Slide 29: Video Metrix 2.0 – Current Tools
Video Metrix 2.0 – Current Tools • Key Measures • Demographic Profile • Media Trend © comScore, Inc. Proprietary and Confidential. 29
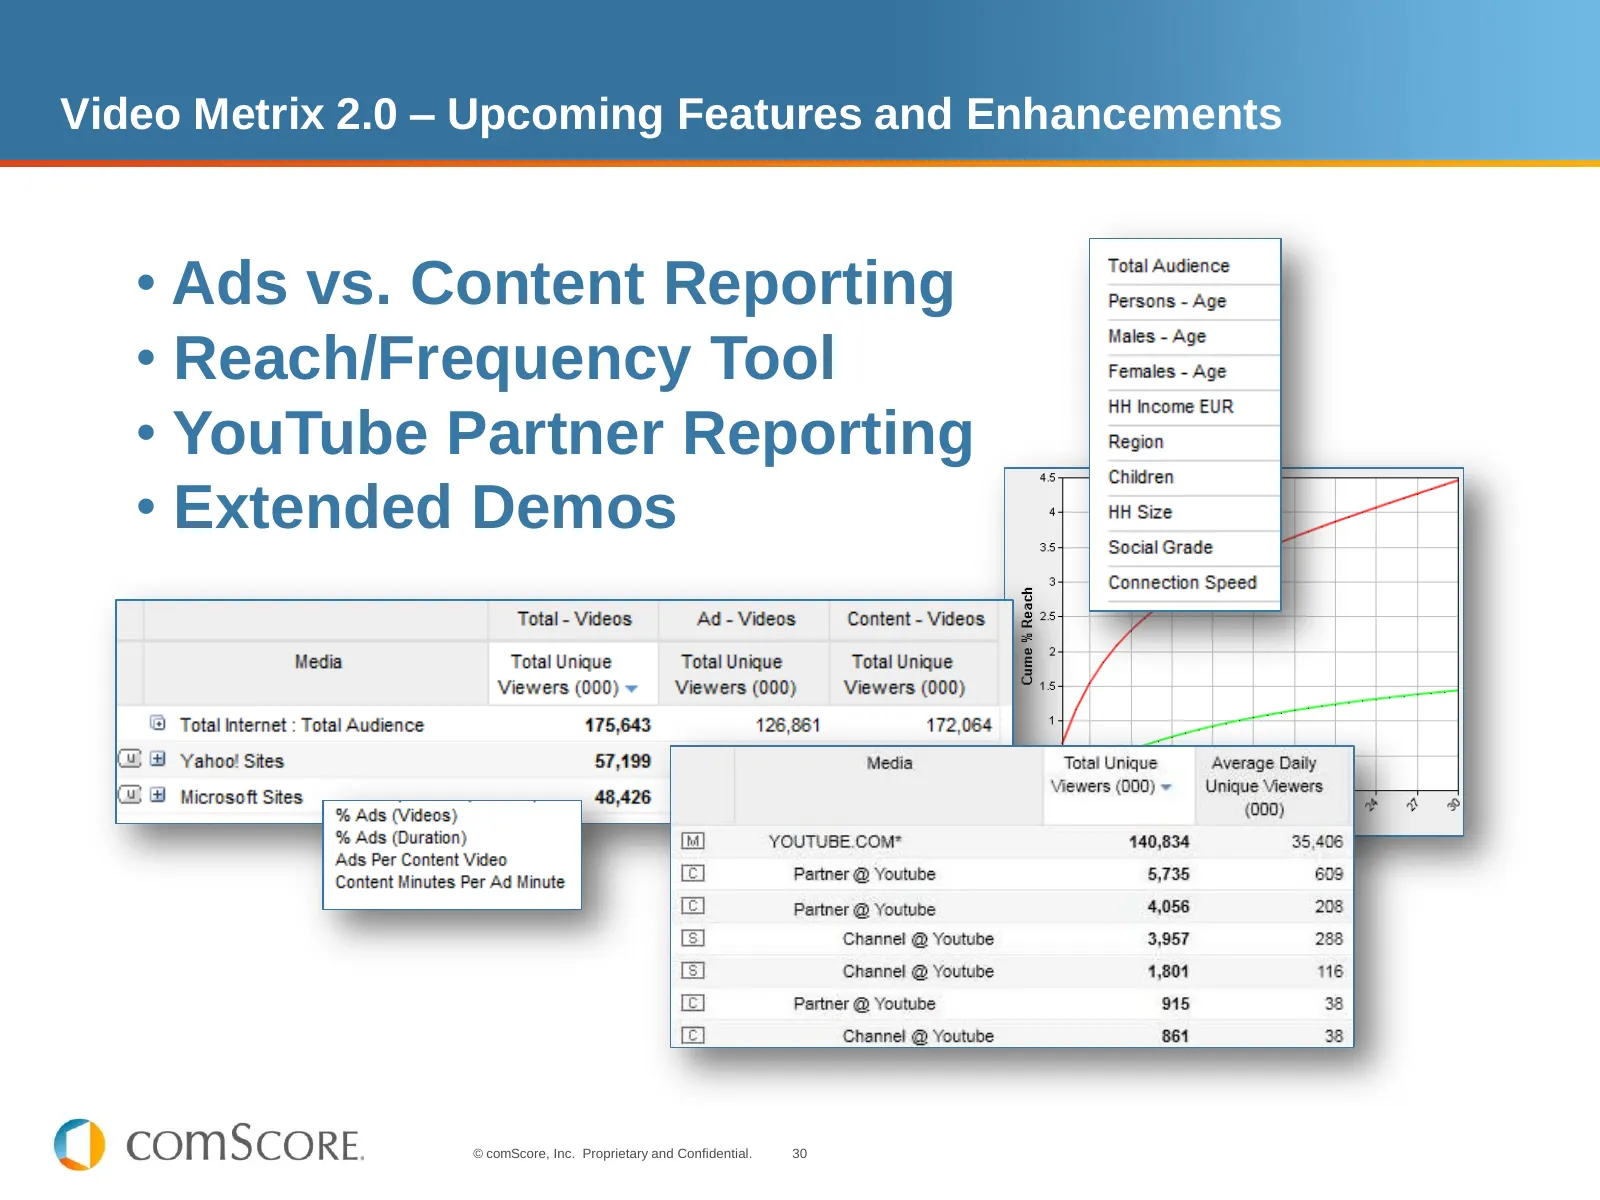
Slide 30: Video Metrix 2.0 – Upcoming Features and Enhancements
Video Metrix 2.0 – Upcoming Features and Enhancements • Ads vs. Content Reporting • Reach/Frequency Tool • YouTube Partner Reporting • Extended Demos © comScore, Inc. Proprietary and Confidential. 30
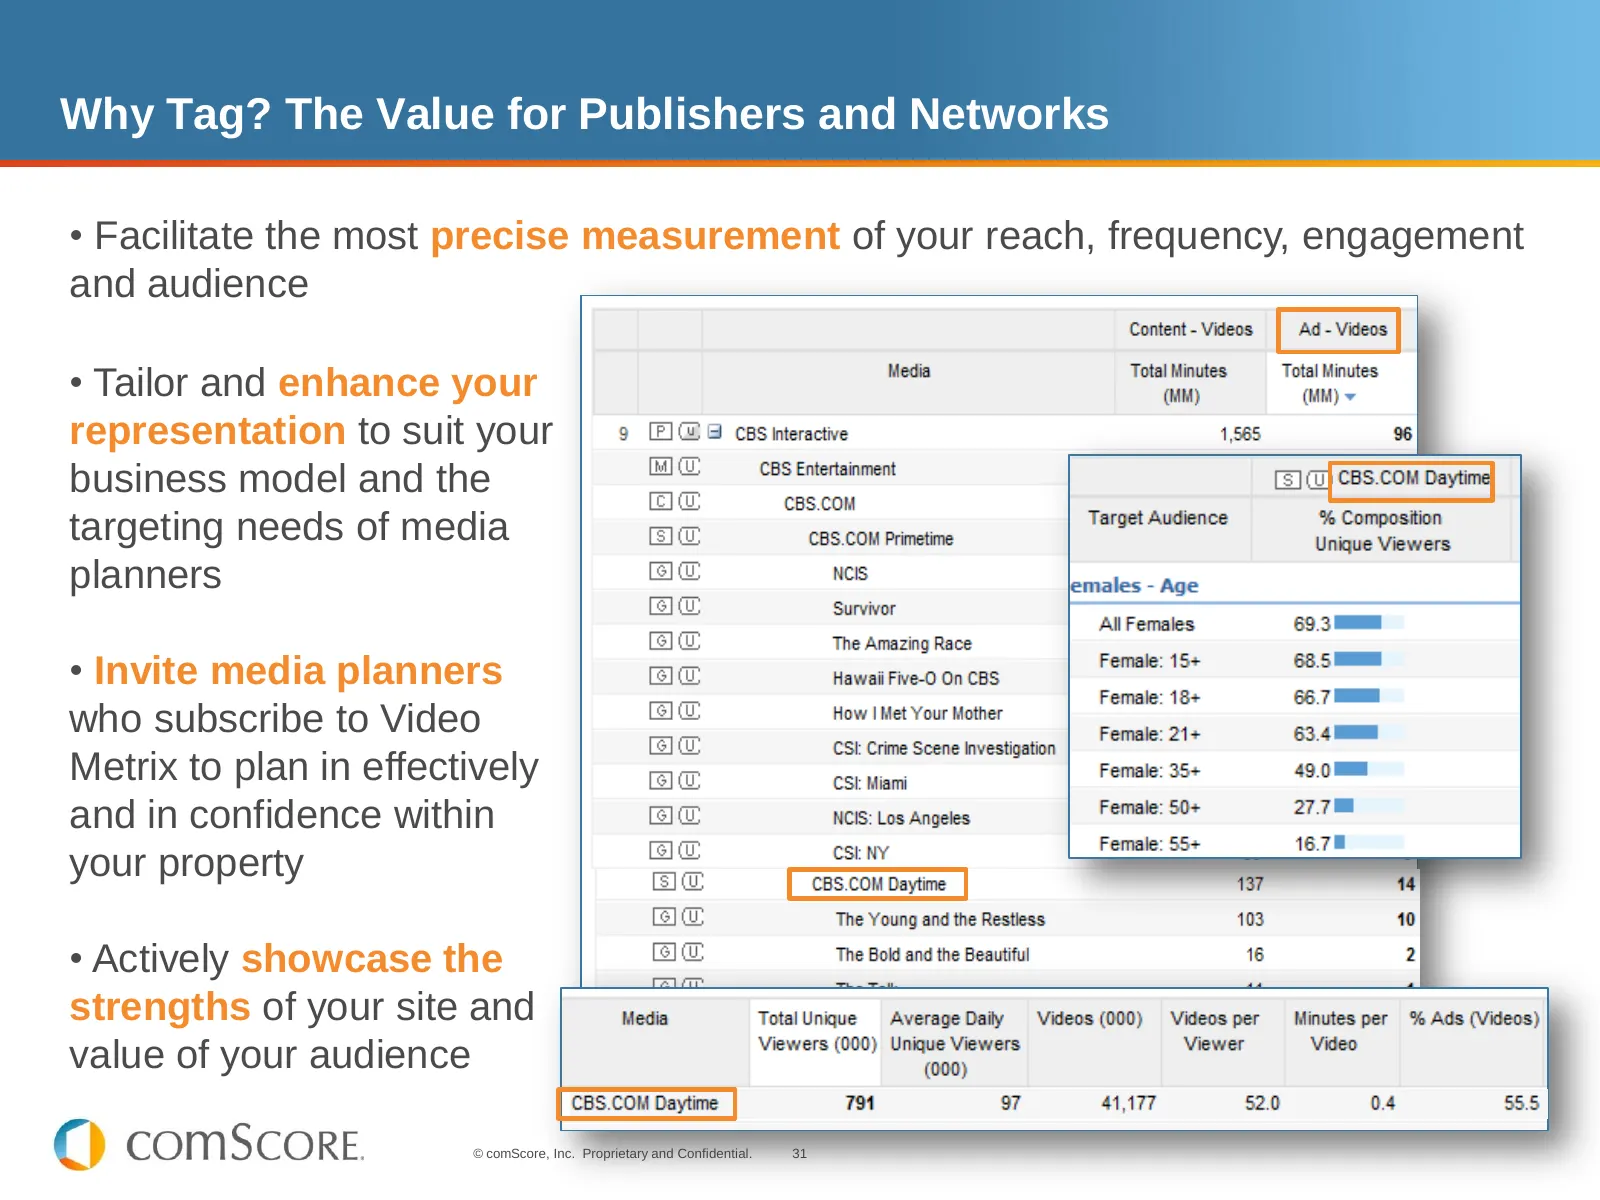
Slide 31: Why Tag? The Value for Publishers and Networks
Why Tag? The Value for Publishers and Networks • Facilitate the most precise measurement of your reach, frequency, engagement and audience • Tailor and enhance your representation to suit your business model and the targeting needs of media planners • Invite media planners who subscribe to Video Met
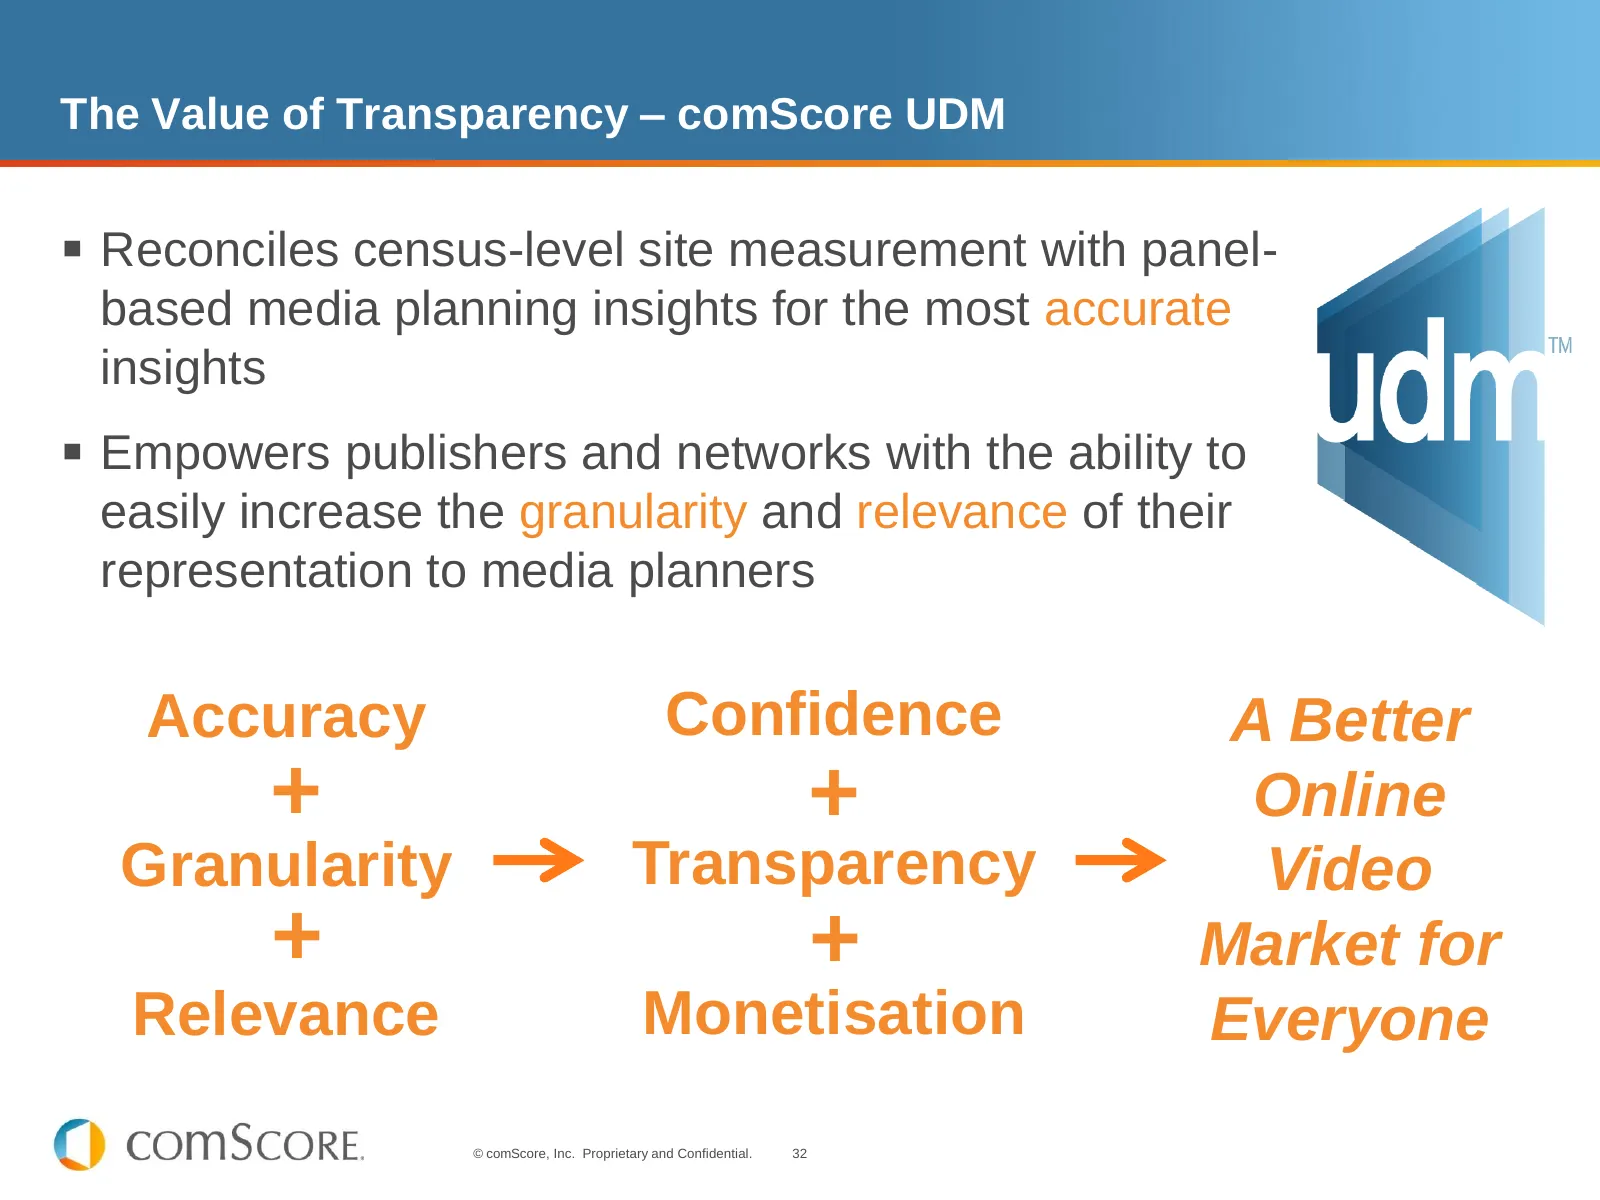
Slide 32: The Value of Transparency – comScore UDM
The Value of Transparency – comScore UDM Reconciles census-level site measurement with panel- based media planning insights for the most accurate insights Empowers publishers and networks with the ability to easily increase the granularity and relevance of their representation to media planners
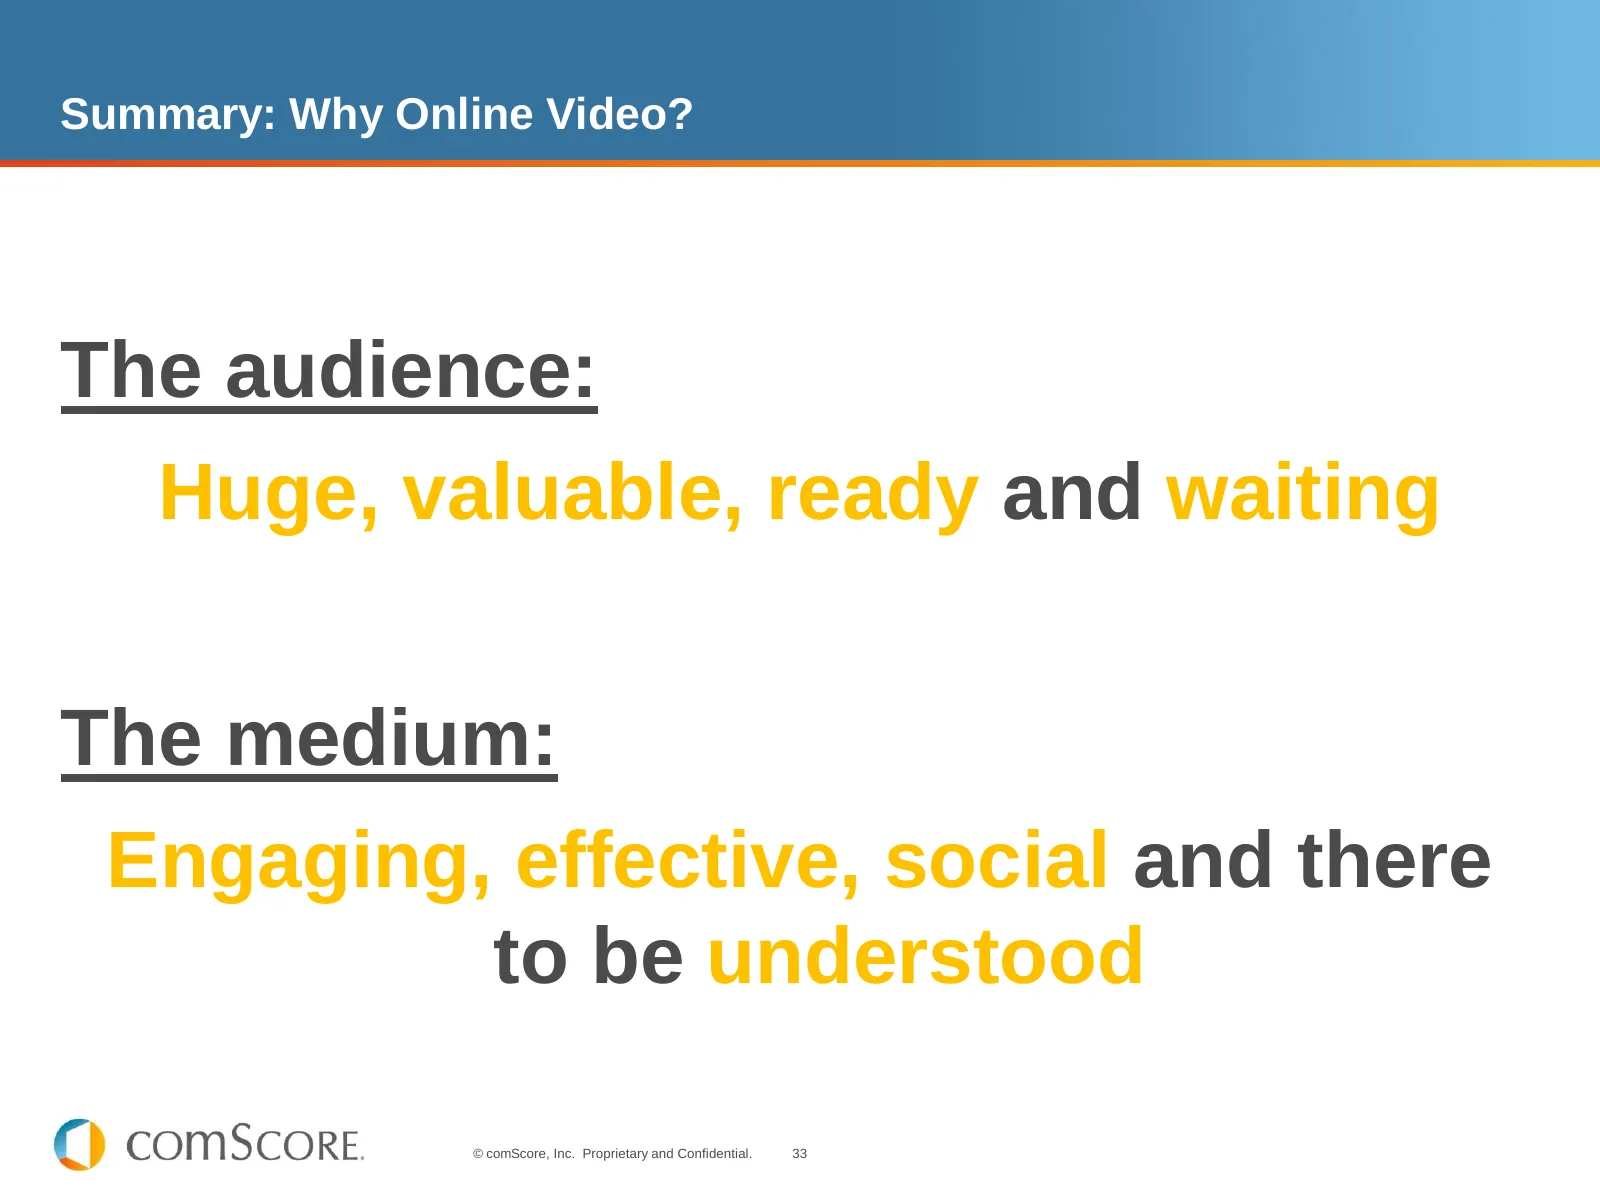
Slide 33: Summary: Why Online Video?
Summary: Why Online Video? The audience: Huge, valuable, ready and waiting The medium: Engaging, effective, social and there to be understood © comScore, Inc. Proprietary and Confidential. 33

Slide 34: Thank You! Questions?
Thank You! Questions? © comScore, Inc. Proprietary and Confidential. 34
Source: Internet Archive copy of comscore.com
More decks from comScore, Inc.
 Q3 2026 Earnings Presentation17 slides · Nov 3, 2026
 Q2 2026 Earnings Presentation20 slides · Aug 12, 2026
 Investor Presentation (June 2026)27 slides · Jun 10, 2026
 Q4 2025 Earnings Presentation13 slides · Mar 17, 2026
 Q3 2025 Earnings Presentation15 slides · Nov 4, 2025
 Q2 2025 Earnings Presentation11 slides · Aug 5, 2025