Hitron Technologies Inc. · TWSE:2419
Hitron Technologies — Hitron Investor Conference (February 2026)
14 slides from Hitron Technologies's conference presentation, Feb 26, 2026

Slide 1: Hitron Investor Conference
Hitron Investor Conference TWSE Stock Code : 2419 Feb 26, 2026
Slide 2: Agenda
• Business Outlook • 2025 Fiscal Year Financial Result • New Product Status & Market Strategy • Q&A
Slide 3: Disclaimer
Disclaimer This presentation may contain forward-looking based on current assumption and forecasts made by Hitrontech management. Various known and unknown risk, uncertainties and other factors could lead to material differences between the actual future result, financial situation, development or p

Slide 4: Business Outlook
Business Outlook
Slide 5: Successful Transformation in 2025
Successful Transformation in 2025 • Transforming to Data Center / AI Data Center 1.6T liquid cooling system • Integration of Hitron manufacturing facility enhanced operation efficiency • Launch of India new business • New business in US will be the momentum for 2026 2H 5
Slide 6: Constant Growth in 2026
Constant Growth in 2026 • 1.6T AI Data Center Switch continues to advance • Optimize product launch cadence to secure 2026 2H growth momentum • Smooth supply chain and material control, increase capabilities for Made in US • Speed up LBR(Licensed Band Radio)solution 6
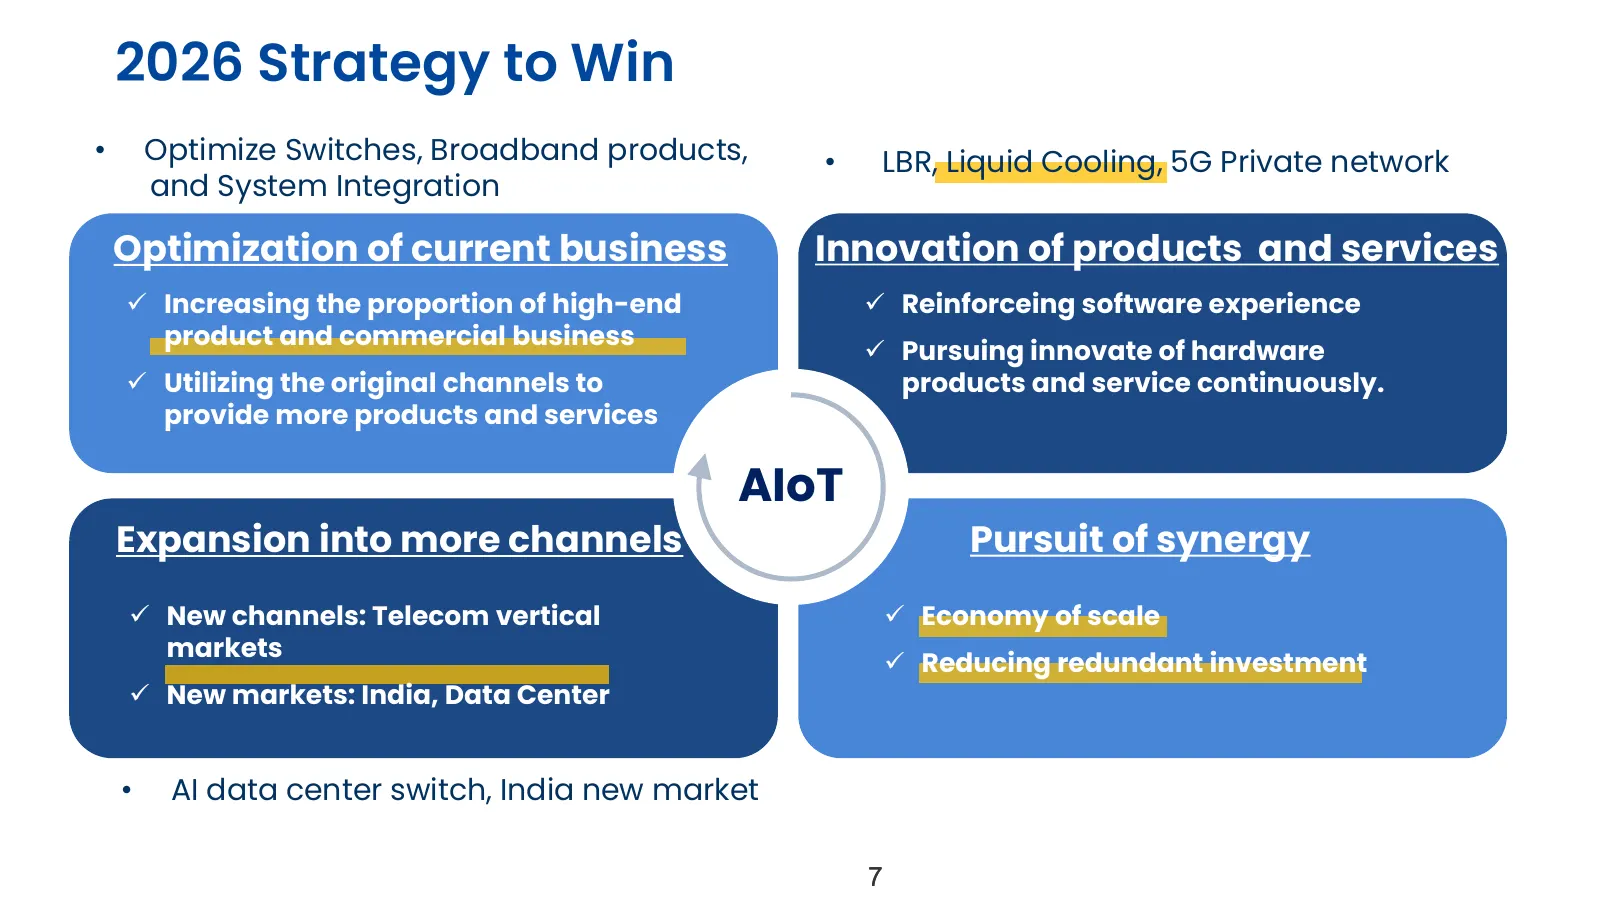
Slide 7: 2026 Strategy to Win
2026 Strategy to Win • Optimize Switches, Broadband products, • LBR, Liquid Cooling, 5G Private network and System Integration Optimization of current business Innovation of products and services ✓ Increasing the proportion of high-end ✓ Reinforceing software experience product and commercial busine
Slide 8: 2025 Q4 Finance Statement
2025 Q4 Finance Statement <hitron
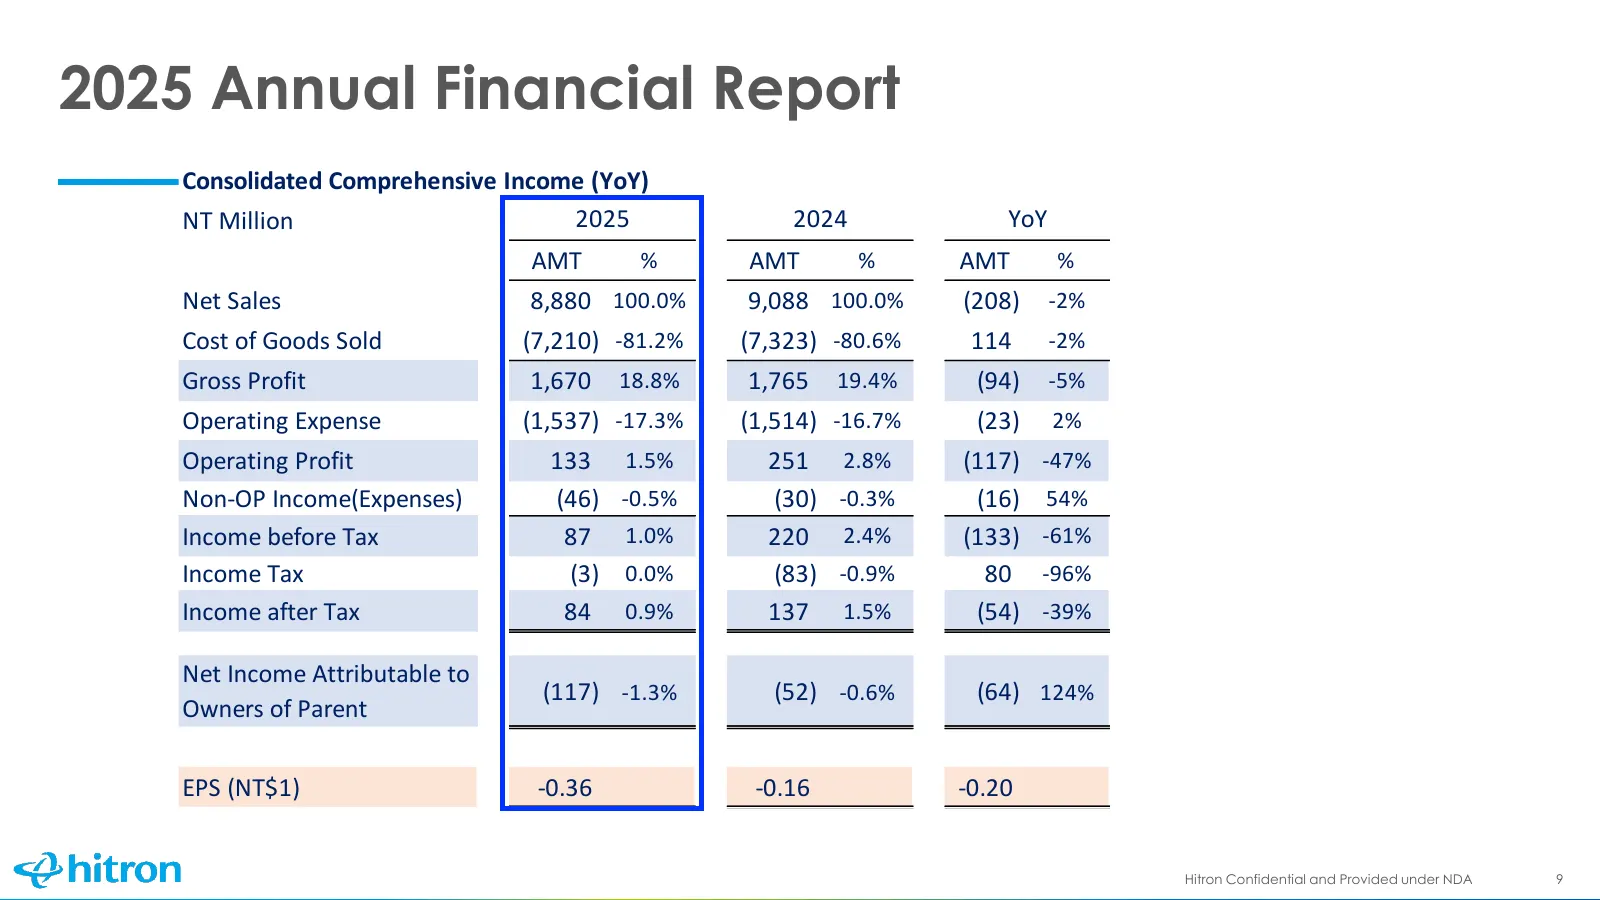
Slide 9: 2025 Annual Financial Report
2025 Annual Financial Report Consolidated Comprehensive Income (YoY) NT Million 2025 2024 YoY AMT % AMT % AMT % Net Sales 8,880 100.0% 9,088 100.0% (208) -2% Cost of Goods Sold (7,210) -81.2% (7,323) -80.6% 114 -2% Gross Profit 1,670 18.8% 1,765 19.4% (94) -5% Operating Expense (1,537) -17.3% (1,514
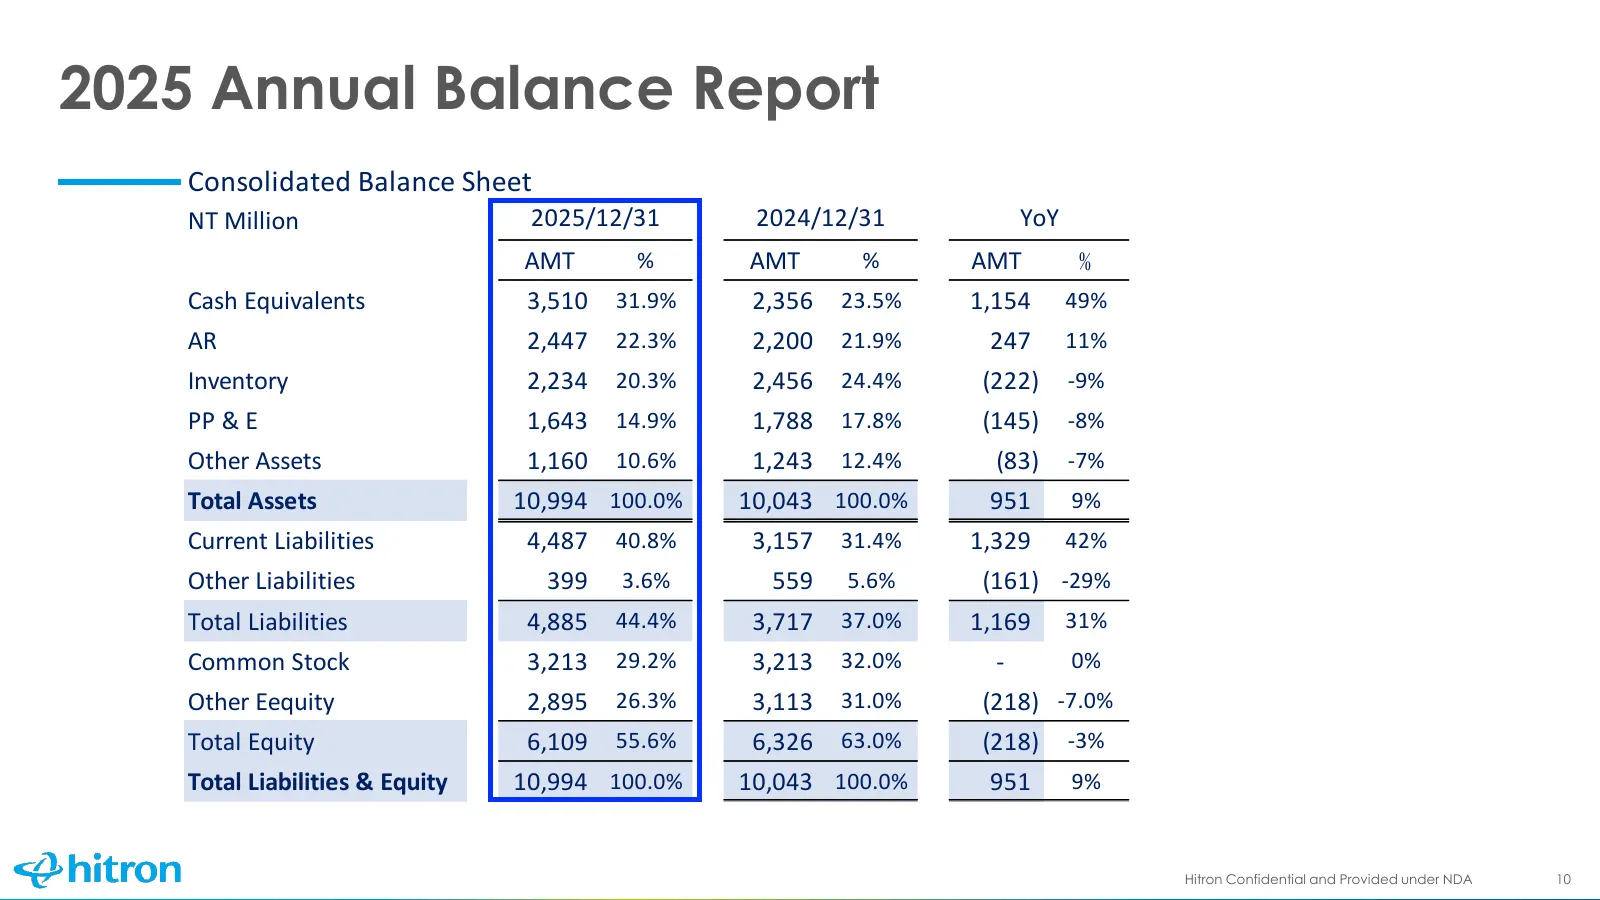
Slide 10: 2025 Annual Balance Report
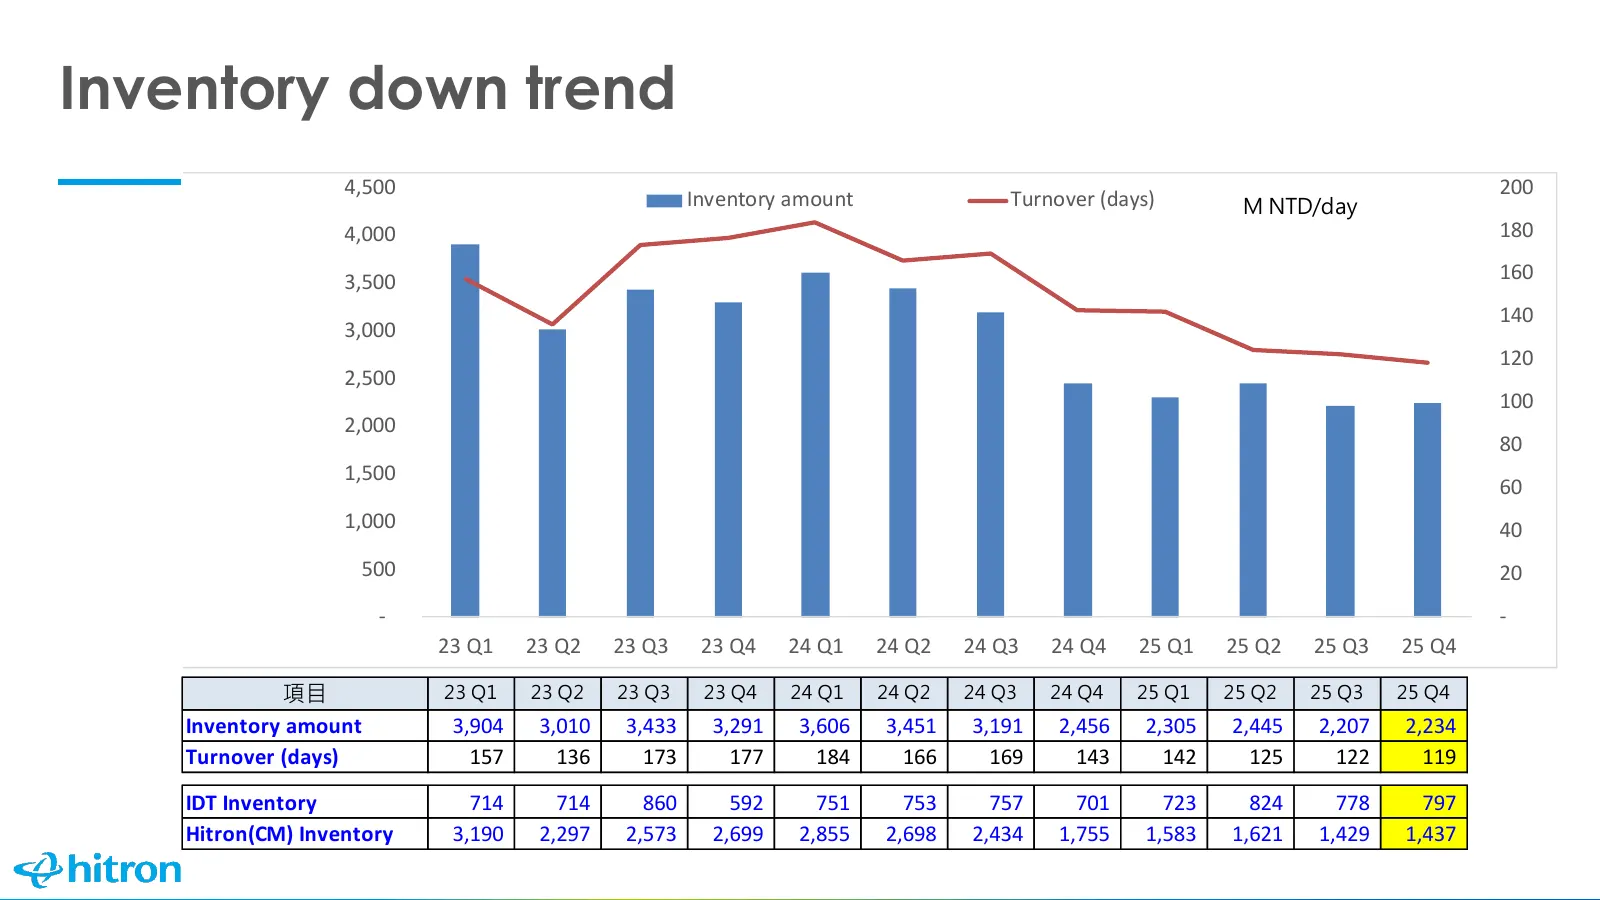
2025 Annual Balance Report Consolidated Balance Sheet NT Million 2025/12/31 2024/12/31 YoY AMT % AMT % AMT % Cash Equivalents 3,510 31.9% 2,356 23.5% 1,154 49% AR 2,447 22.3% 2,200 21.9% 247 11% Inventory 2,234 20.3% 2,456 24.4% (222) -9% PP & E 1,643 14.9% 1,788 17.8% (145) -8% Other Assets 1,160 1
Slide 11: Inventory down trend
Inventory down trend 4,500 200 Inventory amount Turnover (days) M NTD/day 4,000 180 3,500 160 140 3,000 120 2,500 100 2,000 80 1,500 60 1,000 40 500 20 - - 23 Q1 23 Q2 23 Q3 23 Q4 24 Q1 24 Q2 24 Q3 24 Q4 25 Q1 25 Q2 25 Q3 25 Q4 M NTD M NTD M NTD M NTD 項目 23 Q1 23 Q2 23 Q3 23 Q4 24 Q1 24 Q2 24 Q3 24
Slide 12: Growing Hitron、More Products、More Markets
Growing Hitron、More Products、More Markets Current and future development of new products and markets
Slide 13: Q&A
Q&A Hitron Confidential and Provided under NDA 13

Slide 14: Thank you
Thank you Creating the technology for tomorrow’s networks Confidential Confidential - Provided Provided Under Under NDA
Source: company website
More decks from Hitron Technologies Inc.
 Q3 2026 Earnings Presentation22 slides · Nov 12, 2026
 Q3 2026 Earnings Presentation19 slides · Nov 12, 2026
 FY2025 Earnings Presentation14 slides · Feb 26, 2026
 Q3 2025 Earnings Presentation11 slides · Dec 10, 2025
 Q3 2025 Earnings Presentation11 slides · Dec 10, 2025
 FY2024 Earnings Presentation14 slides · Mar 3, 2025