The Andersons, Inc. · NASDAQ:ANDE
The Andersons — Investor Presentation (November 2026)
48 slides from The Andersons's investor presentation, November 2026
Slide 1: Investor Presentation
Investor Presentation Planting Seeds to Enable Profitable Long-term Growth November 2026 2026 INVESTOR PRESENTATION
Slide 2: Safe Harbor and Non-GAAP Financial Measures
Safe Harbor and Non-GAAP Financial Measures Certain information disclosed constitutes forward-looking statements. Actual results could differ materially from those presented in the forward-looking statements as a result of many factors including general economic, weather, and regulatory conditions,
Slide 3: Table of Contents
Table of Contents PAGE 4 INTRODUCTION TO THE ANDERSONS 11 AGRIBUSINESS OVERVIEW AND STRATEGIC DIRECTION 17 RENEWABLES OVERVIEW AND STRATEGIC DIRECTION 24 Q3’26 UPDATE AND FINANCIAL OUTLOOK 31 APPENDIX 2026 INVESTOR PRESENTATION 3
Slide 4: Introduction to The Andersons
Introduction to The Andersons WE SERVE 2026 INVESTOR PRESENTATION 4
Slide 5: Key Messages
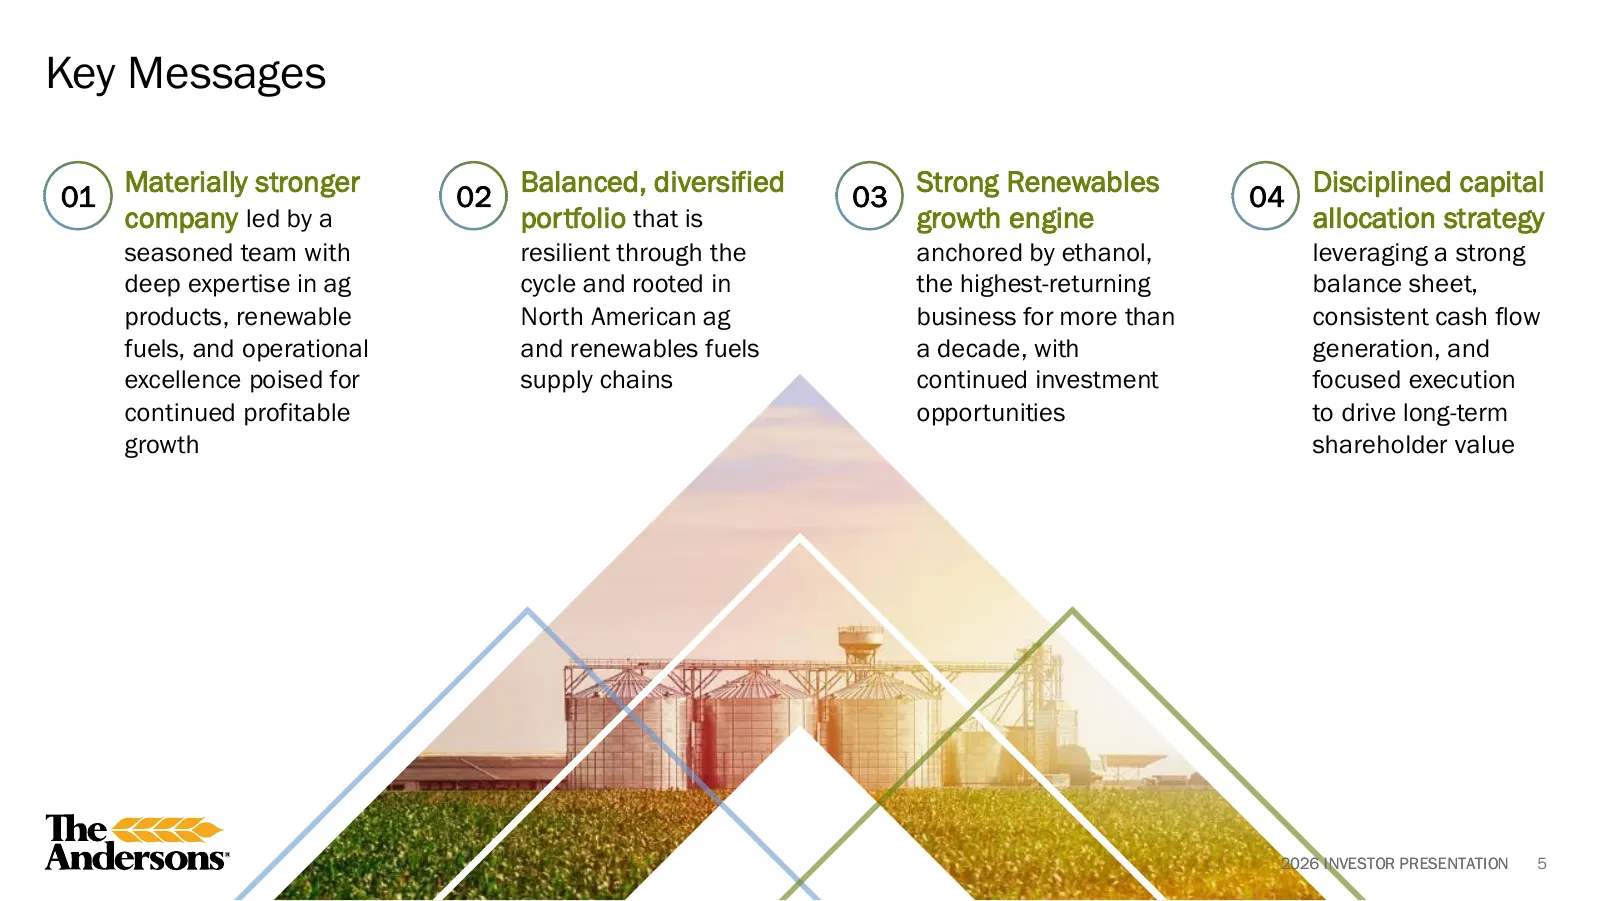
Key Messages Materially stronger Balanced, diversified Strong Renewables Disciplined capital 01 02 03 04 company led by a portfolio that is growth engine allocation strategy seasoned team with resilient through the anchored by ethanol, leveraging a strong deep expertise in ag cycle and rooted in the
Slide 6: The Andersons Snapshot (NASDAQ: ANDE)
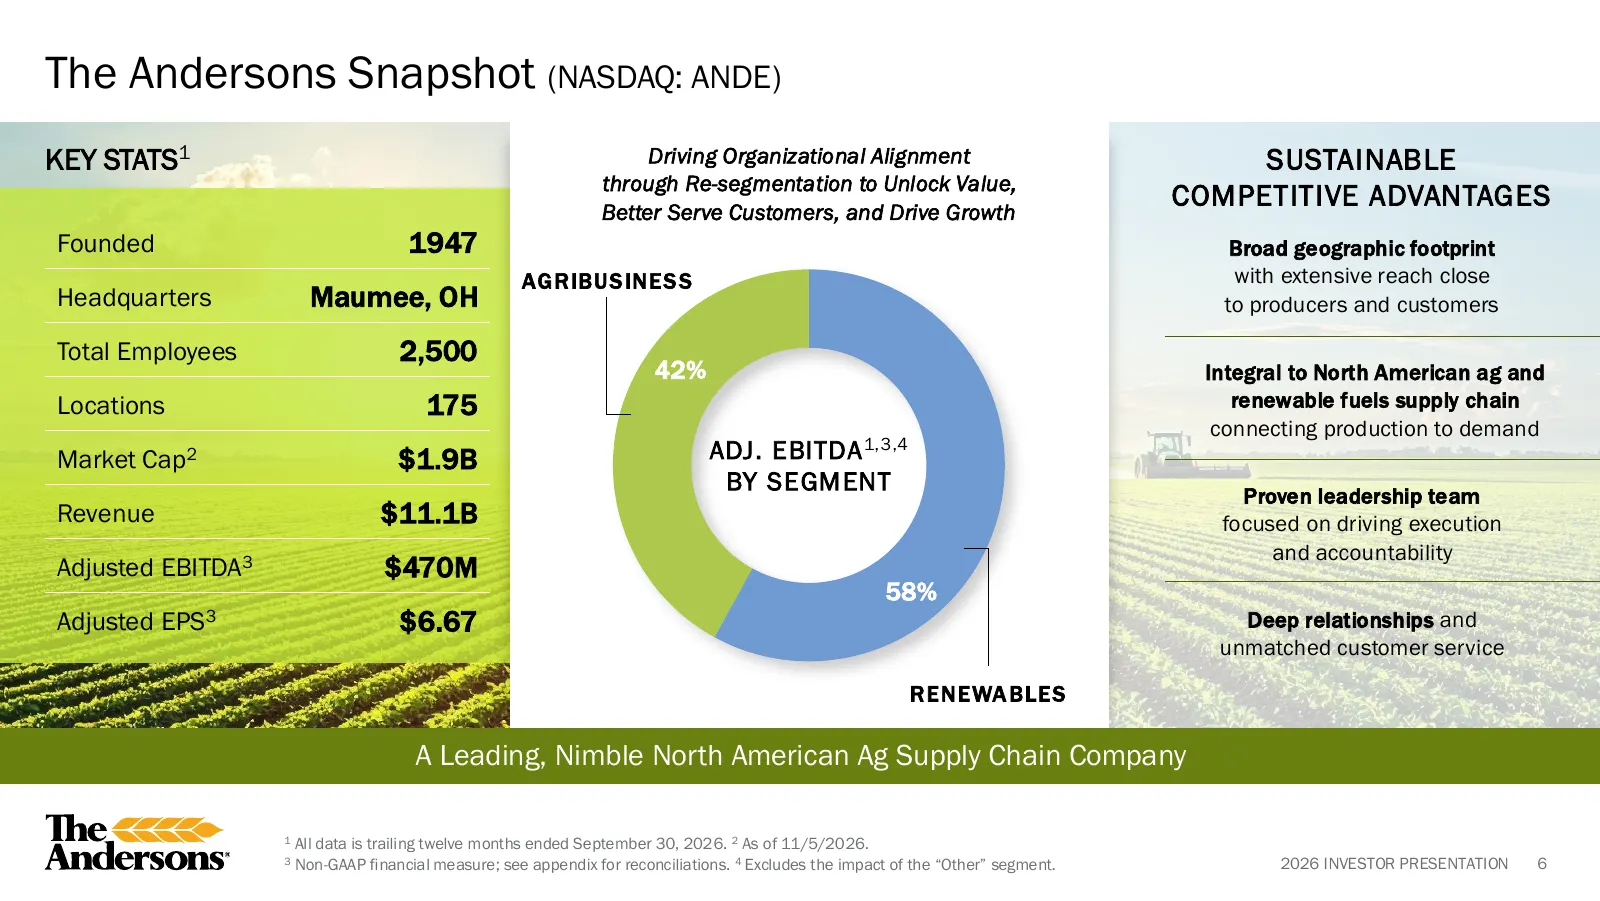
The Andersons Snapshot (NASDAQ: ANDE) KEY STATS1 Driving Organizational Alignment SUSTAINABLE through Re-segmentation to Unlock Value, Better Serve Customers, and Drive Growth COMPETITIVE ADVANTAGES Founded 1947 Broad geographic footprint AGRIBUS INES S with extensive reach close Headquarters Maumee
Slide 7: Two Integrated and Complementary Segments
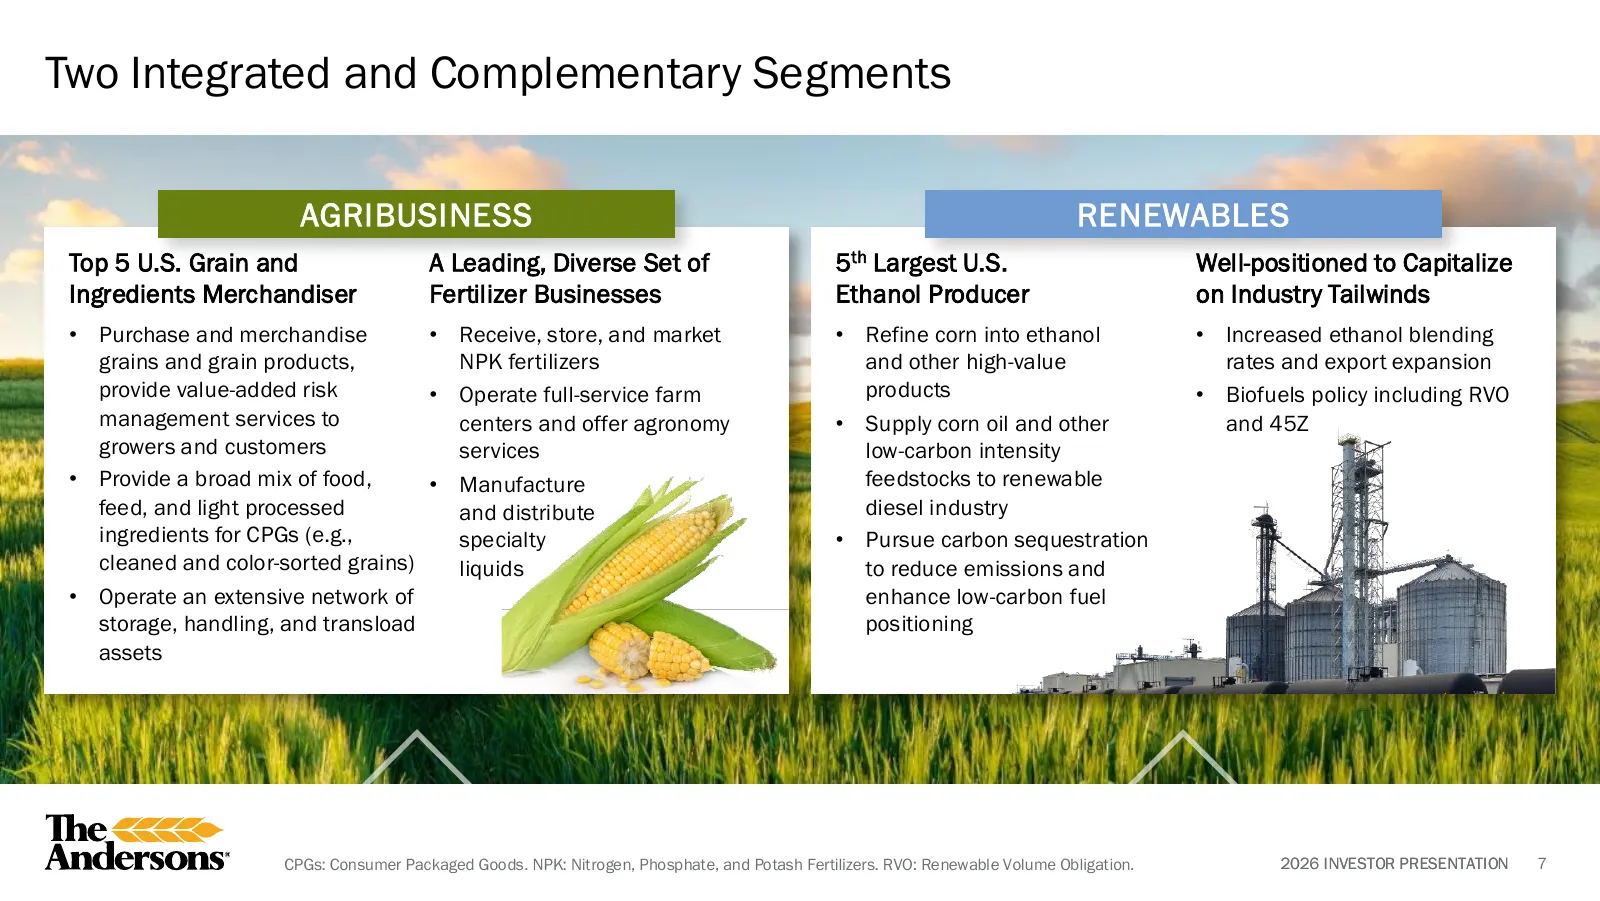
Two Integrated and Complementary Segments AGRIBUSINESS RENEWABLES Top 5 U.S. Grain and A Leading, Diverse Set of 5th Largest U.S. Well-positioned to Capitalize Ingredients Merchandiser Fertilizer Businesses Ethanol Producer on Industry Tailwinds • Purchase and merchandise • Receive, store, and marke
Slide 8: Long-term Strategic Framework for Profitable Growth
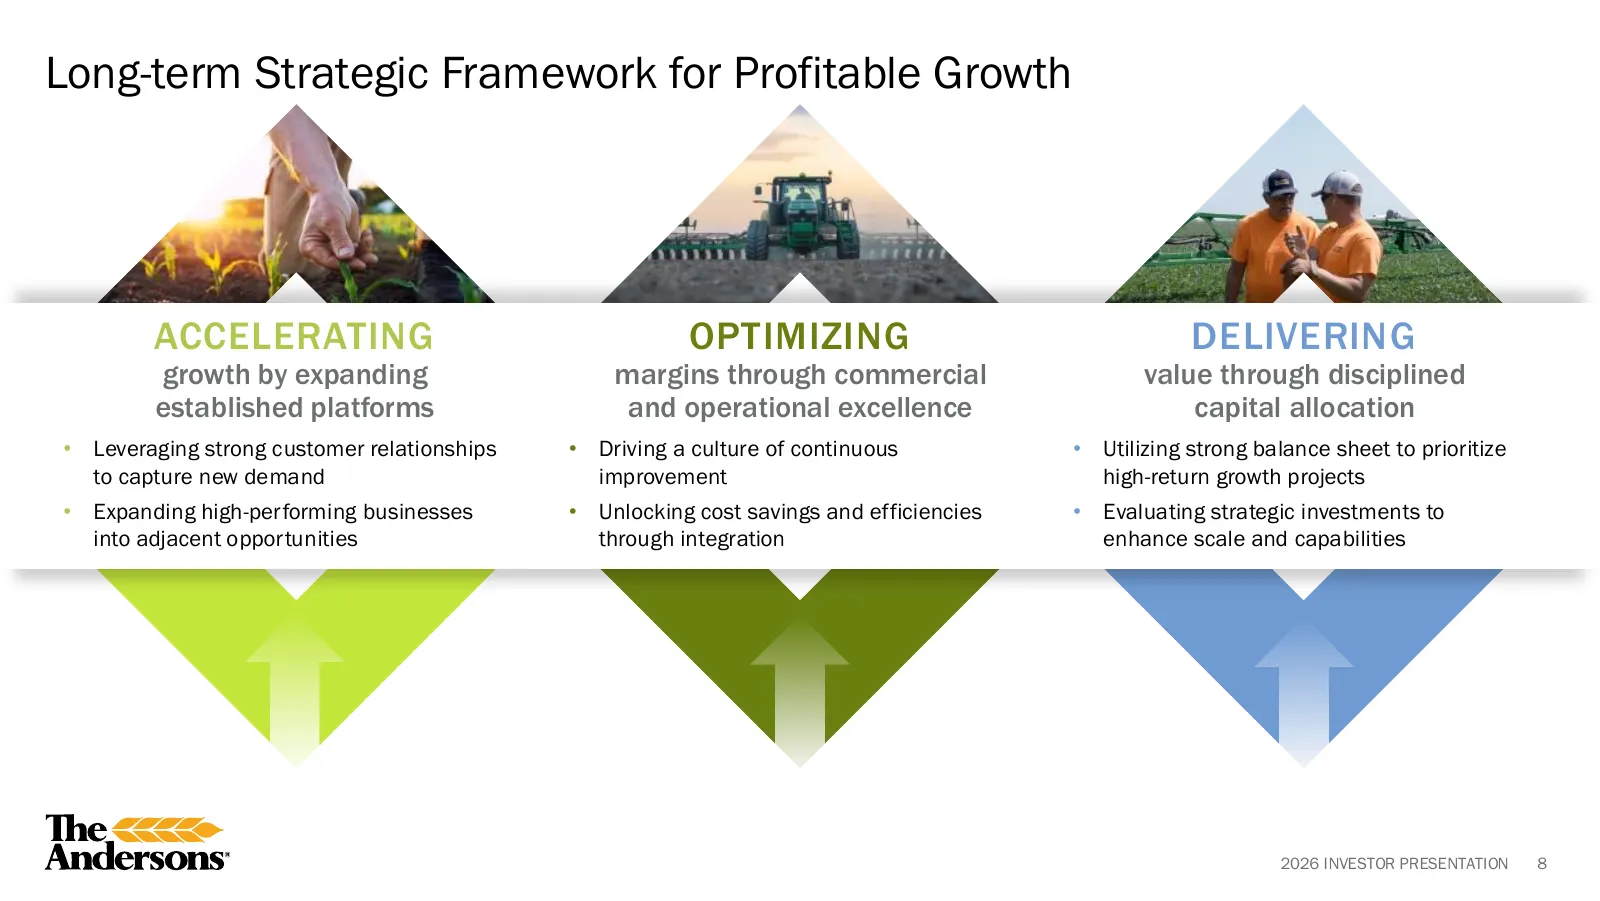
Long-term Strategic Framework for Profitable Growth ACCELERATING OPTIMIZING DELIVERING growth by expanding margins through commercial value through disciplined established platforms and operational excellence capital allocation • Leveraging strong customer relationships • Driving a culture of contin
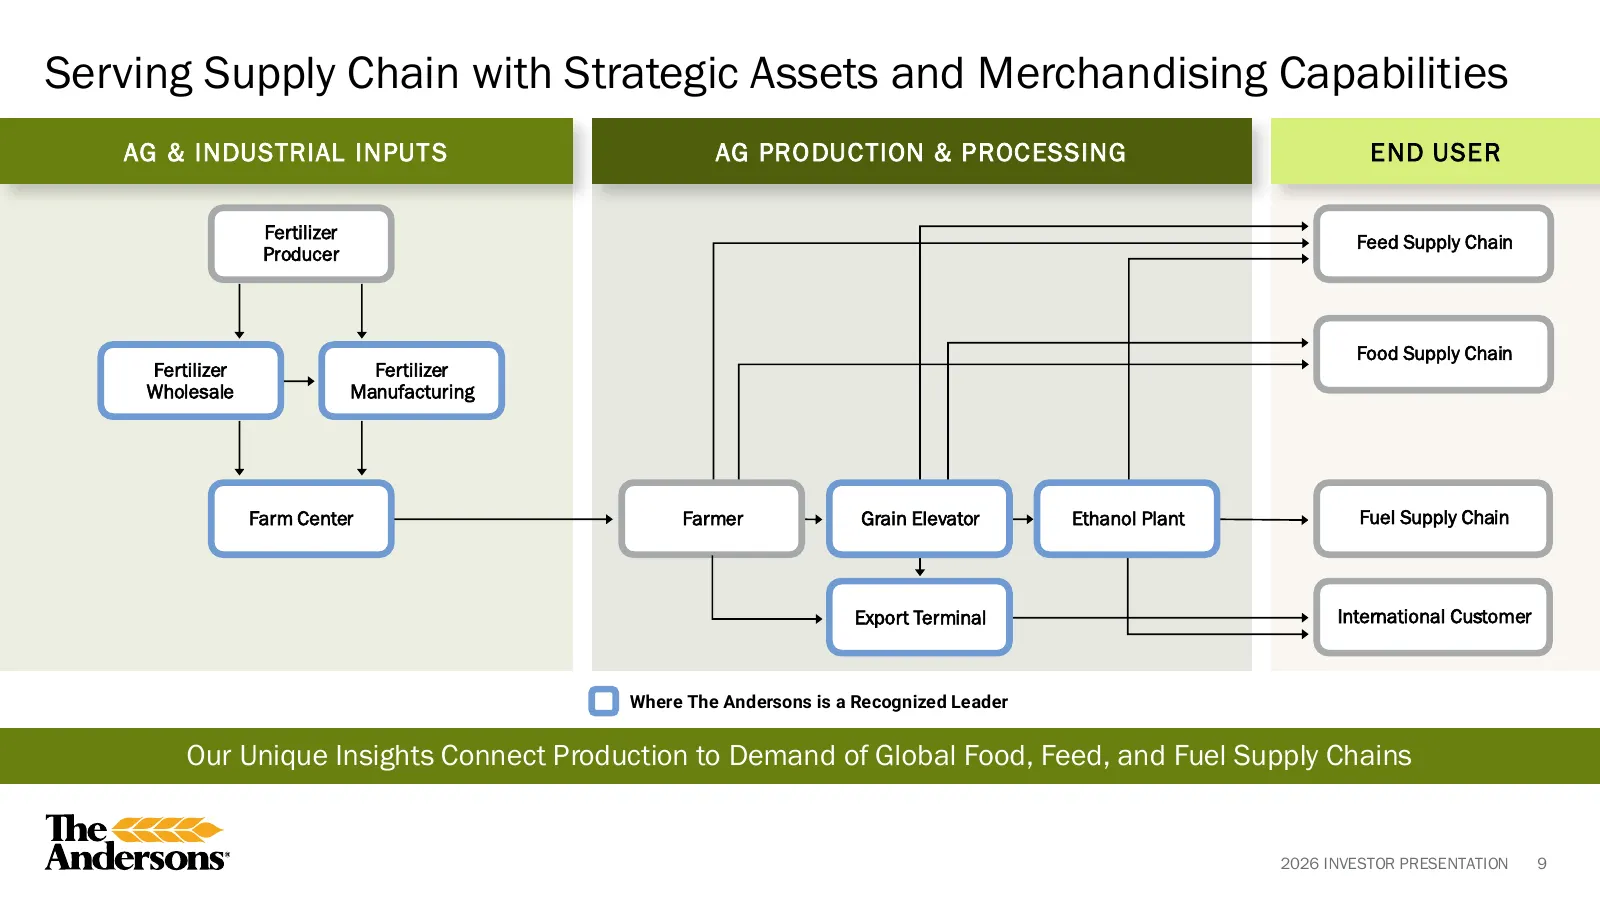
Slide 9: Serving Supply Chain with Strategic Assets and Merchandising Capabilities
Serving Supply Chain with Strategic Assets and Merchandising Capabilities AG & INDUSTRIAL INPUT S AG PRODUC TION & PROC ESSING END USER Fertilizer Feed Supply Chain Producer Food Supply Chain Fertilizer Fertilizer Wholesale Manufacturing Farm Center Farmer Grain Elevator Ethanol Plant Fuel Supply Ch
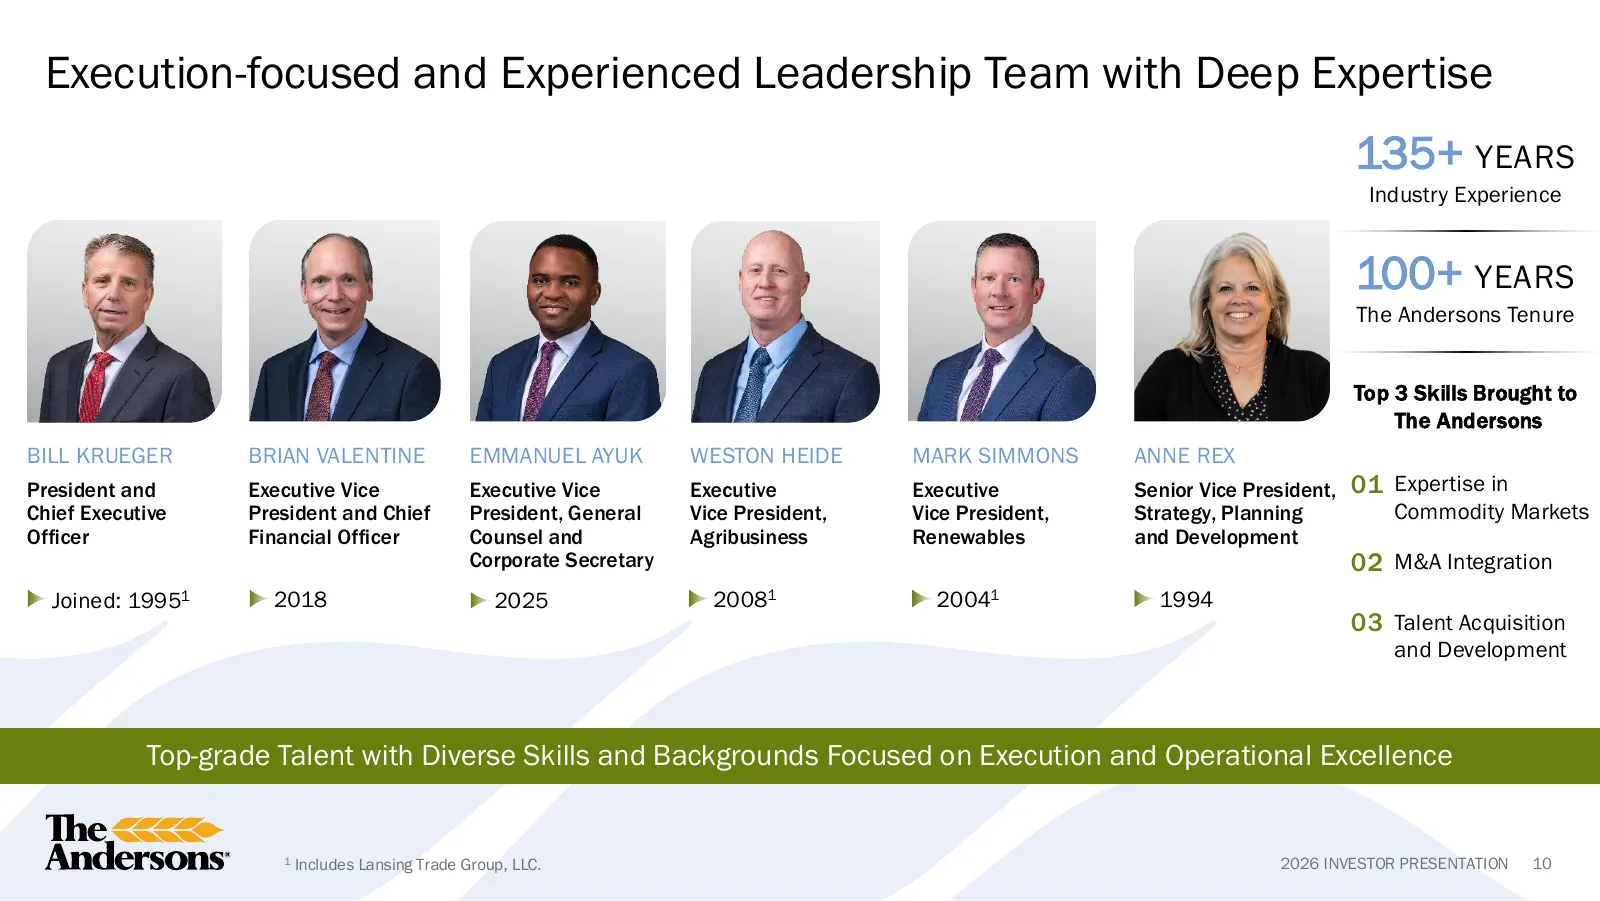
Slide 10: Execution-focused and Experienced Leadership Team with Deep Expertise
Execution-focused and Experienced Leadership Team with Deep Expertise 135+ YEARS Industry Experience 100+ YEARS The Andersons Tenure Top 3 Skills Brought to The Andersons BILL KRUEGER BRIAN VALENTINE EMMANUEL AYUK WESTON HEIDE MARK SIMMONS ANNE REX President and Executive Vice Executive Vice Executi
Slide 11: Agribusiness: Overview and Strategic Direction
Agribusiness WE SERVE Overview and Strategic Direction 2026 INVESTOR PRESENTATION 11
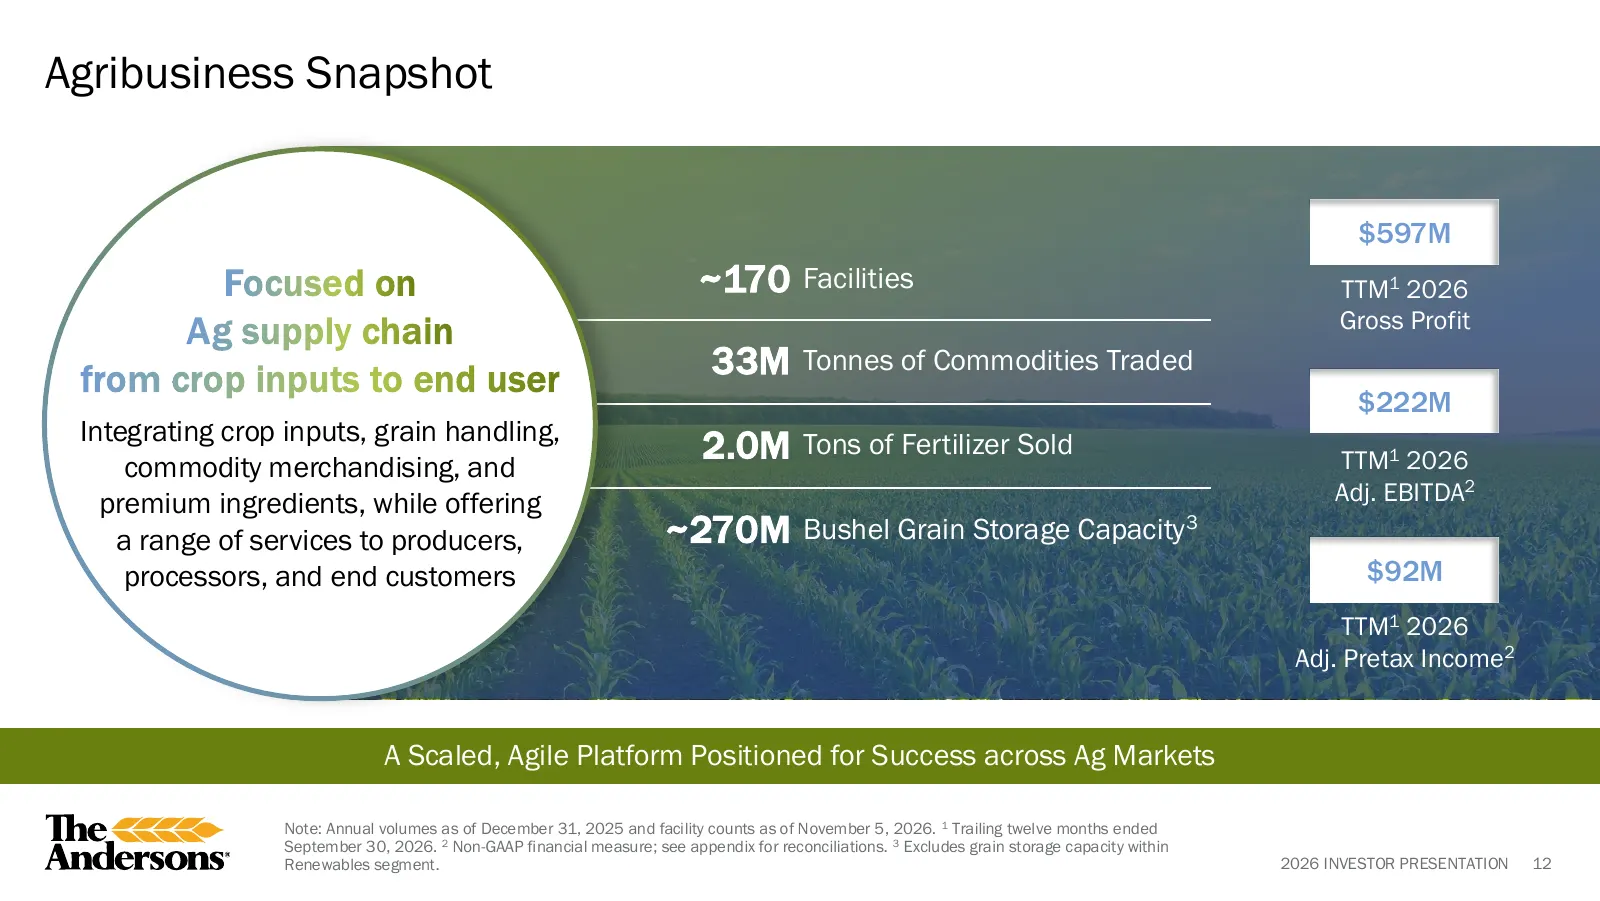
Slide 12: Agribusiness Snapshot
Agribusiness Snapshot $597M Focused on ~170 Facilities TTM1 2026 Gross Profit Ag supply chain from crop inputs to end user 33M Tonnes of Commodities Traded $222M Integrating crop inputs, grain handling, commodity merchandising, and 2.0M Tons of Fertilizer Sold TTM1 2026 premium ingredients, while of
Slide 13: Broad Geographic Footprint
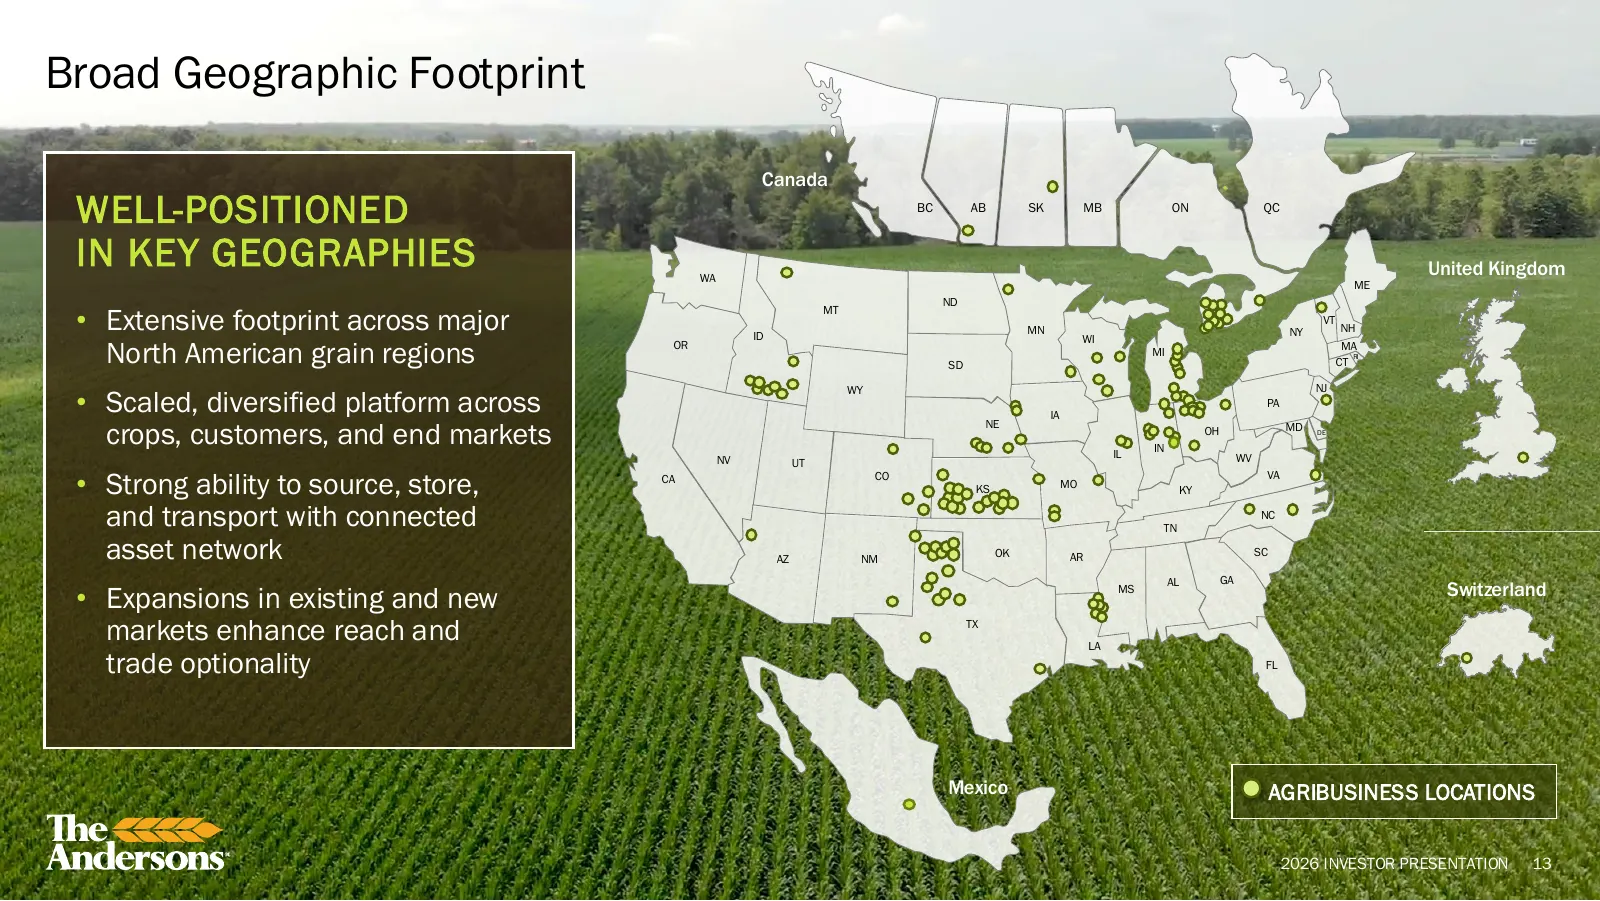
Broad Geographic Footprint Canada WELL-POSITIONED BC AB SK MB ON QC IN KEY GEOGRAPHIES WA United Kingdom ME ND • Extensive footprint across major MT VT MN NY NH ID WI North American grain regions OR SD MI MA CT RI WY NJ • Scaled, diversified platform across IA PA crops, customers, and end markets NE
Slide 14: Agribusiness 101: Where We Play
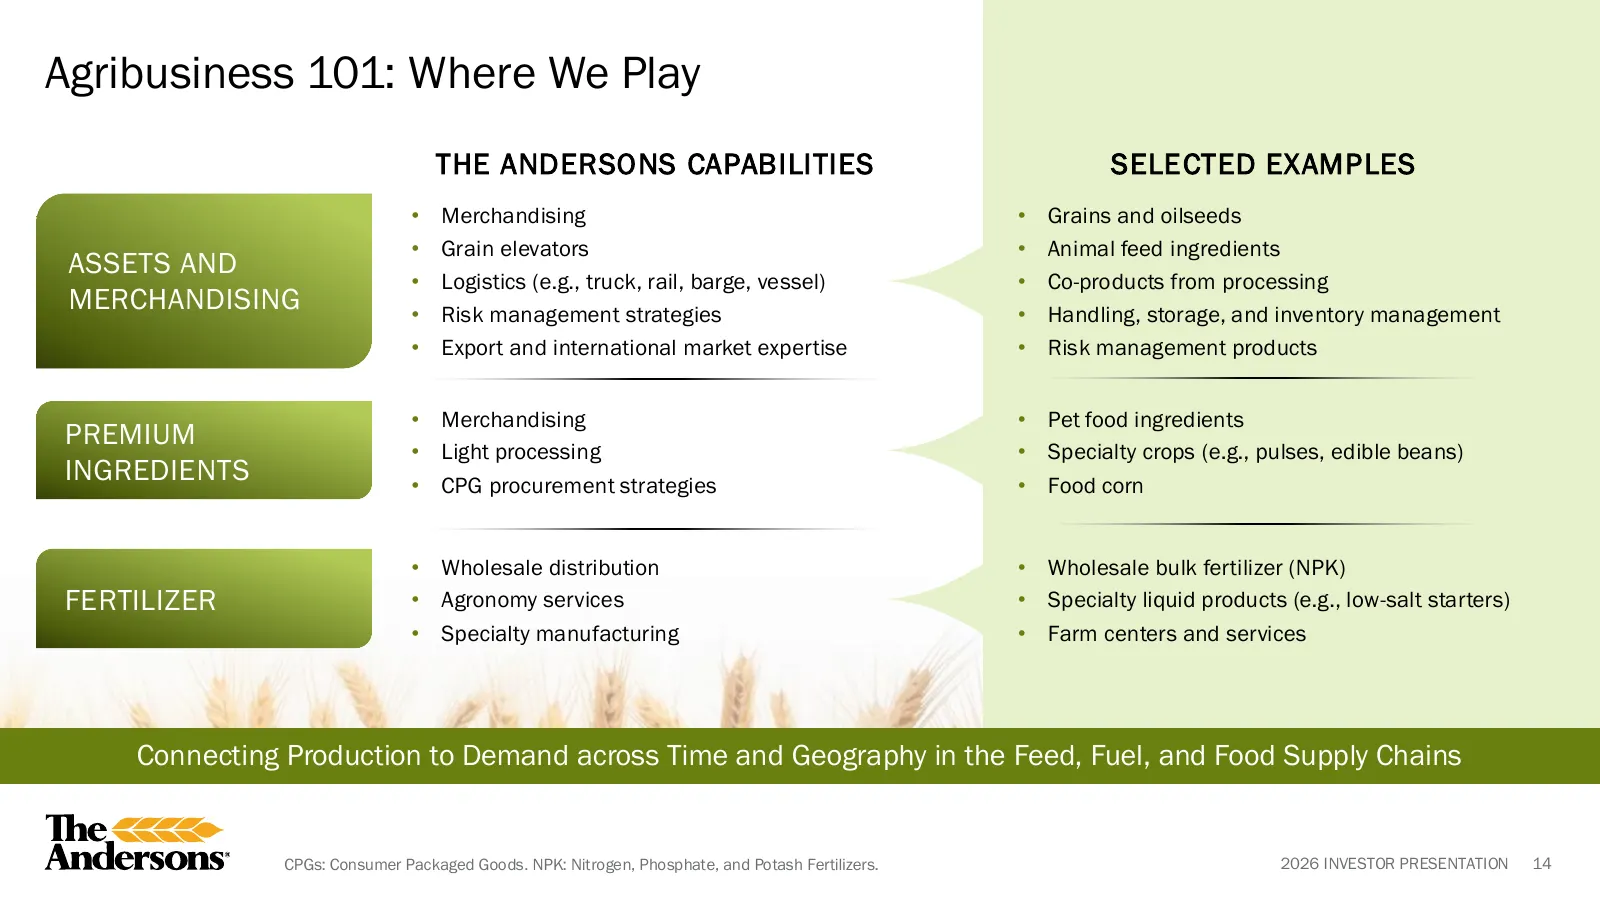
Agribusiness 101: Where We Play THE ANDERSONS CAPABILITIES SELECTED EXAMPLES • Merchandising • Grains and oilseeds • Grain elevators • Animal feed ingredients ASSETS AND • Logistics (e.g., truck, rail, barge, vessel) • Co-products from processing MERCHANDISING • Risk management strategies • Handling
Slide 15: Why We Win in Agribusiness
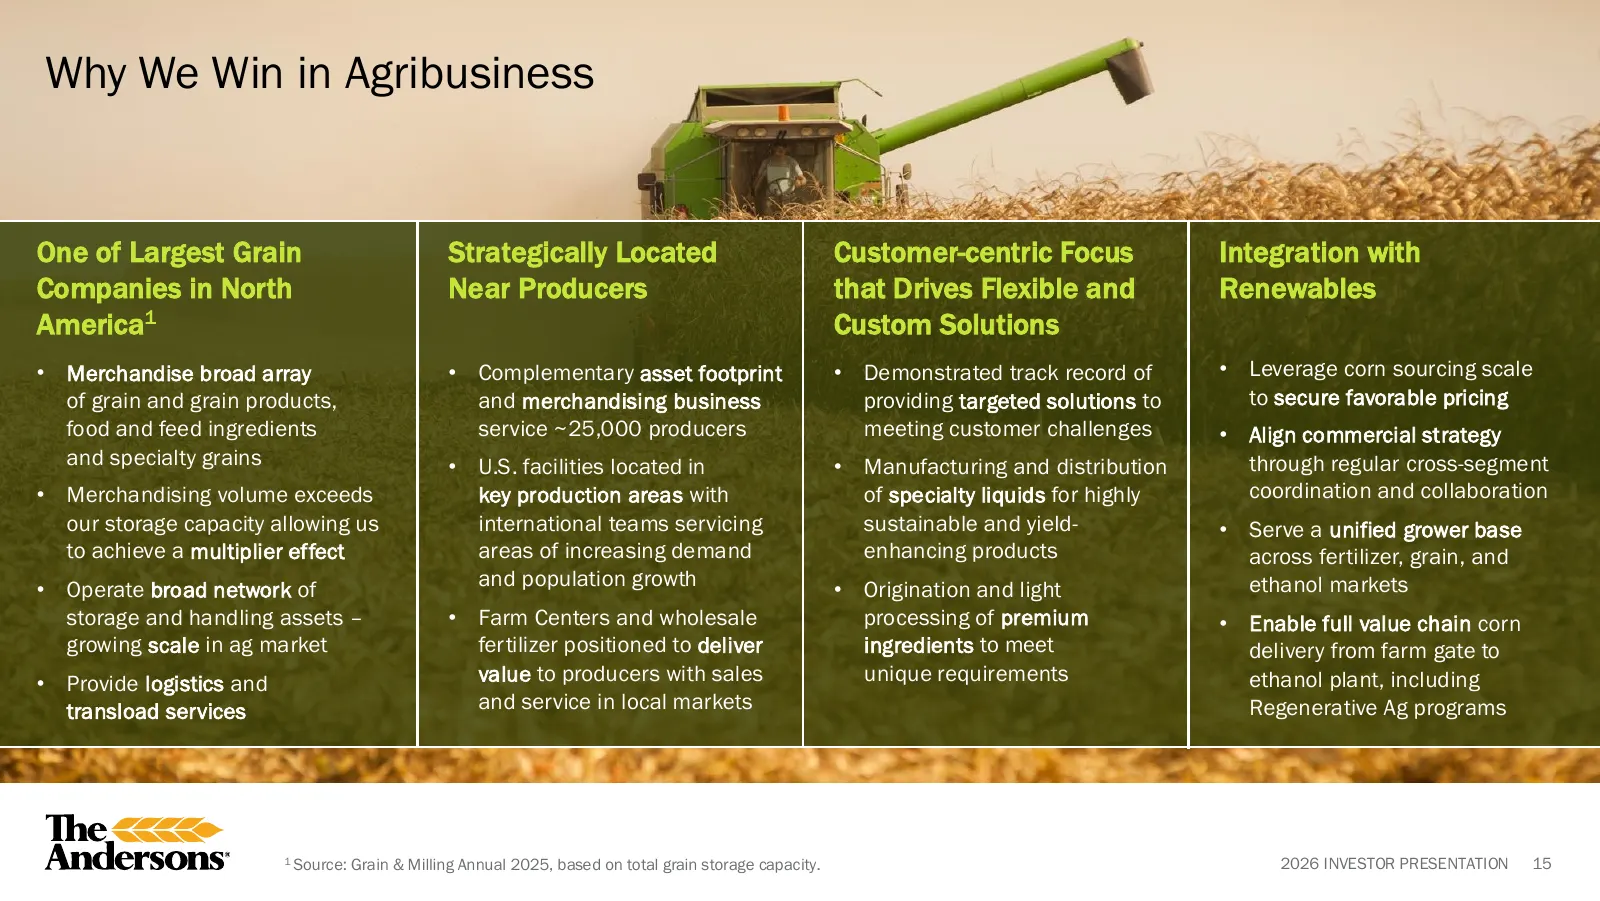
Why We Win in Agribusiness One of Largest Grain Strategically Located Customer-centric Focus Integration with Companies in North Near Producers that Drives Flexible and Renewables America1 Custom Solutions • Merchandise broad array • Complementary asset footprint • Demonstrated track record of • Lev
Slide 16: Agribusiness 5-year Historical Financial Performance Overview ($M)
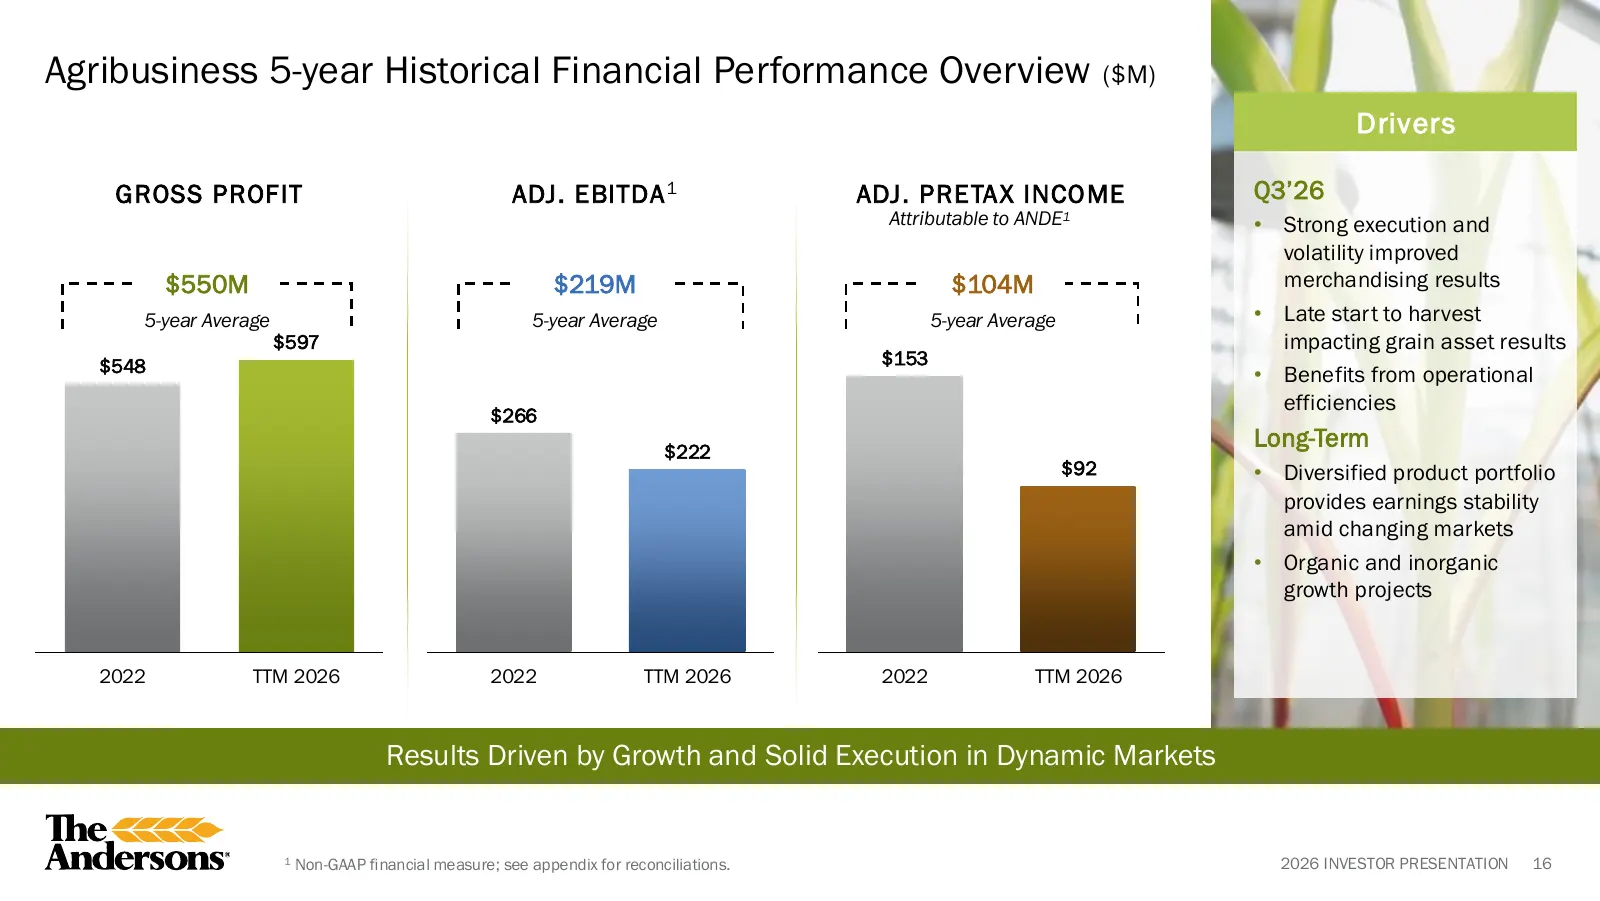
Agribusiness 5-year Historical Financial Performance Overview ($M) Drivers GROSS PROFIT ADJ. EBITDA 1 ADJ. PRETA X INCOME Q3’26 Attributable to ANDE1 • Strong execution and volatility improved $550M $219M $104M merchandising results 5-year Average 5-year Average 5-year Average • Late start to harves
Slide 17: Renewables: Overview and Strategic Direction
Renewables WE SERVE Overview and Strategic Direction 2026 INVESTOR PRESENTATION 17
Slide 18: Renewables Snapshot
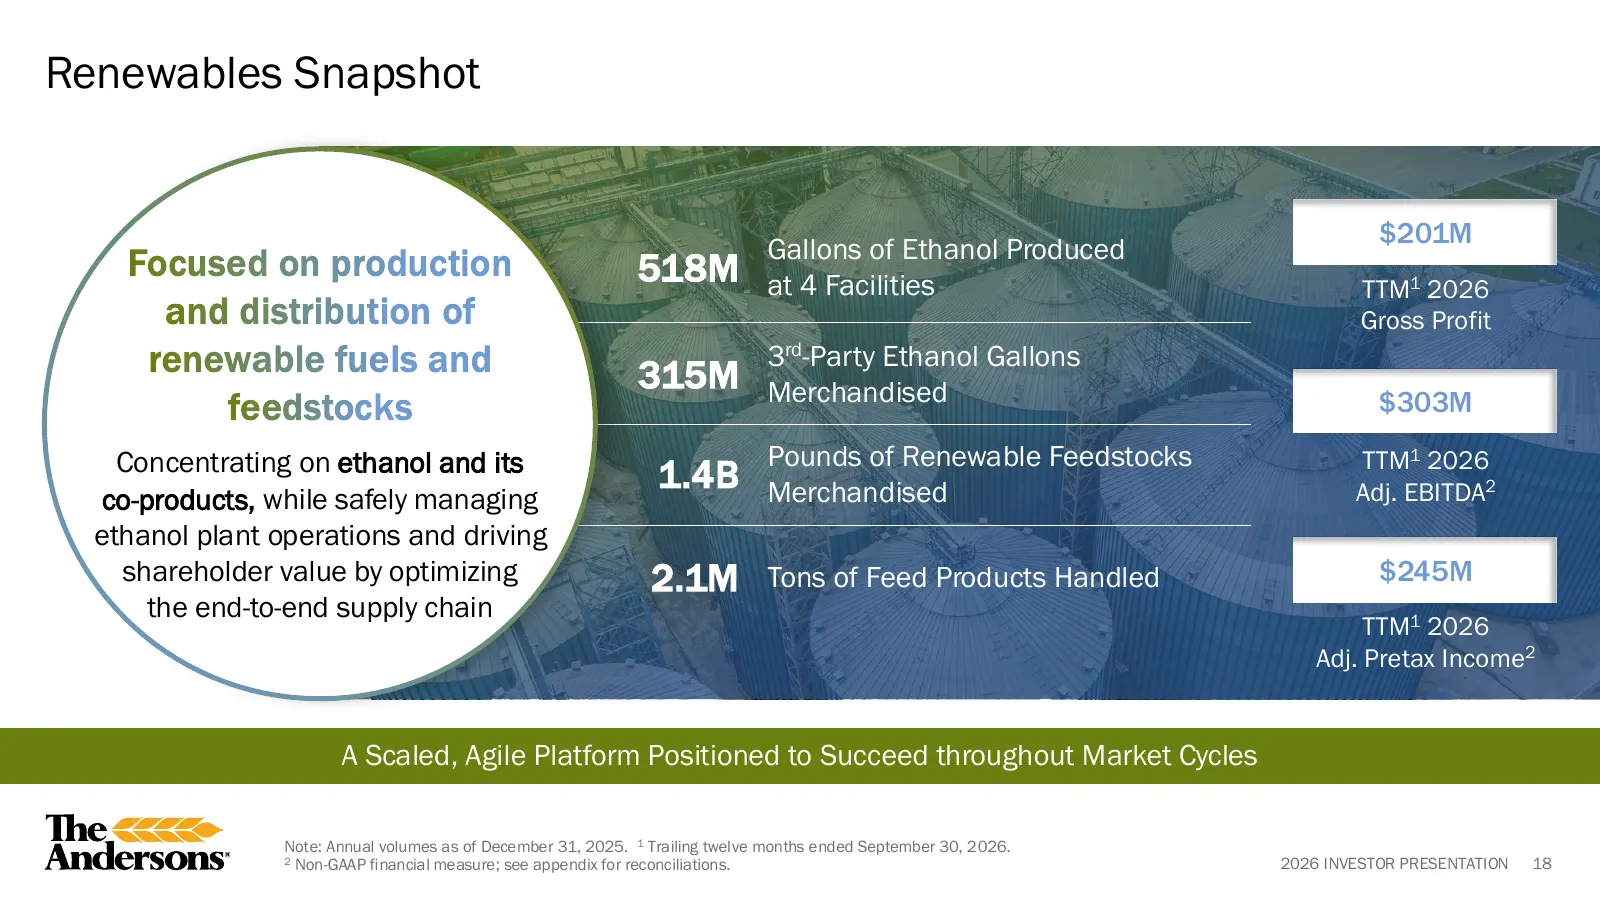
Renewables Snapshot $201M Gallons of Ethanol Produced Focused on production 518M at 4 Facilities TTM1 2026 and distribution of Gross Profit renewable fuels and 315M 3rd-Party Ethanol Gallons Merchandised feedstocks $303M Concentrating on ethanol and its Pounds of Renewable Feedstocks TTM1 2026 1.4B
Slide 19: Eastern Footprint Enables Strong Connection to Growers and End Users
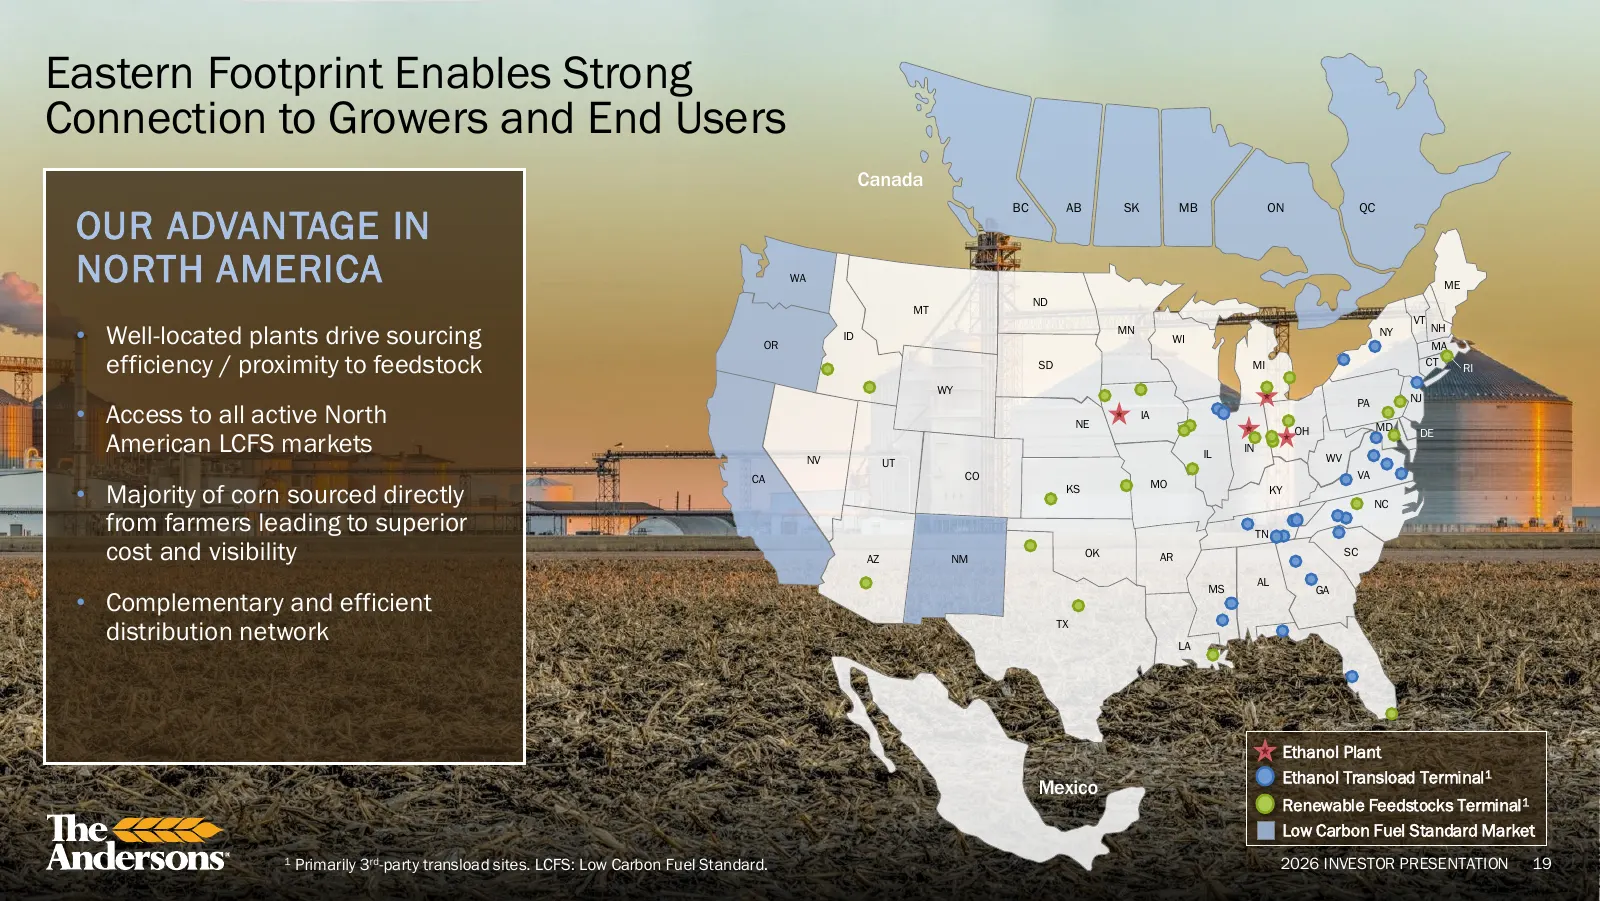
Eastern Footprint Enables Strong Connection to Growers and End Users Canada BC AB SK MB ON QC OUR ADVANTAGE IN NORTH AMERICA WA ME ND MT VT • Well-located plants drive sourcing OR ID MN WI NY NH MA efficiency / proximity to feedstock SD MI CT RI WY PA NJ • Access to all active North NE IA OH MD DE A
Slide 20: Renewables 101: Where We Play
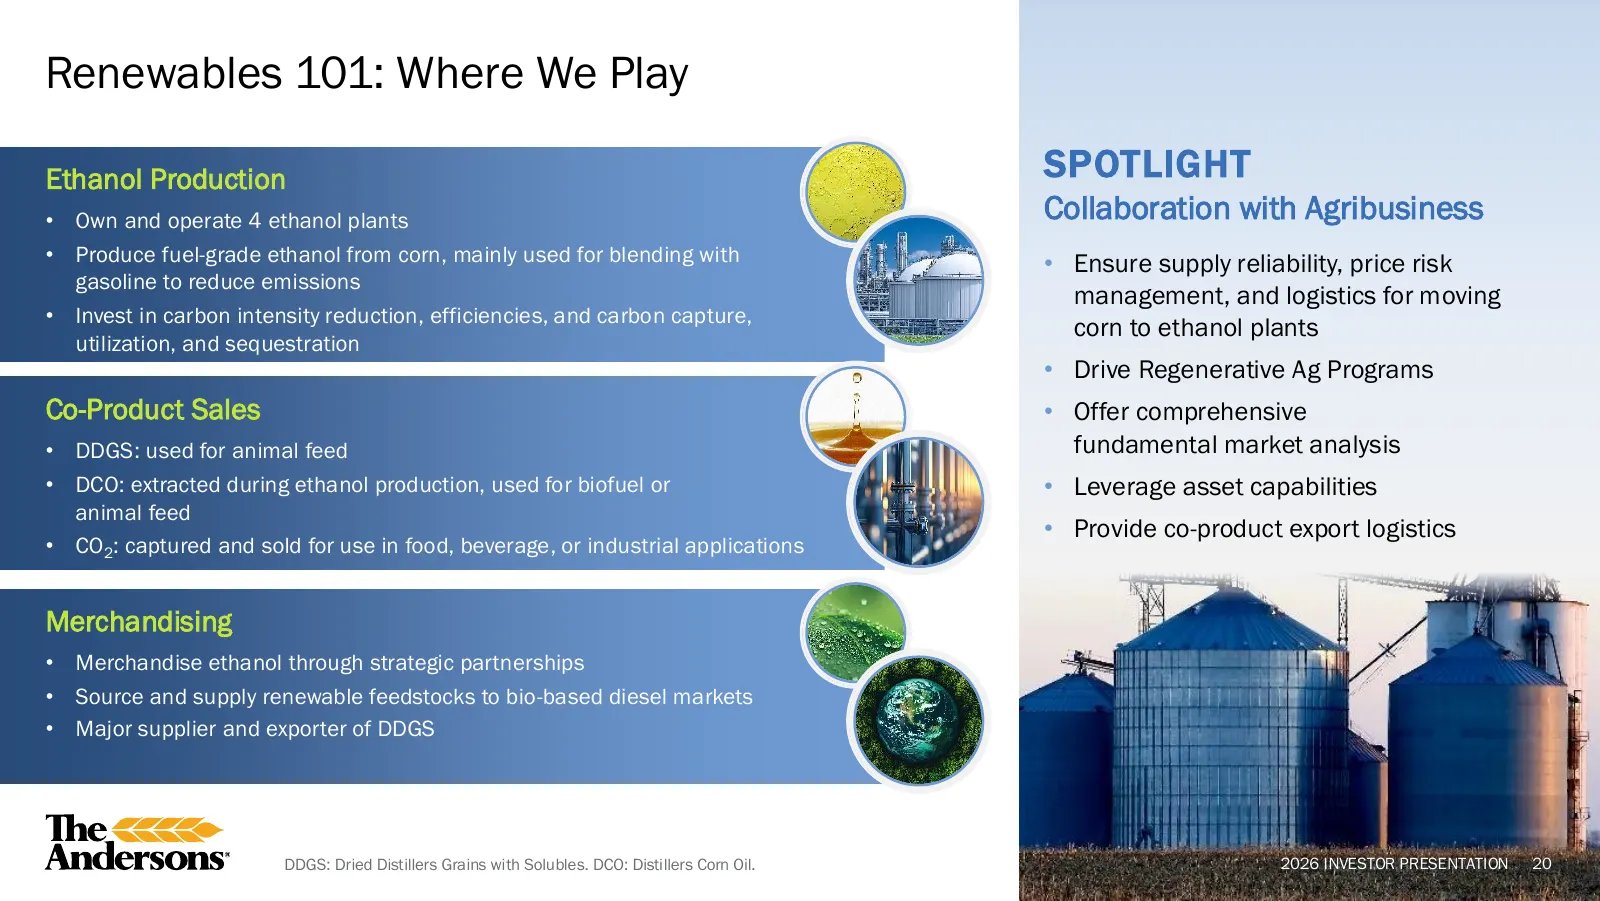
Renewables 101: Where We Play Ethanol Production SPOTLIGHT • Own and operate 4 ethanol plants Collaboration with Agribusiness • Produce fuel-grade ethanol from corn, mainly used for blending with • Ensure supply reliability, price risk gasoline to reduce emissions management, and logistics for movin
Slide 21: Why We Win in Renewables
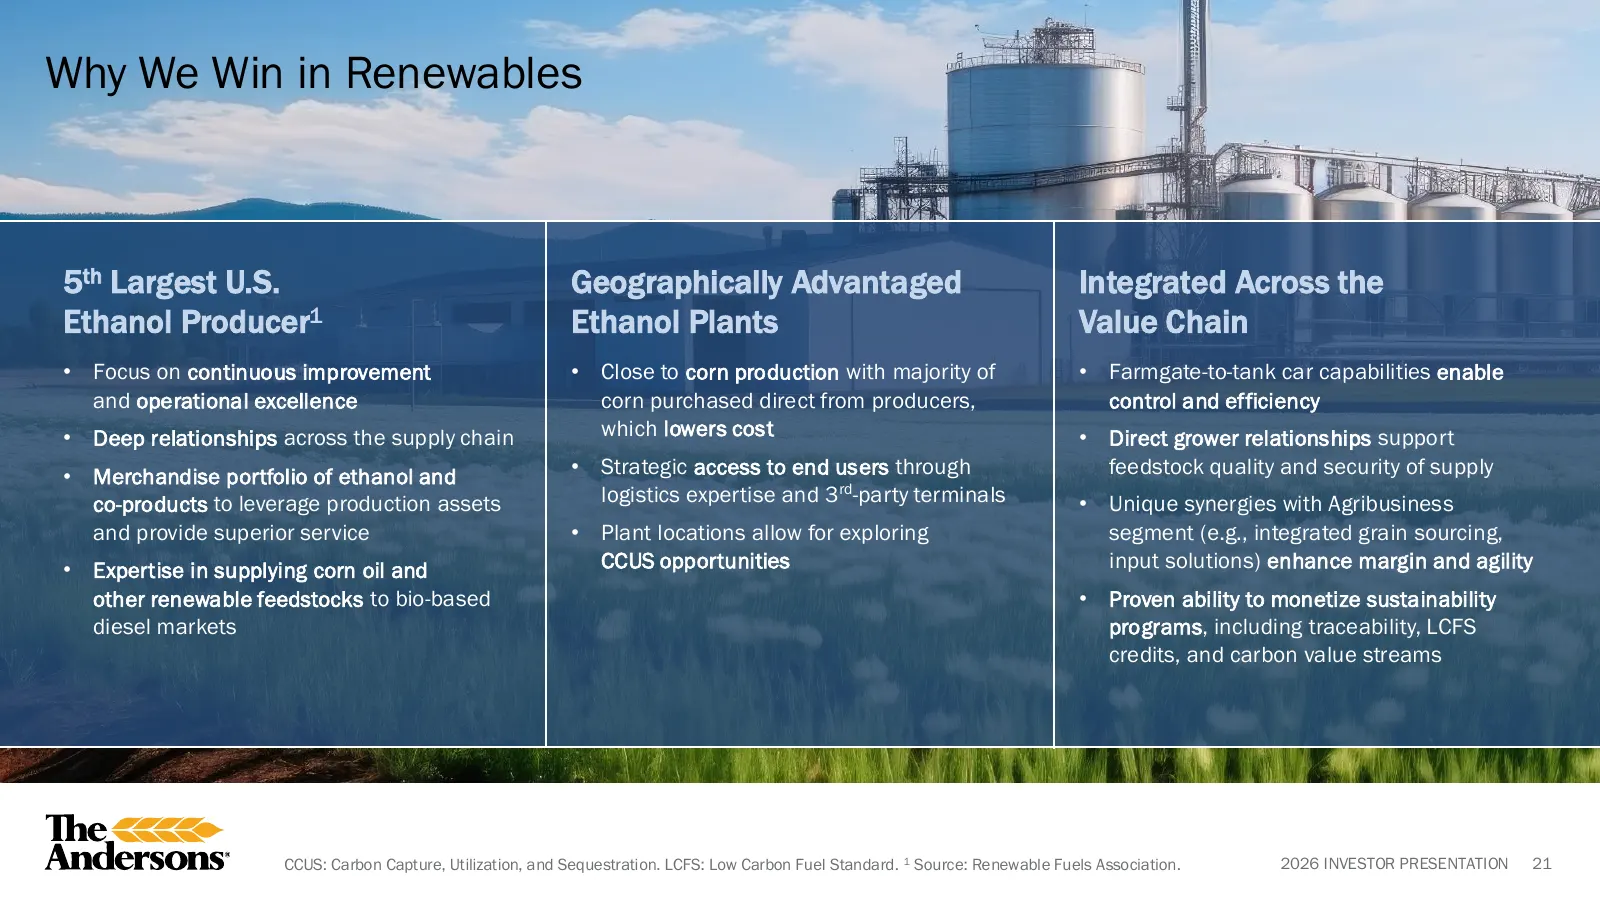
Why We Win in Renewables 5th Largest U.S. Geographically Advantaged Integrated Across the Ethanol Producer1 Ethanol Plants Value Chain • Focus on continuous improvement • Close to corn production with majority of • Farmgate-to-tank car capabilities enable and operational excellence corn purchased di
Slide 22: Renewables 5-year Historical Financial Performance Overview ($M)
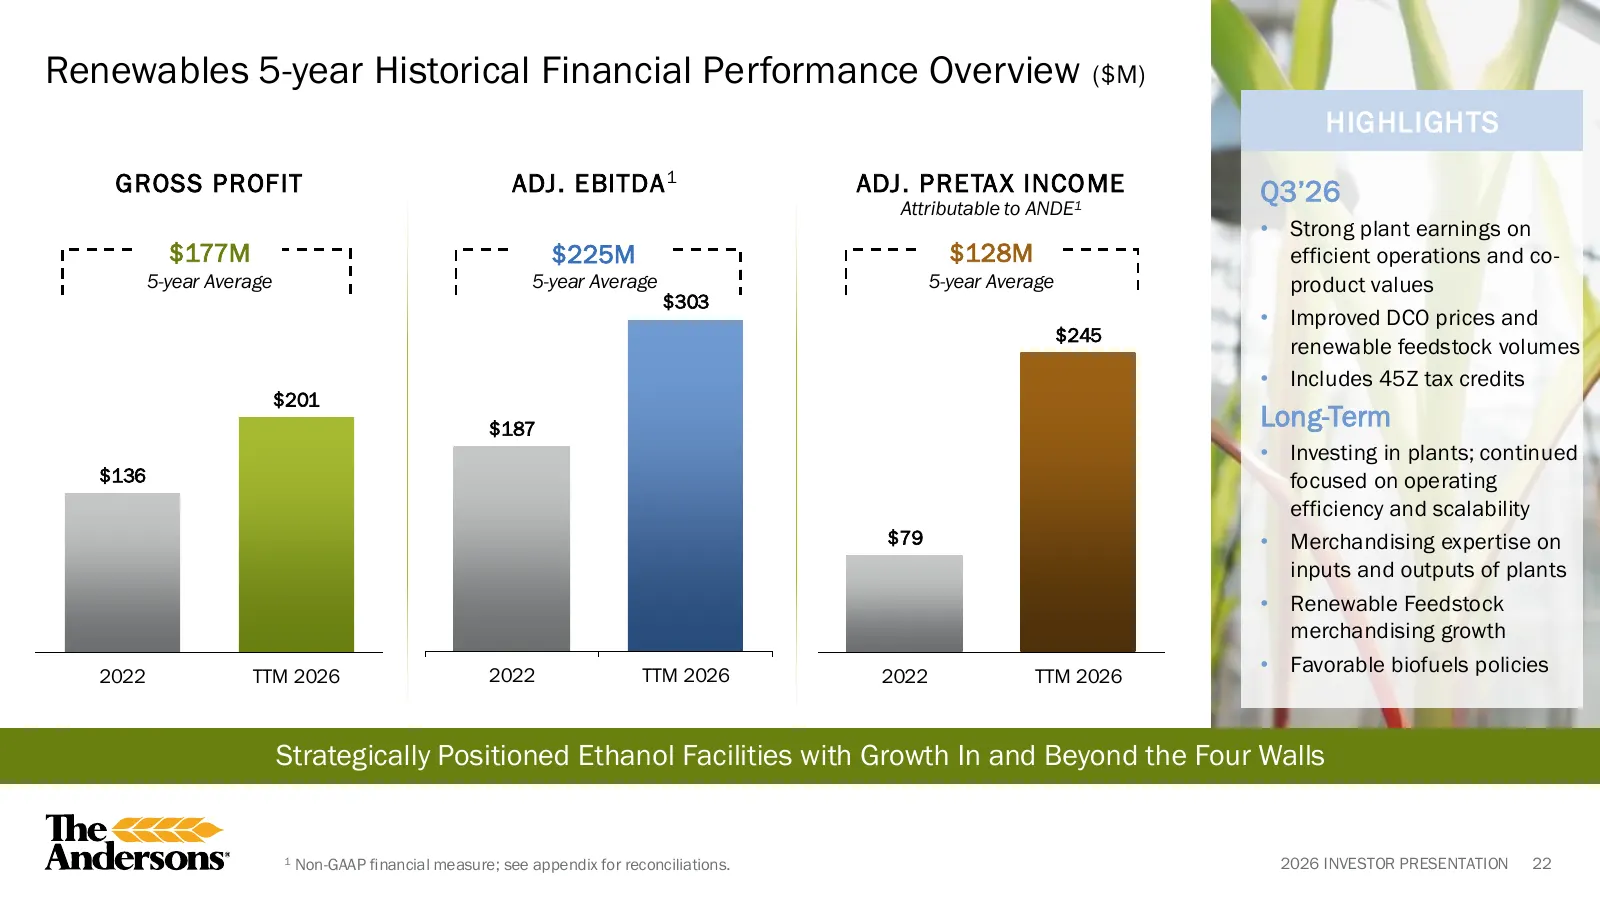
Renewables 5-year Historical Financial Performance Overview ($M) HIGHLIGHTS GROSS PROFIT ADJ. EBITDA 1 ADJ. PRETA X INCOME Q3’26 Attributable to ANDE1 • Strong plant earnings on $177M $225M $128M efficient operations and co- 5-year Average 5-year Average 5-year Average product values $303 • Improved
Slide 23: Q3'26 Update and Financial Outlook
Q3’26 Update and Financial Outlook WE SERVE 2026 INVESTOR PRESENTATION 23
Slide 24: Financial Performance Overview ($M)
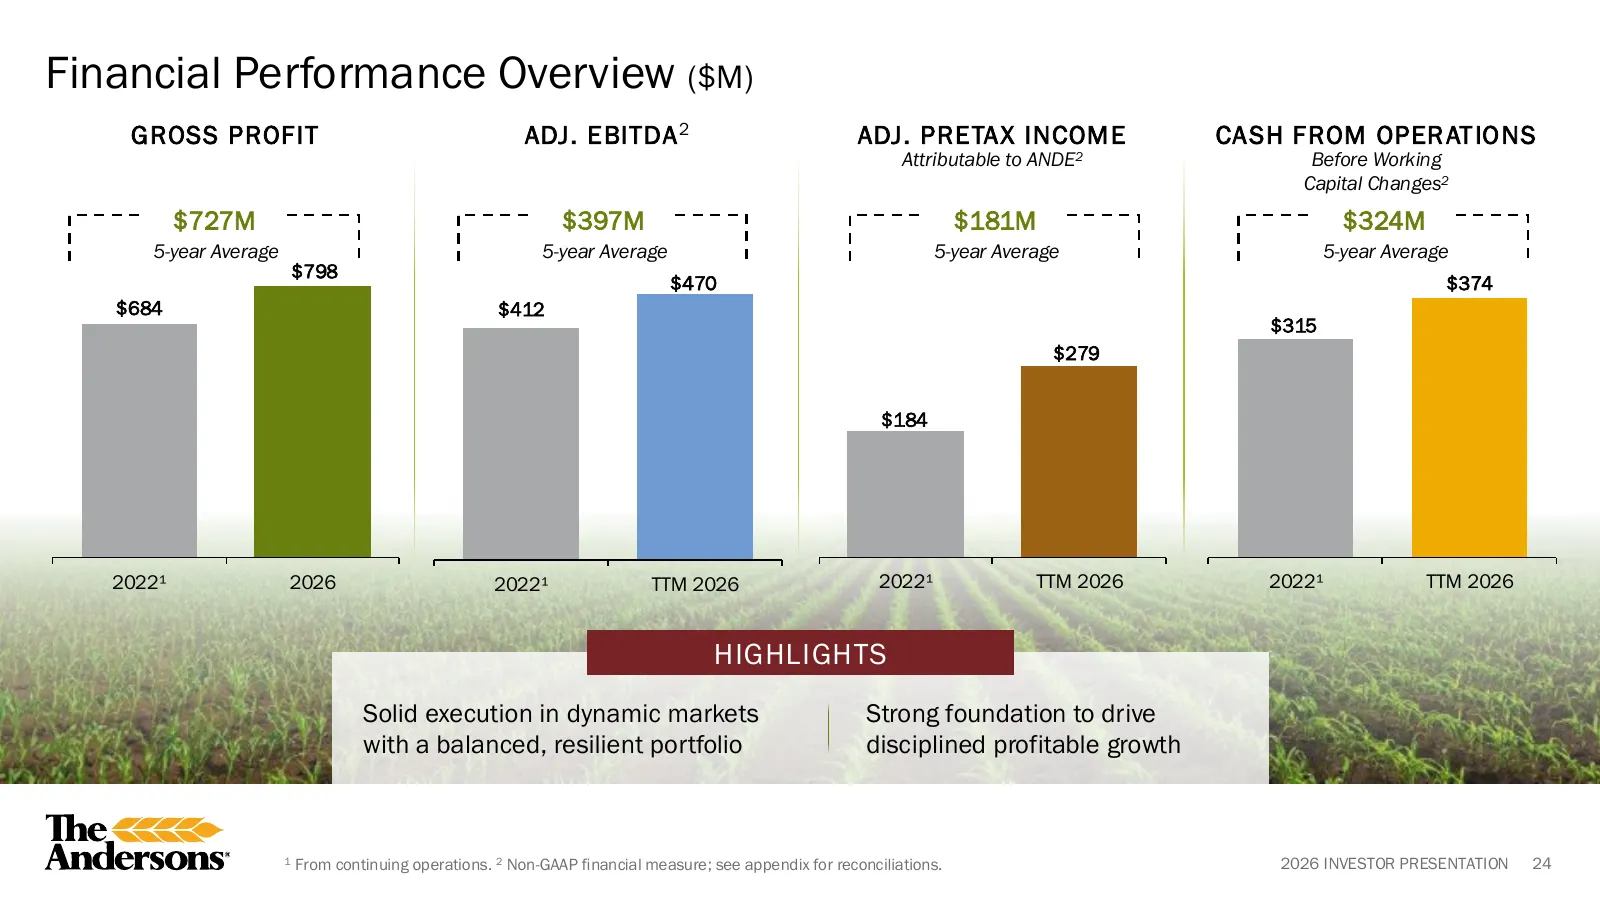
Financial Performance Overview ($M) GROSS PROFIT ADJ. EBITDA 2 ADJ. PRETAX INCOME CA SH FROM OPER AT IONS Attributable to ANDE2 Before Working Capital Changes2 $727M $397M $181M $324M 5-year Average 5-year Average 5-year Average 5-year Average $798 $470 $374 $684 $412 $315 $279 $184 2022¹ 2026 2022¹
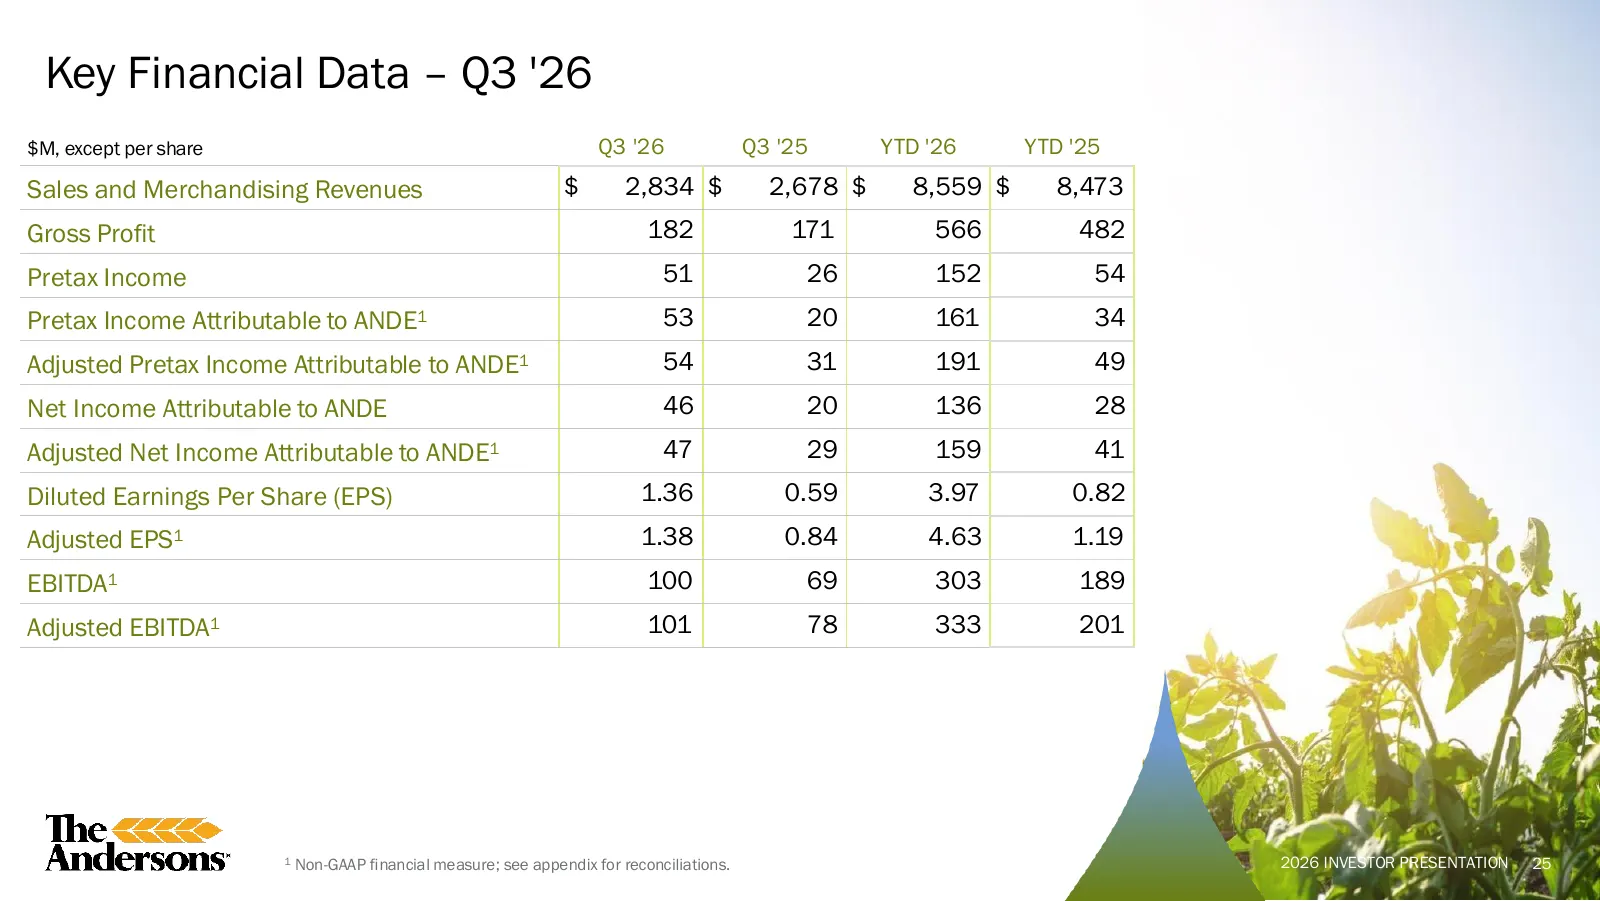
Slide 25: Key Financial Data – Q3 '26
Key Financial Data – Q3 '26 $M, except per share Q3 '26 Q3 '25 YTD '26 YTD '25 Sales and Merchandising Revenues $ 2,834 $ 2,678 $ 8,559 $ 8,473 Gross Profit 182 171 566 482 Pretax Income 51 26 152 54 Pretax Income Attributable to ANDE1 53 20 161 34 Adjusted Pretax Income Attributable to ANDE1 54 31
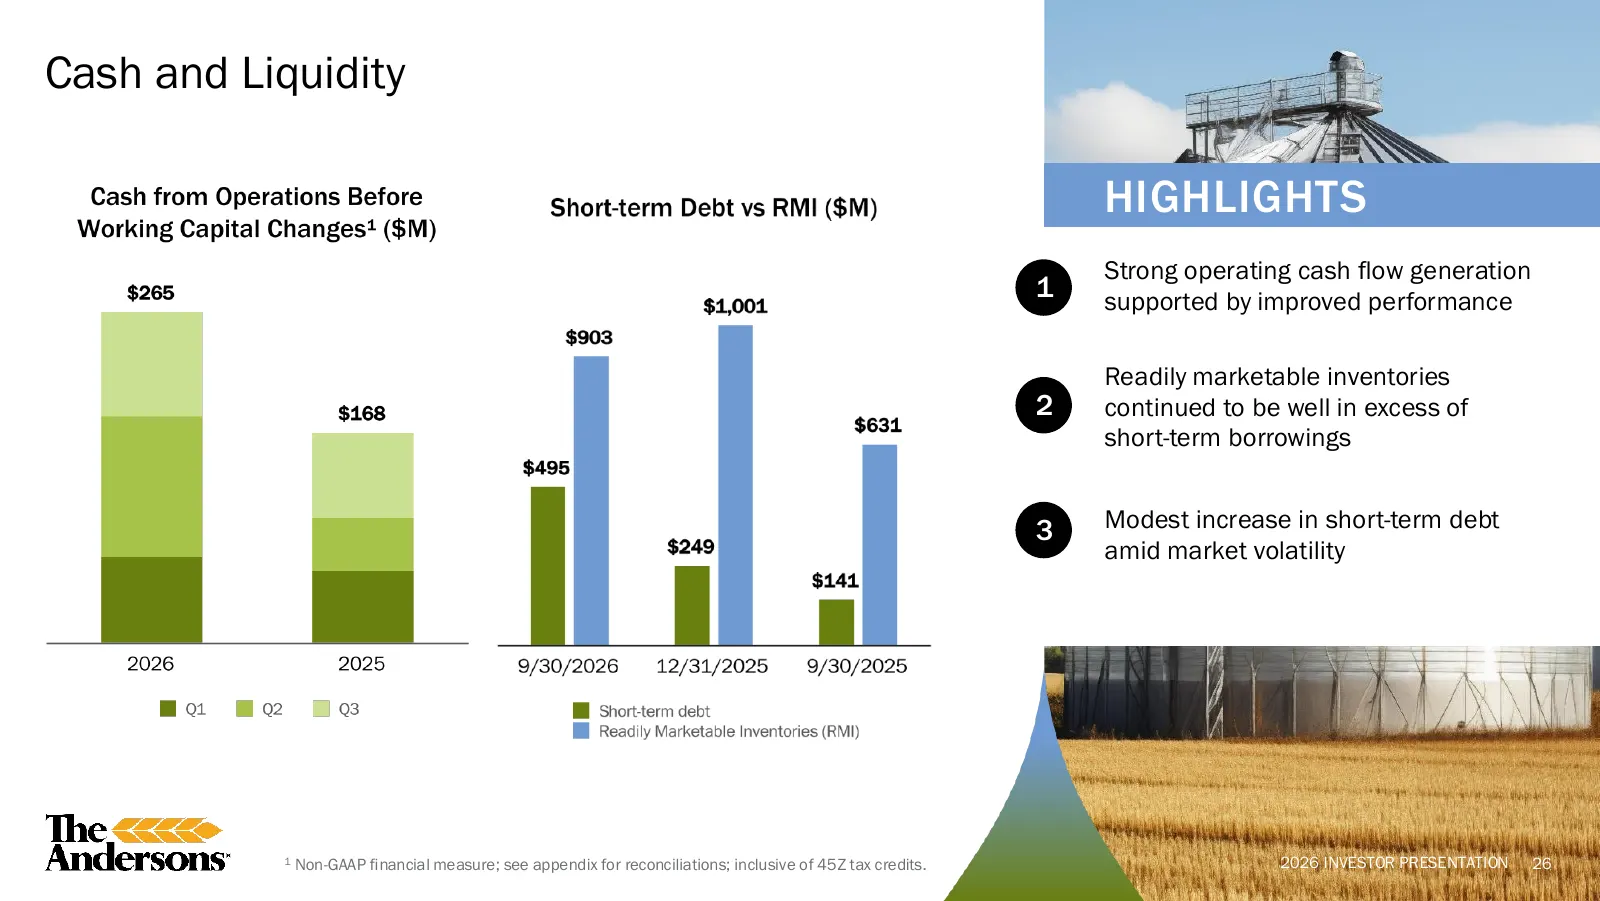
Slide 26: Cash and Liquidity
Cash and Liquidity HIGHLIGHTS Strong operating cash flow generation 1 supported by improved performance Readily marketable inventories 2 continued to be well in excess of short-term borrowings 3 Modest increase in short-term debt amid market volatility 1 Non-GAAP financial measure; see appendix for
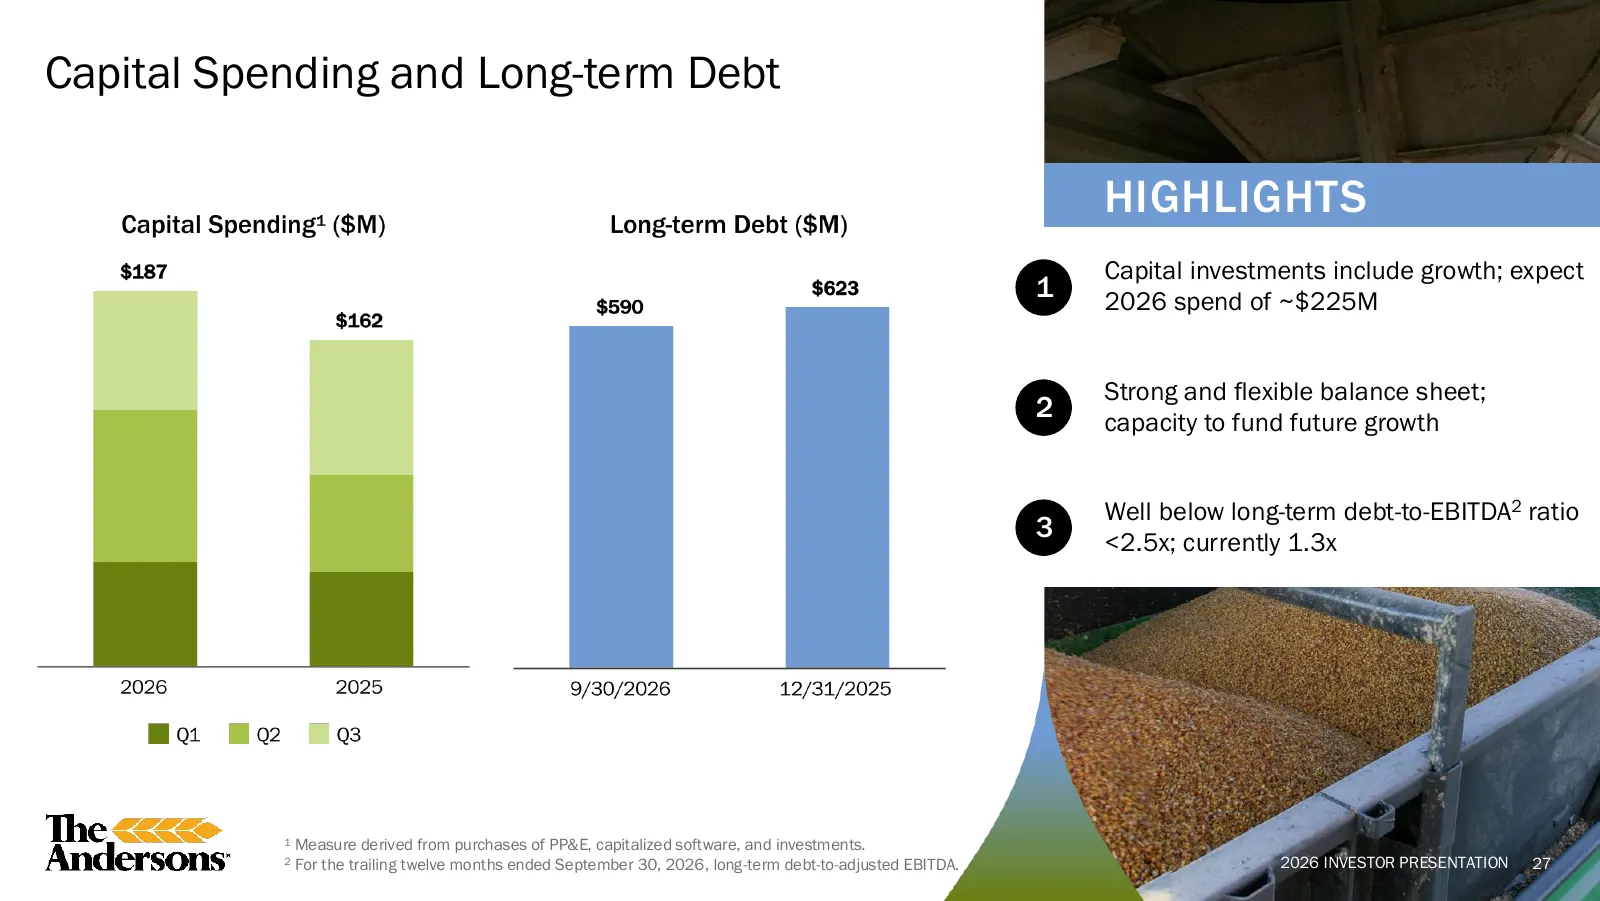
Slide 27: Capital Spending and Long-term Debt
Capital Spending and Long-term Debt HIGHLIGHTS Capital investments include growth; expect 1 2026 spend of ~$225M Strong and flexible balance sheet; 2 capacity to fund future growth Well below long-term debt-to-EBITDA2 ratio 3 <2.5x; currently 1.3x 1 Measure derived from purchases of PP&E, capitalize
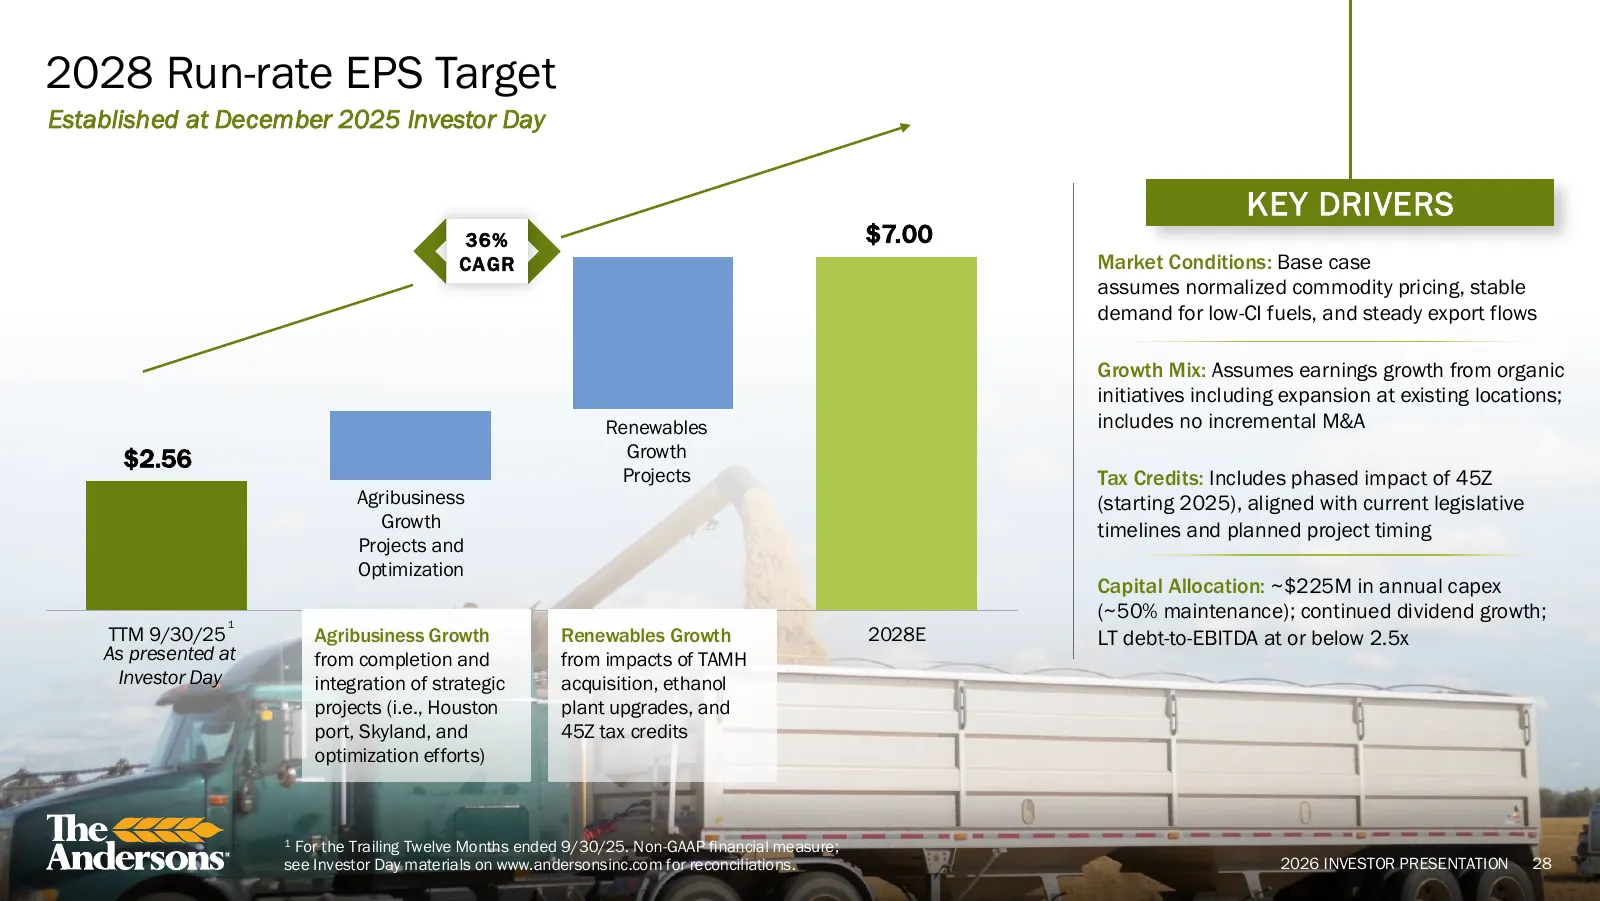
Slide 28: 2028 Run-rate EPS Target
2028 Run-rate EPS Target Established at December 2025 Investor Day KEY DRIVERS 36% $7.00 CAGR Market Conditions: Base case assumes normalized commodity pricing, stable demand for low-CI fuels, and steady export flows Growth Mix: Assumes earnings growth from organic initiatives including expansion at
Slide 29: Outlook
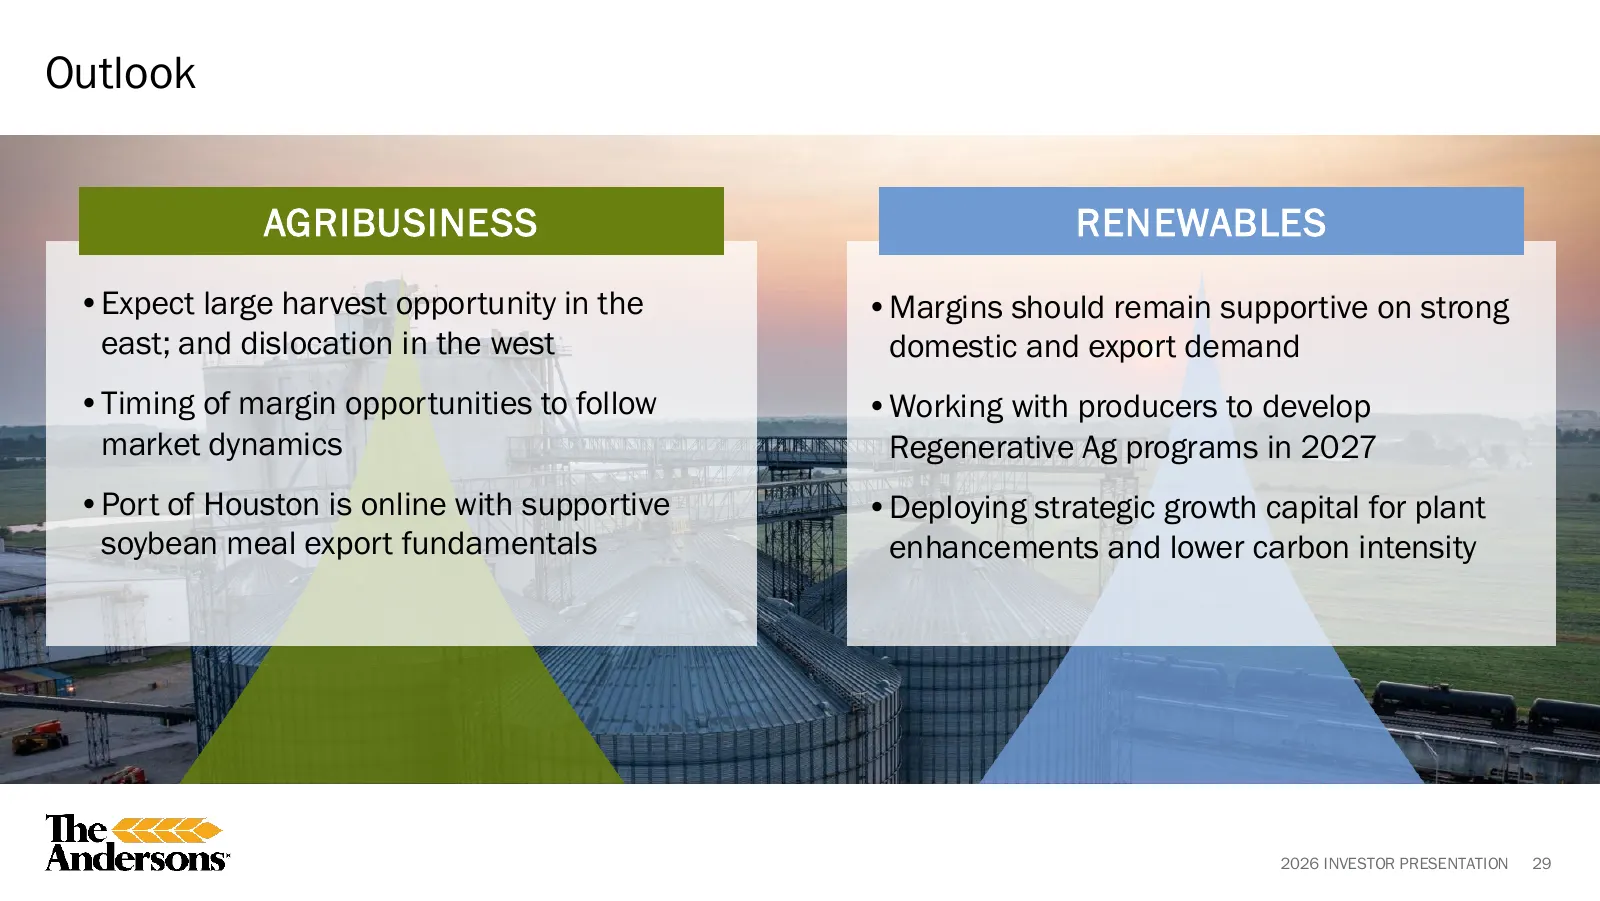
Outlook AGRIBUSINESS RENEWABLES •Expect large harvest opportunity in the •Margins should remain supportive on strong east; and dislocation in the west domestic and export demand •Timing of margin opportunities to follow •Working with producers to develop market dynamics Regenerative Ag programs in 2
Slide 30: Advancing Our Strategy with the Acquisition of Harvestone Low Carbon Partners
+ Advancing Our Strategy with the Acquisition of Harvestone Low Carbon Partners 2026 INVESTOR PRESENTATION
Slide 31: Harvestone Low Carbon Partners: An Industry Leader in Low-Carbon Ethanol
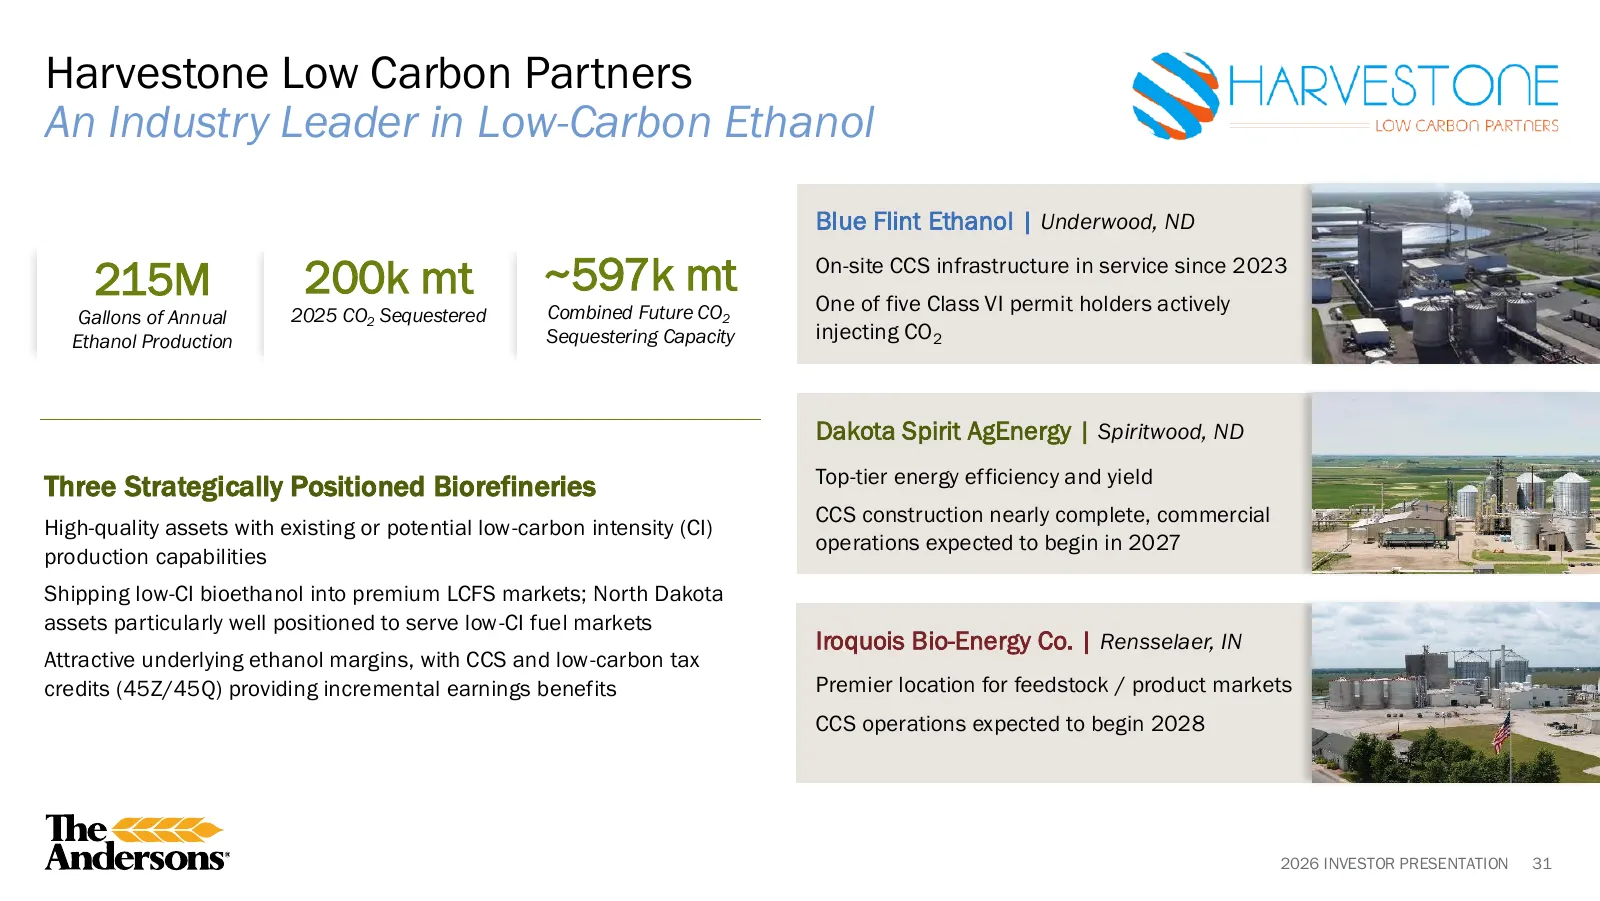
Harvestone Low Carbon Partners An Industry Leader in Low-Carbon Ethanol Blue Flint Ethanol | Underwood, ND 215M 200k mt ~597k mt On-site CCS infrastructure in service since 2023 One of five Class VI permit holders actively Gallons of Annual 2025 CO2 Sequestered Combined Future CO2 Ethanol Production
Slide 32: Unique Opportunity to Expand Renewables Platform with Difficult-to-Replicate Assets
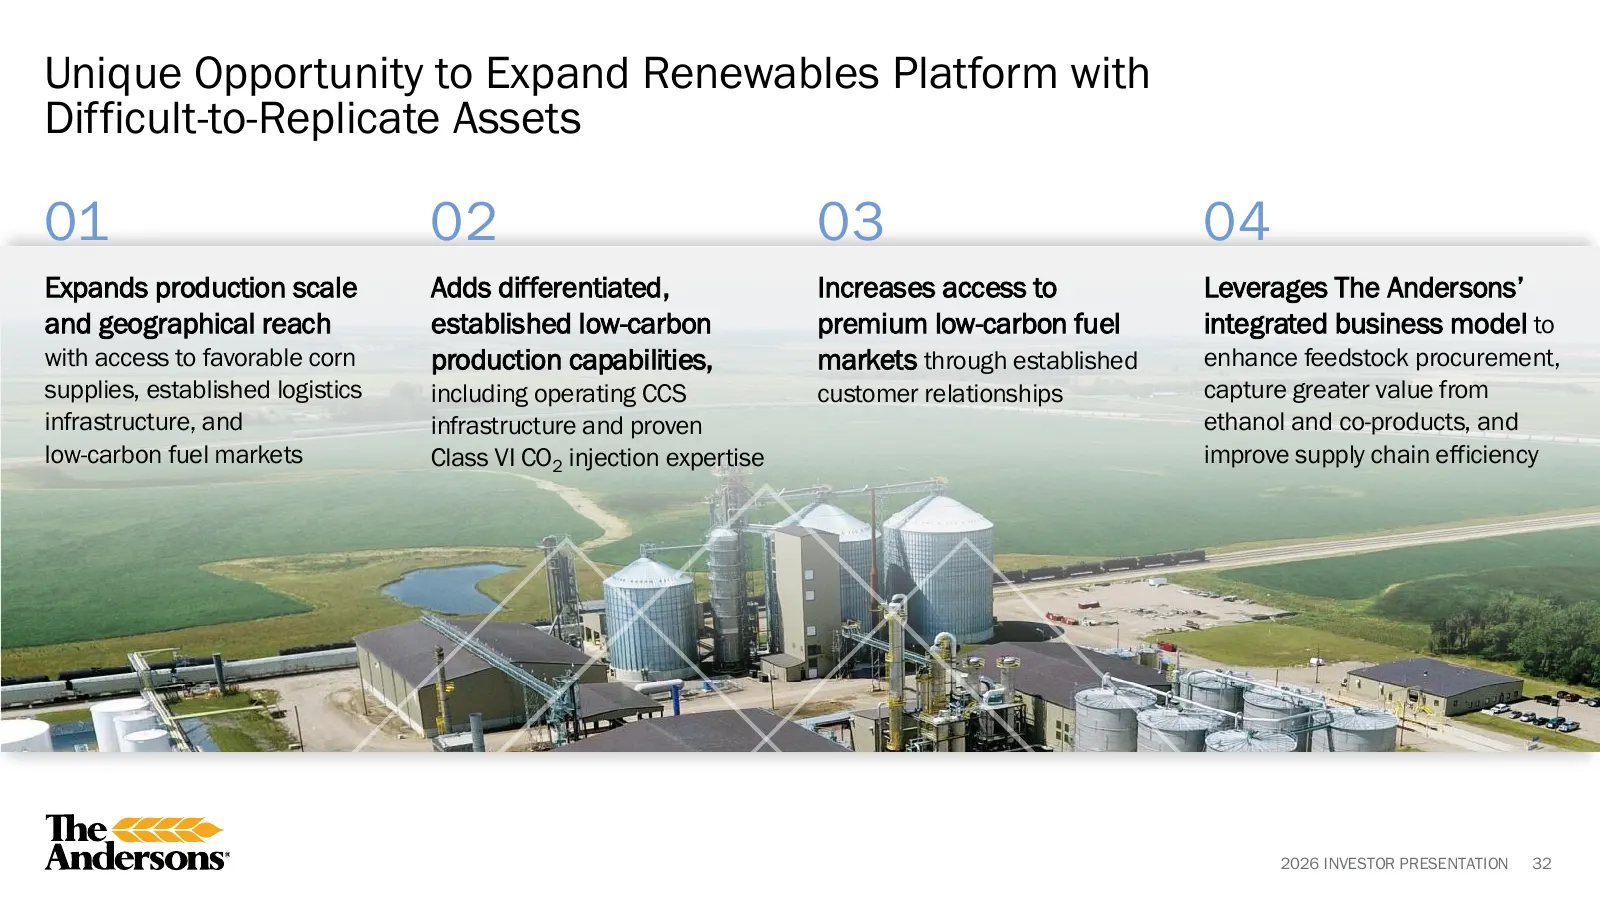
Unique Opportunity to Expand Renewables Platform with Difficult-to-Replicate Assets 01 02 03 04 Expands production scale Adds differentiated, Increases access to Leverages The Andersons’ and geographical reach established low-carbon premium low-carbon fuel integrated business model to with access to
Slide 33: Transaction Overview
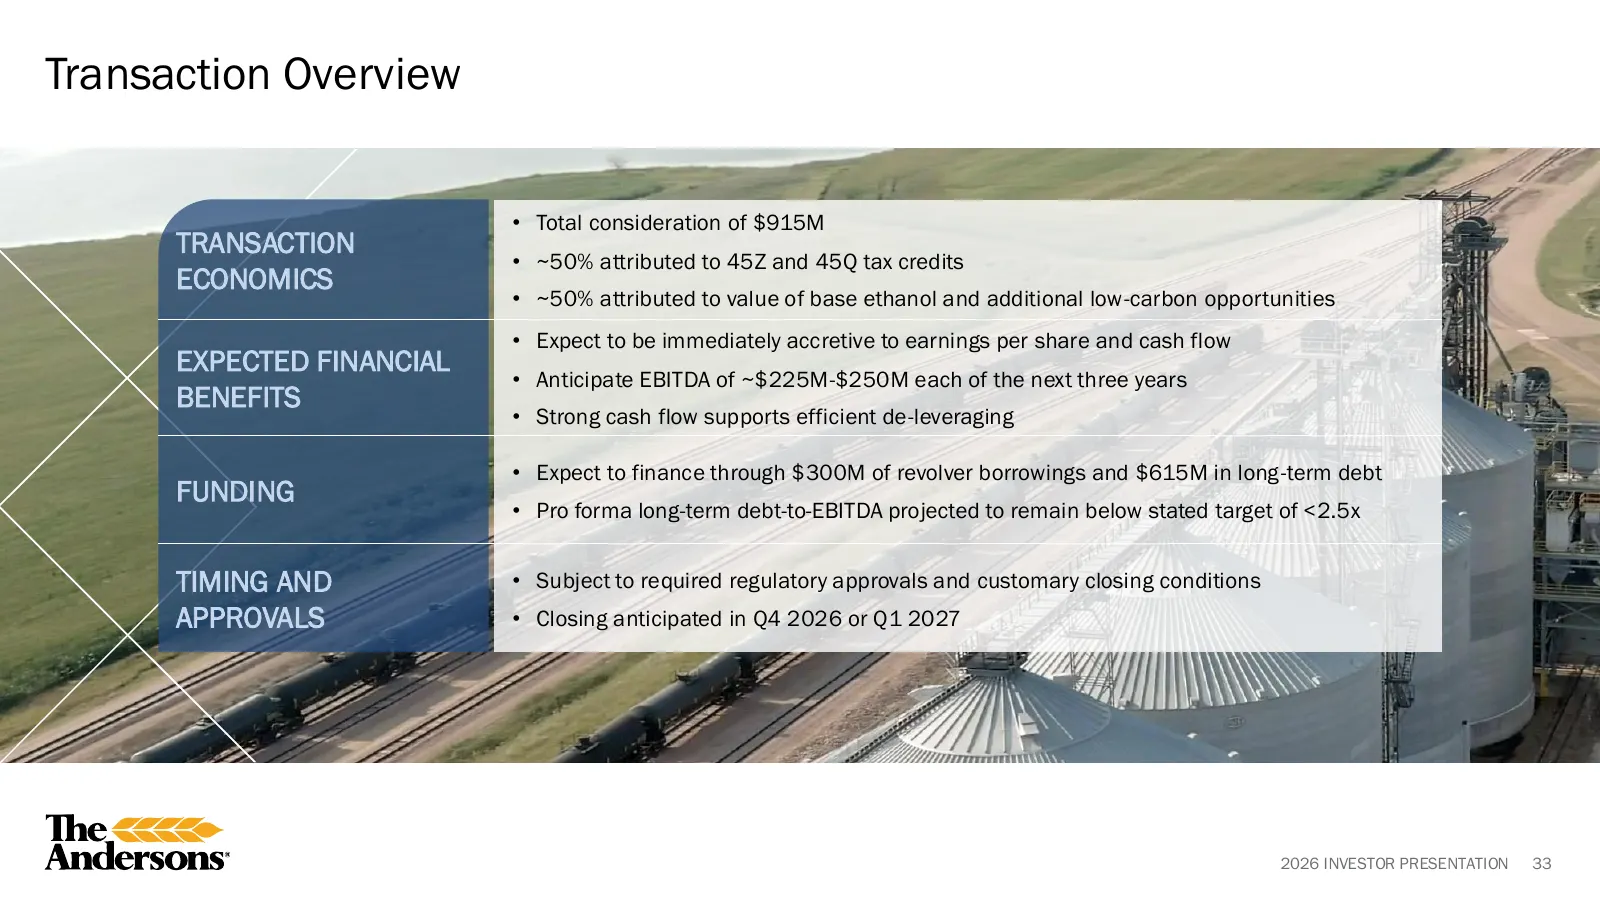
Transaction Overview • Total consideration of $915M TRANSACTION • ~50% attributed to 45Z and 45Q tax credits ECONOMICS • ~50% attributed to value of base ethanol and additional low-carbon opportunities • Expect to be immediately accretive to earnings per share and cash flow EXPECTED FINANCIAL • Anti
Slide 34: Acquisition Aligned with Long-term Strategic Framework for Profitable Growth
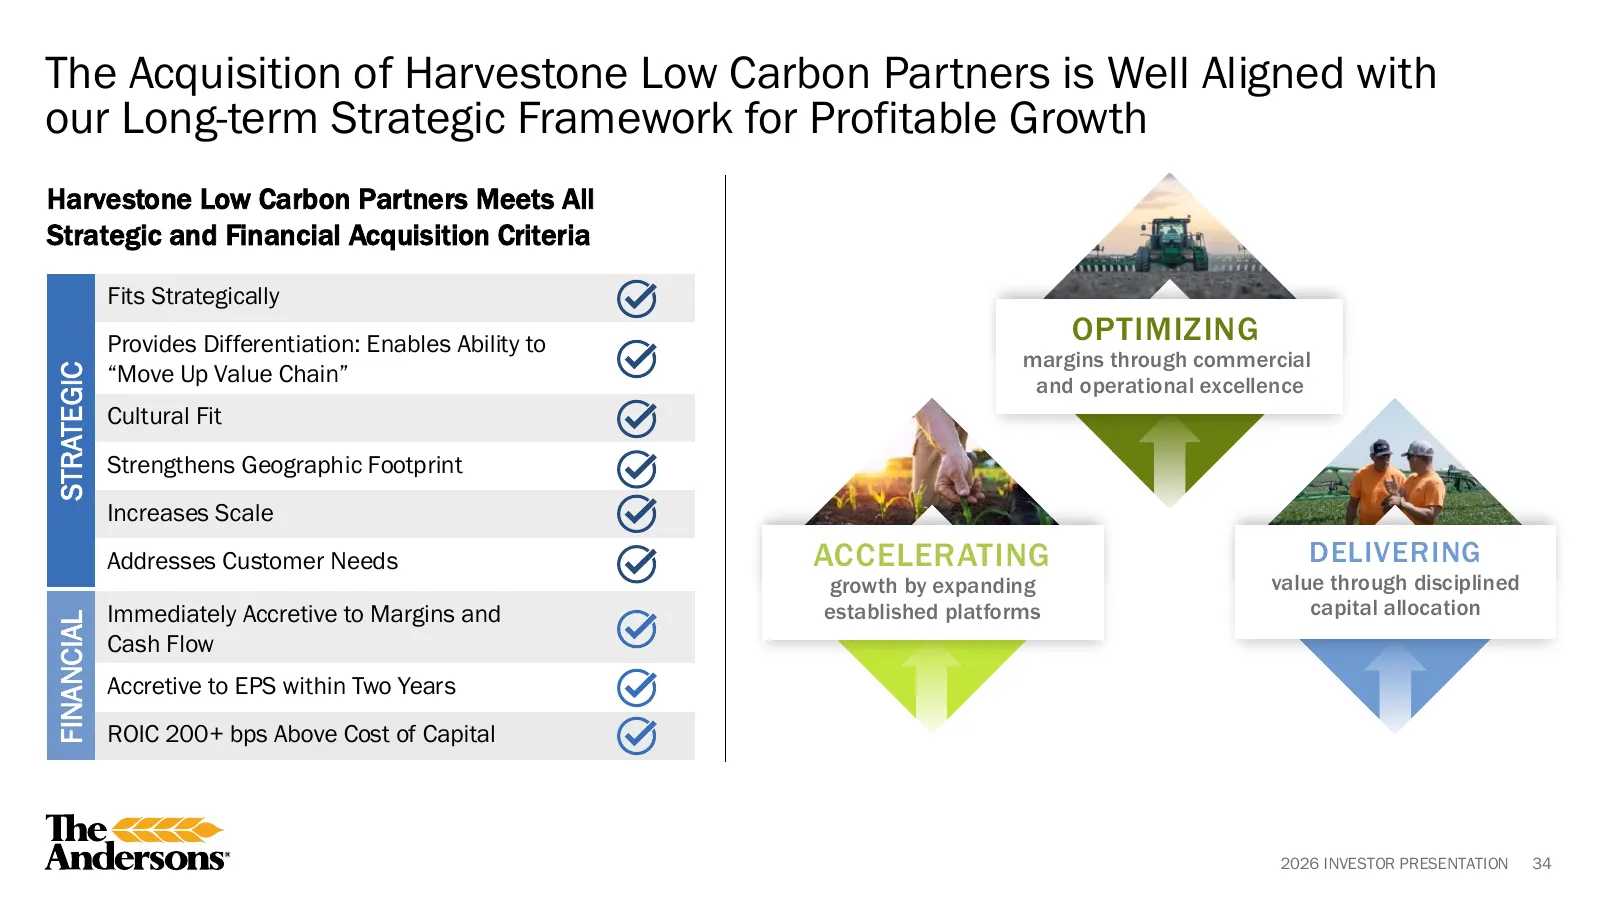
The Acquisition of Harvestone Low Carbon Partners is Well Aligned with our Long-term Strategic Framework for Profitable Growth Harvestone Low Carbon Partners Meets All Strategic and Financial Acquisition Criteria Fits Strategically Provides Differentiation: Enables Ability to OPTIMIZING margins thro
Slide 35: Invest with Us
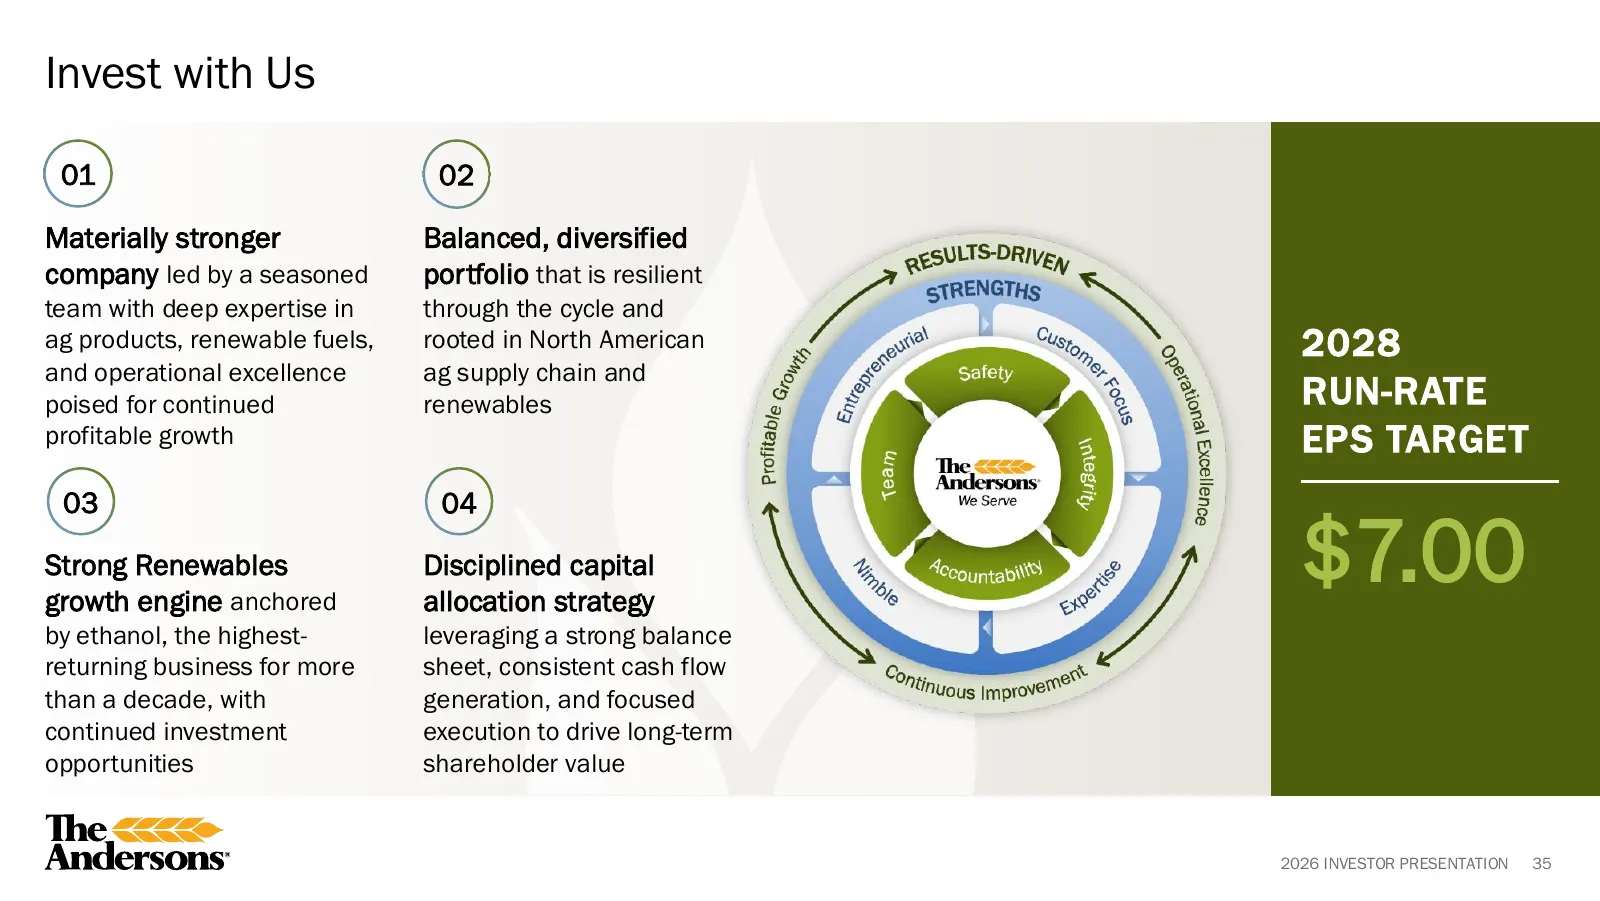
Invest with Us 01 02 Materially stronger Balanced, diversified company led by a seasoned portfolio that is resilient team with deep expertise in through the cycle and ag products, renewable fuels, rooted in North American 2028 and operational excellence ag supply chain and poised for continued renew
Slide 36: Appendix: Supplemental Slides and Non-GAAP Reconciliations
Appendix WE SERVE Supplemental Slides and Non-GAAP Reconciliations 2026 INVESTOR PRESENTATION 36
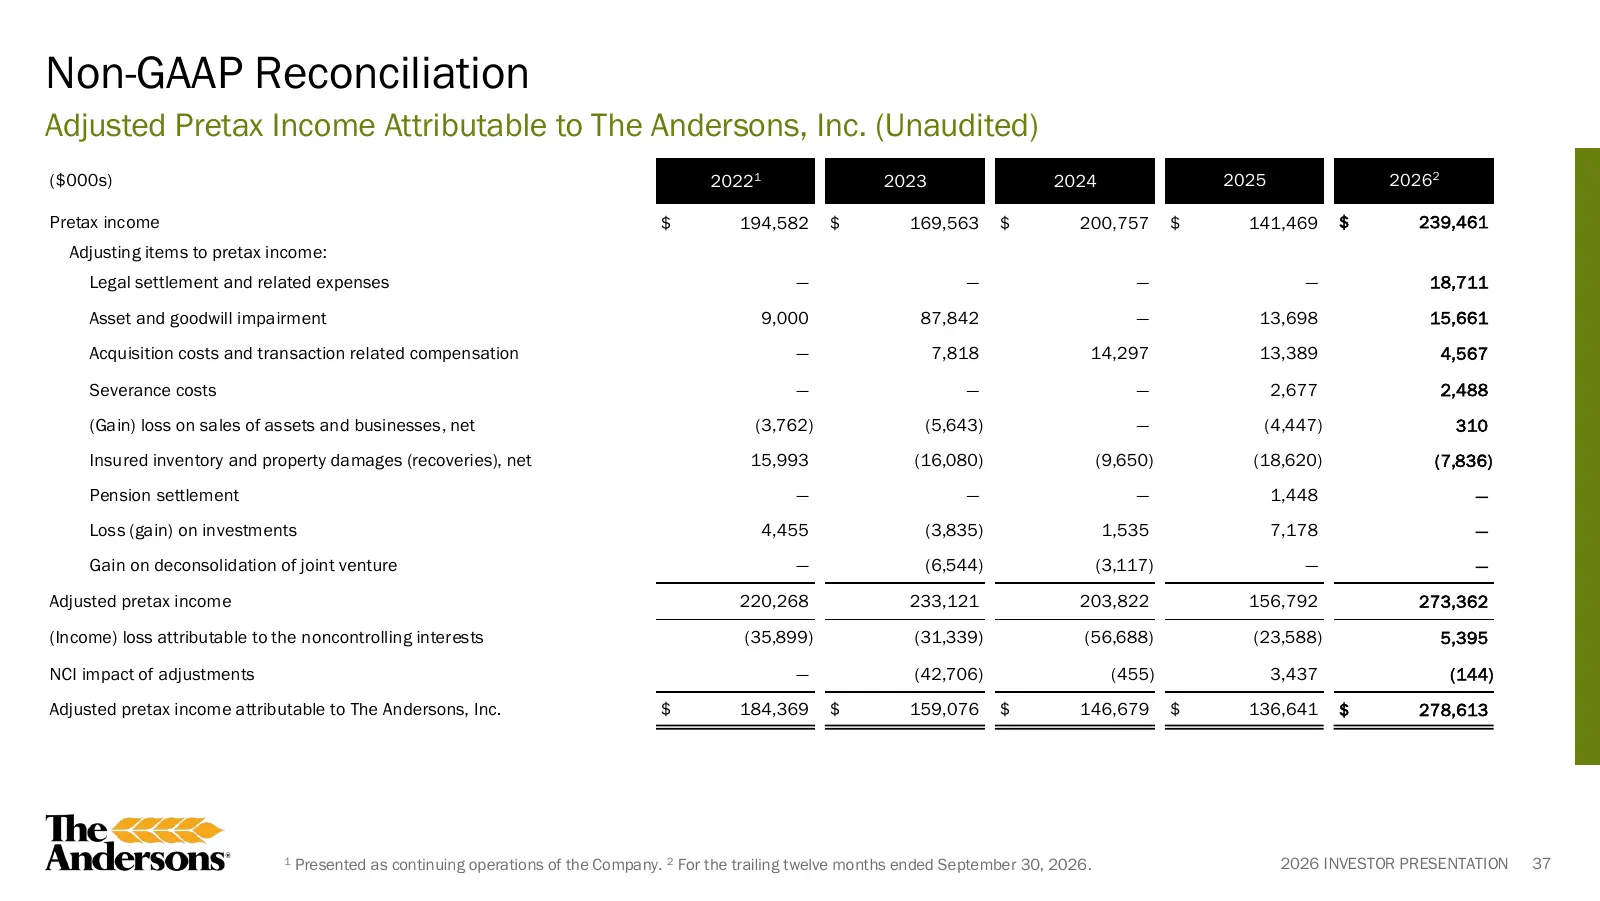
Slide 37: Non-GAAP Reconciliation
Non-GAAP Reconciliation Adjusted Pretax Income Attributable to The Andersons, Inc. (Unaudited) ($000s) 20221 2023 2024 2025 20262 Pretax income $ 194,582 $ 169,563 $ 200,757 $ 141,469 $ 239,461 Adjusting items to pretax income: Legal settlement and related expenses — — — — 18,711 Asset and goodwill
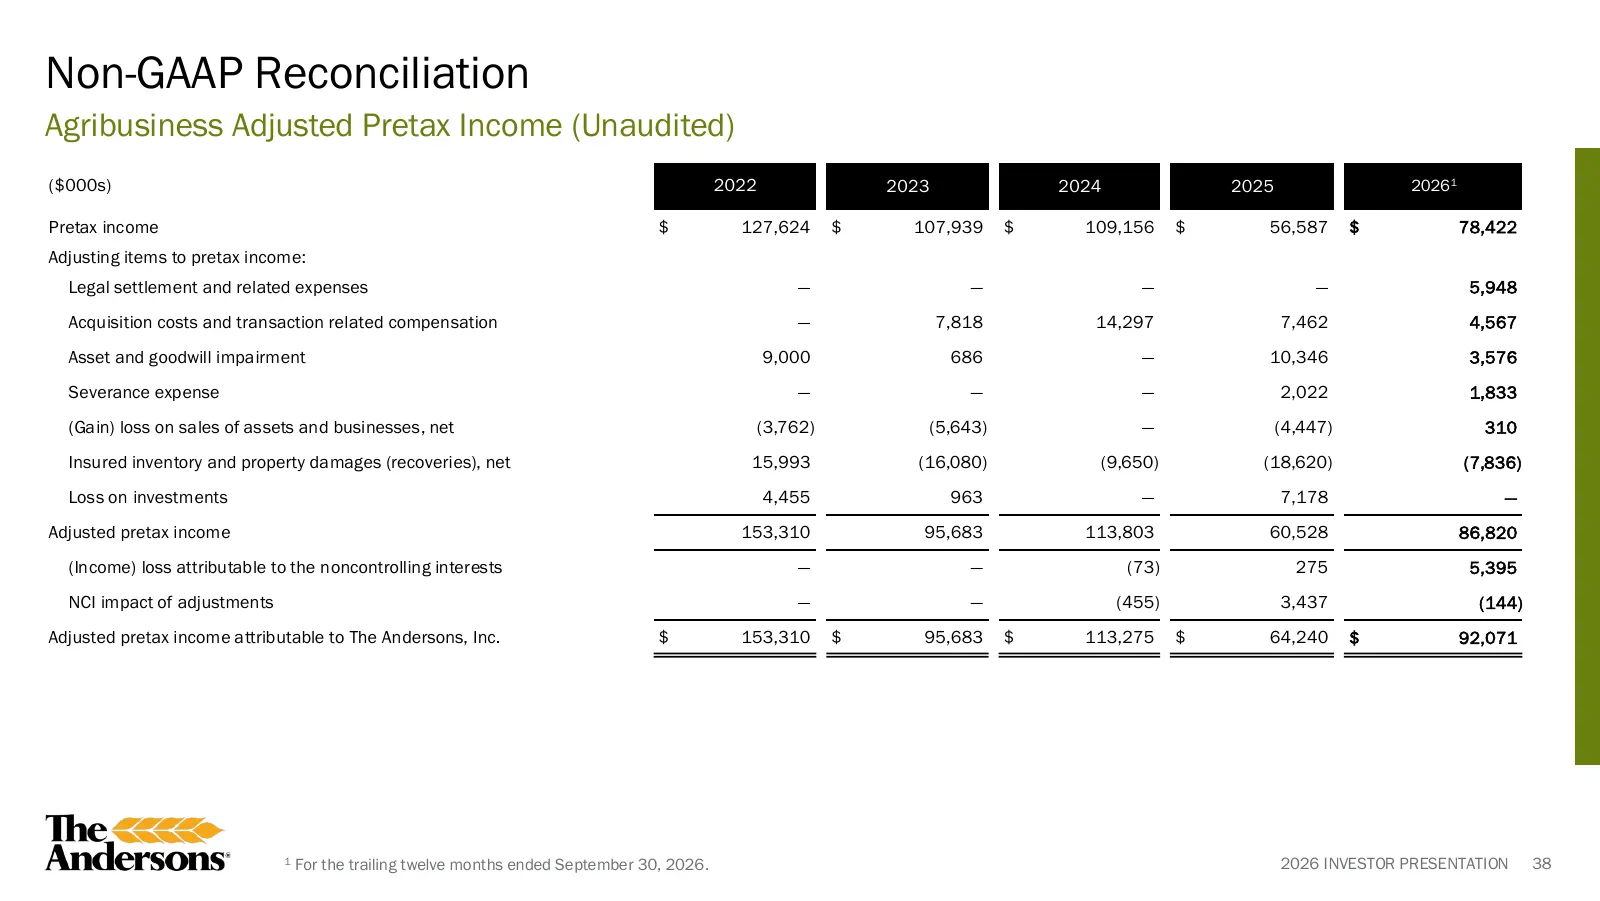
Slide 38: Non-GAAP Reconciliation
Non-GAAP Reconciliation Agribusiness Adjusted Pretax Income (Unaudited) ($000s) 2022 2023 2024 2025 2026 1 Pretax income $ 127,624 $ 107,939 $ 109,156 $ 56,587 $ 78,422 Adjusting items to pretax income: Legal settlement and related expenses — — — — 5,948 Acquisition costs and transaction related com
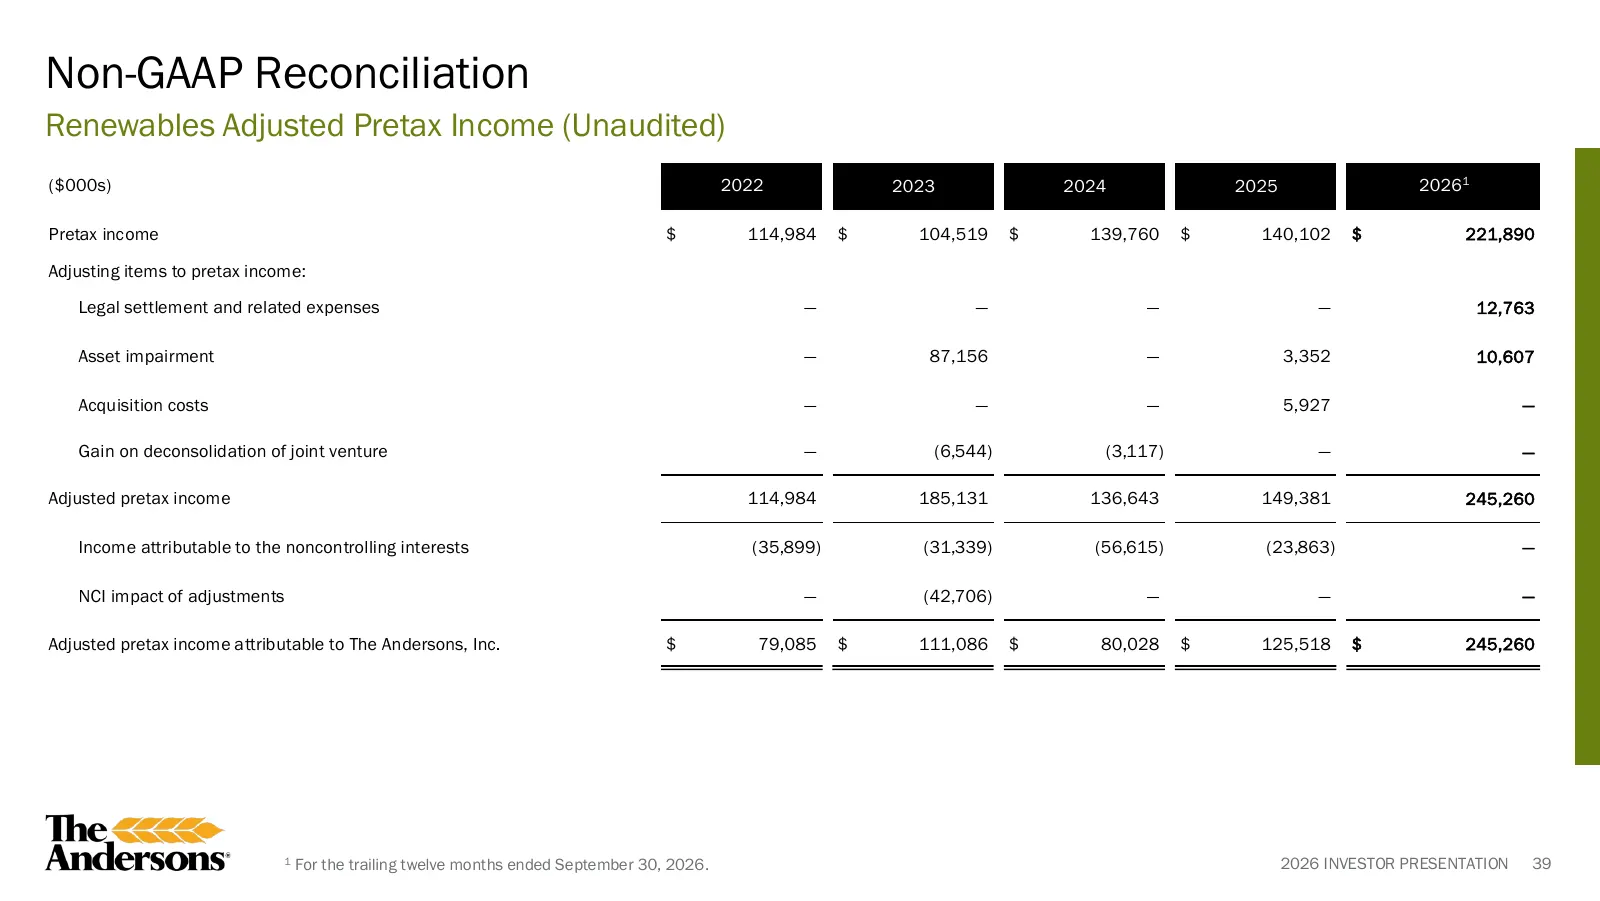
Slide 39: Non-GAAP Reconciliation
Non-GAAP Reconciliation Renewables Adjusted Pretax Income (Unaudited) ($000s) 2022 2023 2024 2025 20261 Pretax income $ 114,984 $ 104,519 $ 139,760 $ 140,102 $ 221,890 Adjusting items to pretax income: Legal settlement and related expenses — — — — 12,763 Asset impairment — 87,156 — 3,352 10,607 Acqu
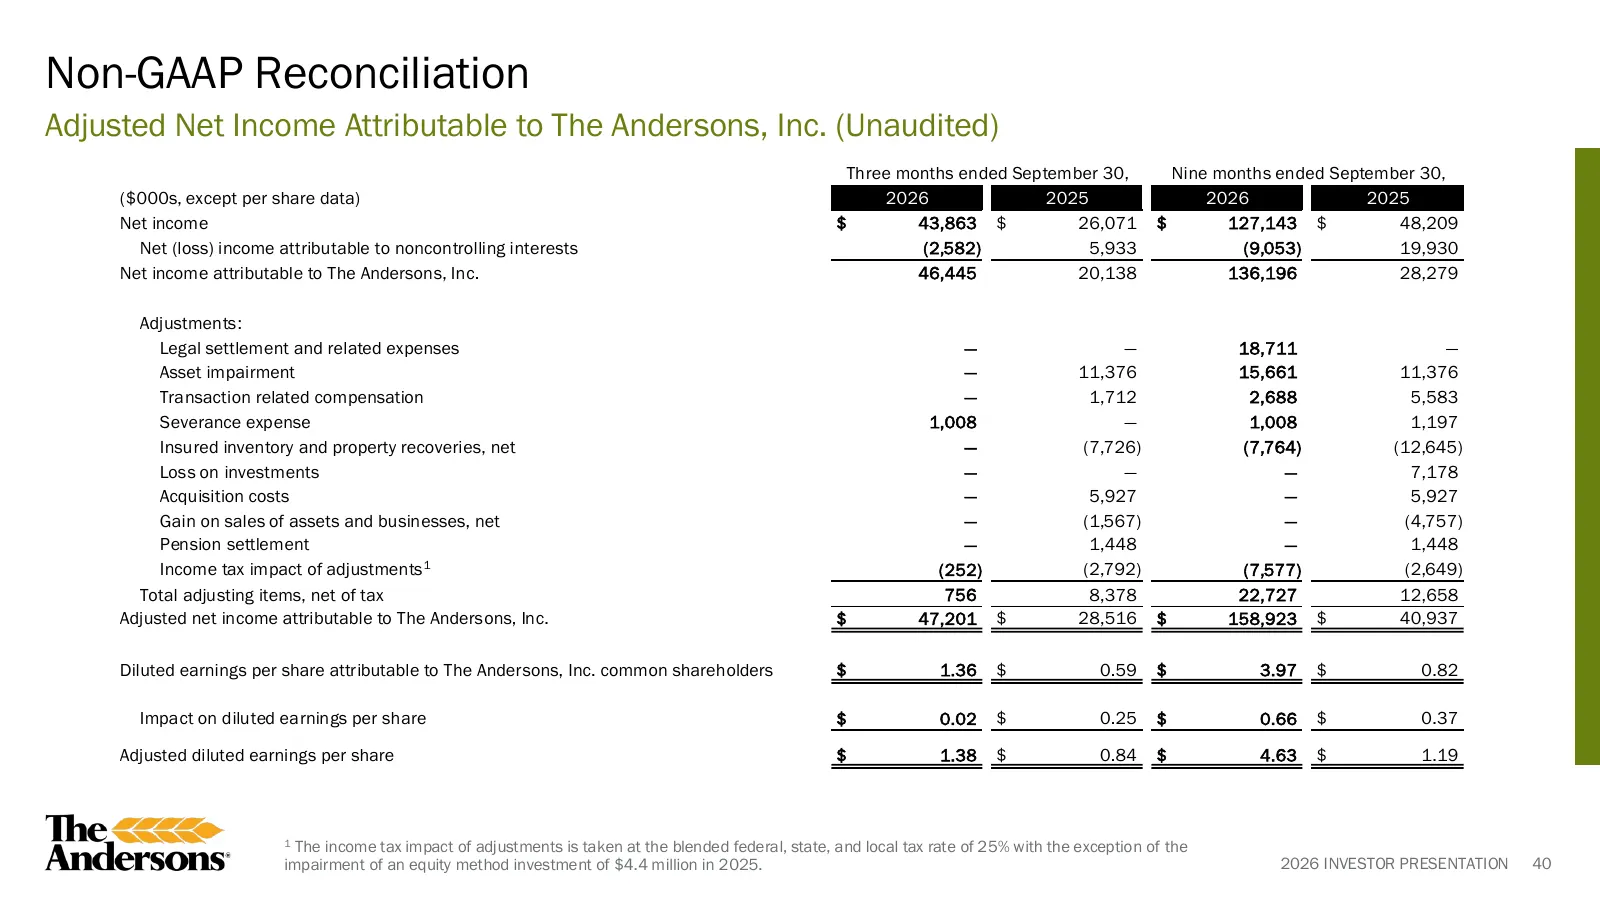
Slide 40: Non-GAAP Reconciliation
Non-GAAP Reconciliation Adjusted Net Income Attributable to The Andersons, Inc. (Unaudited) Three months ended September 30, Nine months ended September 30, ($000s, except per share data) 2026 2025 2026 2025 Net income $ 43,863 $ 26,071 $ 127,143 $ 48,209 Net (loss) income attributable to noncontrol
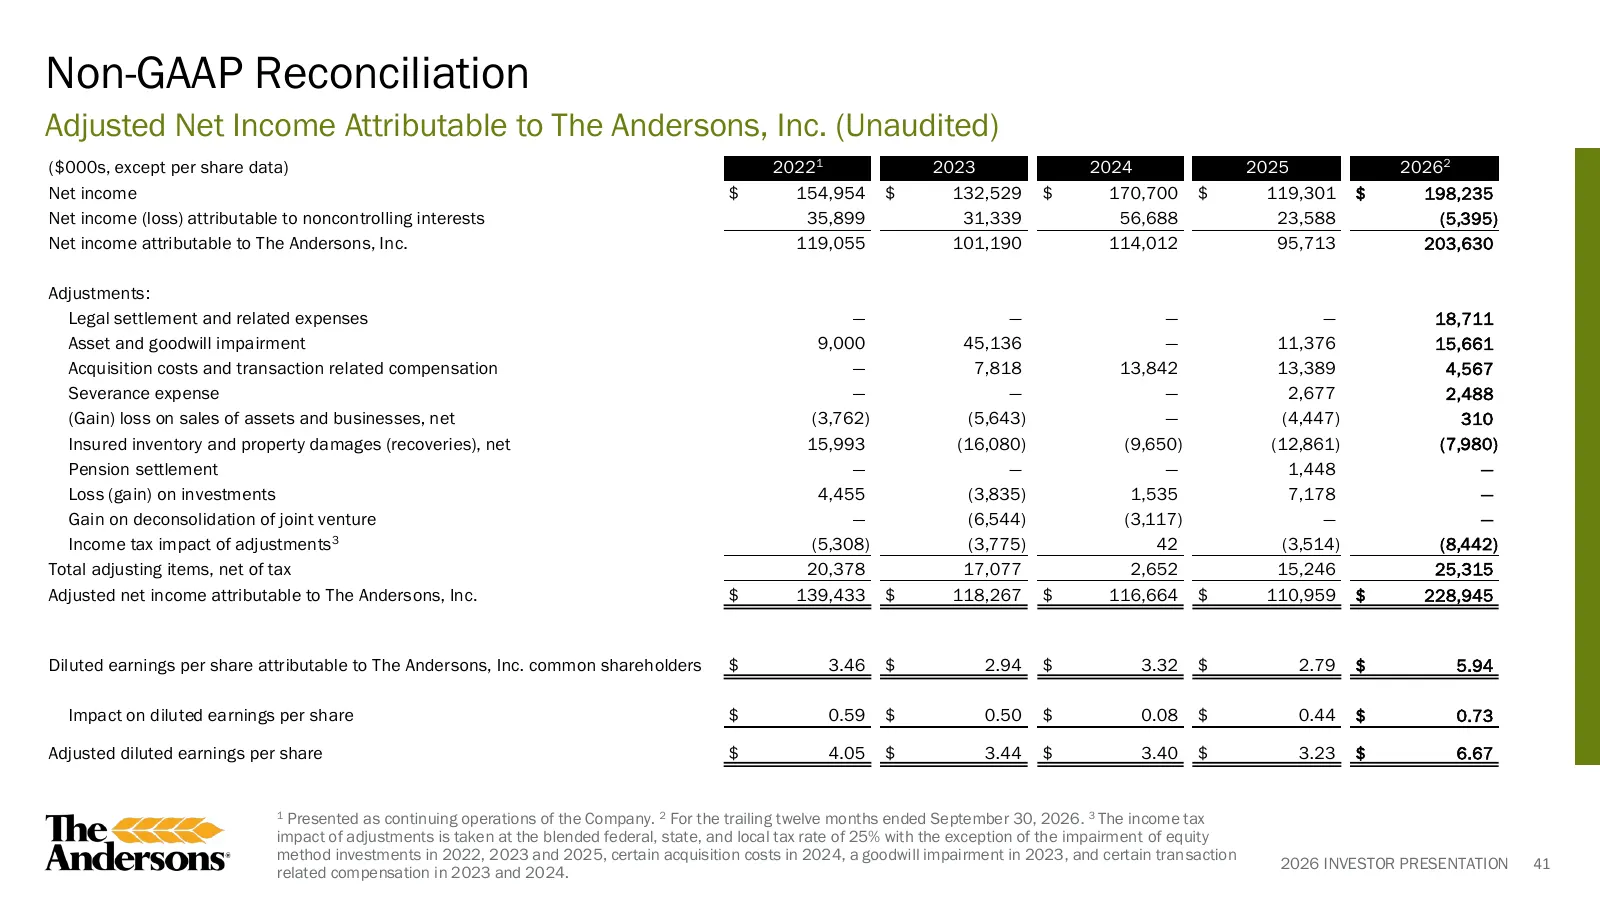
Slide 41: Non-GAAP Reconciliation
Non-GAAP Reconciliation Adjusted Net Income Attributable to The Andersons, Inc. (Unaudited) ($000s, except per share data) 20221 2023 2024 2025 20262 Net income $ 154,954 $ 132,529 $ 170,700 $ 119,301 $ 198,235 Net income (loss) attributable to noncontrolling interests 35,899 31,339 56,688 23,588 (5
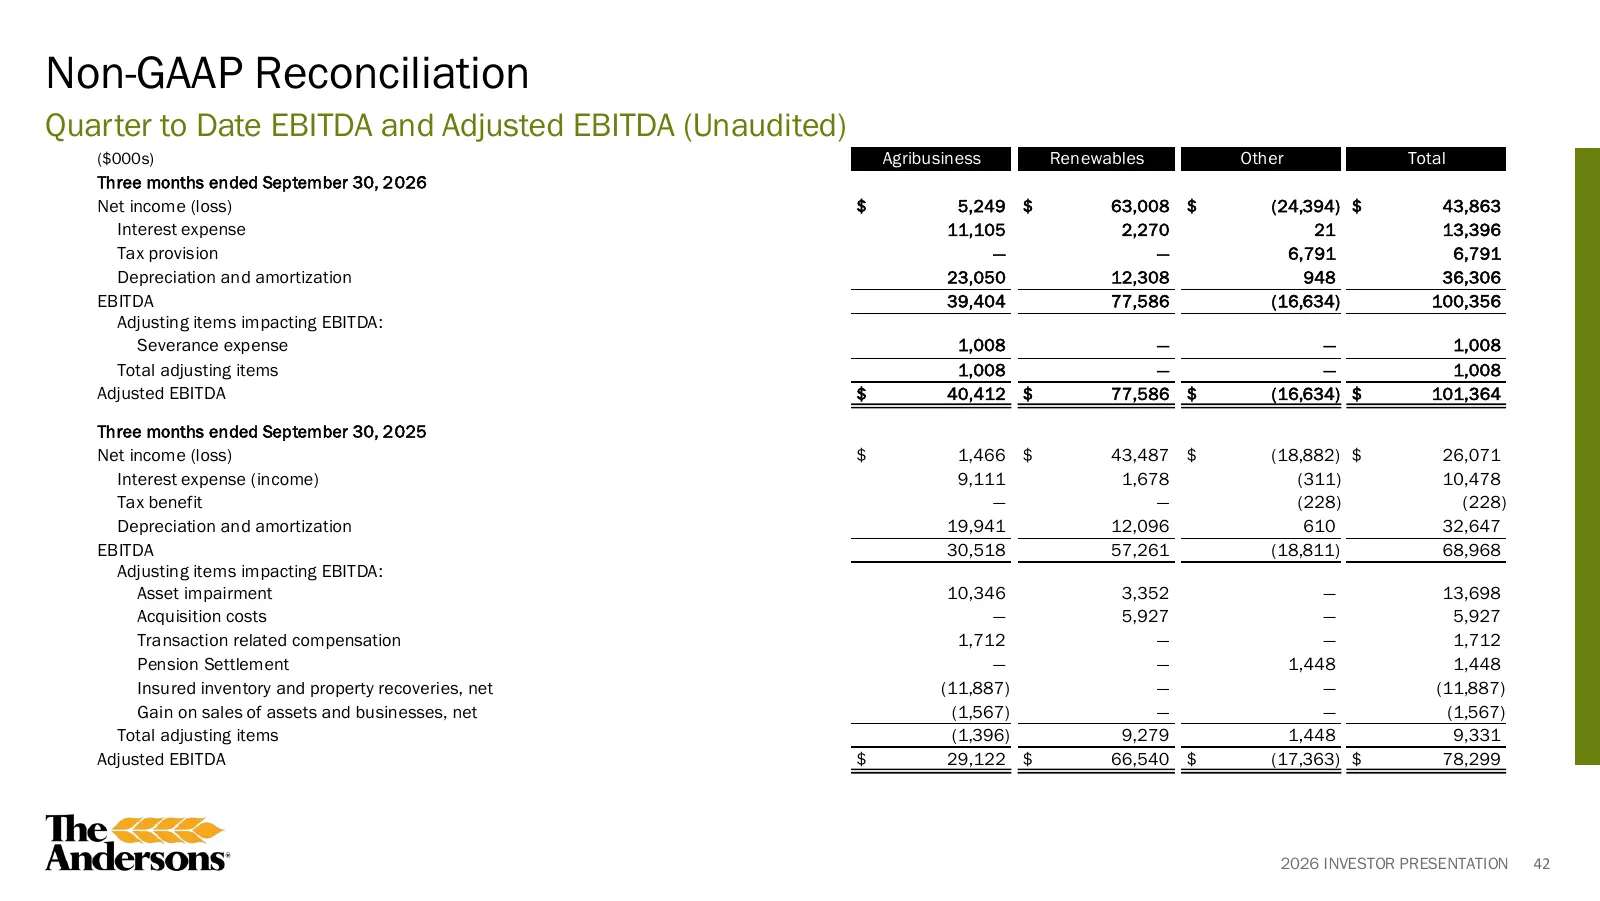
Slide 42: Non-GAAP Reconciliation
Non-GAAP Reconciliation Quarter to Date EBITDA and Adjusted EBITDA (Unaudited) ($000s) Agribusiness Renewables Other Total Three months ended September 30, 2026 Net income (loss) $ 5,249 $ 63,008 $ (24,394) $ 43,863 Interest expense 11,105 2,270 21 13,396 Tax provision — — 6,791 6,791 Depreciation a
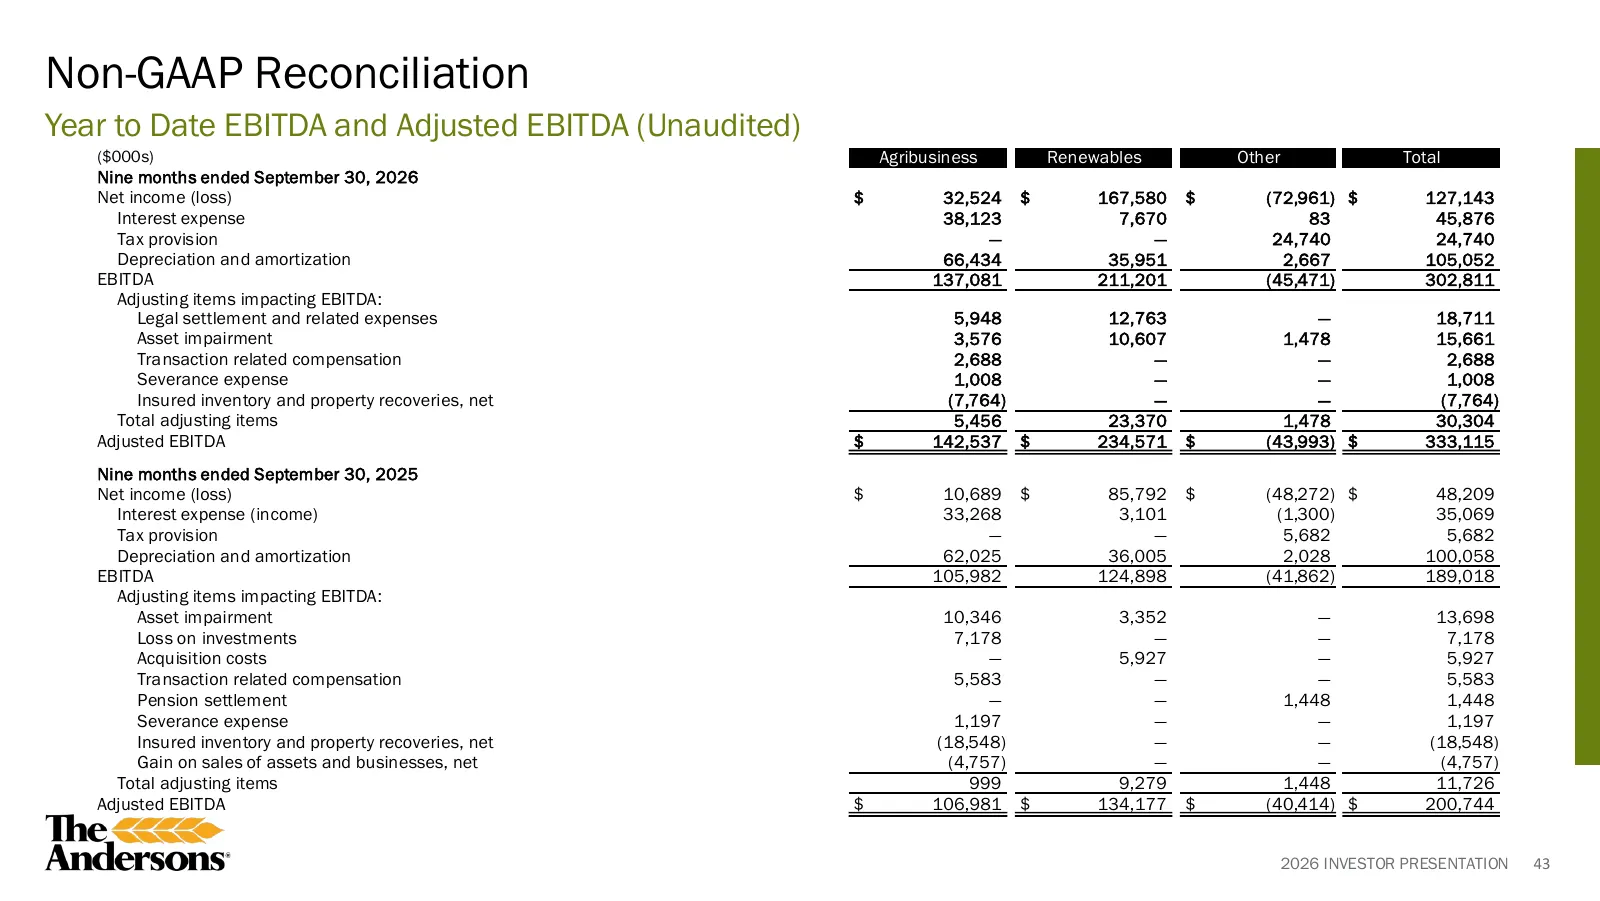
Slide 43: Non-GAAP Reconciliation
Non-GAAP Reconciliation Year to Date EBITDA and Adjusted EBITDA (Unaudited) ($000s) Agribusiness Renewables Other Total Nine months ended September 30, 2026 Net income (loss) $ 32,524 $ 167,580 $ (72,961) $ 127,143 Interest expense 38,123 7,670 83 45,876 Tax provision — — 24,740 24,740 Depreciation
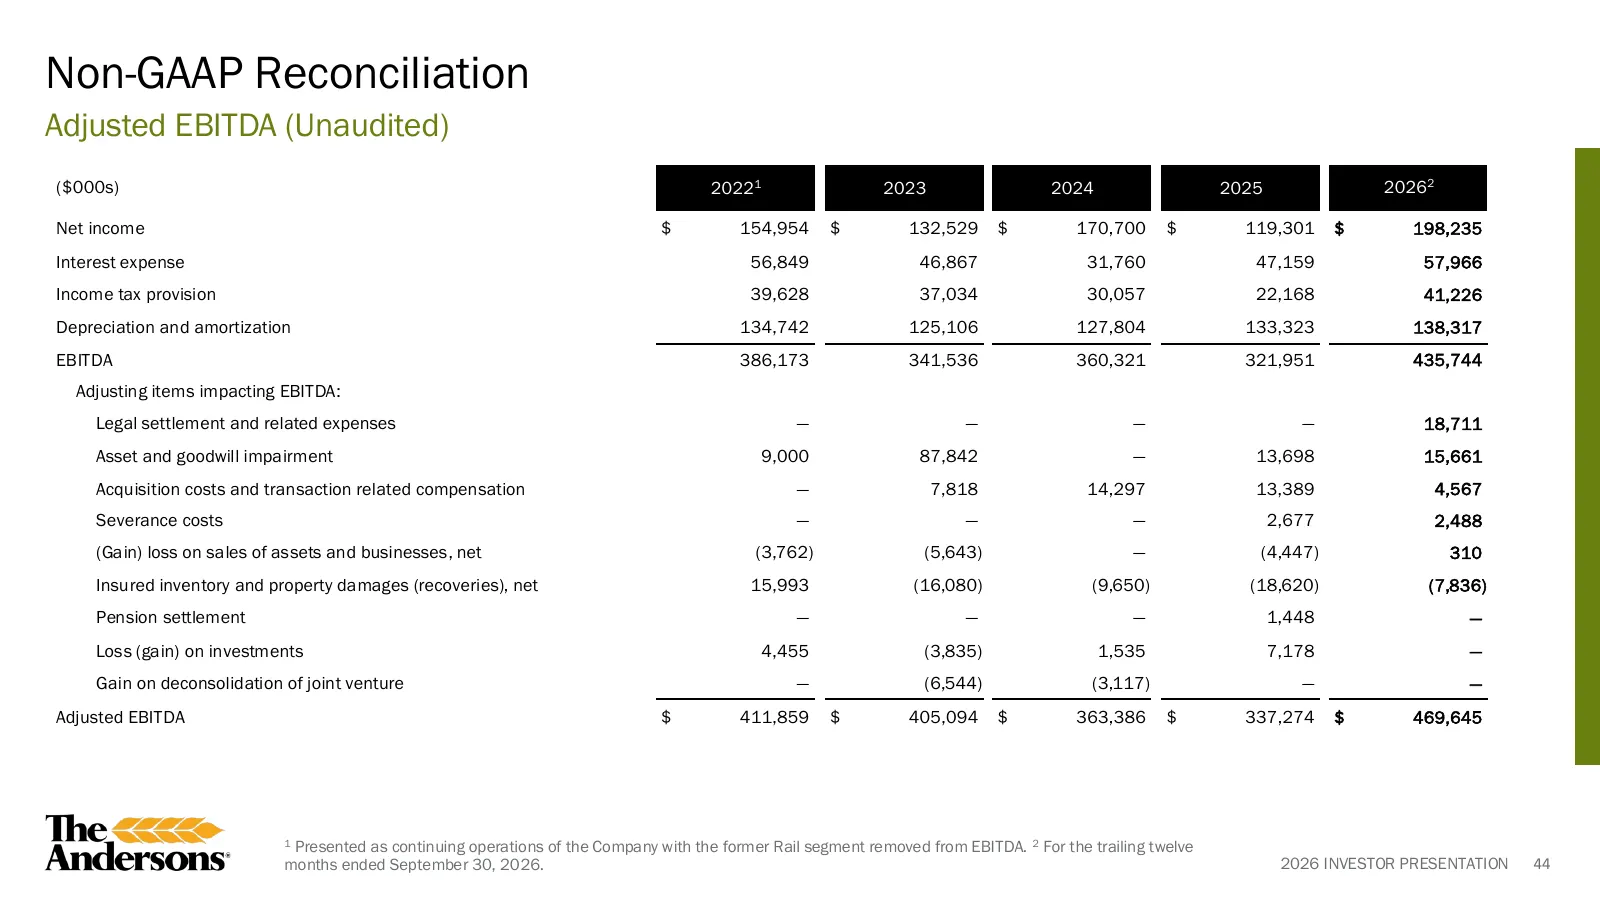
Slide 44: Non-GAAP Reconciliation
Non-GAAP Reconciliation Adjusted EBITDA (Unaudited) ($000s) 20221 2023 2024 2025 20262 Net income $ 154,954 $ 132,529 $ 170,700 $ 119,301 $ 198,235 Interest expense 56,849 46,867 31,760 47,159 57,966 Income tax provision 39,628 37,034 30,057 22,168 41,226 Depreciation and amortization 134,742 125,10
Slide 45: Non-GAAP Reconciliation
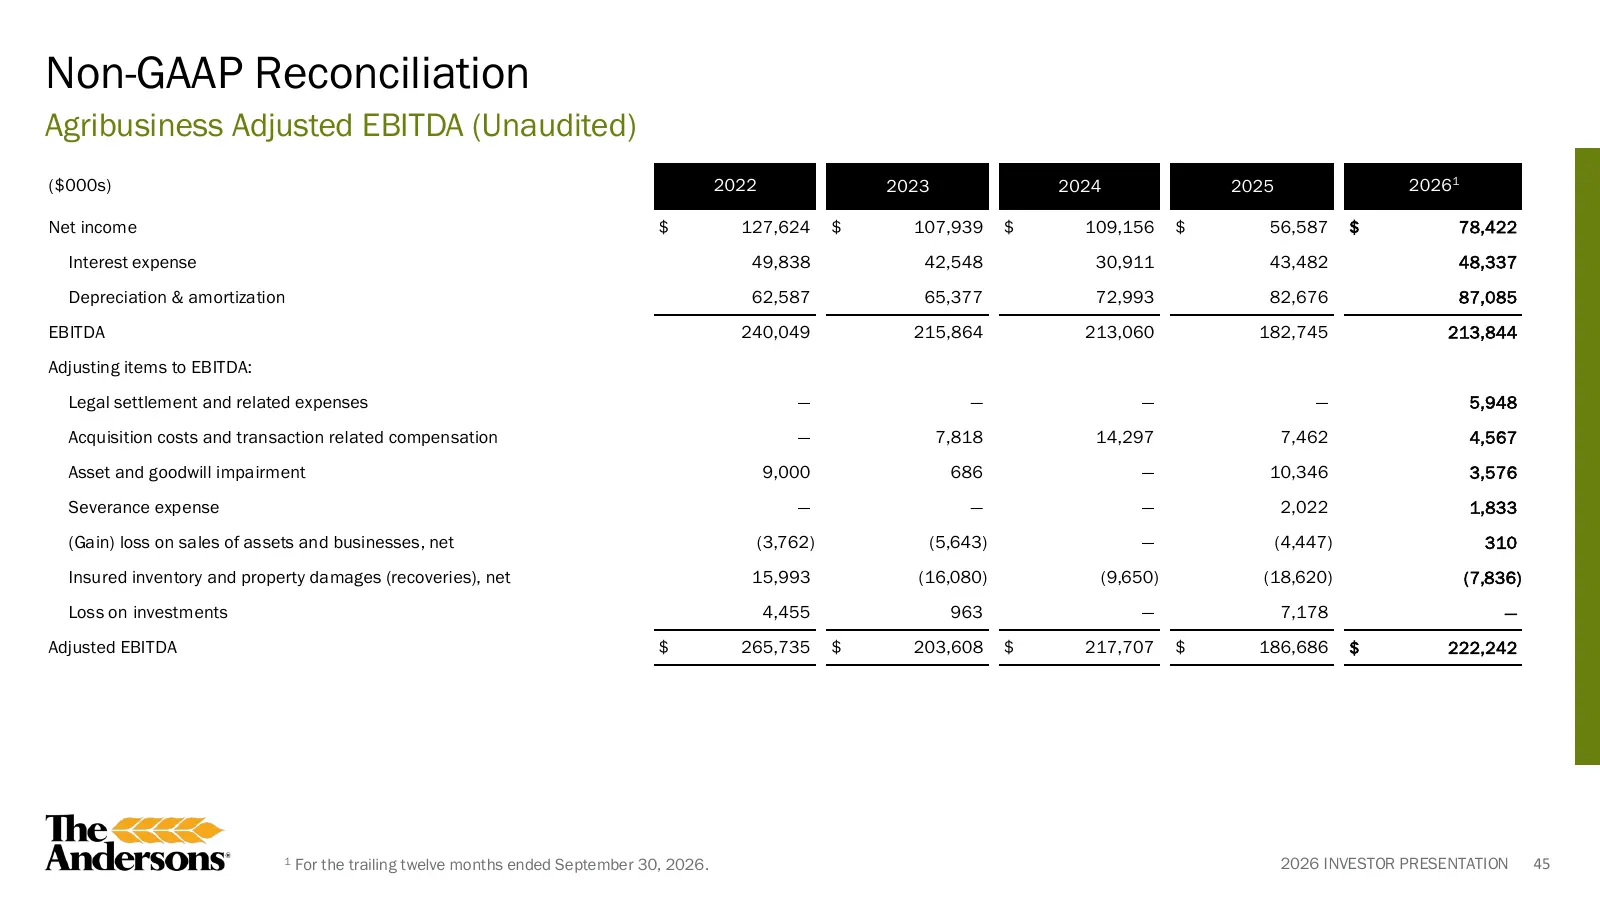
Non-GAAP Reconciliation Agribusiness Adjusted EBITDA (Unaudited) ($000s) 2022 2023 2024 2025 20261 Net income $ 127,624 $ 107,939 $ 109,156 $ 56,587 $ 78,422 Interest expense 49,838 42,548 30,911 43,482 48,337 Depreciation & amortization 62,587 65,377 72,993 82,676 87,085 EBITDA 240,049 215,864 213,
Slide 46: Non-GAAP Reconciliation
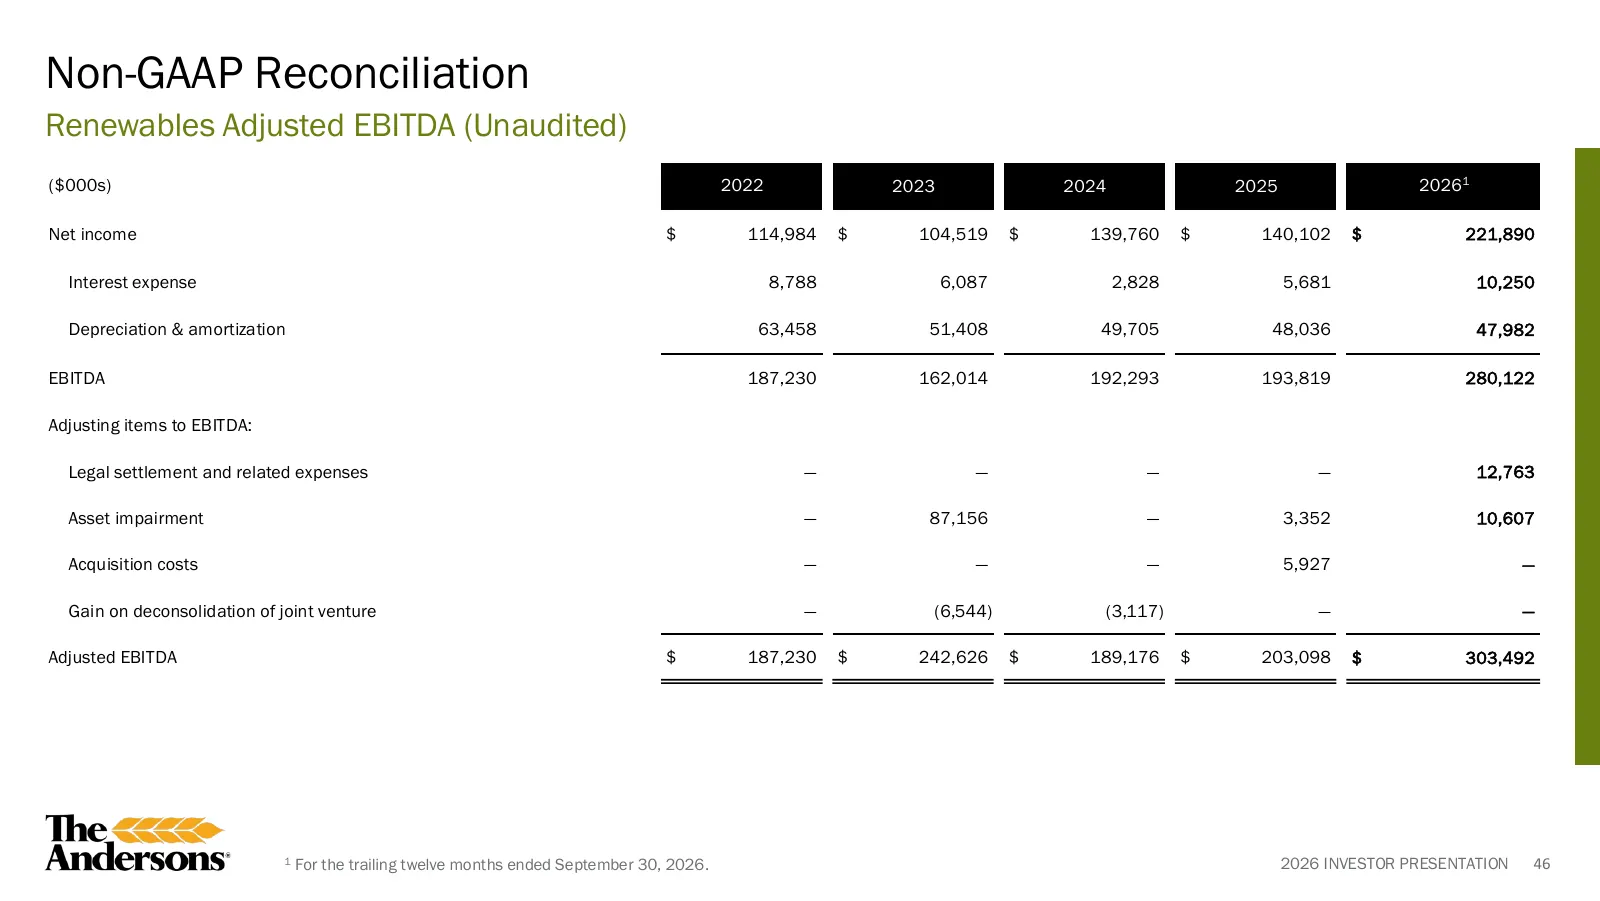
Non-GAAP Reconciliation Renewables Adjusted EBITDA (Unaudited) ($000s) 2022 2023 2024 2025 20261 Net income $ 114,984 $ 104,519 $ 139,760 $ 140,102 $ 221,890 Interest expense 8,788 6,087 2,828 5,681 10,250 Depreciation & amortization 63,458 51,408 49,705 48,036 47,982 EBITDA 187,230 162,014 192,293
Slide 47: Non-GAAP Reconciliation
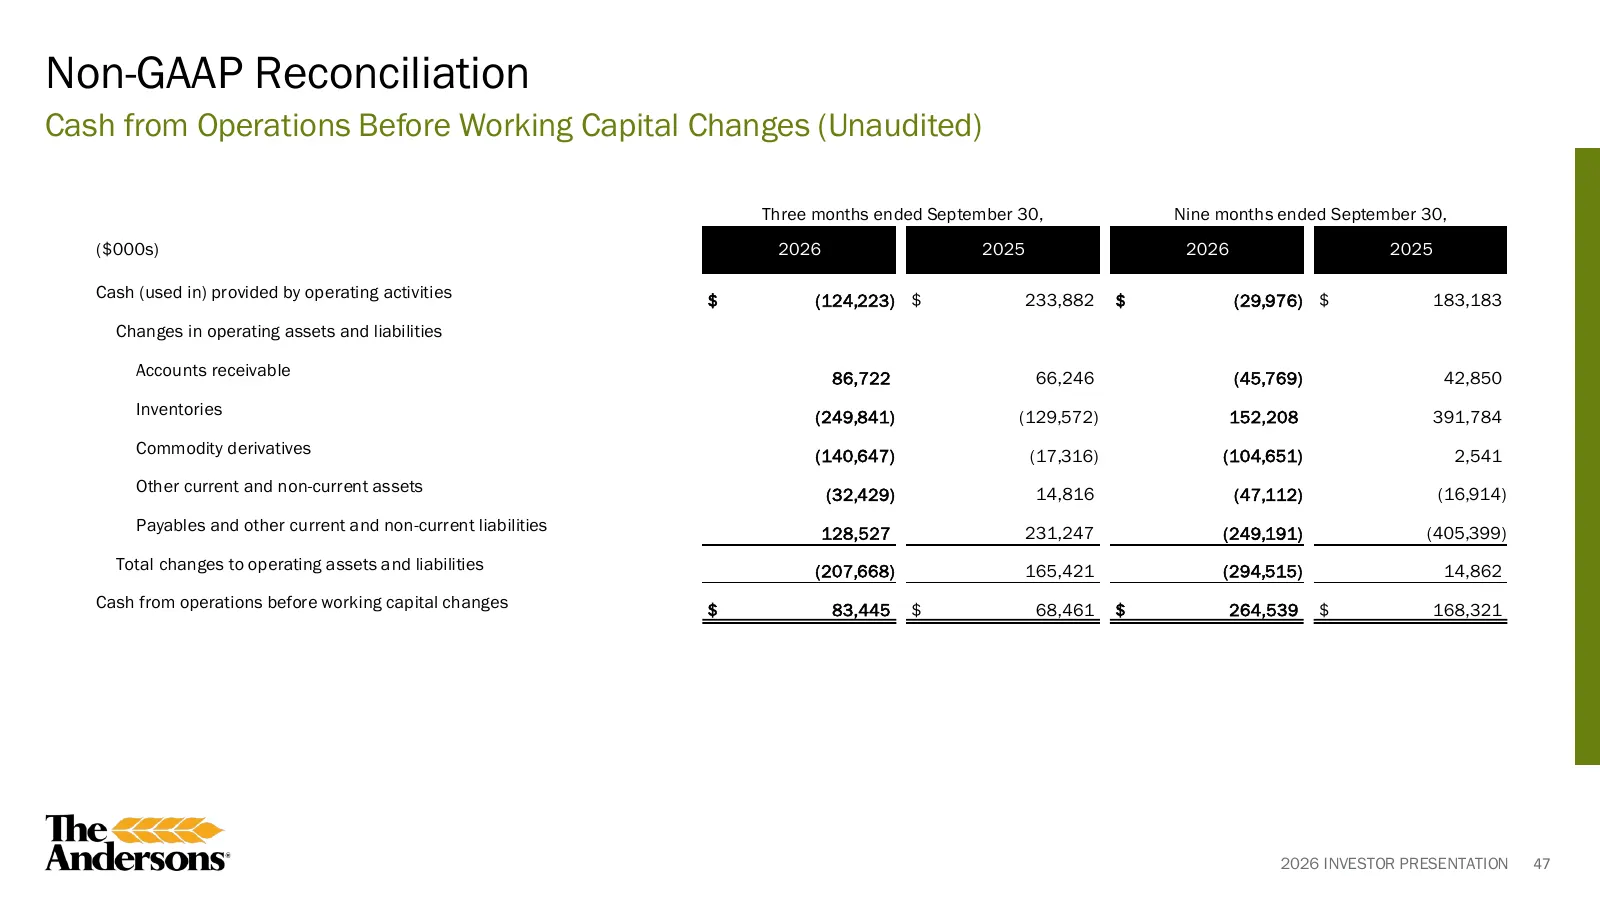
Non-GAAP Reconciliation Cash from Operations Before Working Capital Changes (Unaudited) Three months ended September 30, Nine months ended September 30, ($000s) 2026 2025 2026 2025 Cash (used in) provided by operating activities $ (124,223) $ 233,882 $ (29,976) $ 183,183 Changes in operating assets
Slide 48: Non-GAAP Reconciliation
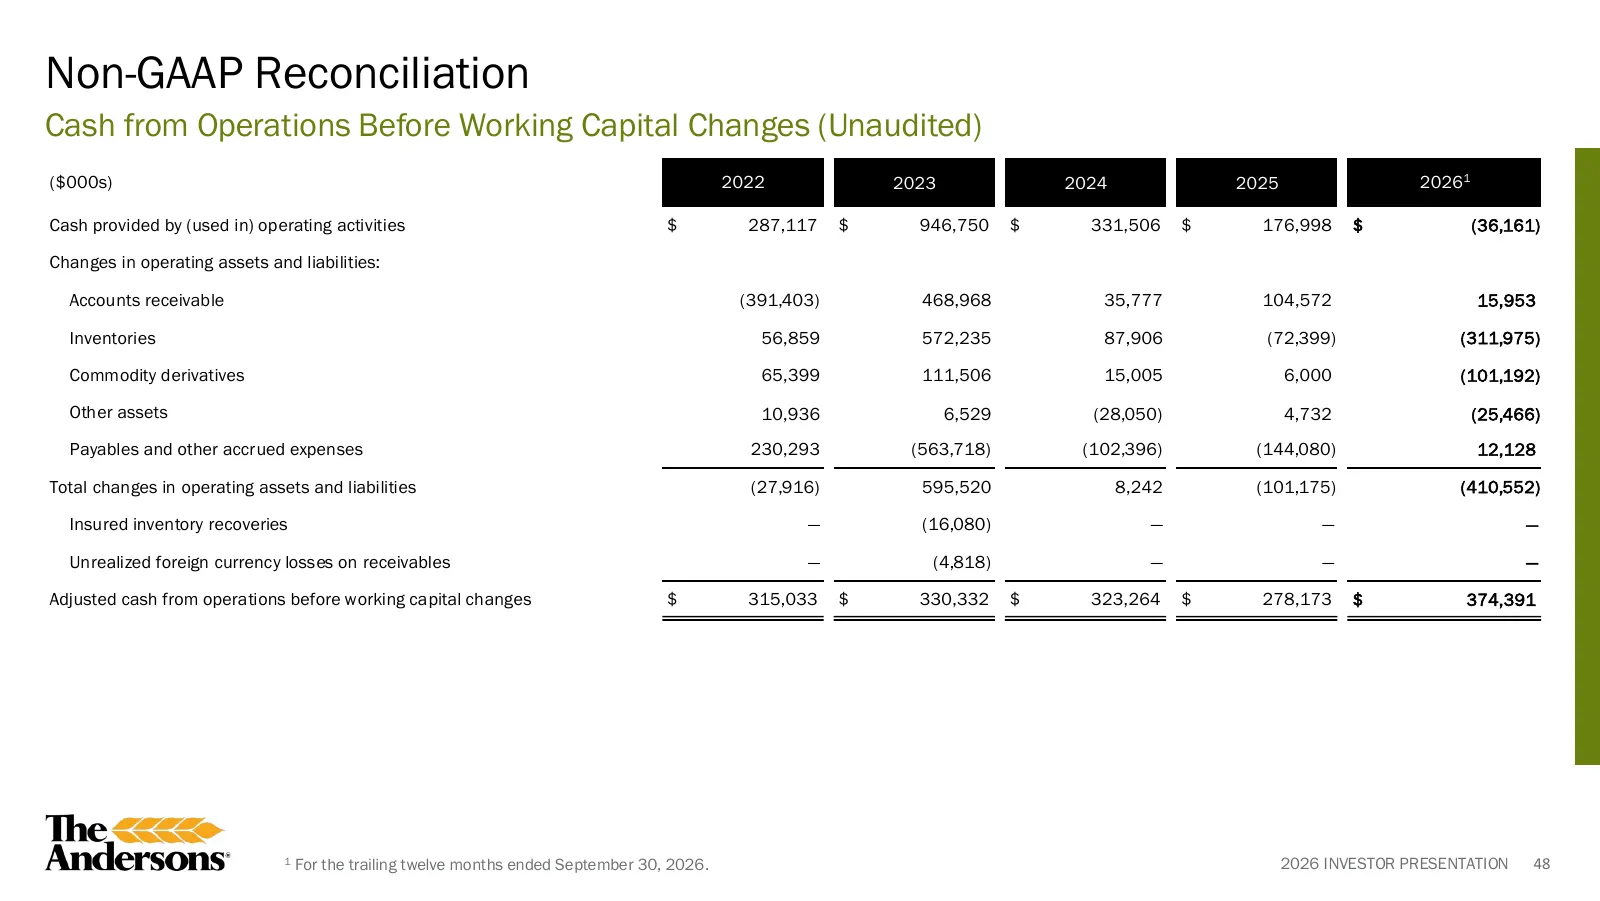
Non-GAAP Reconciliation Cash from Operations Before Working Capital Changes (Unaudited) ($000s) 2022 2023 2024 2025 20261 Cash provided by (used in) operating activities $ 287,117 $ 946,750 $ 331,506 $ 176,998 $ (36,161) Changes in operating assets and liabilities: Accounts receivable (391,403) 468,
Source: company website
More decks from The Andersons, Inc.
 Q3 2026 Earnings Presentation26 slides · Nov 4, 2026
 Q2 2026 Earnings Presentation21 slides · Aug 4, 2026
 Investor Presentation (August 2026)43 slides · August 2026
 Q1 2026 Earnings Presentation19 slides · May 6, 2026
 Investor Presentation (May 2026)43 slides · May 2026
 Q4 2025 Earnings Presentation21 slides · Feb 18, 2026