Aryzta AG · SIX:ARYN
Aryzta — H1 2015 Earnings Presentation
39 slides from Aryzta's earnings presentation, Mar 16, 2015

Slide 1: H1 Results, FY 2015
ARYZTA AG H1 Results, FY 2015 16 March 2015
Slide 2: Forward Looking Statement
Forward Looking Statement This document contains forward looking statements which reflect management’s current views and estimates. The forward looking statements involve certain risks and uncertainties that could cause actual results to differ materially from those contained in the forward looking
Slide 3: Our Business
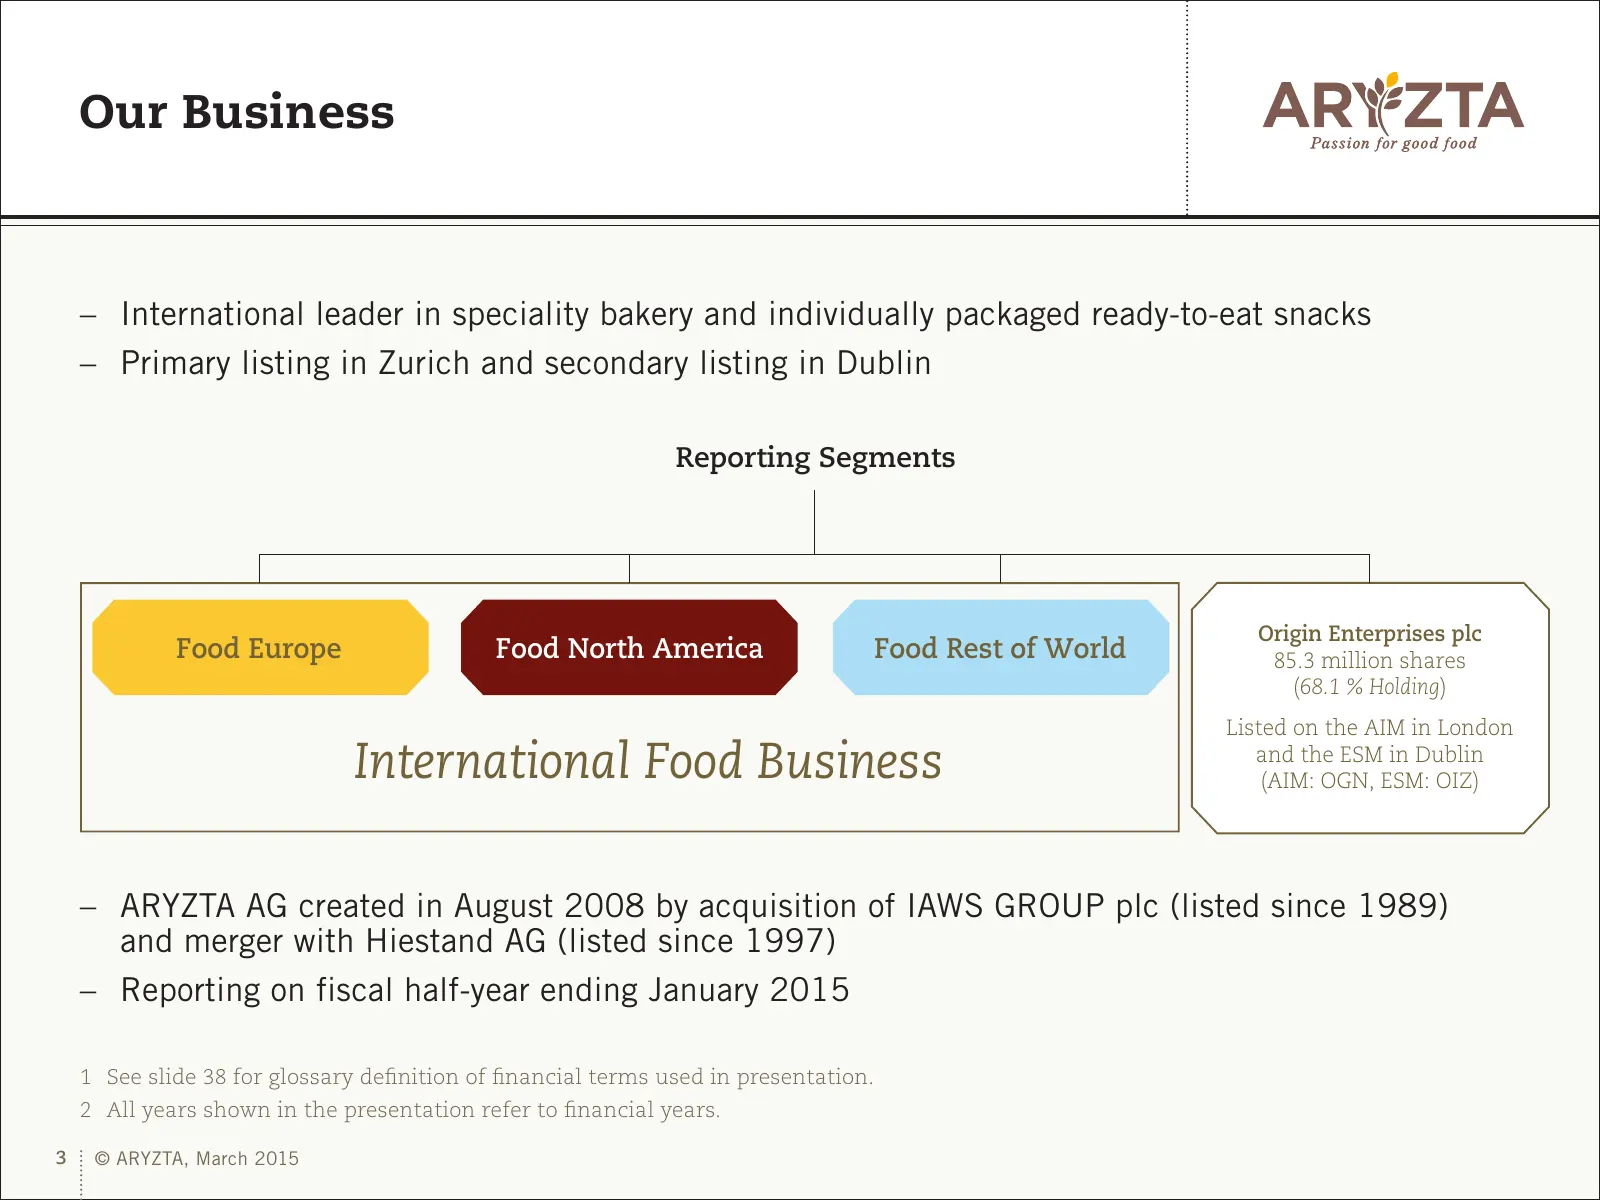
Our Business – International leader in speciality bakery and individually packaged ready-to-eat snacks – Primary listing in Zurich and secondary listing in Dublin ARYZTA Reporting AG Segments Origin Enterprises plc Origin Enterprises plc Food Europe Food North America Food Rest of World 85.3 million
Slide 4: Origin Enterprises plc – 68.1% Holding
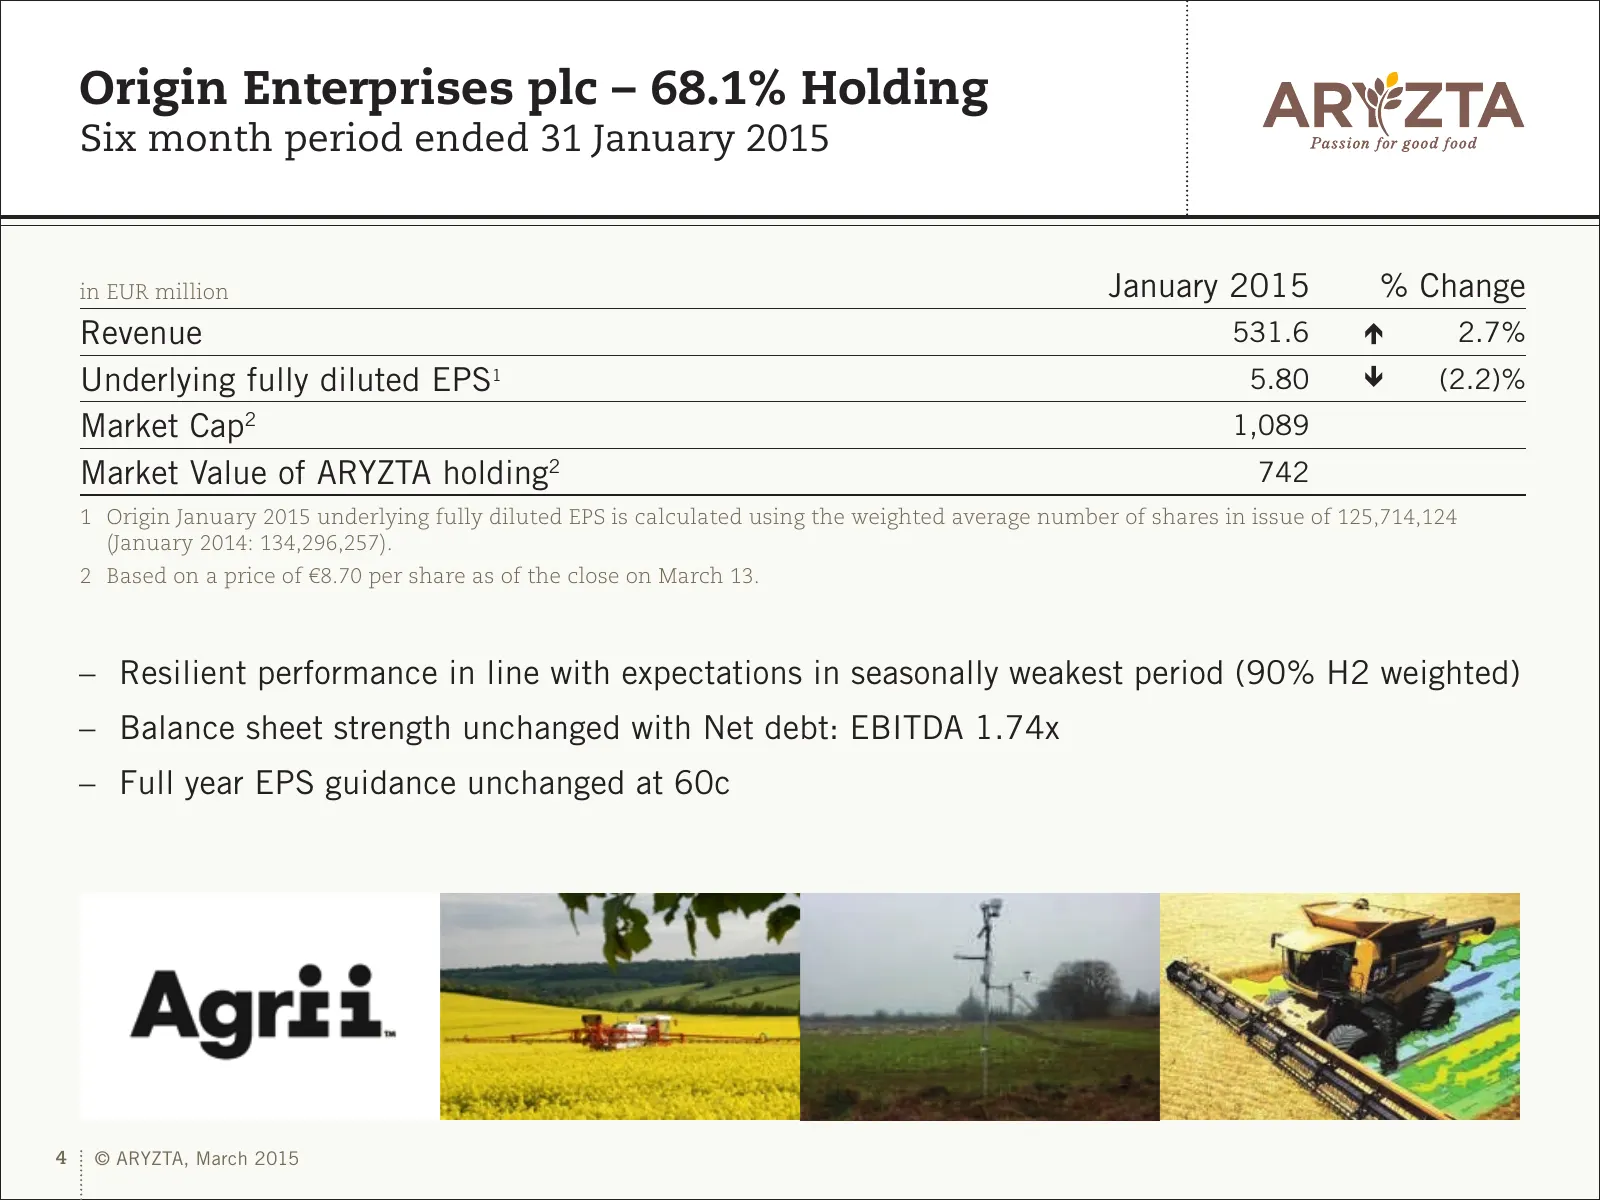
Origin Enterprises plc – 68.1% Holding Six month period ended 31 January 2015 in EUR million January 2015 % Change Revenue 531.6 2.7% Underlying fully diluted EPS1 5.80 (2.2)% Market Cap2 1,089 Market Value of ARYZTA holding2 742 1 Origin January 2015 underlying fully diluted EPS is calculated u
Slide 5: H1 Strategic Focus – Revenue Repositioning
Food Group H1 Strategic Focus – Revenue Repositioning – Revenue increase of 17.2% entirely from acquisitions and currency – Underlying revenue decline of (0.9)% – More pronounced decline in North America of (5.8)% – (8.4)% in Q2 – Negative impact on margin in North America of (50) bps – Customer cen
Slide 6: Financial and Business Review
Financial and Business Review 6 © ARYZTA, March 2015
Slide 7: ARYZTA Group Financial Highlights
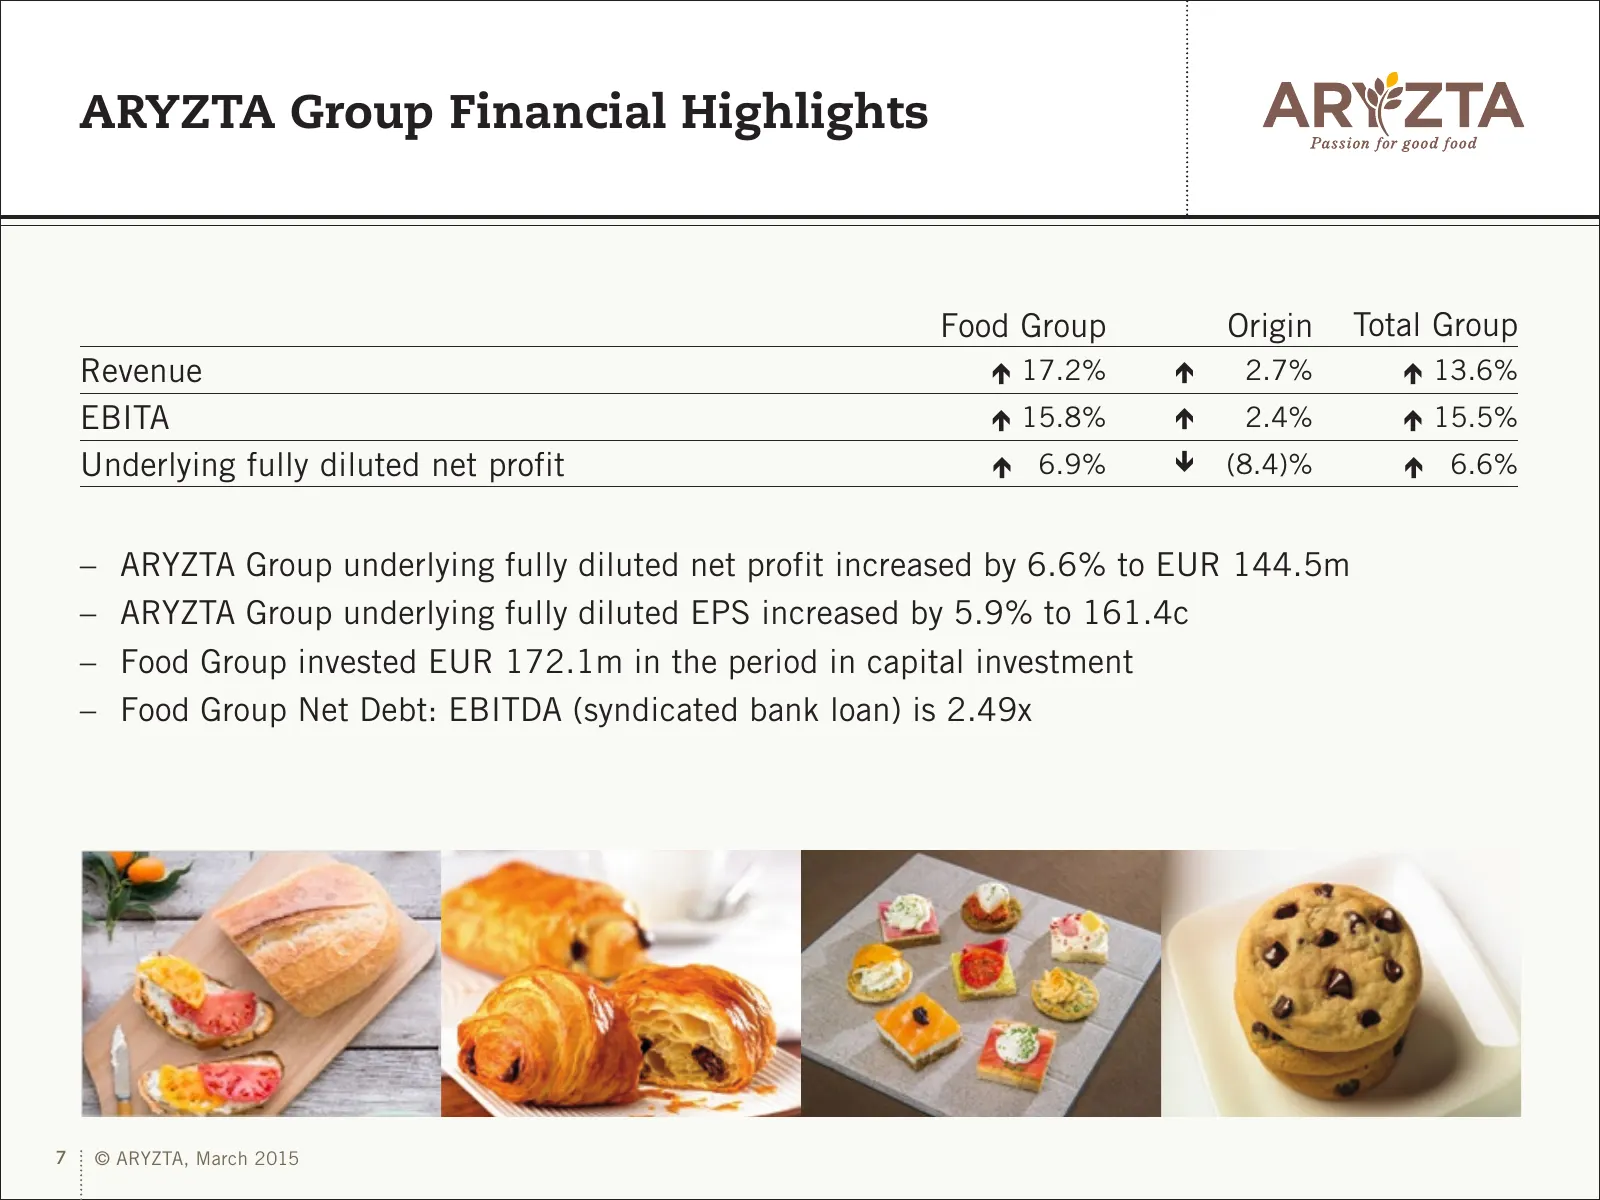
ARYZTA Group Financial Highlights Food Group Origin Total Group Revenue 17.2% 2.7% 13.6% EBITA 15.8% 2.4% 15.5% Underlying fully diluted net profit 6.9% (8.4)% 6.6% –– ARYZTA Group underlying fully diluted net profit increased by 6.6% to EUR 144.5m –– ARYZTA Group underlying fully
Slide 8: ARYZTA Group – Income Statement
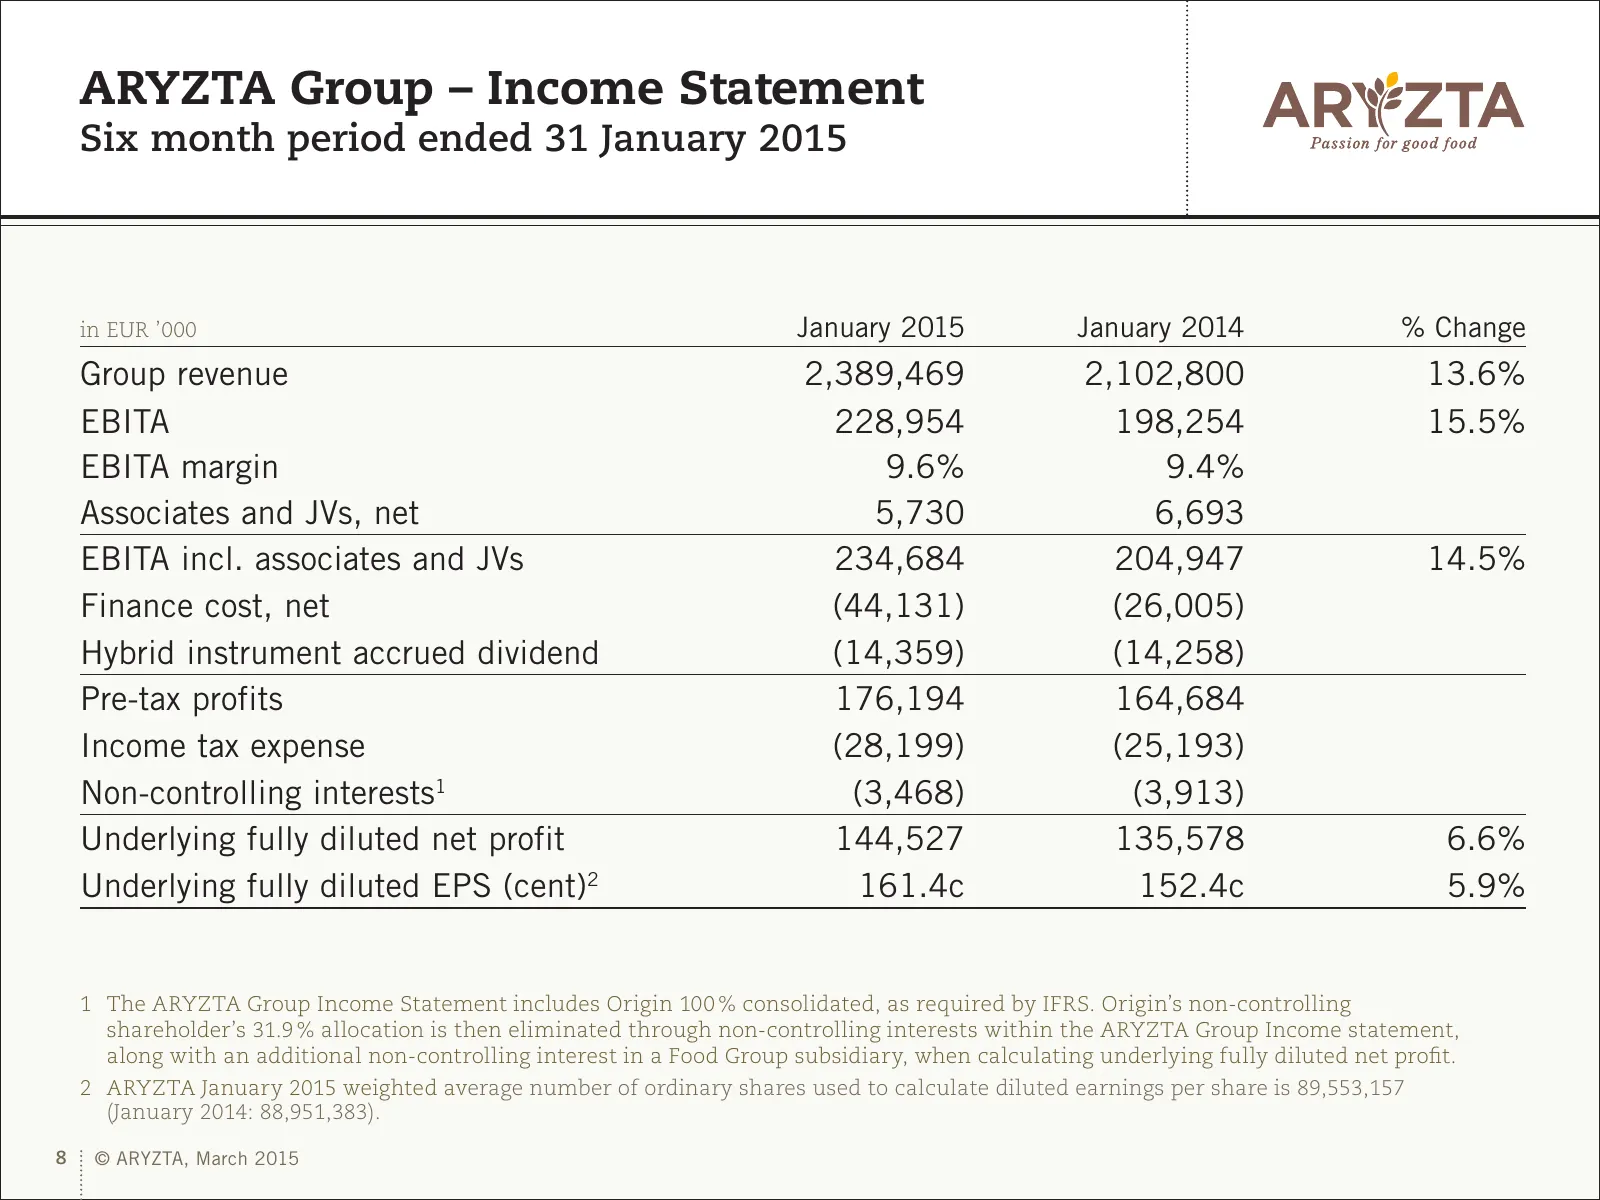
ARYZTA Group – Income Statement Six month period ended 31 January 2015 in EUR ’000 January 2015 January 2014 % Change Group revenue 2,389,469 2,102,800 13.6% EBITA 228,954 198,254 15.5% EBITA margin 9.6% 9.4% Associates and JVs, net 5,730 6,693 EBITA incl. associates and JVs 234,684 204,947 14.5% Fi
Slide 9: ARYZTA Group – Underlying Revenue Growth
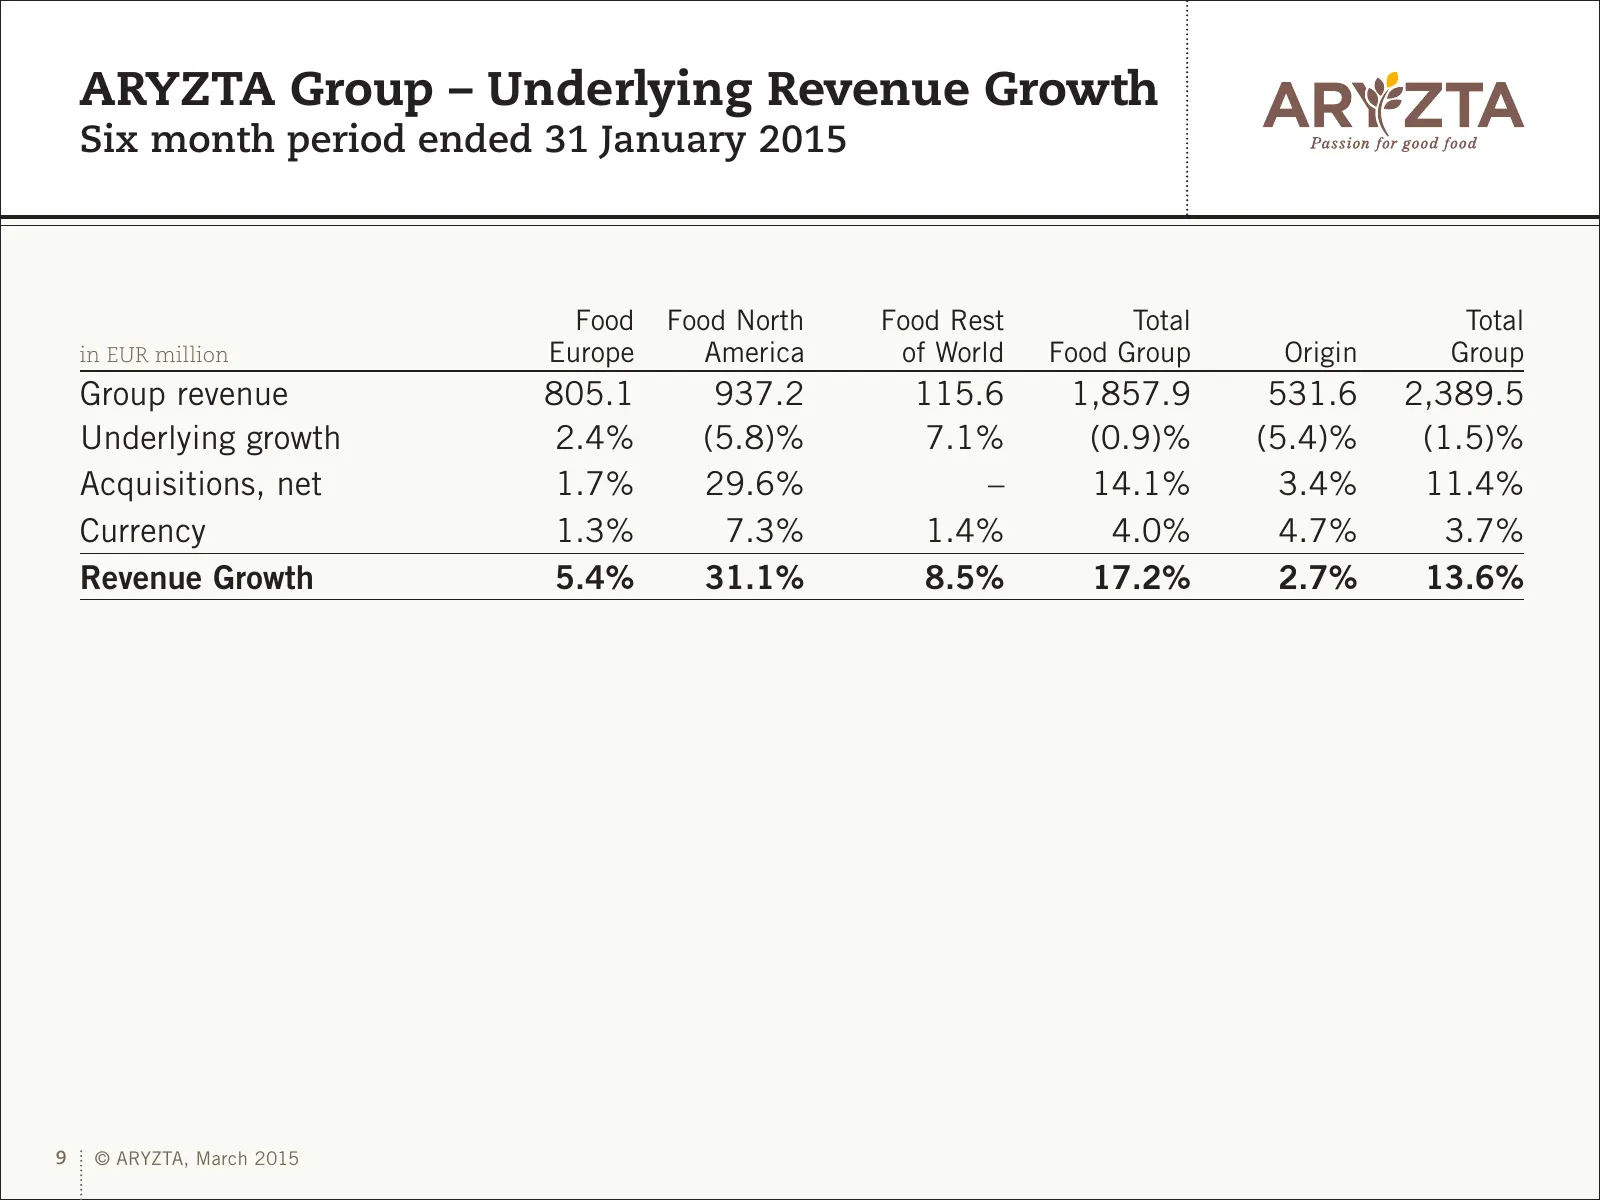
ARYZTA Group – Underlying Revenue Growth Six month period ended 31 January 2015 Food Food North Food Rest Total Total in EUR million Europe America of World Food Group Origin Group Group revenue 805.1 937.2 115.6 1,857.9 531.6 2,389.5 Underlying growth 2.4% (5.8)% 7.1% (0.9)% (5.4)% (1.5)% Acquisiti
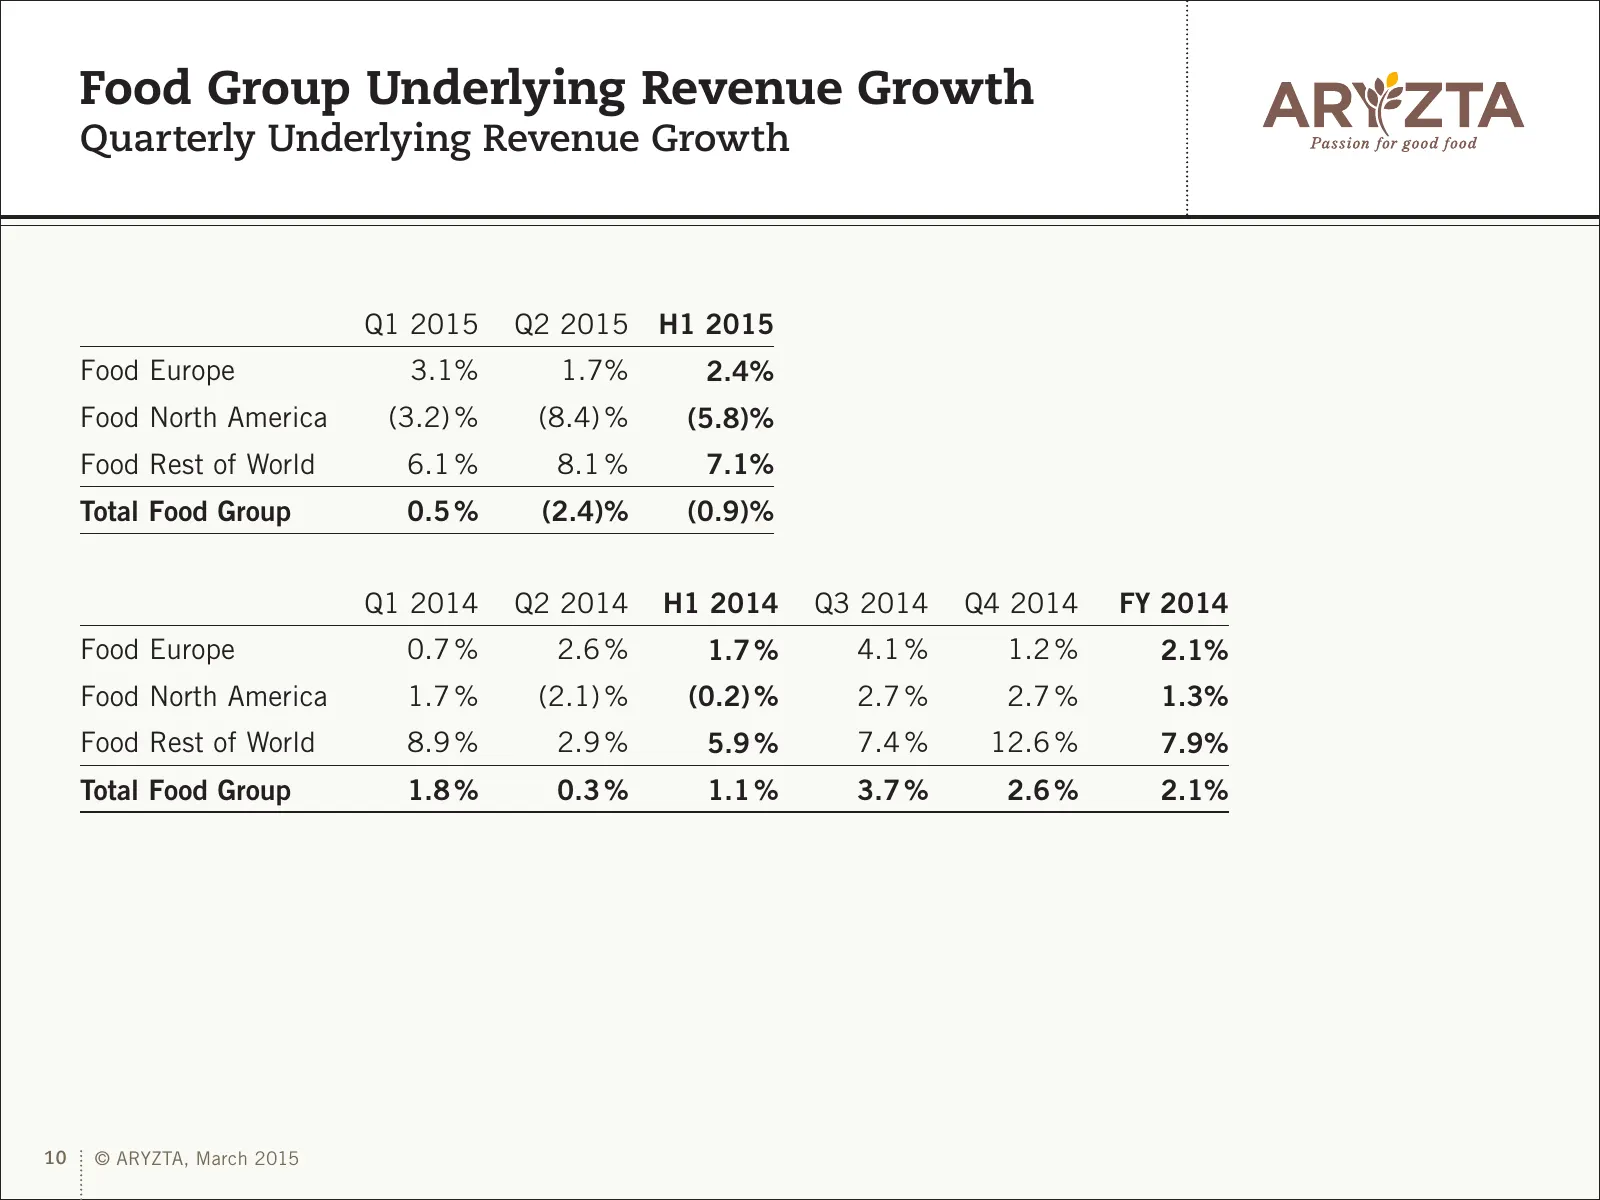
Slide 10: Food Group Underlying Revenue Growth
Food Group Underlying Revenue Growth Quarterly Underlying Revenue Growth Q1 2015 Q2 2015 H1 2015 Food Europe 3.1% 1.7% 2.4% Food North America (3.2) % (8.4) % (5.8)% Food Rest of World 6.1 % 8.1 % 7.1% Total Food Group 0.5 % (2.4)% (0.9)% Q1 2014 Q2 2014 H1 2014 Q3 2014 Q4 2014 FY 2014 Food Europe 0
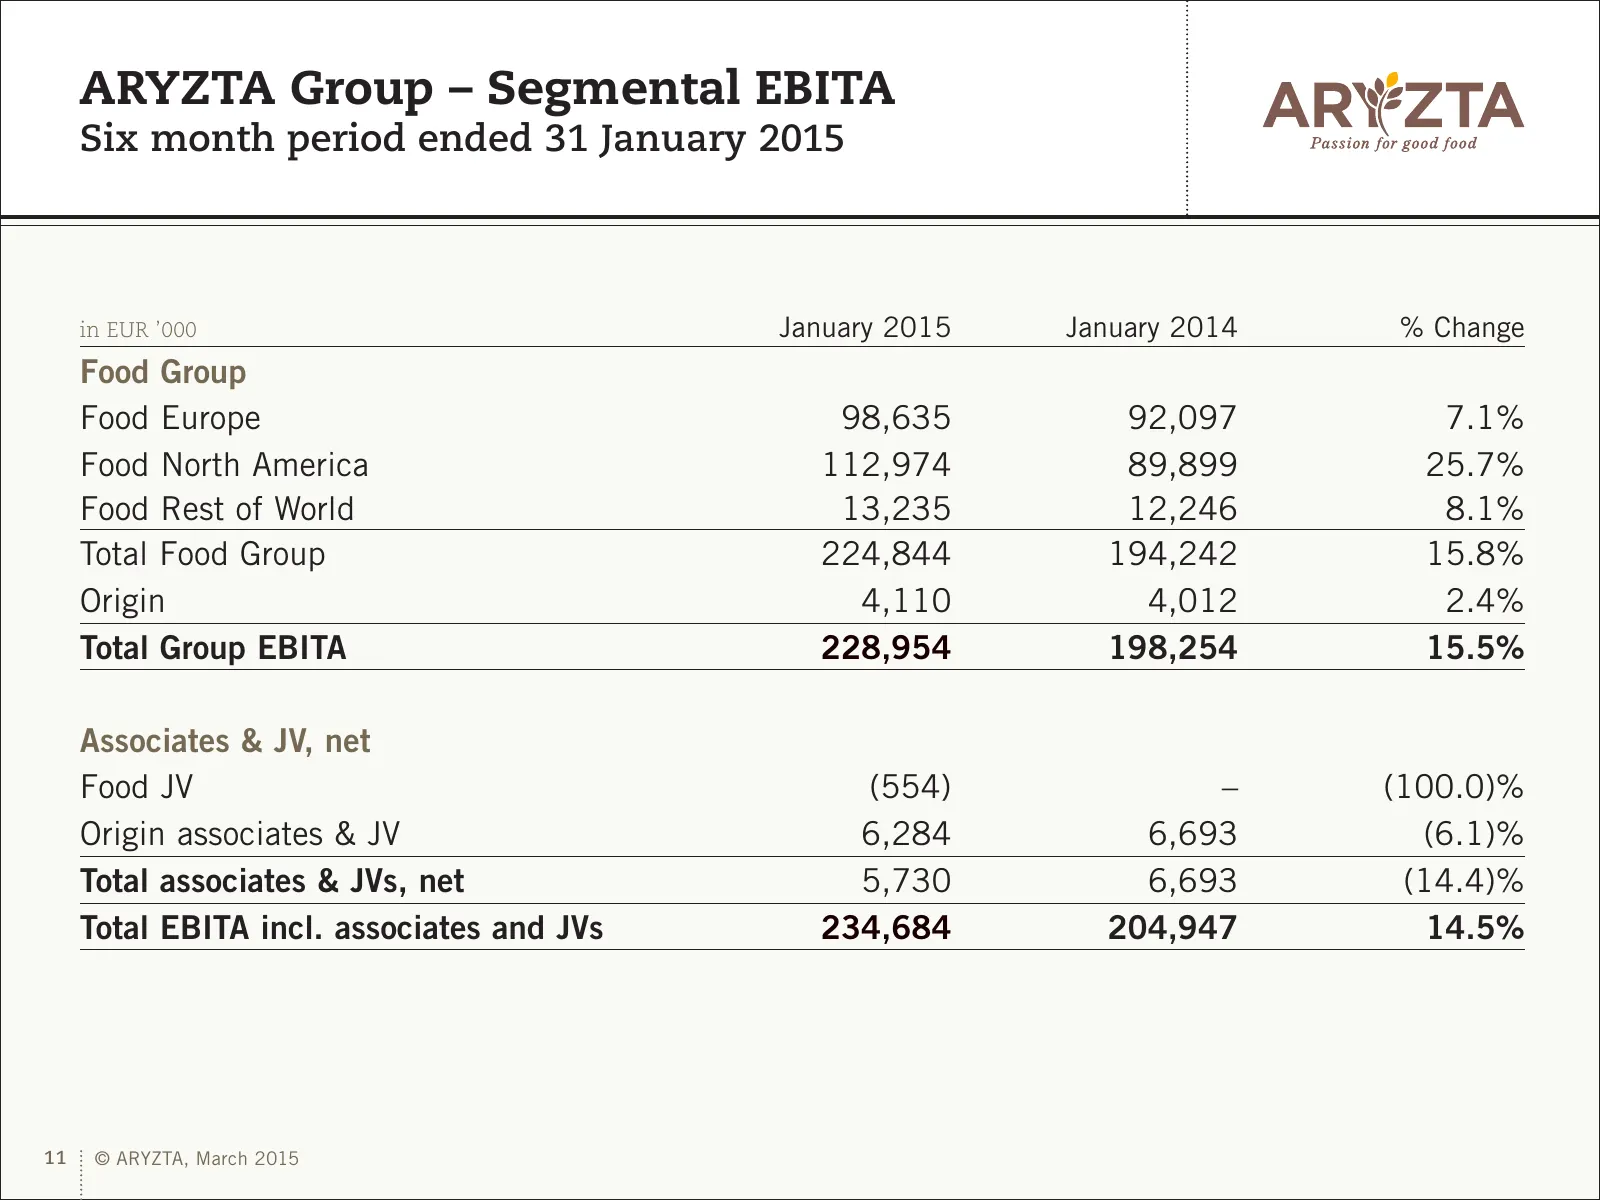
Slide 11: ARYZTA Group – Segmental EBITA
ARYZTA Group – Segmental EBITA Six month period ended 31 January 2015 in EUR ’000 January 2015 January 2014 % Change Food Group Food Europe 98,635 92,097 7.1% Food North America 112,974 89,899 25.7% Food Rest of World 13,235 12,246 8.1% Total Food Group 224,844 194,242 15.8% Origin 4,110 4,012 2.4%
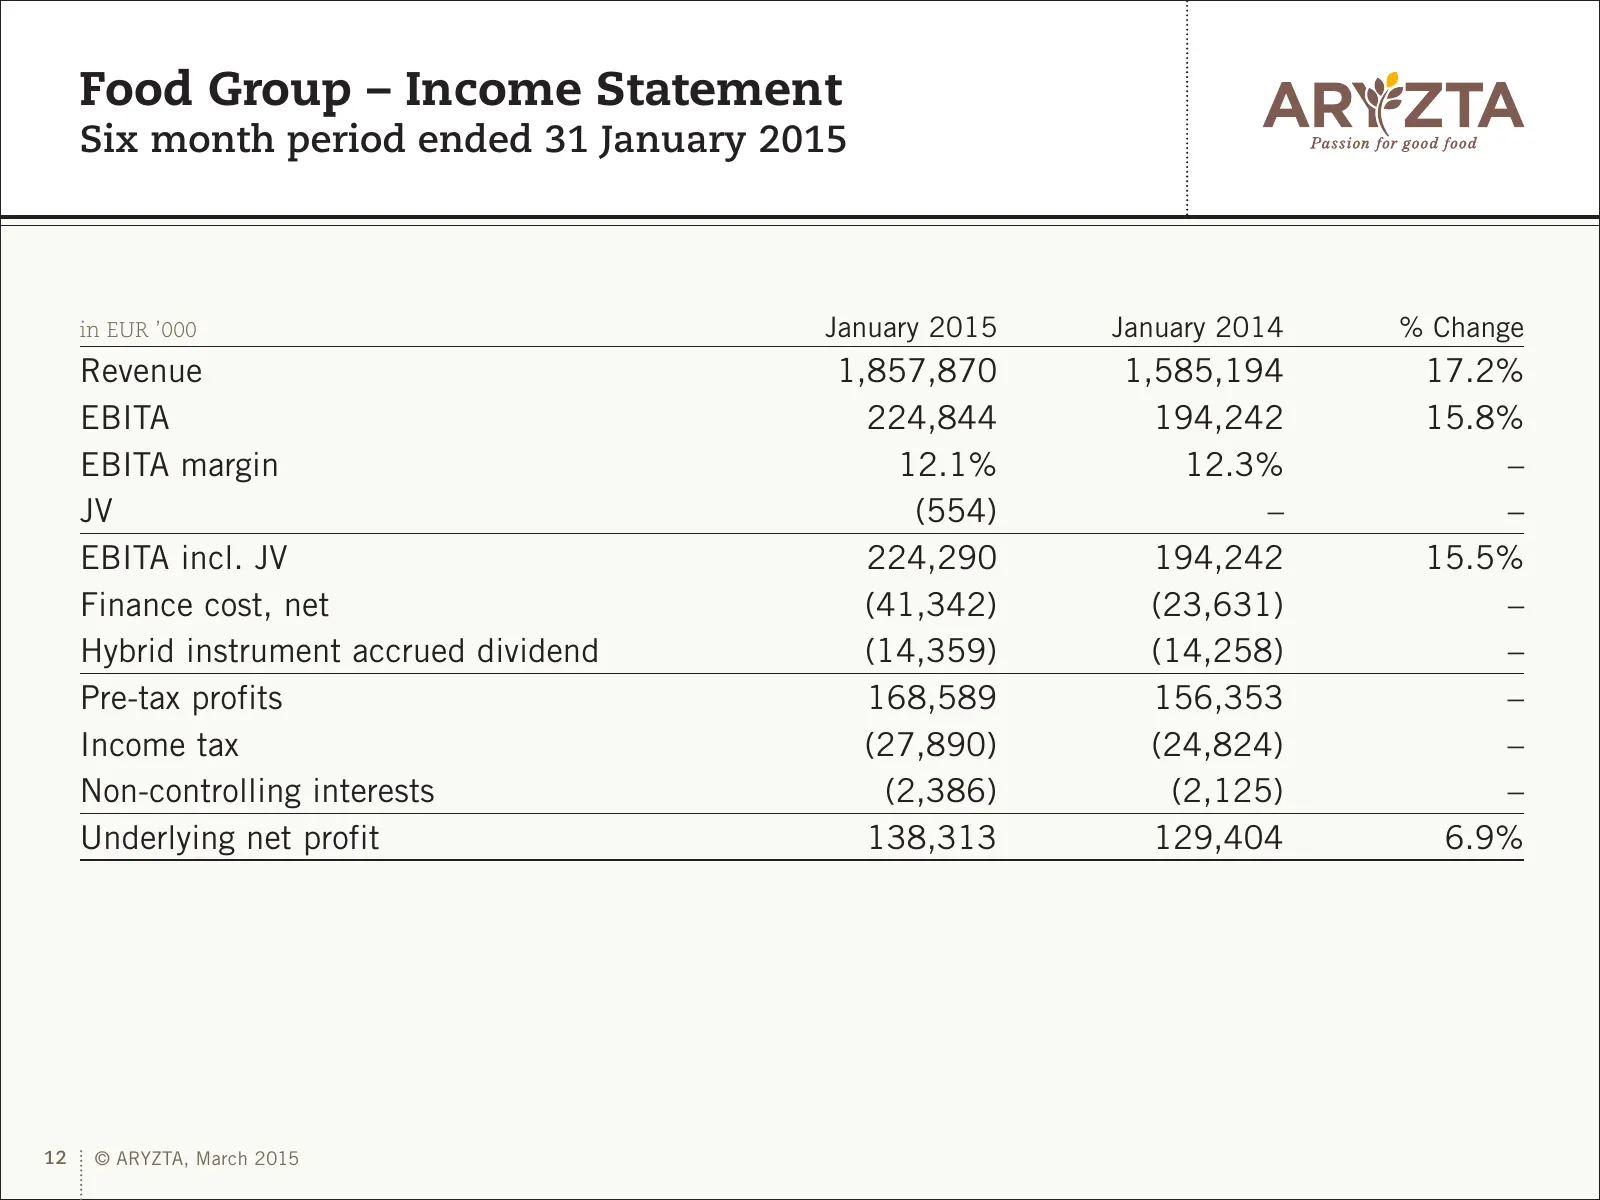
Slide 12: Food Group – Income Statement
Food Group – Income Statement Six month period ended 31 January 2015 in EUR ’000 January 2015 January 2014 % Change Revenue 1,857,870 1,585,194 17.2% EBITA 224,844 194,242 15.8% EBITA margin 12.1% 12.3% – JV (554) – – EBITA incl. JV 224,290 194,242 15.5% Finance cost, net (41,342) (23,631) – Hybrid
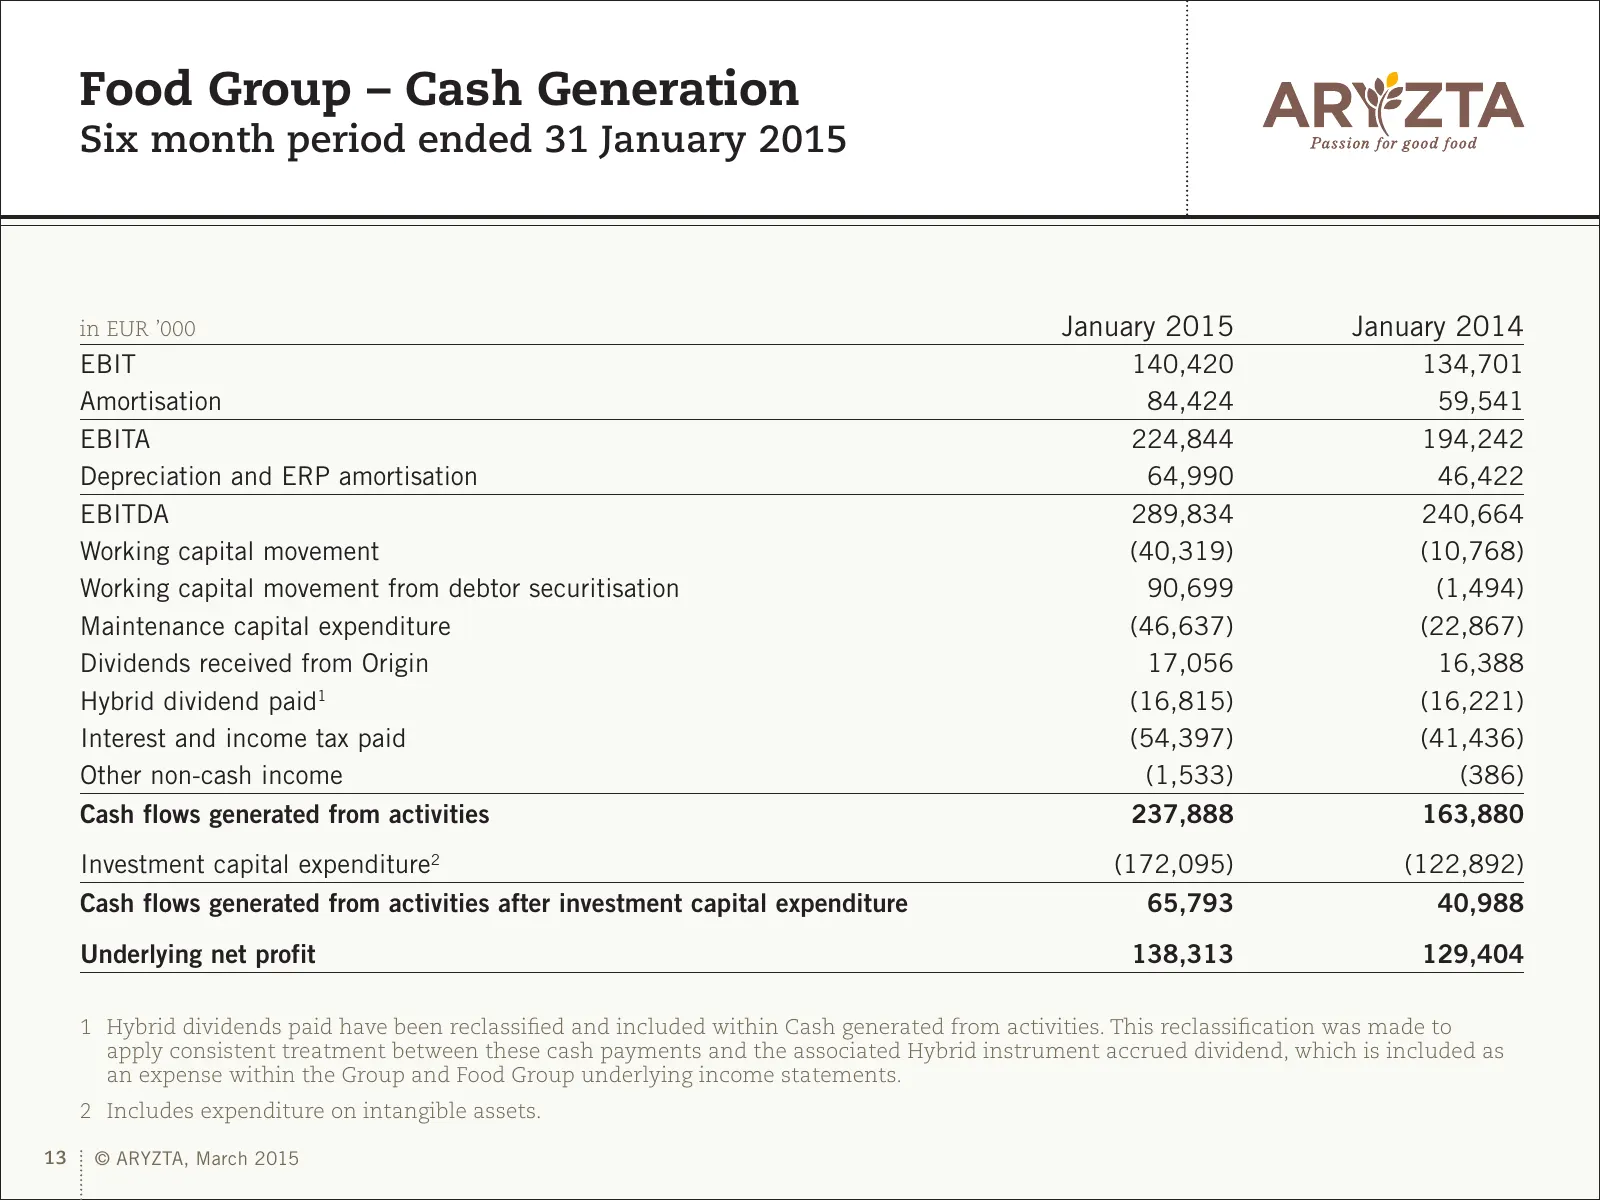
Slide 13: Food Group – Cash Generation
Food Group – Cash Generation Six month period ended 31 January 2015 in EUR ’000 January 2015 January 2014 EBIT 140,420 134,701 Amortisation 84,424 59,541 EBITA 224,844 194,242 Depreciation and ERP amortisation 64,990 46,422 EBITDA 289,834 240,664 Working capital movement (40,319) (10,768) Working ca
Slide 14: Food Group – Net Debt and Investment Activity
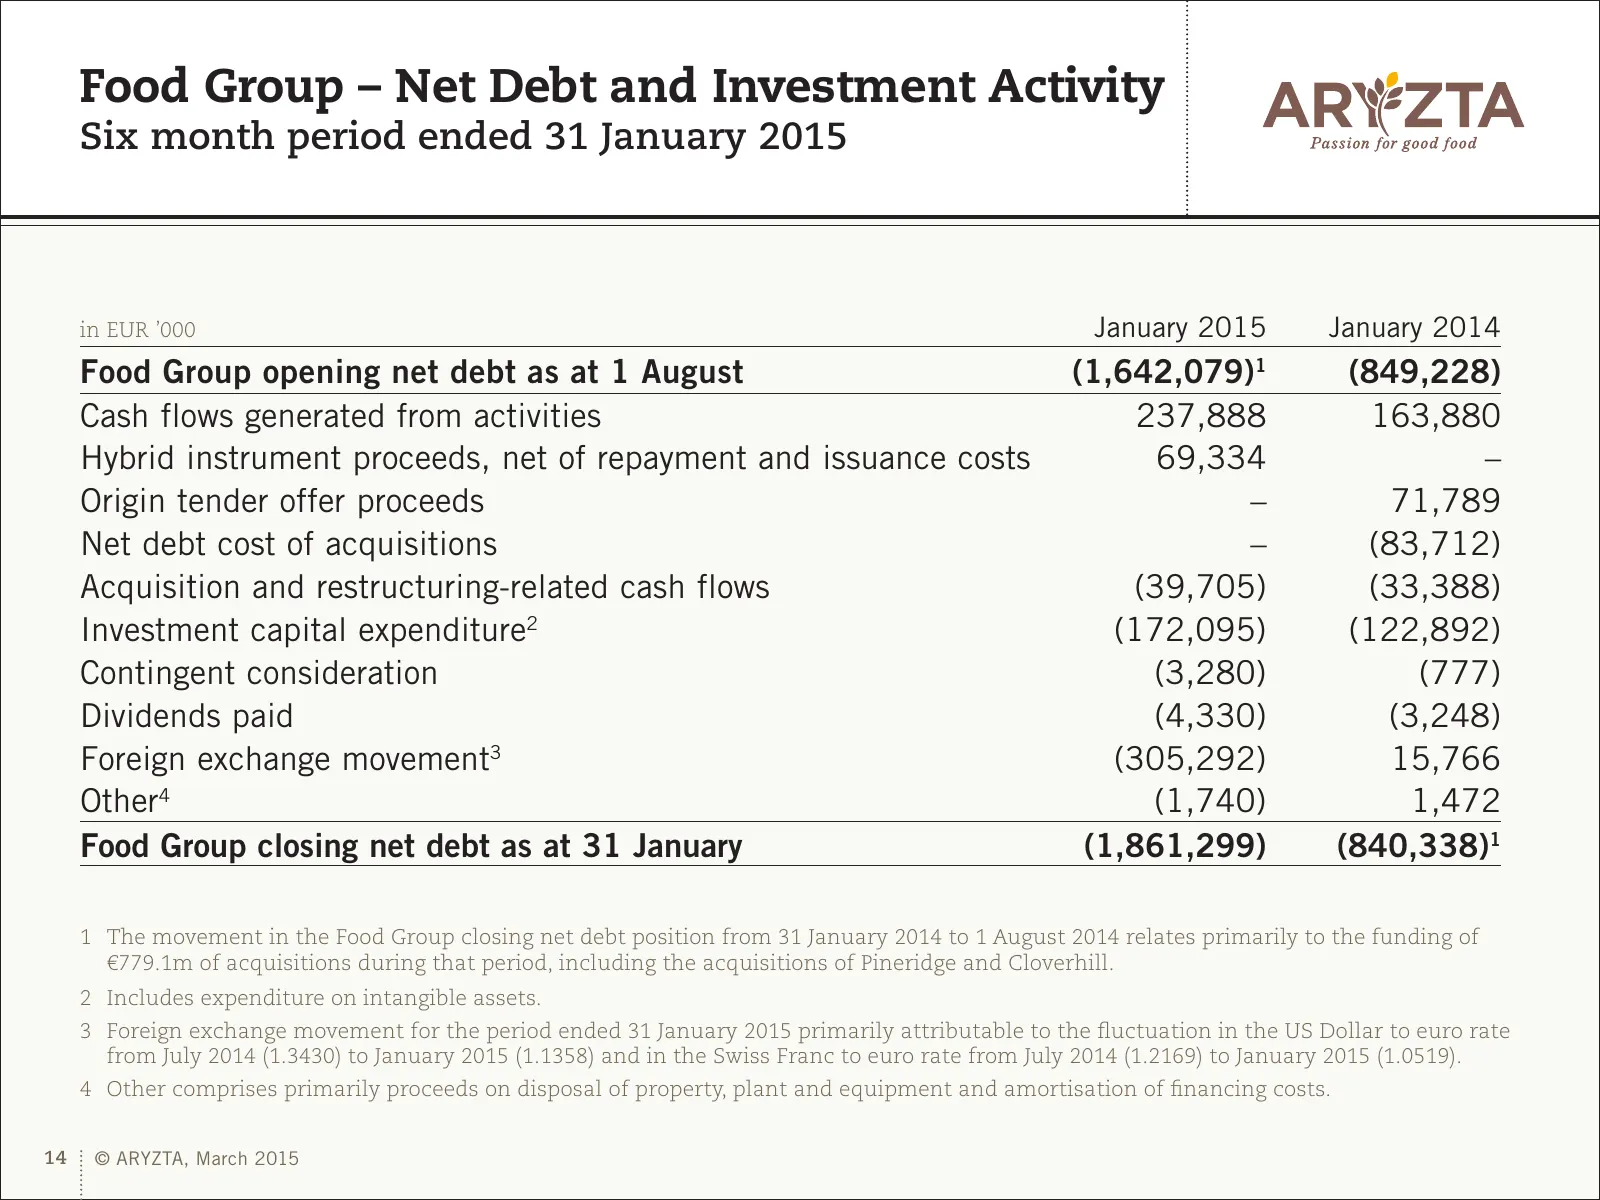
Food Group – Net Debt and Investment Activity Six month period ended 31 January 2015 in EUR ’000 January 2015 January 2014 Food Group opening net debt as at 1 August (1,642,079)1 (849,228) Cash flows generated from activities 237,888 163,880 Hybrid instrument proceeds, net of repayment and issuance
Slide 15: Food Group – Financing as at 31 January 2015
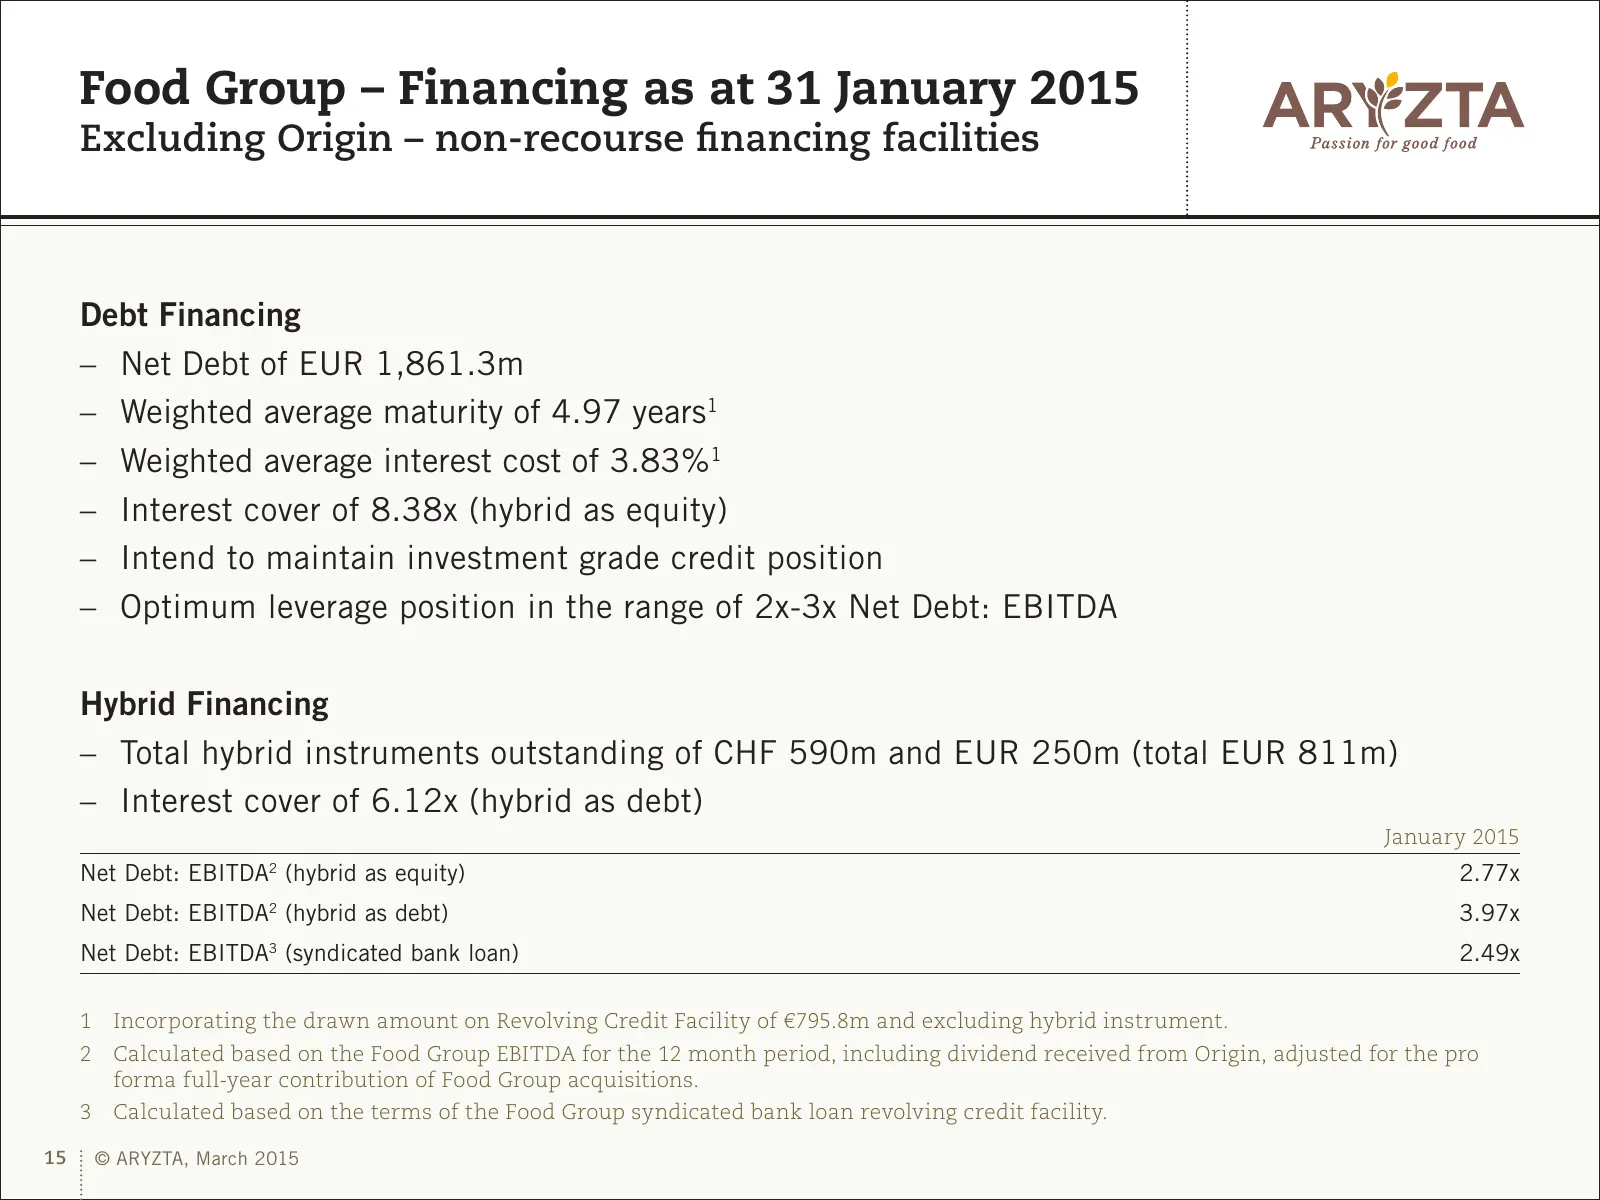
Food Group – Financing as at 31 January 2015 Excluding Origin – non-recourse financing facilities Debt Financing – Net Debt of EUR 1,861.3m – Weighted average maturity of 4.97 years1 – Weighted average interest cost of 3.83%1 – Interest cover of 8.38x (hybrid as equity) – Intend to maintain investme
Slide 16: Food Group Integration Investments
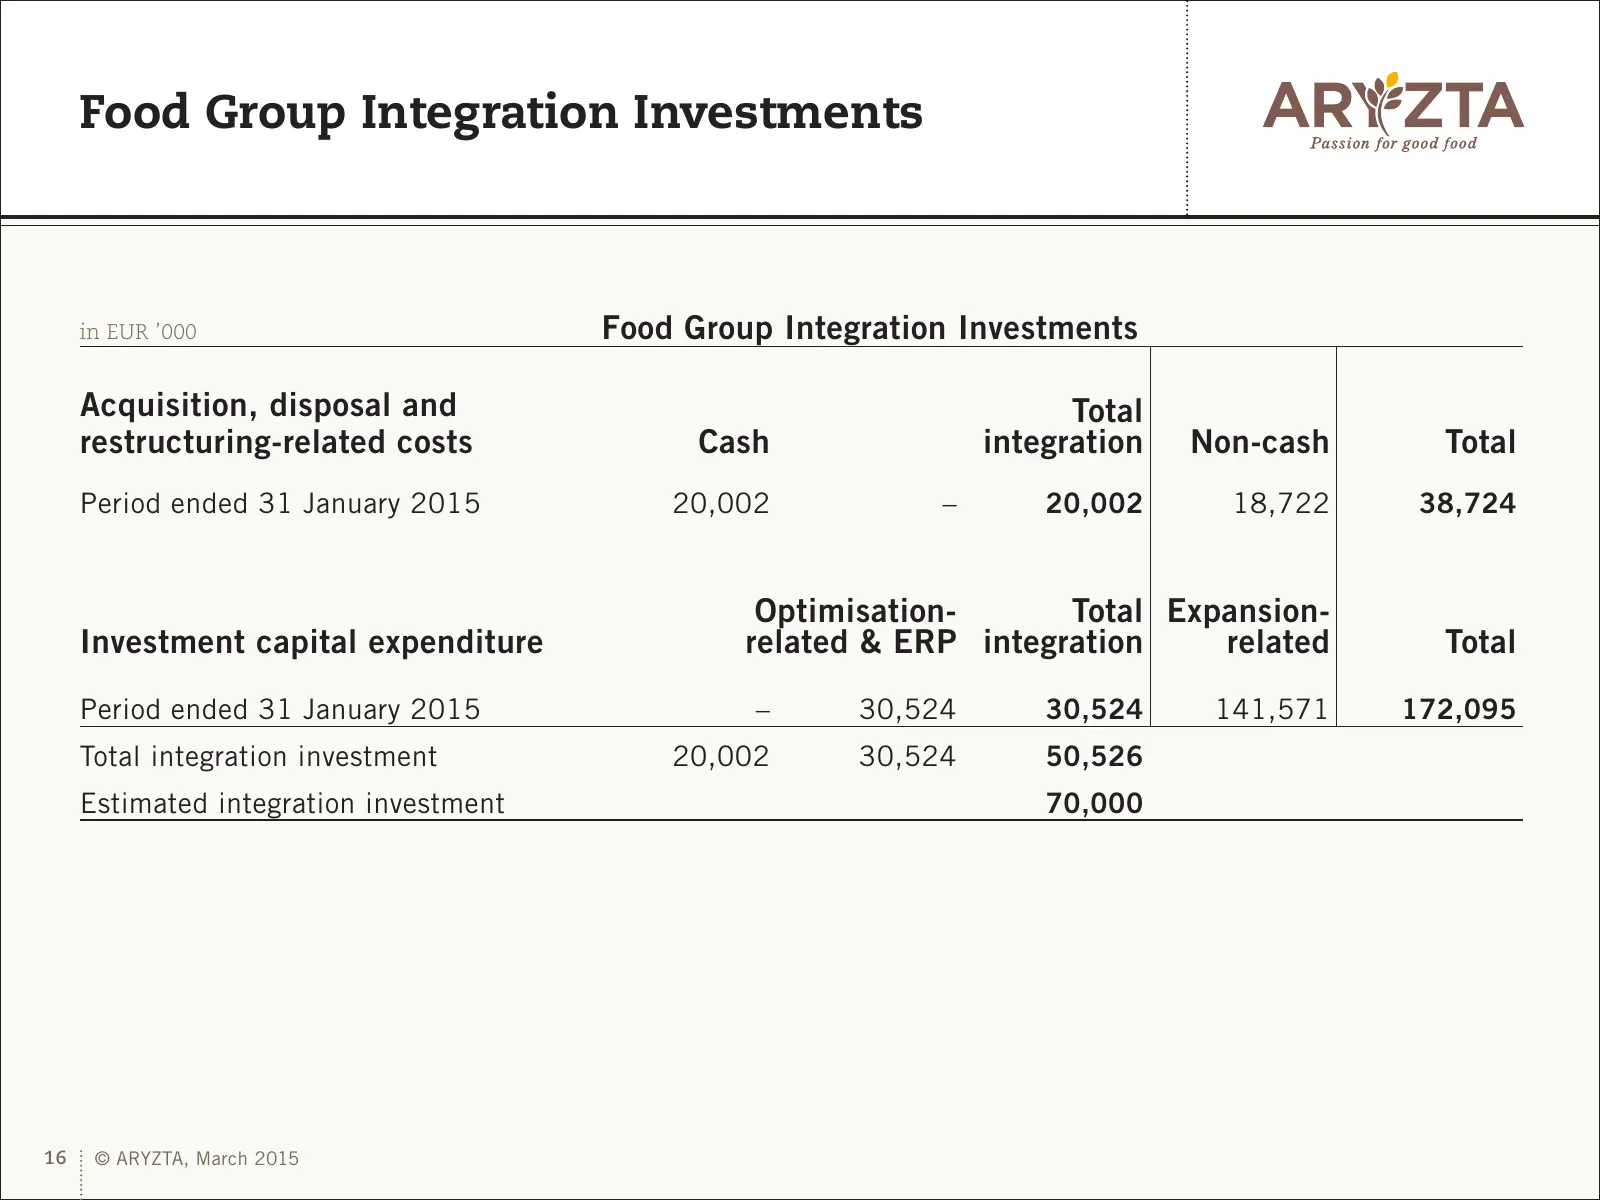
Food Group Integration Investments in EUR ’000 Food Group Integration Investments Acquisition, disposal and Total restructuring-related costs Cash integration Non-cash Total Period ended 31 January 2015 20,002 – 20,002 18,722 38,724 Optimisation- Total Expansion- Investment capital expenditure relat
Slide 17: Europe – Well Invested to Capture In-Store Bakery Growth
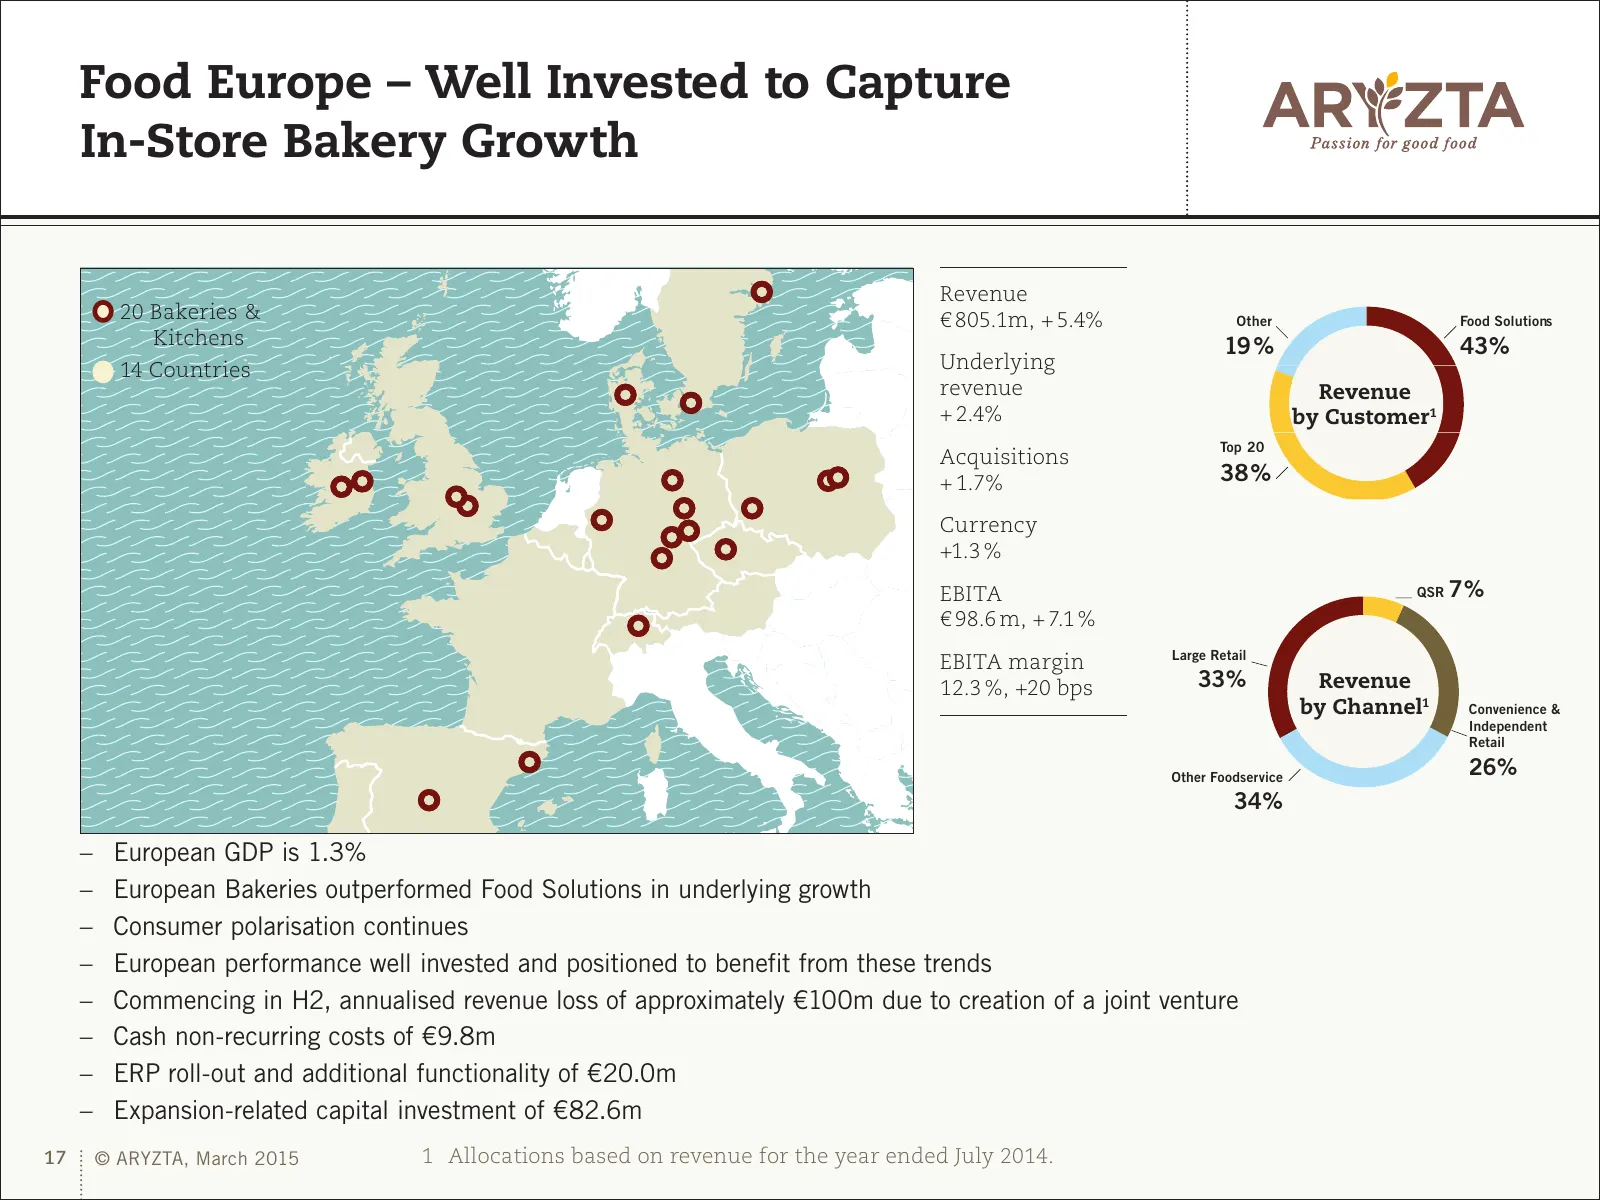
Food Europe – Well Invested to Capture In-Store Bakery Growth Revenue 20 Bakeries & € 805.1m, + 5.4% Other Food Solutions Kitchens 19 % 43% 14 Countries Underlying revenue Revenue + 2.4% by Customer1 Top 20 Acquisitions + 1.7% 38 % Currency +1.3 % EBITA QSR 7% € 98.6 m, + 7.1 % Large Retail EBITA ma
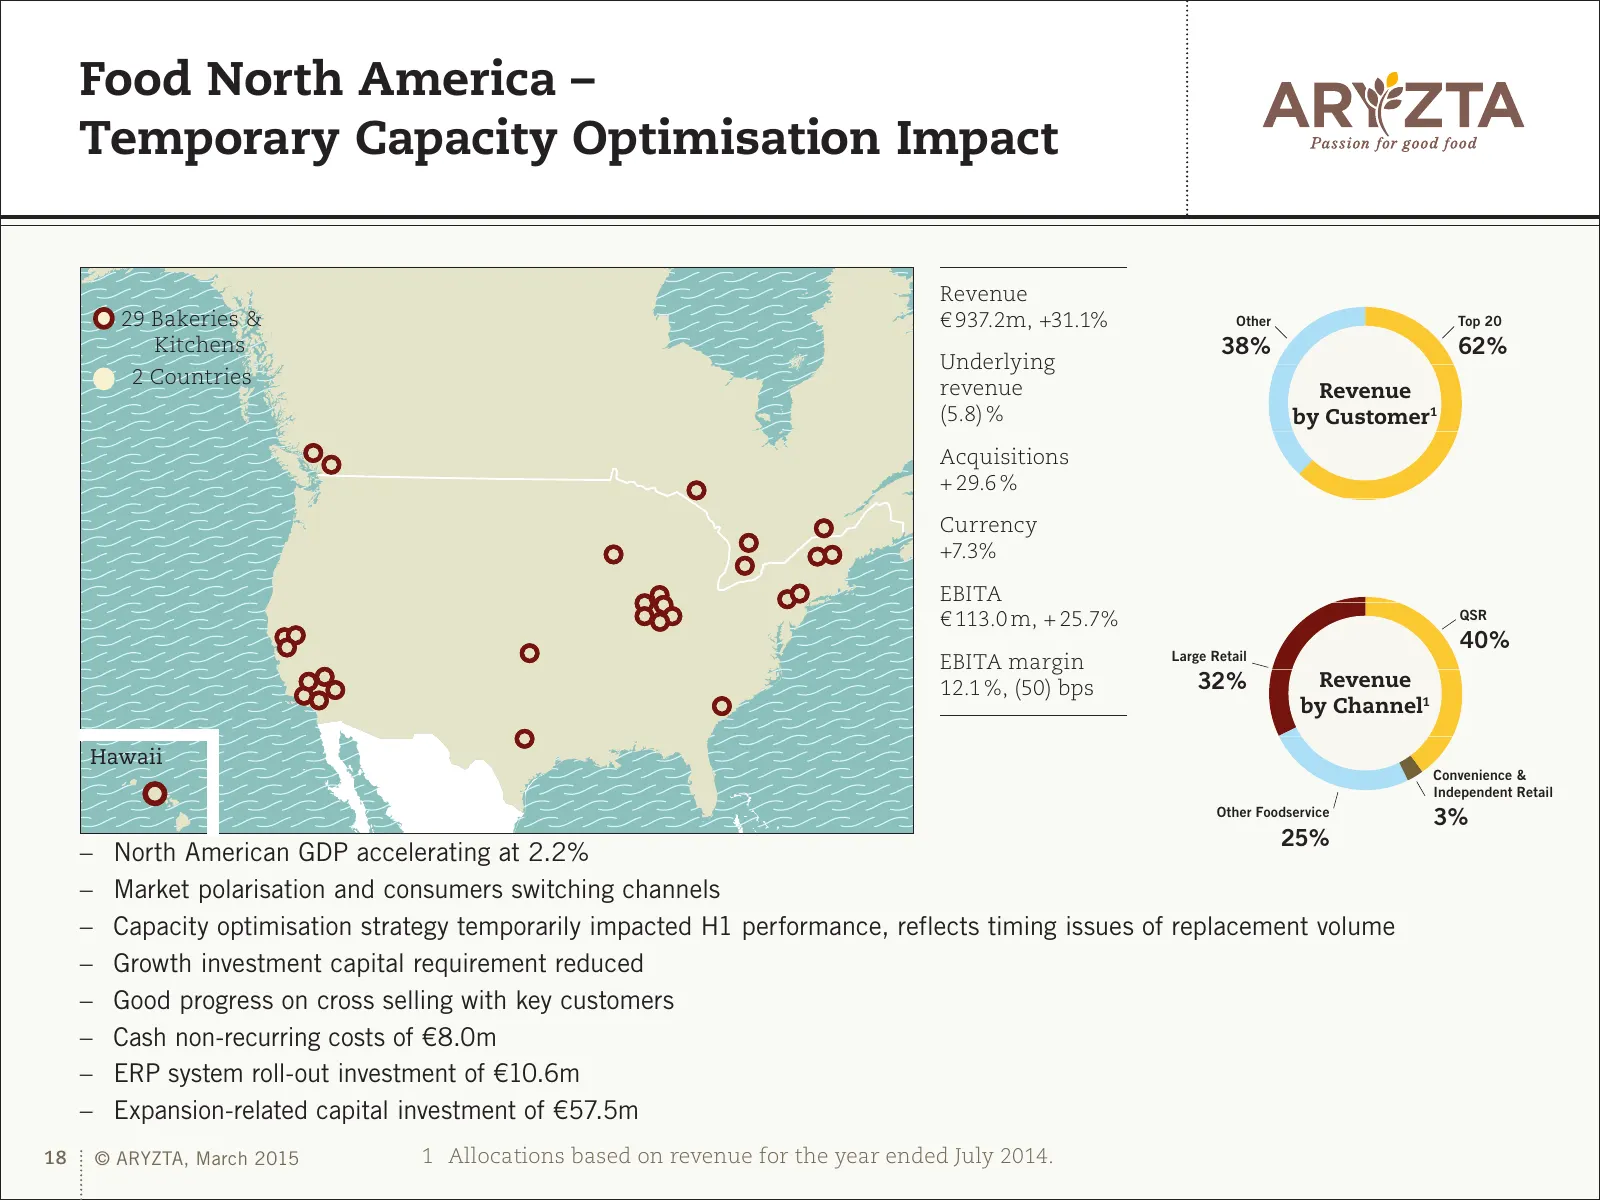
Slide 18: North America – Temporary Capacity Optimisation Impact
Food North America – Temporary Capacity Optimisation Impact Revenue 29 Bakeries & € 937.2m, +31.1% Other Top 20 Kitchens 38% 62% Underlying 2 Countries revenue Revenue (5.8) % by Customer1 Acquisitions + 29.6 % Currency +7.3% EBITA € 113.0 m, + 25.7% QSR 40% Large Retail EBITA margin 12.1 %, (50) bp
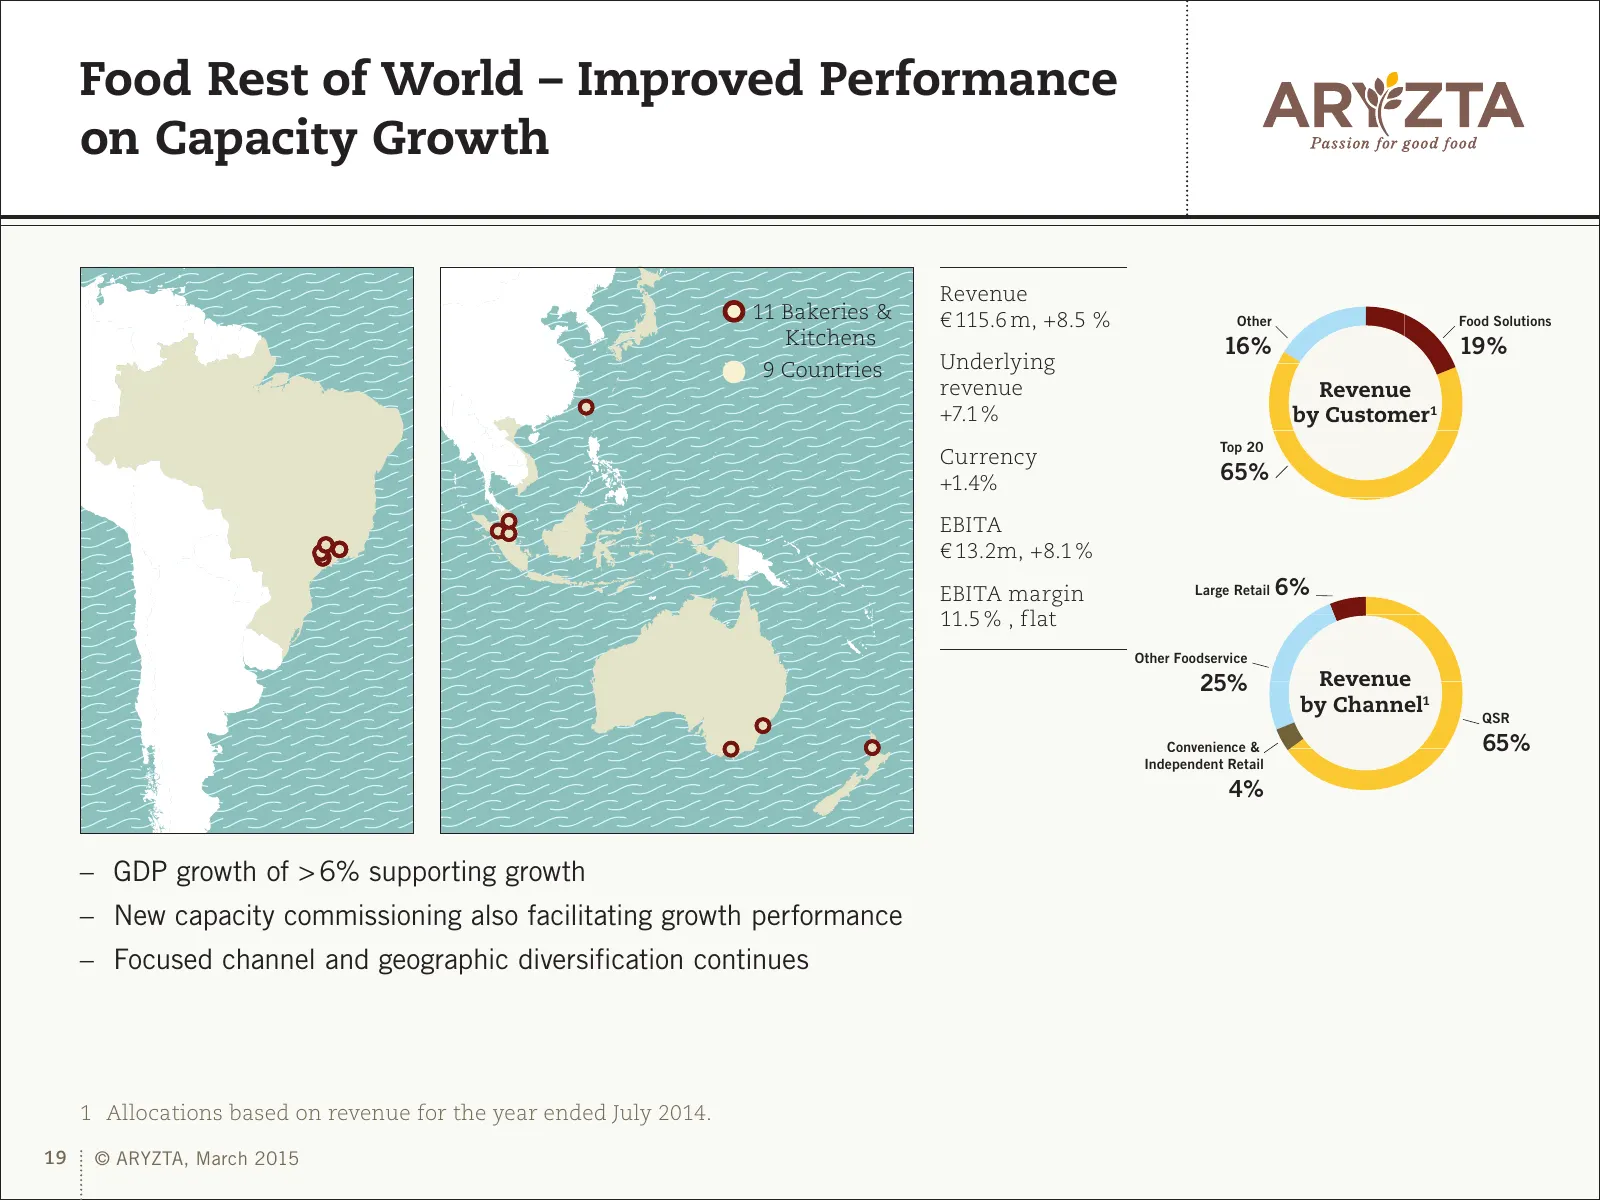
Slide 19: Rest of World – Improved Performance on Capacity Growth
Food Rest of World – Improved Performance on Capacity Growth Revenue 11 Bakeries & € 115.6 m, +8.5 % Other Food Solutions Kitchens 16% 19% 9 Countries Underlying revenue Revenue +7.1 % by Customer1 Top 20 Currency +1.4% 65% EBITA € 13.2m, +8.1 % EBITA margin Large Retail 6% 11.5 % , flat Other Foods
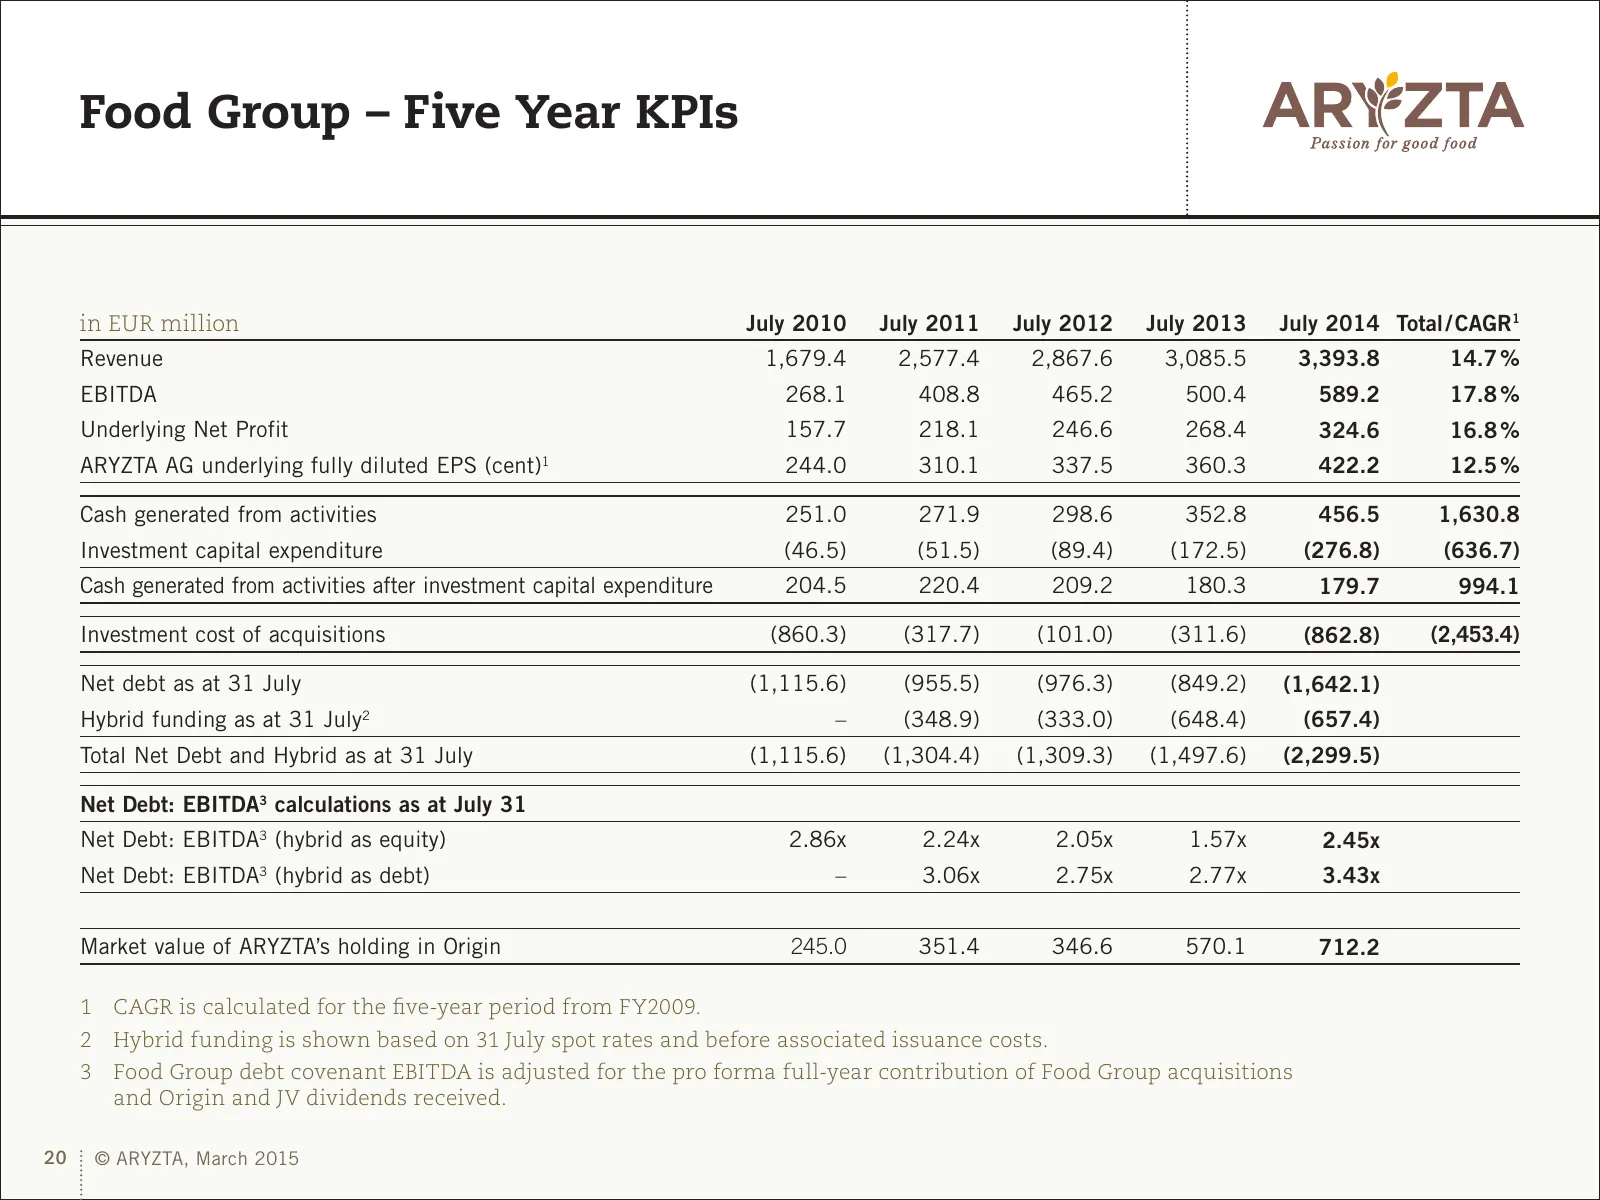
Slide 20: Food Group – Five Year KPIs
Food Group – Five Year KPIs in EUR million July 2010 July 2011 July 2012 July 2013 July 2014 Total / CAGR1 Revenue 1,679.4 2,577.4 2,867.6 3,085.5 3,393.8 14.7 % EBITDA 268.1 408.8 465.2 500.4 589.2 17.8 % Underlying Net Profit 157.7 218.1 246.6 268.4 324.6 16.8 % ARYZTA AG underlying fully diluted
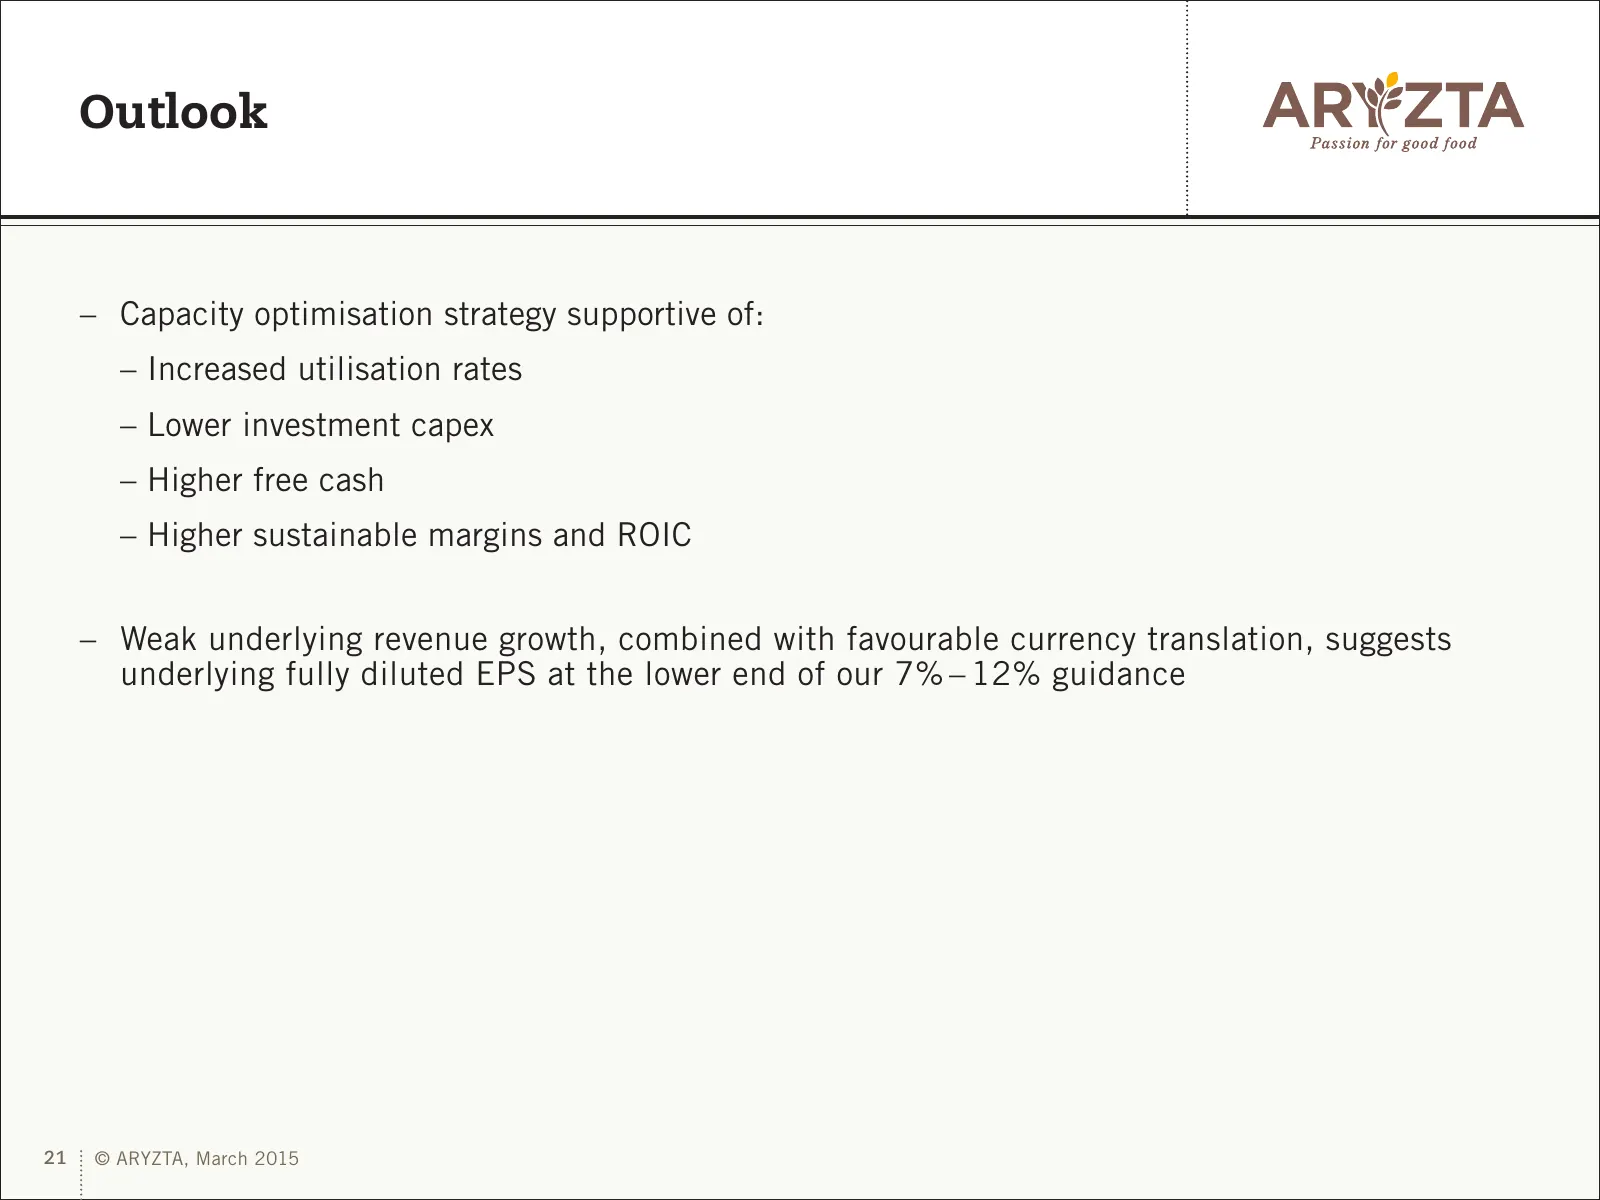
Slide 21: Outlook
Outlook – Capacity optimisation strategy supportive of: – Increased utilisation rates – Lower investment capex – Higher free cash – Higher sustainable margins and ROIC – Weak underlying revenue growth, combined with favourable currency translation, suggests underlying fully diluted EPS at the lower
Slide 22: Food Group Financial Metrics
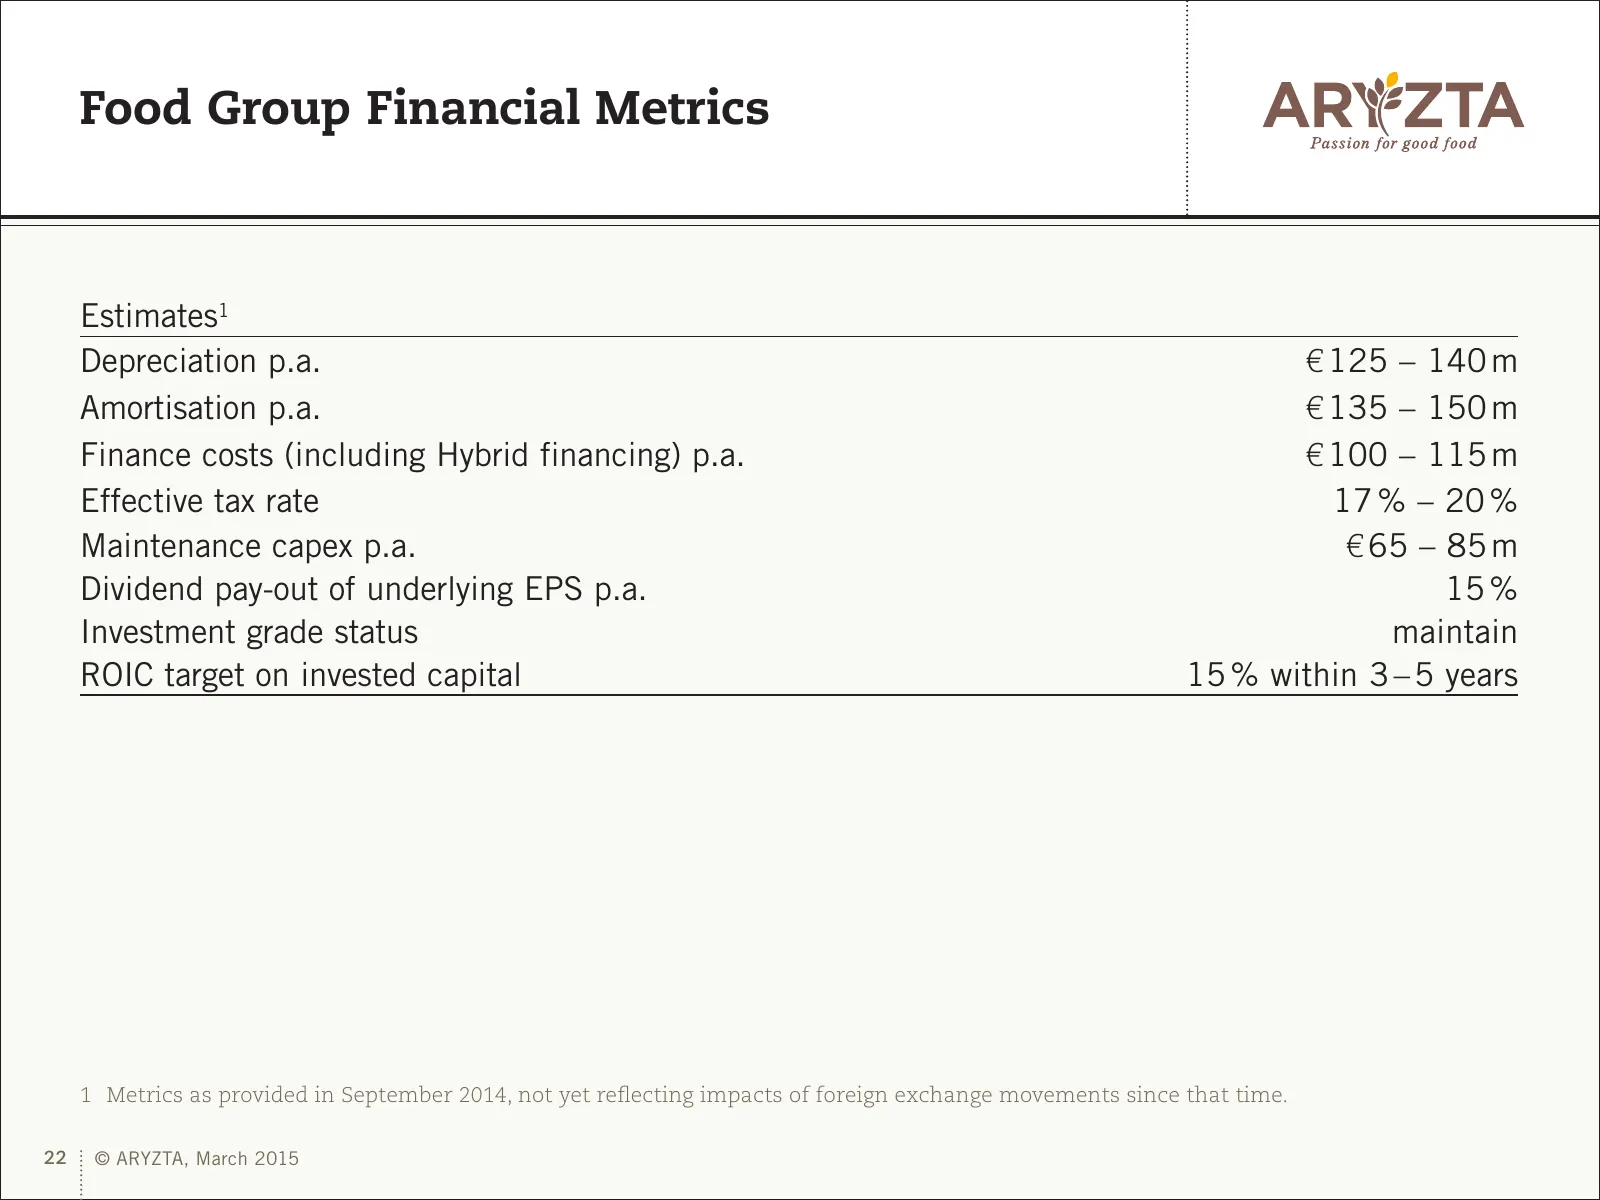
Food Group Financial Metrics Estimates1 Depreciation p.a. € 125 – 140 m Amortisation p.a. € 135 – 150 m Finance costs (including Hybrid financing) p.a. € 100 – 115 m Effective tax rate 17 % – 20 % Maintenance capex p.a. € 65 – 85 m Dividend pay-out of underlying EPS p.a. 15 % Investment grade status
Slide 23: Appendix 1 – Origin Financials
Appendix 1 – Origin Financials 23 © ARYZTA, March 2015
Slide 24: Origin – Income Statement
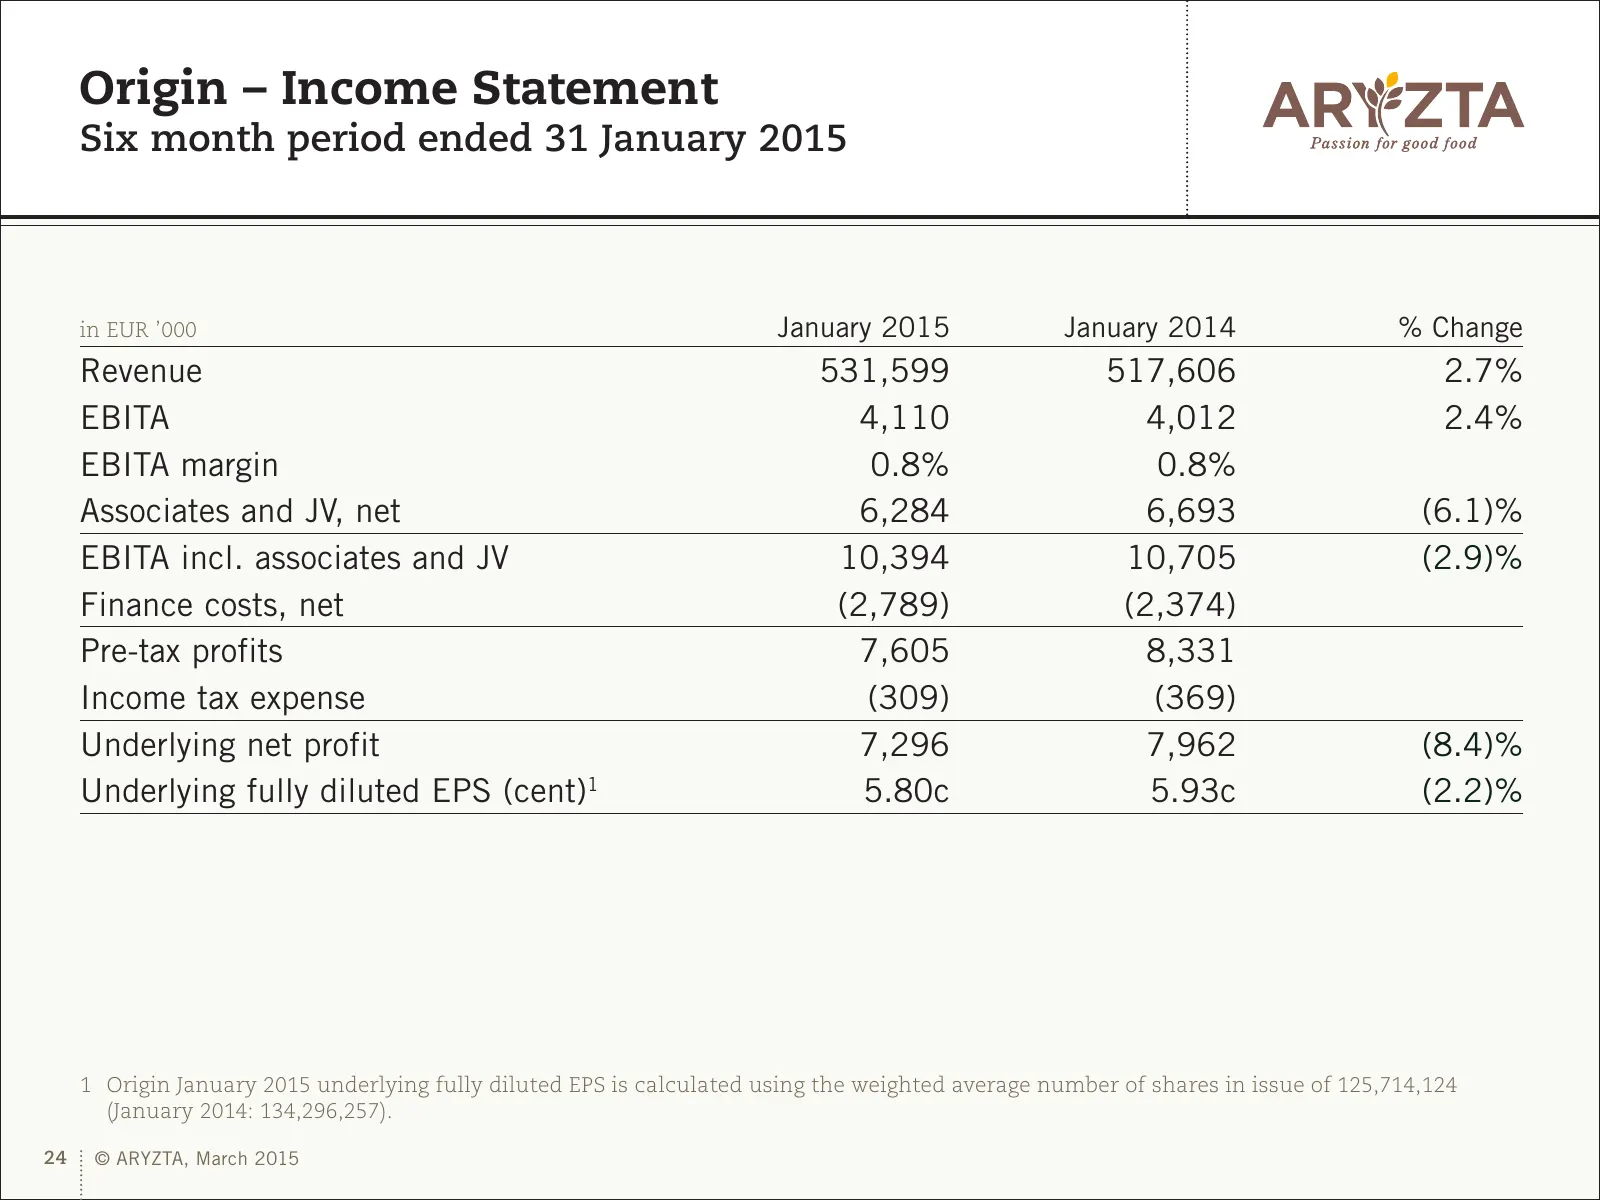
Origin – Income Statement Six month period ended 31 January 2015 in EUR ’000 January 2015 January 2014 % Change Revenue 531,599 517,606 2.7% EBITA 4,110 4,012 2.4% EBITA margin 0.8% 0.8% Associates and JV, net 6,284 6,693 (6.1)% EBITA incl. associates and JV 10,394 10,705 (2.9)% Finance costs, net (
Slide 25: Origin – Underlying Net Profit Rec.
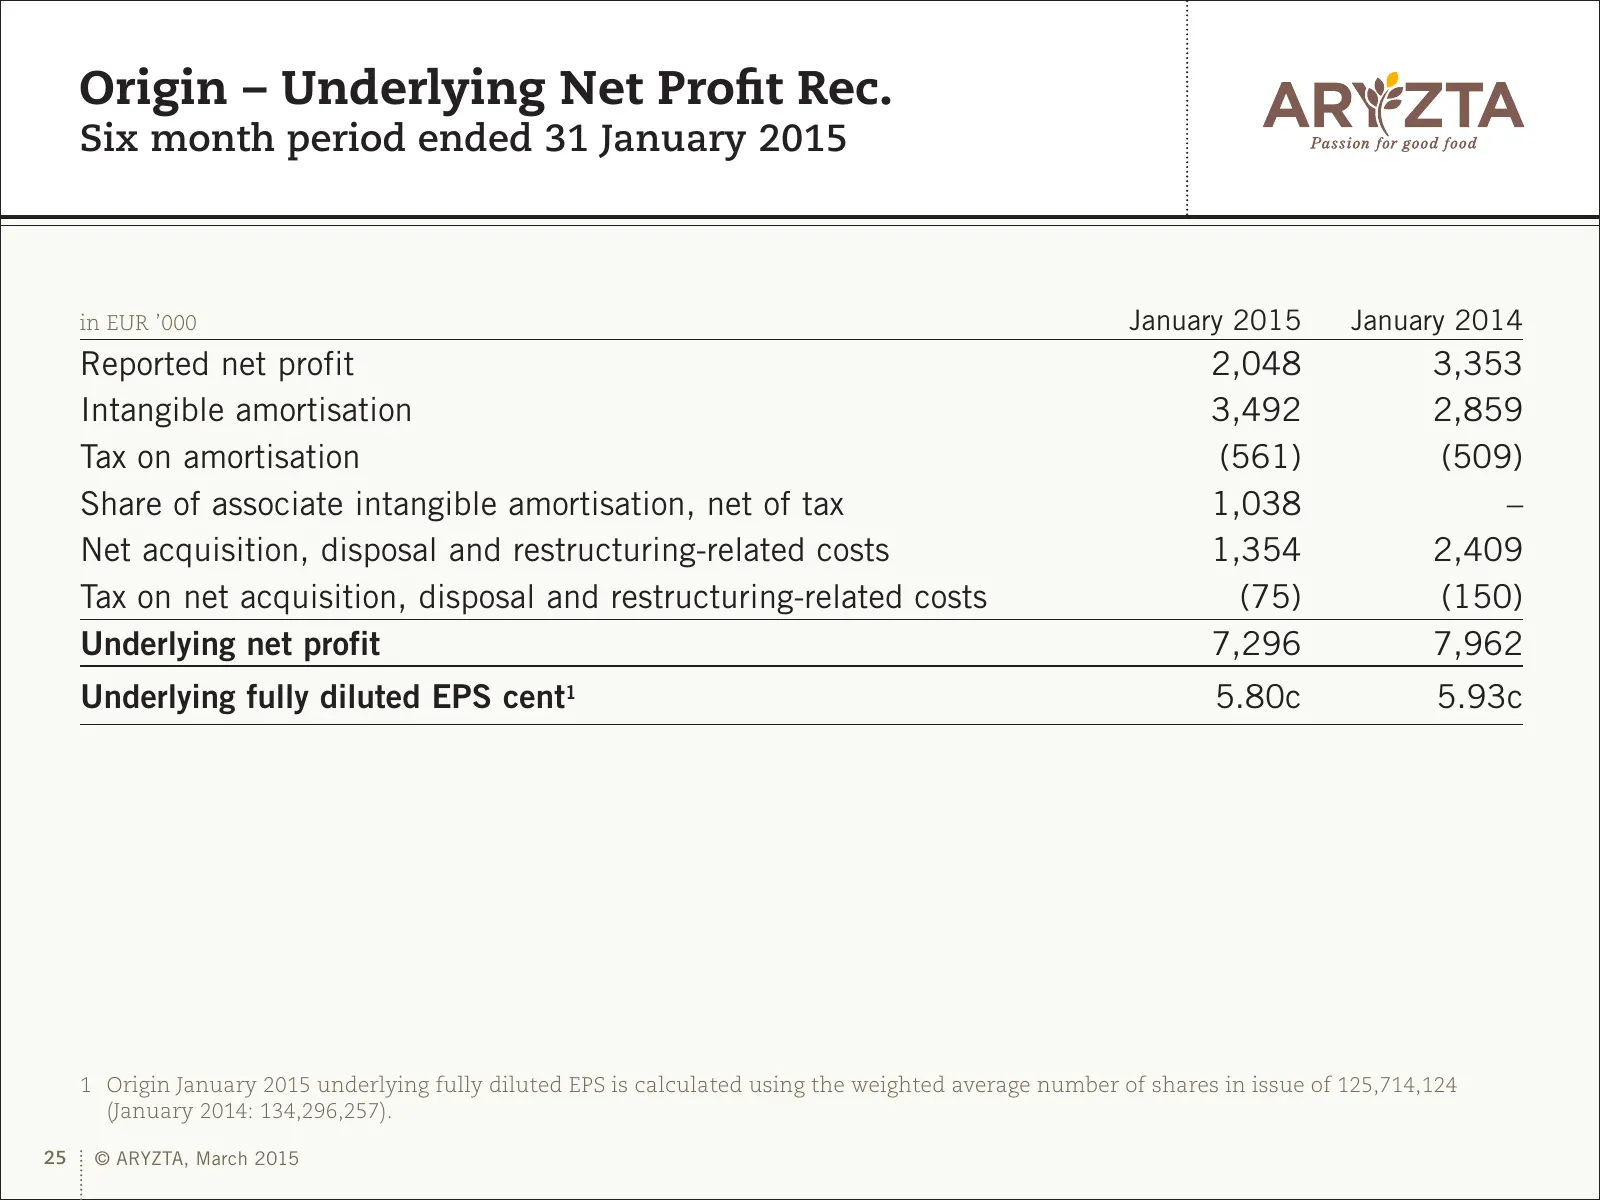
Origin – Underlying Net Profit Rec. Six month period ended 31 January 2015 in EUR ’000 January 2015 January 2014 Reported net profit 2,048 3,353 Intangible amortisation 3,492 2,859 Tax on amortisation (561) (509) Share of associate intangible amortisation, net of tax 1,038 – Net acquisition, disposa
Slide 26: Appendix 2 – Other Financial Information and Presentation Glossary
Appendix 2 – Other Financial Information and Presentation Glossary 26 © ARYZTA, March 2015
Slide 27: ARYZTA Group – Underlying Net Profit Rec.
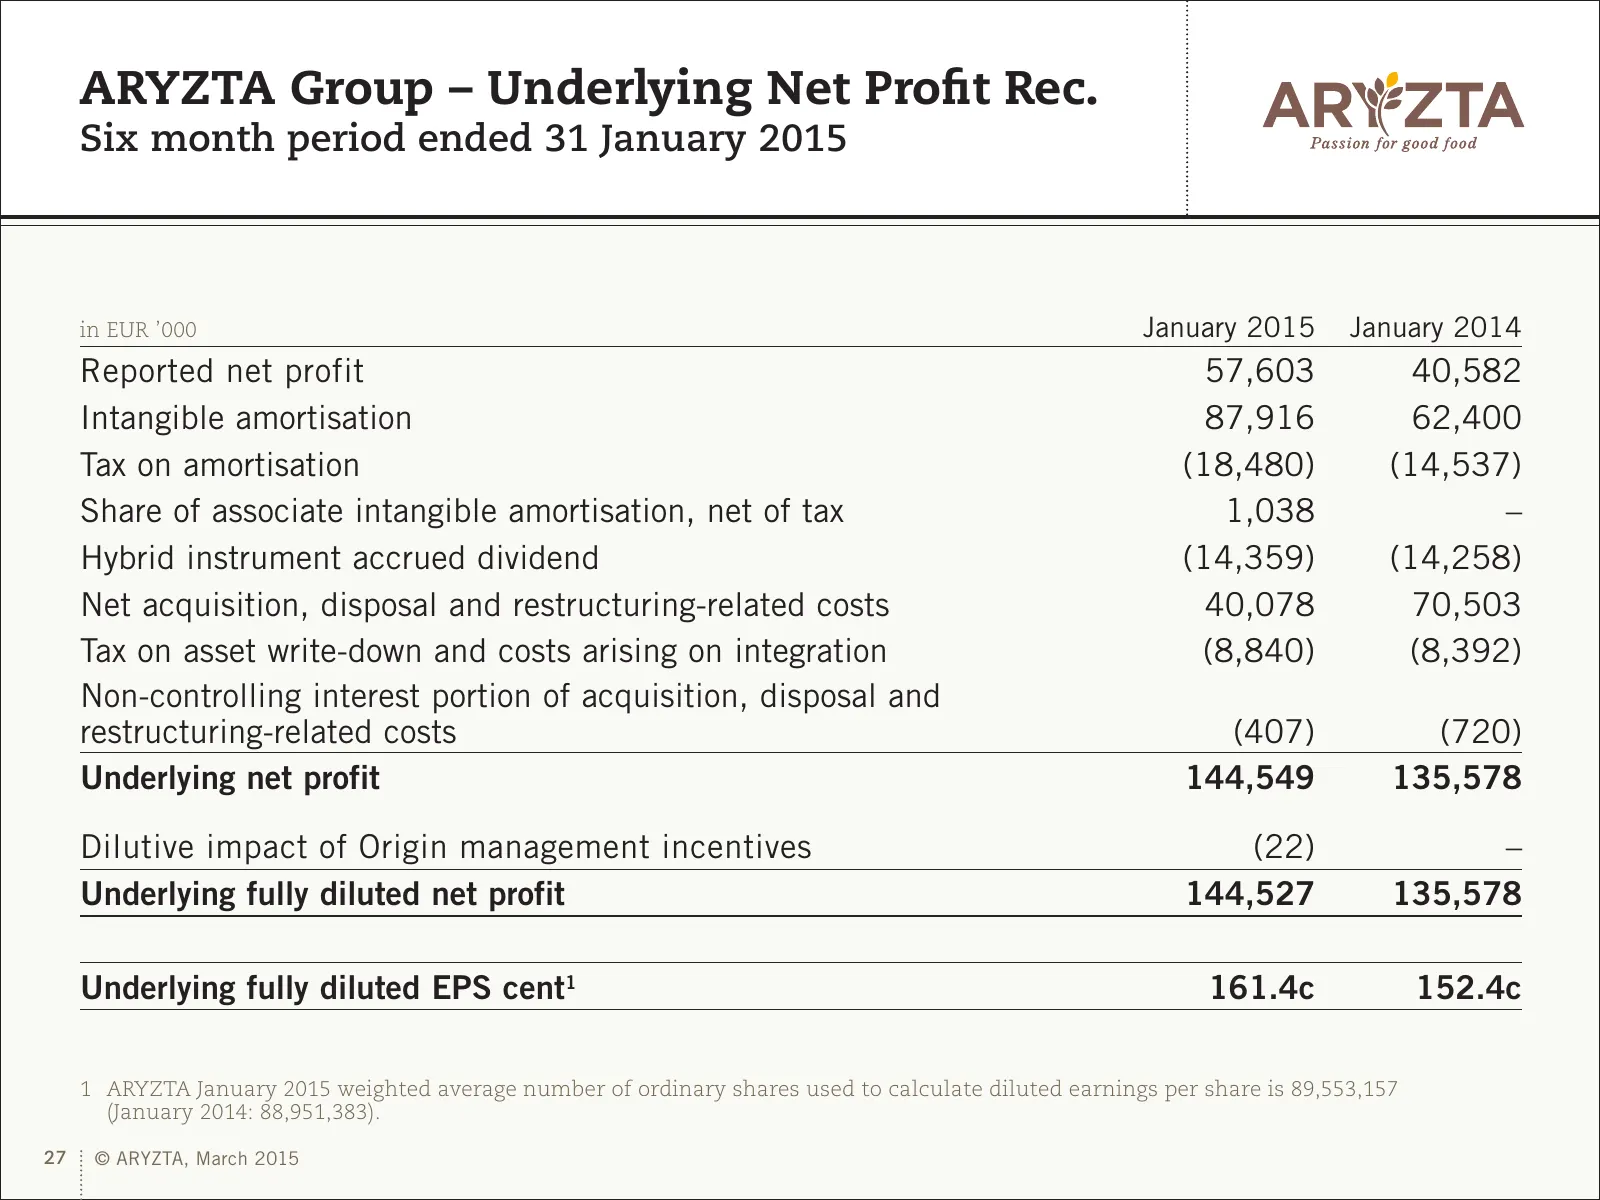
ARYZTA Group – Underlying Net Profit Rec. Six month period ended 31 January 2015 in EUR ’000 January 2015 January 2014 Reported net profit 57,603 40,582 Intangible amortisation 87,916 62,400 Tax on amortisation (18,480) (14,537) Share of associate intangible amortisation, net of tax 1,038 – Hybrid i
Slide 28: Food Group – Underlying Net Profit Rec.
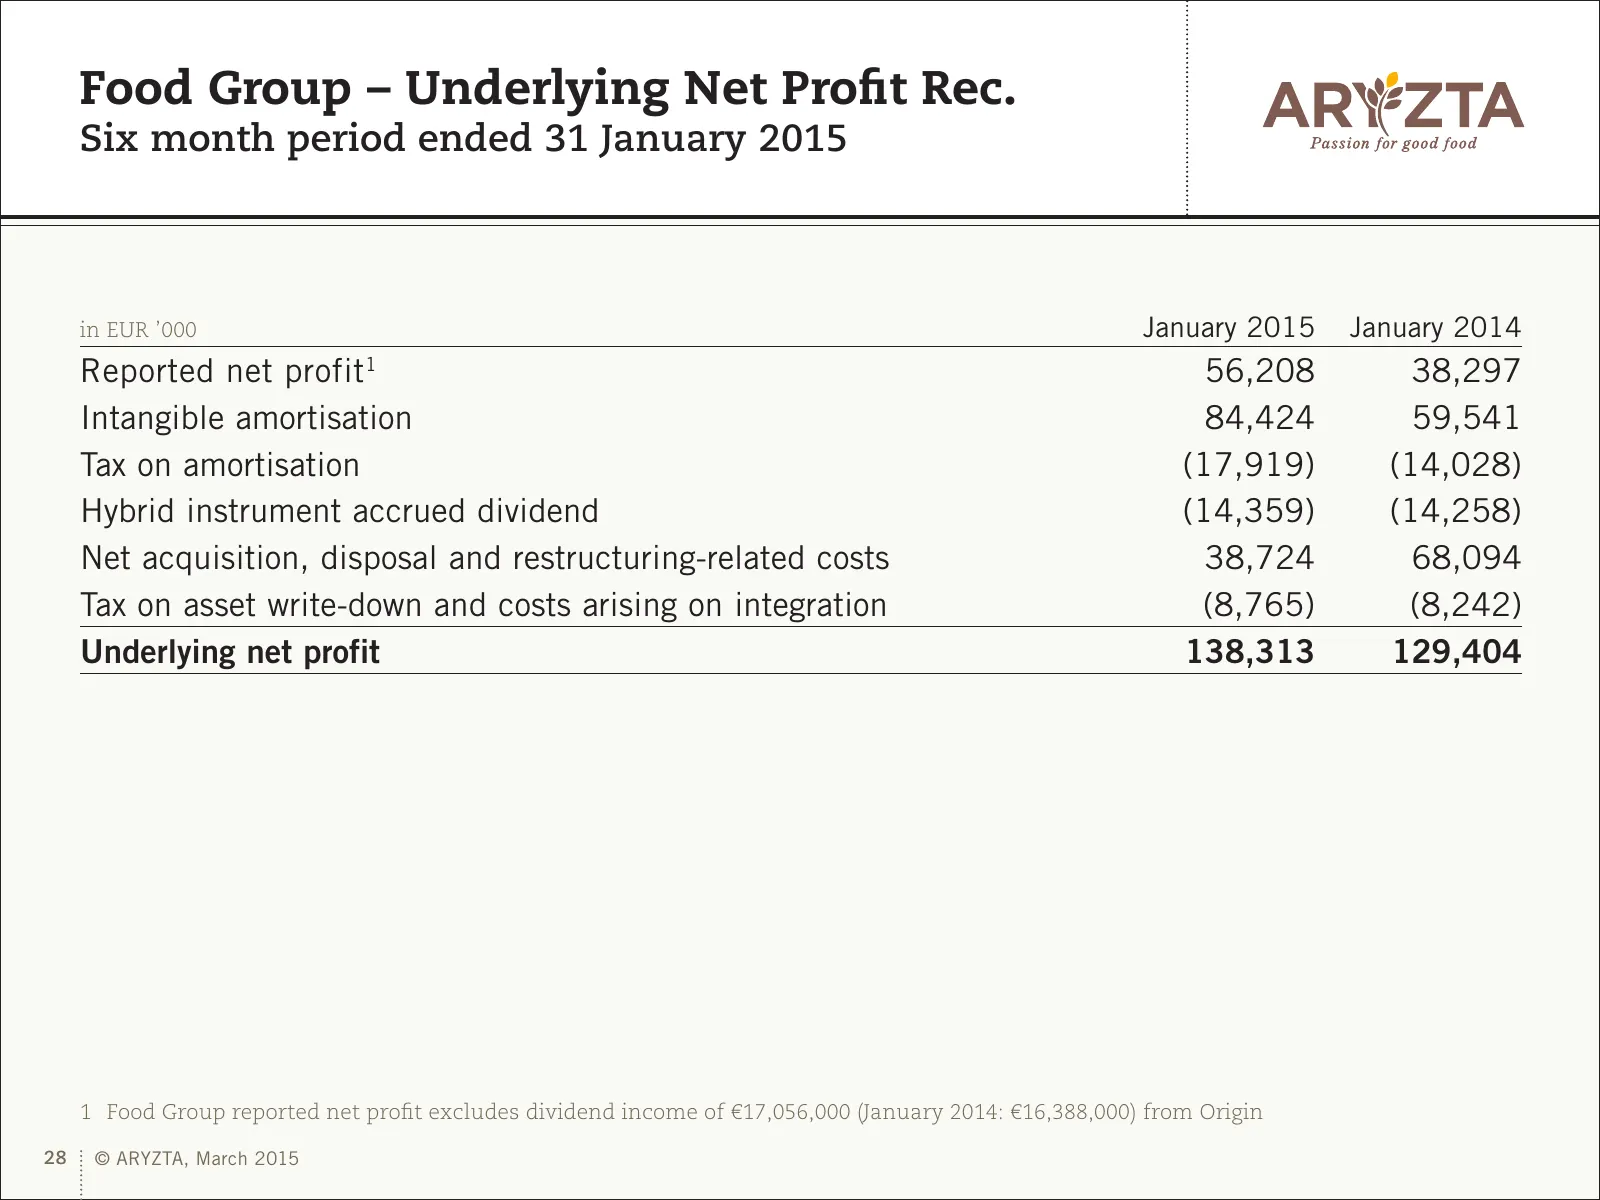
Food Group – Underlying Net Profit Rec. Six month period ended 31 January 2015 in EUR ’000 January 2015 January 2014 Reported net profit1 56,208 38,297 Intangible amortisation 84,424 59,541 Tax on amortisation (17,919) (14,028) Hybrid instrument accrued dividend (14,359) (14,258) Net acquisition, di
Slide 29: ARYZTA AG Balance Sheet
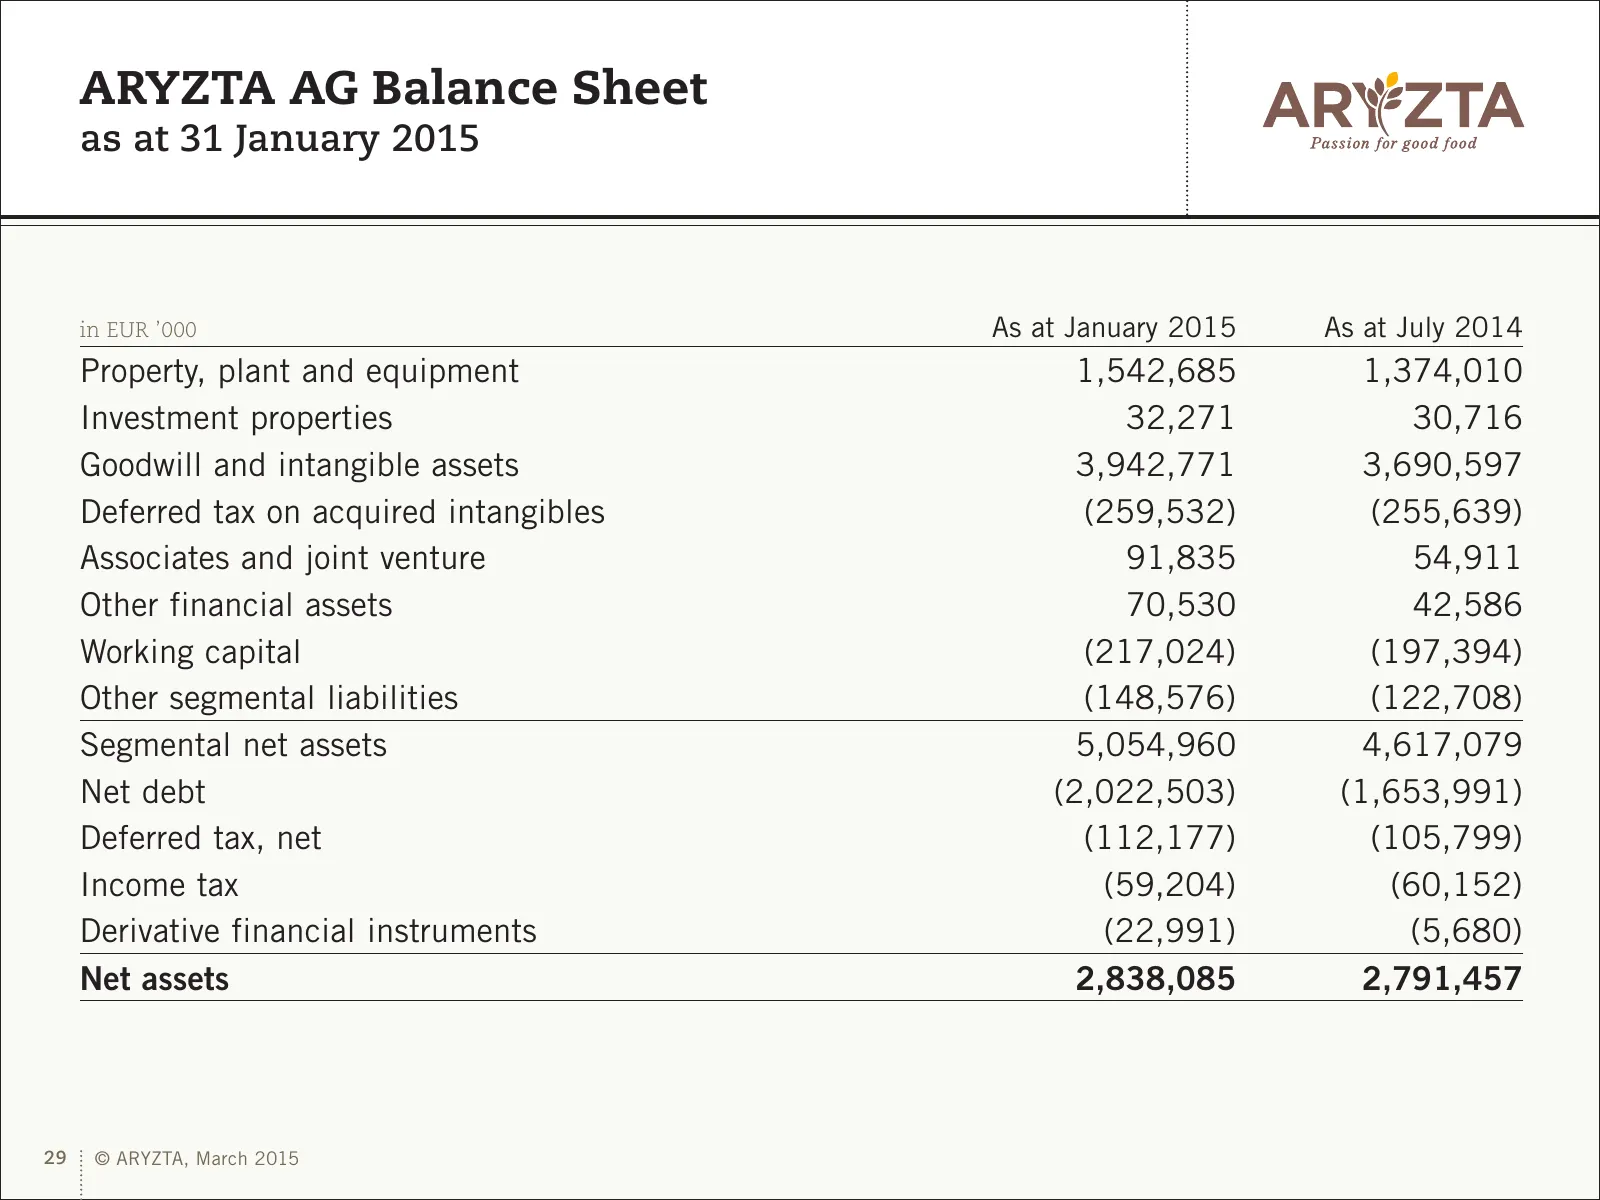
ARYZTA AG Balance Sheet as at 31 January 2015 in EUR ’000 As at January 2015 As at July 2014 Property, plant and equipment 1,542,685 1,374,010 Investment properties 32,271 30,716 Goodwill and intangible assets 3,942,771 3,690,597 Deferred tax on acquired intangibles (259,532) (255,639) Associates an
Slide 30: Food Group Balance Sheet
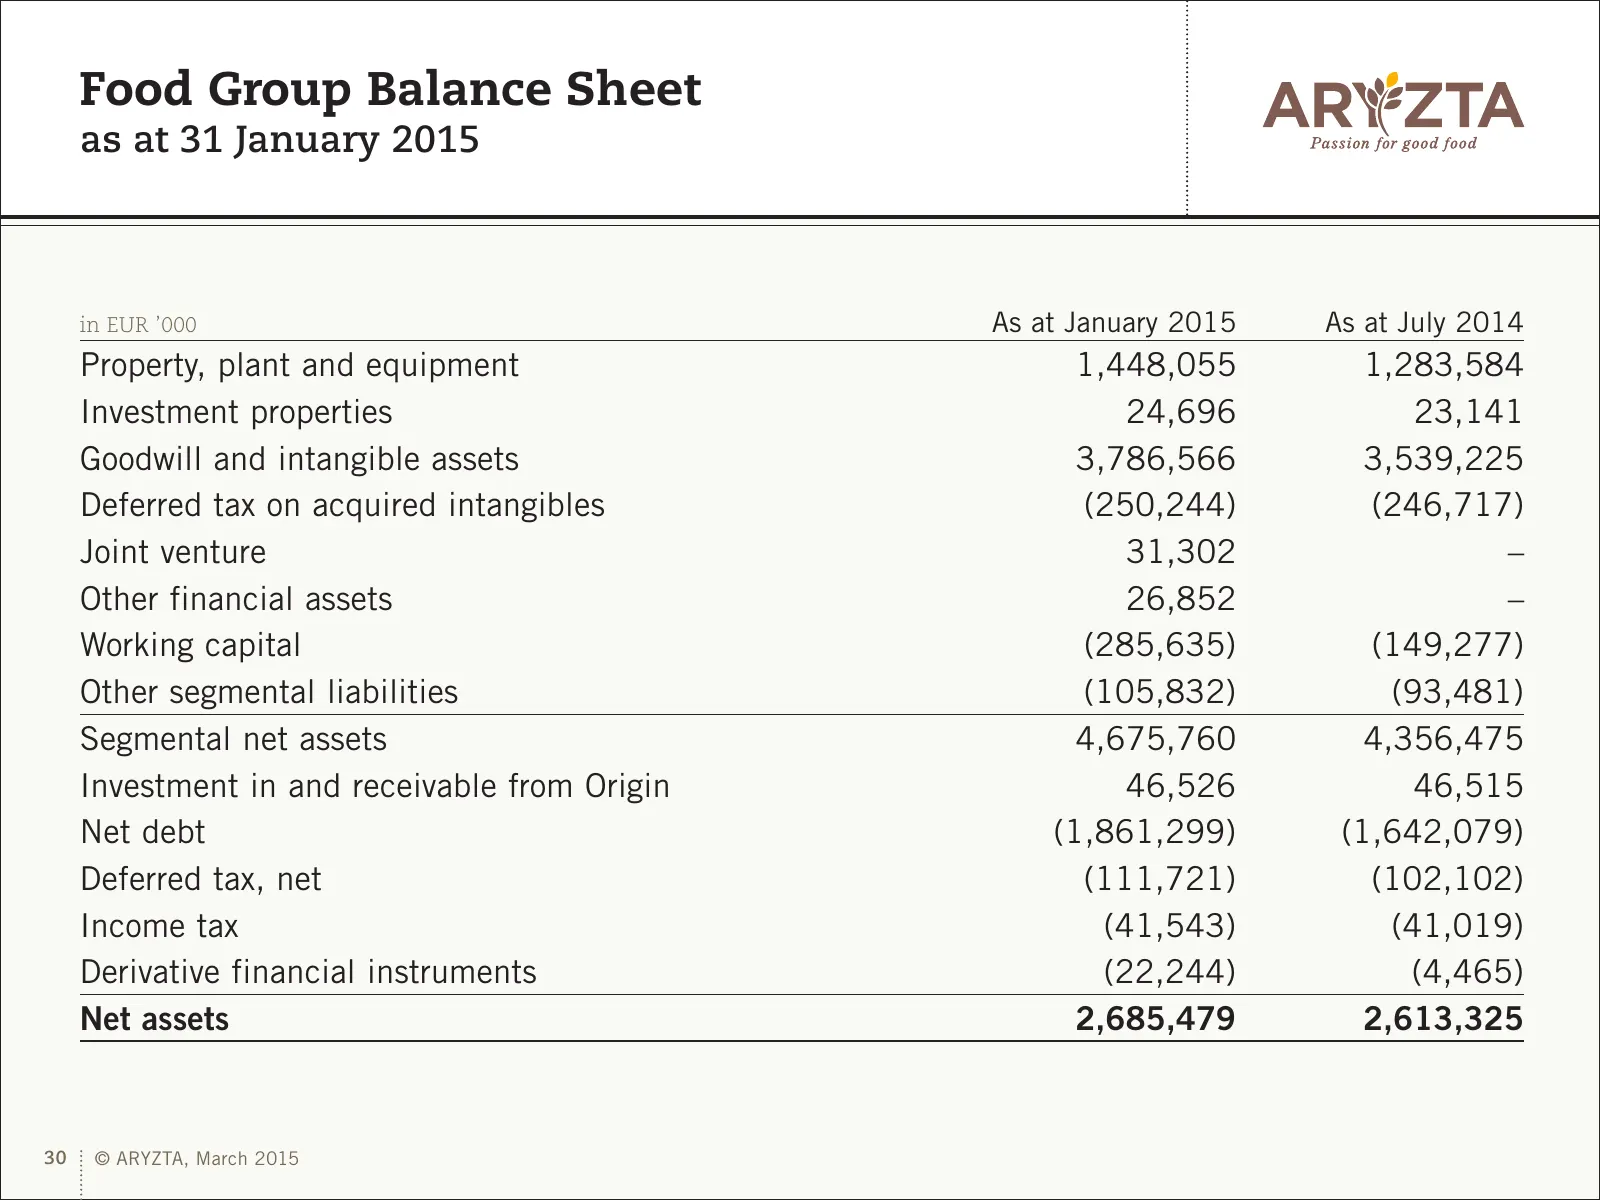
Food Group Balance Sheet as at 31 January 2015 in EUR ’000 As at January 2015 As at July 2014 Property, plant and equipment 1,448,055 1,283,584 Investment properties 24,696 23,141 Goodwill and intangible assets 3,786,566 3,539,225 Deferred tax on acquired intangibles (250,244) (246,717) Joint ventur
Slide 31: Food Group – Financing
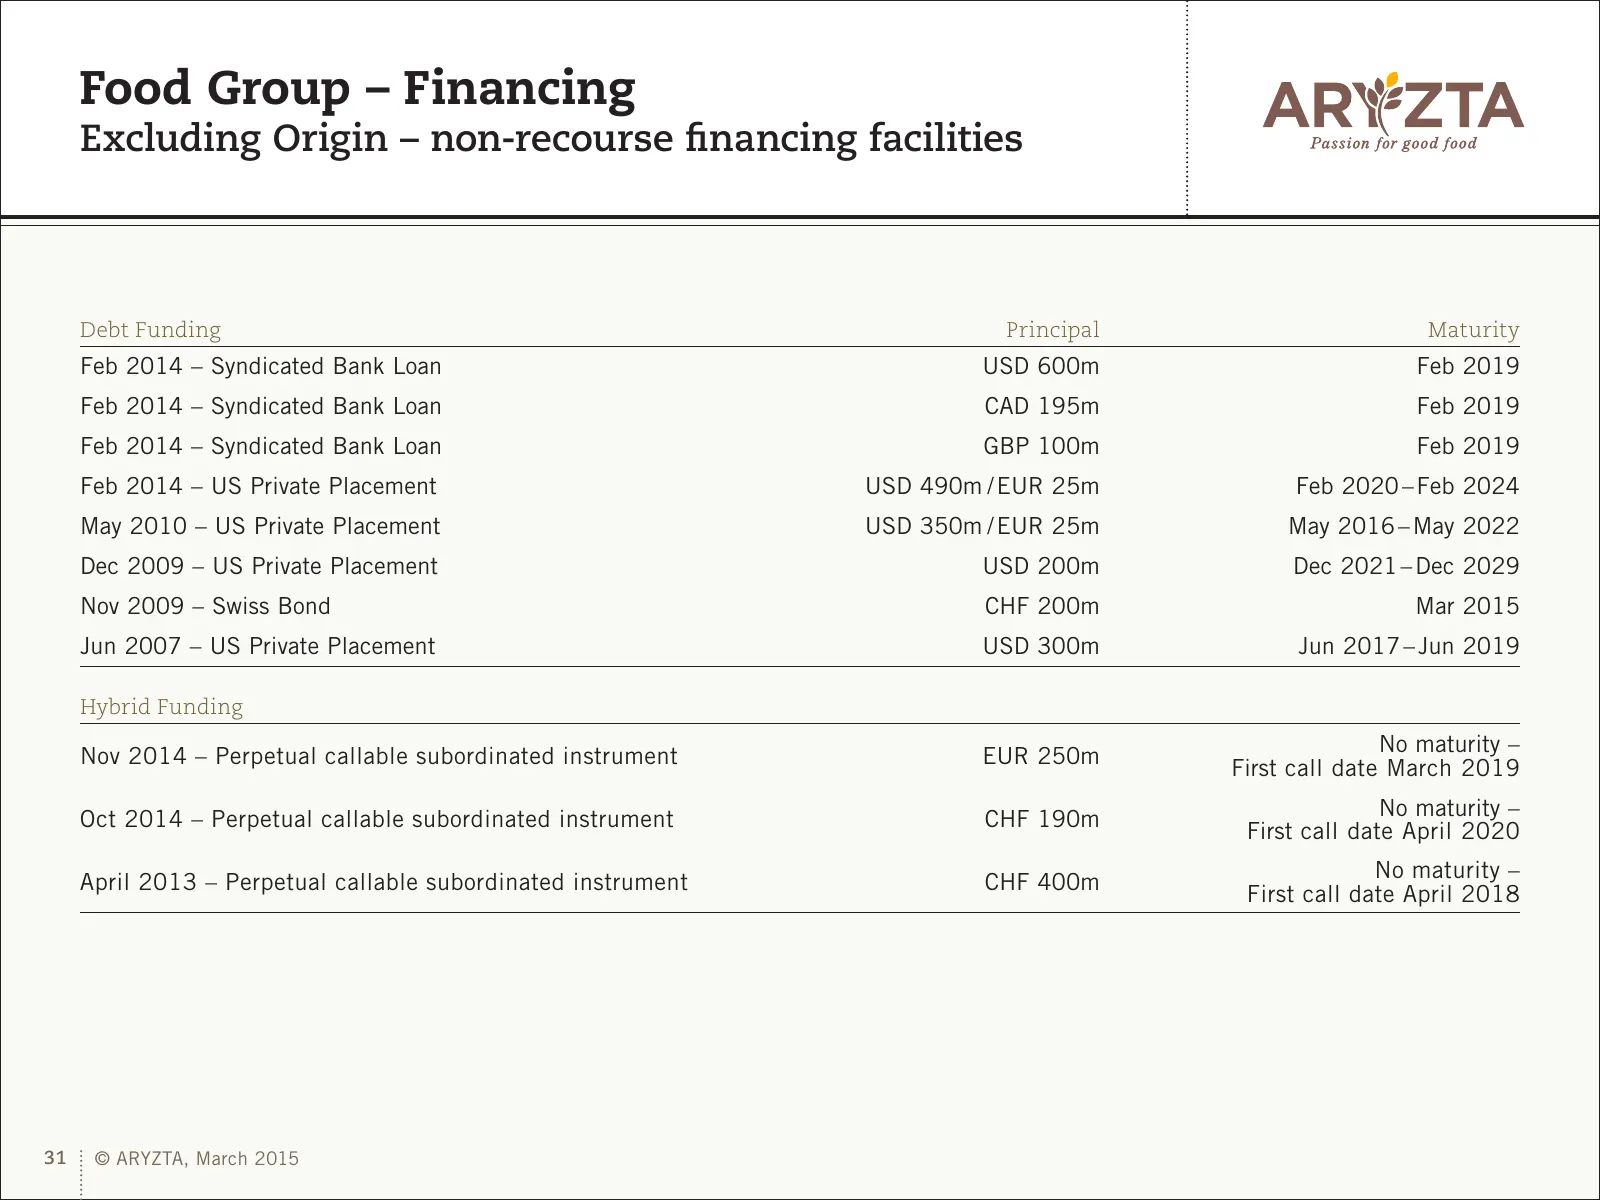
Food Group – Financing Excluding Origin – non-recourse financing facilities Debt Funding Principal Maturity Feb 2014 – Syndicated Bank Loan USD 600m Feb 2019 Feb 2014 – Syndicated Bank Loan CAD 195m Feb 2019 Feb 2014 – Syndicated Bank Loan GBP 100m Feb 2019 Feb 2014 – US Private Placement USD 490m /
Slide 32: Food Group – Gross Term Debt Maturity Profile
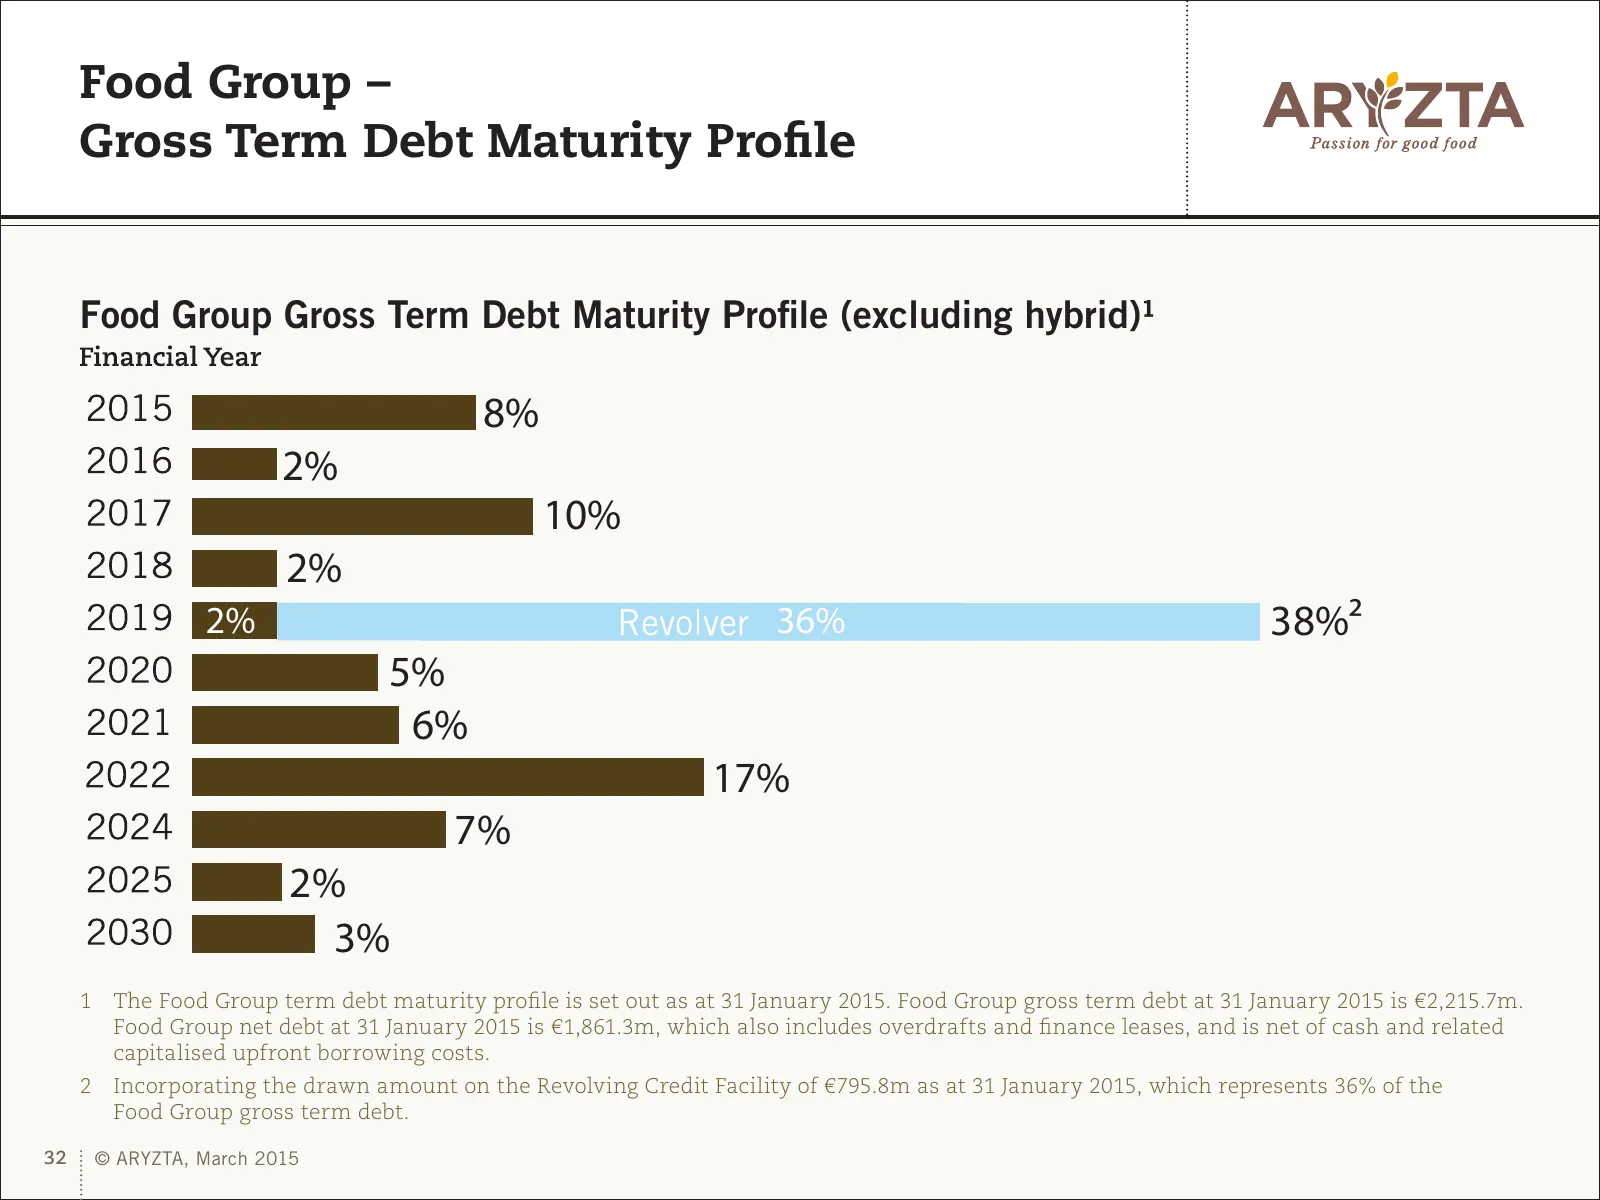
Food Group – Gross Term Debt Maturity Profile Food Group Gross Term Debt Maturity Profile (excluding hybrid)¹ 8% 2% 10% 2% 2% 36% 38%² 5% 6% 17% 7% 2% 3% 1 The Food Group term debt maturity profile is set out as at 31 January 2015. Food Group gross term debt at 31 January 2015 is €2,215.7m. Food Gro
Slide 33: ARYZTA Group – Return on Invested Capital
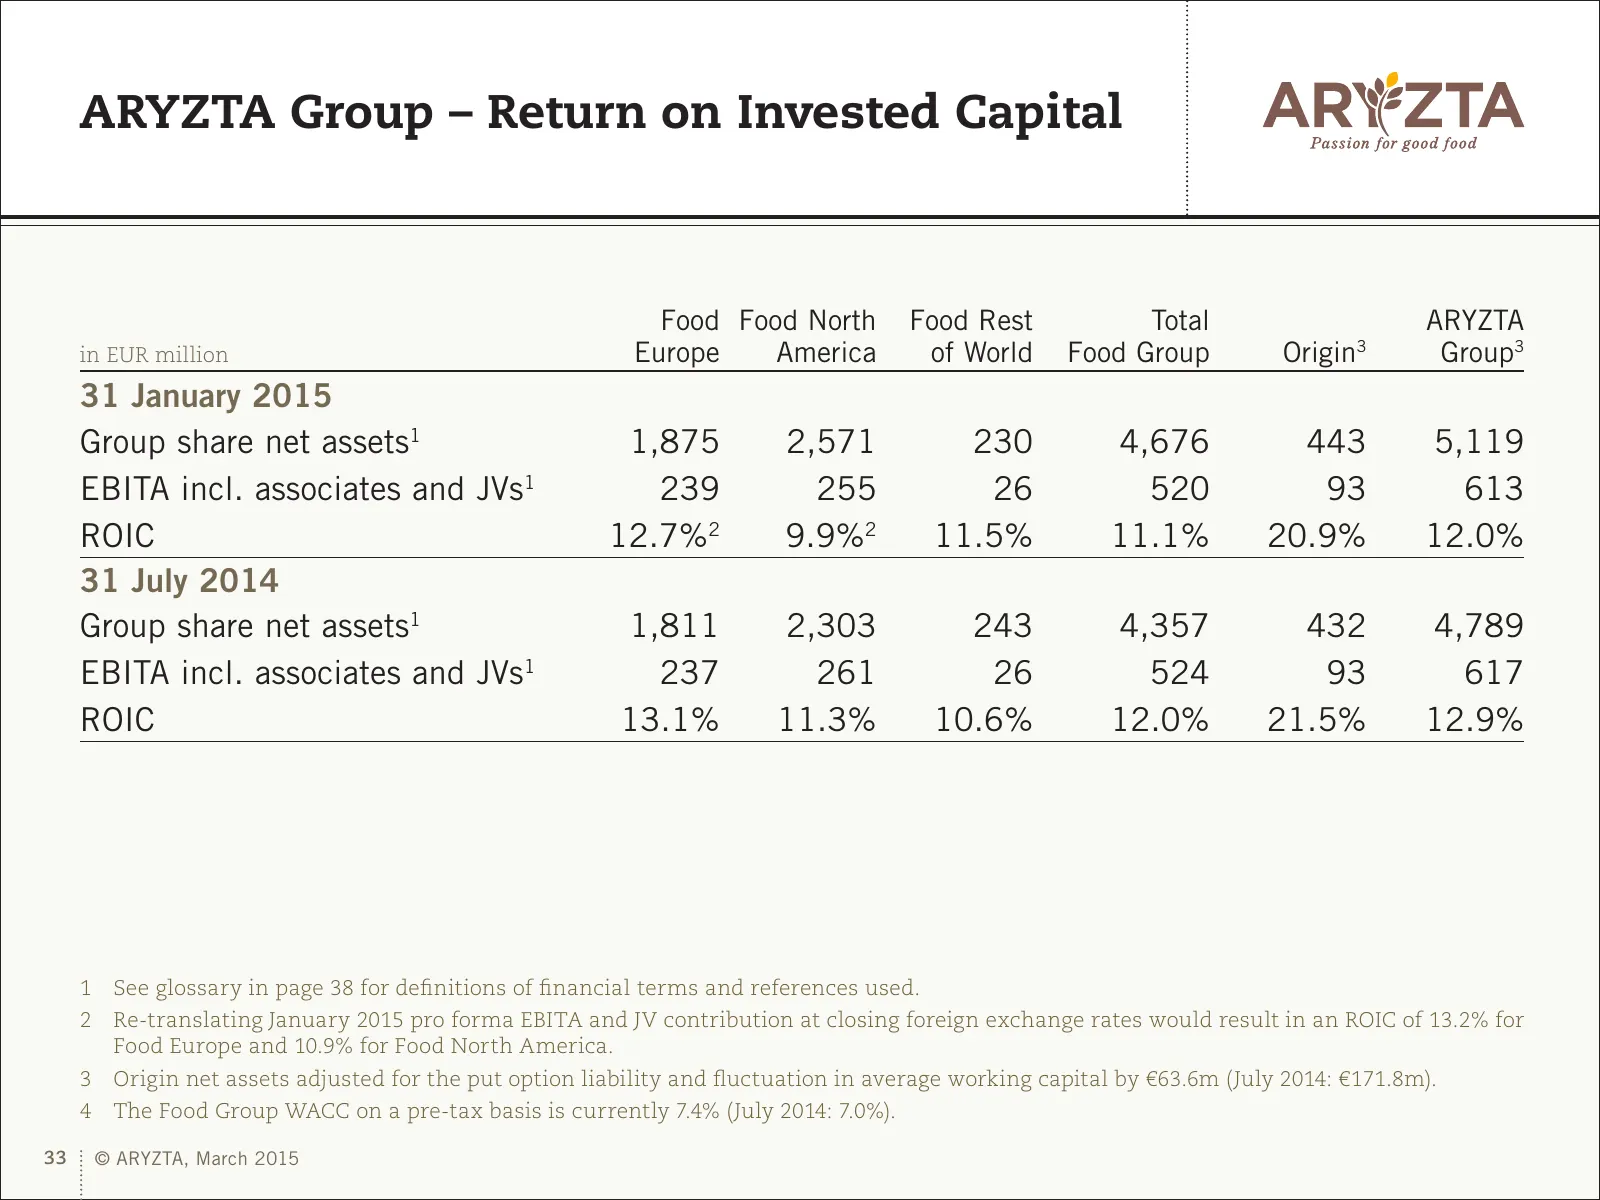
ARYZTA Group – Return on Invested Capital Food Food North Food Rest Total ARYZTA in EUR million Europe America of World Food Group Origin3 Group3 31 January 2015 Group share net assets1 1,875 2,571 230 4,676 443 5,119 EBITA incl. associates and JVs1 239 255 26 520 93 613 ROIC 12.7%2 9.9%2 11.5% 11.1
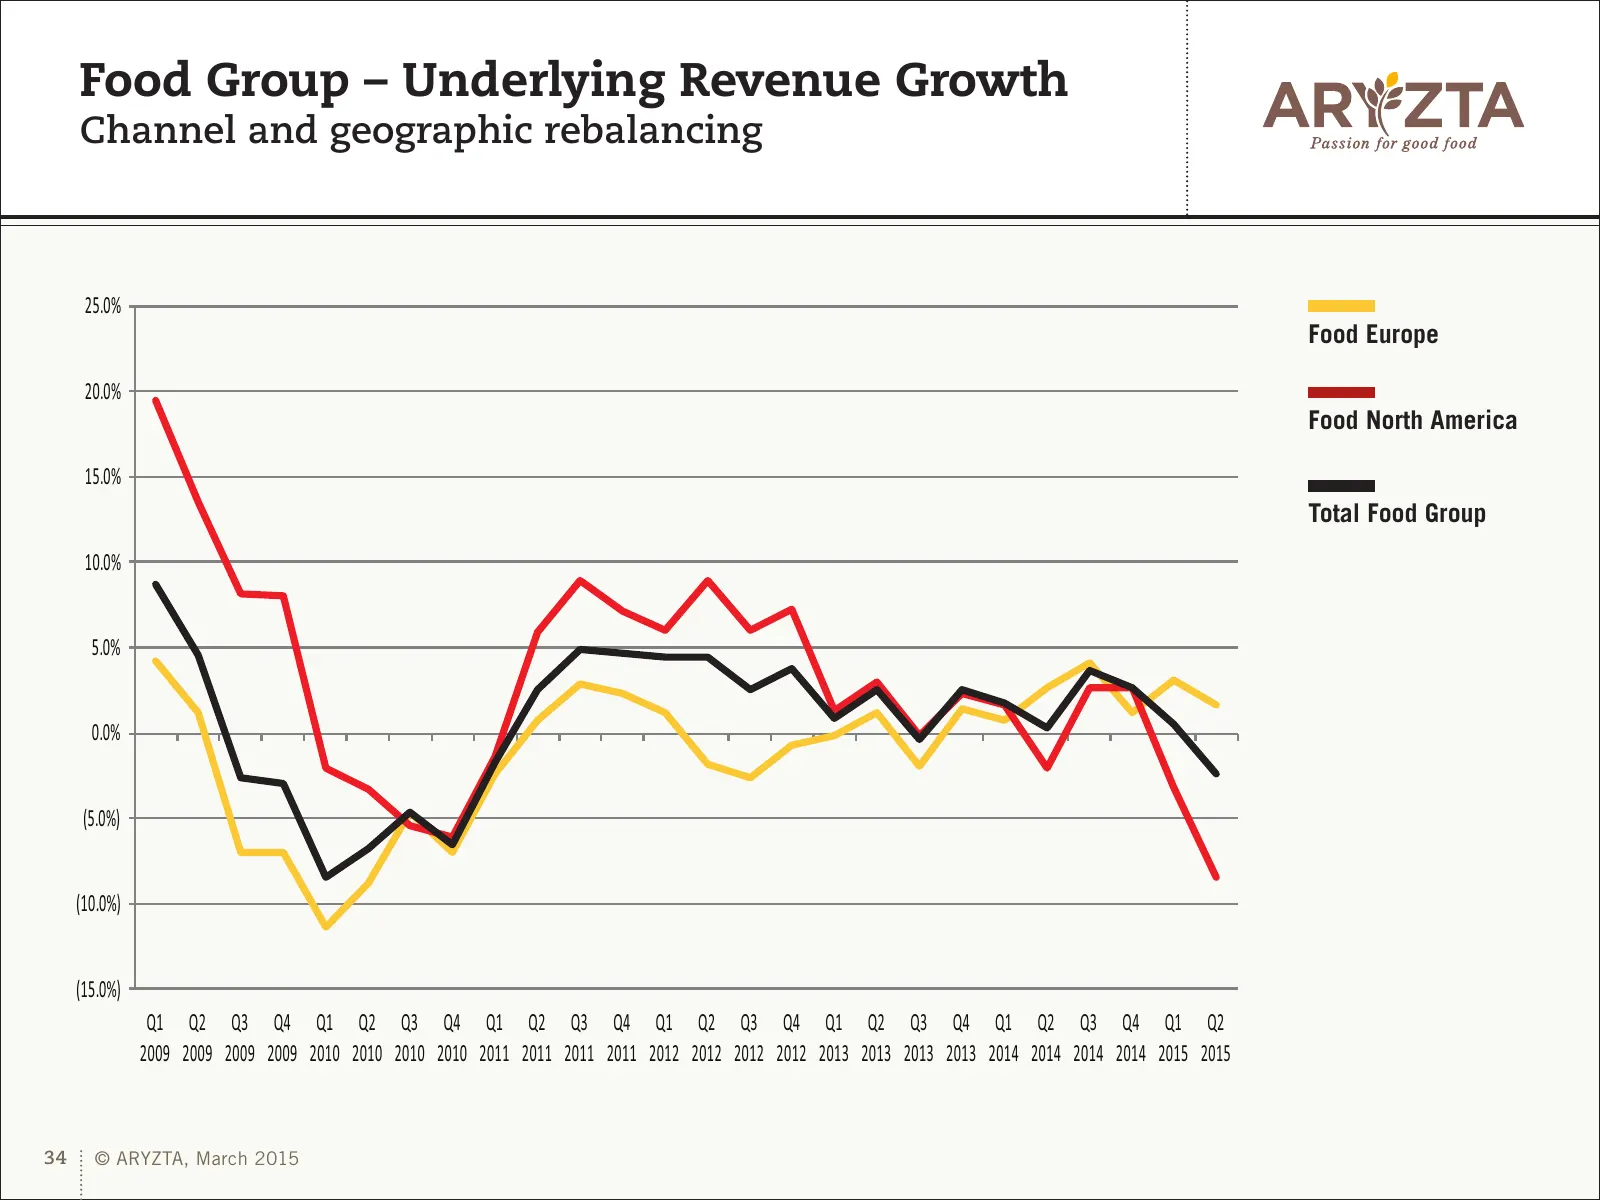
Slide 34: Food Group – Underlying Revenue Growth
Food Group – Underlying Revenue Growth Channel and geographic rebalancing 25.0% Food Europe 20.0% Food North America 15.0% Total Food Group 10.0% 5.0% 0.0% (5.0%) (10.0%) (15.0%) Q1 Q2 Q3 Q4 Q1 Q2 Q3 Q4 Q1 Q2 Q3 Q4 Q1 Q2 Q3 Q4 Q1 Q2 Q3 Q4 Q1 Q2 Q3 Q4 Q1 Q2 2009 2009 2009 2009 2010 2010 2010 2010 201
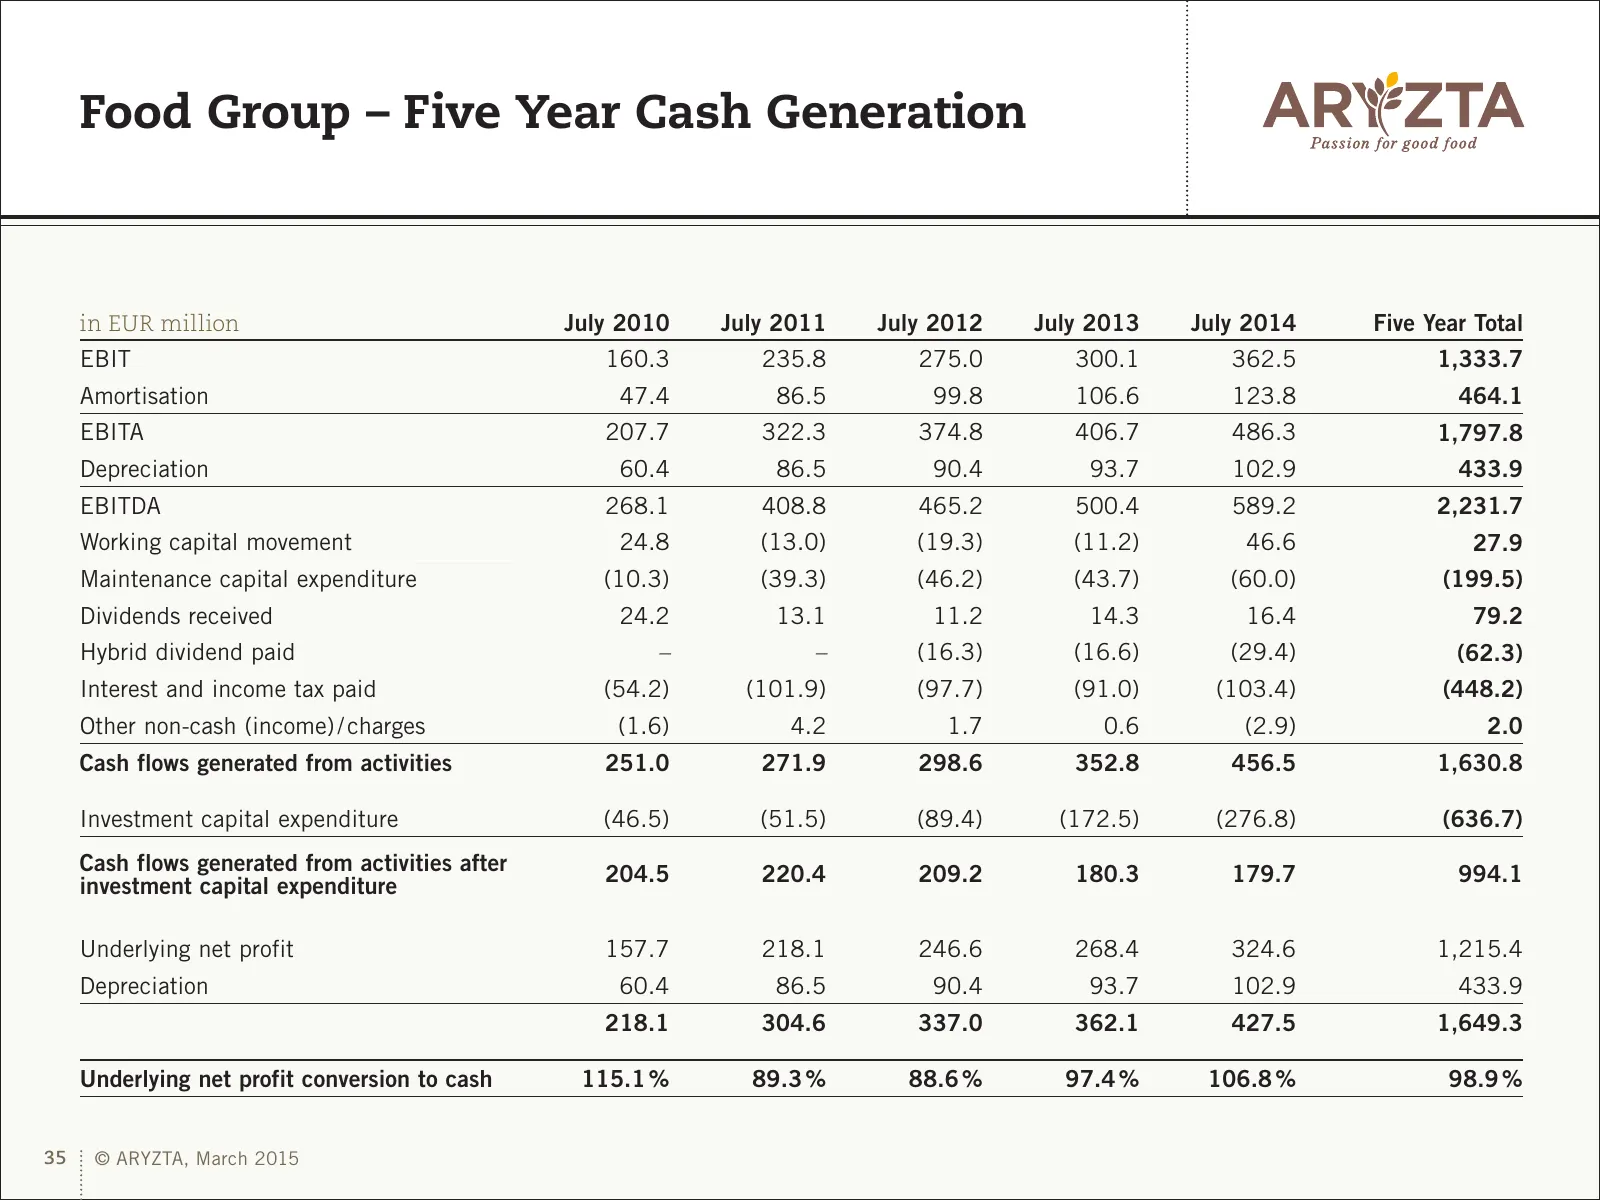
Slide 35: Food Group – Five Year Cash Generation
Food Group – Five Year Cash Generation in EUR million July 2010 July 2011 July 2012 July 2013 July 2014 Five Year Total EBIT 160.3 235.8 275.0 300.1 362.5 1,333.7 Amortisation 47.4 86.5 99.8 106.6 123.8 464.1 EBITA 207.7 322.3 374.8 406.7 486.3 1,797.8 Depreciation 60.4 86.5 90.4 93.7 102.9 433.9 EB
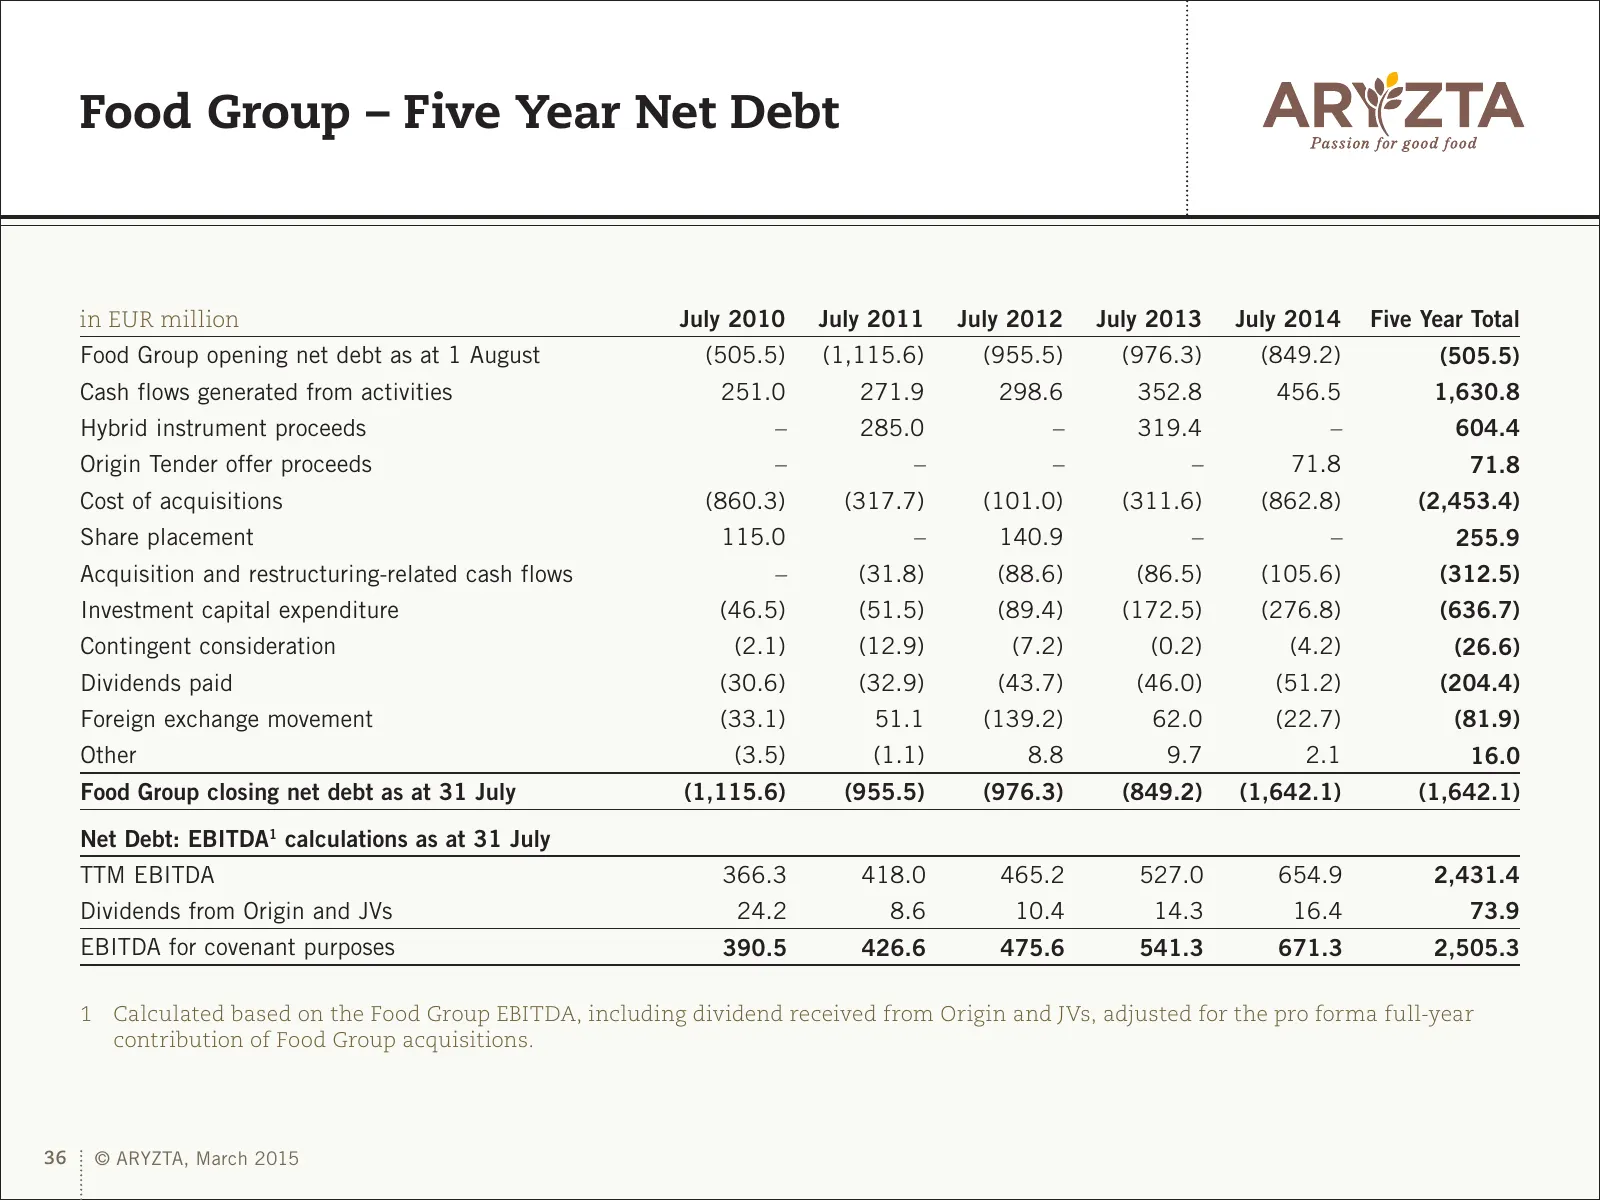
Slide 36: Food Group – Five Year Net Debt
Food Group – Five Year Net Debt in EUR million July 2010 July 2011 July 2012 July 2013 July 2014 Five Year Total Food Group opening net debt as at 1 August (505.5) (1,115.6) (955.5) (976.3) (849.2) (505.5) Cash flows generated from activities 251.0 271.9 298.6 352.8 456.5 1,630.8 Hybrid instrument p
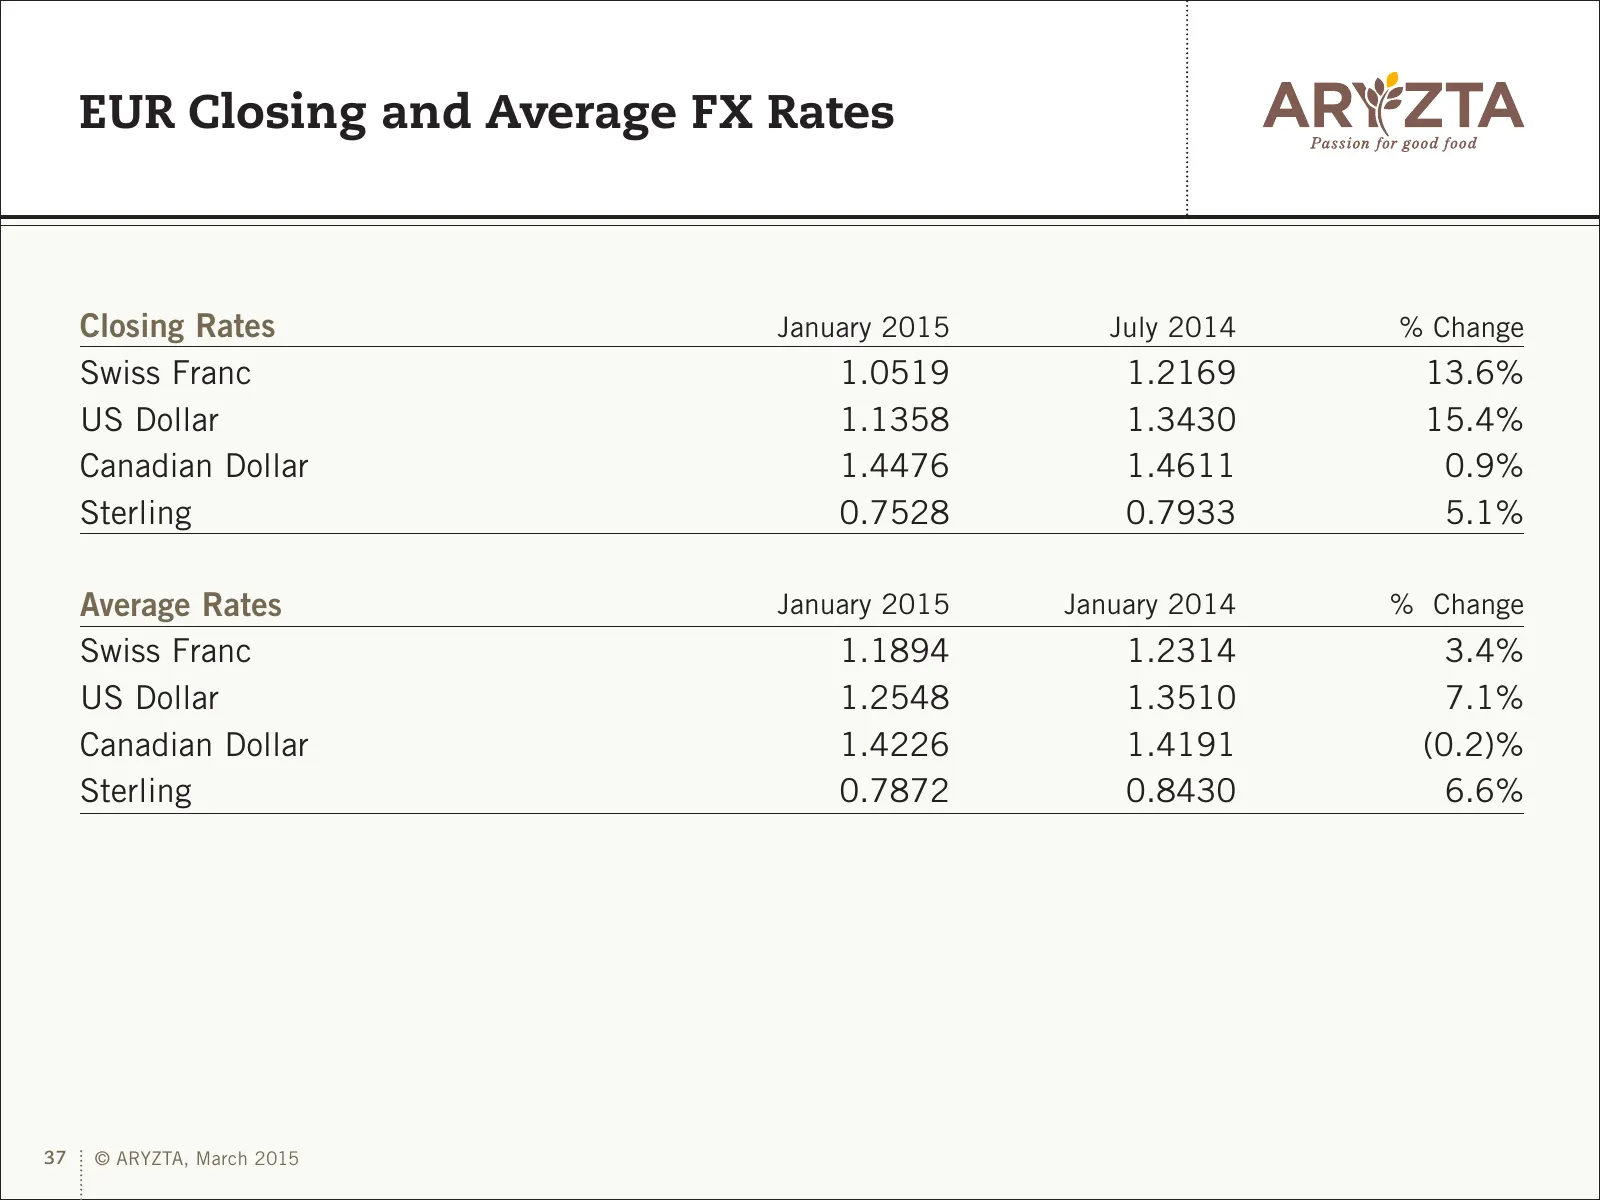
Slide 37: EUR Closing and Average FX Rates
EUR Closing and Average FX Rates Closing Rates January 2015 July 2014 % Change Swiss Franc 1.0519 1.2169 13.6% US Dollar 1.1358 1.3430 15.4% Canadian Dollar 1.4476 1.4611 0.9% Sterling 0.7528 0.7933 5.1% Average Rates January 2015 January 2014 % Change Swiss Franc 1.1894 1.2314 3.4% US Dollar 1.2548
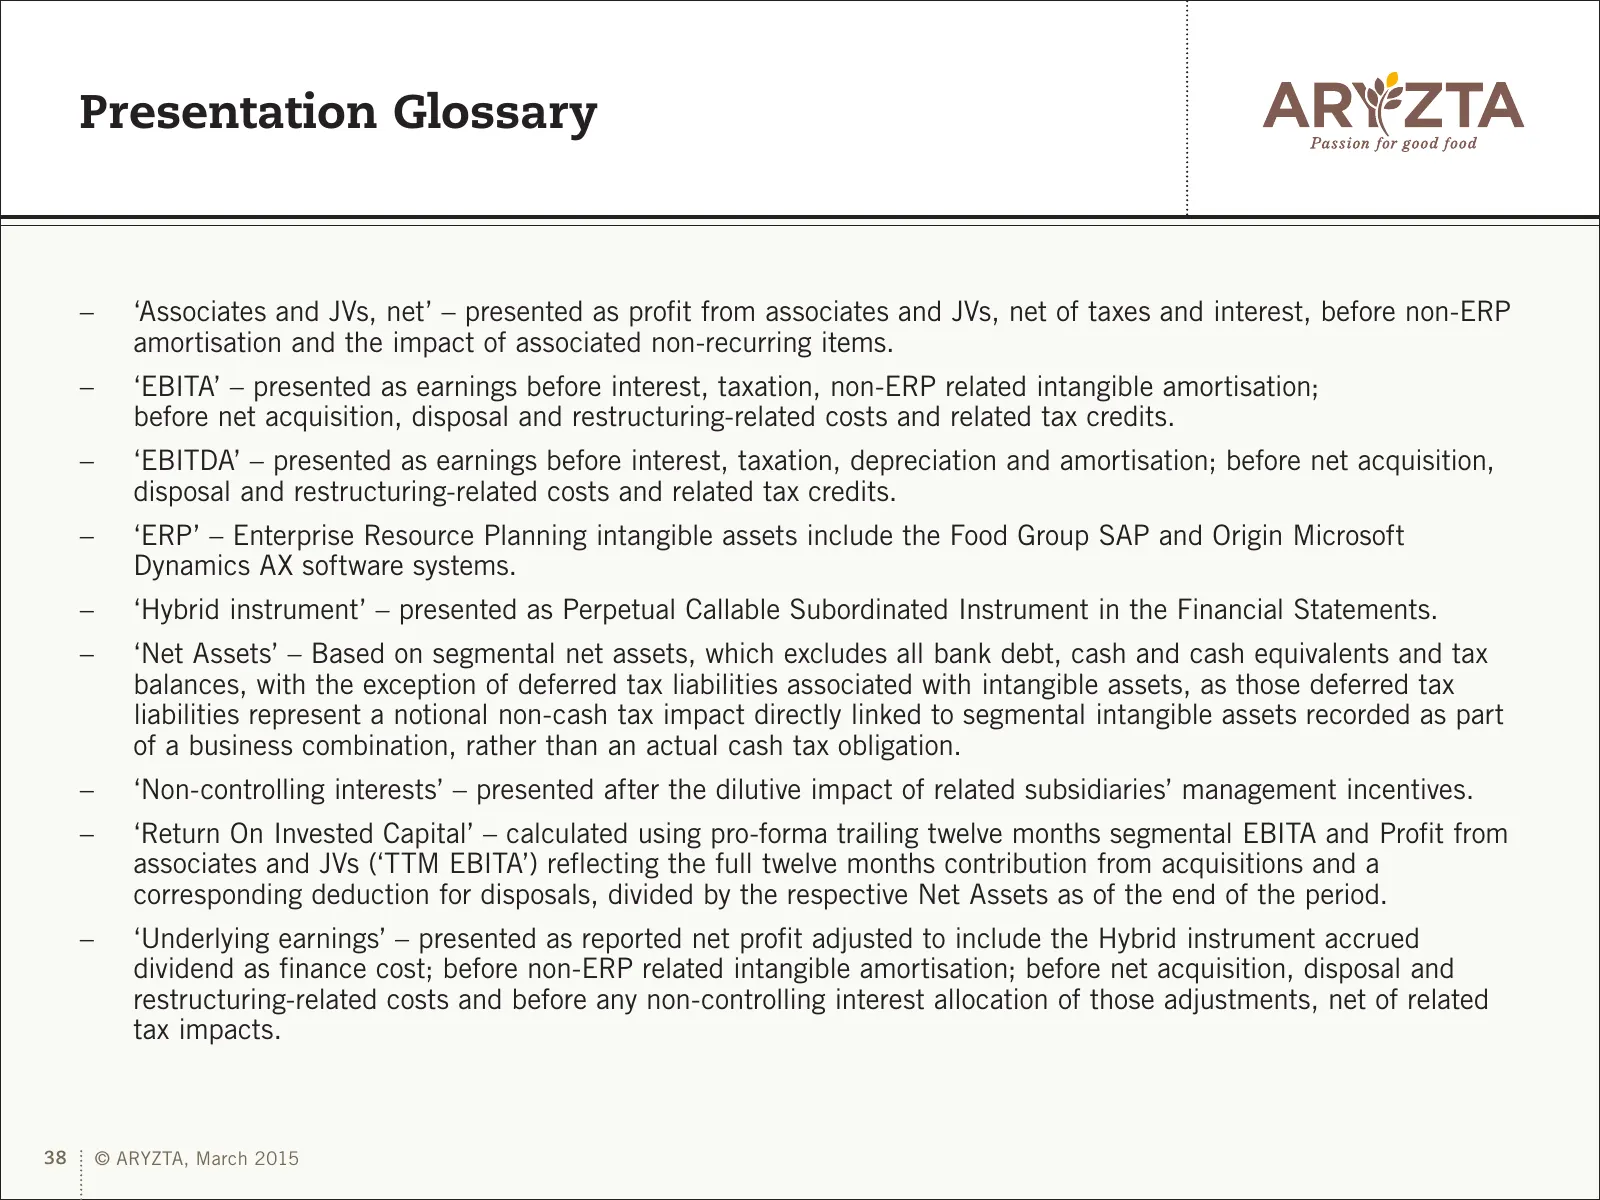
Slide 38: Presentation Glossary
Presentation Glossary –– ‘Associates and JVs, net’ – presented as profit from associates and JVs, net of taxes and interest, before non-ERP amortisation and the impact of associated non-recurring items. –– ‘EBITA’ – presented as earnings before interest, taxation, non-ERP related intangible amortisa

Slide 39: Thank you!
Thank you! 39 © ARYZTA, March 2015
Source: Internet Archive copy of aryzta.com
More decks from Aryzta AG
 H1 2026 Earnings Presentation32 slides · Aug 10, 2026
 FY2025 Earnings Presentation7 slides · Jan 22, 2026
 Q3 2025 Earnings Presentation15 slides · Oct 20, 2025
 H1 2025 Earnings Presentation34 slides · Aug 11, 2025
 Investor Day (May 2025)48 slides · May 7, 2025
 Q1 2025 Earnings Presentation35 slides · Mar 2, 2025