Worldline SA · EURONEXT:WLN
Worldline SA — Ingenico — H1 2007 Earnings Presentation
29 slides from Worldline SA's earnings presentation, Sep 20, 2007
Slide 1: H1 2007 Results Business Report
H1 – 2007 RESULTS Business Report September 20th, 2007 Hotel Bristol Secure Transaction and payment solutions
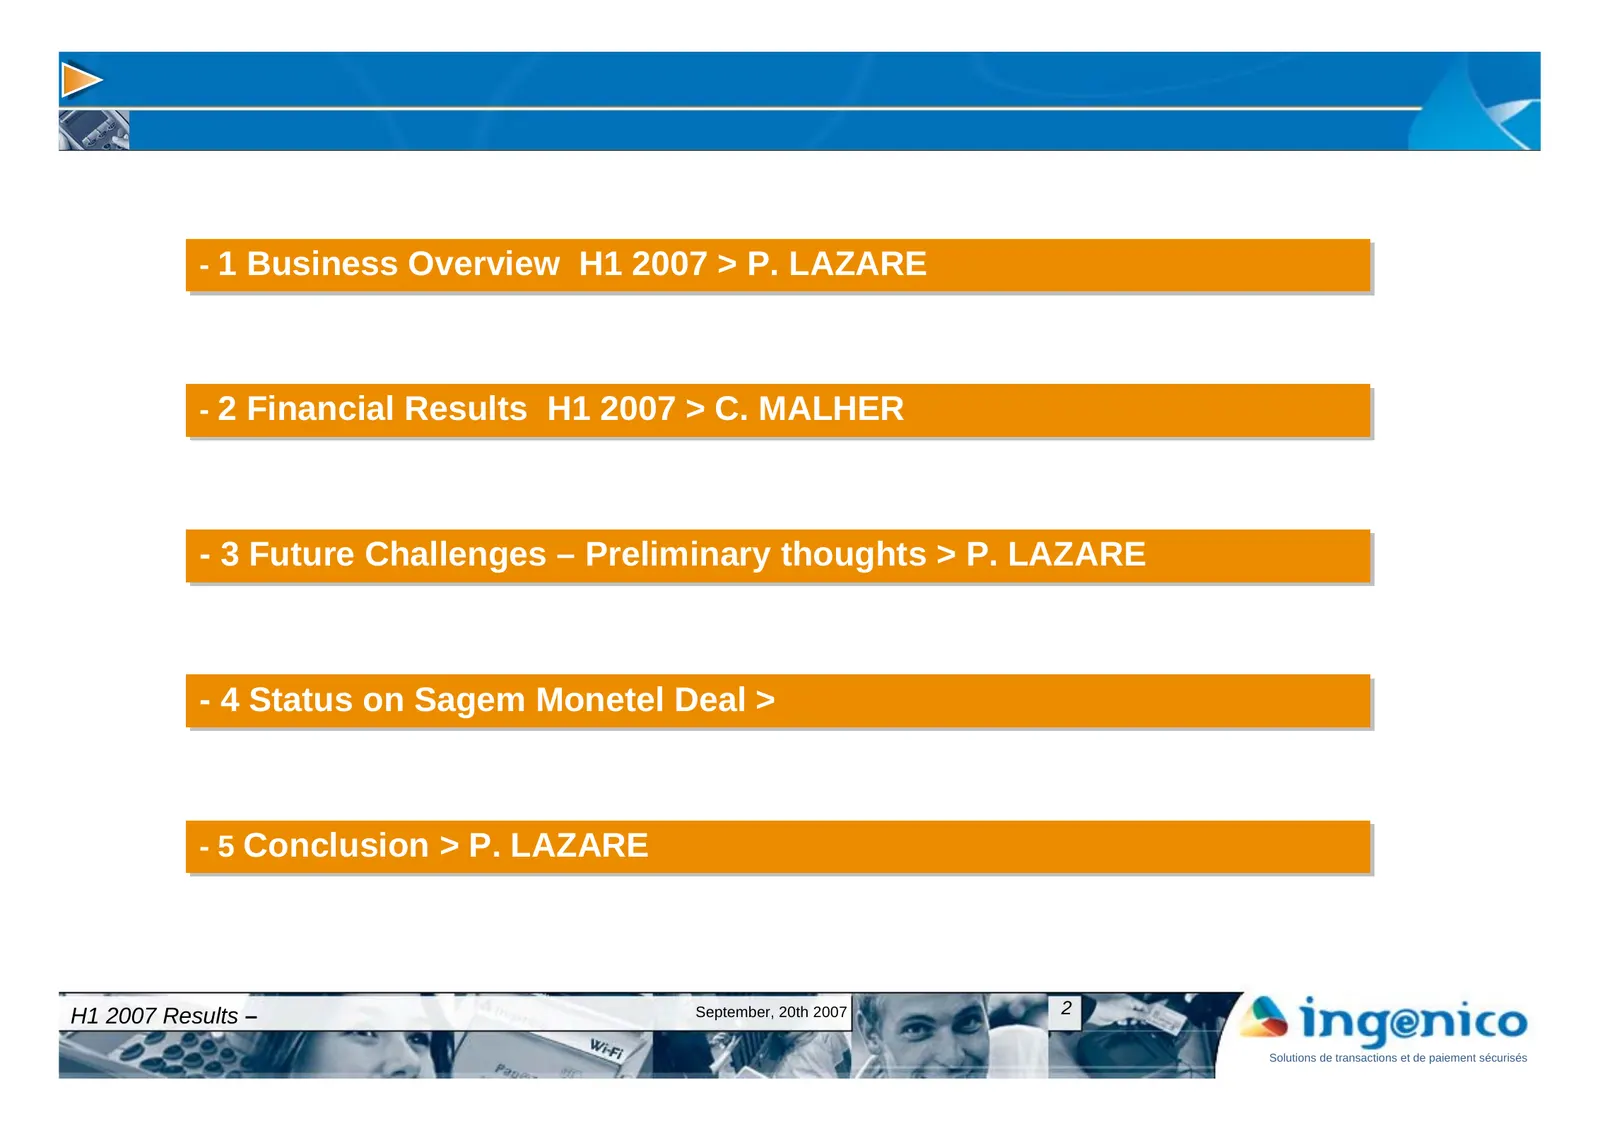
Slide 2: 1 Business Business Overview Overview H1
-- 1 1 Business Business Overview Overview H1 H1 2007 2007 >> P. P. LAZARE LAZARE -- 2 2 Financial Financial Results Results H1 H1 2007 2007 >> C. C. MALHER MALHER -- 33 Future Future Challenges Challenges –– Preliminary Preliminary thoughts thoughts >> P. P. LAZARE LAZARE -- 44 Status Status on on
Slide 3: Business Overview H1 2007
Business Overview H1 - 2007 H1 2007 Results – September, 20th 2007 3 Solutions de transactions et de paiement sécurisés
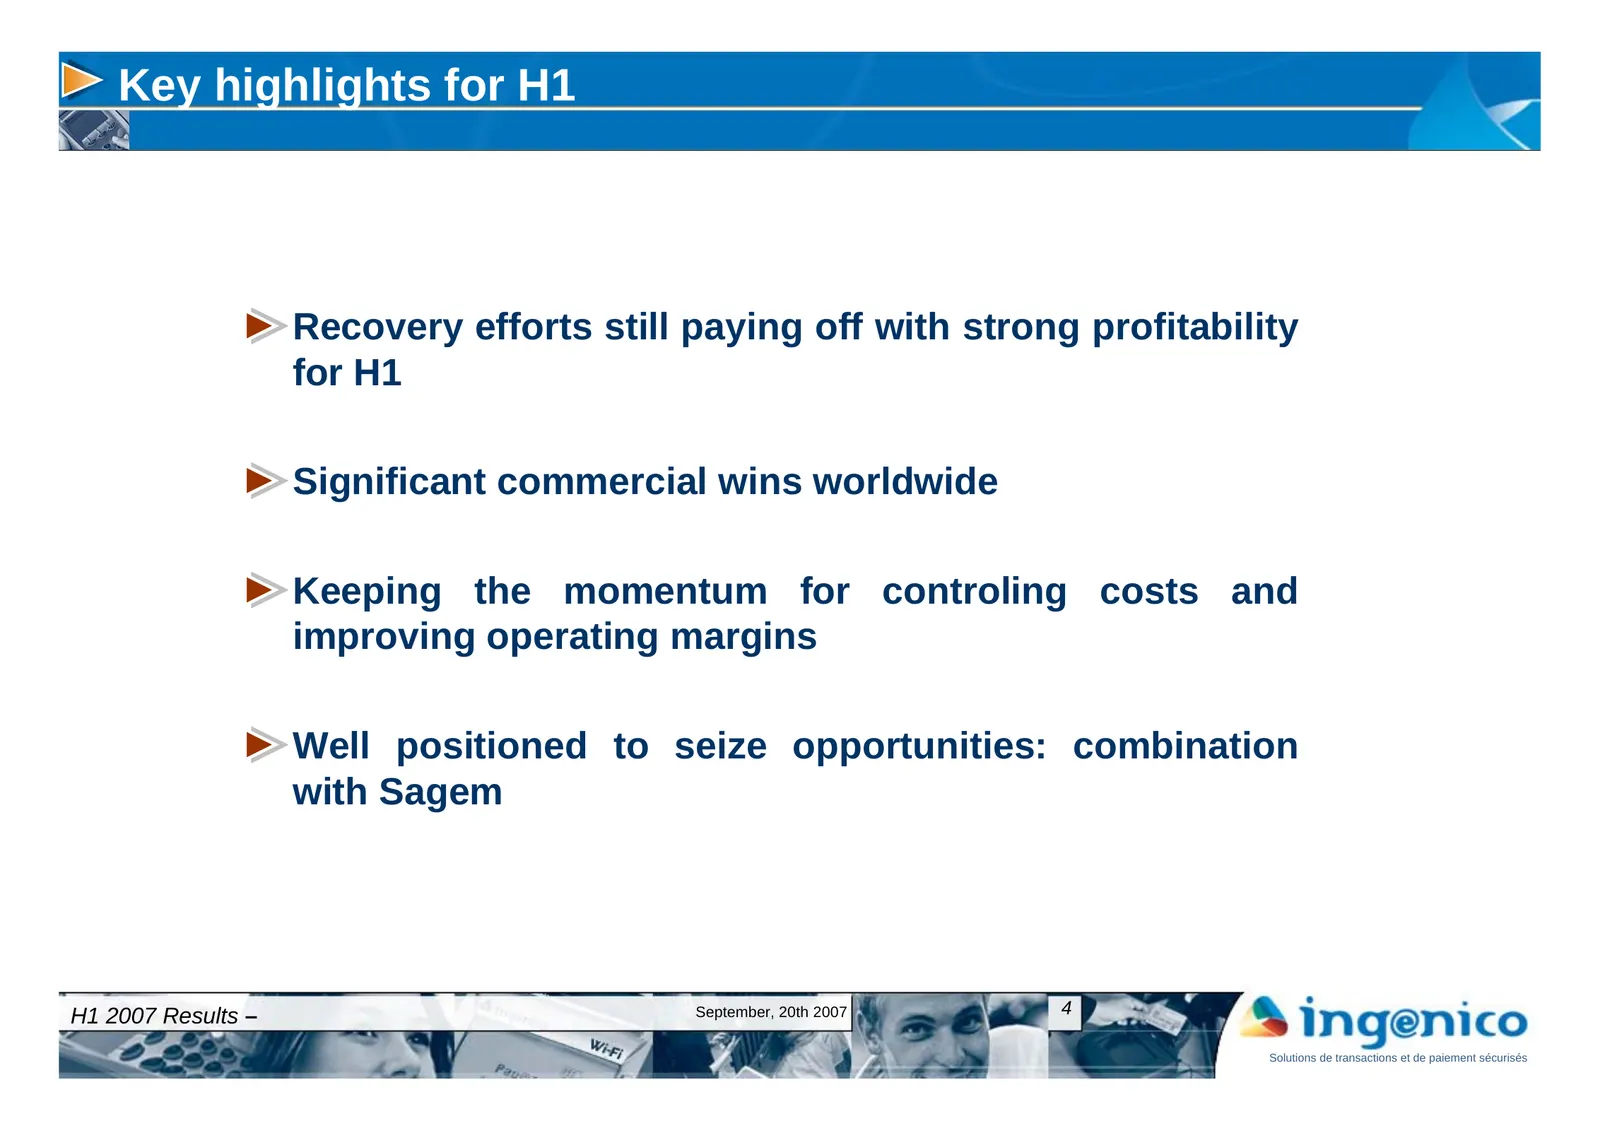
Slide 4: Key highlights for H1
Key highlights for H1 Recovery efforts still paying off with strong profitability for H1 Significant commercial wins worldwide Keeping the momentum for controling costs and improving operating margins Well positioned to seize opportunities: combination with Sagem H1 2007 Results – September, 20th 20
Slide 5: Strong profitability for 2007 H1
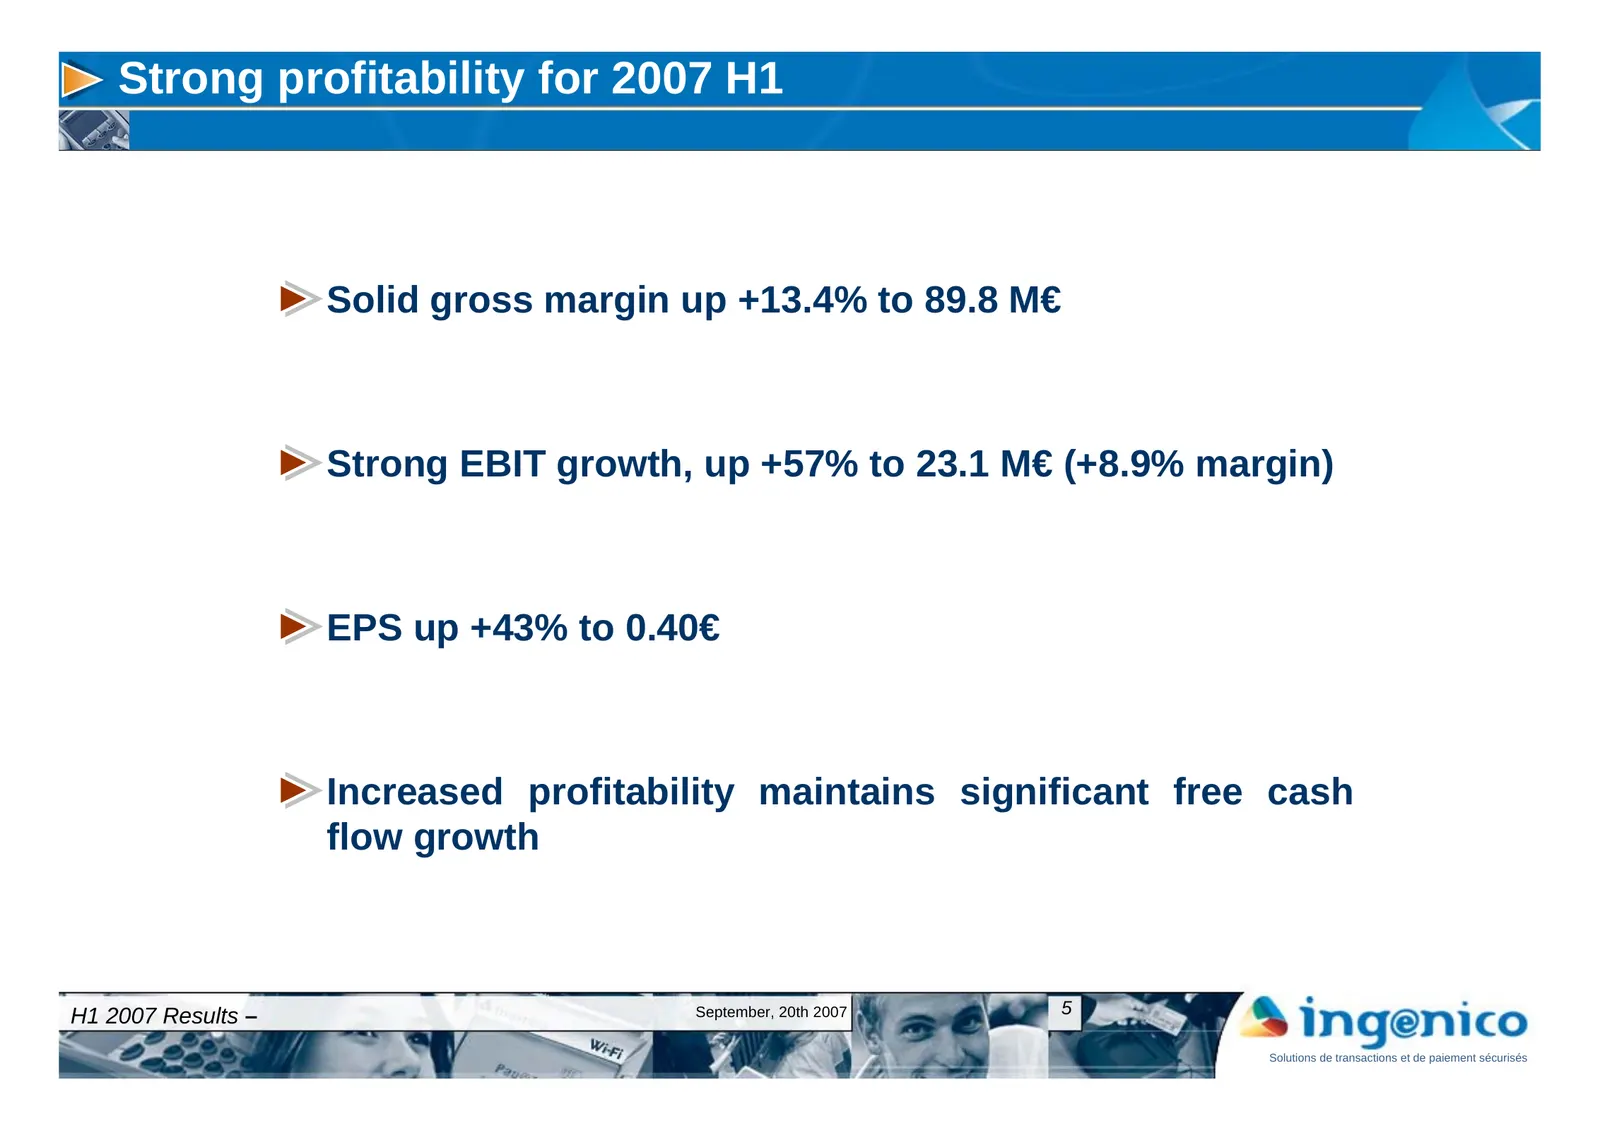
Strong profitability for 2007 H1 Solid gross margin up +13.4% to 89.8 M€ Strong EBIT growth, up +57% to 23.1 M€ (+8.9% margin) EPS up +43% to 0.40€ Increased profitability maintains significant free cash flow growth H1 2007 Results – September, 20th 2007 5 Solutions de transactions et de paiement sé
Slide 6: Significant commercial wins worldwide
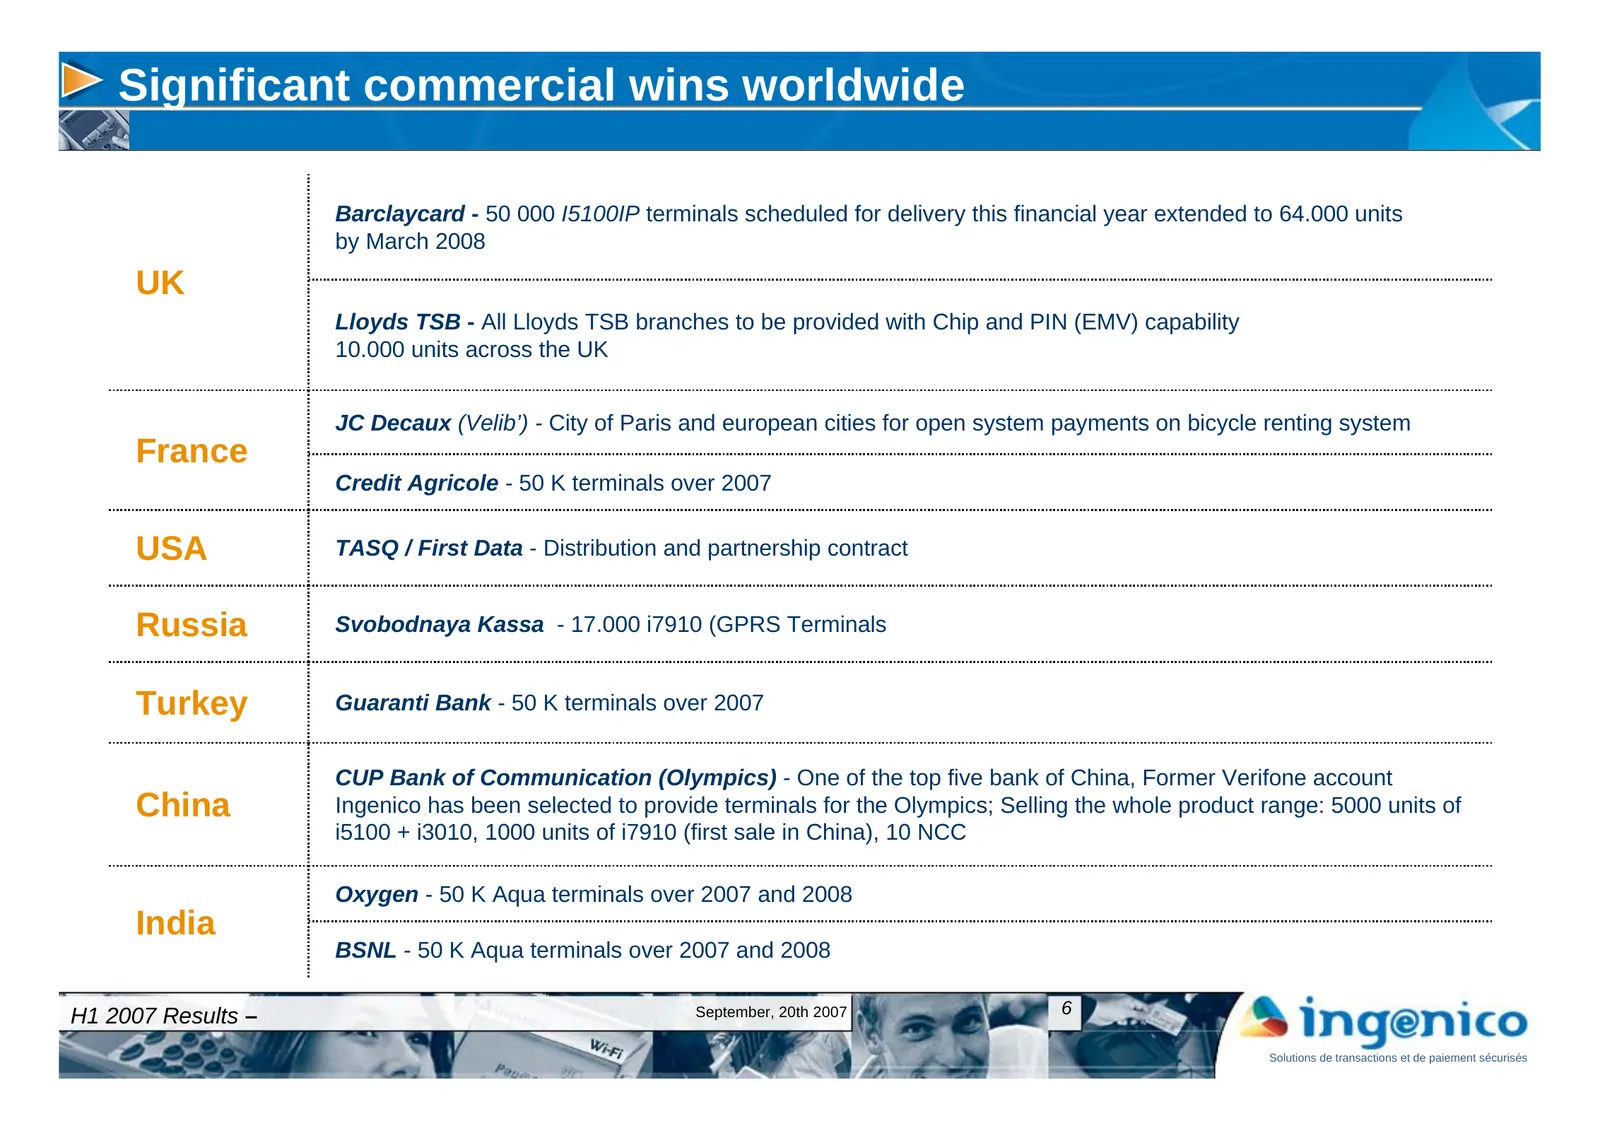
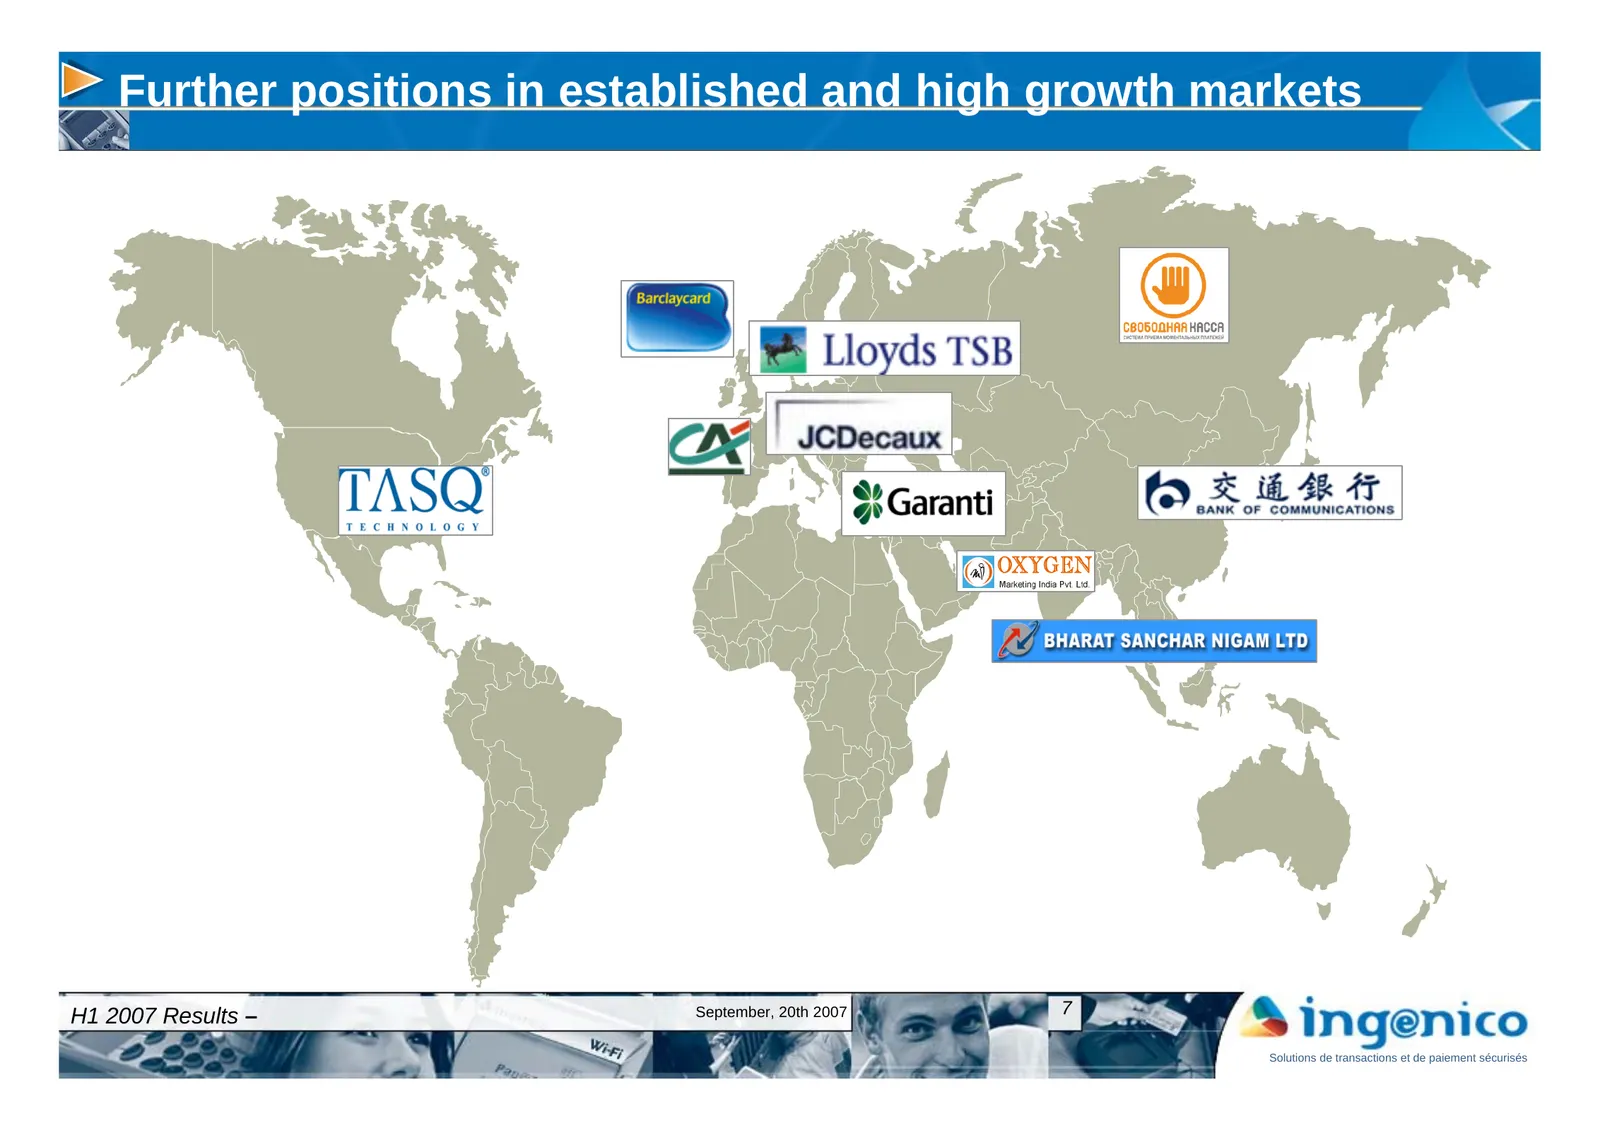
Significant commercial wins worldwide Barclaycard - 50 000 I5100IP terminals scheduled for delivery this financial year extended to 64.000 units by March 2008 UK Lloyds TSB - All Lloyds TSB branches to be provided with Chip and PIN (EMV) capability 10.000 units across the UK JC Decaux (Velib’) - Cit
Slide 7: Further positions in established and high growth markets
Further positions in established and high growth markets H1 2007 Results – September, 20th 2007 7 Solutions de transactions et de paiement sécurisés
Slide 8: Improving operating margins: on track
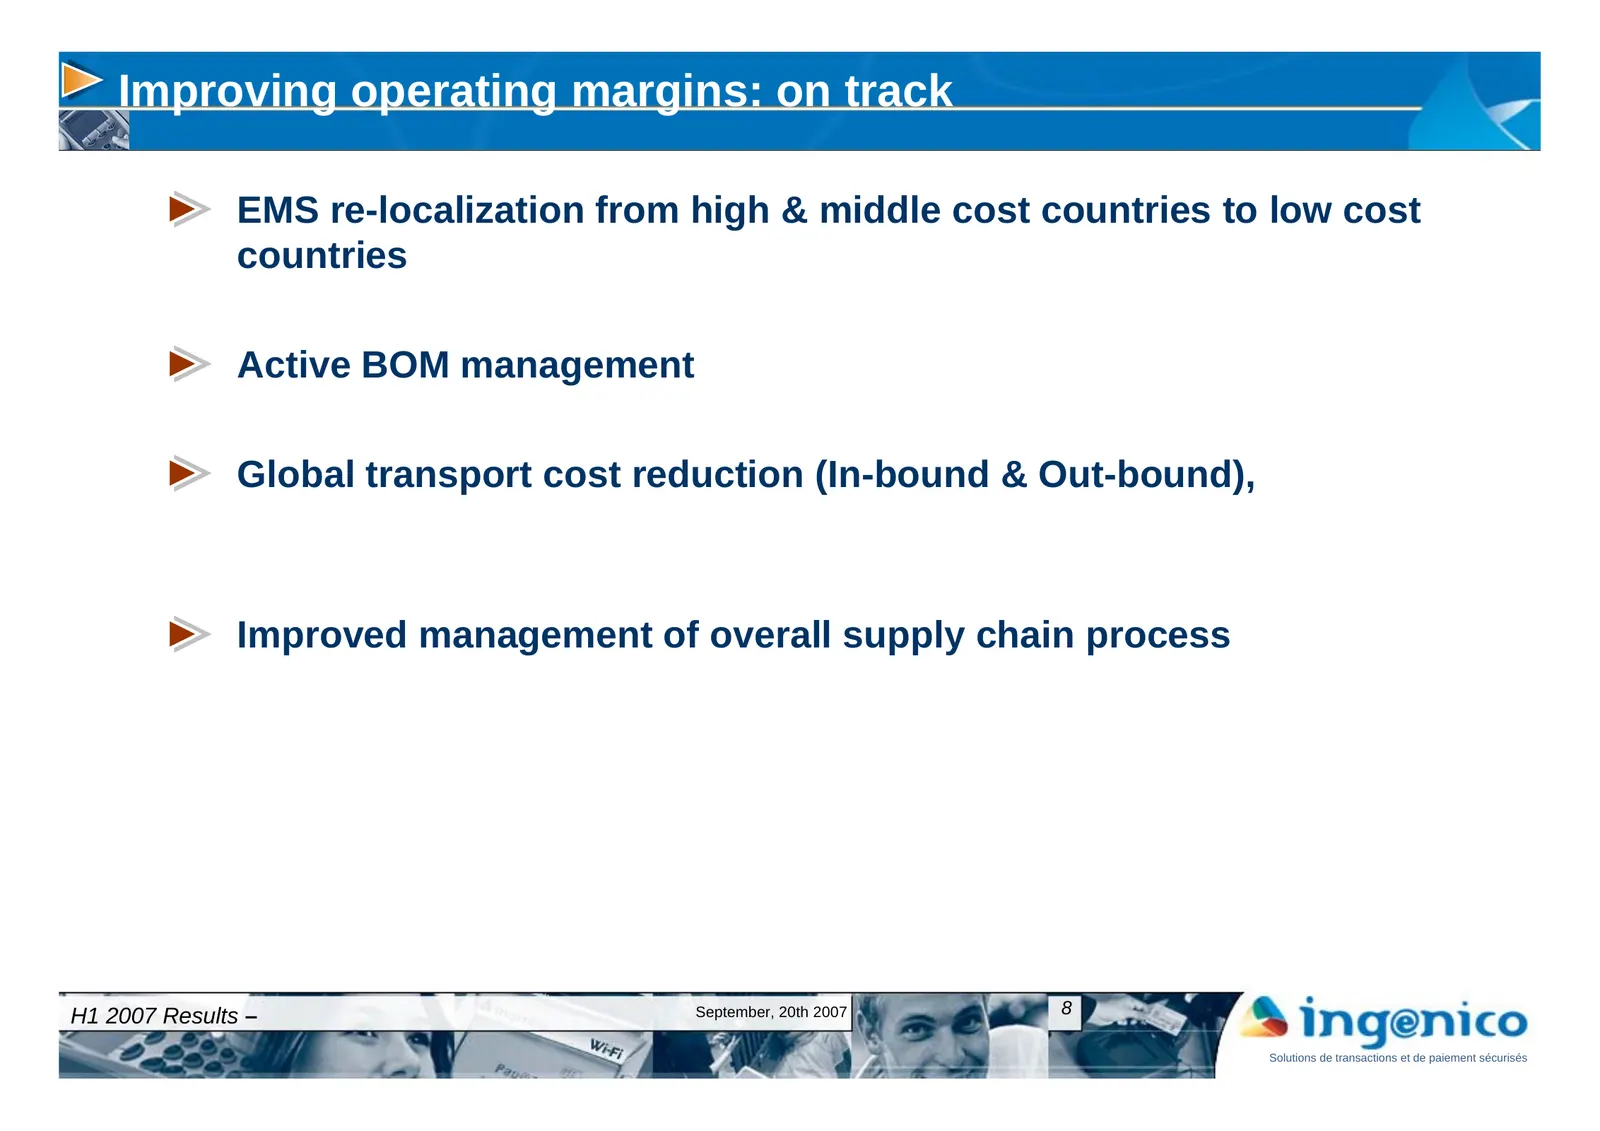
Improving operating margins: on track EMS re-localization from high & middle cost countries to low cost countries Active BOM management Global transport cost reduction (In-bound & Out-bound), Improved management of overall supply chain process H1 2007 Results – September, 20th 2007 8 Solutions de tr
Slide 9: Financial Results H1 2007
Financial Results H1 - 2007 H1 2007 Results – September, 20th 2007 9 Solutions de transactions et de paiement sécurisés
Slide 10: Strong profitability
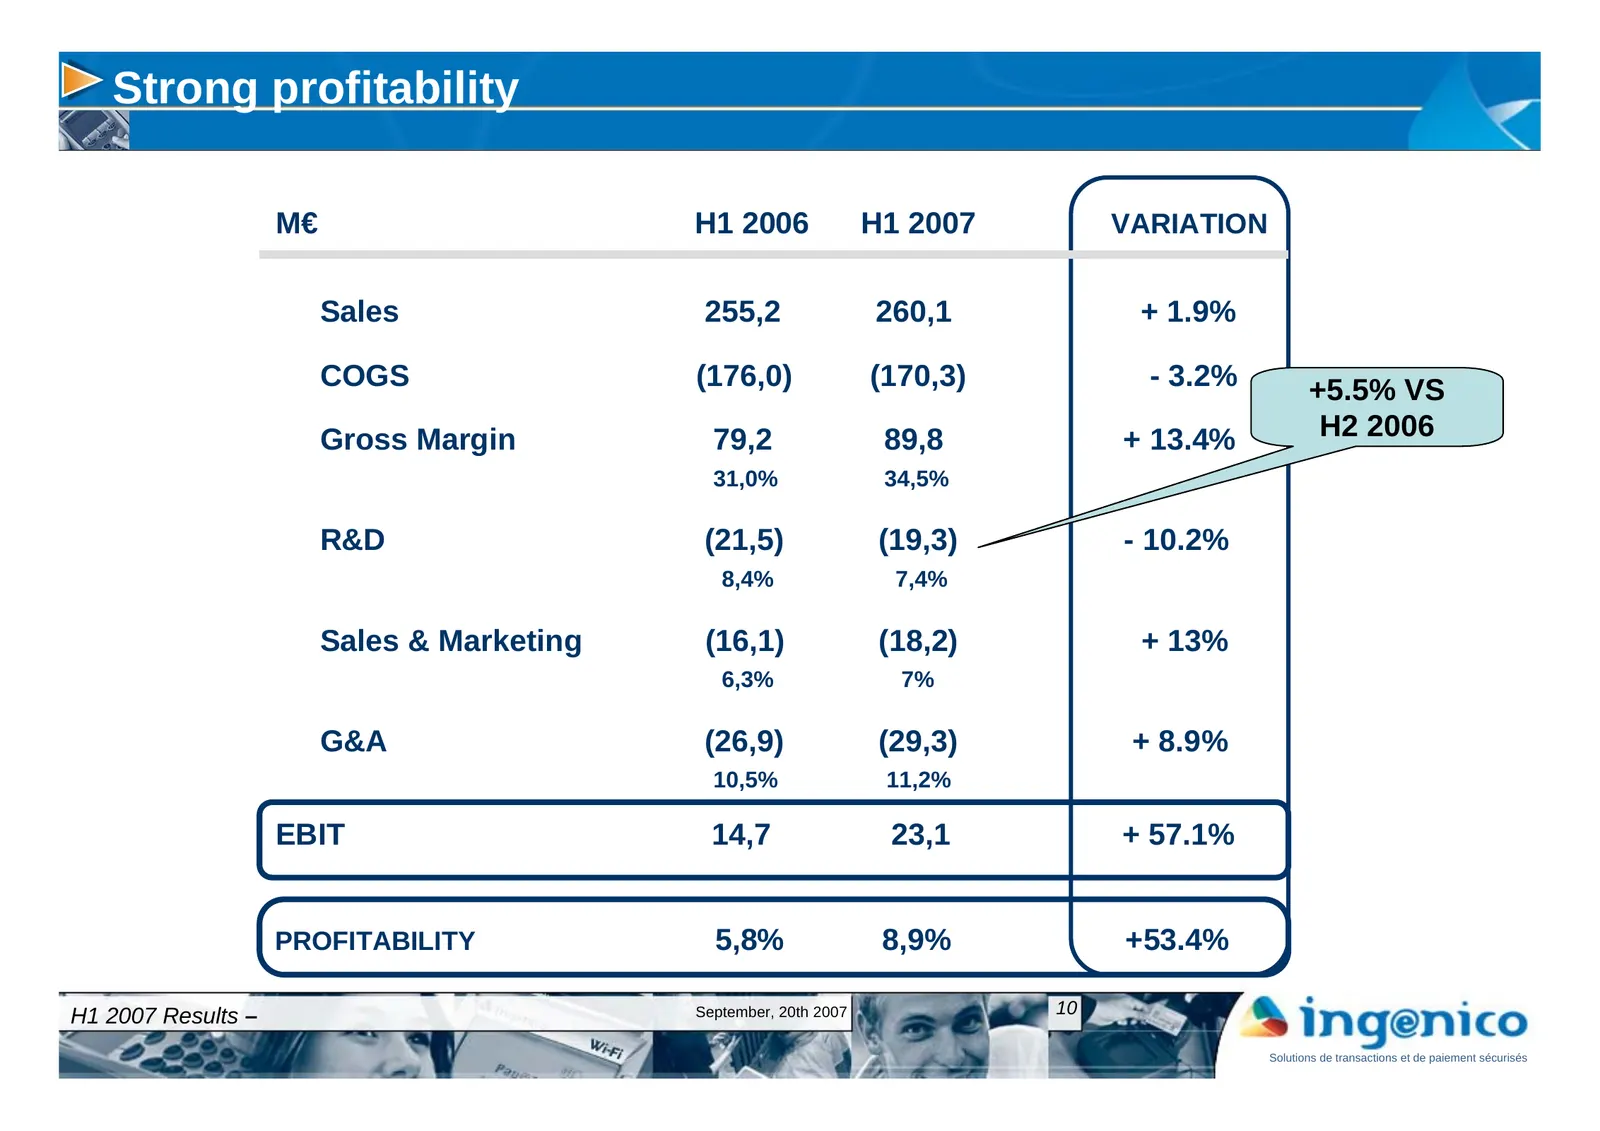
Strong profitability M€ H1 2006 H1 2007 VARIATION Sales 255,2 260,1 + 1.9% COGS (176,0) (170,3) - 3.2% +5.5% VS Gross Margin 79,2 89,8 + 13.4% H2 2006 31,0% 34,5% R&D (21,5) (19,3) - 10.2% 8,4% 7,4% Sales & Marketing (16,1) (18,2) + 13% 6,3% 7% G&A (26,9) (29,3) + 8.9% 10,5% 11,2% EBIT 14,7 23,1 + 5
Slide 11: Gross Margin
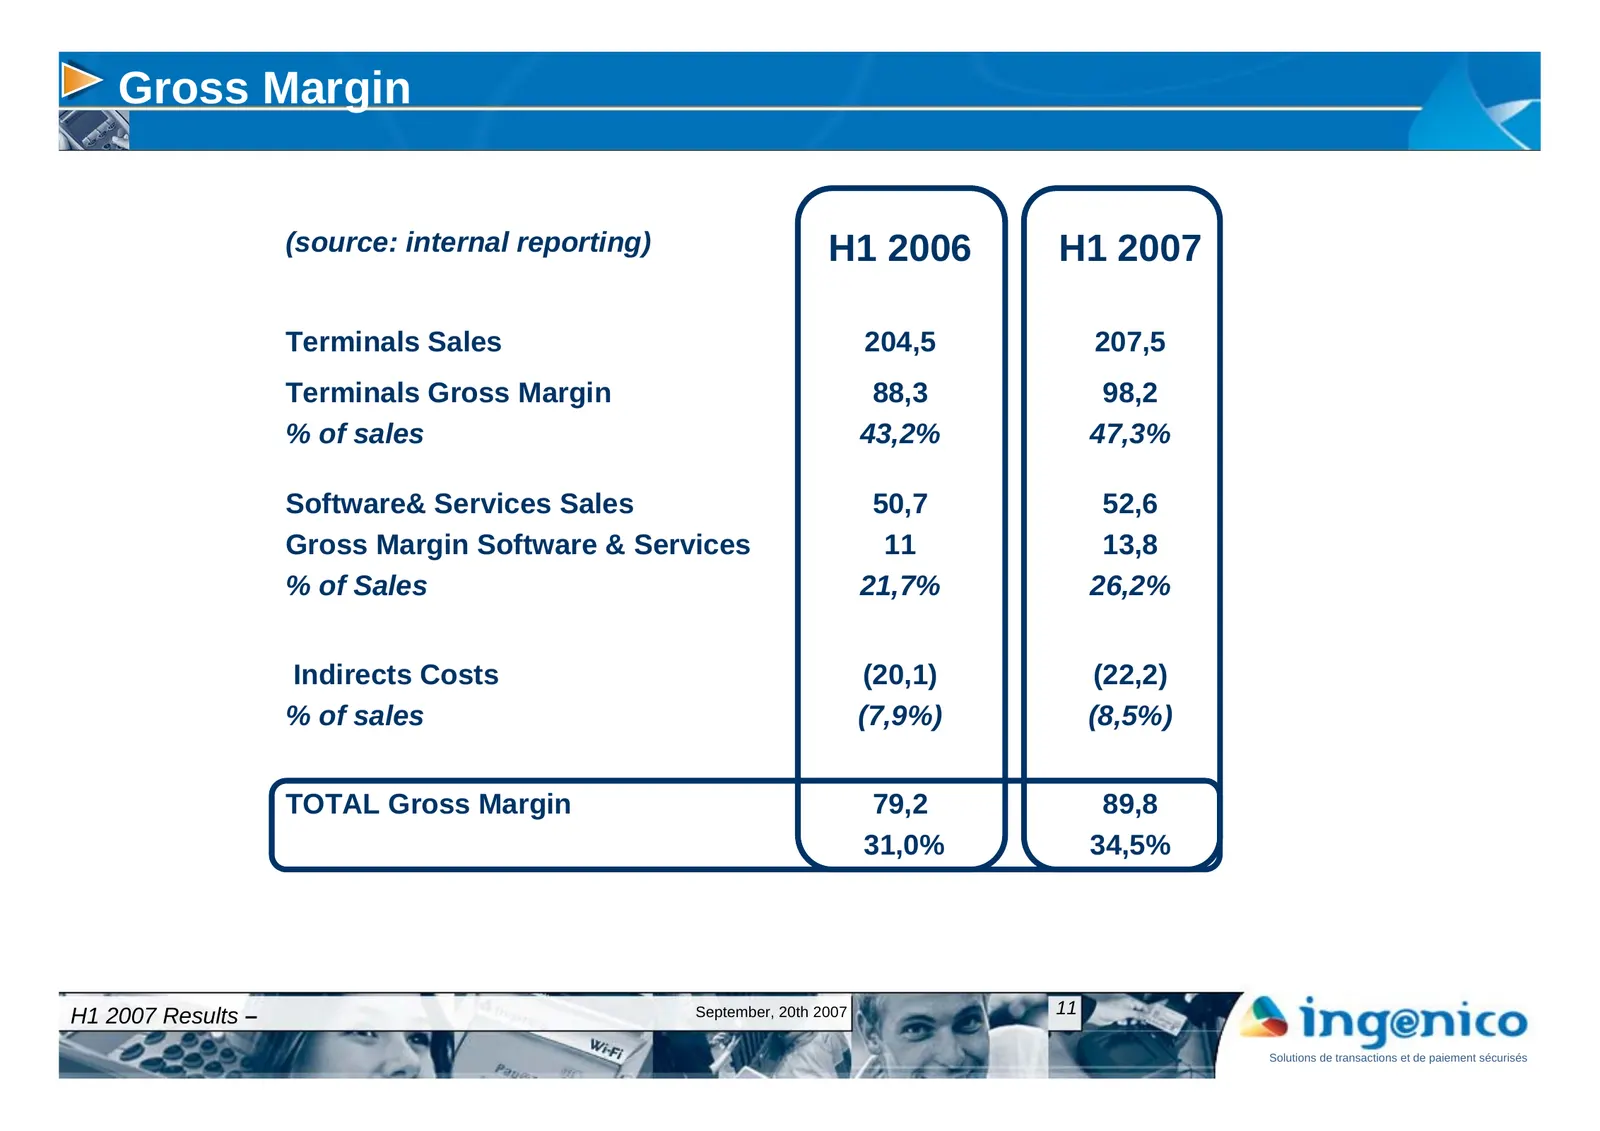
Gross Margin (source: internal reporting) H1 2006 H1 2007 Terminals Sales 204,5 207,5 Terminals Gross Margin 88,3 98,2 % of sales 43,2% 47,3% Software& Services Sales 50,7 52,6 Gross Margin Software & Services 11 13,8 % of Sales 21,7% 26,2% Indirects Costs (20,1) (22,2) % of sales (7,9%) (8,5%) TOTA
Slide 12: Gross Margin
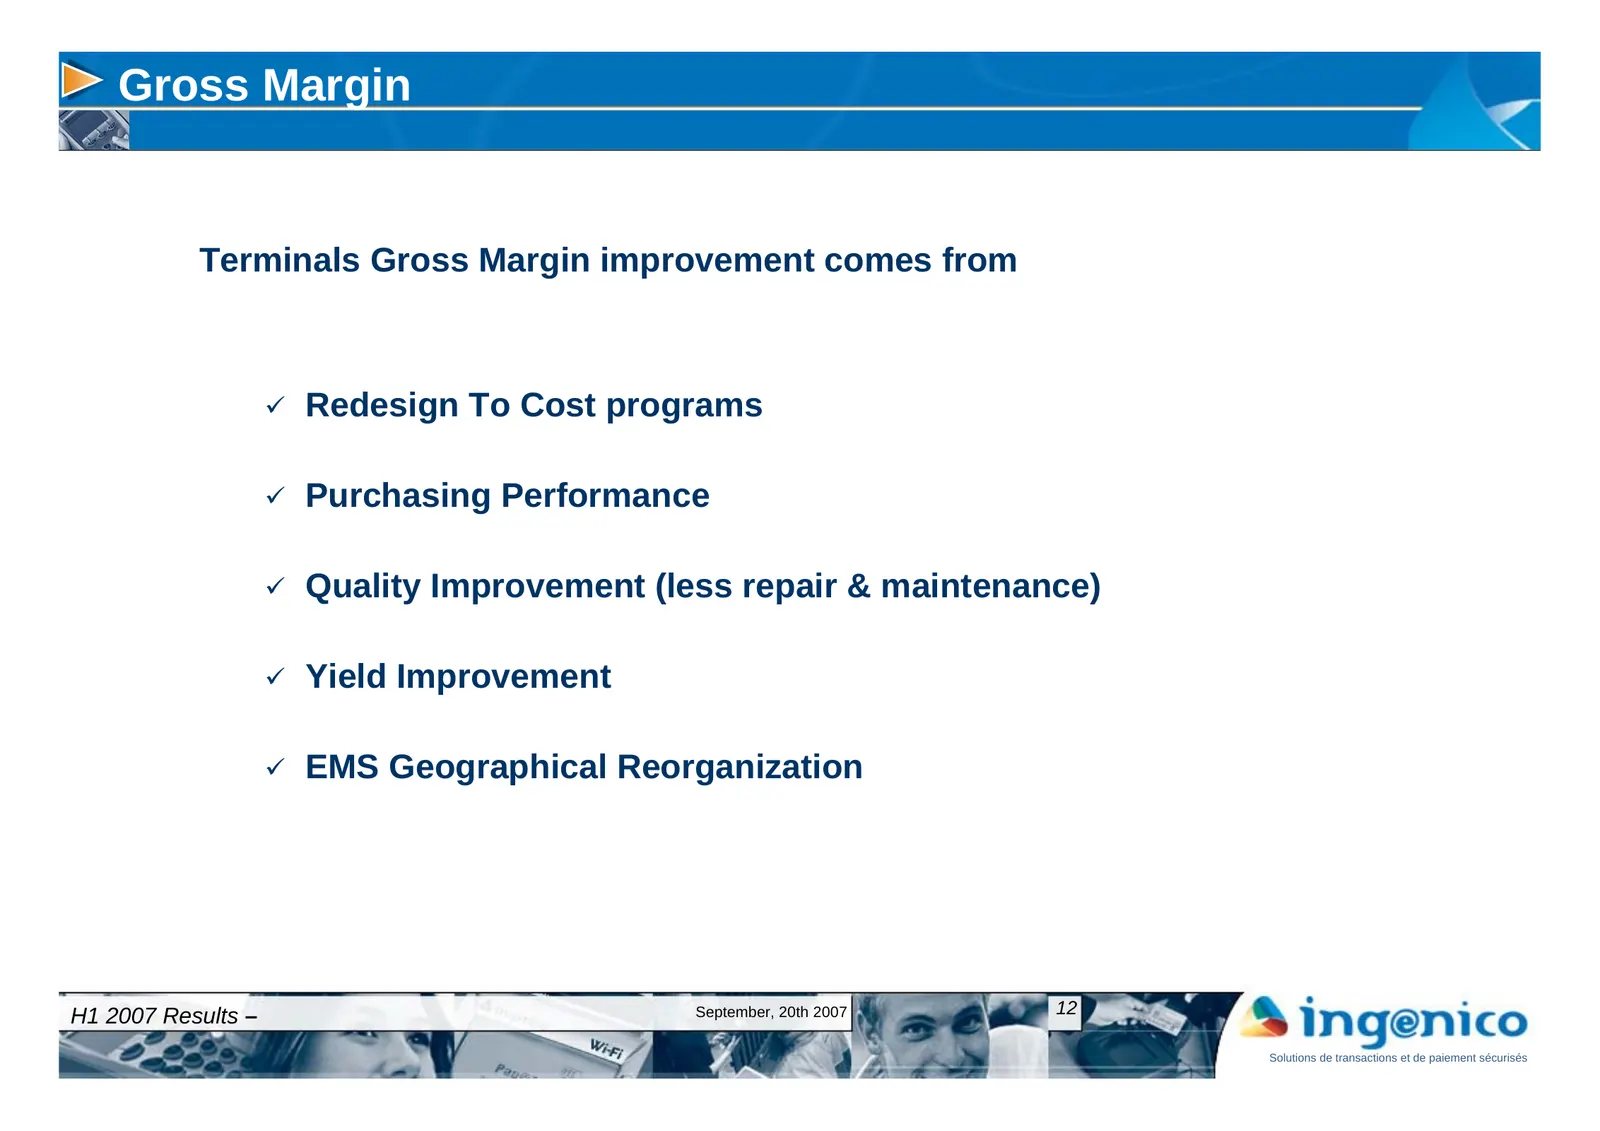
Gross Margin Terminals Gross Margin improvement comes from 9 Redesign To Cost programs 9 Purchasing Performance 9 Quality Improvement (less repair & maintenance) 9 Yield Improvement 9 EMS Geographical Reorganization H1 2007 Results – September, 20th 2007 12 Solutions de transactions et de paiement s
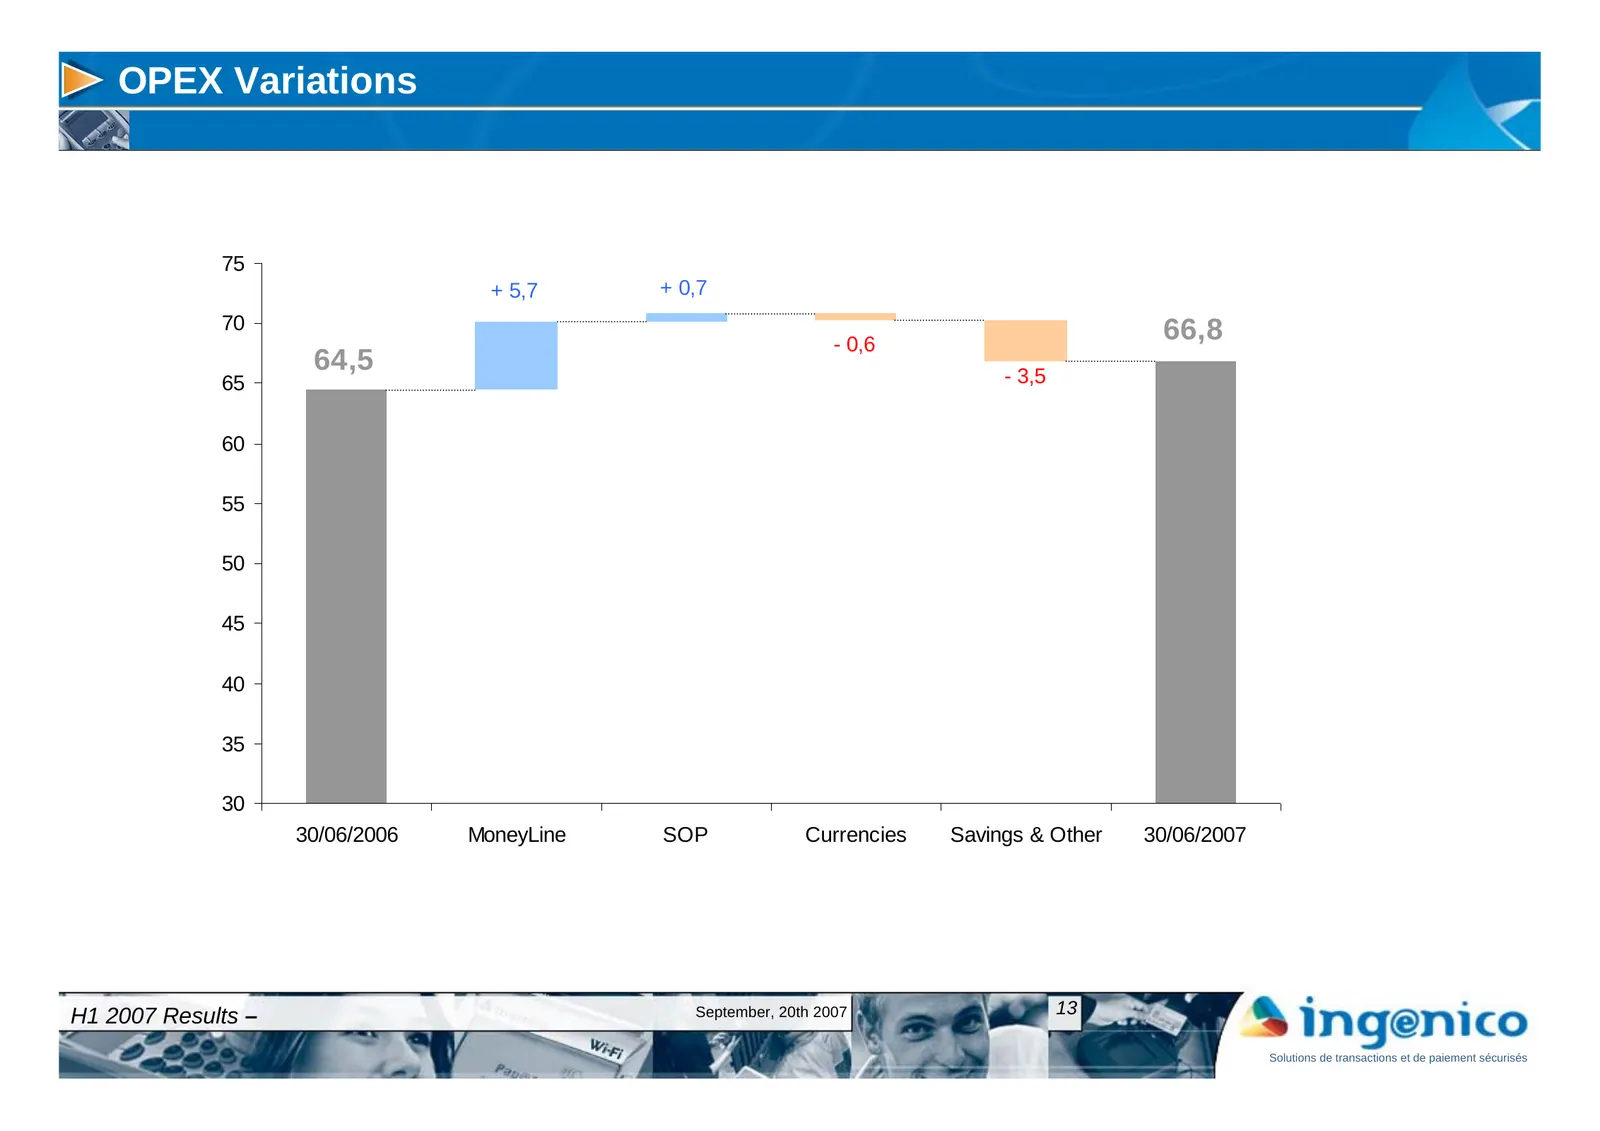
Slide 13: OPEX Variations
OPEX Variations 75 + 5,7 + 0,7 70 66,8 - 0,6 64,5 - 3,5 65 60 55 50 45 40 35 30 30/06/2006 MoneyLine SOP Currencies Savings & Other 30/06/2007 H1 2007 Results – September, 20th 2007 13 Solutions de transactions et de paiement sécurisés
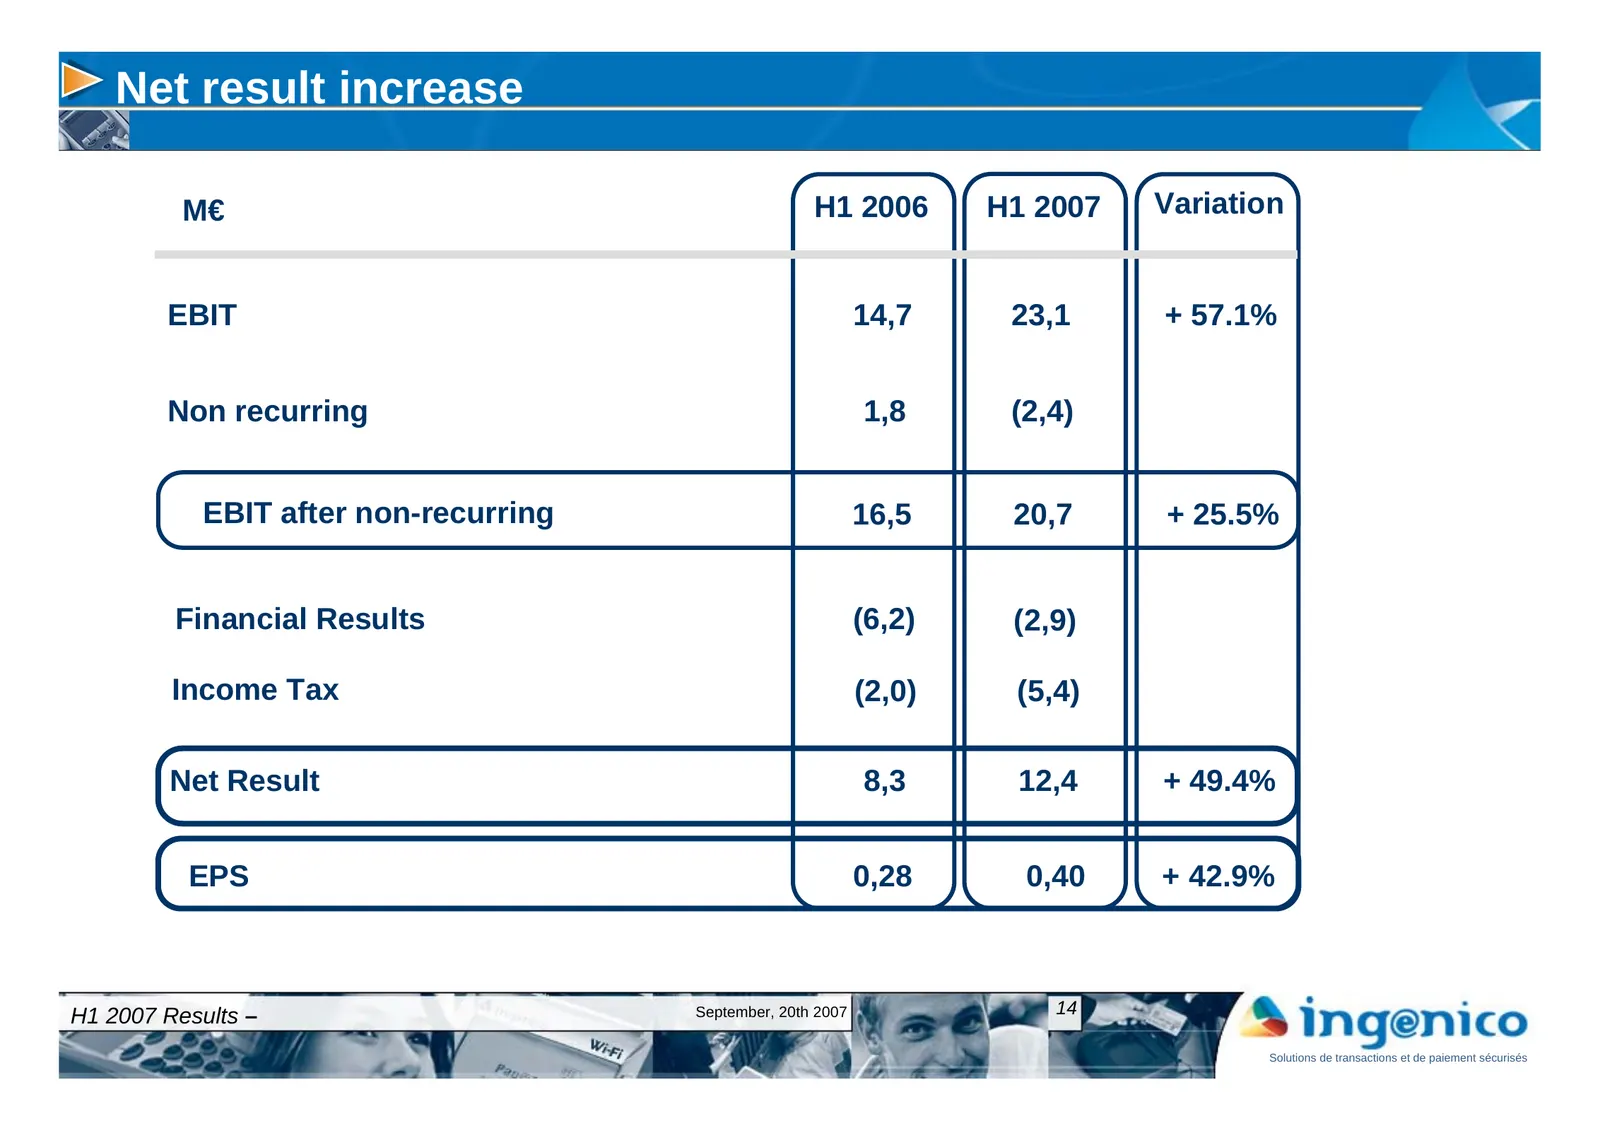
Slide 14: Net result increase
Net result increase M€ H1 2006 H1 2007 Variation EBIT 14,7 23,1 + 57.1% Non recurring 1,8 (2,4) EBIT after non-recurring 16,5 20,7 + 25.5% Financial Results (6,2) (2,9) Income Tax (2,0) (5,4) Net Result 8,3 12,4 + 49.4% EPS 0,28 0,40 + 42.9% H1 2007 Results – September, 20th 2007 14 Solutions de tra
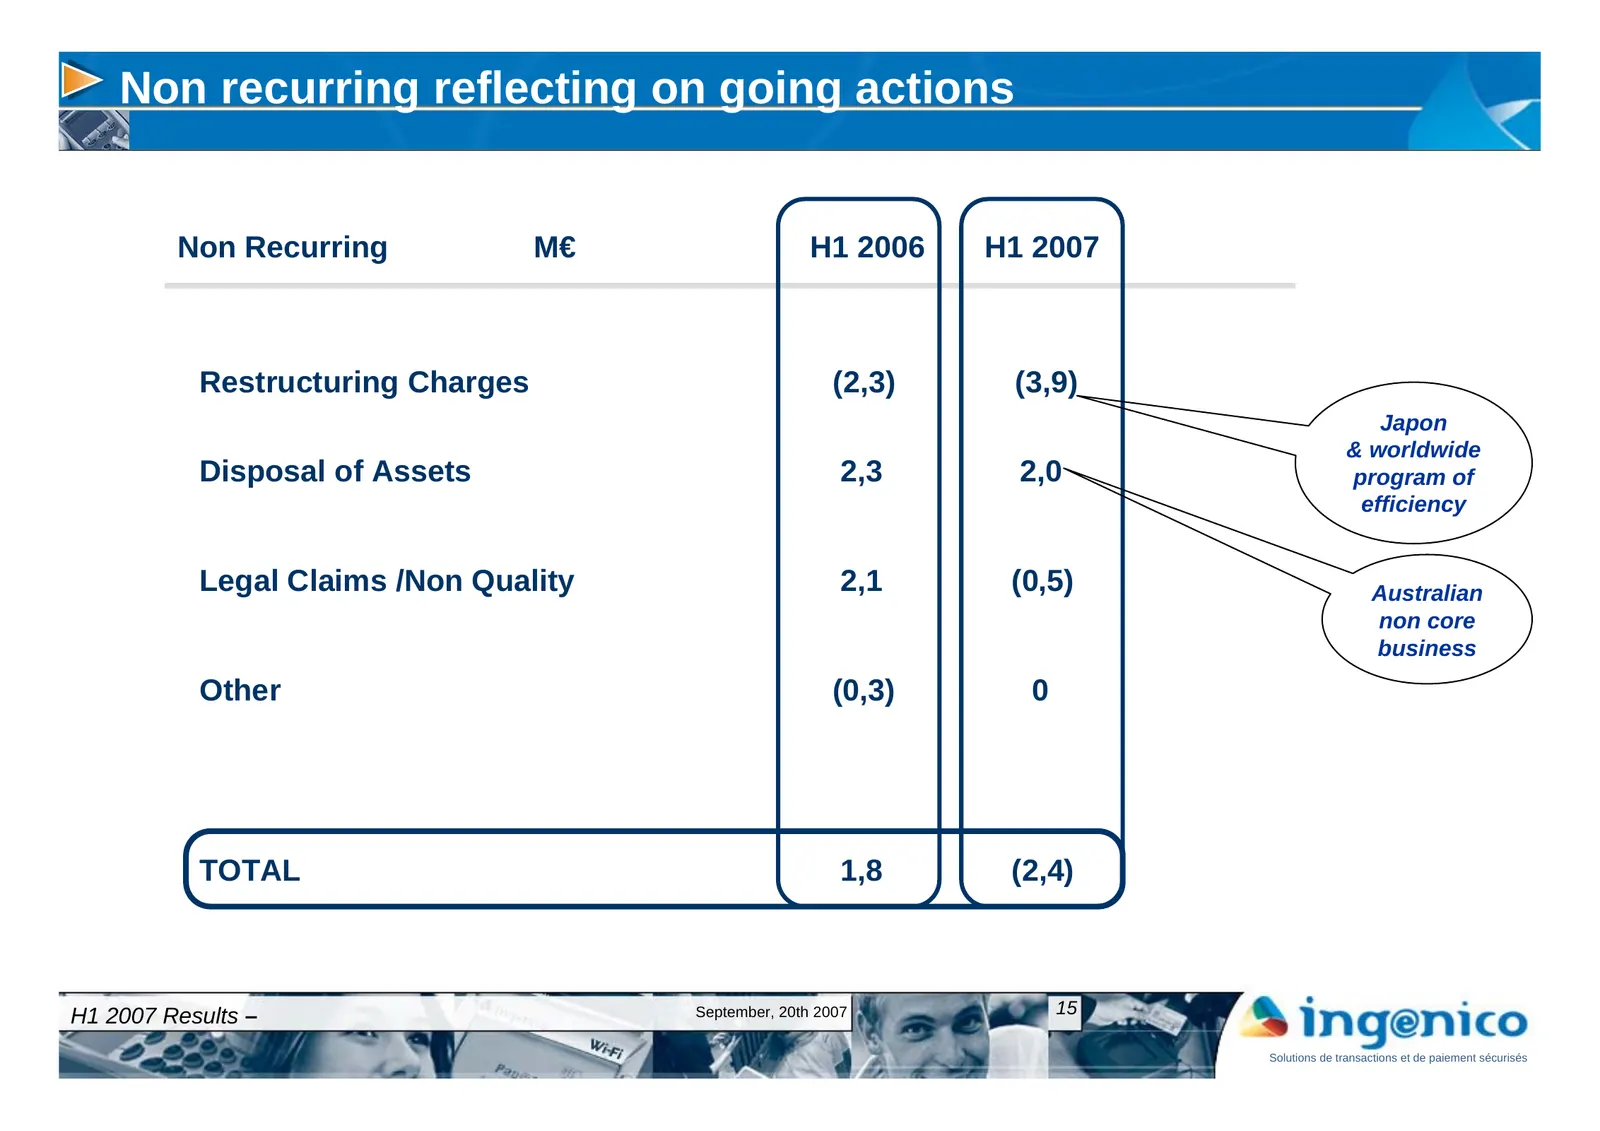
Slide 15: Non recurring reflecting on going actions
Non recurring reflecting on going actions Non Recurring M€ H1 2006 H1 2007 Restructuring Charges (2,3) (3,9) Japon & worldwide Disposal of Assets 2,3 2,0 program of efficiency Legal Claims /Non Quality 2,1 (0,5) Australian non core business Other (0,3) 0 TOTAL 1,8 (2,4) H1 2007 Results – September,
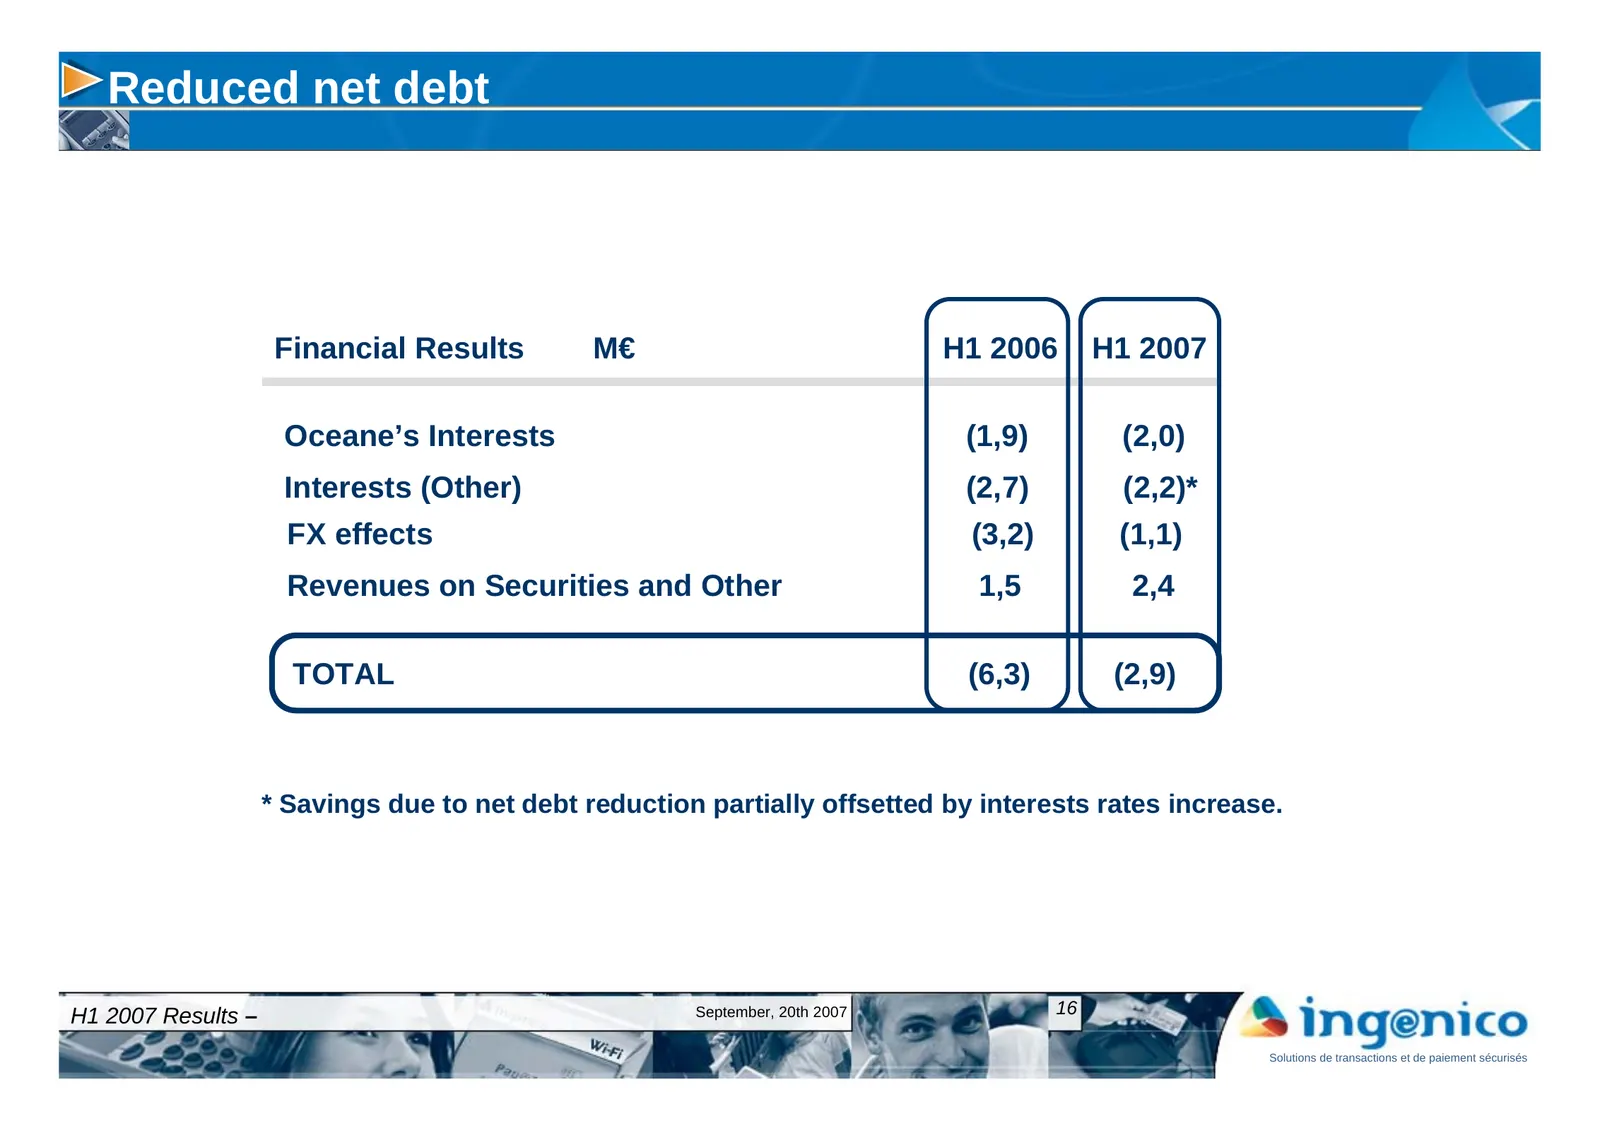
Slide 16: Reduced net debt
Reduced net debt Financial Results M€ H1 2006 H1 2007 Oceane’s Interests (1,9) (2,0) Interests (Other) (2,7) (2,2)* FX effects (3,2) (1,1) Revenues on Securities and Other 1,5 2,4 TOTAL (6,3) (2,9) * Savings due to net debt reduction partially offsetted by interests rates increase. H1 2007 Results –
Slide 17: Stronger Equity
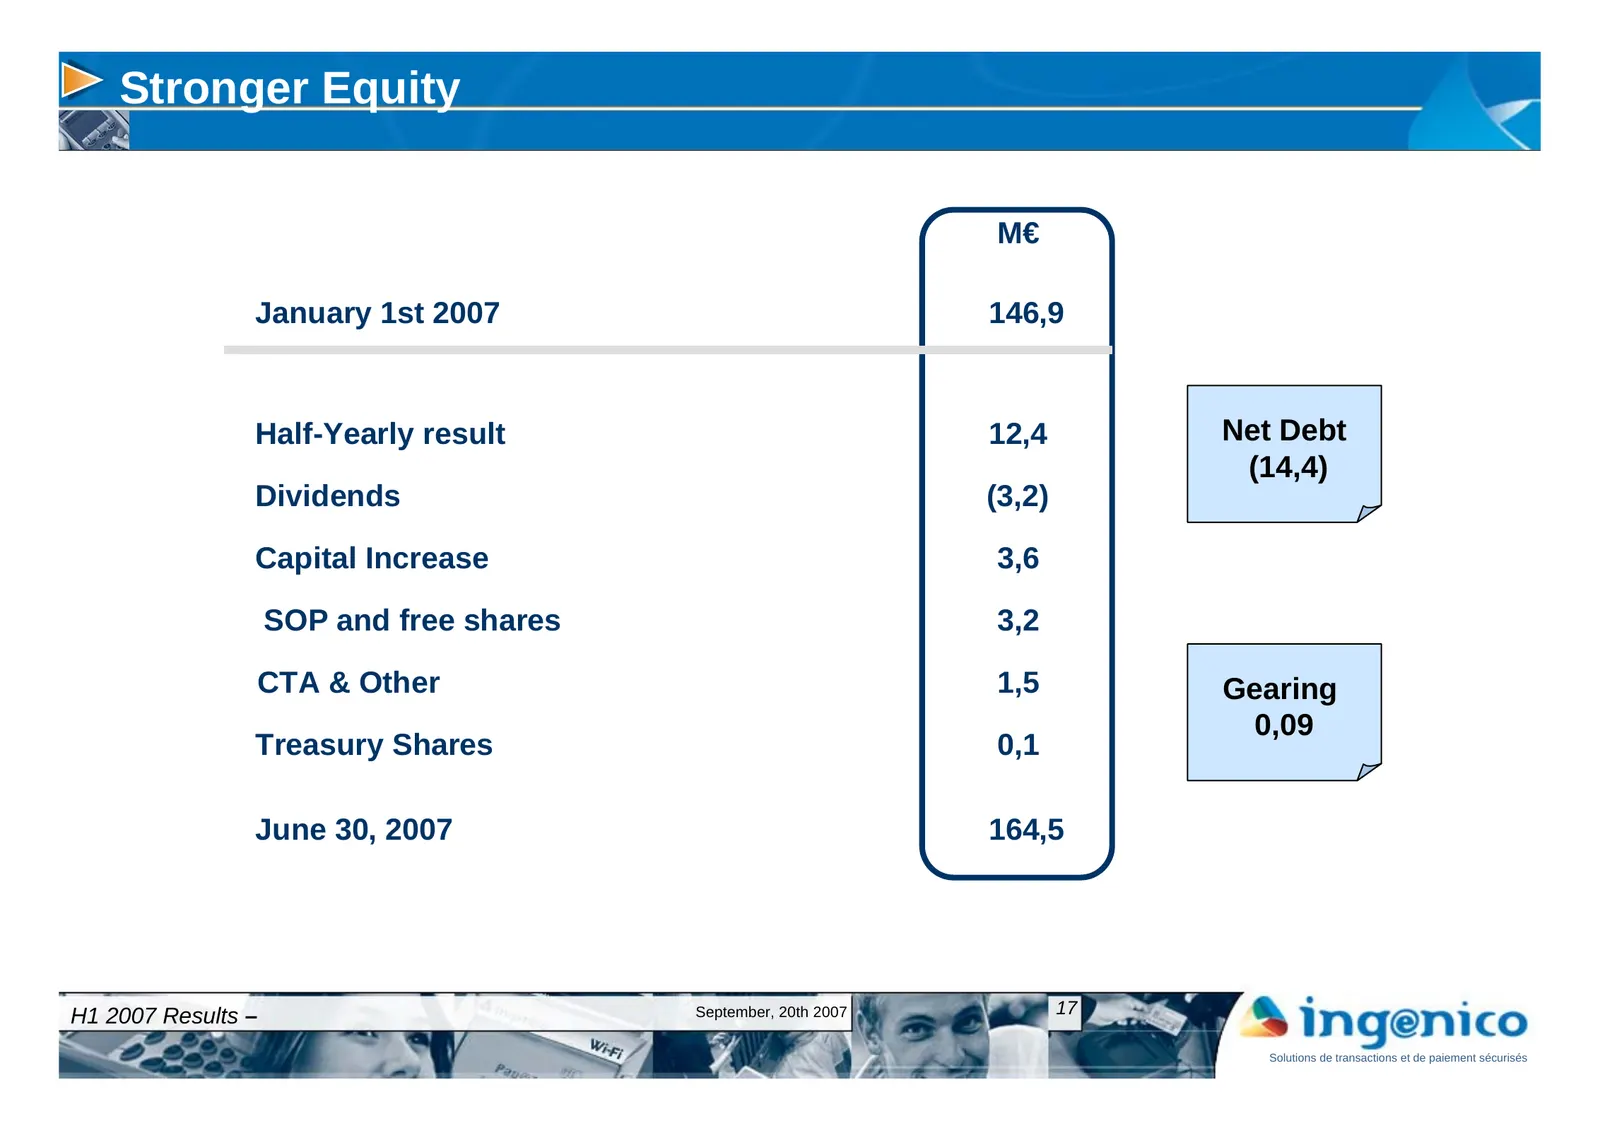
Stronger Equity M€ January 1st 2007 146,9 Half-Yearly result 12,4 Net Debt (14,4) Dividends (3,2) Capital Increase 3,6 SOP and free shares 3,2 CTA & Other 1,5 Gearing 0,09 Treasury Shares 0,1 June 30, 2007 164,5 H1 2007 Results – September, 20th 2007 17 Solutions de transactions et de paiement sécur
Slide 18: Cash Flow generation driven by increased profitability
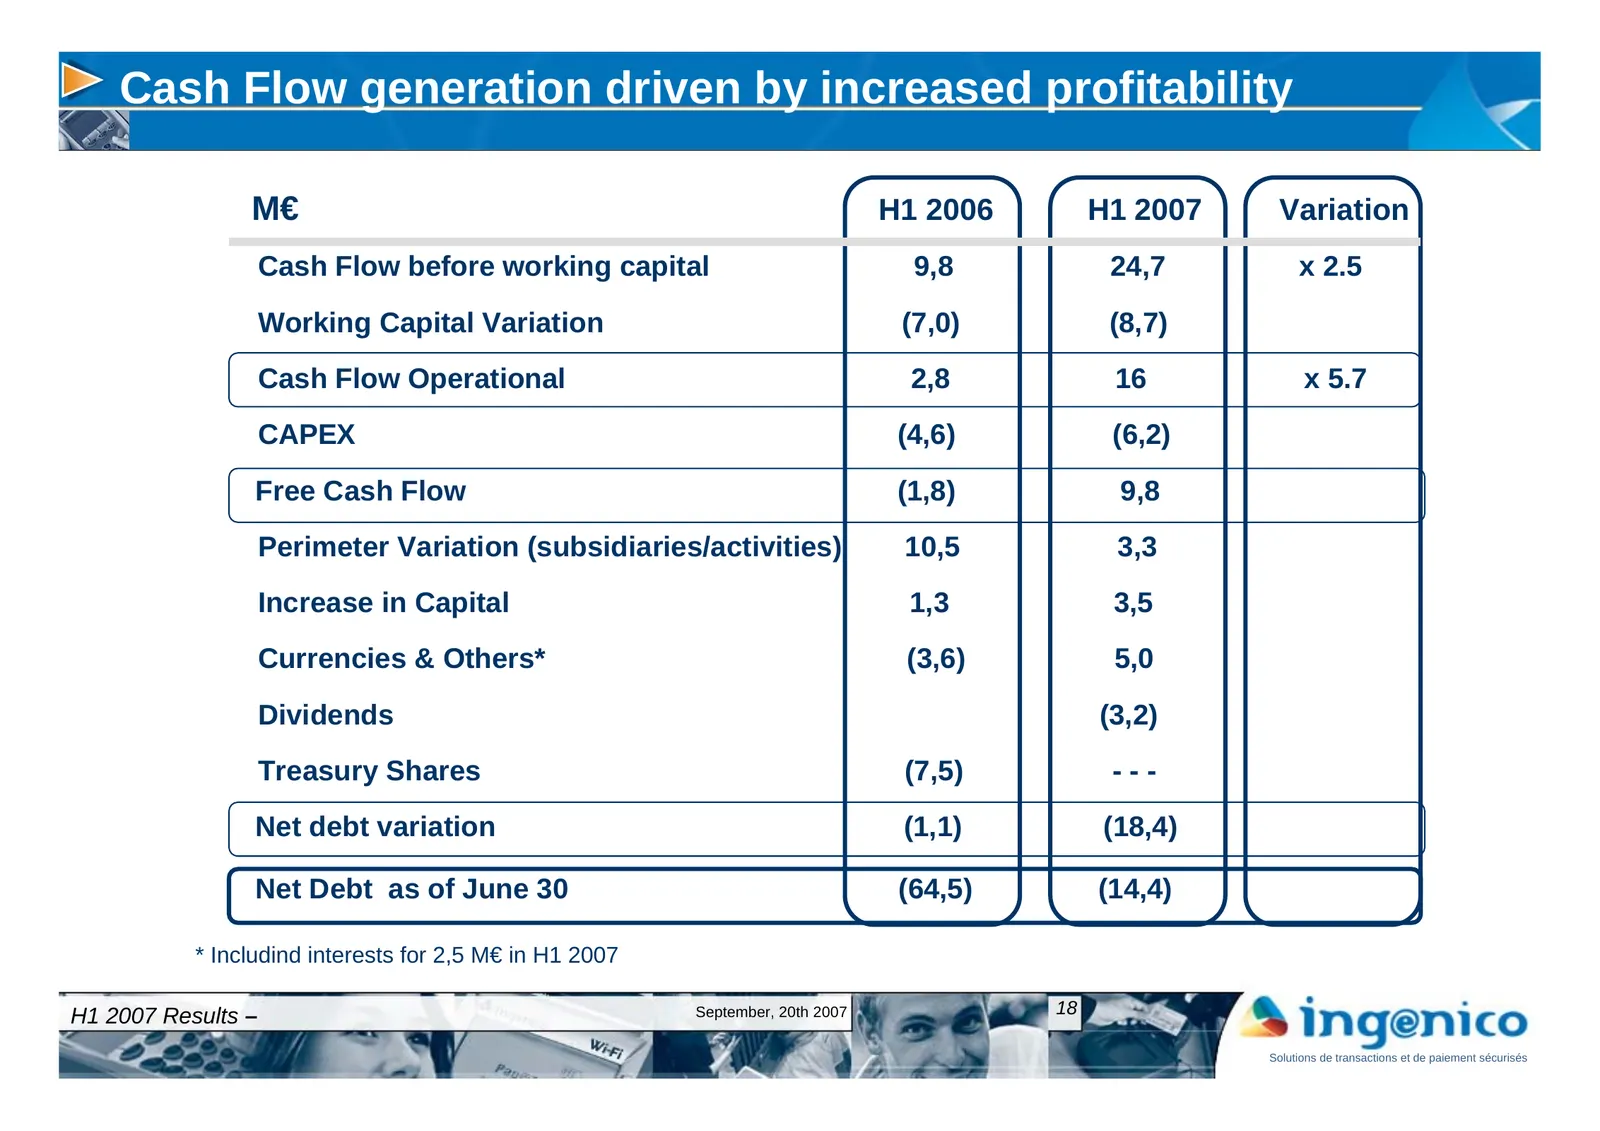
Cash Flow generation driven by increased profitability M€ H1 2006 H1 2007 Variation Cash Flow before working capital 9,8 24,7 x 2.5 Working Capital Variation (7,0) (8,7) Cash Flow Operational 2,8 16 x 5.7 CAPEX (4,6) (6,2) Free Cash Flow (1,8) 9,8 Perimeter Variation (subsidiaries/activities) 10,5 3
Slide 19: Future Challenges – Preliminary thoughts
Future Challenges – Preliminary thoughts H1 2007 Results – September, 20th 2007 19 Solutions de transactions et de paiement sécurisés
Slide 20: Sagem Monetel deal: an opportunity in line with our strategy
Sagem Monetel deal : an opportunity in line with our strategy H1 2007 Results – September, 20th 2007 20 Solutions de transactions et de paiement sécurisés
Slide 21: Transaction highlights
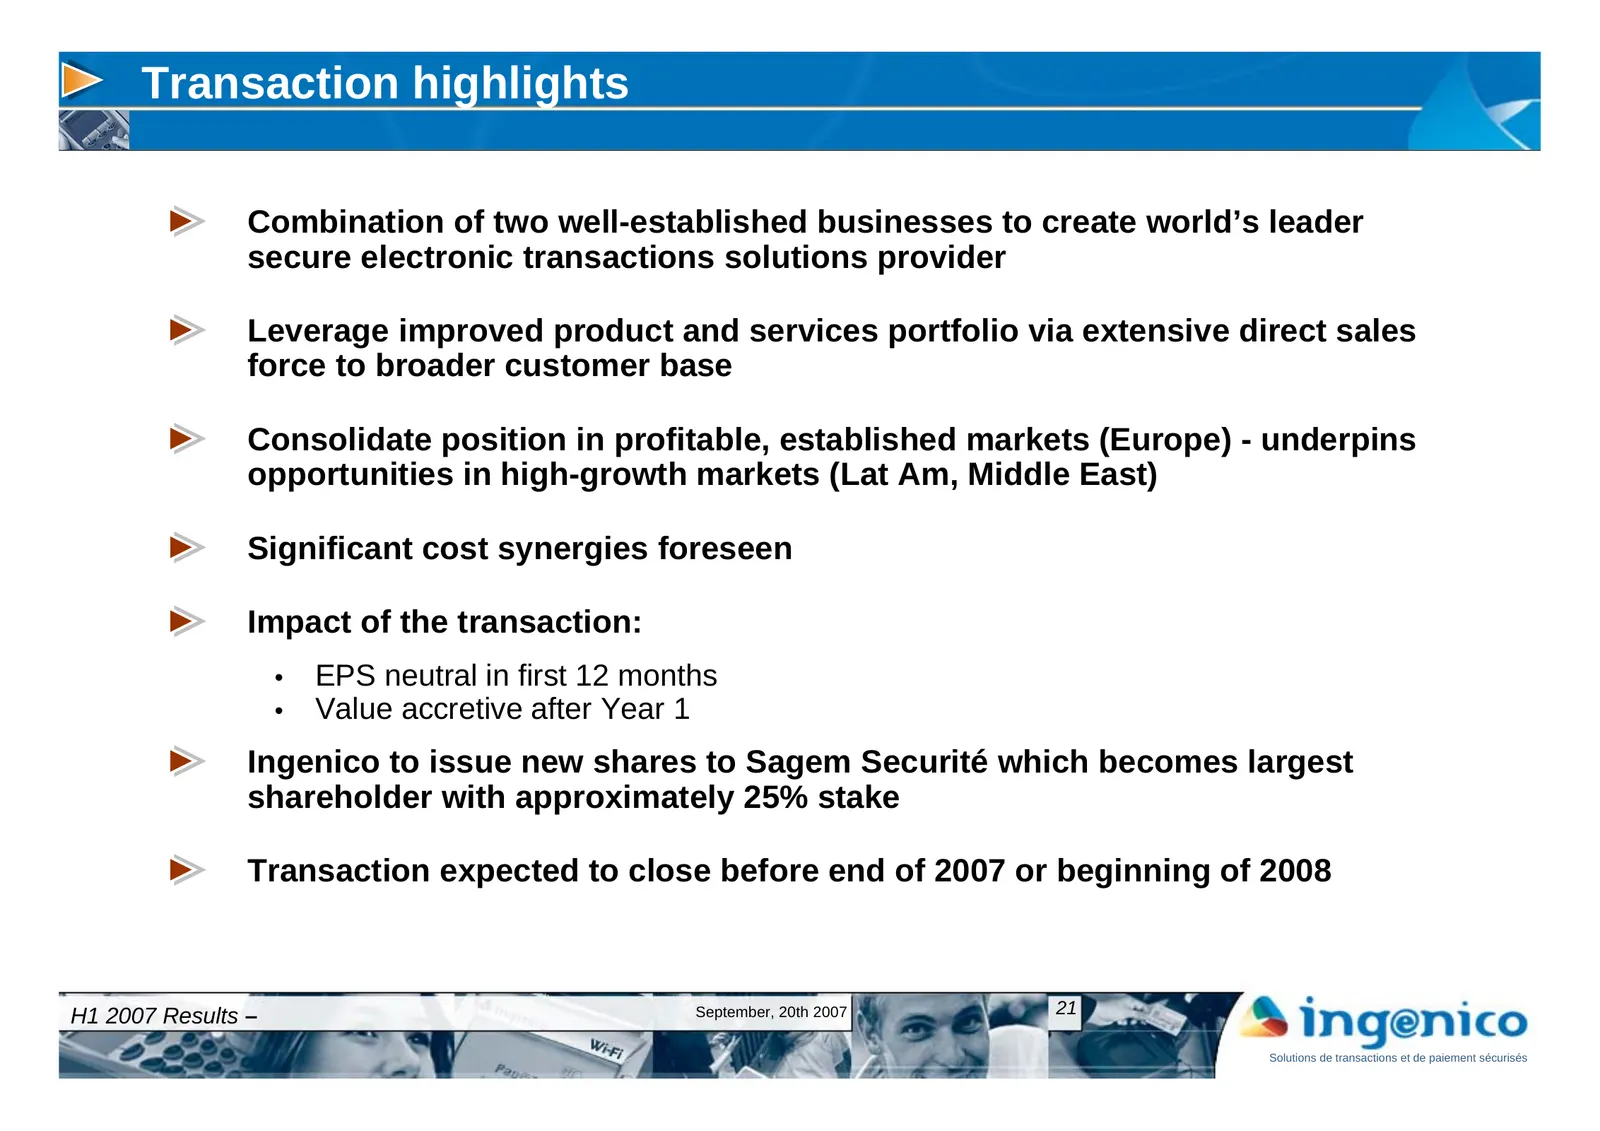
Transaction highlights Combination of two well-established businesses to create world’s leader secure electronic transactions solutions provider Leverage improved product and services portfolio via extensive direct sales force to broader customer base Consolidate position in profitable, established
Slide 22: Two strong businesses in their own right…
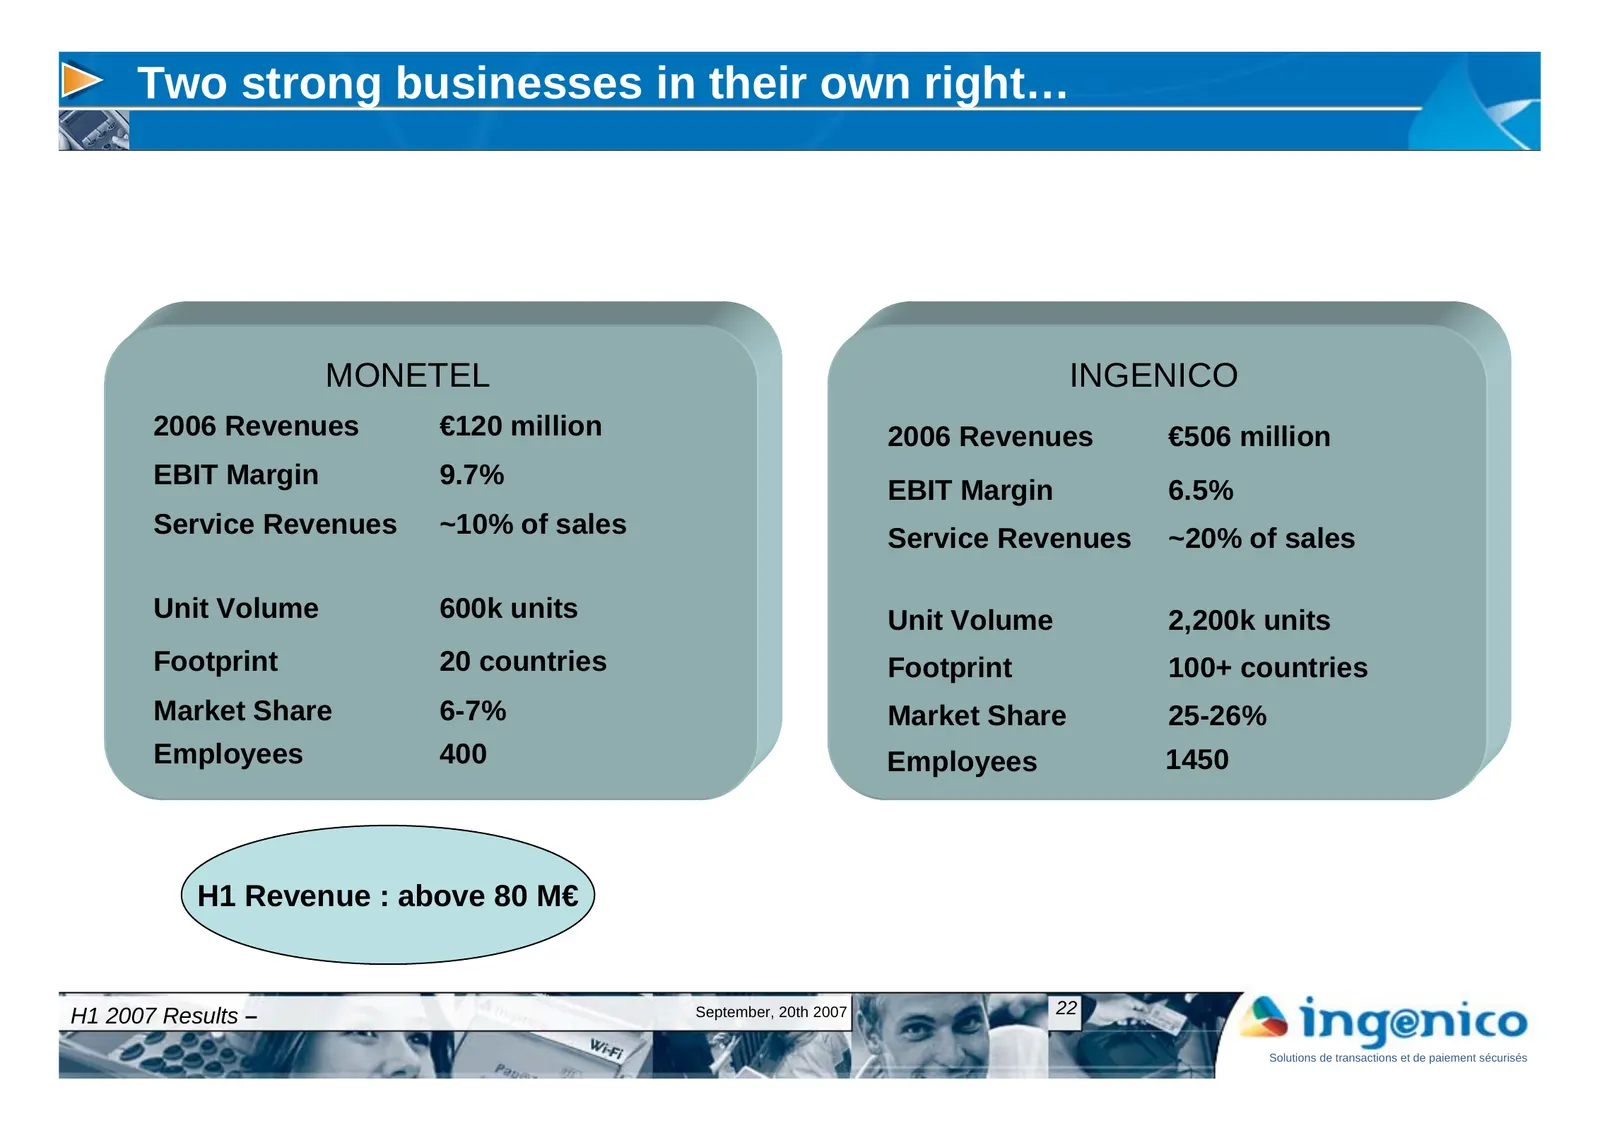
Two strong businesses in their own right… MONETEL INGENICO 2006 Revenues €120 million 2006 Revenues €506 million EBIT Margin 9.7% EBIT Margin 6.5% Service Revenues ~10% of sales Service Revenues ~20% of sales Unit Volume 600k units Unit Volume 2,200k units Footprint 20 countries Footprint 100+ count
Slide 23: …together creating an industry leader
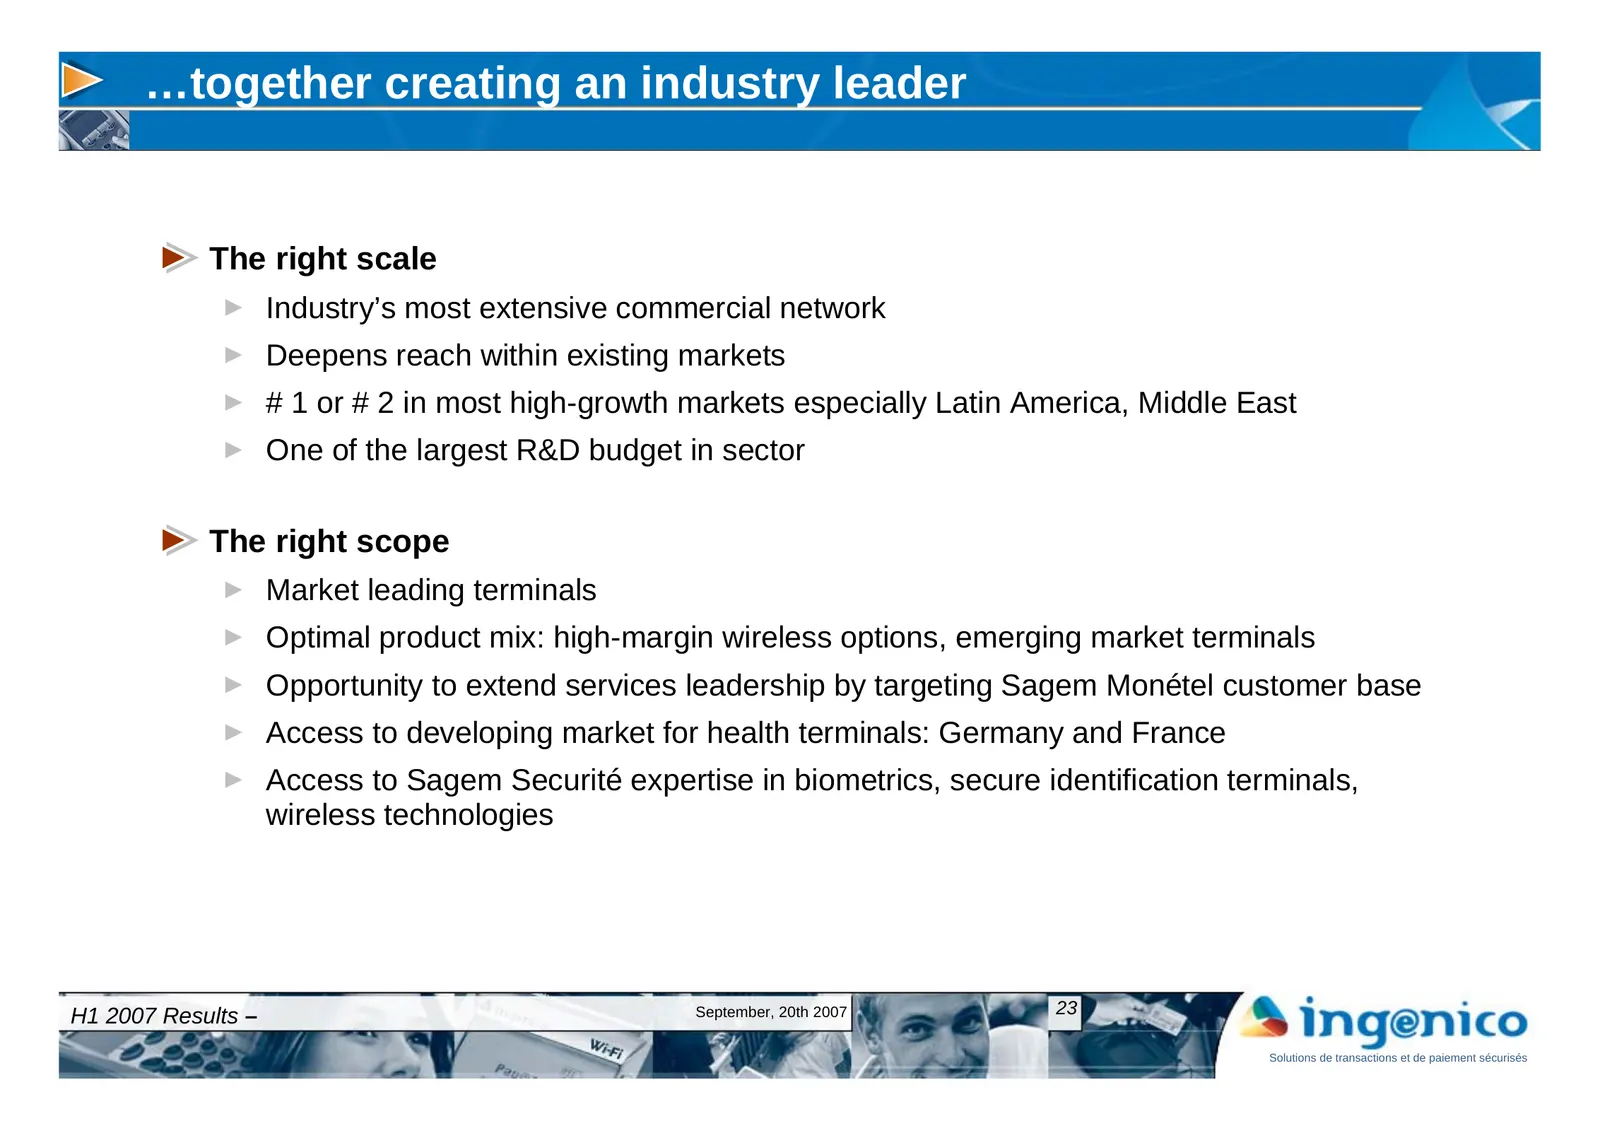
…together creating an industry leader The right scale Industry’s most extensive commercial network Deepens reach within existing markets # 1 or # 2 in most high-growth markets especially Latin America, Middle East One of the largest R&D budget in sector The right scope Market leading terminals Optim
Slide 24: Transaction timetable
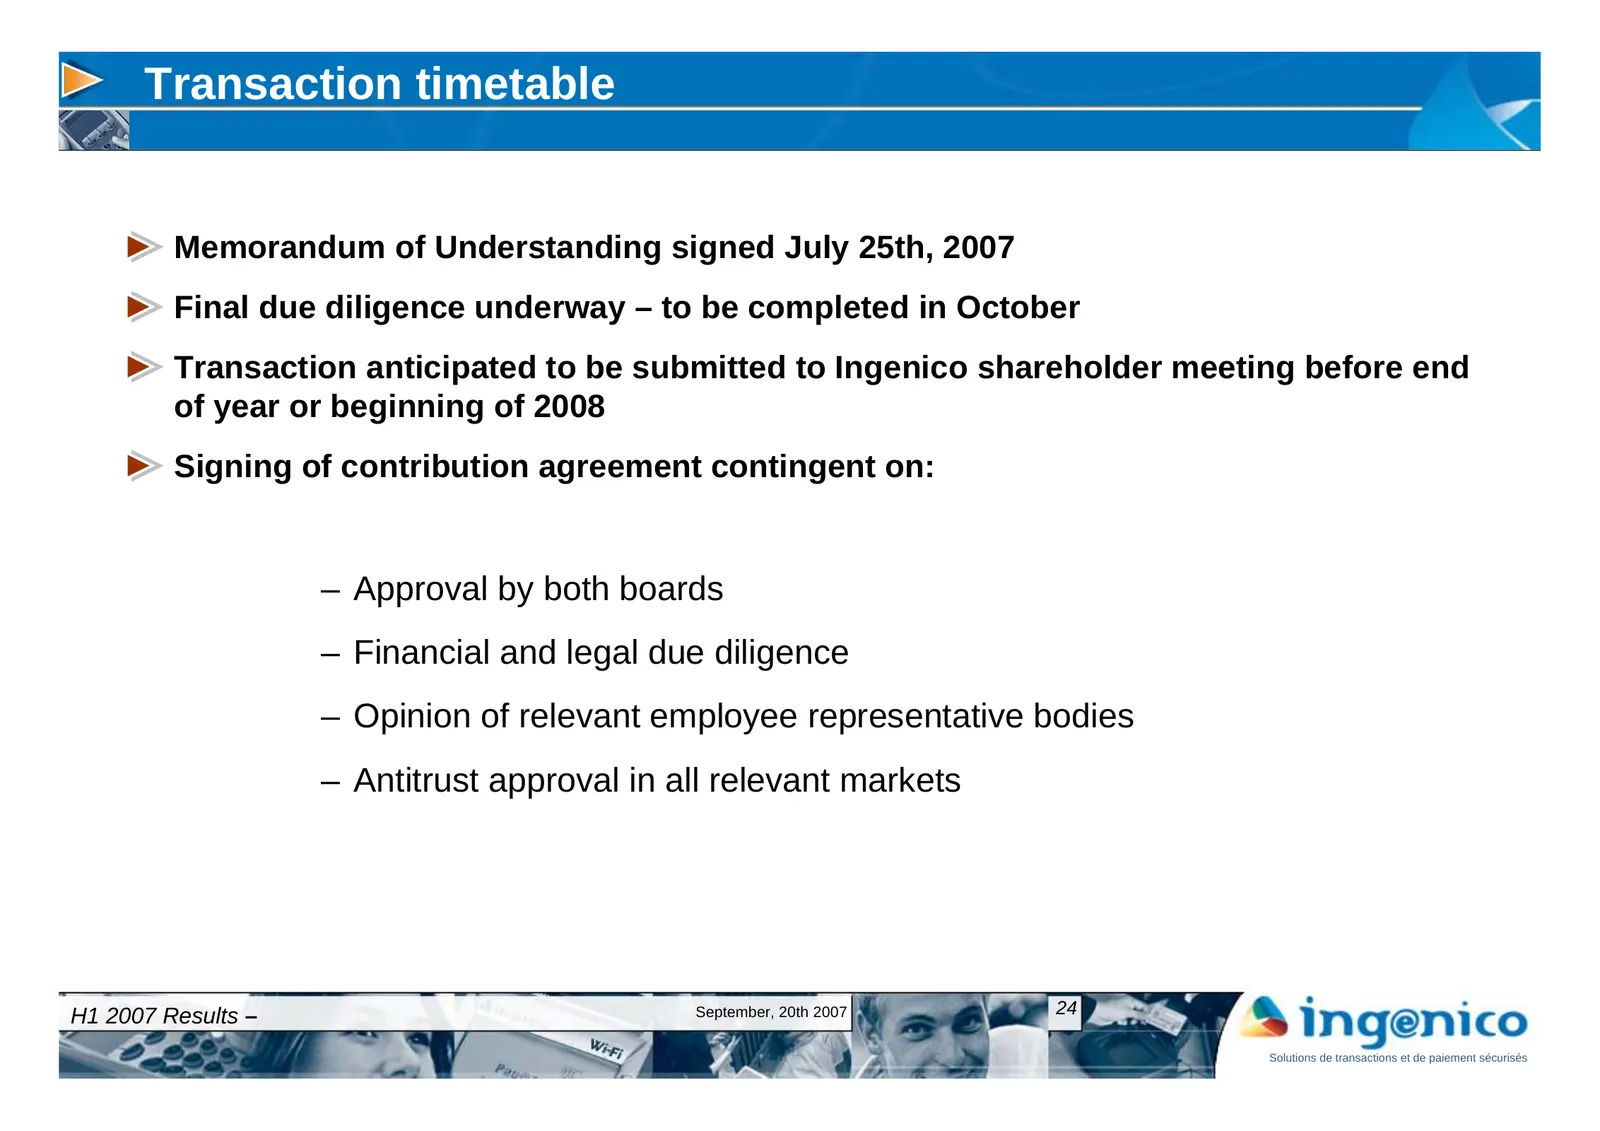
Transaction timetable Memorandum of Understanding signed July 25th, 2007 Final due diligence underway – to be completed in October Transaction anticipated to be submitted to Ingenico shareholder meeting before end of year or beginning of 2008 Signing of contribution agreement contingent on: – Approv
Slide 25: Conclusion
Conclusion H1 2007 Results – September, 20th 2007 25 Solutions de transactions et de paiement sécurisés
Slide 26: Closing remarks
Closing remarks The group’s fundamentals are strong The turnaround strategy is delivering successfully Challenges ahead : • Accelerate build-up on our product and service offer • Maintain profitable growth H1 2007 Results – September, 20th 2007 26 Solutions de transactions et de paiement sécurisés
Slide 27: Group objectives for 2007
Group objectives for 2007 We maintain our objectives of 7% to 10% sales growth for FY 2007 We confirm that our EBIT margin for FY 2007 should be of at least 9% H1 2007 Results – September, 20th 2007 27 Solutions de transactions et de paiement sécurisés
Slide 28: Questions & Answers
Questions & Answers H1 2007 Results – September, 20th 2007 28 Solutions de transactions et de paiement sécurisés
Slide 29: Thank You
THANK YOU Secure Transaction and payment solutions
Source: Internet Archive copy of investors.worldline.com
More decks from Worldline SA
 Q3 2026 Earnings Presentation24 slides · Oct 27, 2026
 H1 2026 Earnings Presentation42 slides · Jul 30, 2026
 Shareholder Meeting (June 2026)72 slides · Jun 11, 2026
 Q1 2026 Earnings Presentation21 slides · Apr 28, 2026
 FY 2025 Earnings Presentation45 slides · Feb 25, 2026
 Shareholder Meeting (January 2026)32 slides · Jan 8, 2026