Navistar International Corporation
Navistar International — Q4 2013 Earnings Presentation
51 slides from Navistar International's earnings presentation, Dec 20, 2013

Slide 1: 2013 Earnings Presentation
Exhibit 99.2 2013 EARNINGS PRESENTATION December 20, 2013
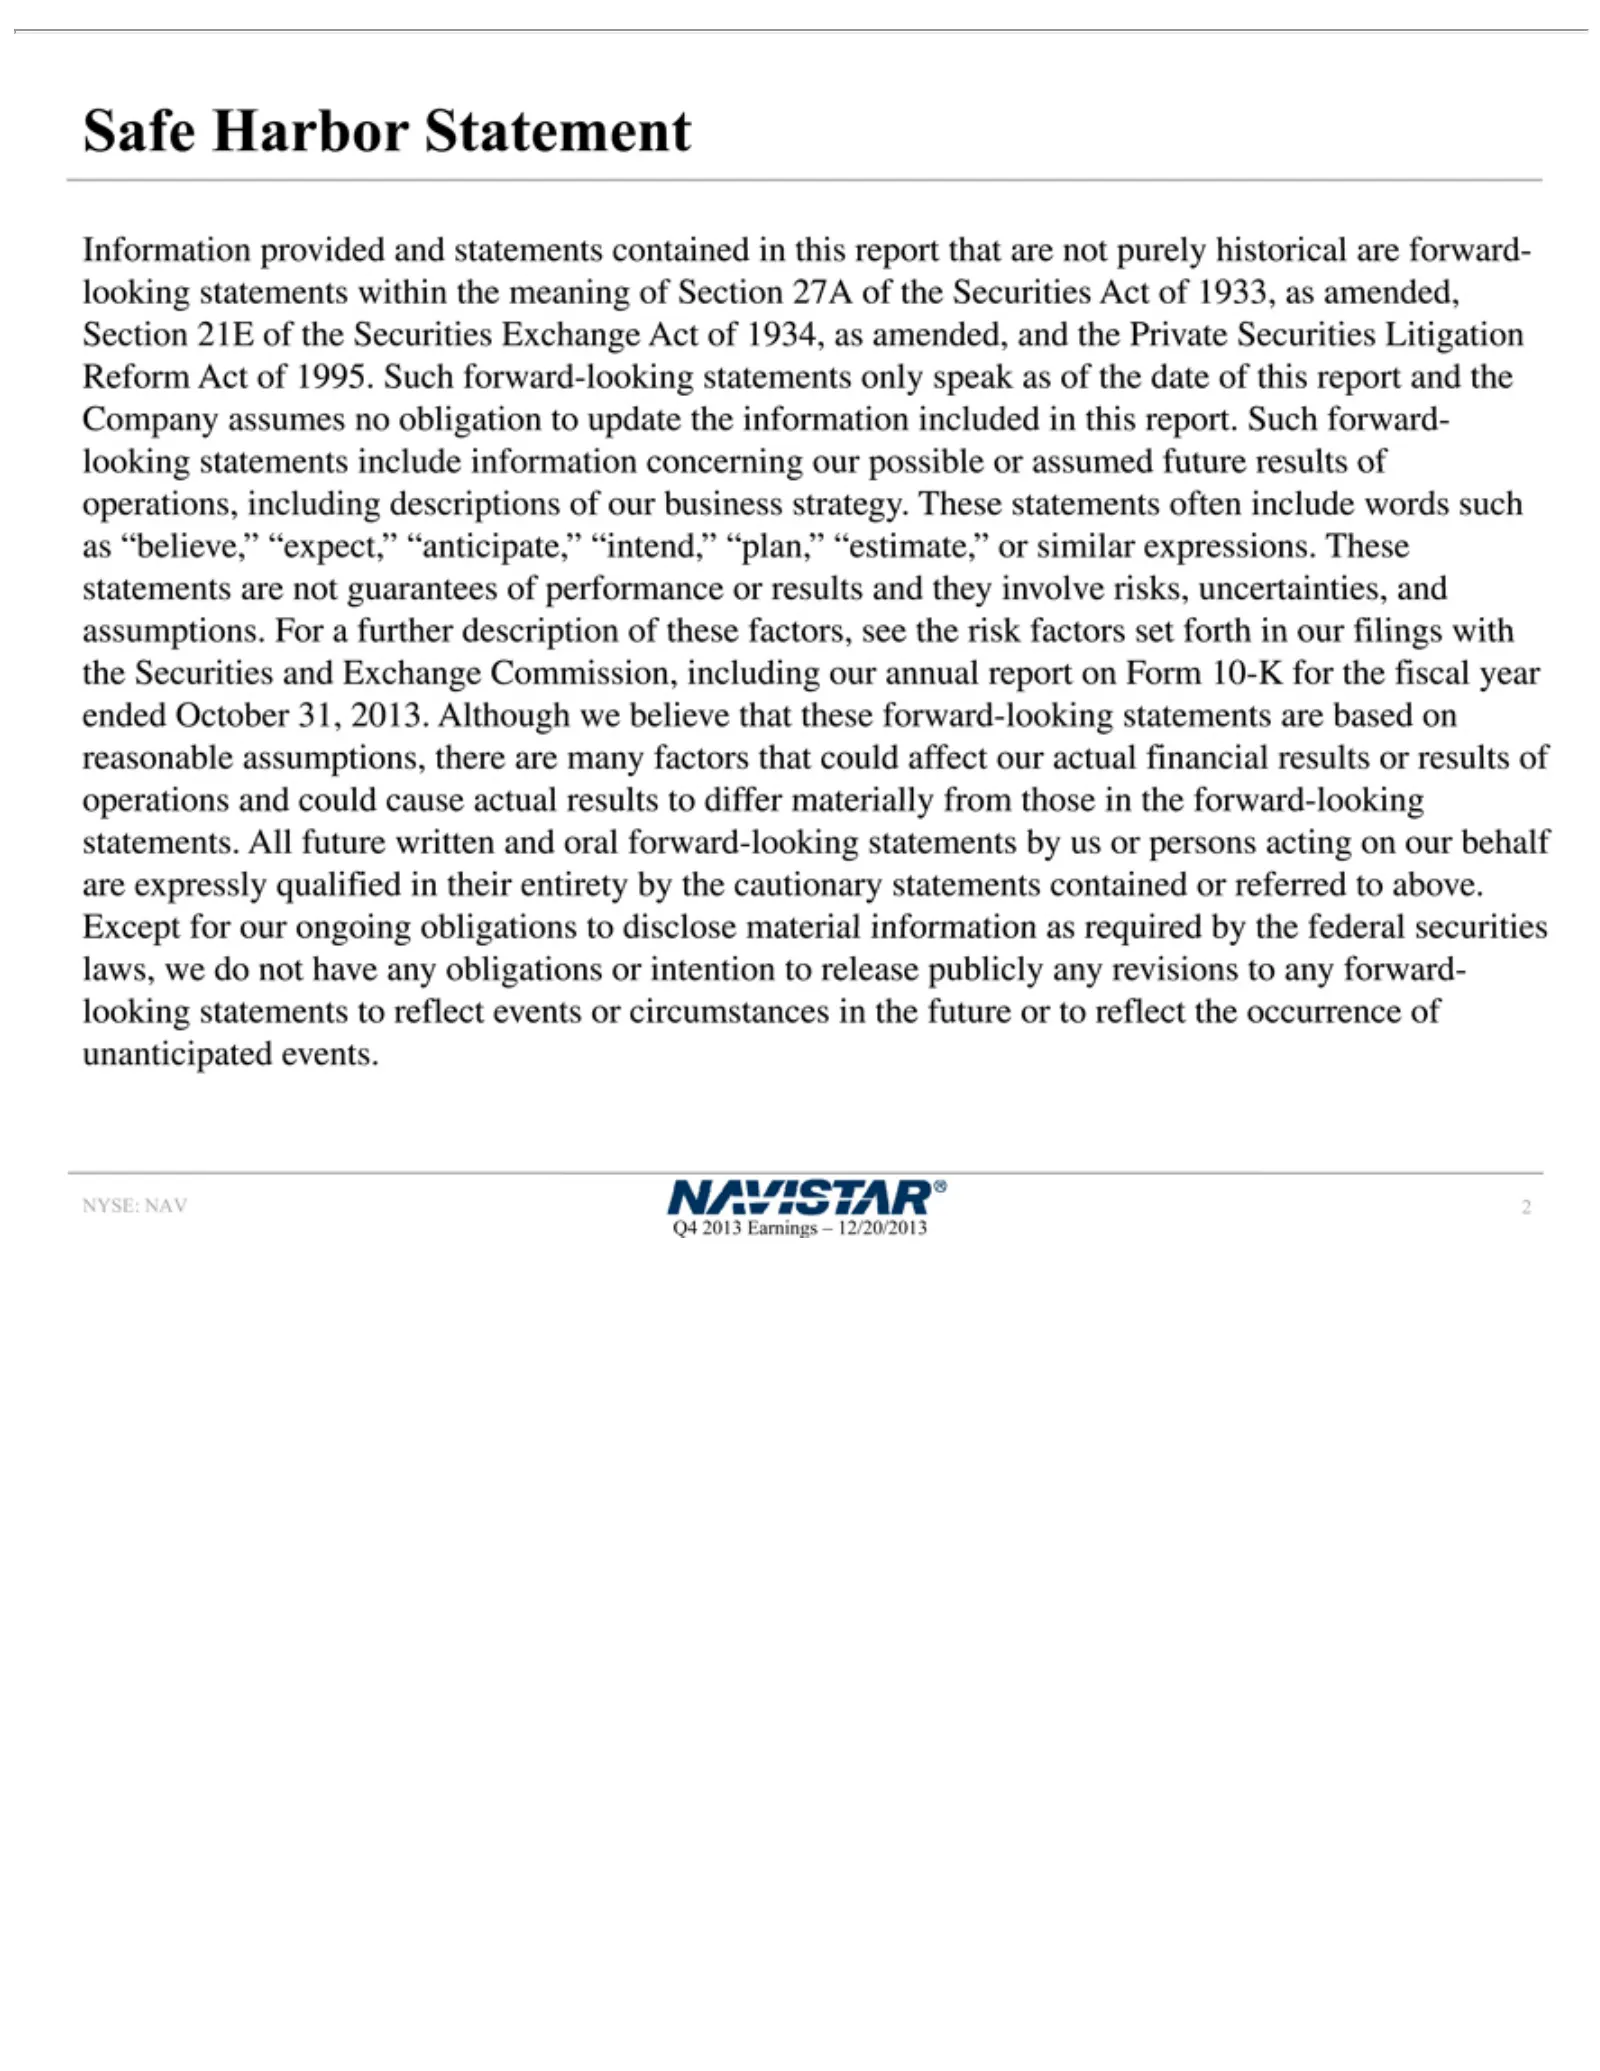
Slide 2: Safe Harbor Statement
Safe Information the obligation strategy. involve K results expressly have NYSE: 2Q4for Securities 2013 Harbor any the of NAV risks, These Earnings obligations fiscal operations qualified toprovided Statement update uncertainties, Exchange statements year–inended the 12/20/2013 and or and their inte
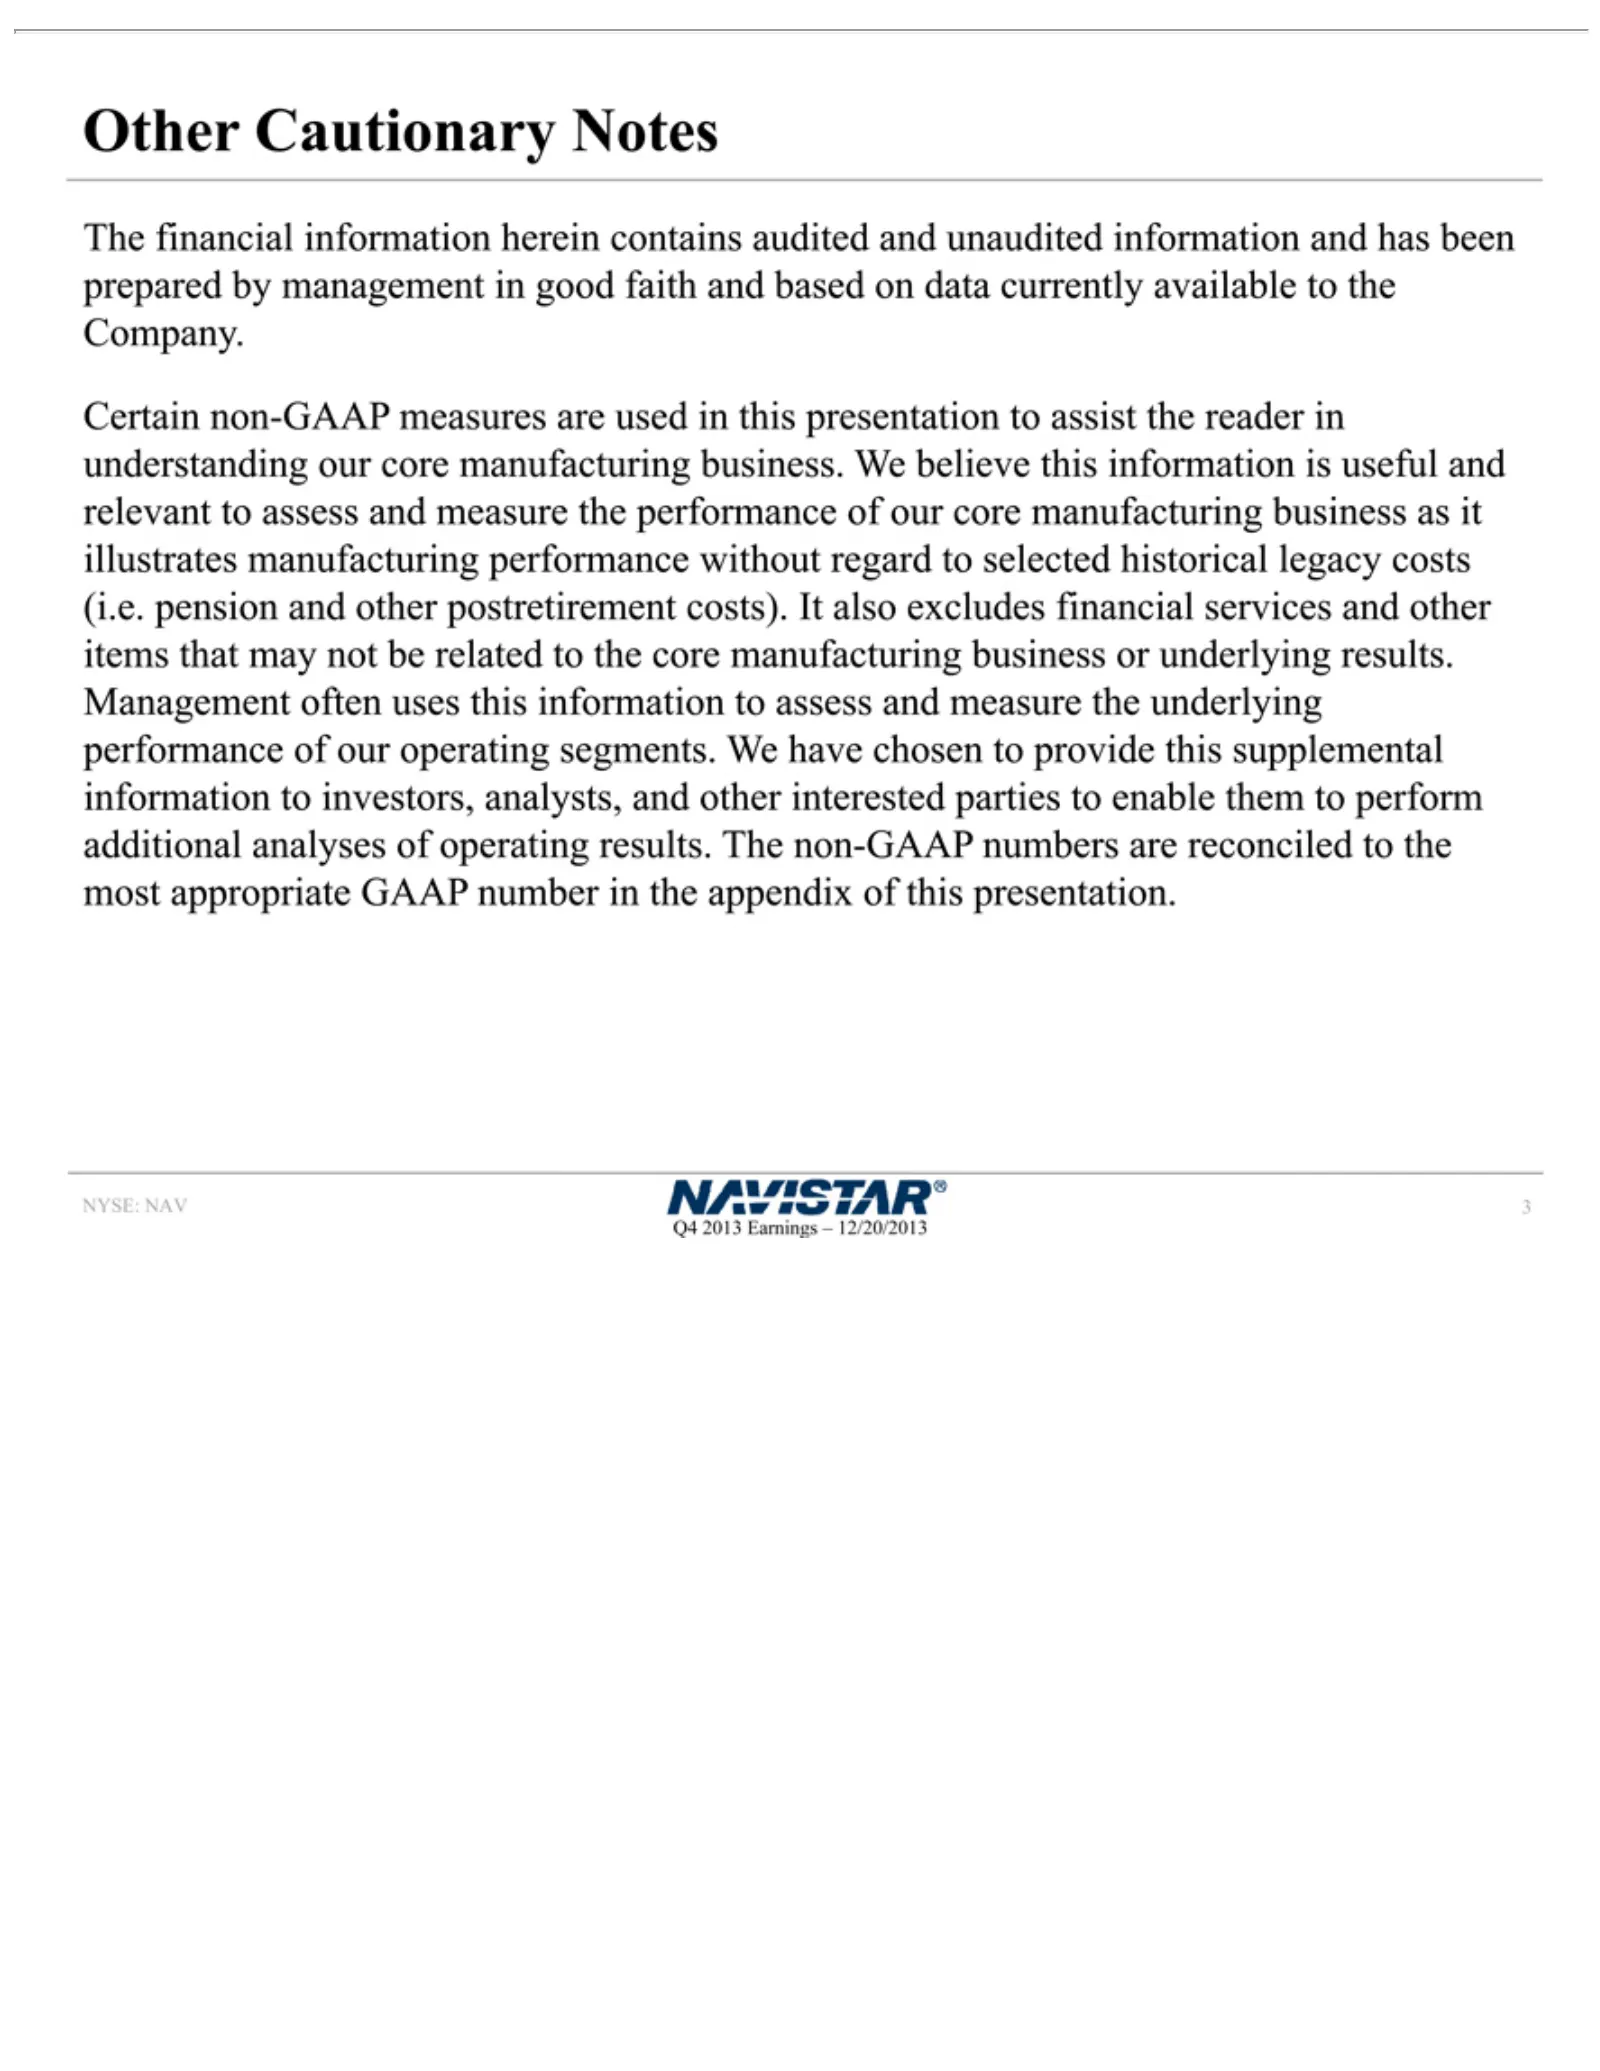
Slide 3: Other Cautionary Notes
Other The used business related supplemental number NYSE: 3Q4 2013 financial inCautionary to this NAV inas Earnings the the itpresentation core illustrates information appendix Notes manufacturing – 12/20/2013 manufacturing of toherein to this assist investors, presentation. contains the business re
Slide 4: 4th Quarter 2013 Results
4th QUARTER Troy NYSE:Clarke, NAV President 2013 RESULTS & CEO Troy Clarke, President & CEO
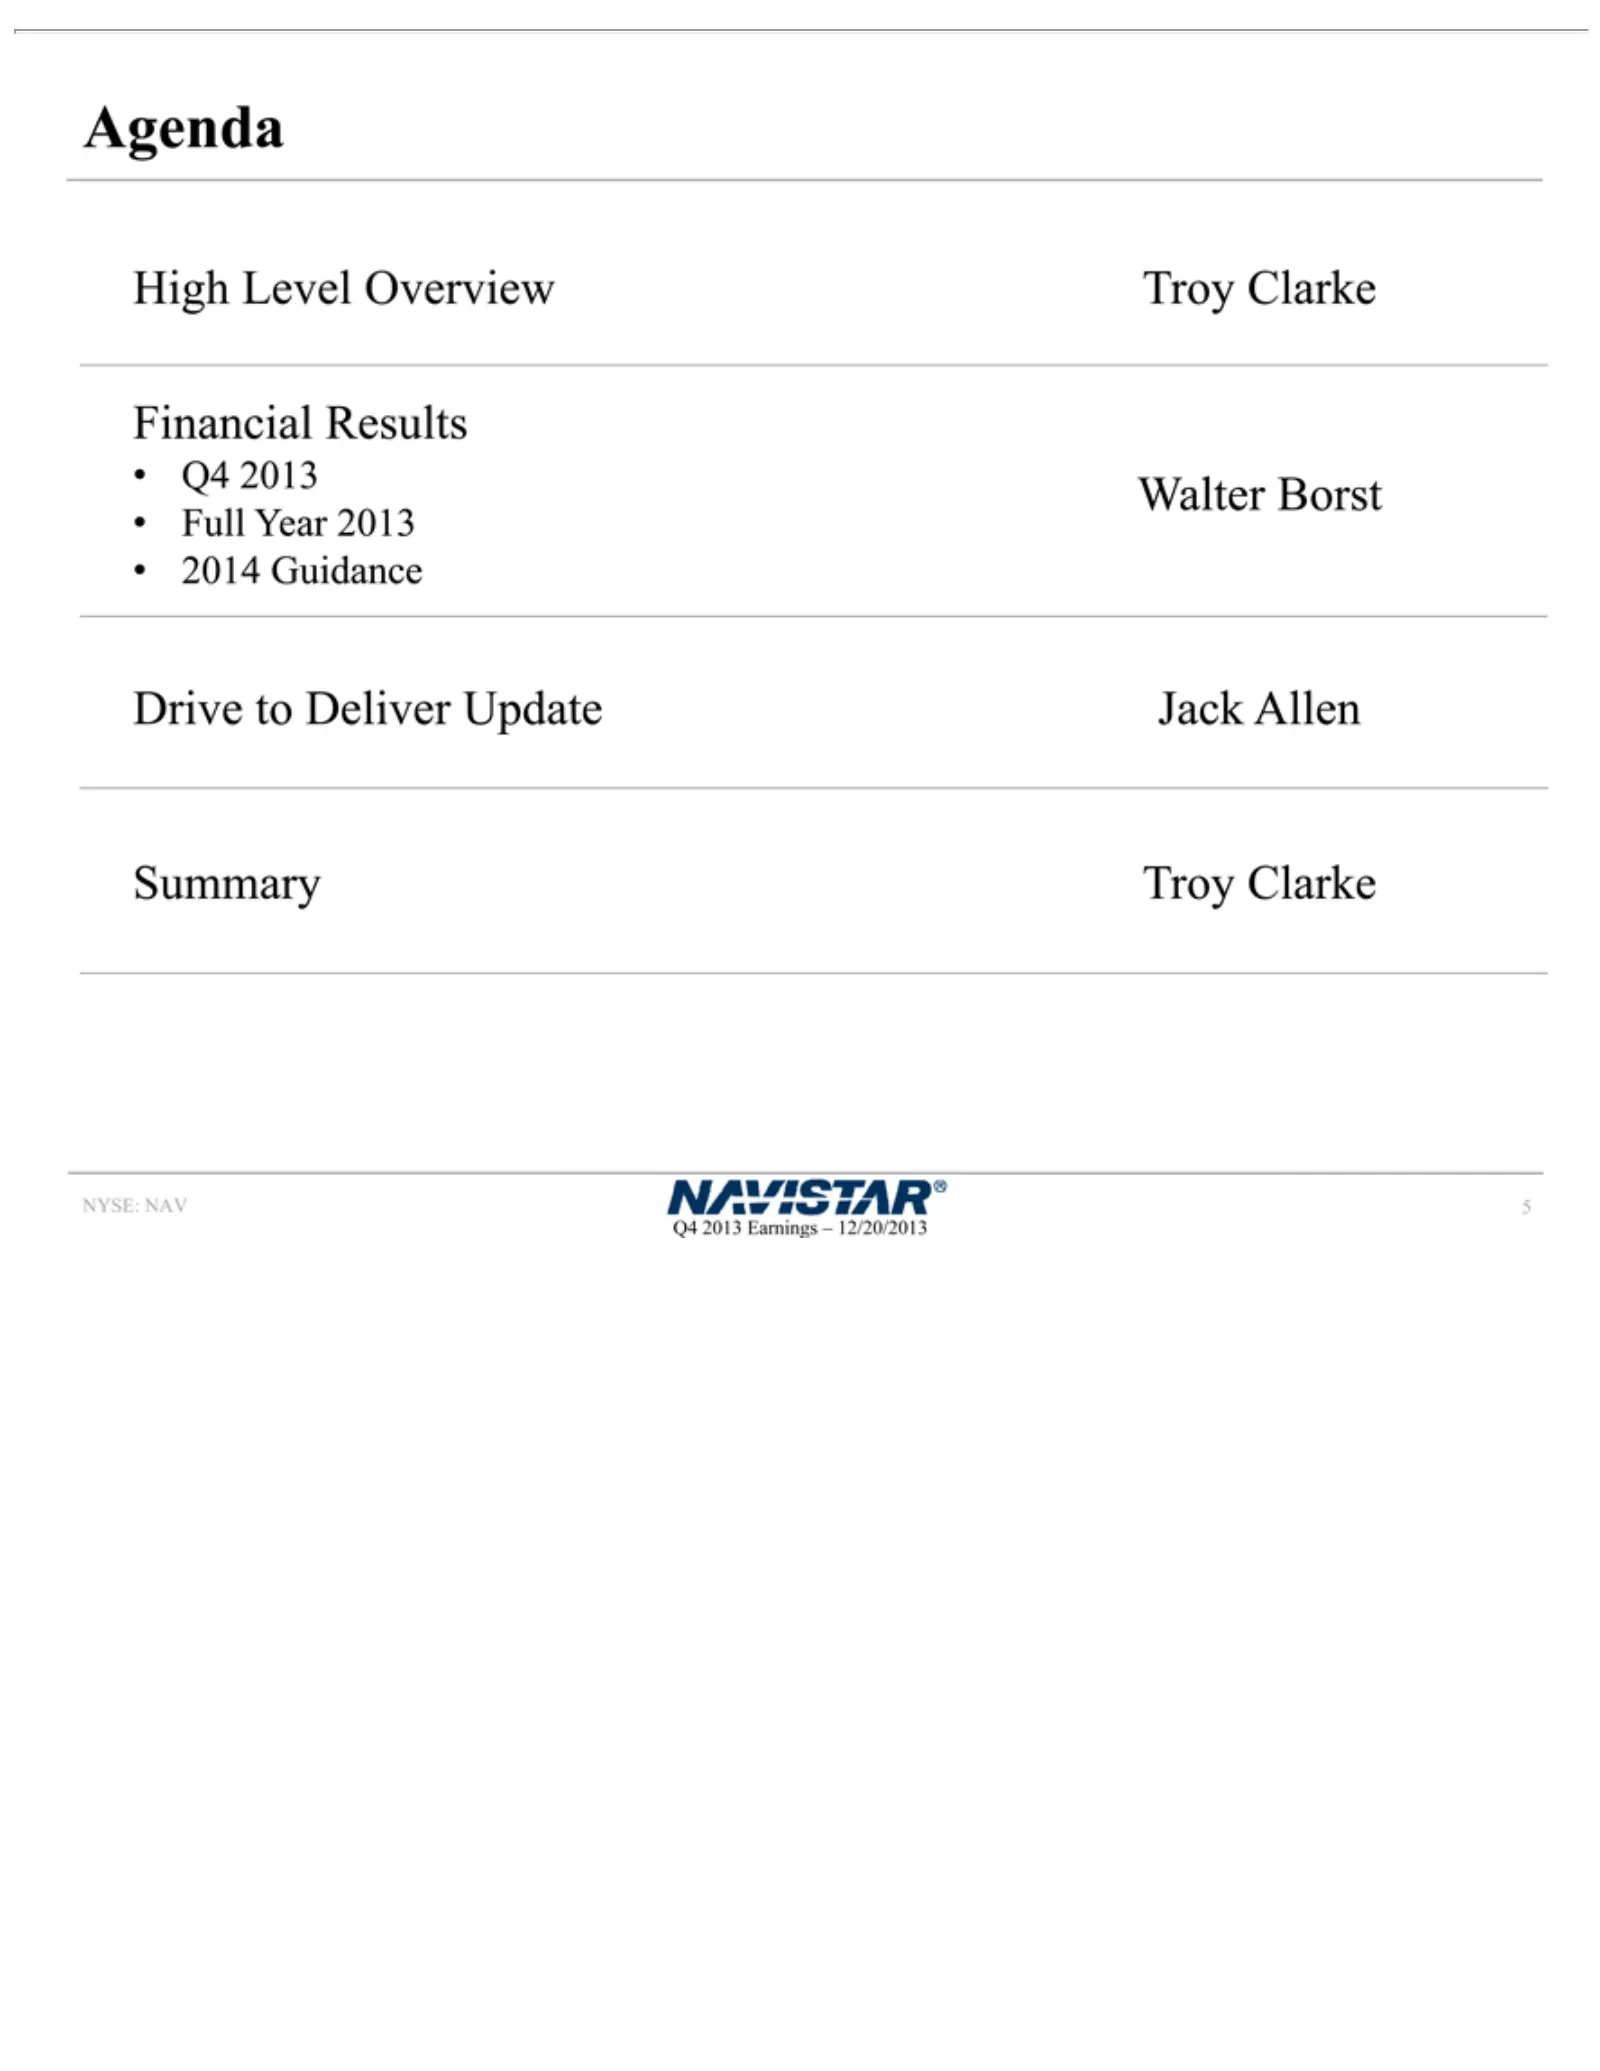
Slide 5: Agenda
High Agenda Financial Full 2014 Drive Summary NYSE: 5Q4 2013 Year Level Guidance toNAV Deliver Earnings 2013 Results Troy Overview Clarke Walter Update – 12/20/2013 Troy Borst Jack Clarke Allen
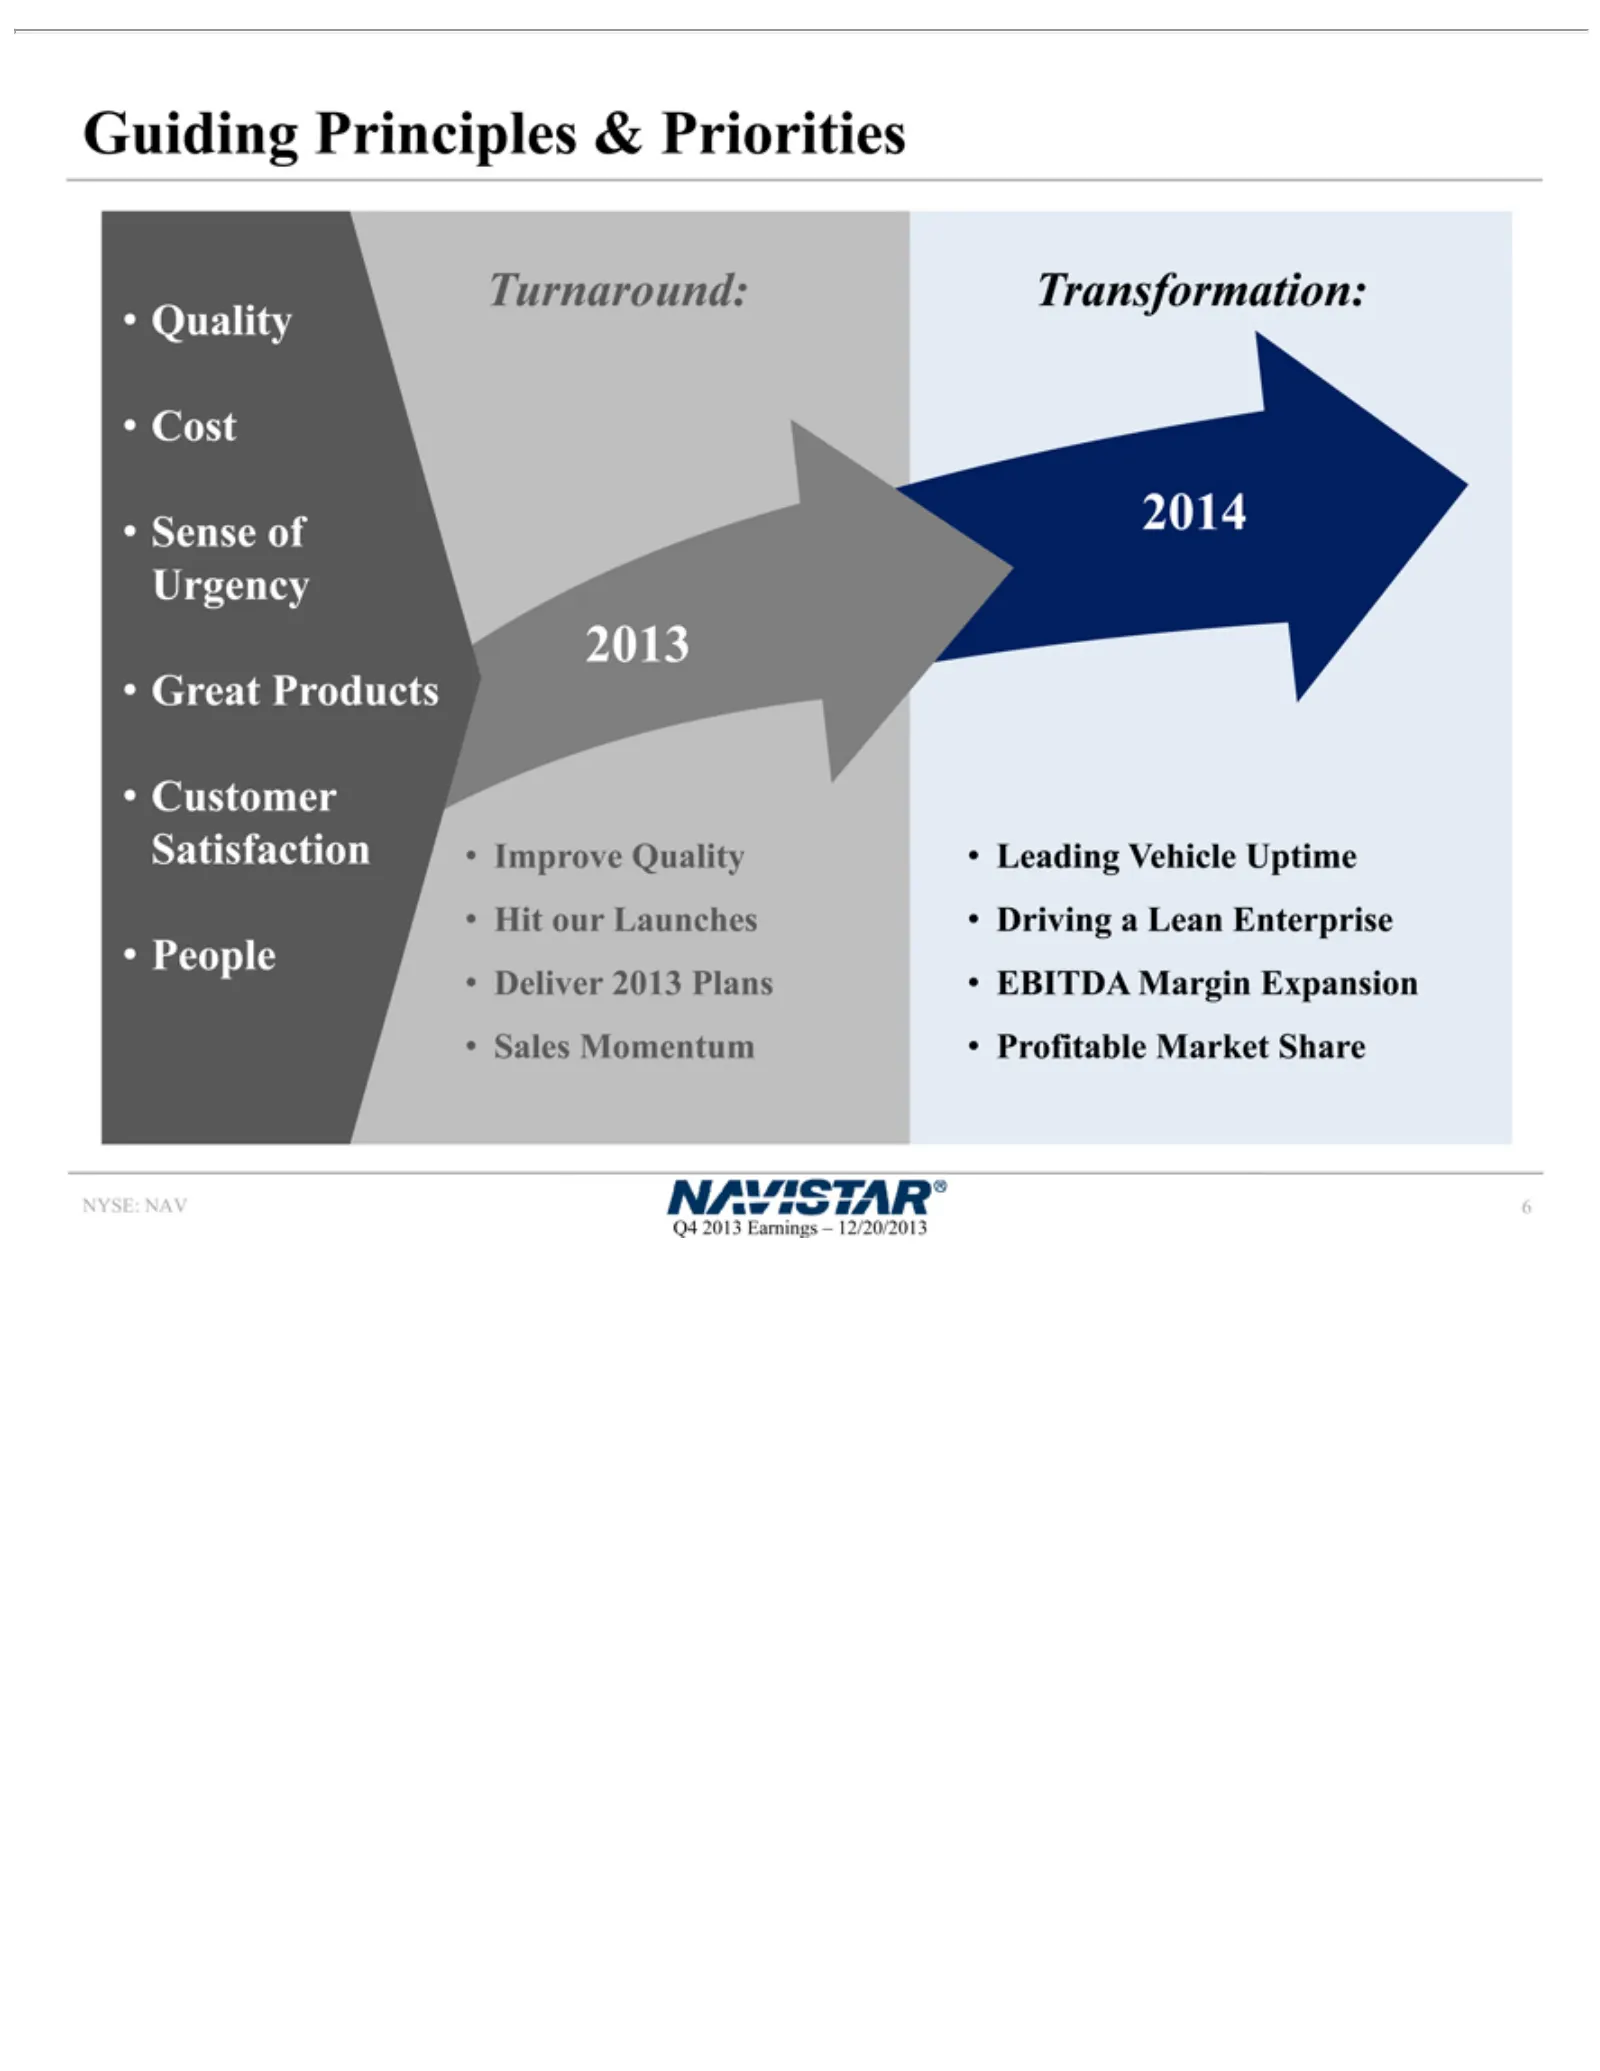
Slide 6: Guiding Principles: Transformation and Turnaround Priorities
Guiding Transformation: Turnaround: NYSE: 6Q4 2013NAV Principles Earnings Improve 2013 –&12/20/2013 Priorities Quality 2014 Leading Hit ourVehicle Launches Uptime Deliver Driving 2013 aPlans LeanSales Enterprise Momentum EBITDA Margin Expansion Profitable Market Share Quality Cost Sense of Urgency G
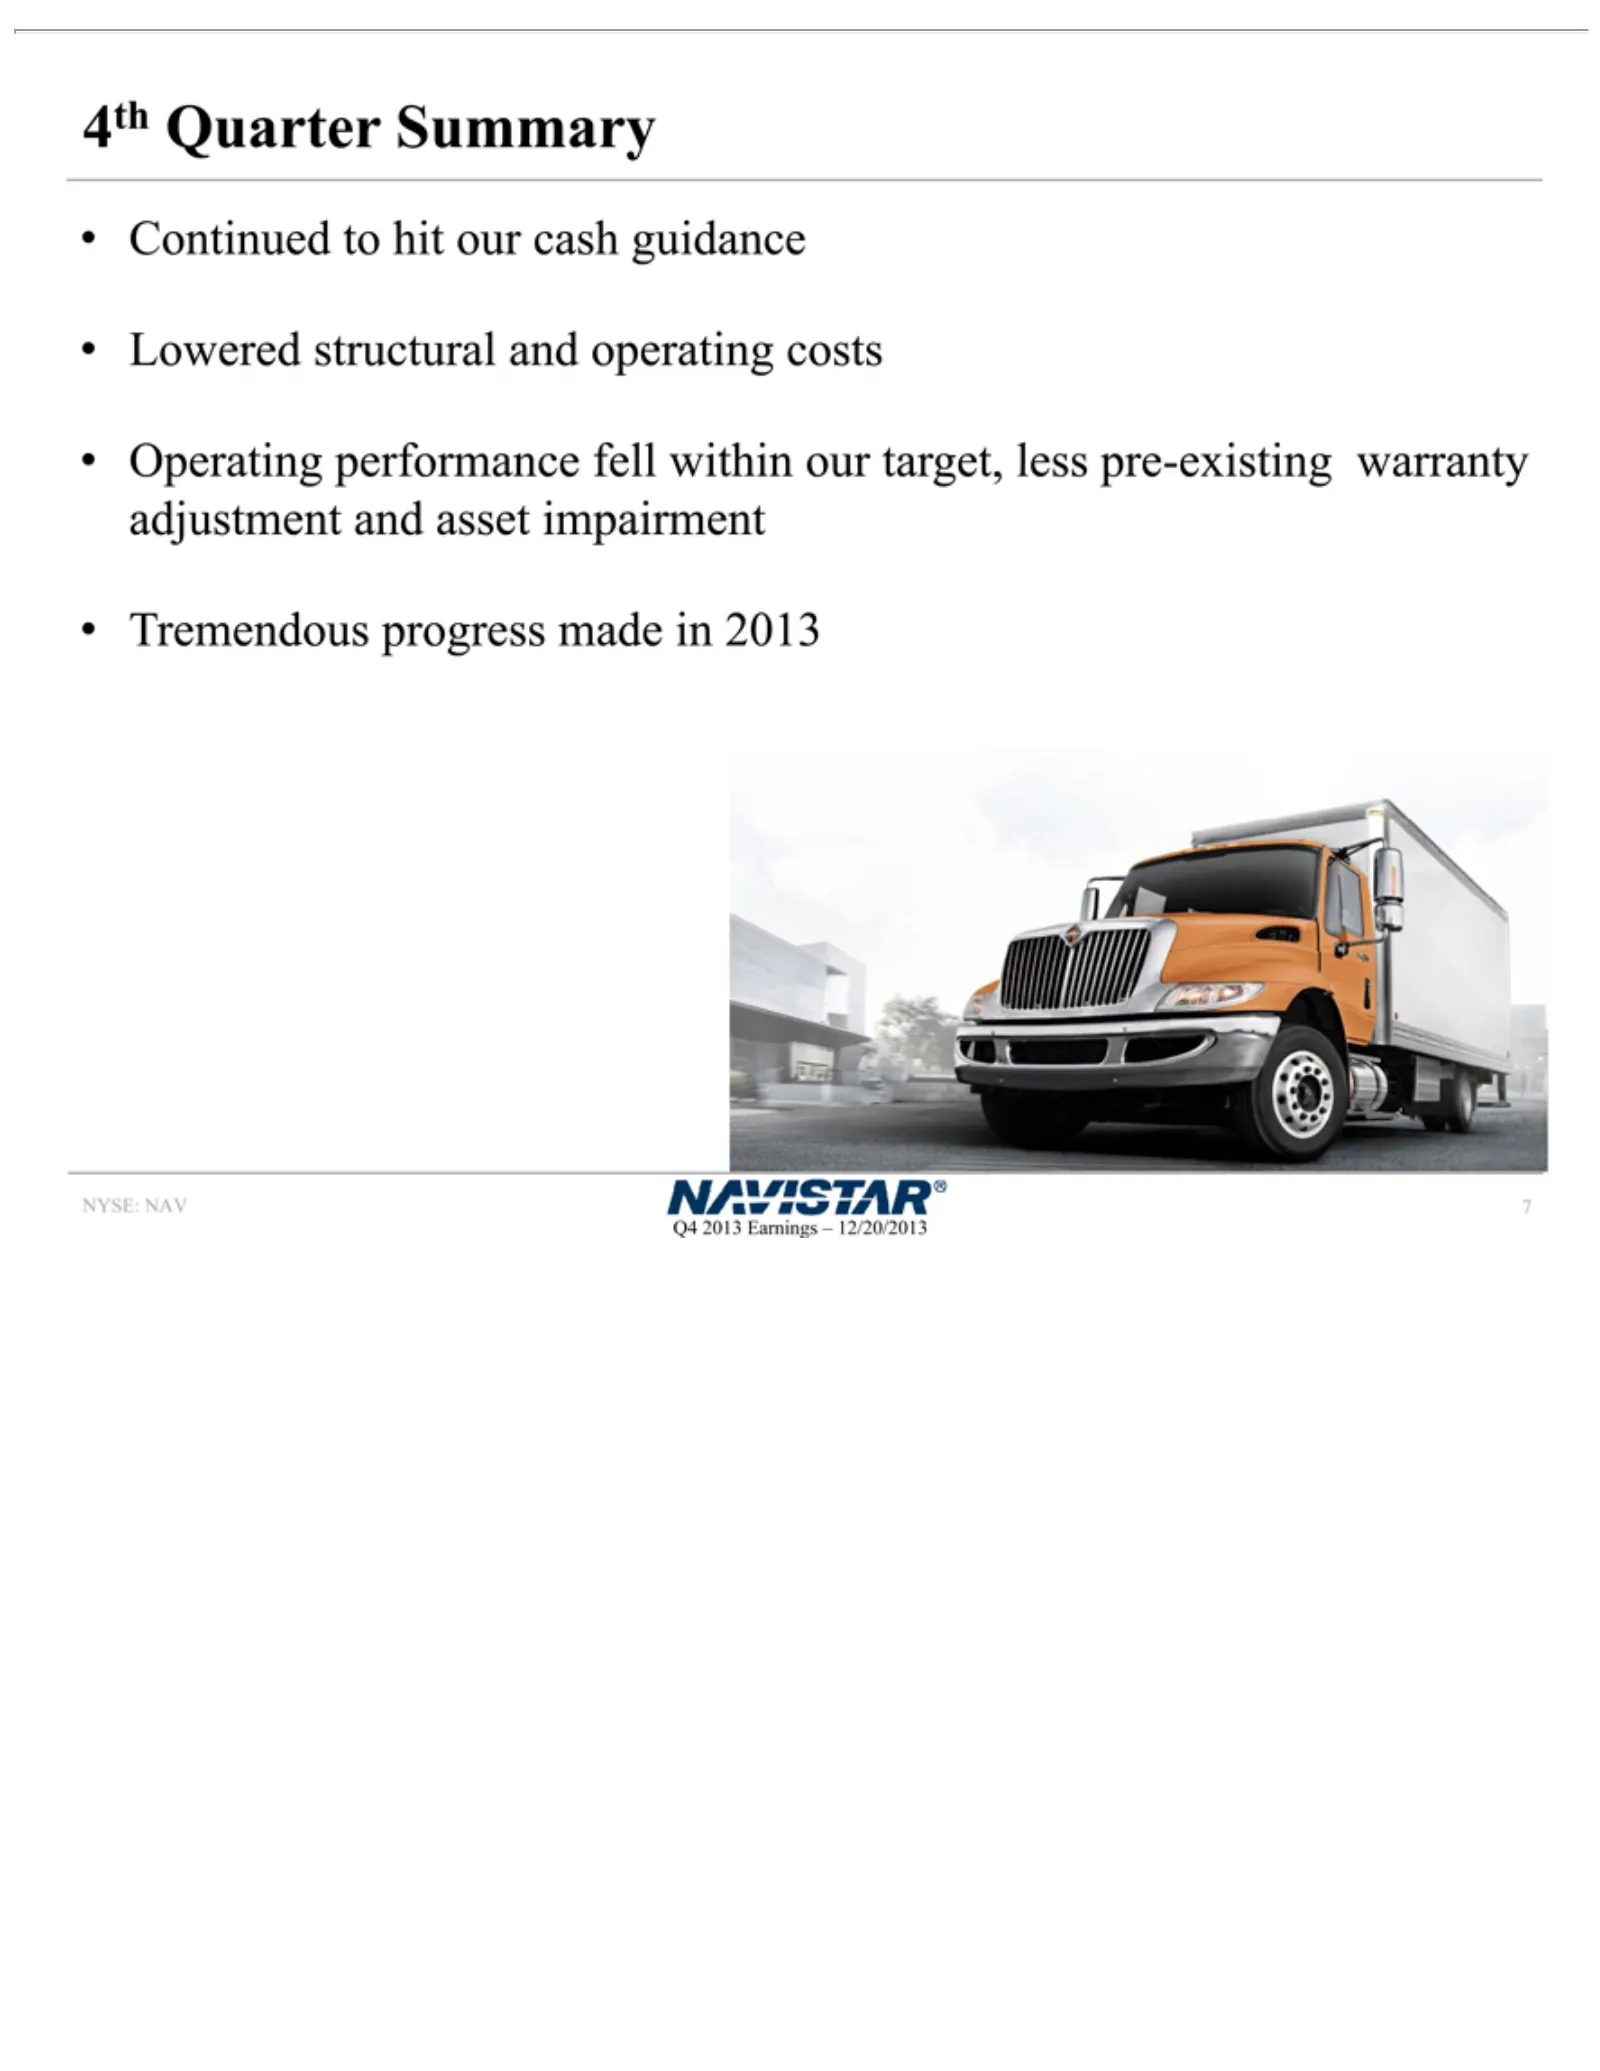
Slide 7: 4th Quarter 2013 Summary
4th 2013 Continued NYSE: 7Q4 Quarter NAV Earnings toSummary hit our – 12/20/2013 cash guidance Lowered structural and operating costs Operating performance fell within our target, less pre-existing warranty adjustment and asset impairment Tremendous progress made in 2013
Slide 8: Top 2013 Accomplishments
Top New in guidance NYSE: 8Q4understanding 2013 2013 leadership NAV Earnings for Accomplishments lastteam 5scope –quarters 12/20/2013 Met of all EGR-only key product warranty launch Reduced dates Received material EPA cost to certifications help offset SCR for MF13L costs Implemented w/ SCR Added RO
Slide 9: Warranty Focus
2014 Warranty higher NYSE: 9Q4 2013 Focus Strong NAV Earnings Strengthen market – 12/20/2013 our acceptance forecasting of Cummins capabilityISB Halfway Entering through 2014maximum with a significantly exposure ofbetter EGRorder onlybacklog engines Majority of units will exit warranty by end of 201
Slide 10: Financial Results
FINANCIAL Walter NYSE: Borst, NAV Executive RESULTSVice President & CFO
Slide 11: Q4 2013 Financial Results Summary
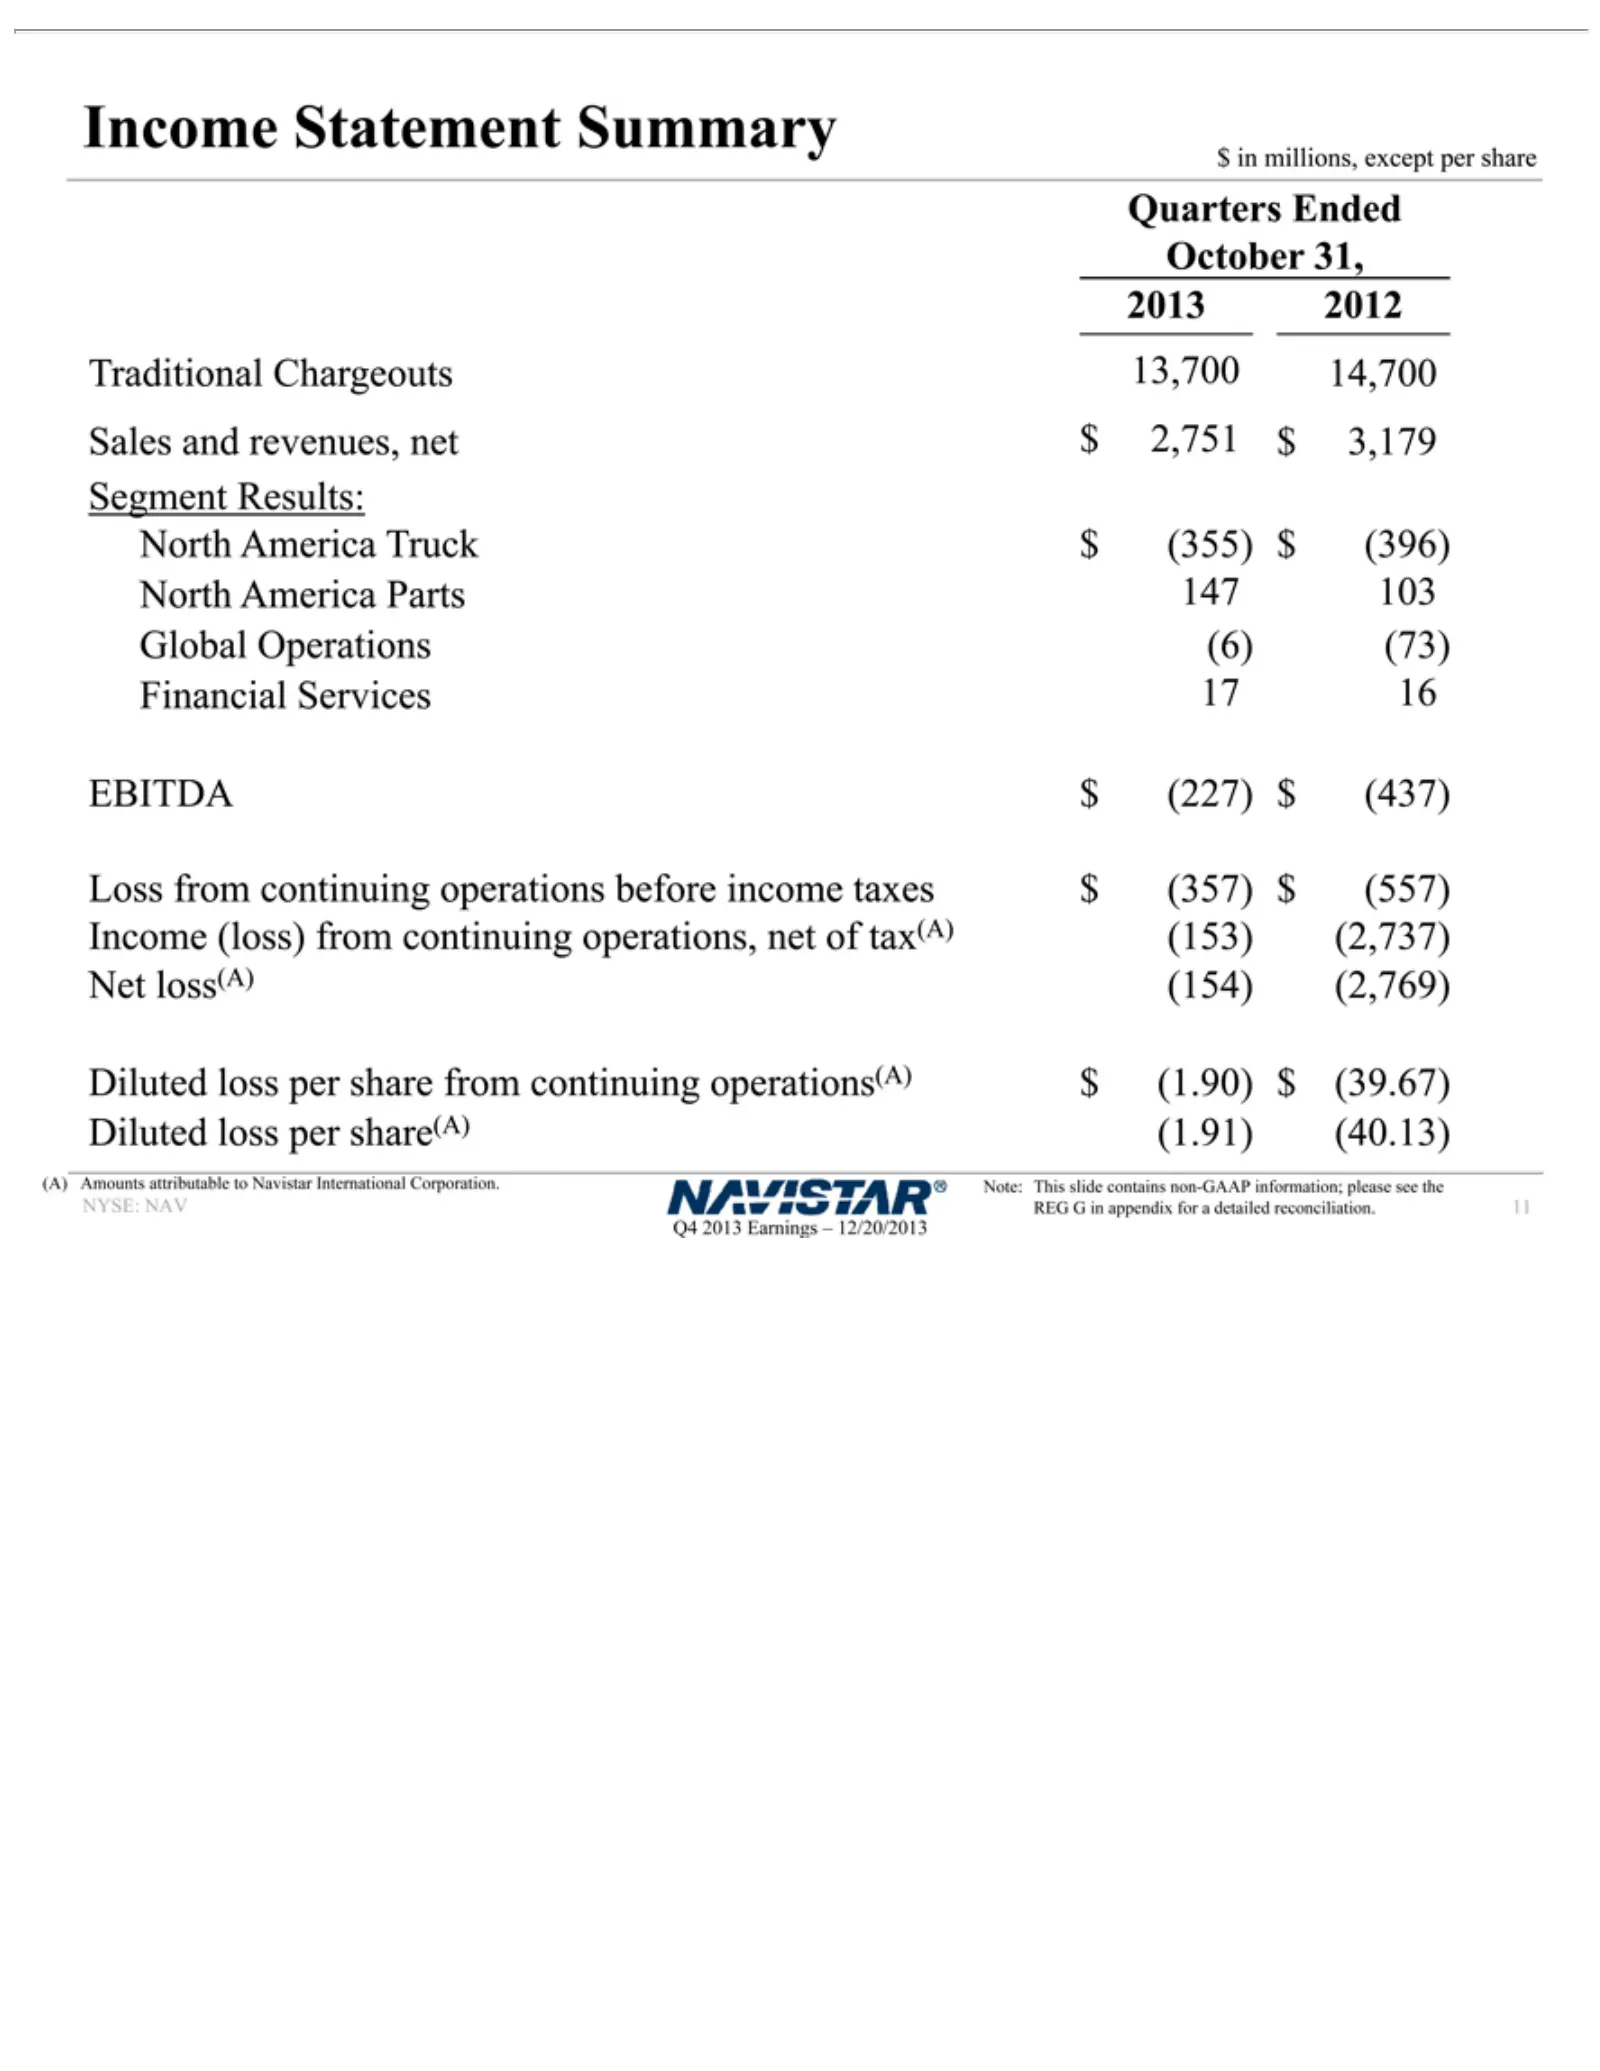
Quarters October 2013 Traditional Sales Segment North Global Financial EBITDA Loss Income Net Diluted (A) Note: NYSE: Q4 11 2013 Amounts loss(A from 2012 and This America Operations NAV Statement (loss) loss 31, Ended Earnings Results: $Services revenues, continuing slide 154 (227) Chargeouts per at
Slide 12: Q4 2013 EBITDA vs. Guidance
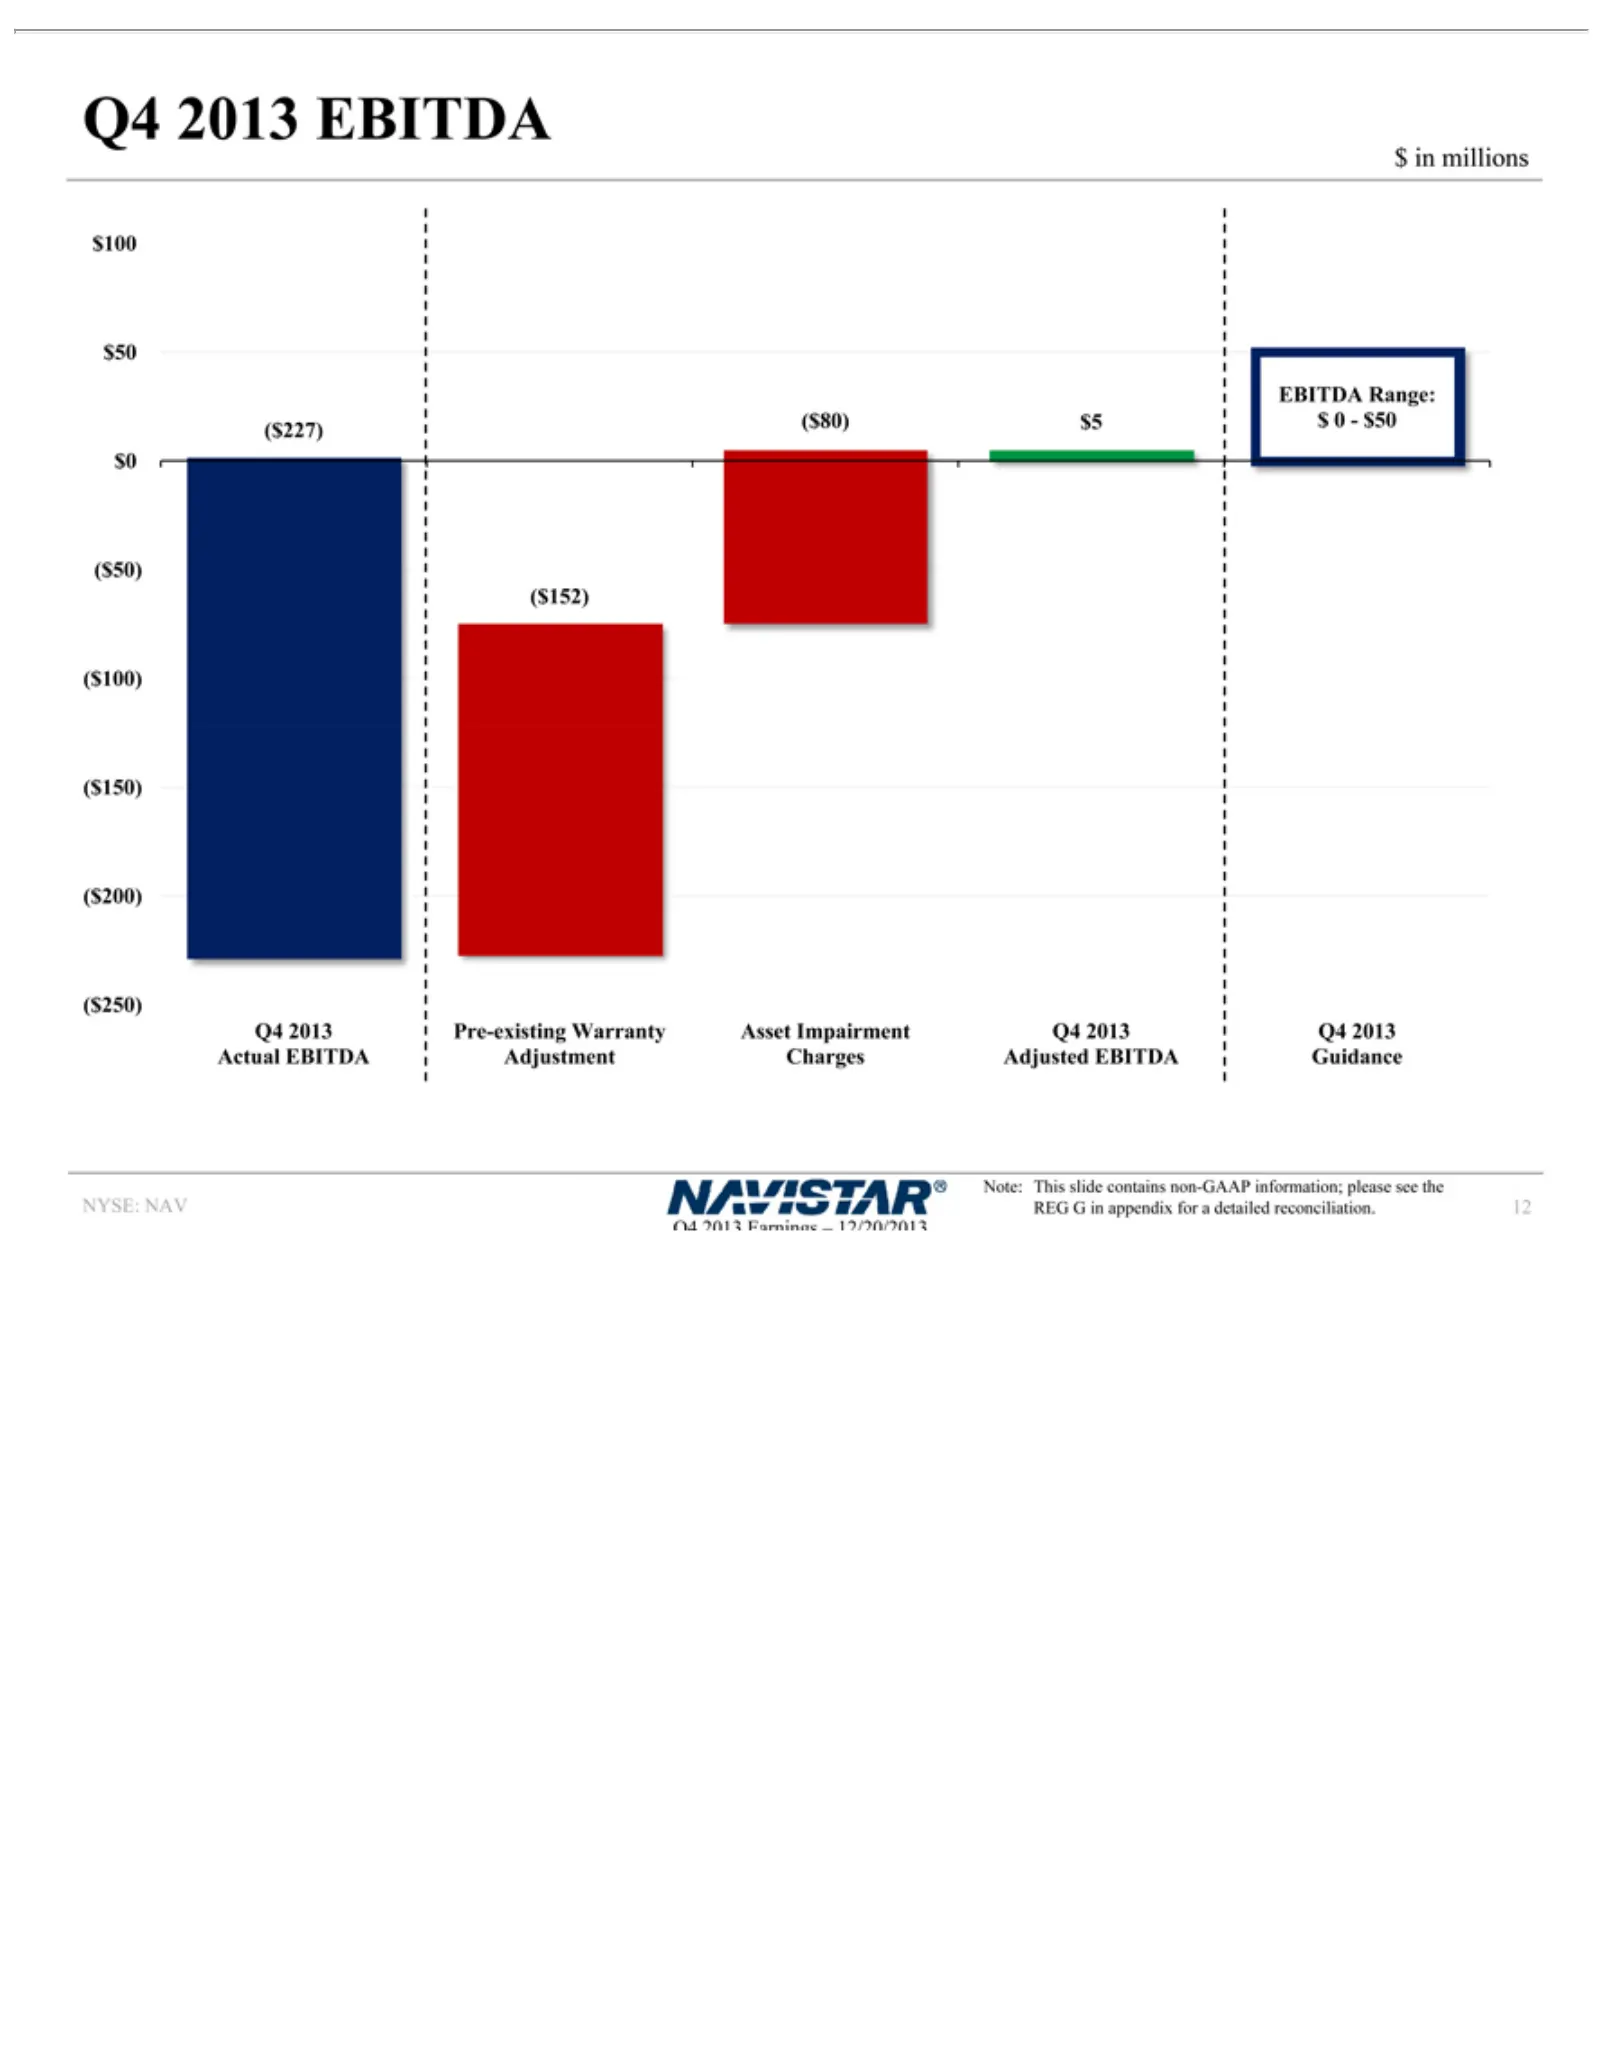
$ in2013 Note: $5 ($80) ($152) ($227) ($250) ($200) ($150) ($100) ($50) $0 $50 $100 Actual Asset Adjusted EBITDA NYSE: $0-$50 Q4 12 Guidance millions This Impairment EBITD NAV EBITDA Earnings Range: EBITED slideApre-existing contains Charges – 12/20/2013 non-GAAP warrantyinformation; please see the
Slide 13: FY 2013 EBITDA Drivers
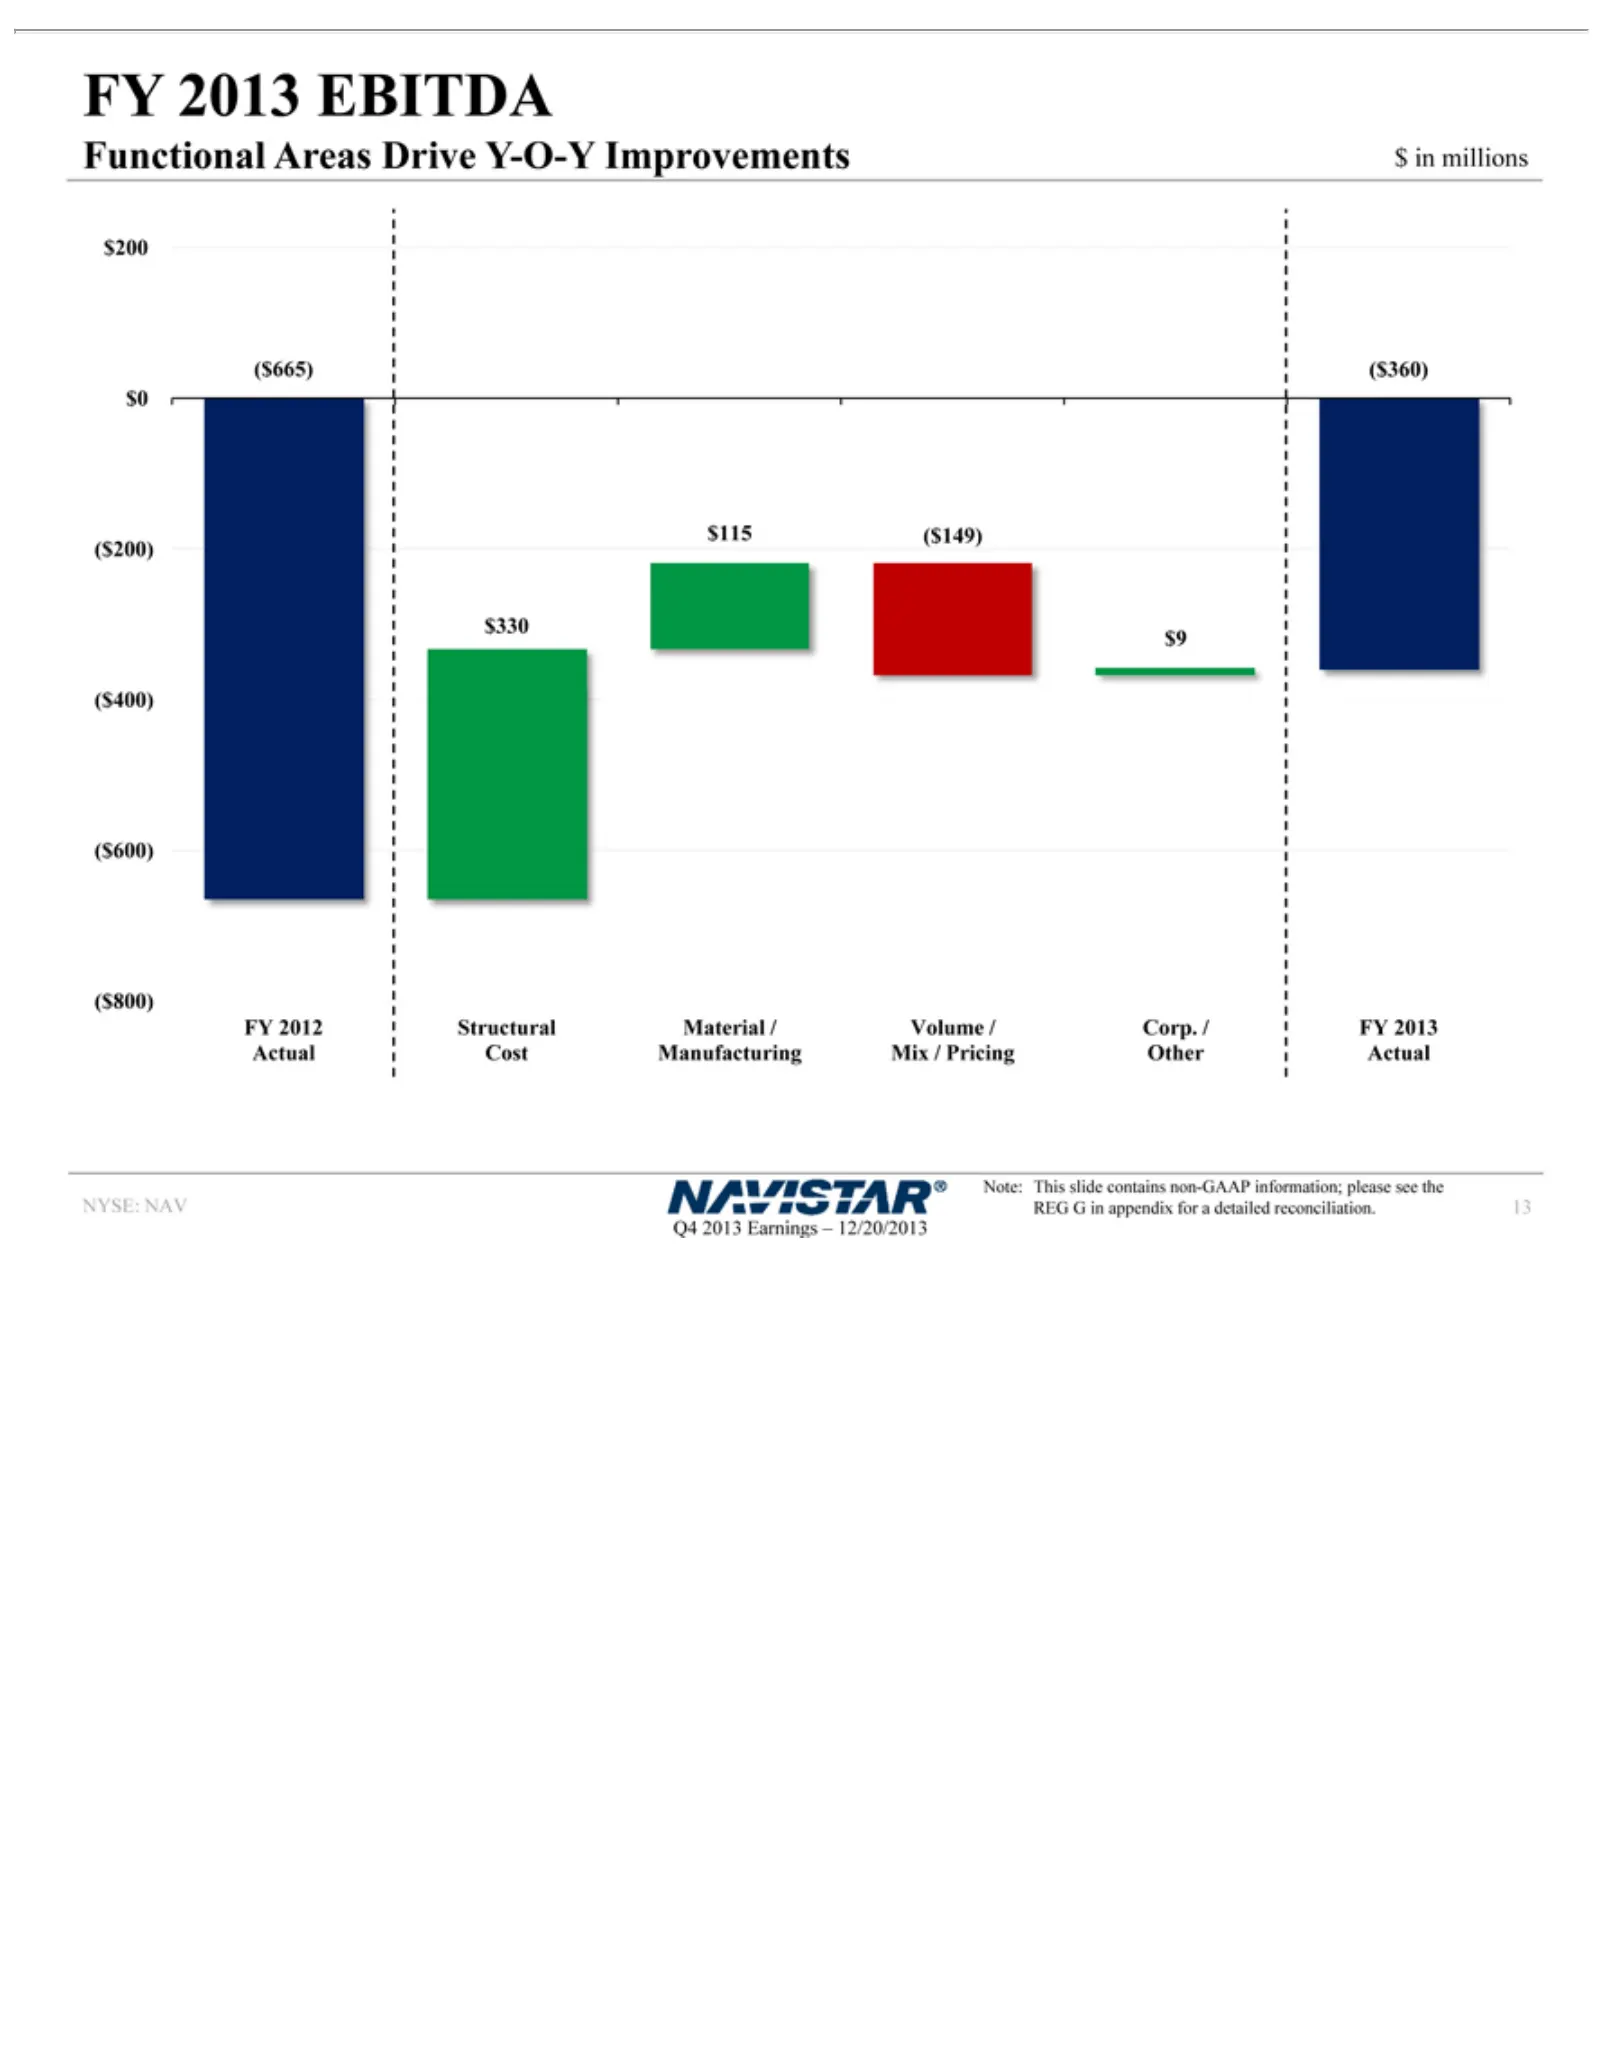
FY 2013NAV Functional Volume/ NYSE: Q4 13 Mix/ Earnings EBITDA Areas Pricing Drive – 12/20/2013 Corp./ Y-O-Y Other Improvements FY 2013 Actual $ in millions Note: This $200slide $0 ($665) contains ($360) non-GAAP ($200)information; $129 $75 ($149) please ($80) see the ($400) REG$330 G in($600) appen
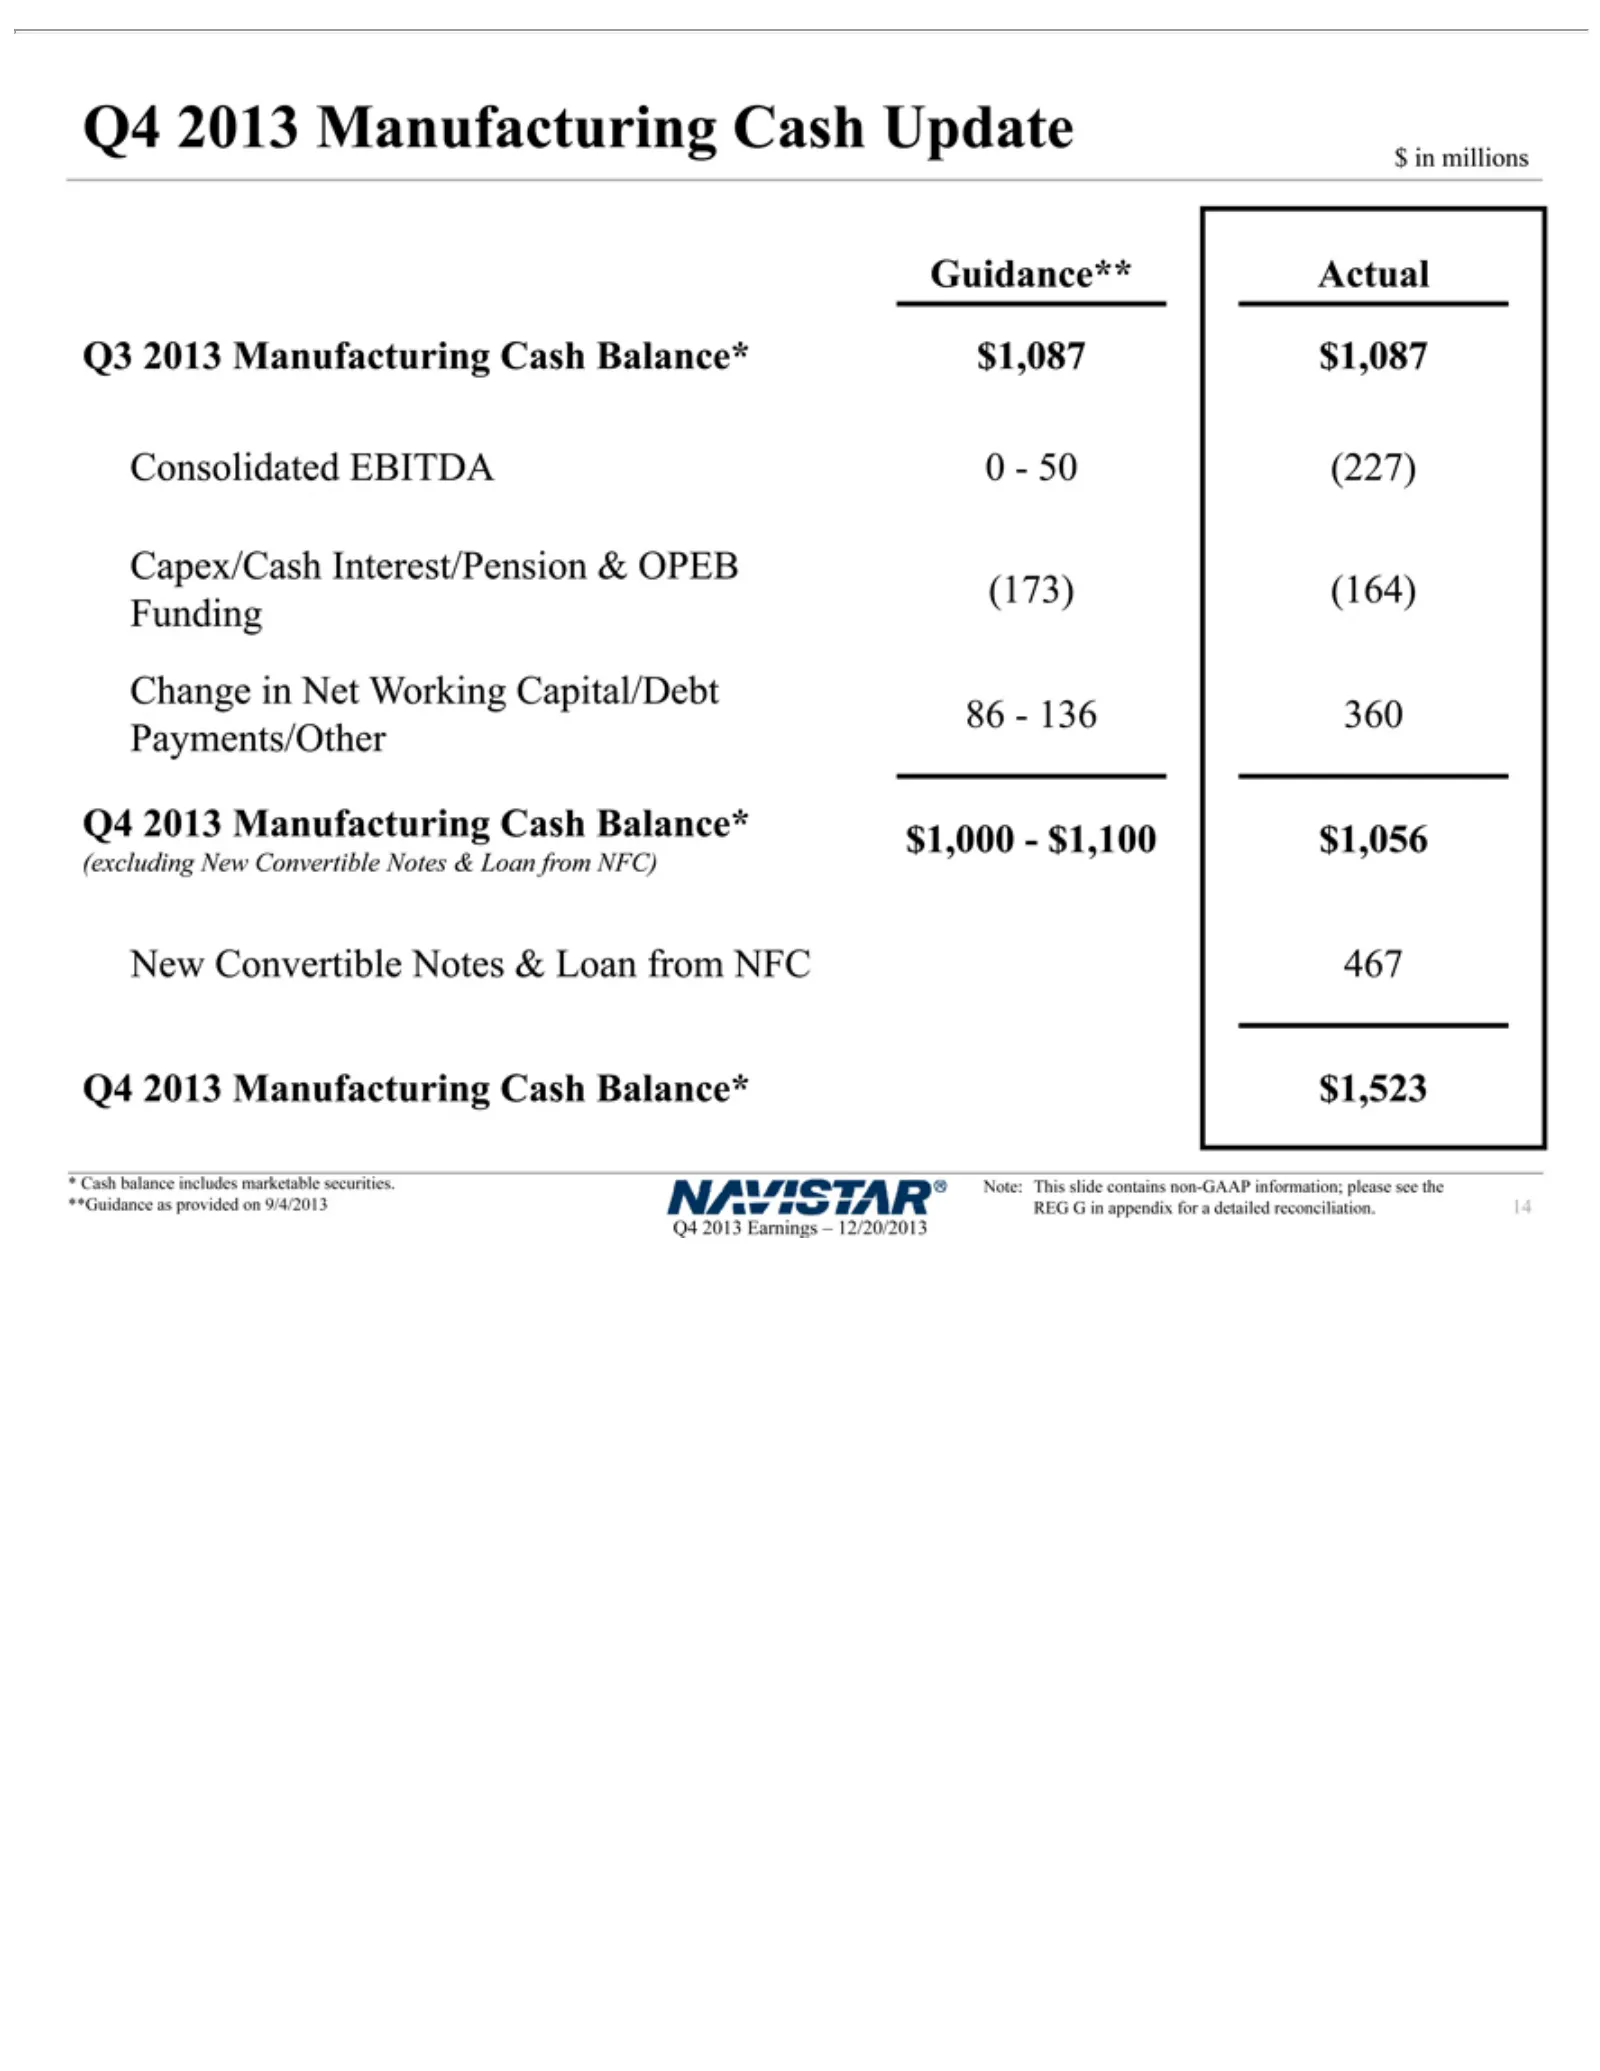
Slide 14: Manufacturing Cash Update
$ in2013 Guidance** Payments/Other Manufacturing Q4 14 millions Manufacturing Earnings Actual * Cash Cash 86—136 –Q3 12/20/2013 balance Balance* 2013 Cash 360includes Manufacturing Update Q4 $1,523 2013marketable Manufacturing Cashsecurities. Balance* Cash$1,087 **Guidance Balance* $1,087 (excluding
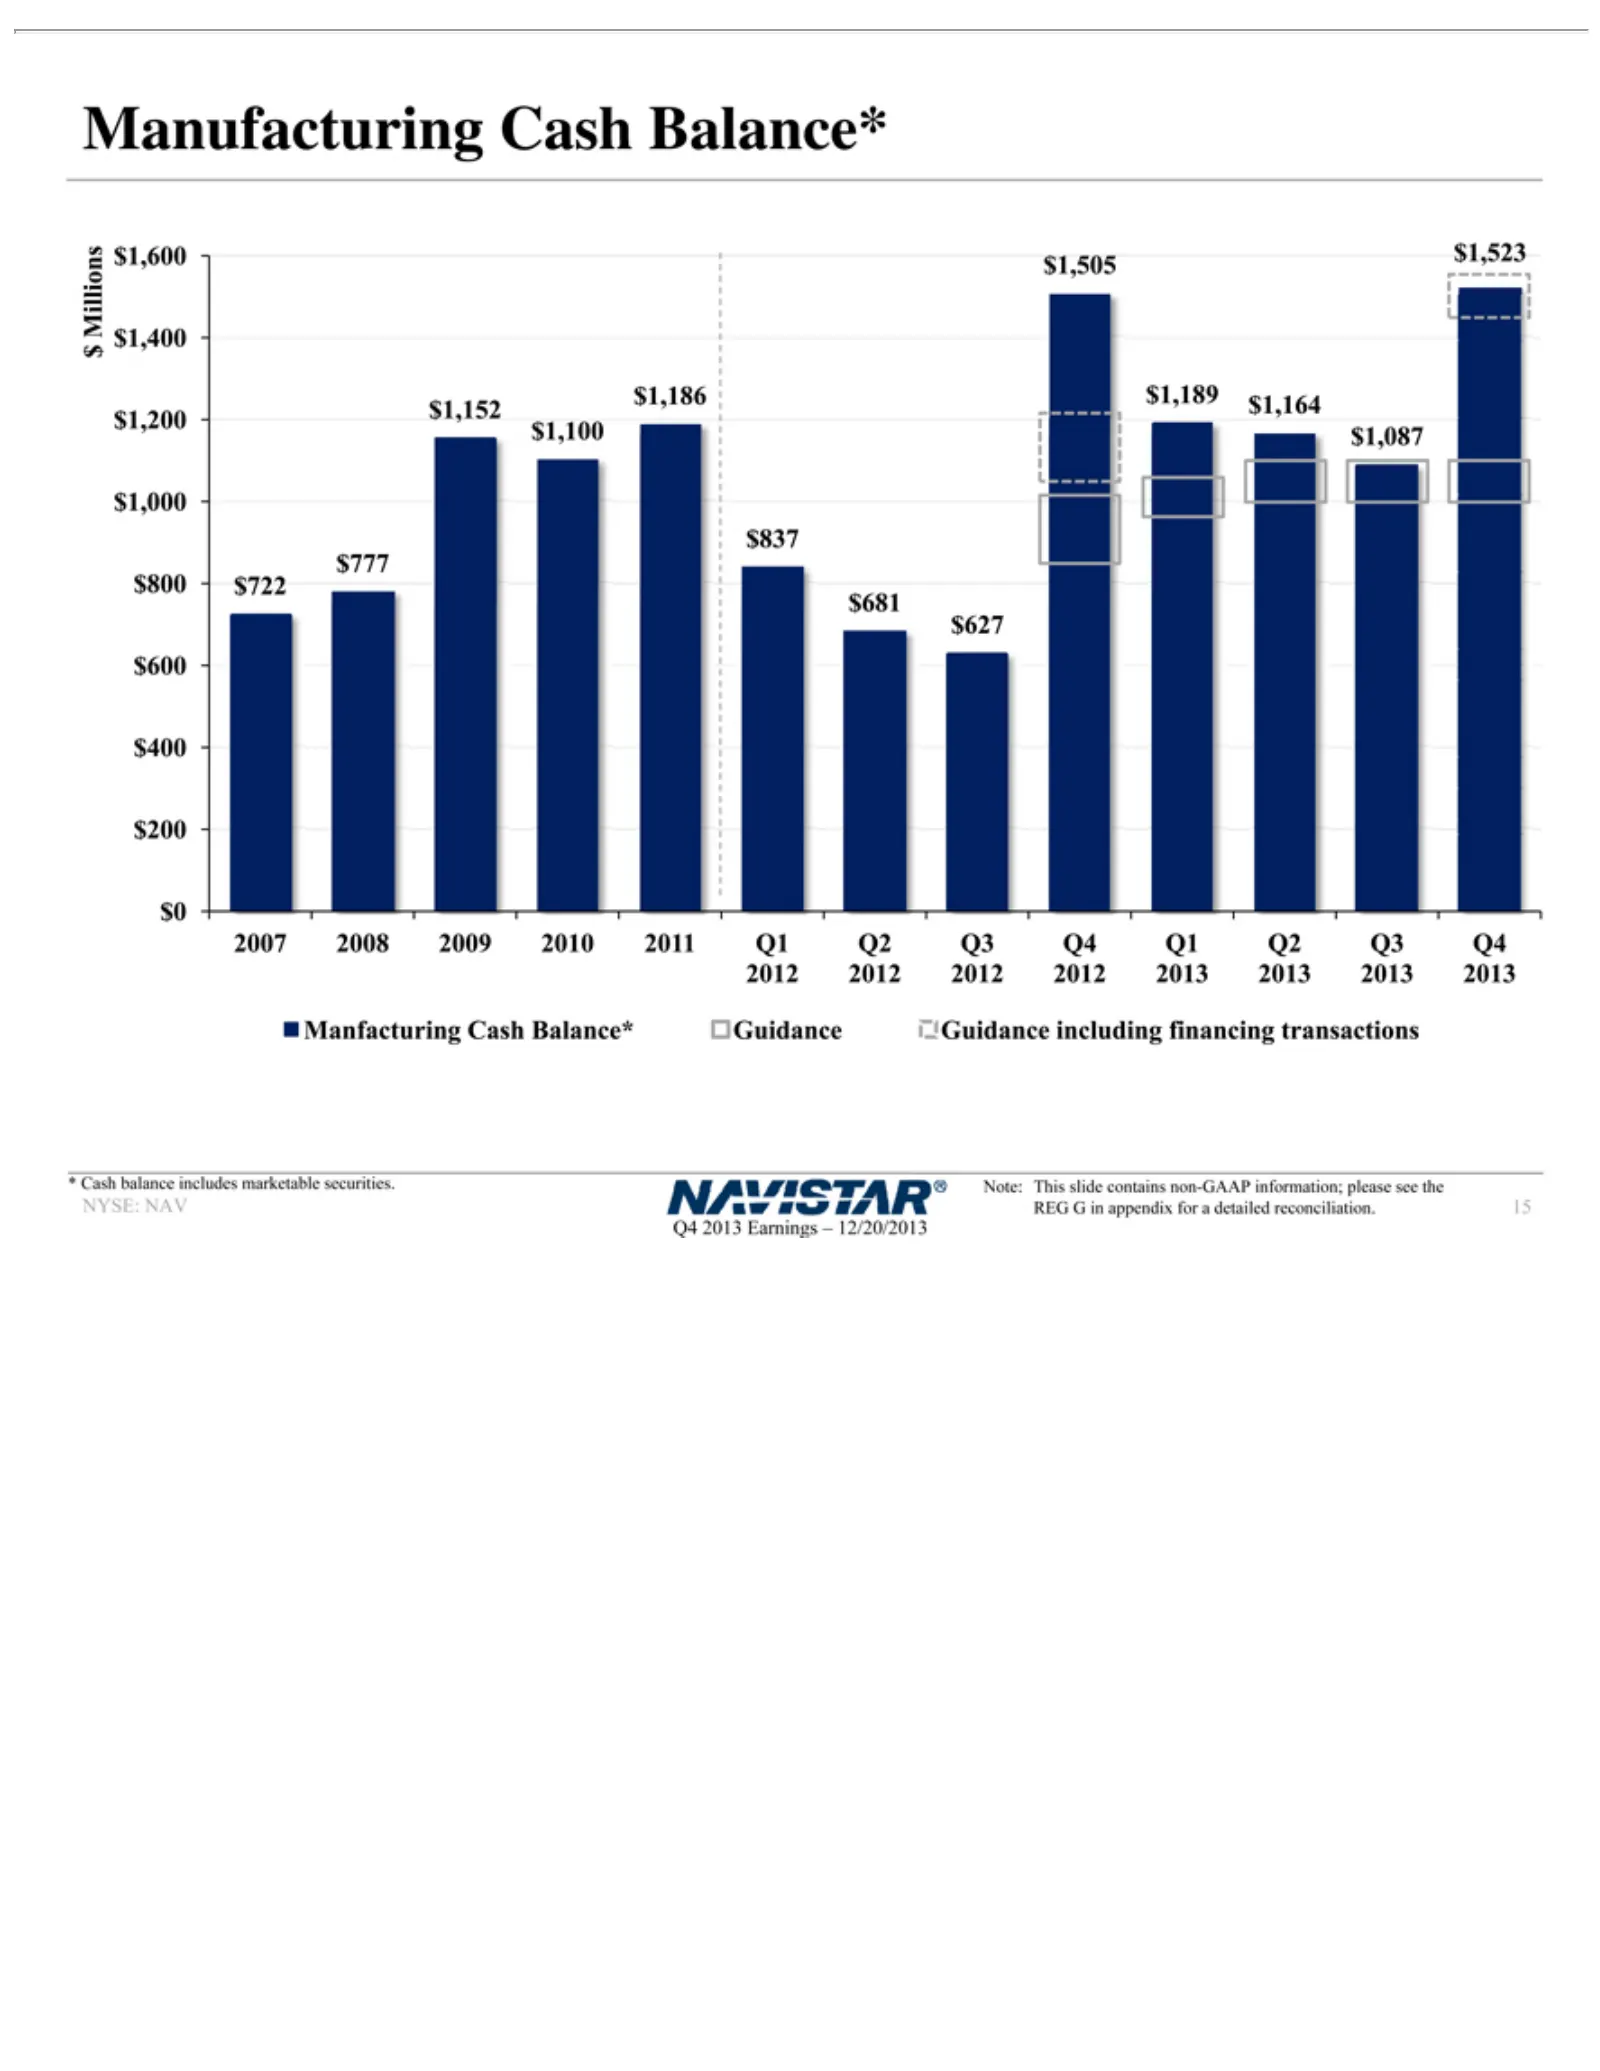
Slide 15: Manufacturing Cash Balance History
2011 2010 2009 2008 2007 $1,523 $1,087 $1,164 $1,189 $1,505 $627 $681 $837 $1,186 $1,100 $1,152 $777 $722 $0 $200 $400 $600 $800 $1,000 $1,200 $1,400 $1,600 $Millions Q1 Q2 Q3 Manufacturing *Guidance Note: NYSE: Q4 15Cash 2012 2014 2013 This balance NAV Earnings including slideCash includes contains
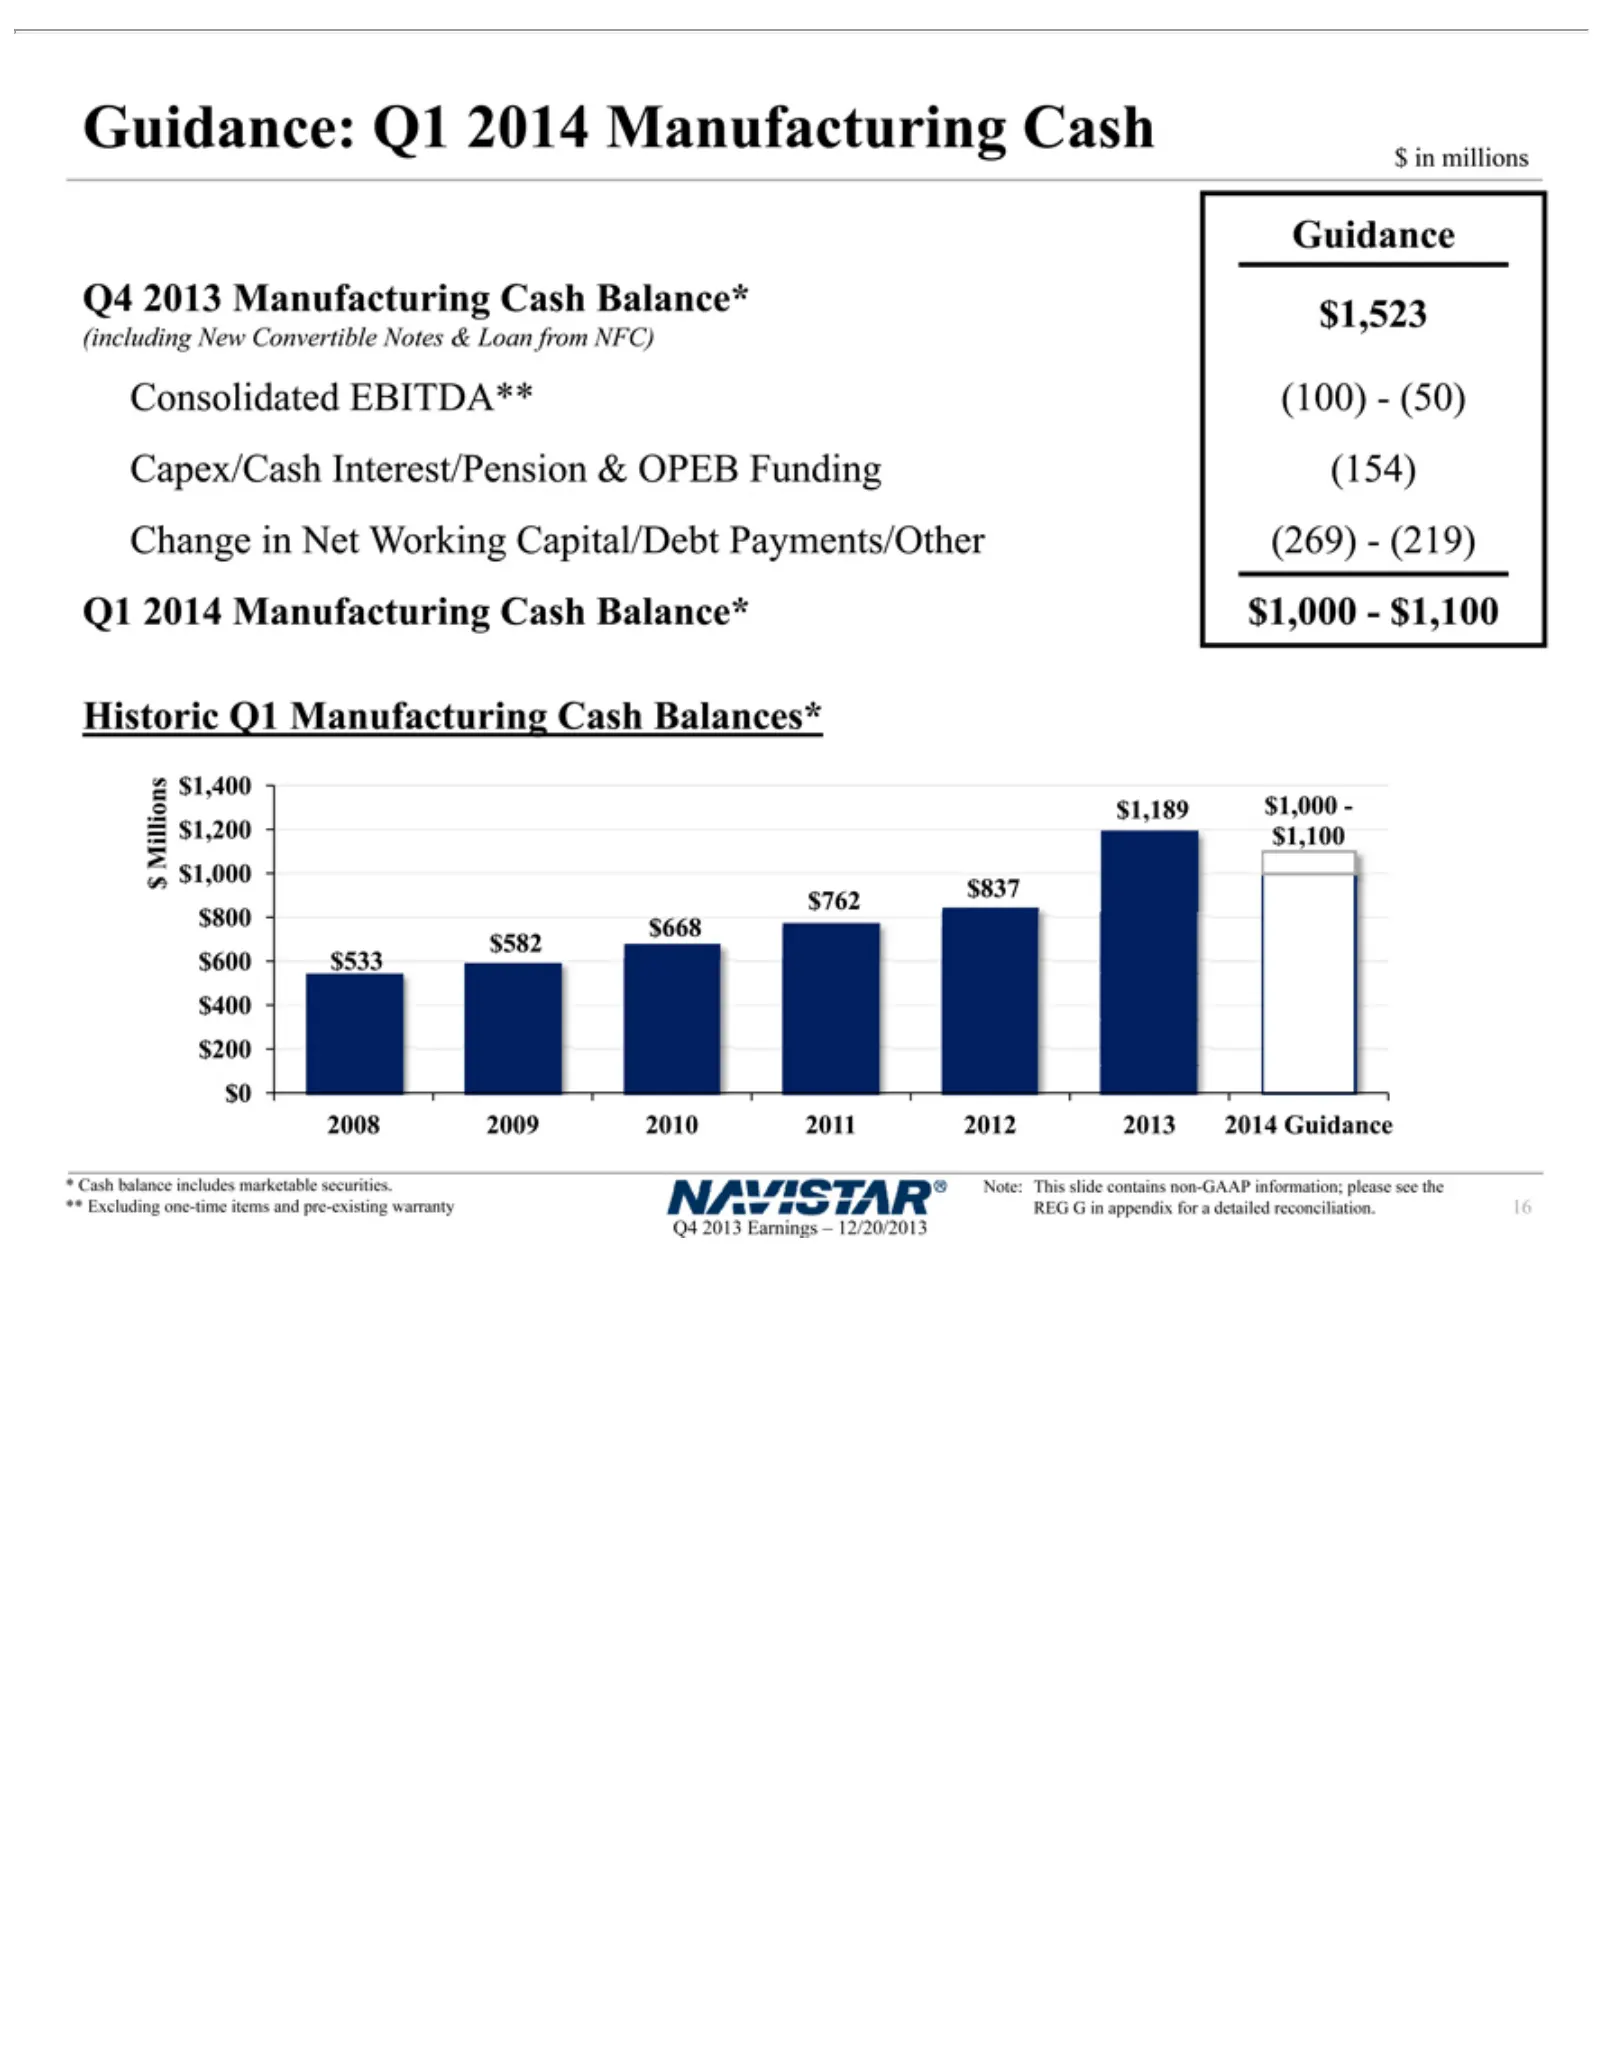
Slide 16: 2014 Manufacturing Cash Guidance
Guidance: (including Consolidated Capex/Cash Change Q1 (100) $1,523 Guidance (269) (154) $Historic 2014 2013 2012 2011 2010 2009 2008 $1,000-$1,100 $1,189 $837 $762 $668 $582 $533 $0 $200 $400 $600 $800 $1,000 $1,200 *$1,400 ** Note: REG Q4 16inExcluding Cash 2014 2013 millions Guidance G -This (50)
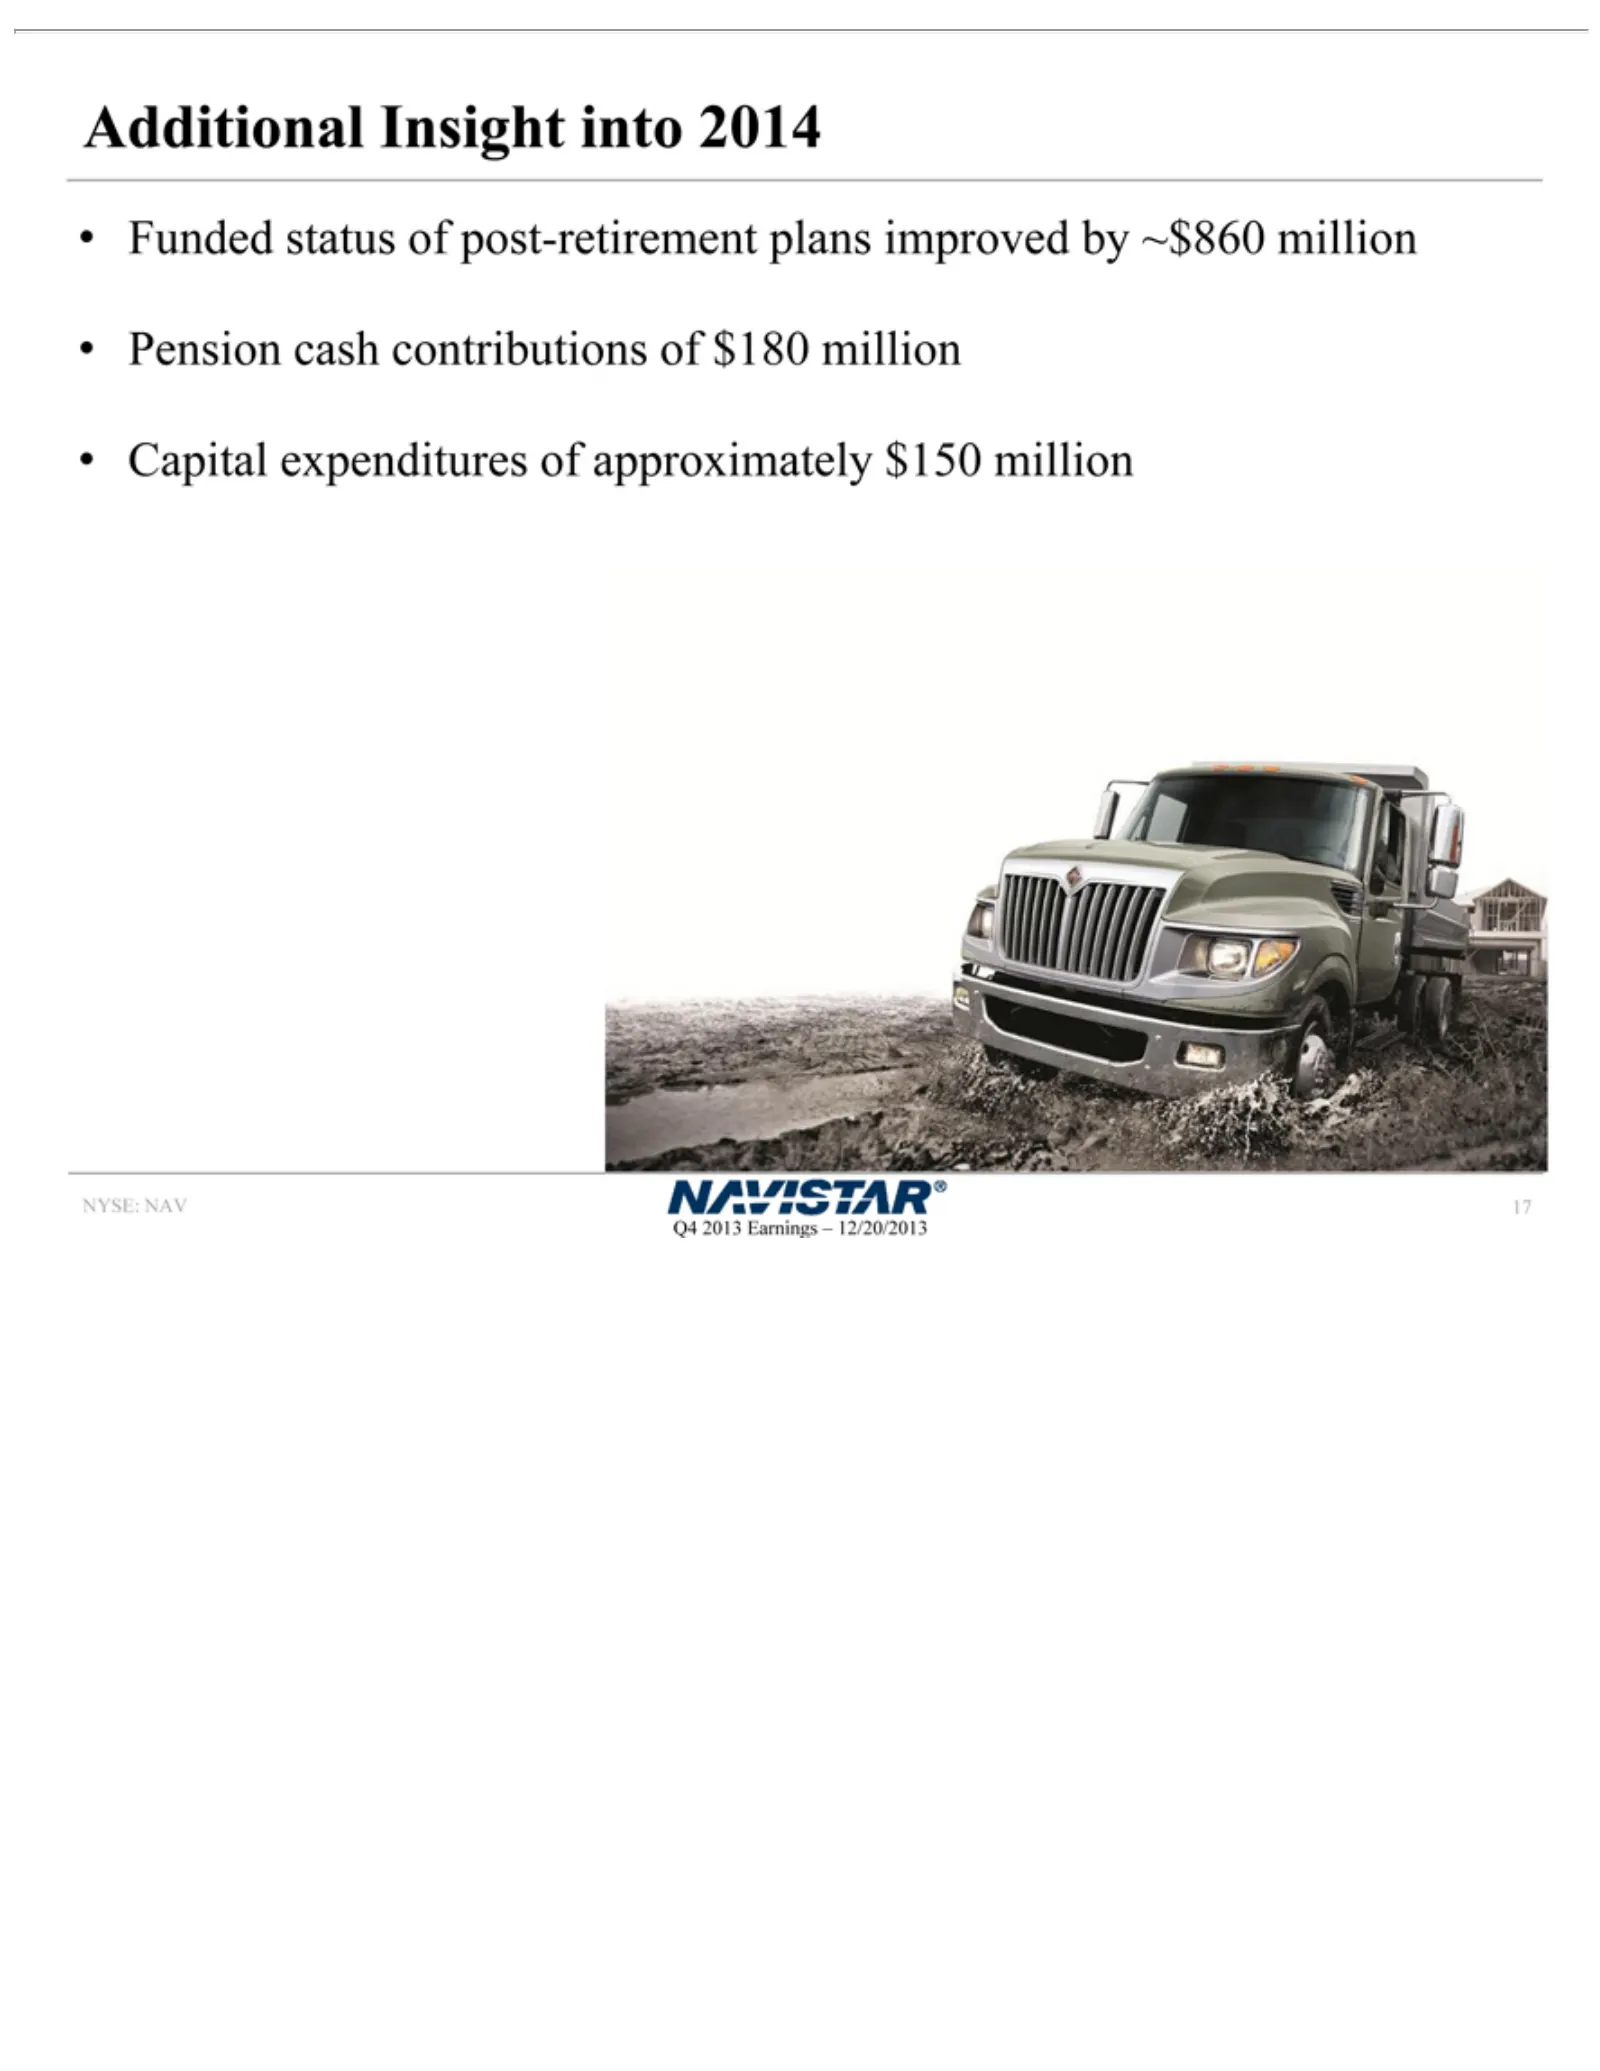
Slide 17: Additional Insight into 2014
Additional Funded NYSE: Q4 17 2013NAV status Earnings Insight of post-retirement –into 12/20/2013 2014 plans improved by ~$860 million Pension cash contributions of $180 million Capital expenditures of approximately $150 million
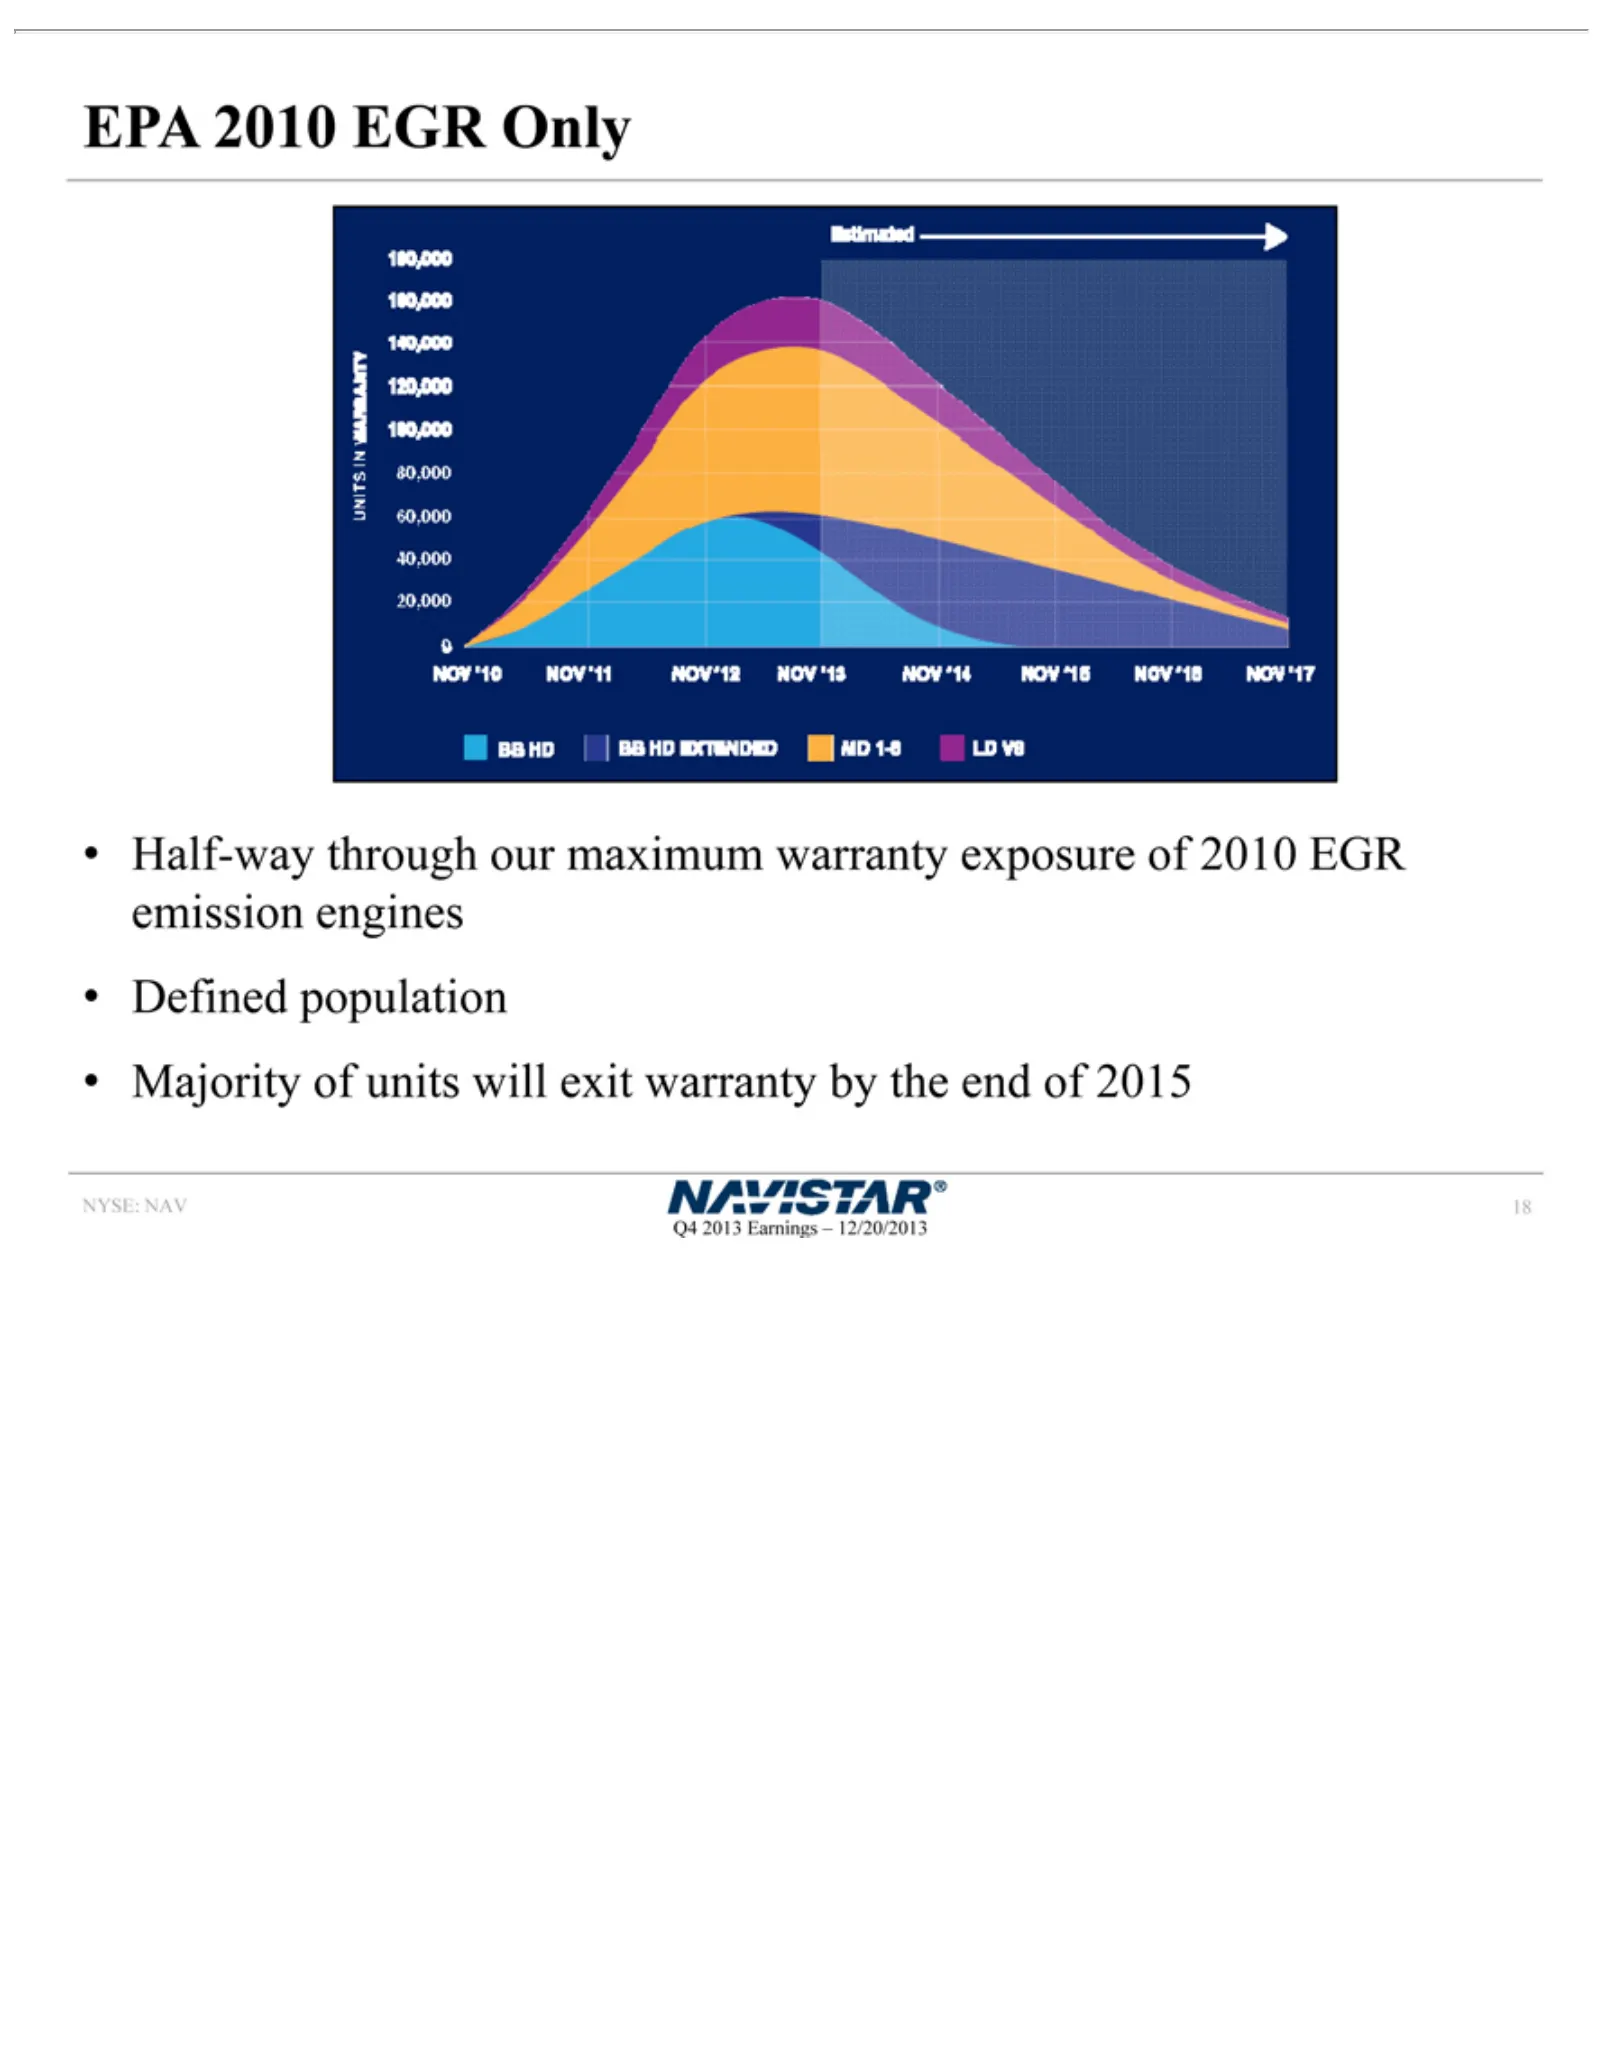
Slide 18: EPA 2010 EGR Only Warranty Exposure
EPA2013 Half-way NYSE: Q4 18 2010 NAV Earnings through EGR Only our – 12/20/2013 maximum warranty exposure of 2010 EGR emission engines Defined population Majority of units will exit warranty by the end of 2015
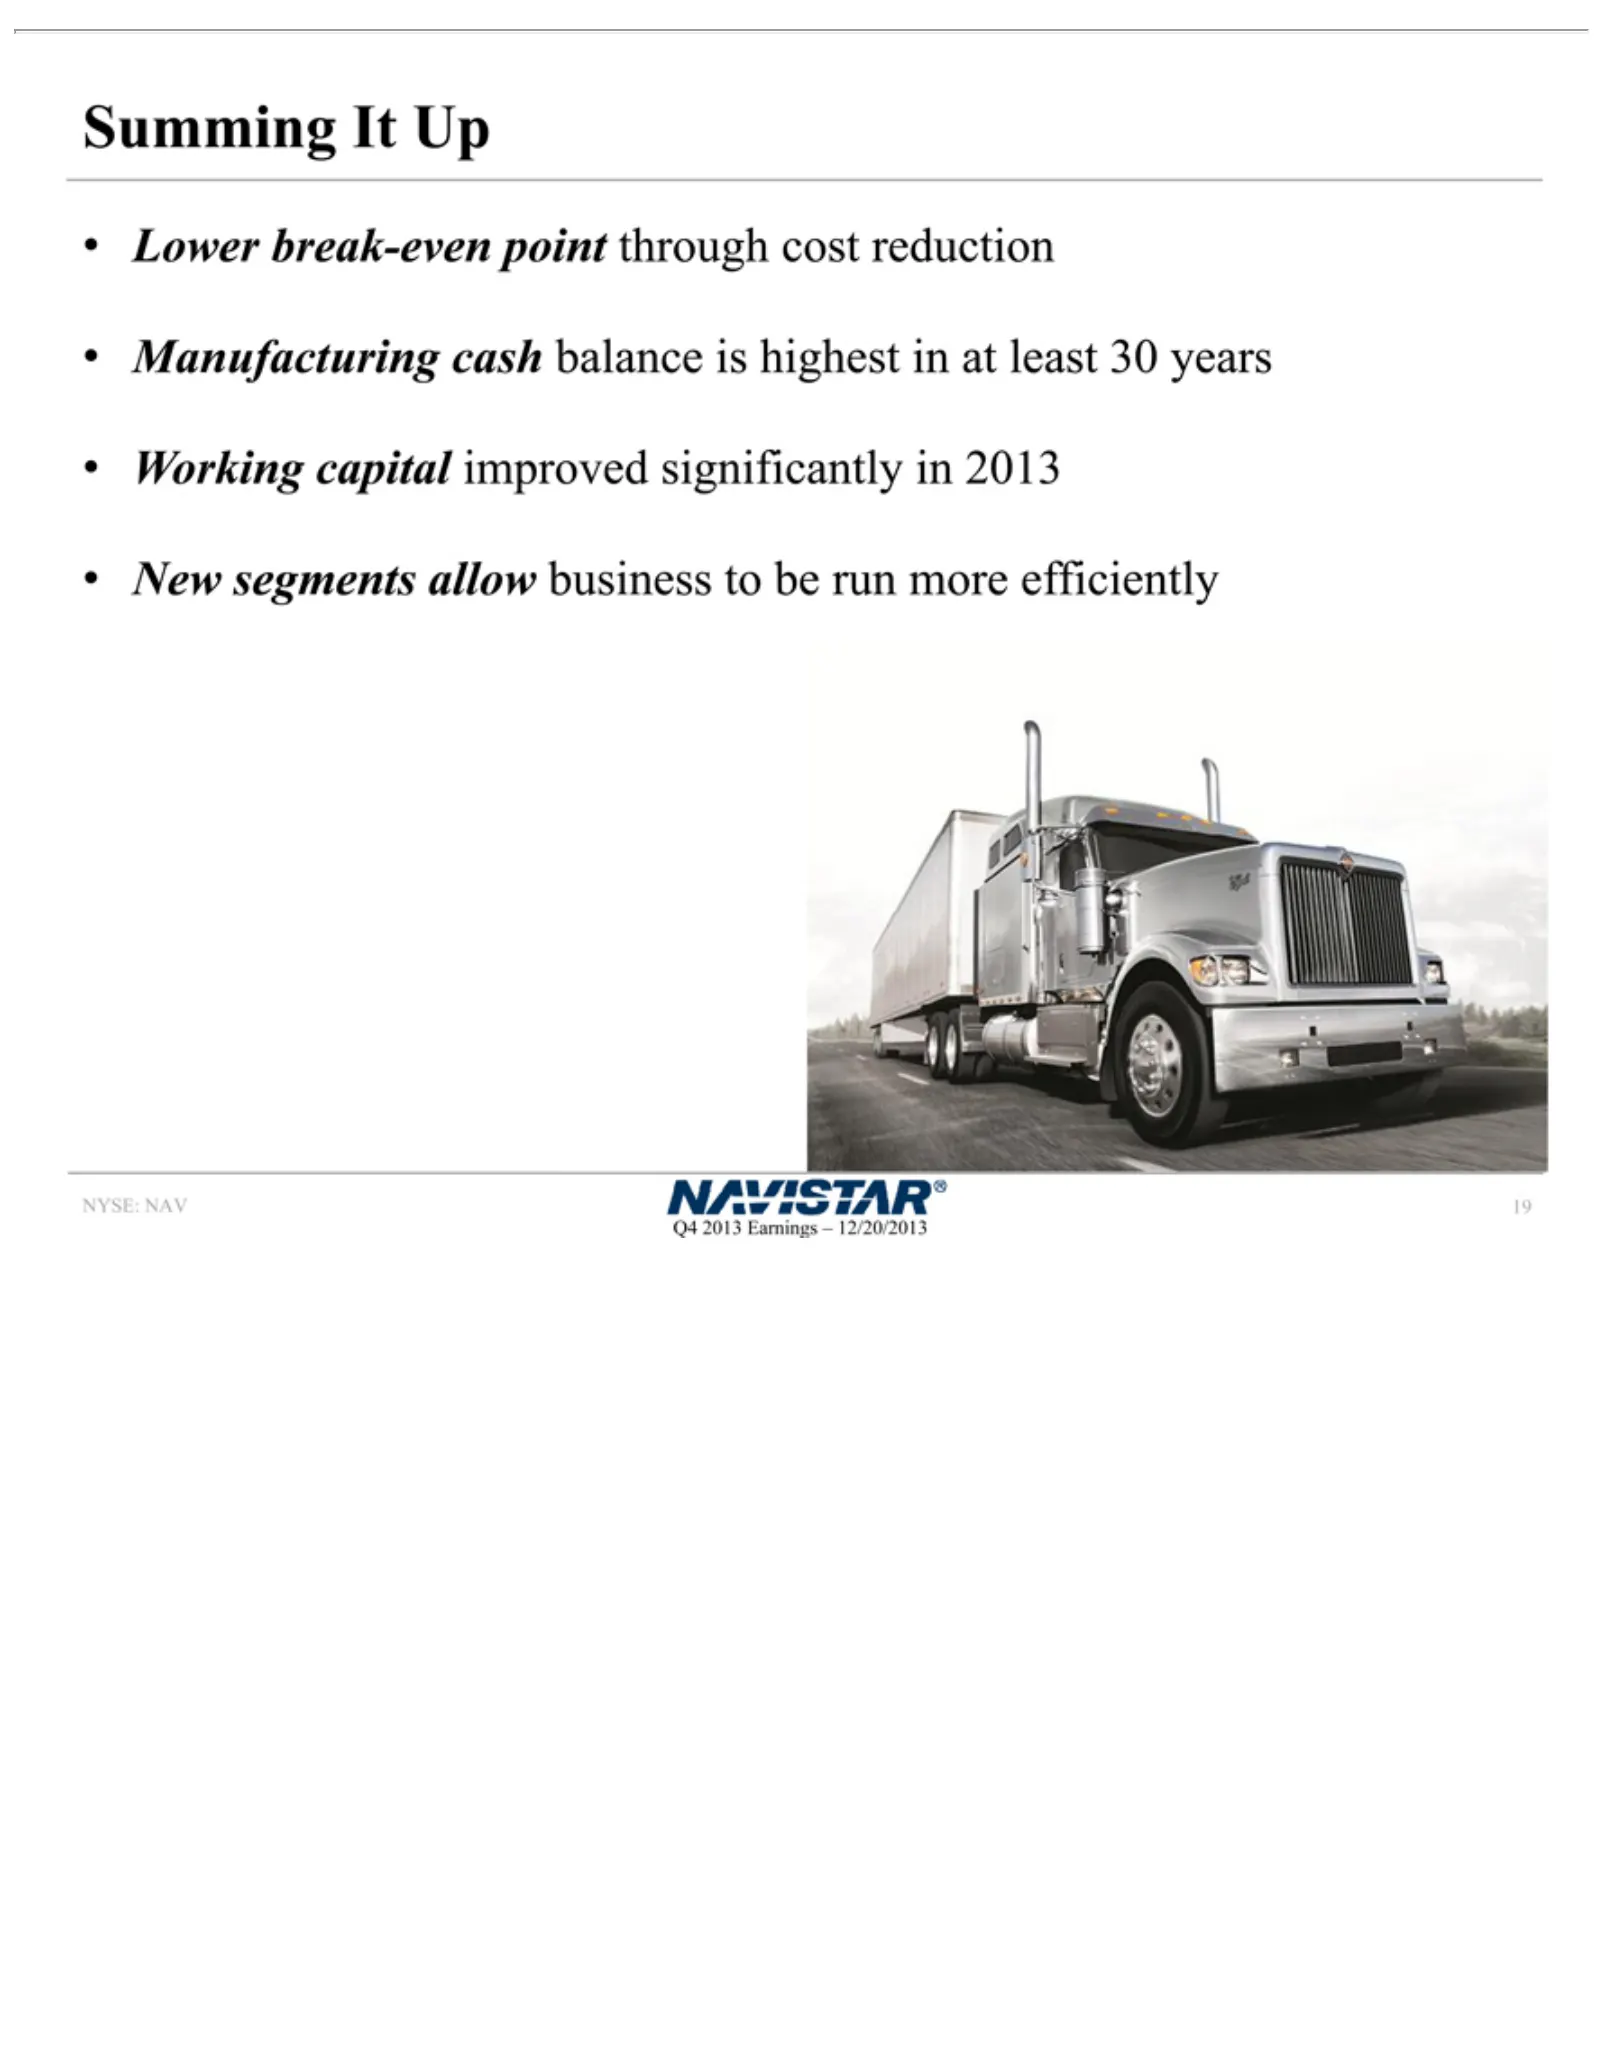
Slide 19: Summing It Up
Summing Lower NYSE: Q4 19 2013 break-even NAV Earnings It Up –point 12/20/2013 through cost reduction Manufacturing cash balance is highest in at least 30 years Working capital improved significantly in 2013 New segments allow business to be run more efficiently
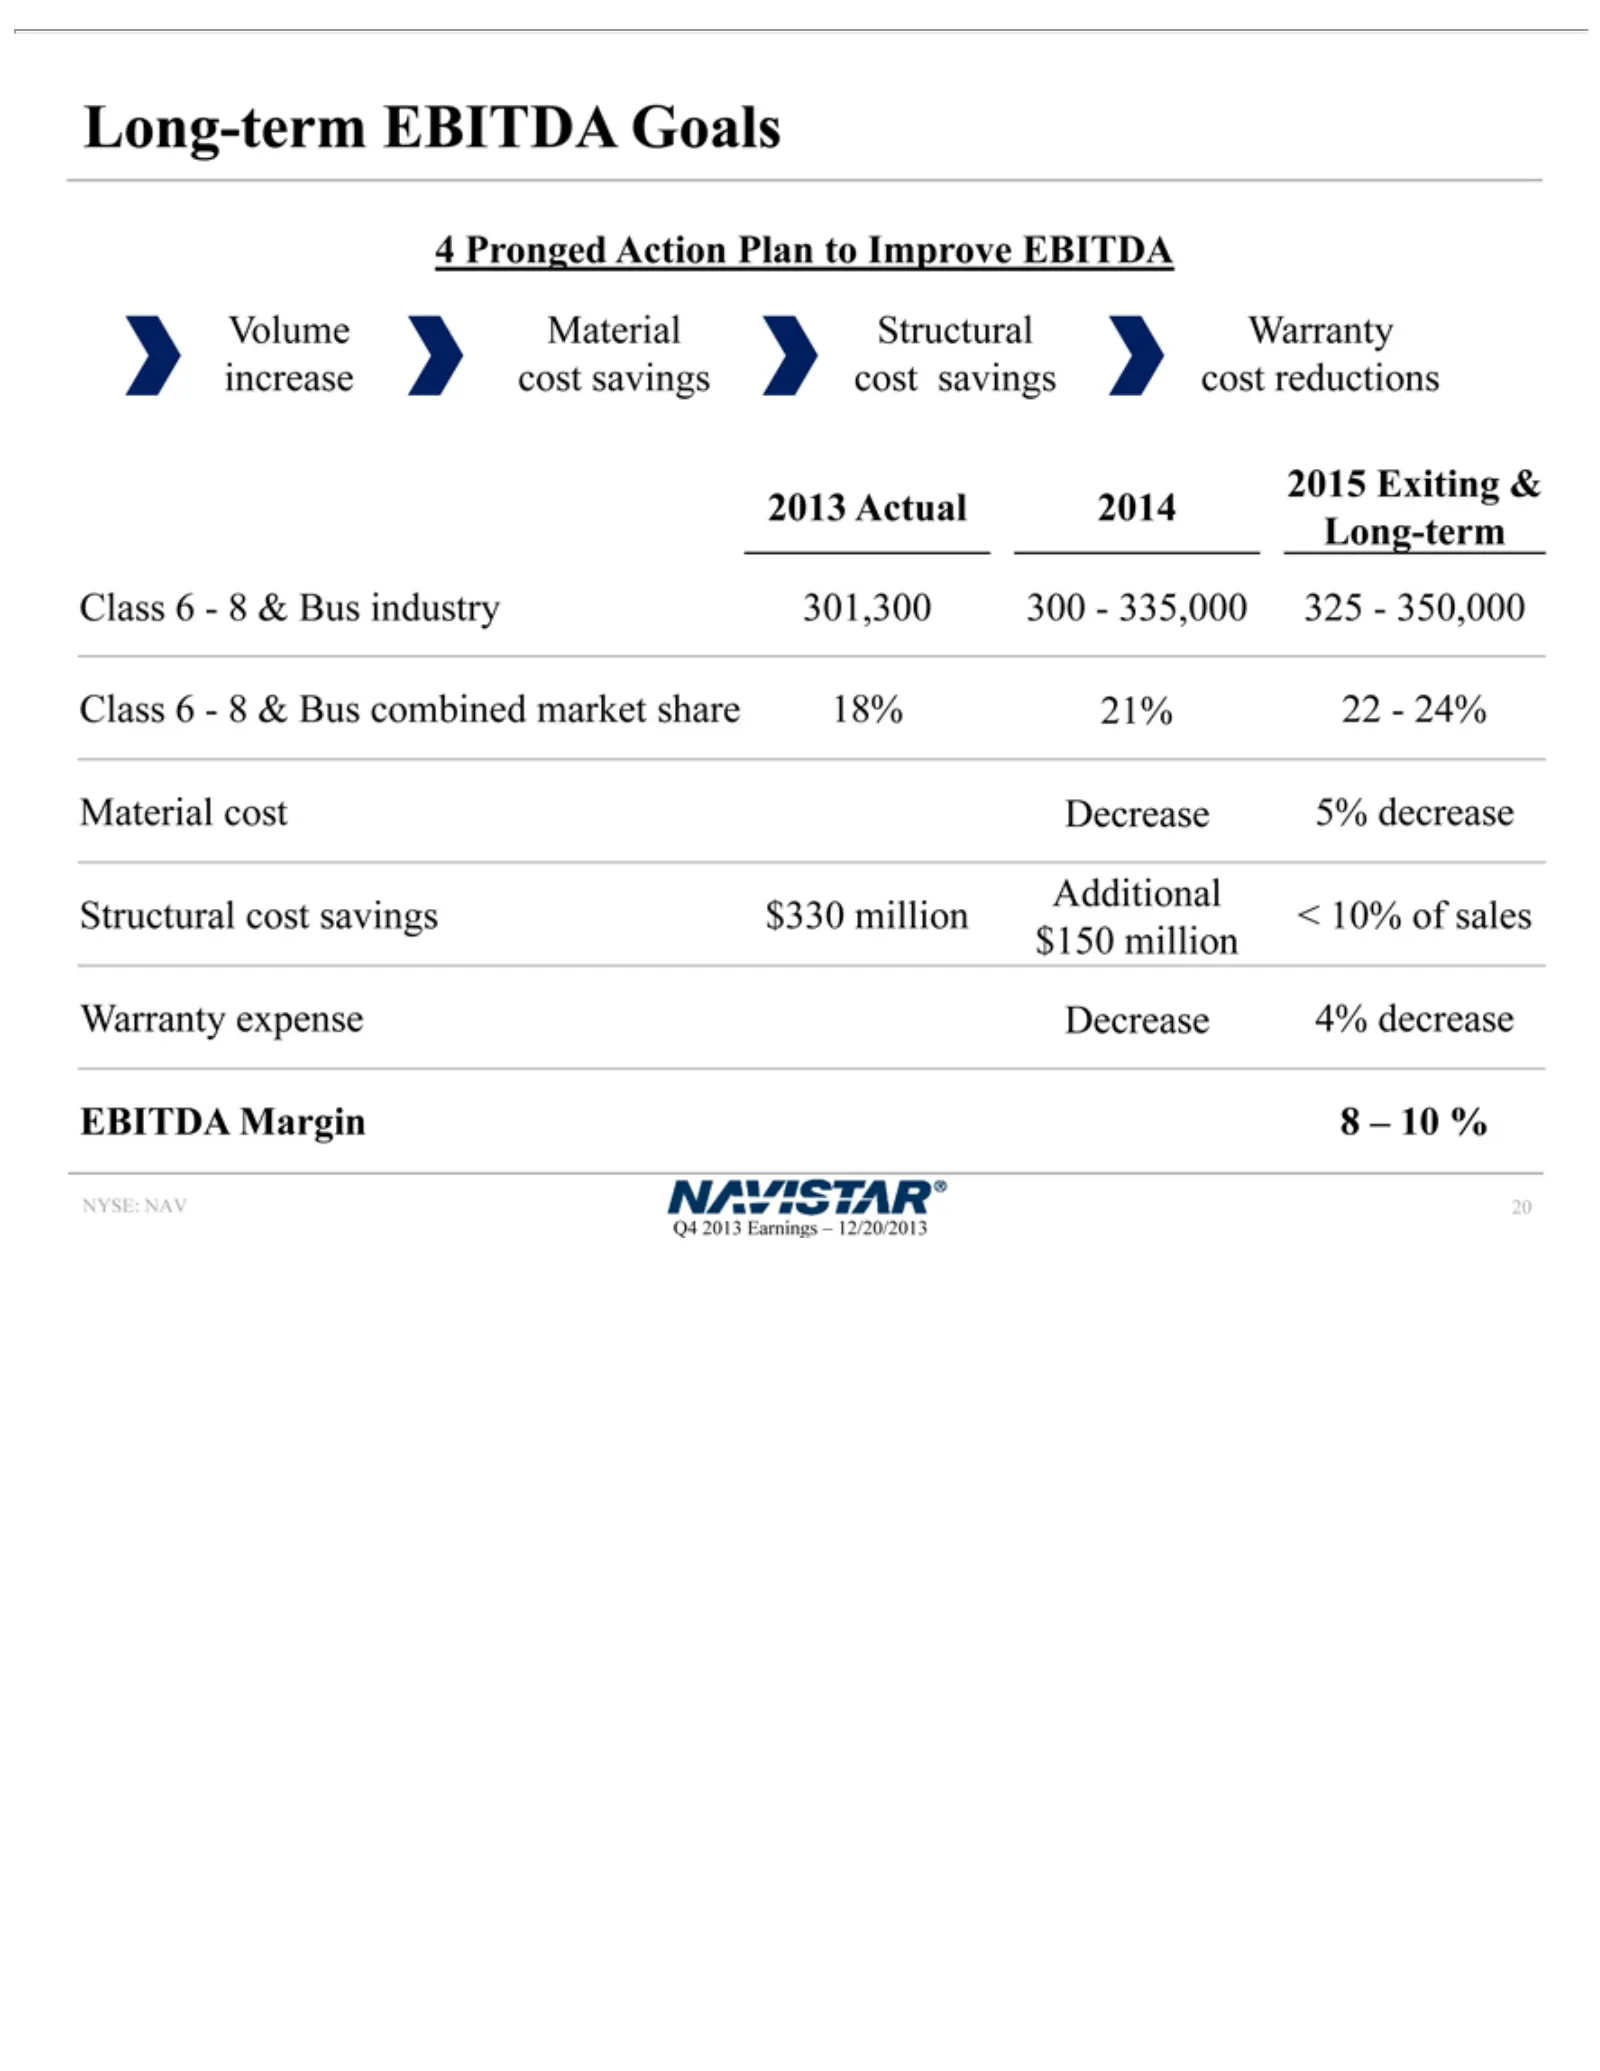
Slide 20: 4-Pronged Action Plan to Improve EBITDA
4Long-term 300—335,000 expense NYSE: Q4 20Pronged 2013NAV Decrease Earnings Action EBITDA 325—350,000 Plan 4% – 12/20/2013 Goals decrease to Improve Class EBITDA EBITDA 6—8 Margin & Bus Volume combined 8 – Material 10 % market Structural share Warranty 18% 21%increase 22—24% cost Material savingscos
Slide 21: Drive to Deliver
DRIVE Jack NYSE:Allen, NAV TO Executive DELIVERVice President & COO
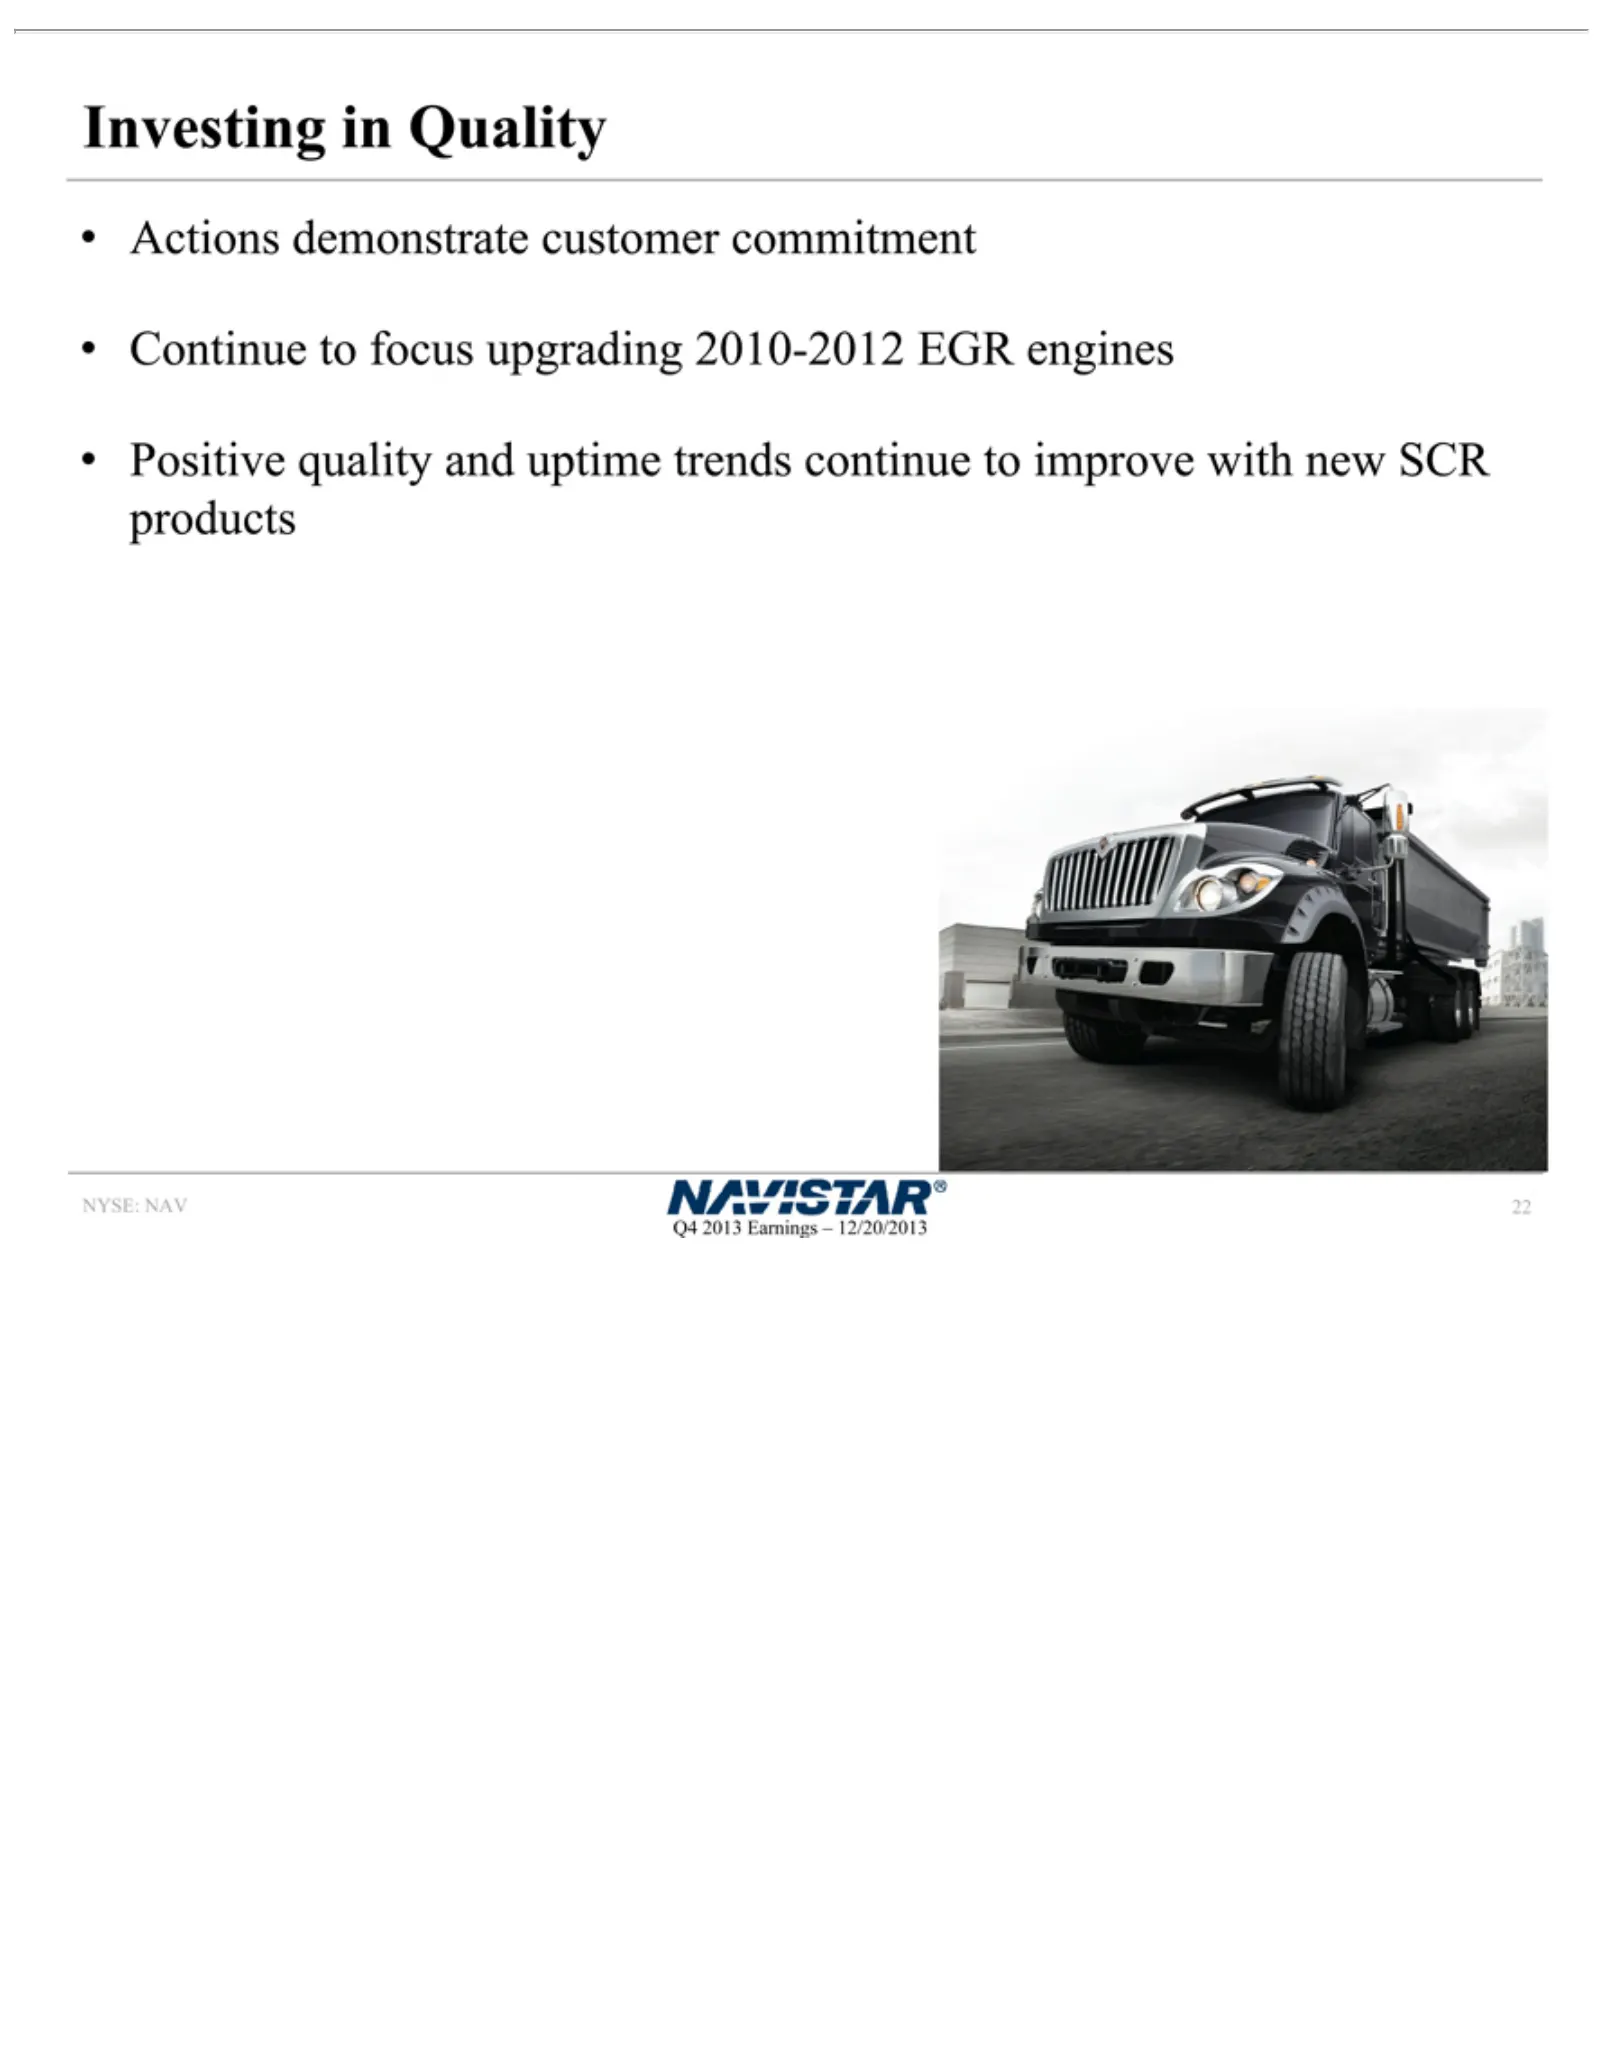
Slide 22: Investing in Quality
Investing Actions NYSE: Q4 22 2013NAV demonstrate Earnings in Quality– 12/20/2013 customer commitment Continue to focus upgrading 2010-2012 EGR engines Positive quality and uptime trends continue to improve with new SCR products
Slide 23: Class 6-8 Industry Trends
Class Mixed NYSE: Q4 23 2013 6—8 signals NAV Earnings Industry in fundamental – Trends 12/20/2013 economic drivers FY 2013 Class 8 industry 211,000, down 8% from 230,000 in 2012 FY 2014 Class 8 industry modest growth to 220,000—230,000
Slide 24: Market Share and Order Trends
Market has NYSE: Q4 24 Class 2013 beenShare NAV all Earnings 6—8 year truck Q4– 12/20/2013 Class orders6/7 up retail 12% from market Q3share 2013;atup 20%; 34%Q4 from order Q4intake 2012 was Q4 backlog 27%, theuphighest 26% from it hasQ4 been 2012 allfor year our traditional markets; Class 8 backlog
Slide 25: Sales Momentum
Sales 15L bus NYSE: Q4 25 2013 orders ISX Momentum NAV 16,000+ Earnings received orders at–since Navistar 12/20/2013 received September since 2013 September Production 2012 began Improvements in December in 2013 fuel economy Completed & uptime transition 13LofSCR on-highway 4,000,000+ Class test 8 p
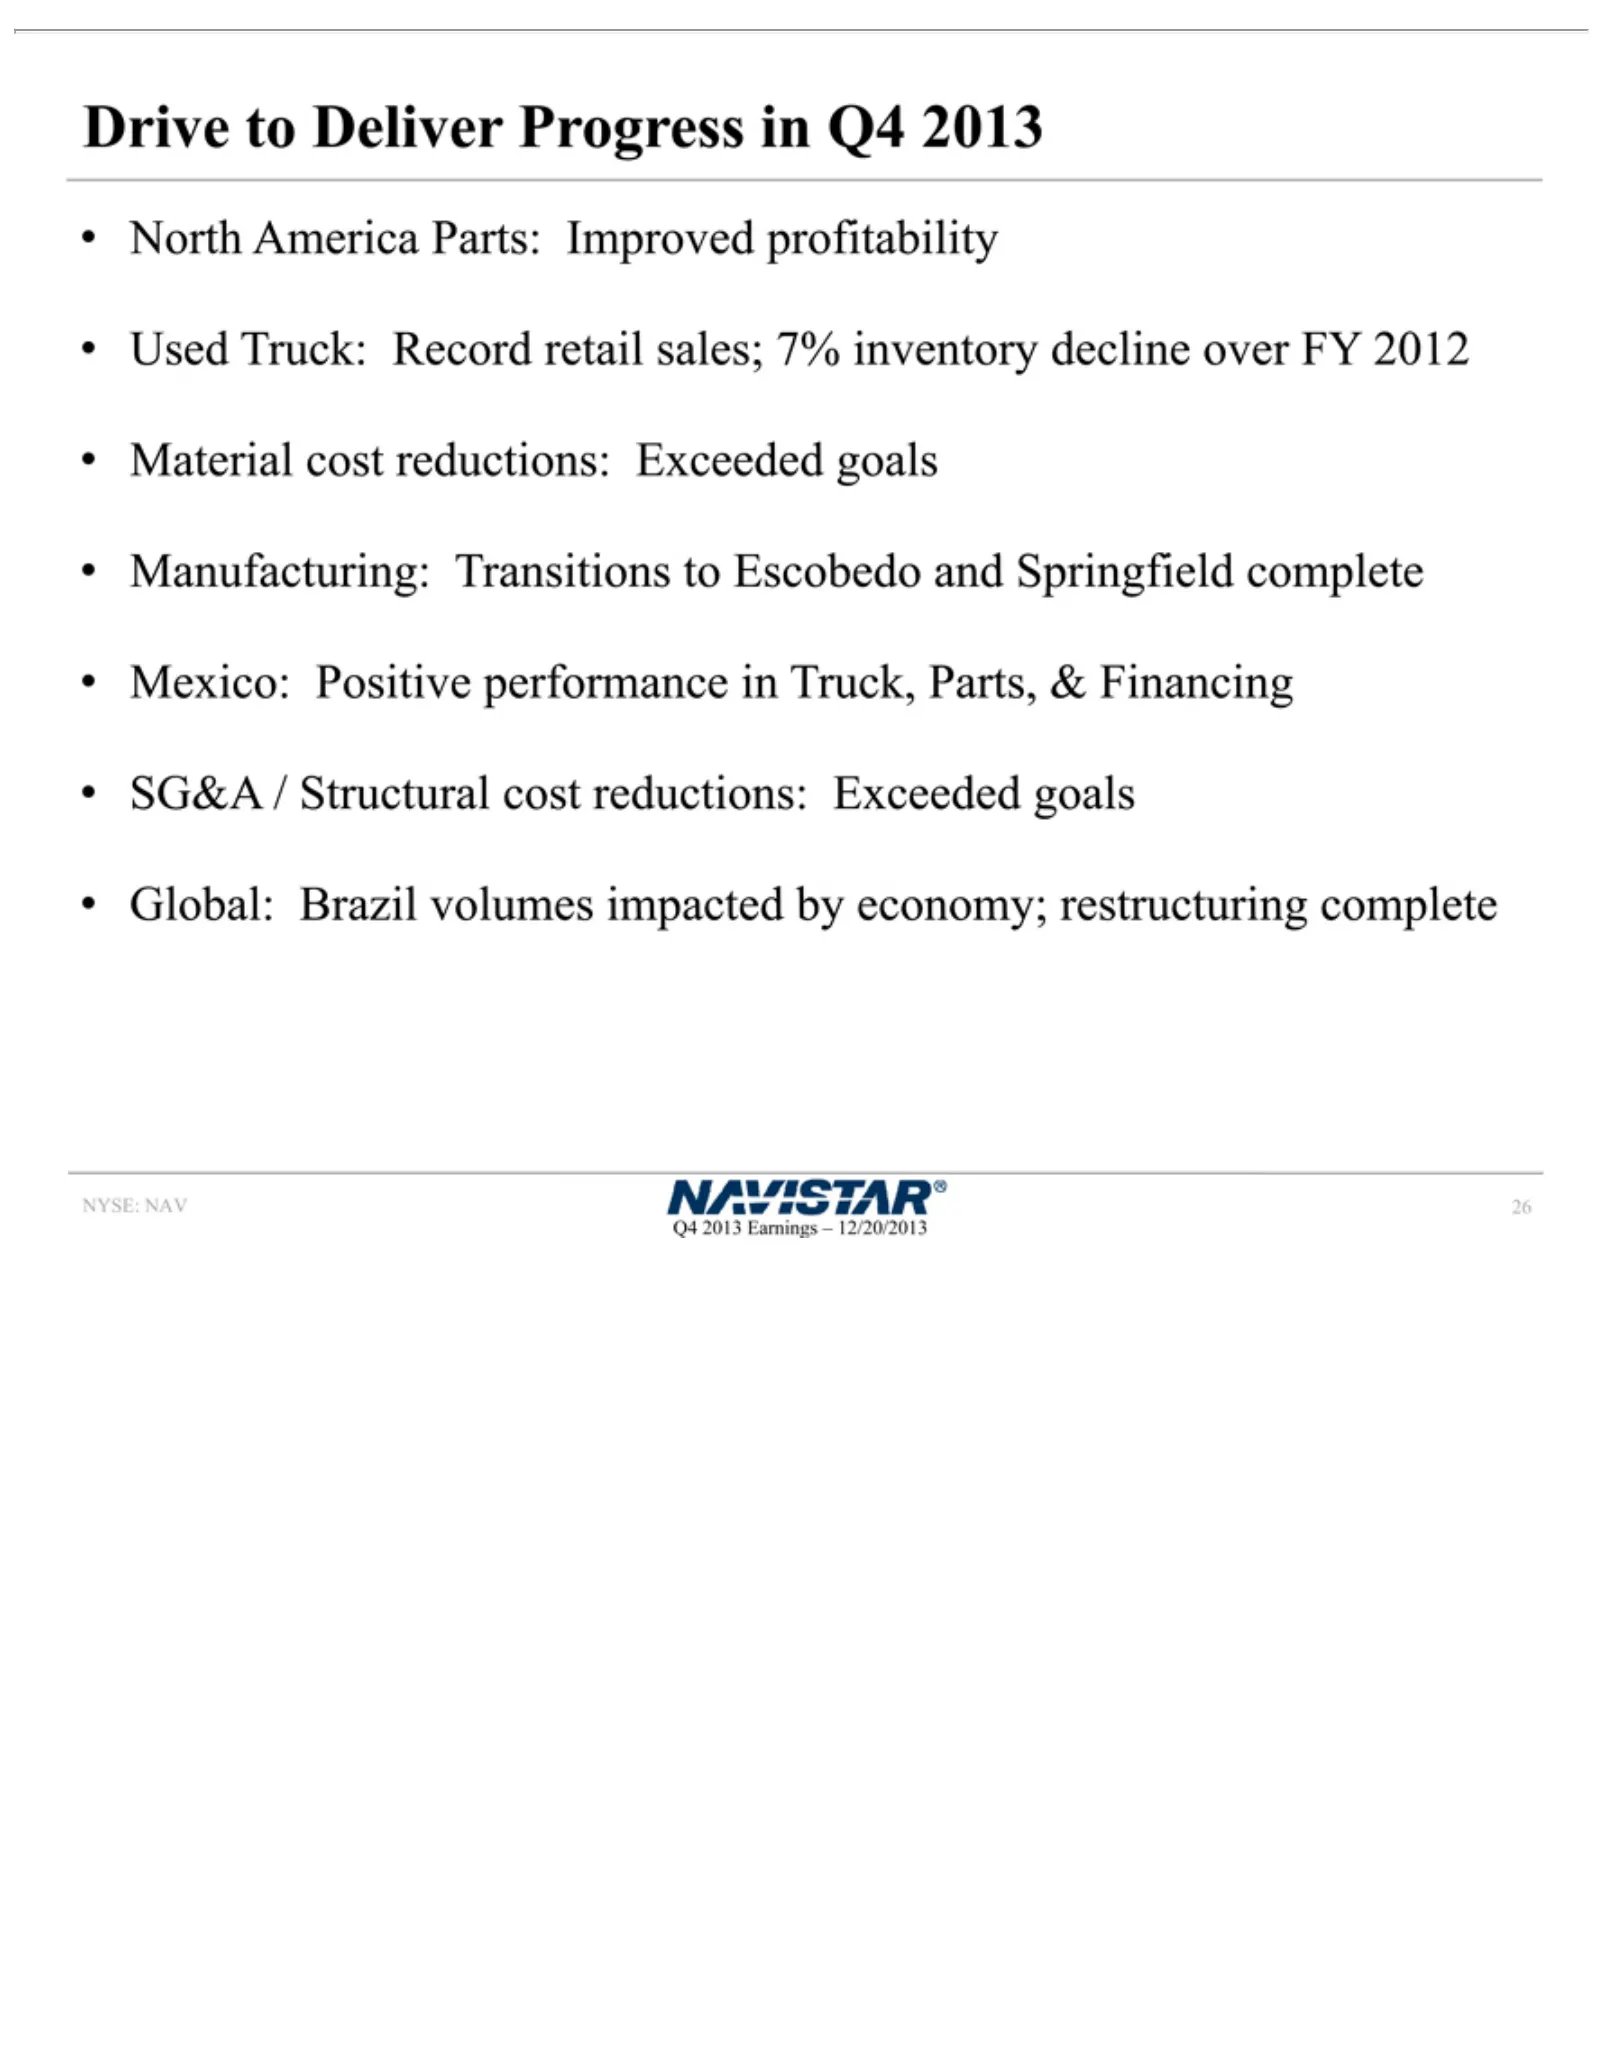
Slide 26: Progress to Deliver Profitability
Drive North complete NYSE: Q4 26 2013 to America NAV Deliver Earnings Mexico: Parts: Progress Positive – 12/20/2013 Improved inperformance Q4 profitability 2013 in Truck, Used Parts, Truck:&Record Financing retailSG&A sales; /7% Structural inventory cost decline reductions: over FYExceeded 2012 Mate
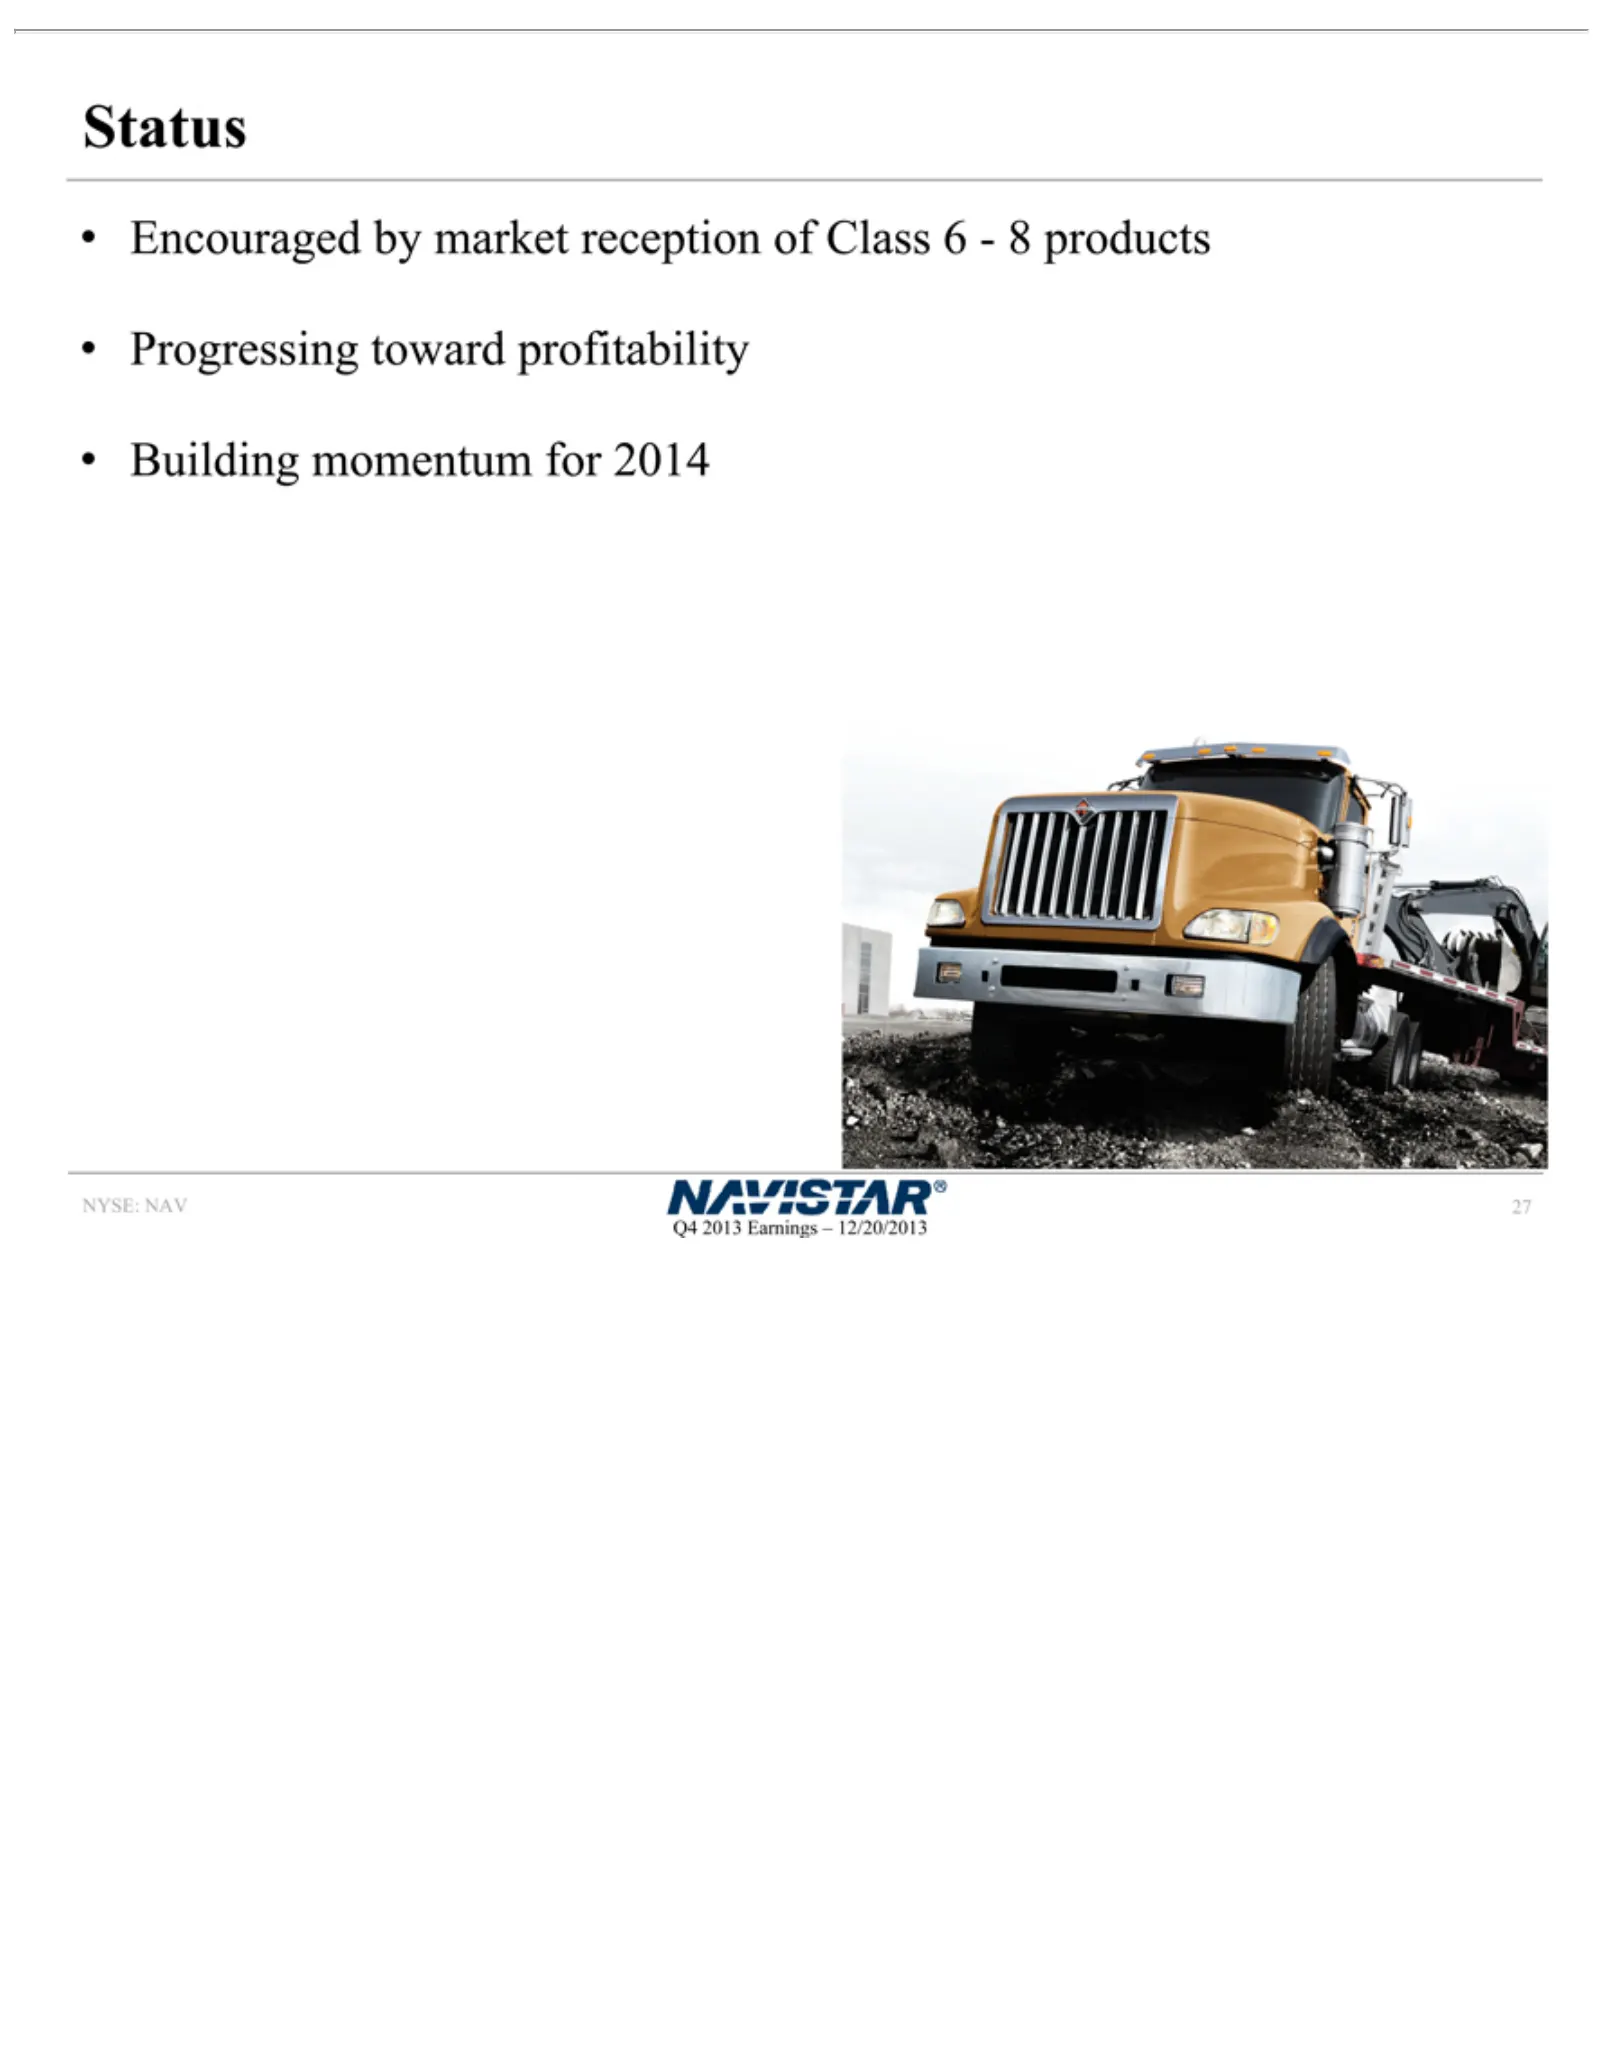
Slide 27: Encouraged by Market Reception
Encouraged Status NYSE: Q4 27 2013NAV Earnings by market – 12/20/2013 reception of Class 6—8 products Progressing toward profitability Building momentum for 2014
Slide 28: Summary
SUMMARY NYSE: NAV Troy Clarke, President & CEO
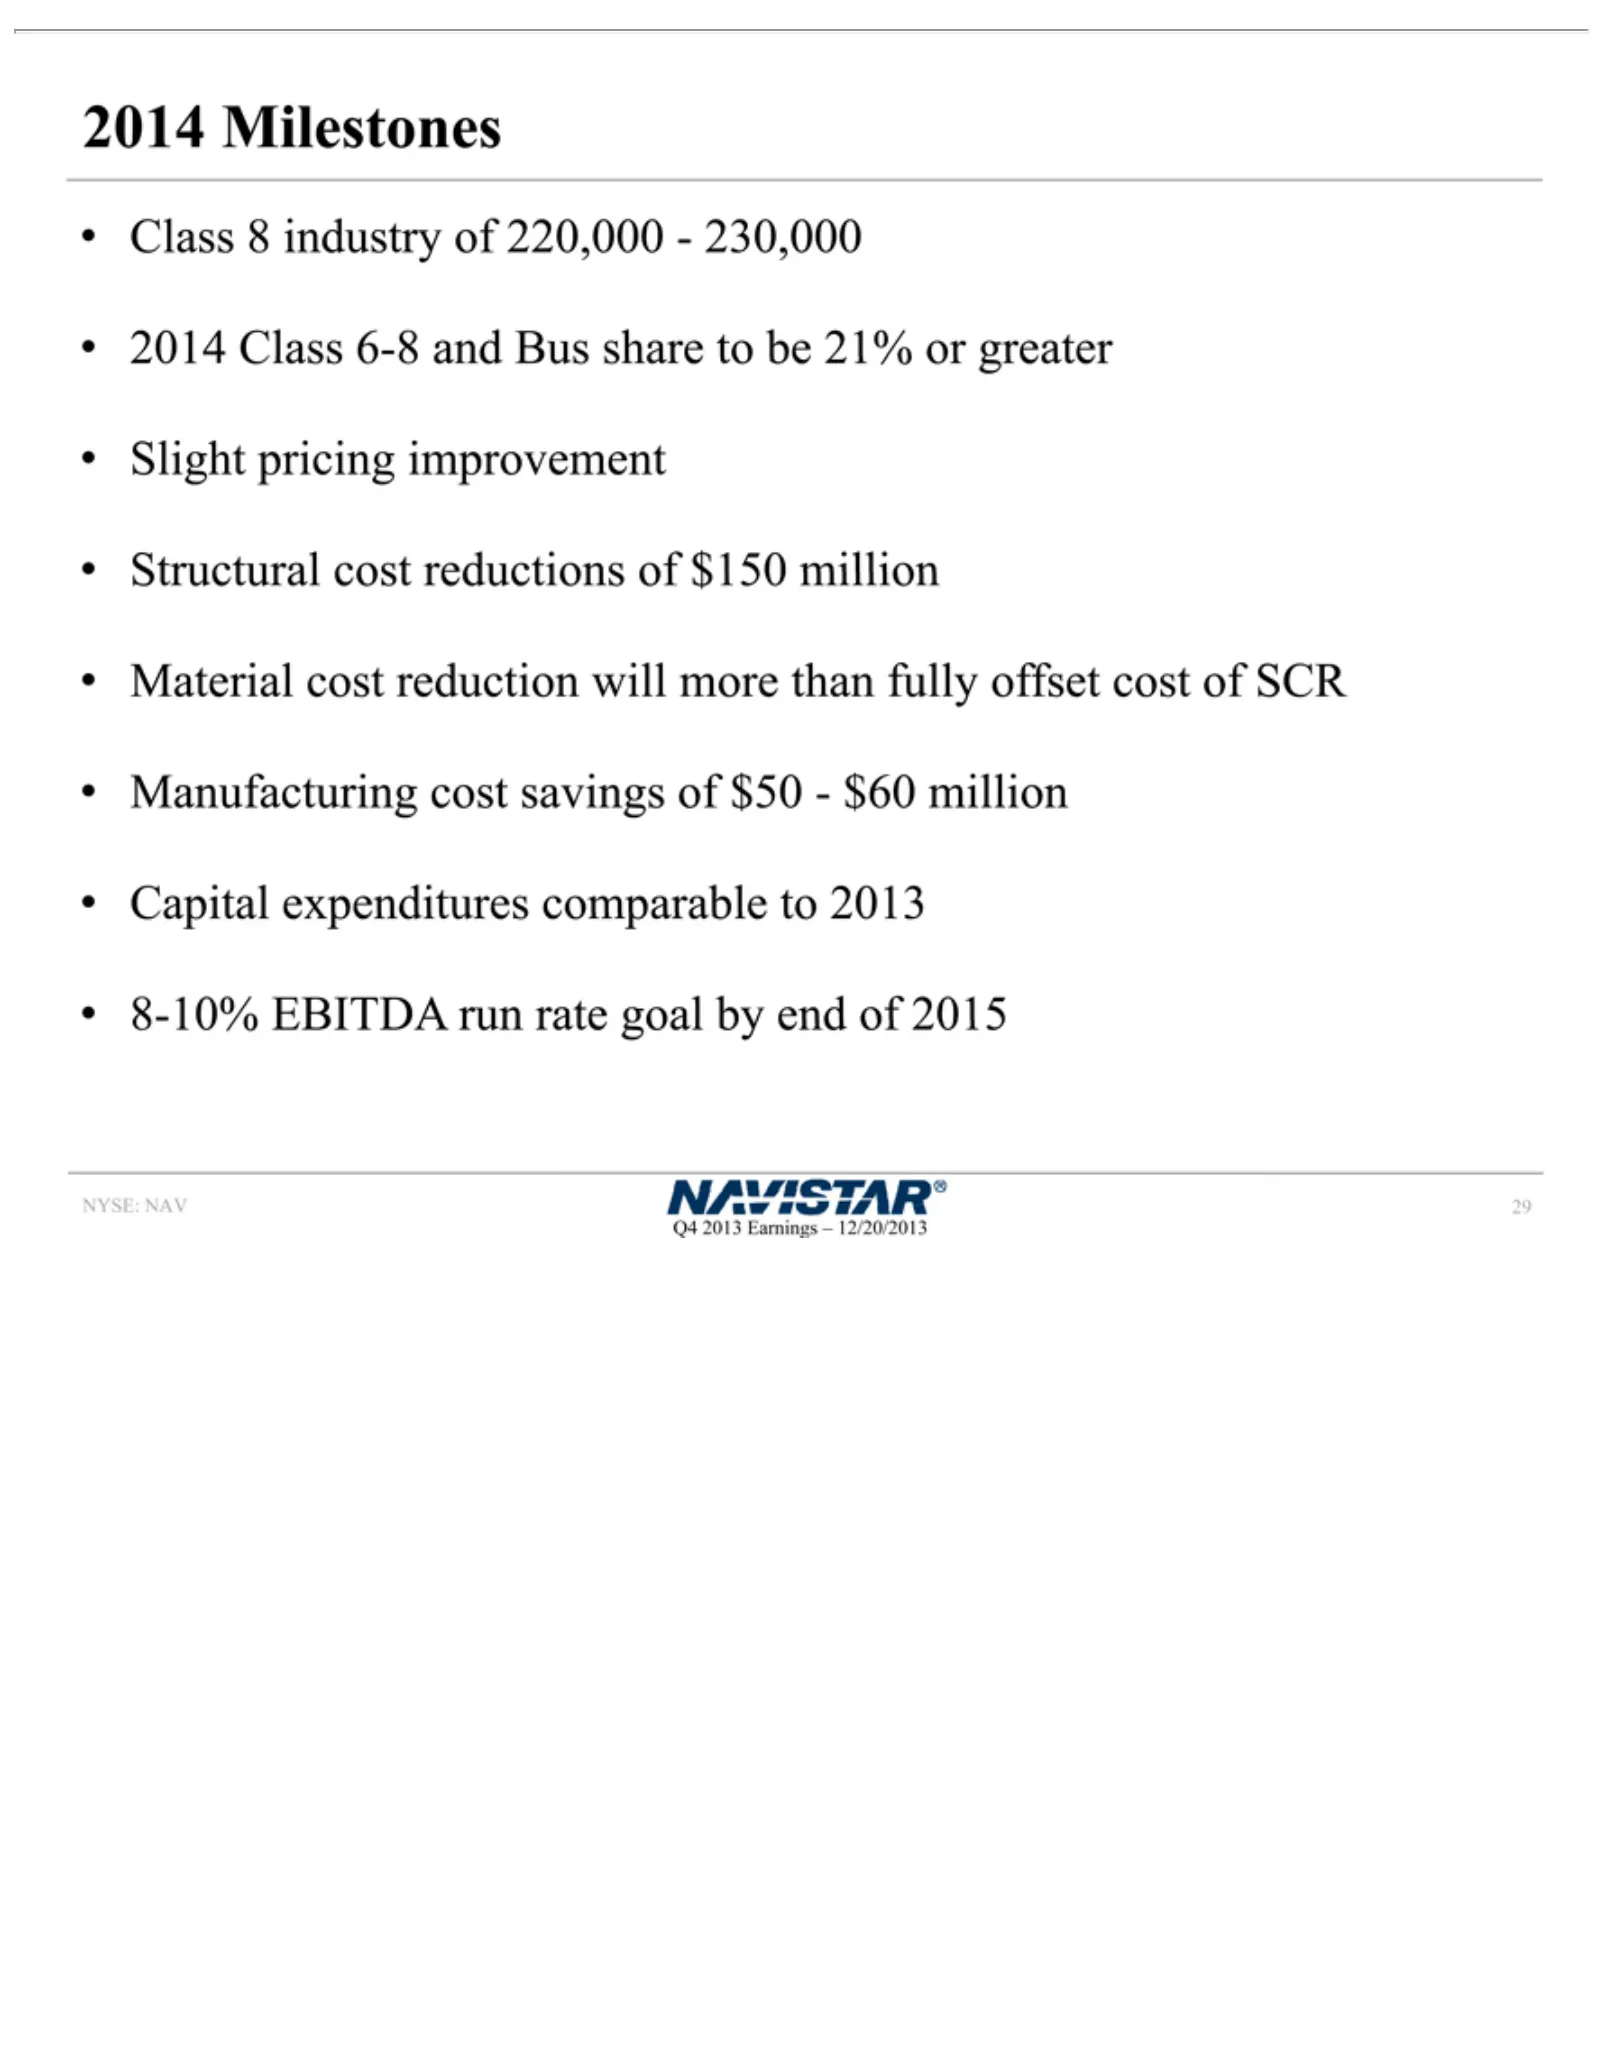
Slide 29: 2014 Milestones
2014 Class of NYSE: Q4 29 SCR 2013 Milestones 8 NAV industry Manufacturing Earnings of–220,000—230,000 12/20/2013 cost savings of 2014 $50—$60 Classmillion 6-8 andCapital Bus share expenditures to be 21%comparable or greater Slight to 2013 pricing 8-10%improvement EBITDA runStructural rate goal cost
Slide 30: Appendix
APPENDIX NAYISTAR’
Slide 31: FY Segment Results
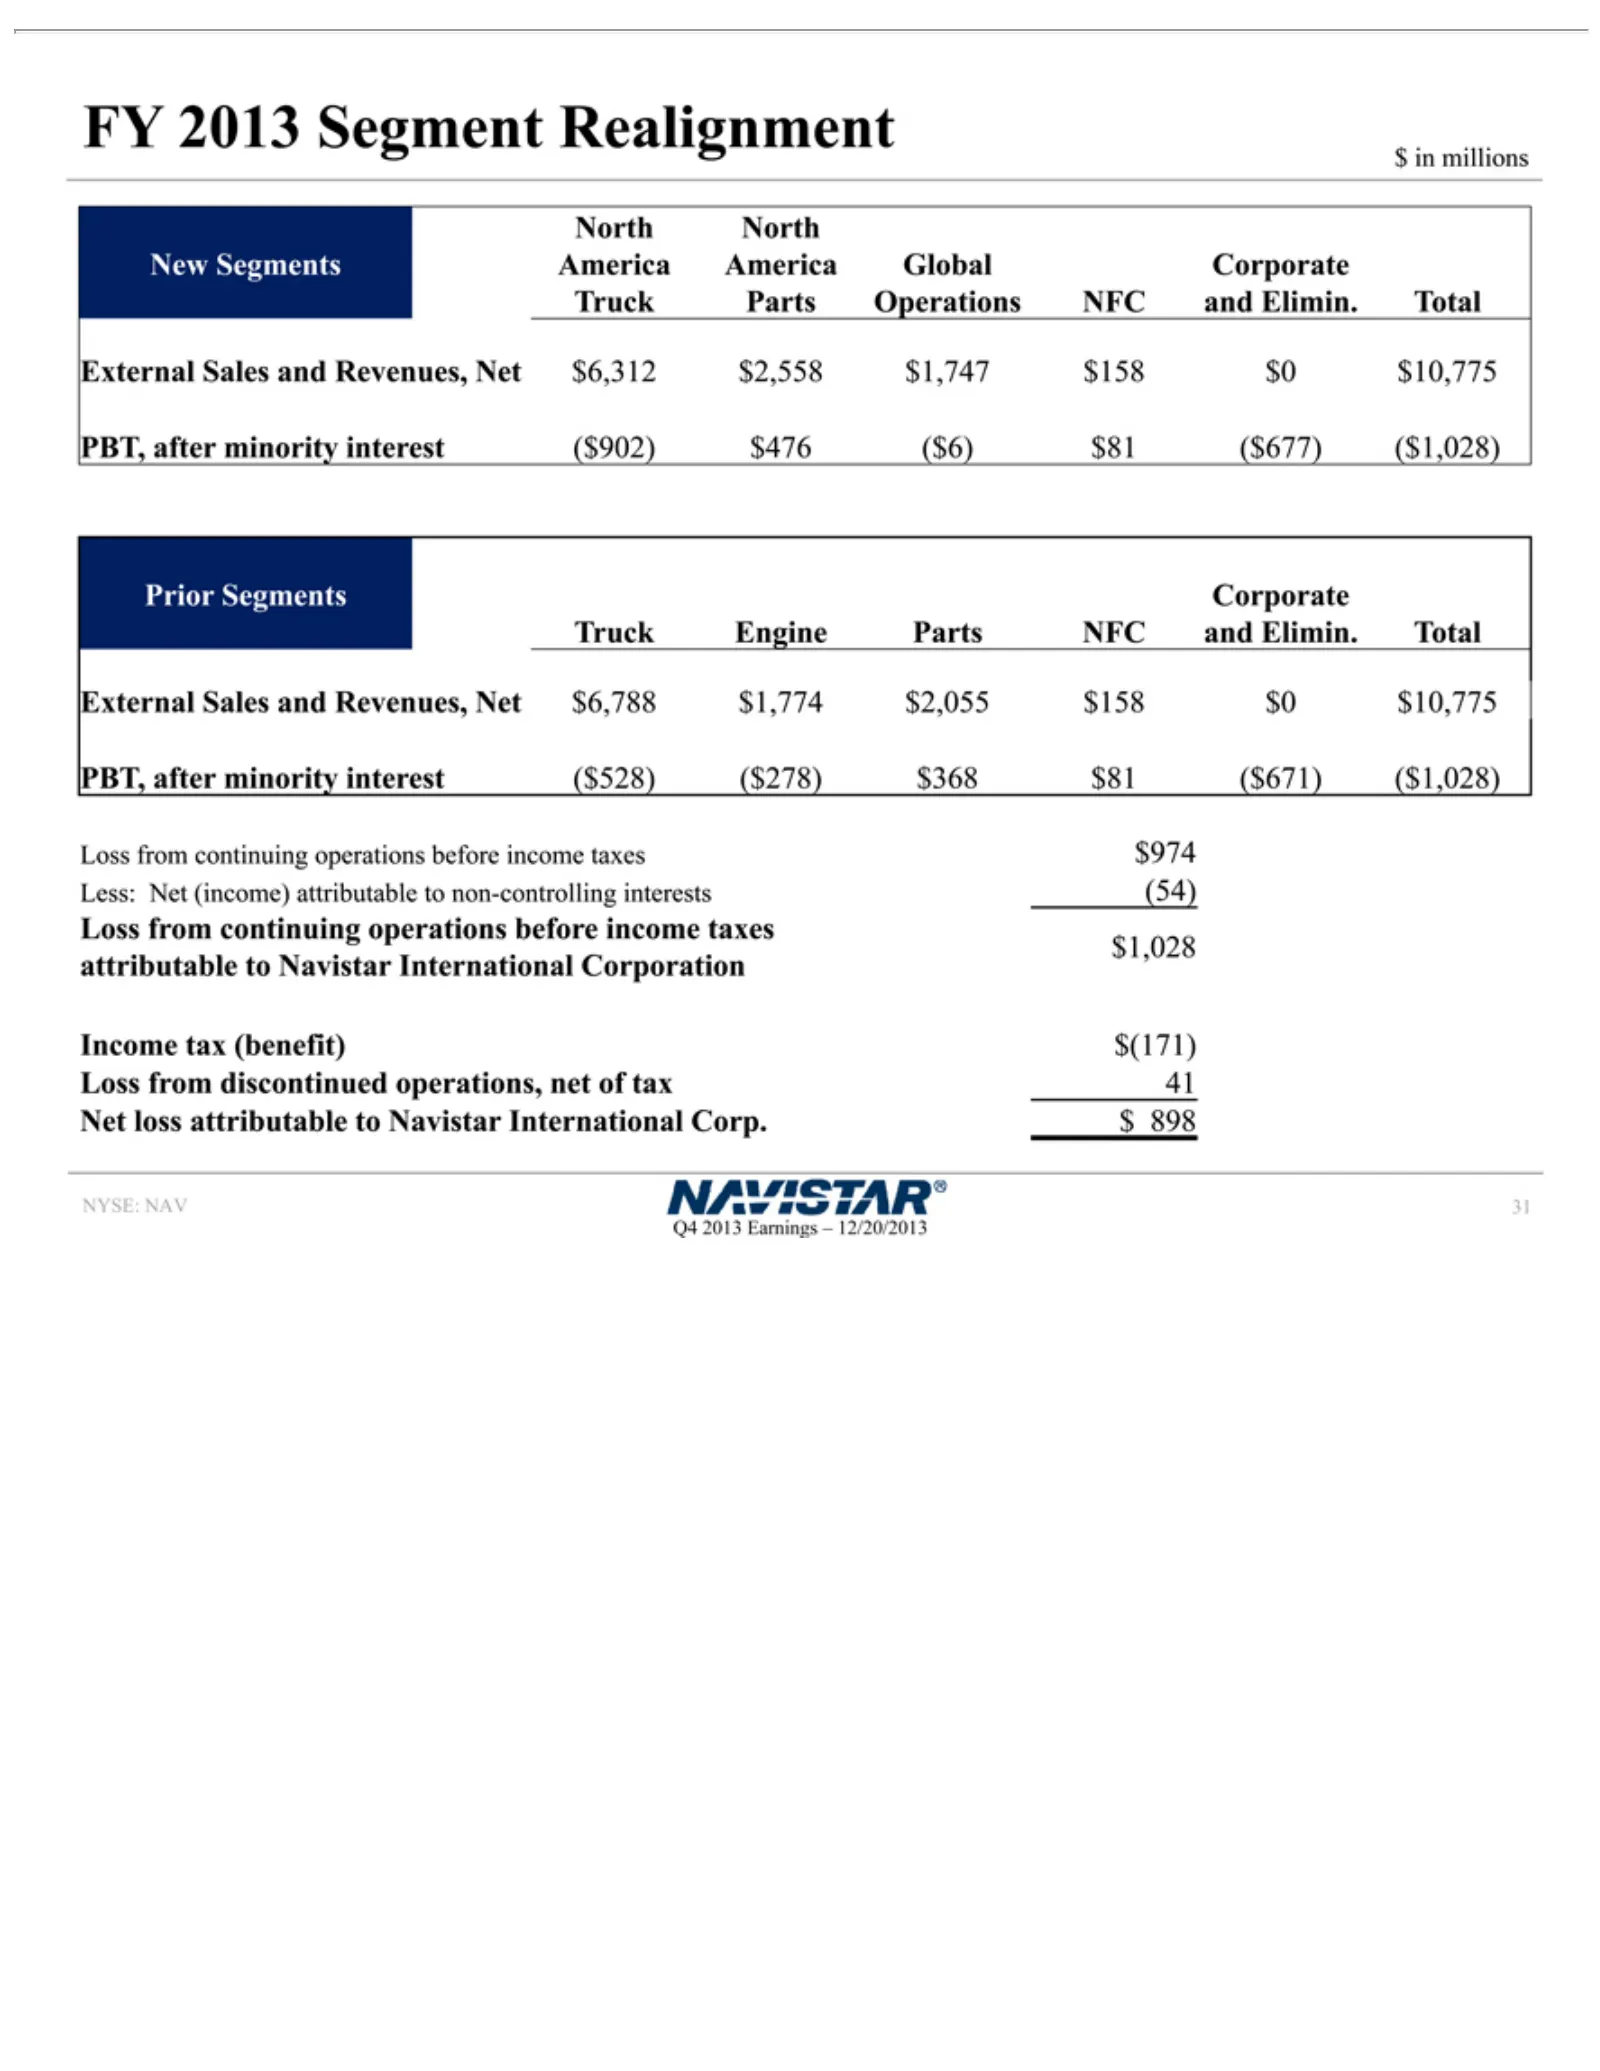
$FY North New PBT, Prior Truck External PBT,, Less: attributable Income Loss Net NYSE: Q4 31in2013 loss millions Segments from Segments after Net after North Parts Engine NAV tax attributable Sales Earnings Segment (income) continuing continuingg discontinued minority minority (benefit) to Operation
Slide 32: Income Statement Summary Q4
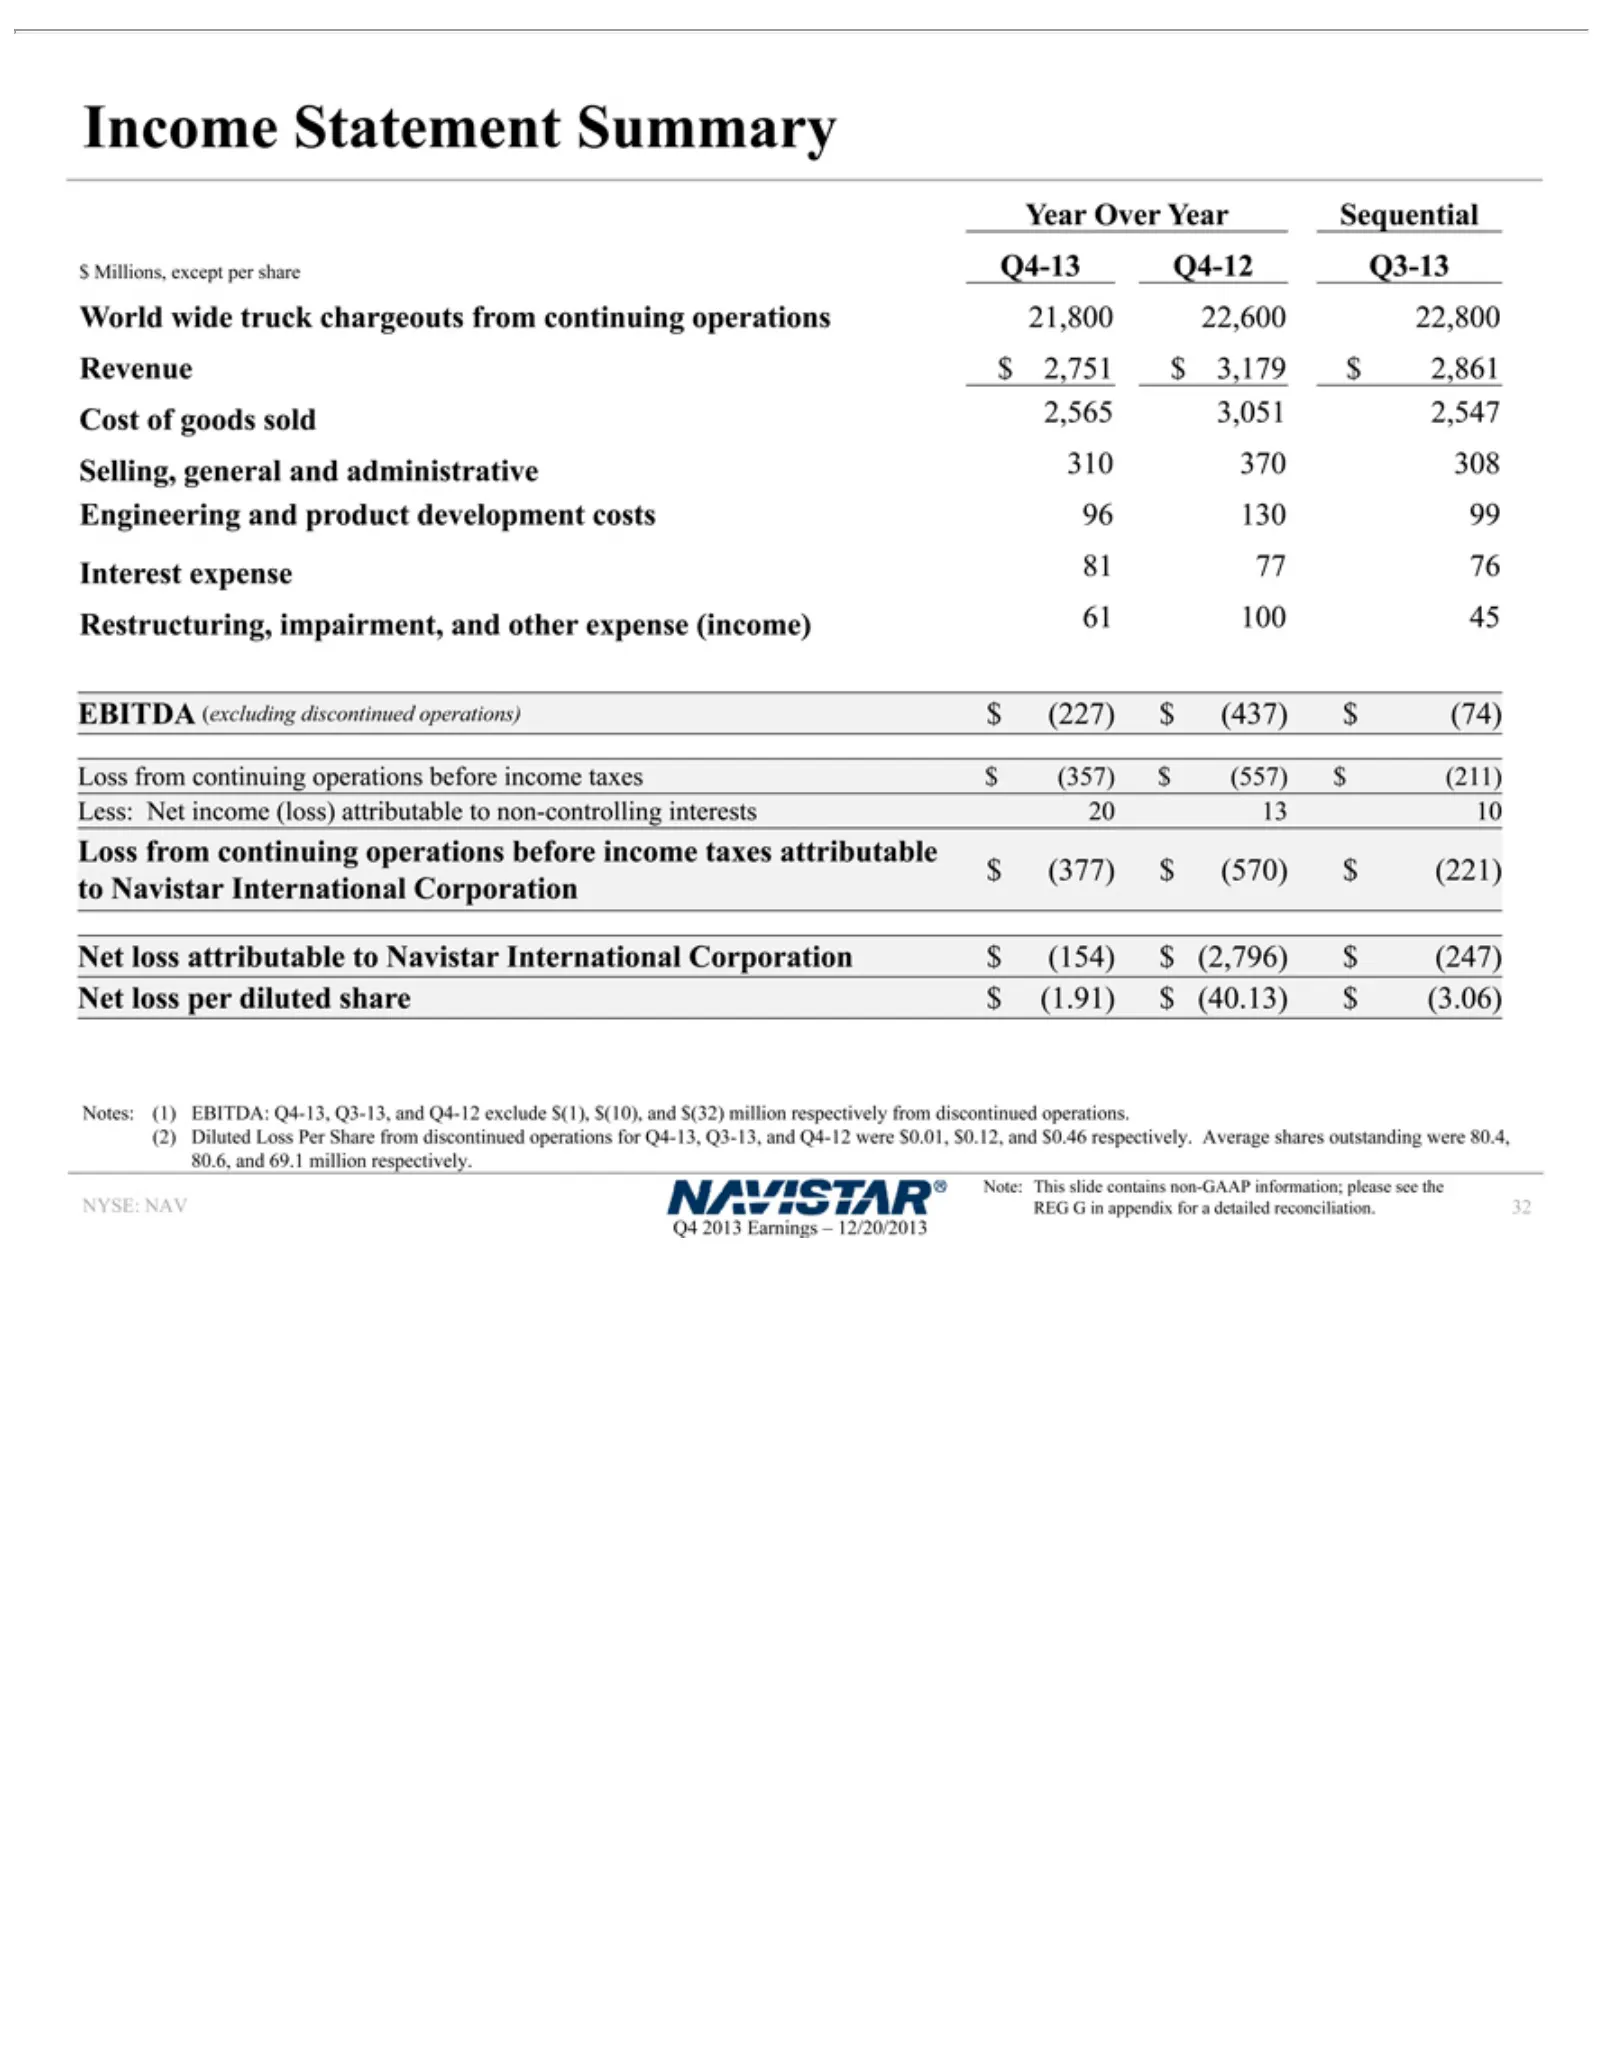
Income Notes: were reconciliation. goods 61 interests (2,796) NYSE: Q4 32 100 2013 $0.01, sold (1) 45 NAV $Statement 20 Earnings (247) EBITDA EBITDA: 2,565 13 $0.12, Year 10 Net 3,051 Loss Summary –and loss Over (excluding 12/20/2013 Q4-13, $0.46 from 2,547 per Year diluted Q3-13, continuing respect
Slide 33: Income Statement Summary Year
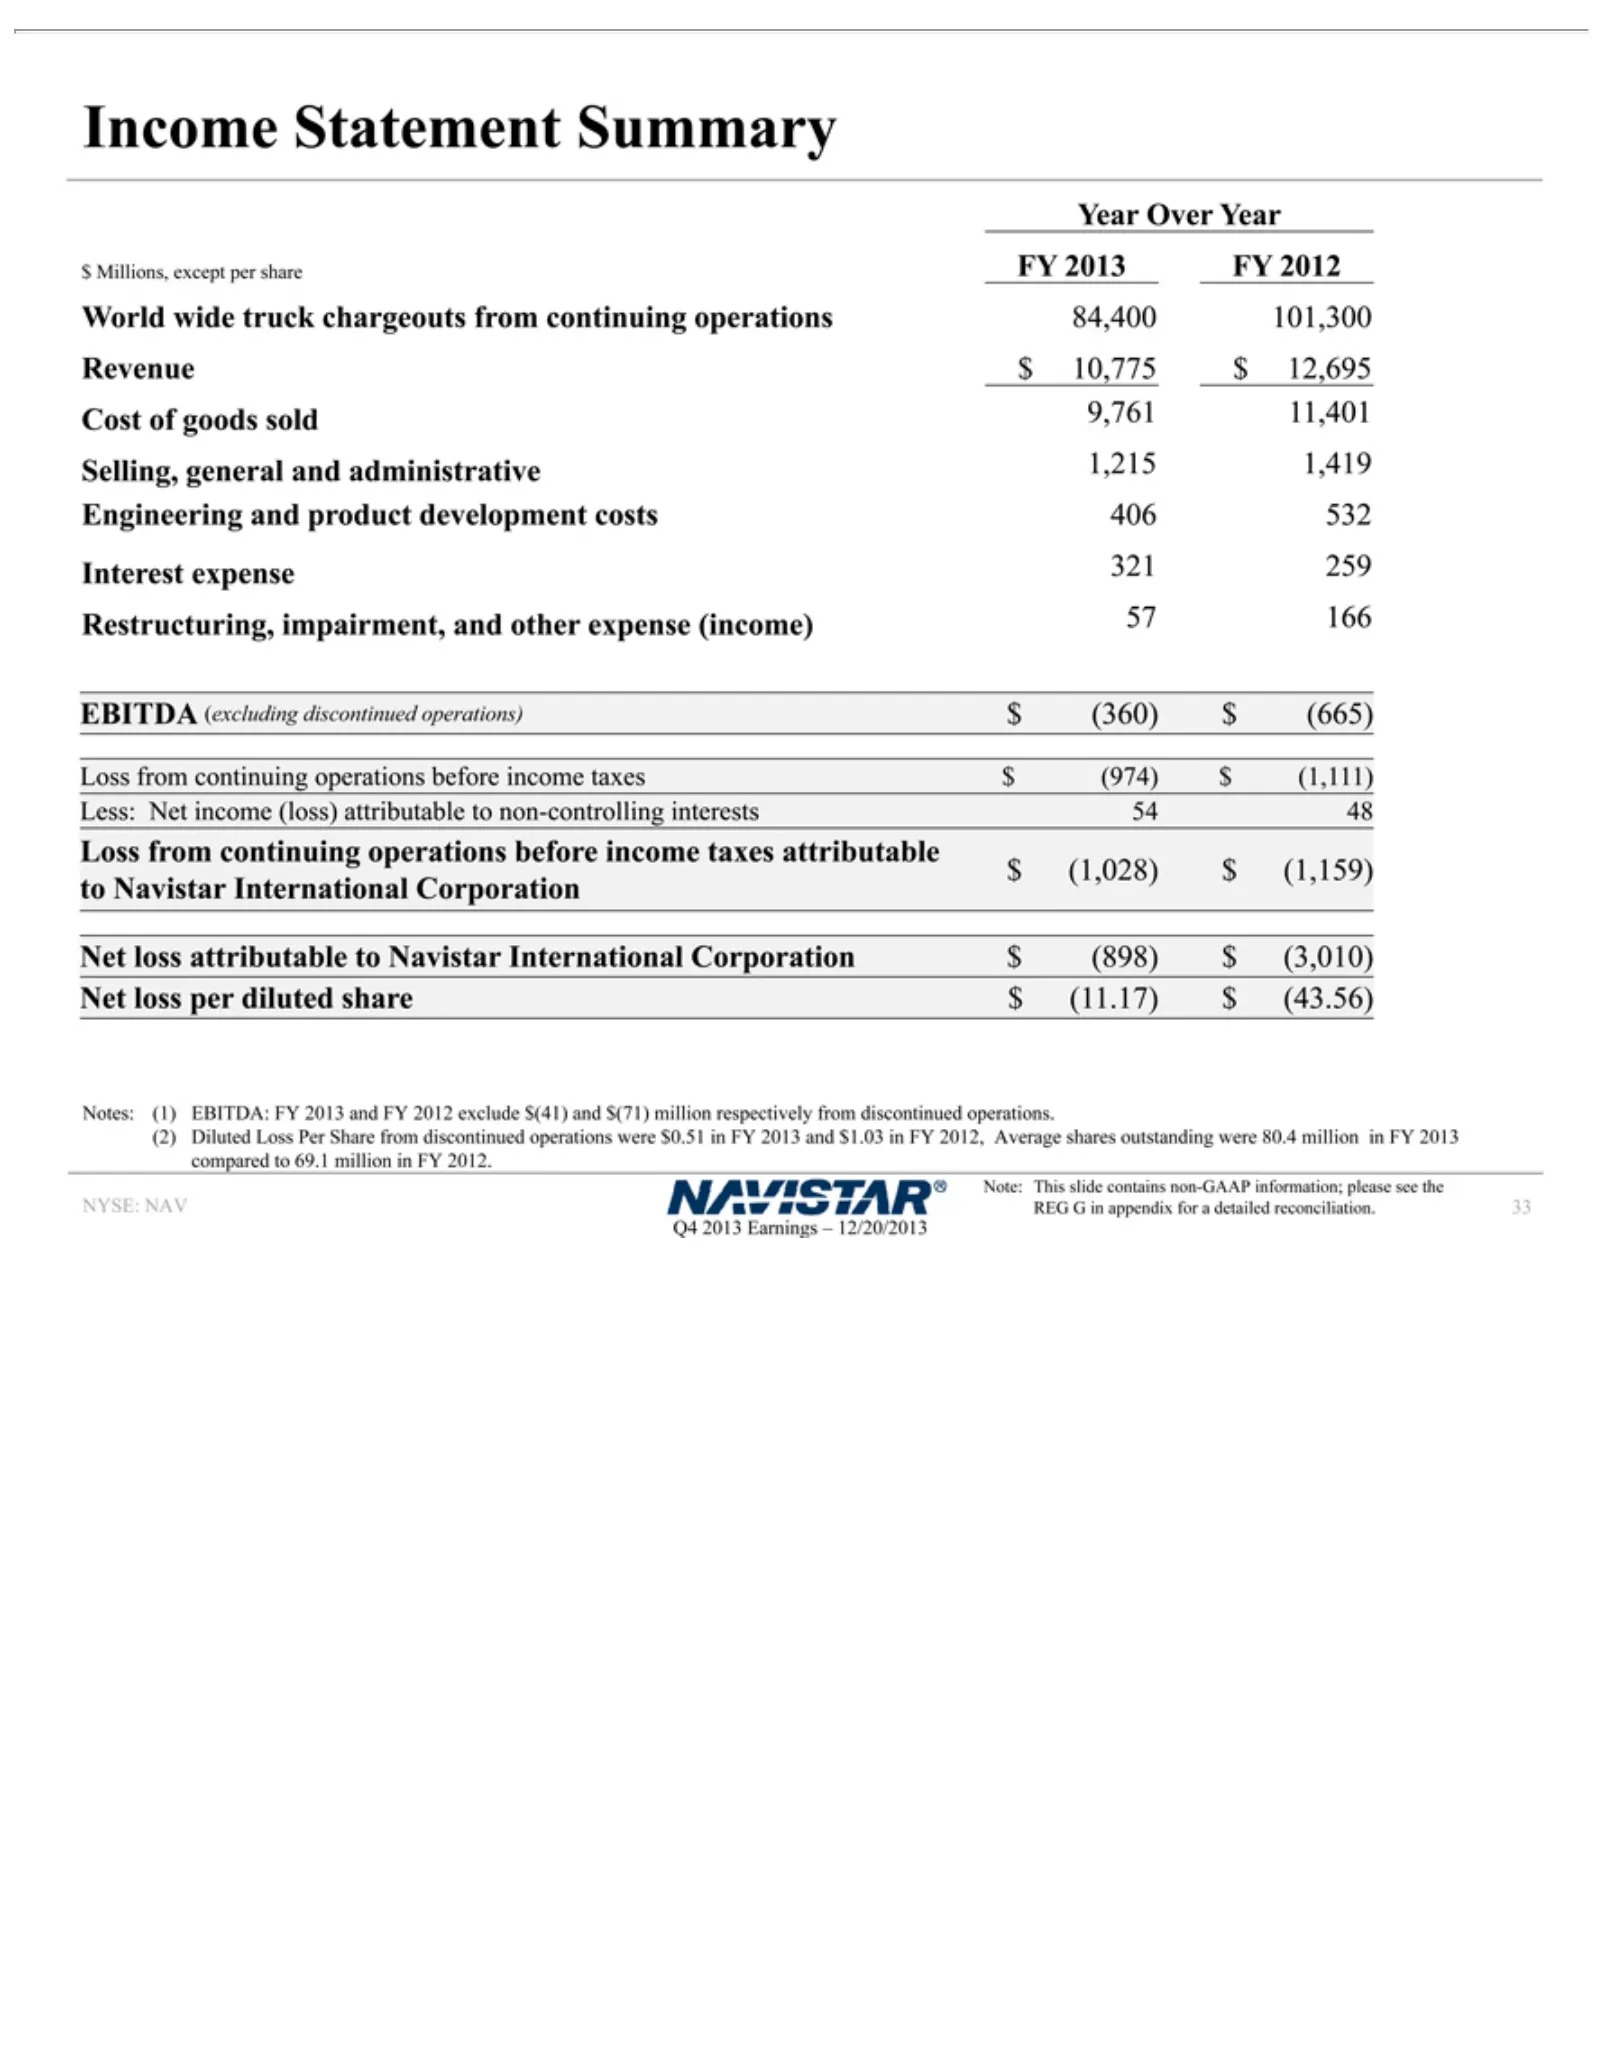
Income Notes: 2012, Year administrative (360) attributable NYSE: Q4 33 2013 Over $Average (1) NAV (665) Statement Earnings EBITDA: Year toLoss Navistar 1,215 shares $ Millions, Summary –from 12/20/2013 FY 1,419 outstanding International continuing 2013 Engineering except andwere per FYoperations Cor
Slide 34: Navistar Financial Highlights
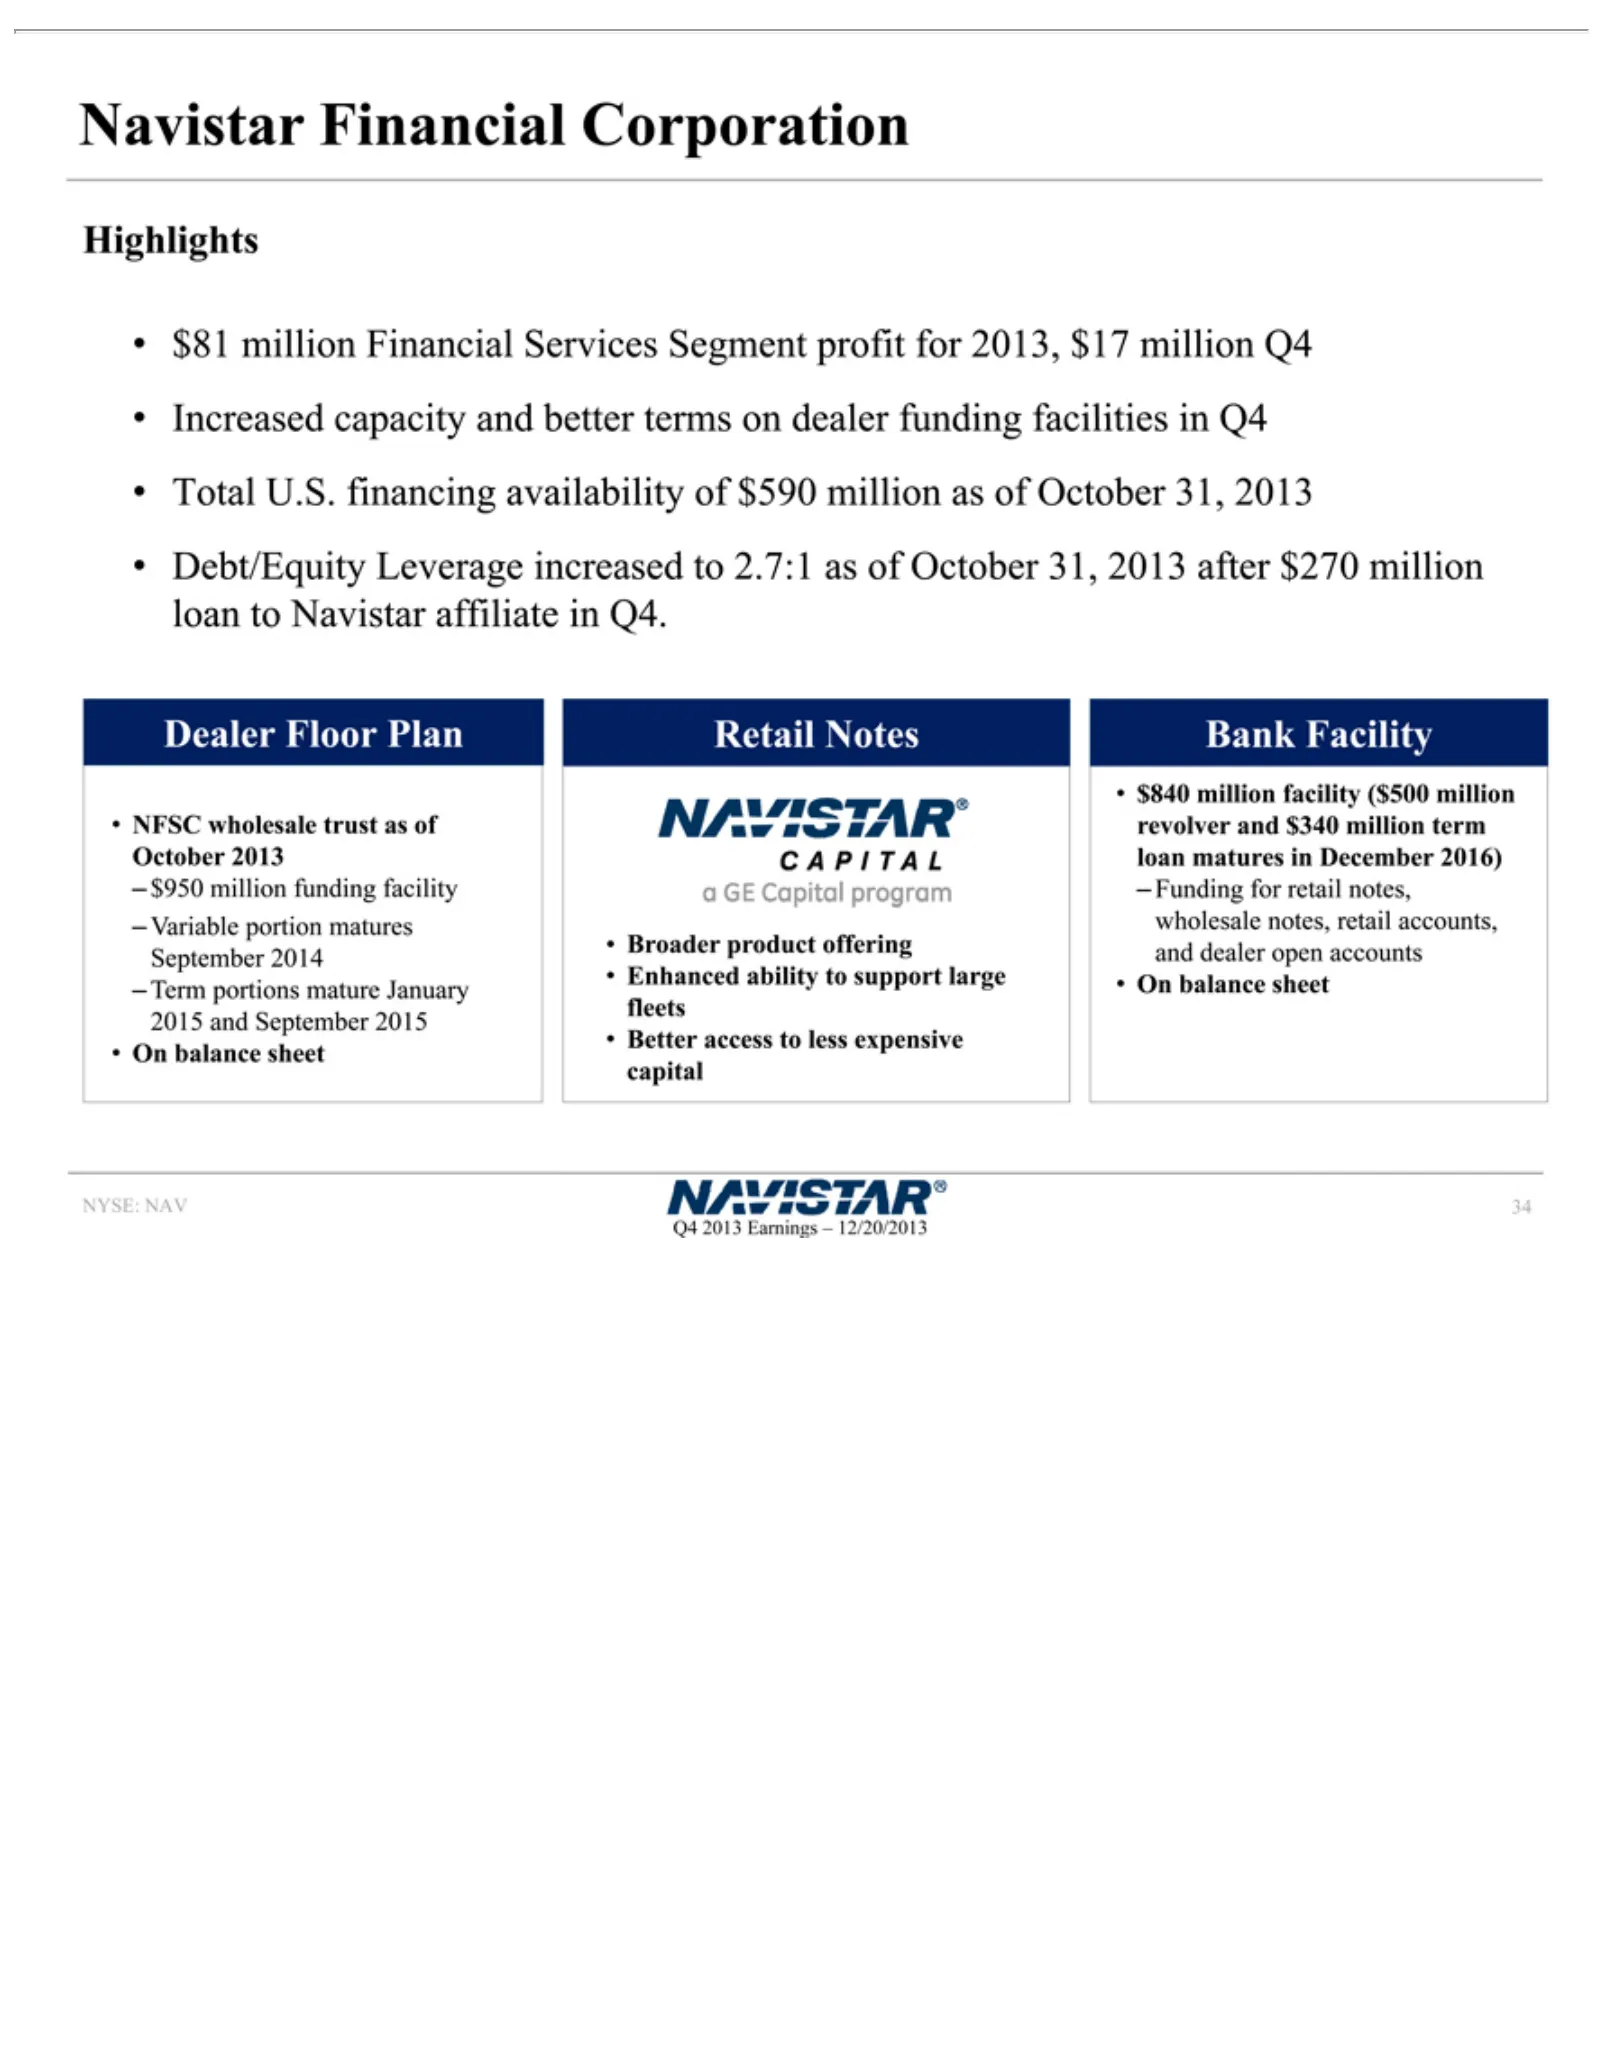
Navistar Highlights October revolver million access NYSE: Q4 34 2013toNAV funding 31, and Financial Earnings less $81 2013 $340 expensive million facility Debt/Equity million –Corporation 12/20/2013 Financial Variable capital termLeverage loan portion Services matures matures increased Segment in De
Slide 35: A Leader in Several Commercial Vehicle Segments
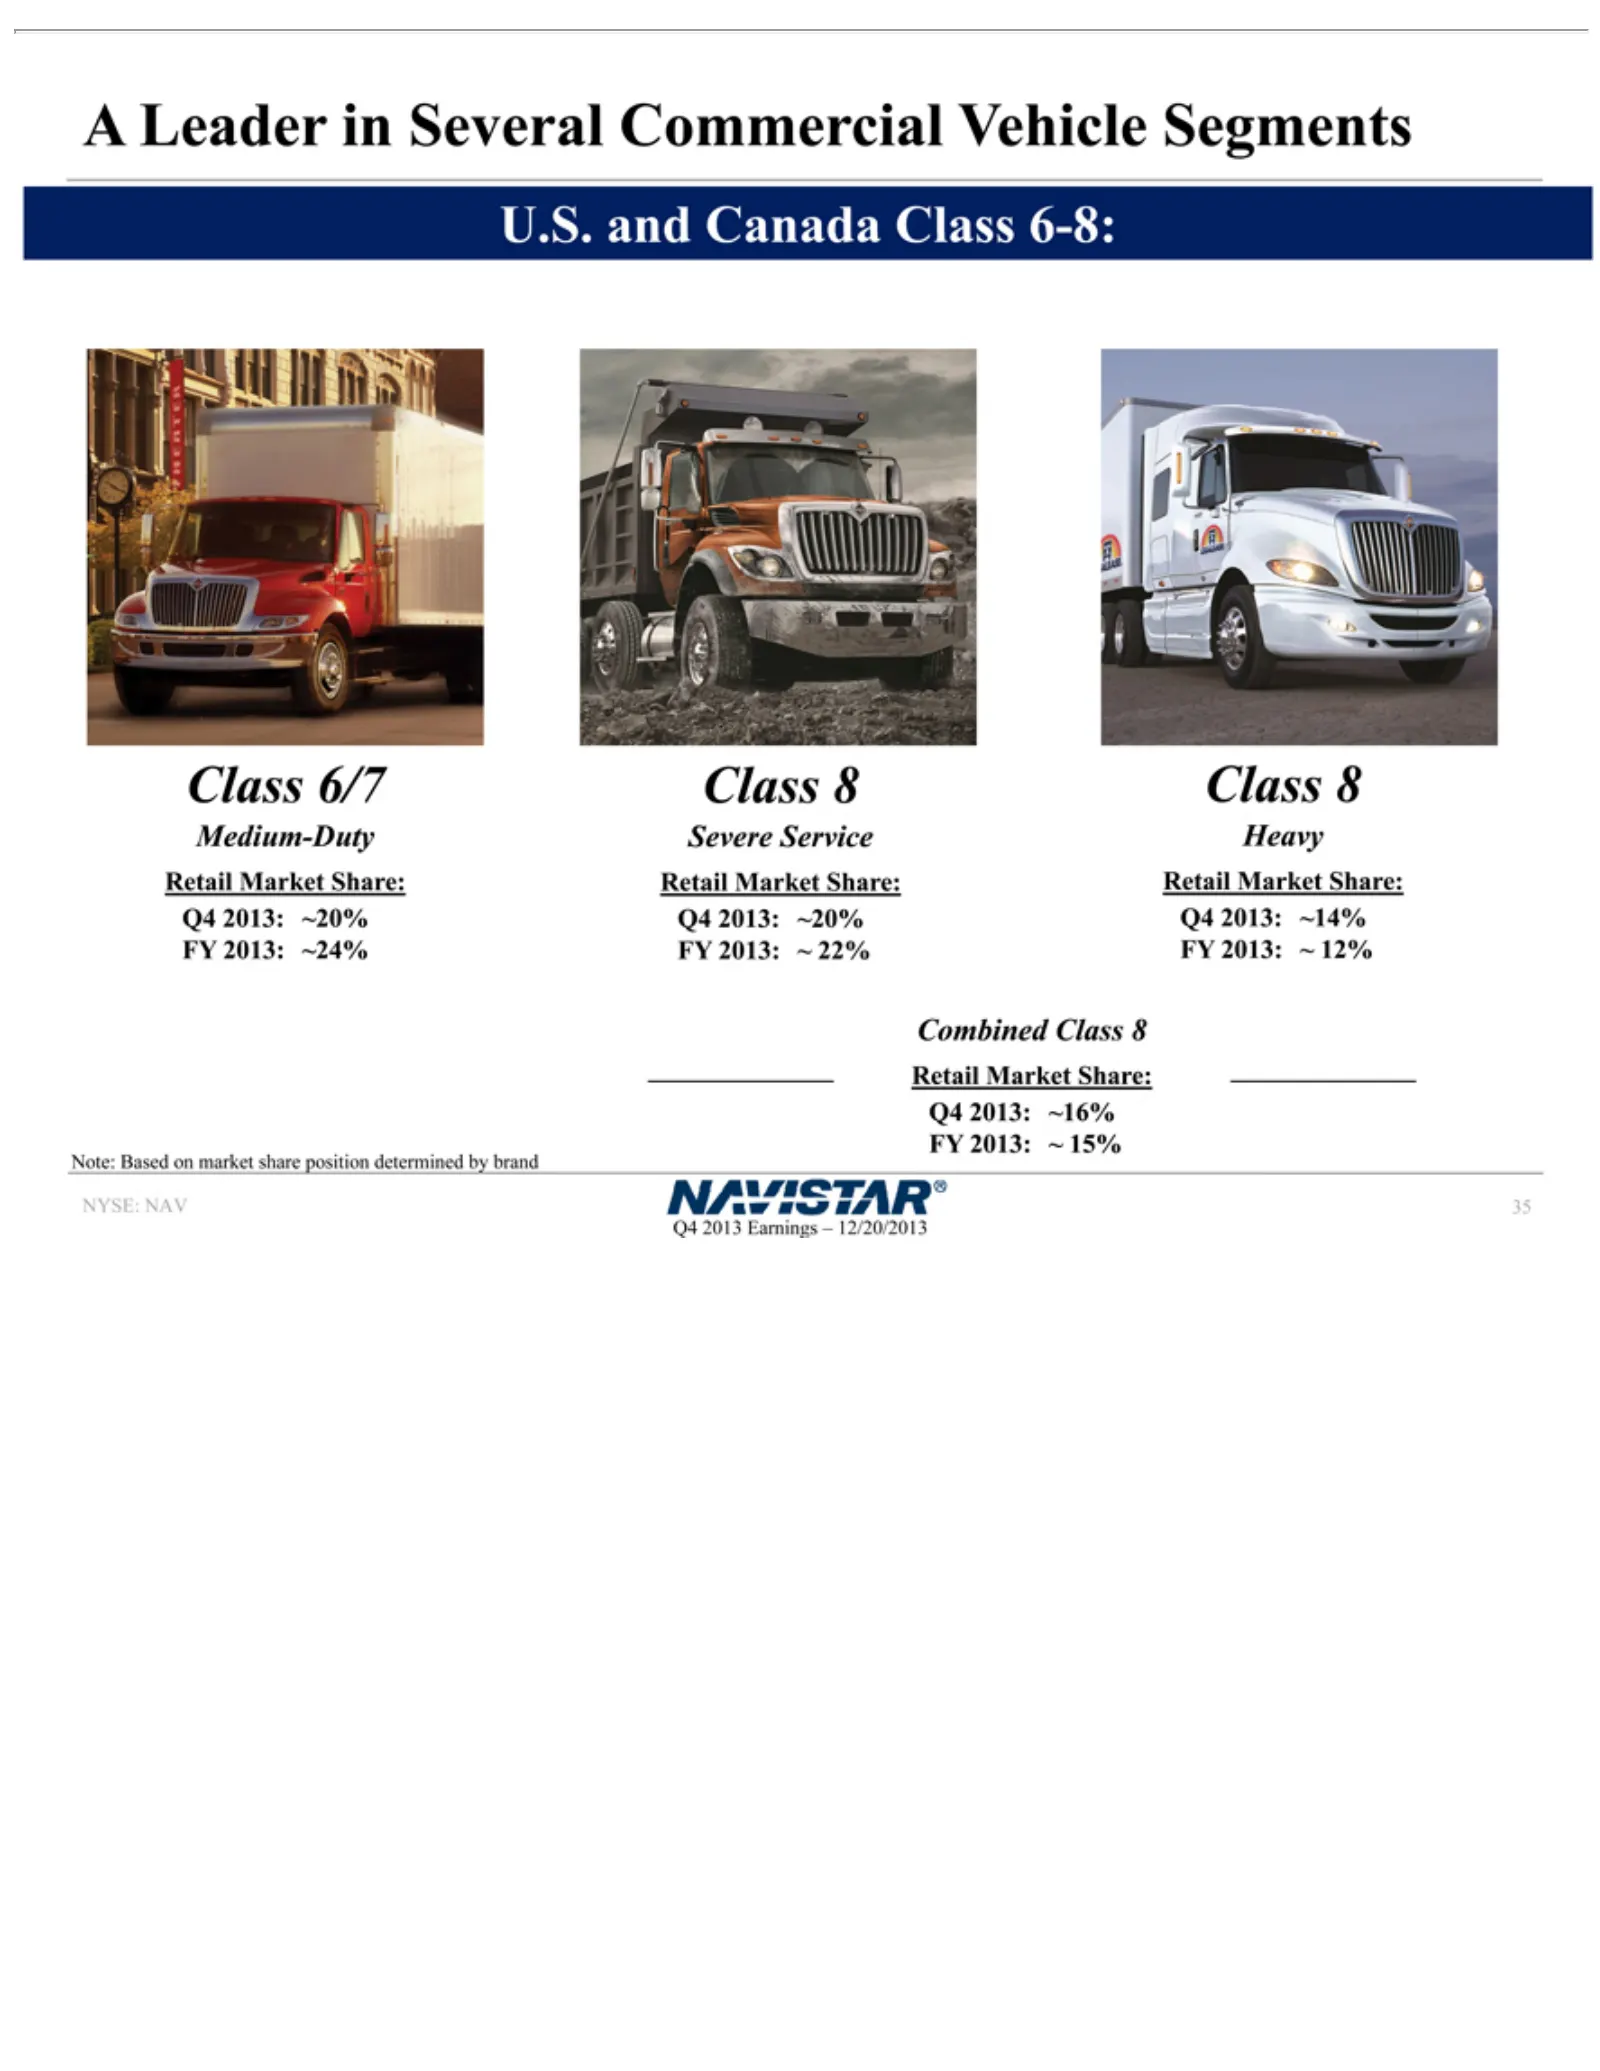
A Leader Note: 2013: NYSE: Q4 35 2013 Based ~20% NAV Earnings in Several FY on market 2013: – Commercial 12/20/2013 ~share 22%position Class Vehicle 8 Heavy determined Segments RetailbyMarket brand Class Share:6/7 Q4Medium-Duty 2013: ~14% FY Retail 2013:Market ~ 12%Share: Combined Q4 2013: Class~20%
Slide 36: Market Share
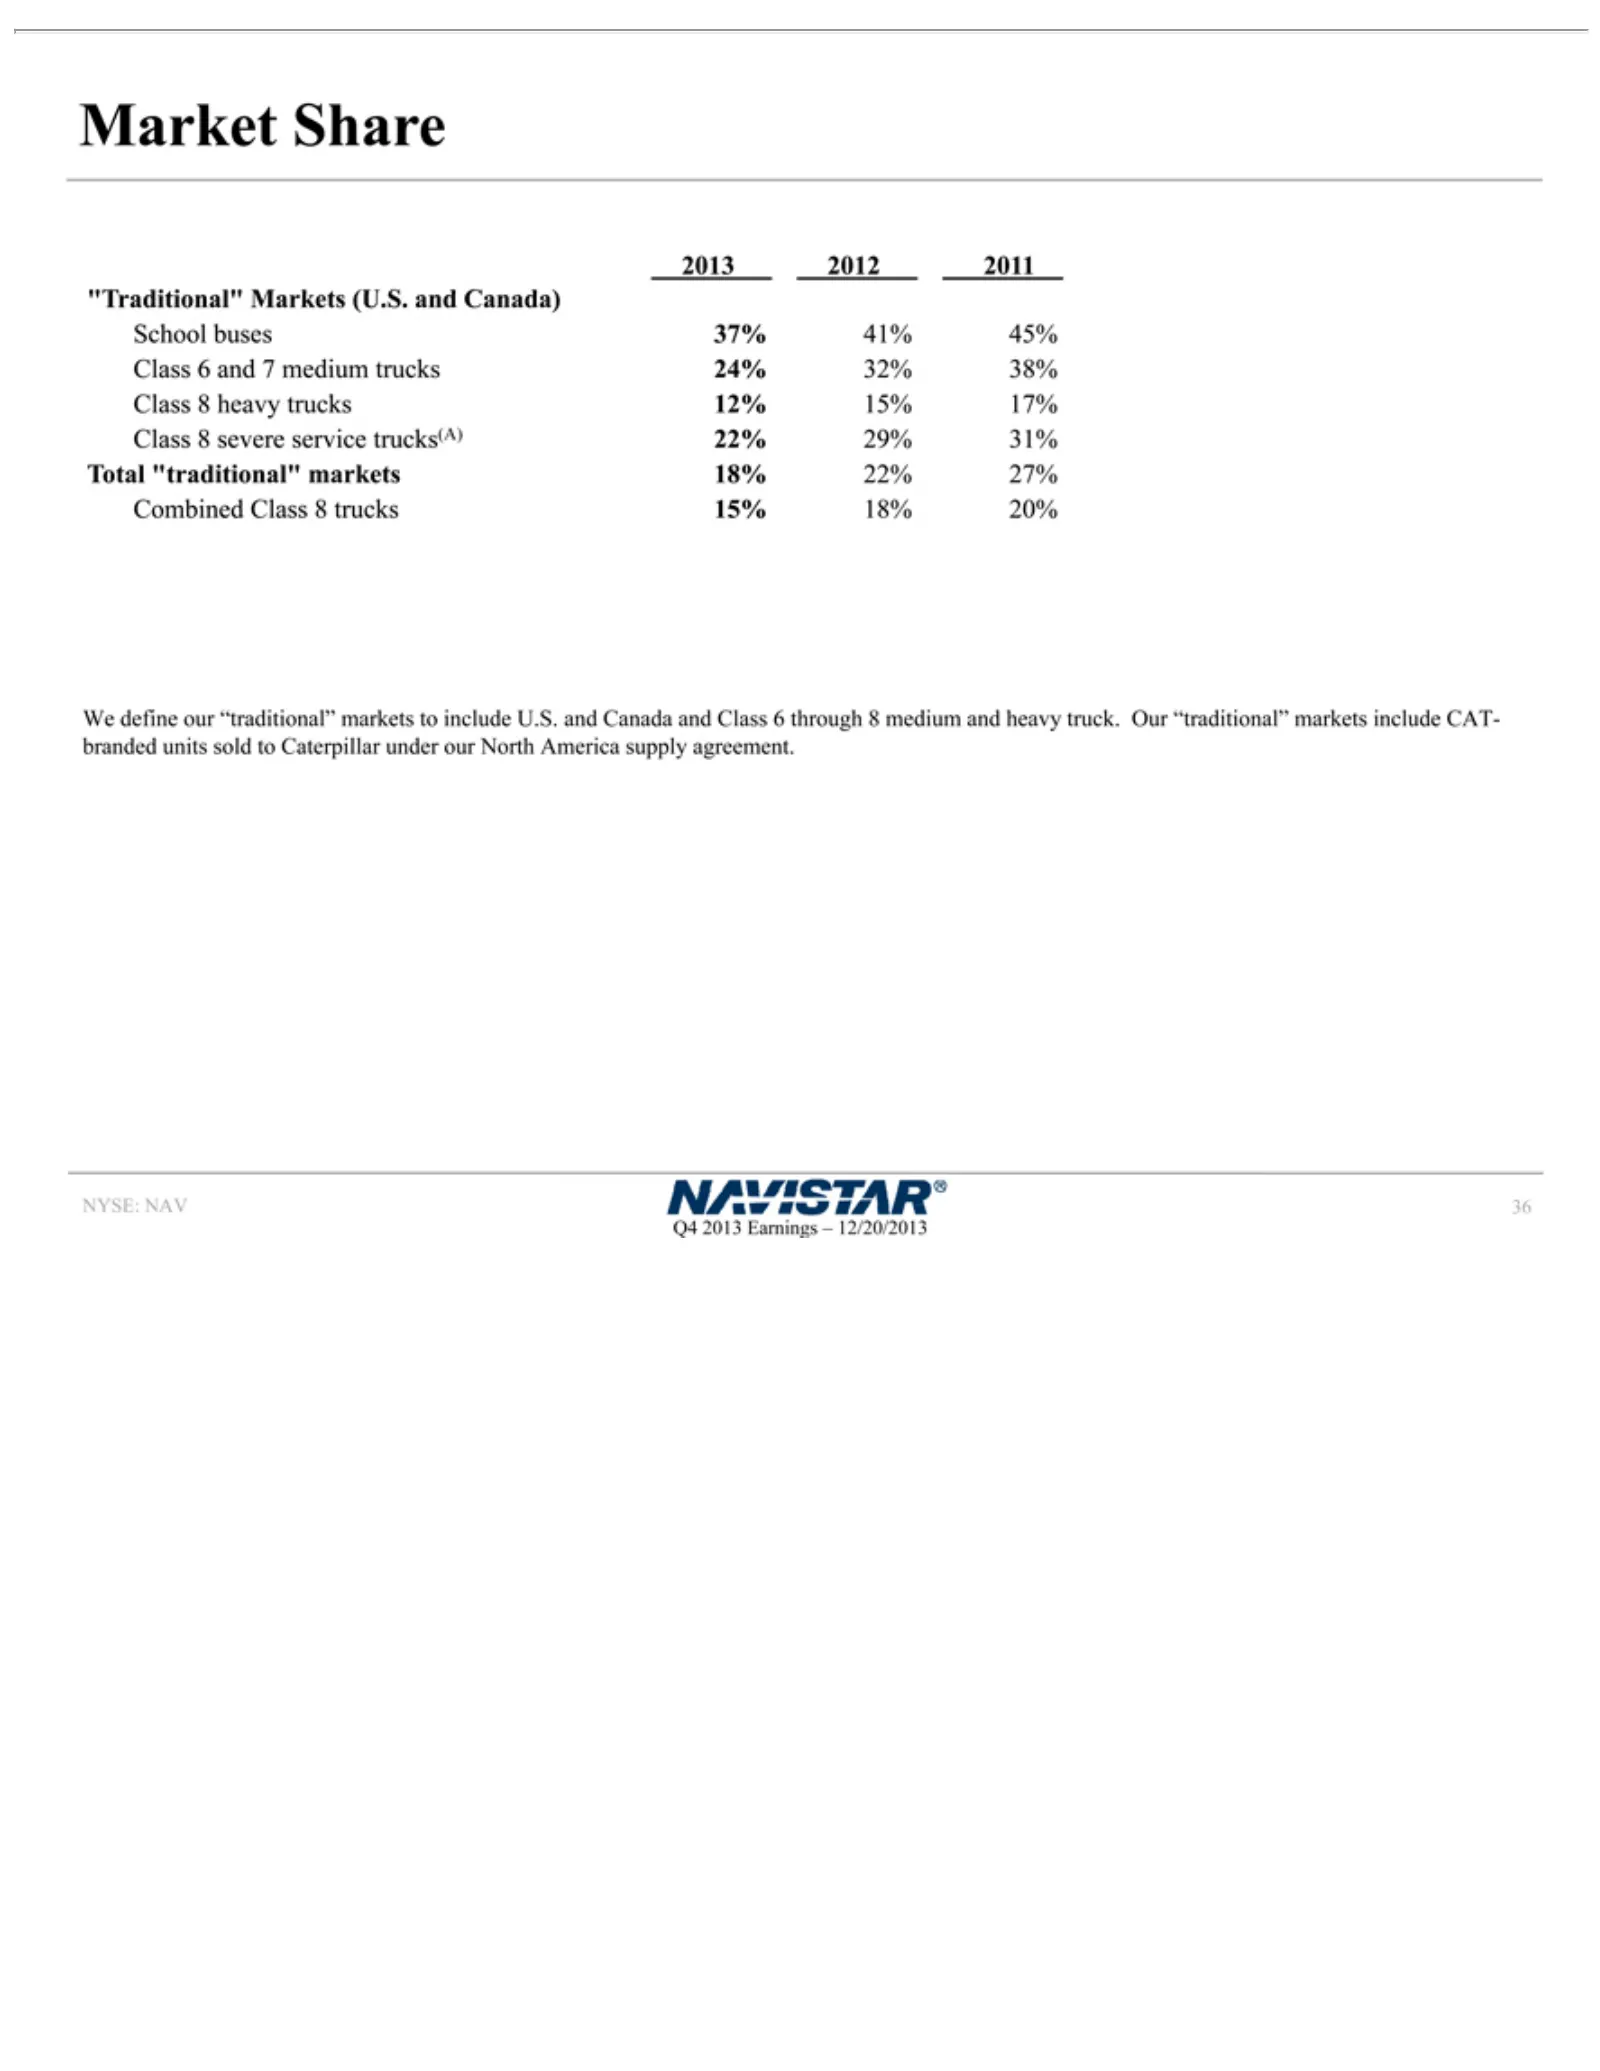
Market We 8supply NYSE: Q4 36severe 2013 define agreement. Share NAV service Earnings our “traditional” trucks(A) –2013 12/20/2013 2013 22 markets % 2012 29 %2012 to 31 include 2011 % Total U.S. 2011 “traditional” and “Traditional” Canadamarkets and Markets Class 18 6% (U.S. through 22 %and 278Canad
Slide 37: Worldwide Truck Chargeouts
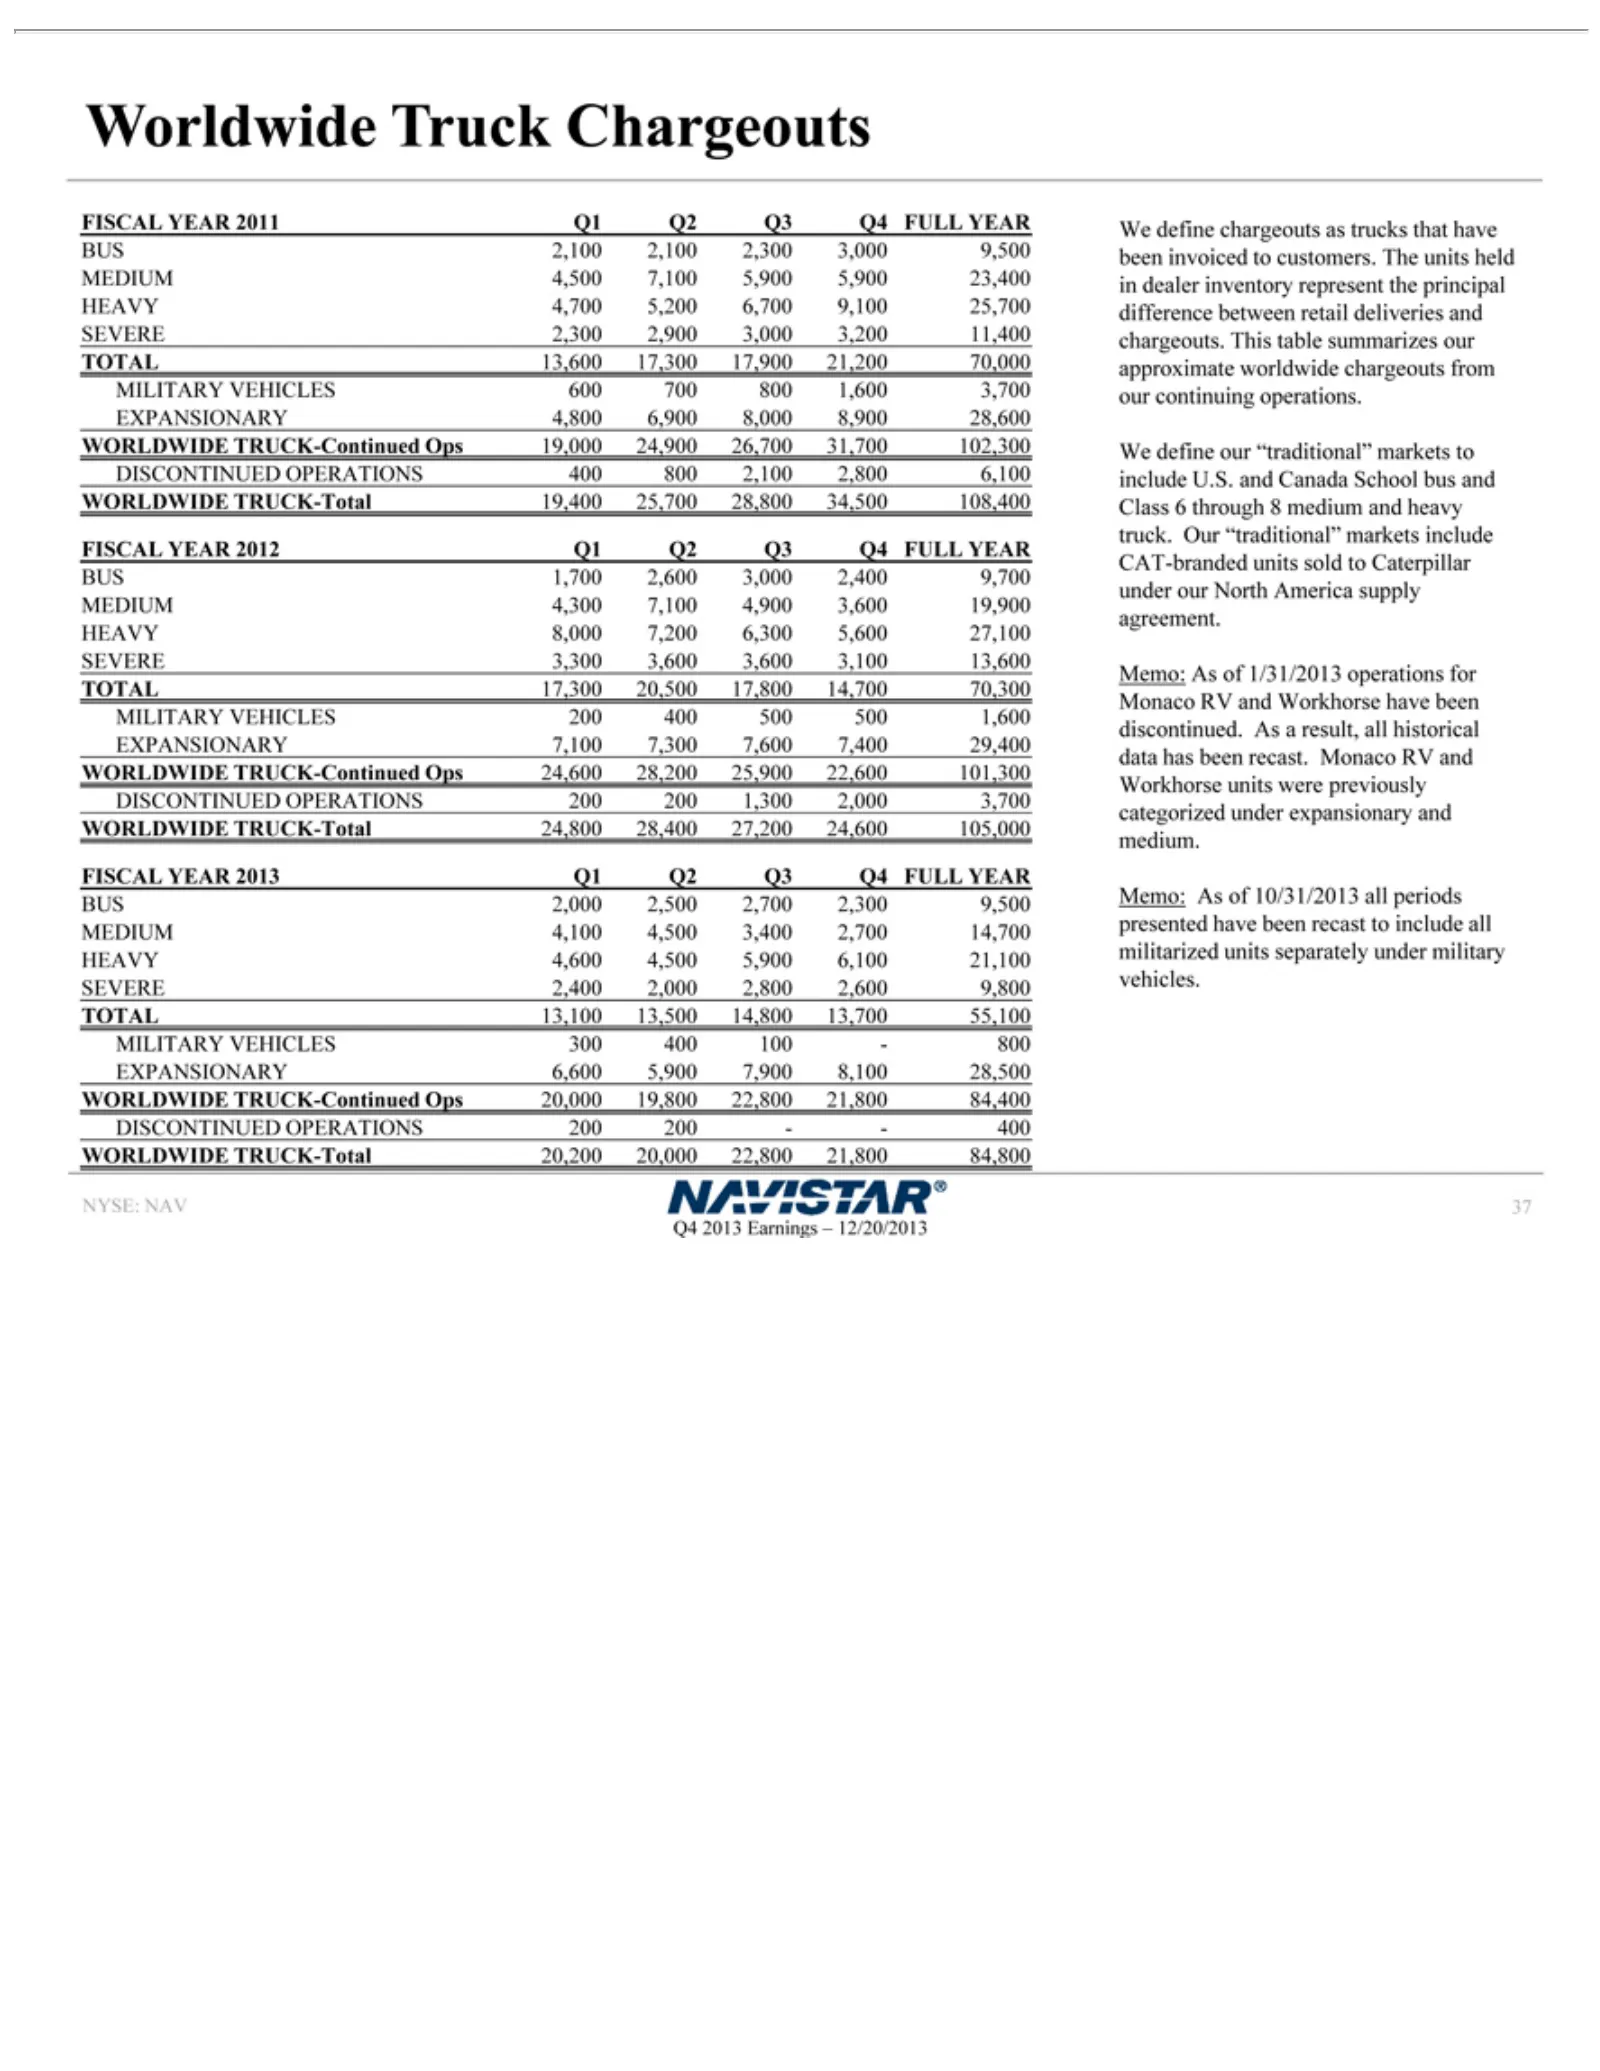
Worldwide We approximate markets data separately 2,300 Ops FULL 70,300 OPERATIONS 4,500 EXPANSIONARY 20,200 NYSE: Q4 37 2013 define 19,000 has 2,900 3,400 YEAR MILITARY 20,000 NAV include been Earnings under chargeouts Truck 24,900 3,000 2,700 worldwide recast. BUS 22,800 200 CAT-branded military Ch
Slide 38: Worldwide Engine Shipments
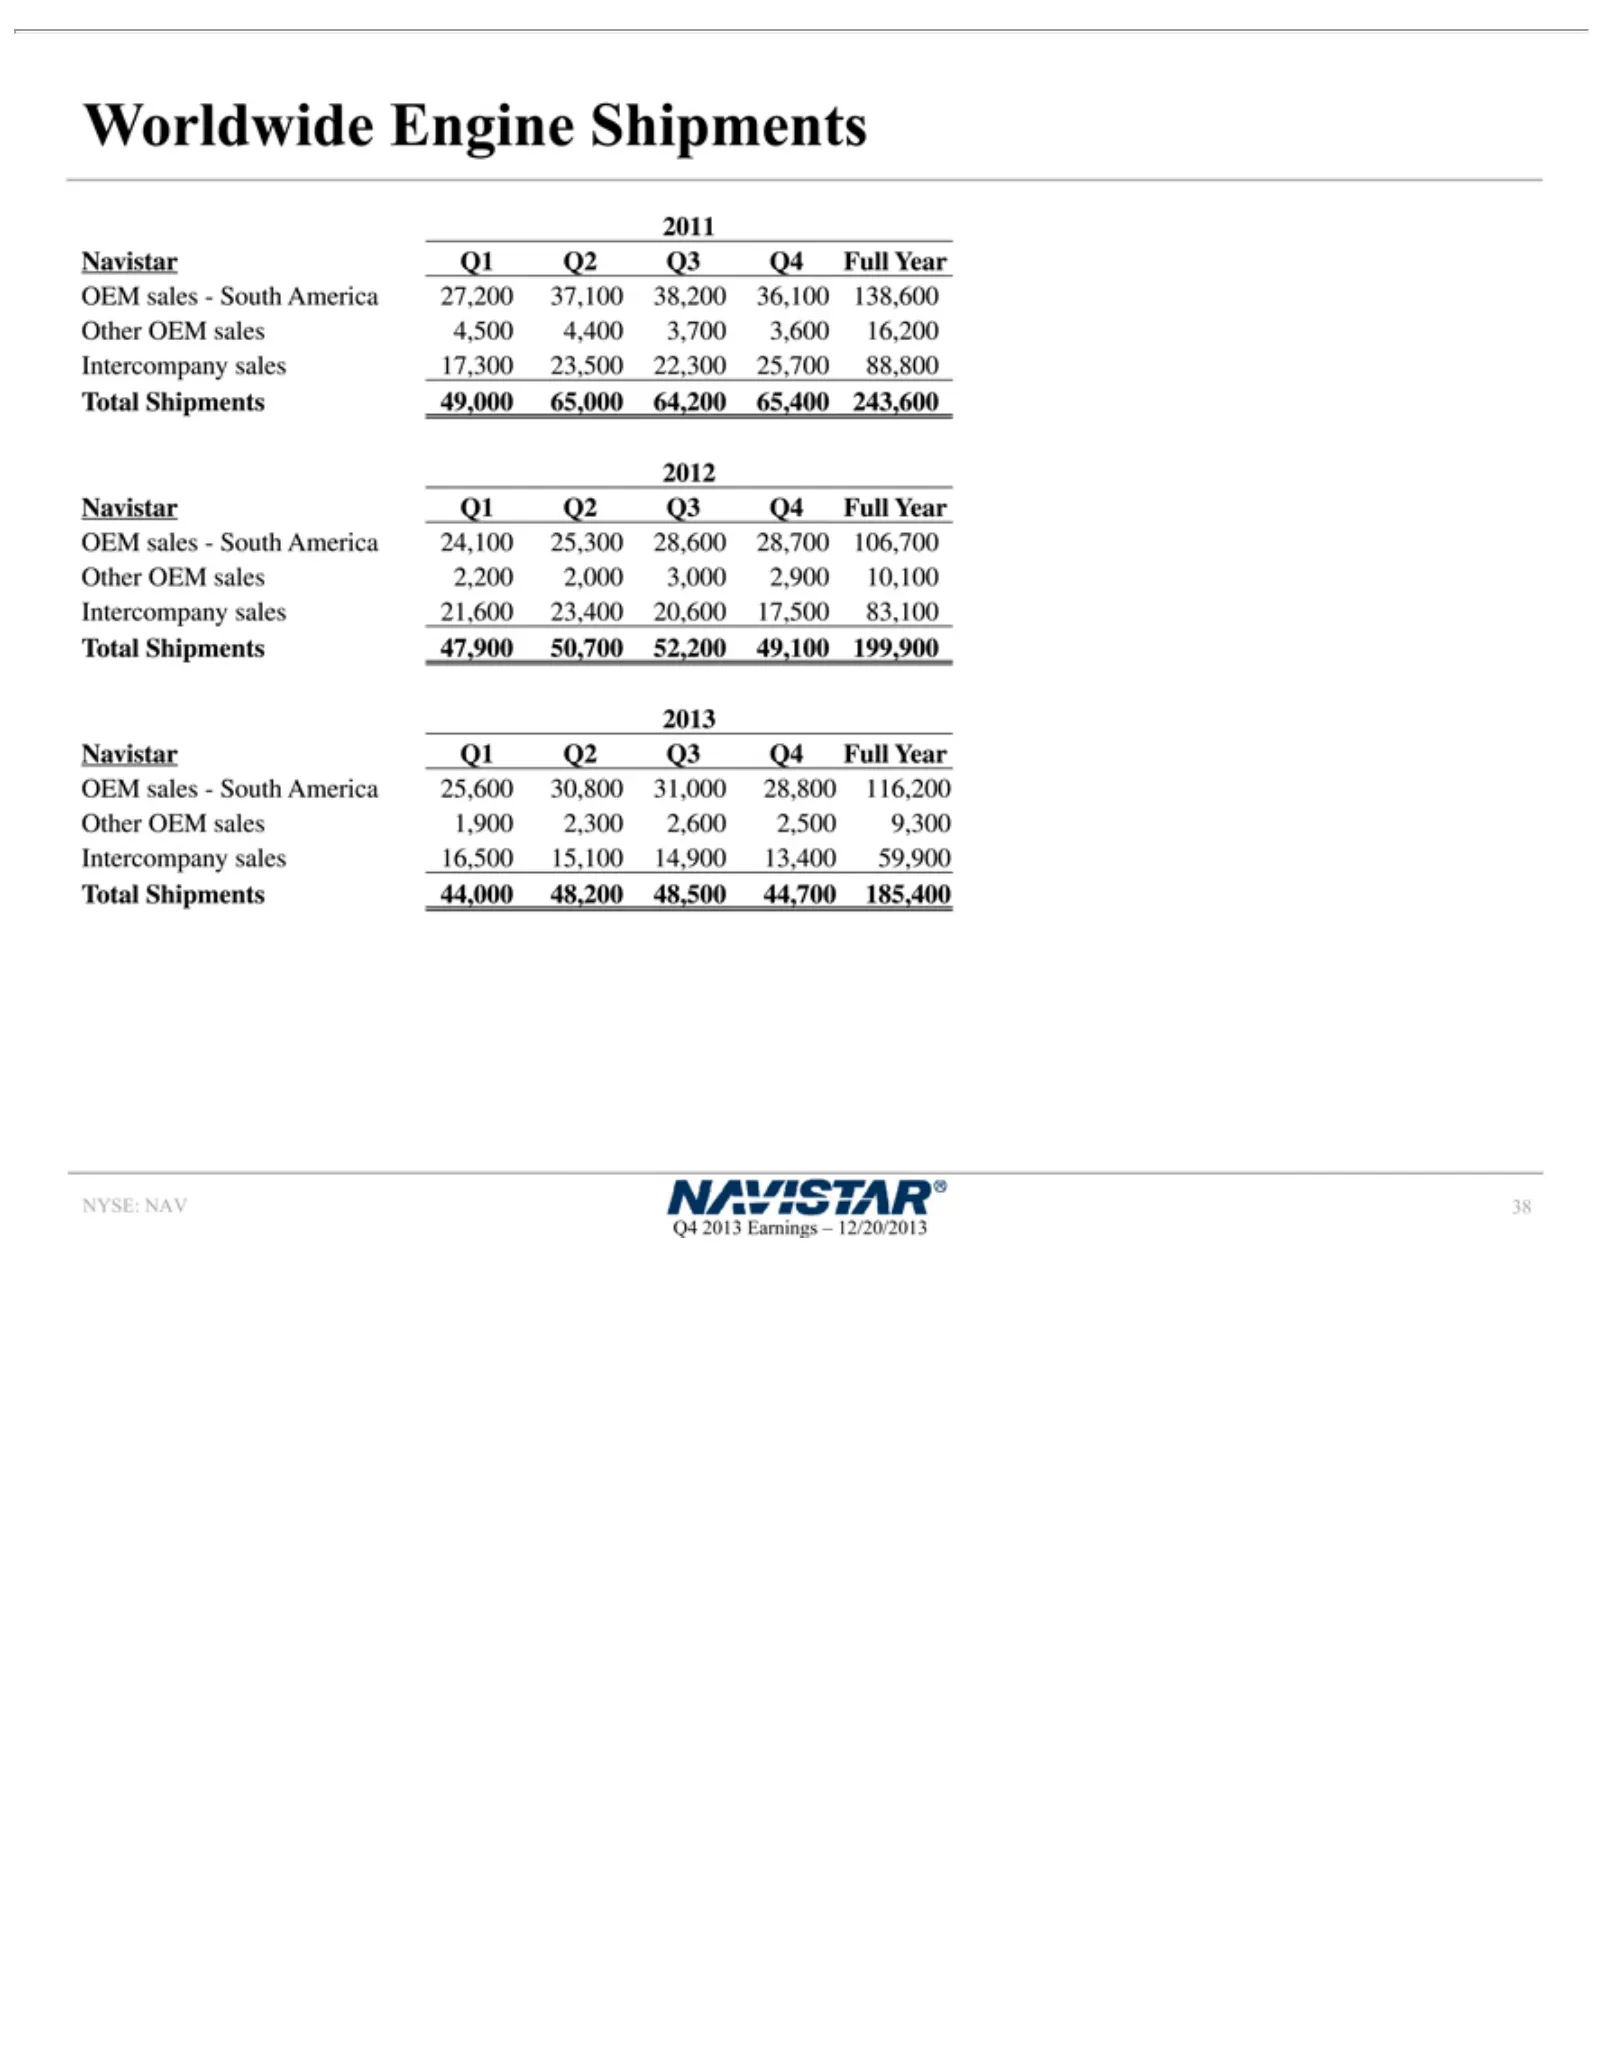
Worldwide 2011 22,300 OEM Year 48,500 NYSE: Q4 38 2013 OEM 2011 sales 25,700 44,700 NAV Earnings 2011 sales—South 2,200 Engine 88,800 185,400 2011 2,000 –Shipments 12/20/2013 2011 Total 3,000 America Navistar Shipments 2,900 25,600 10,100 Q149,000 Q2 30,800 Q3 Intercompany 65,000 Q4 31,000 Full64,20
Slide 39: Order Receipts
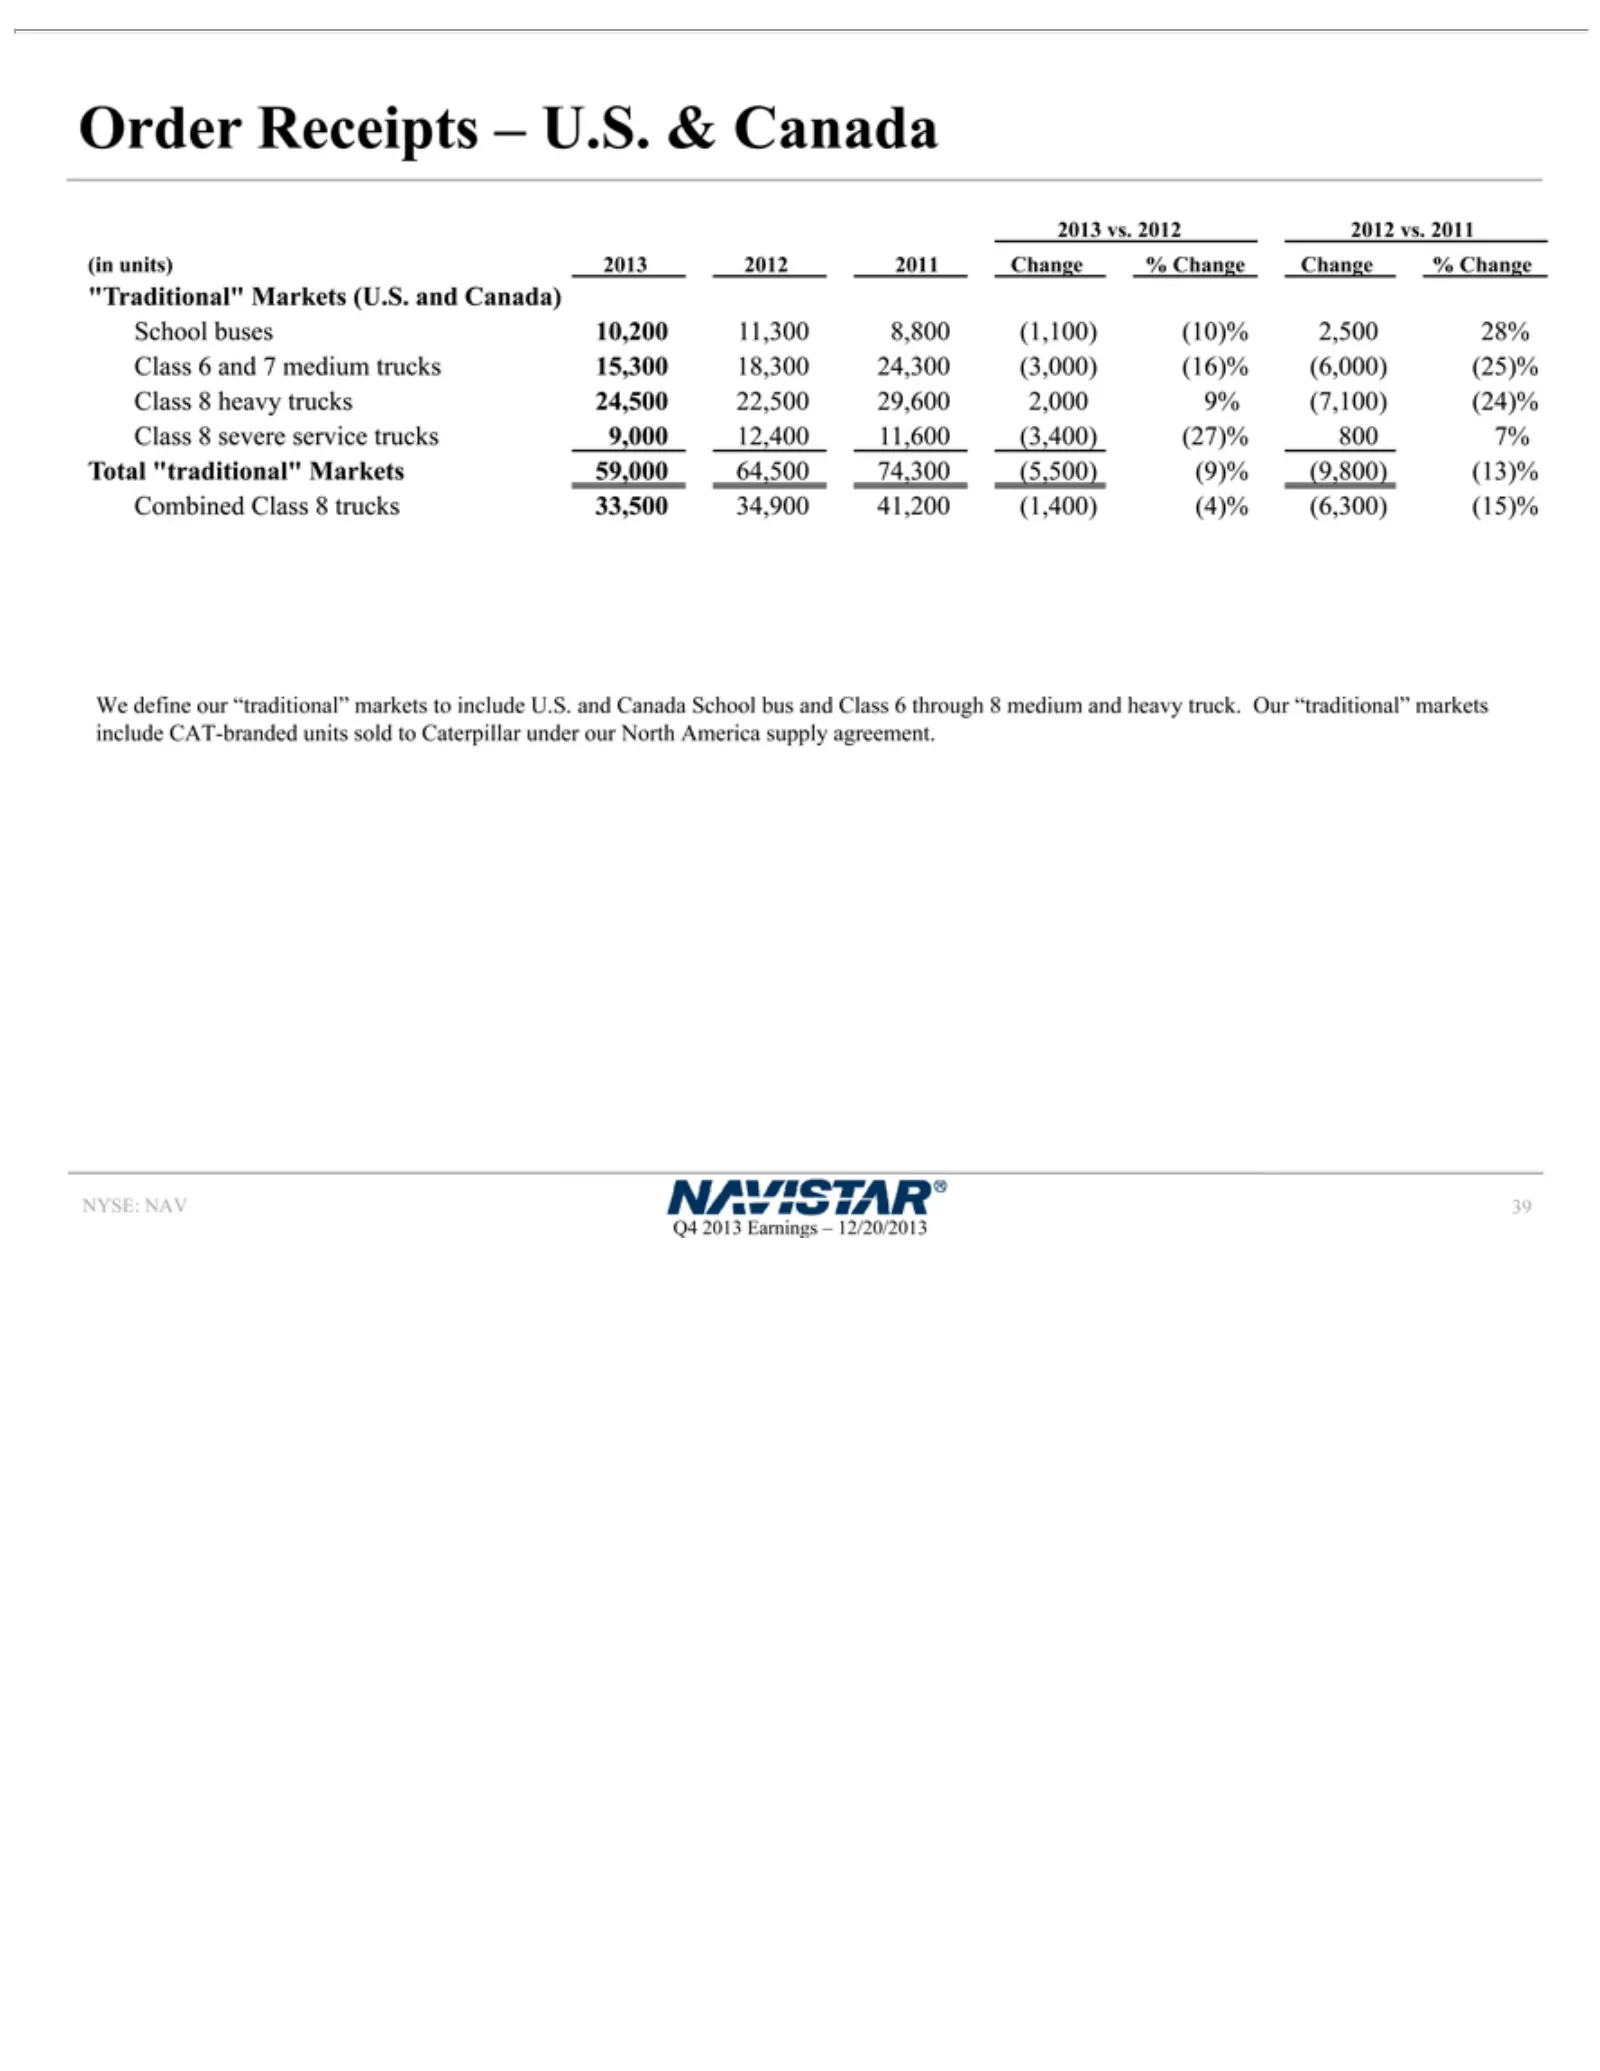
Order to (1,100 12,400 NYSE: Q4 39 Caterpillar 2013 Receipts )11,600 NAV (10 Earnings )%under (3,400 –2,500 U.S. – our 12/20/2013 )28 &(27 North Canada %)% Class America 800 We 67and define % supply Total 7 medium our “traditional” agreement. “traditional” trucks 15,300 2013 Markets markets vs. 18,3
Slide 40: U.S. and Canada Dealer Stock Inventory
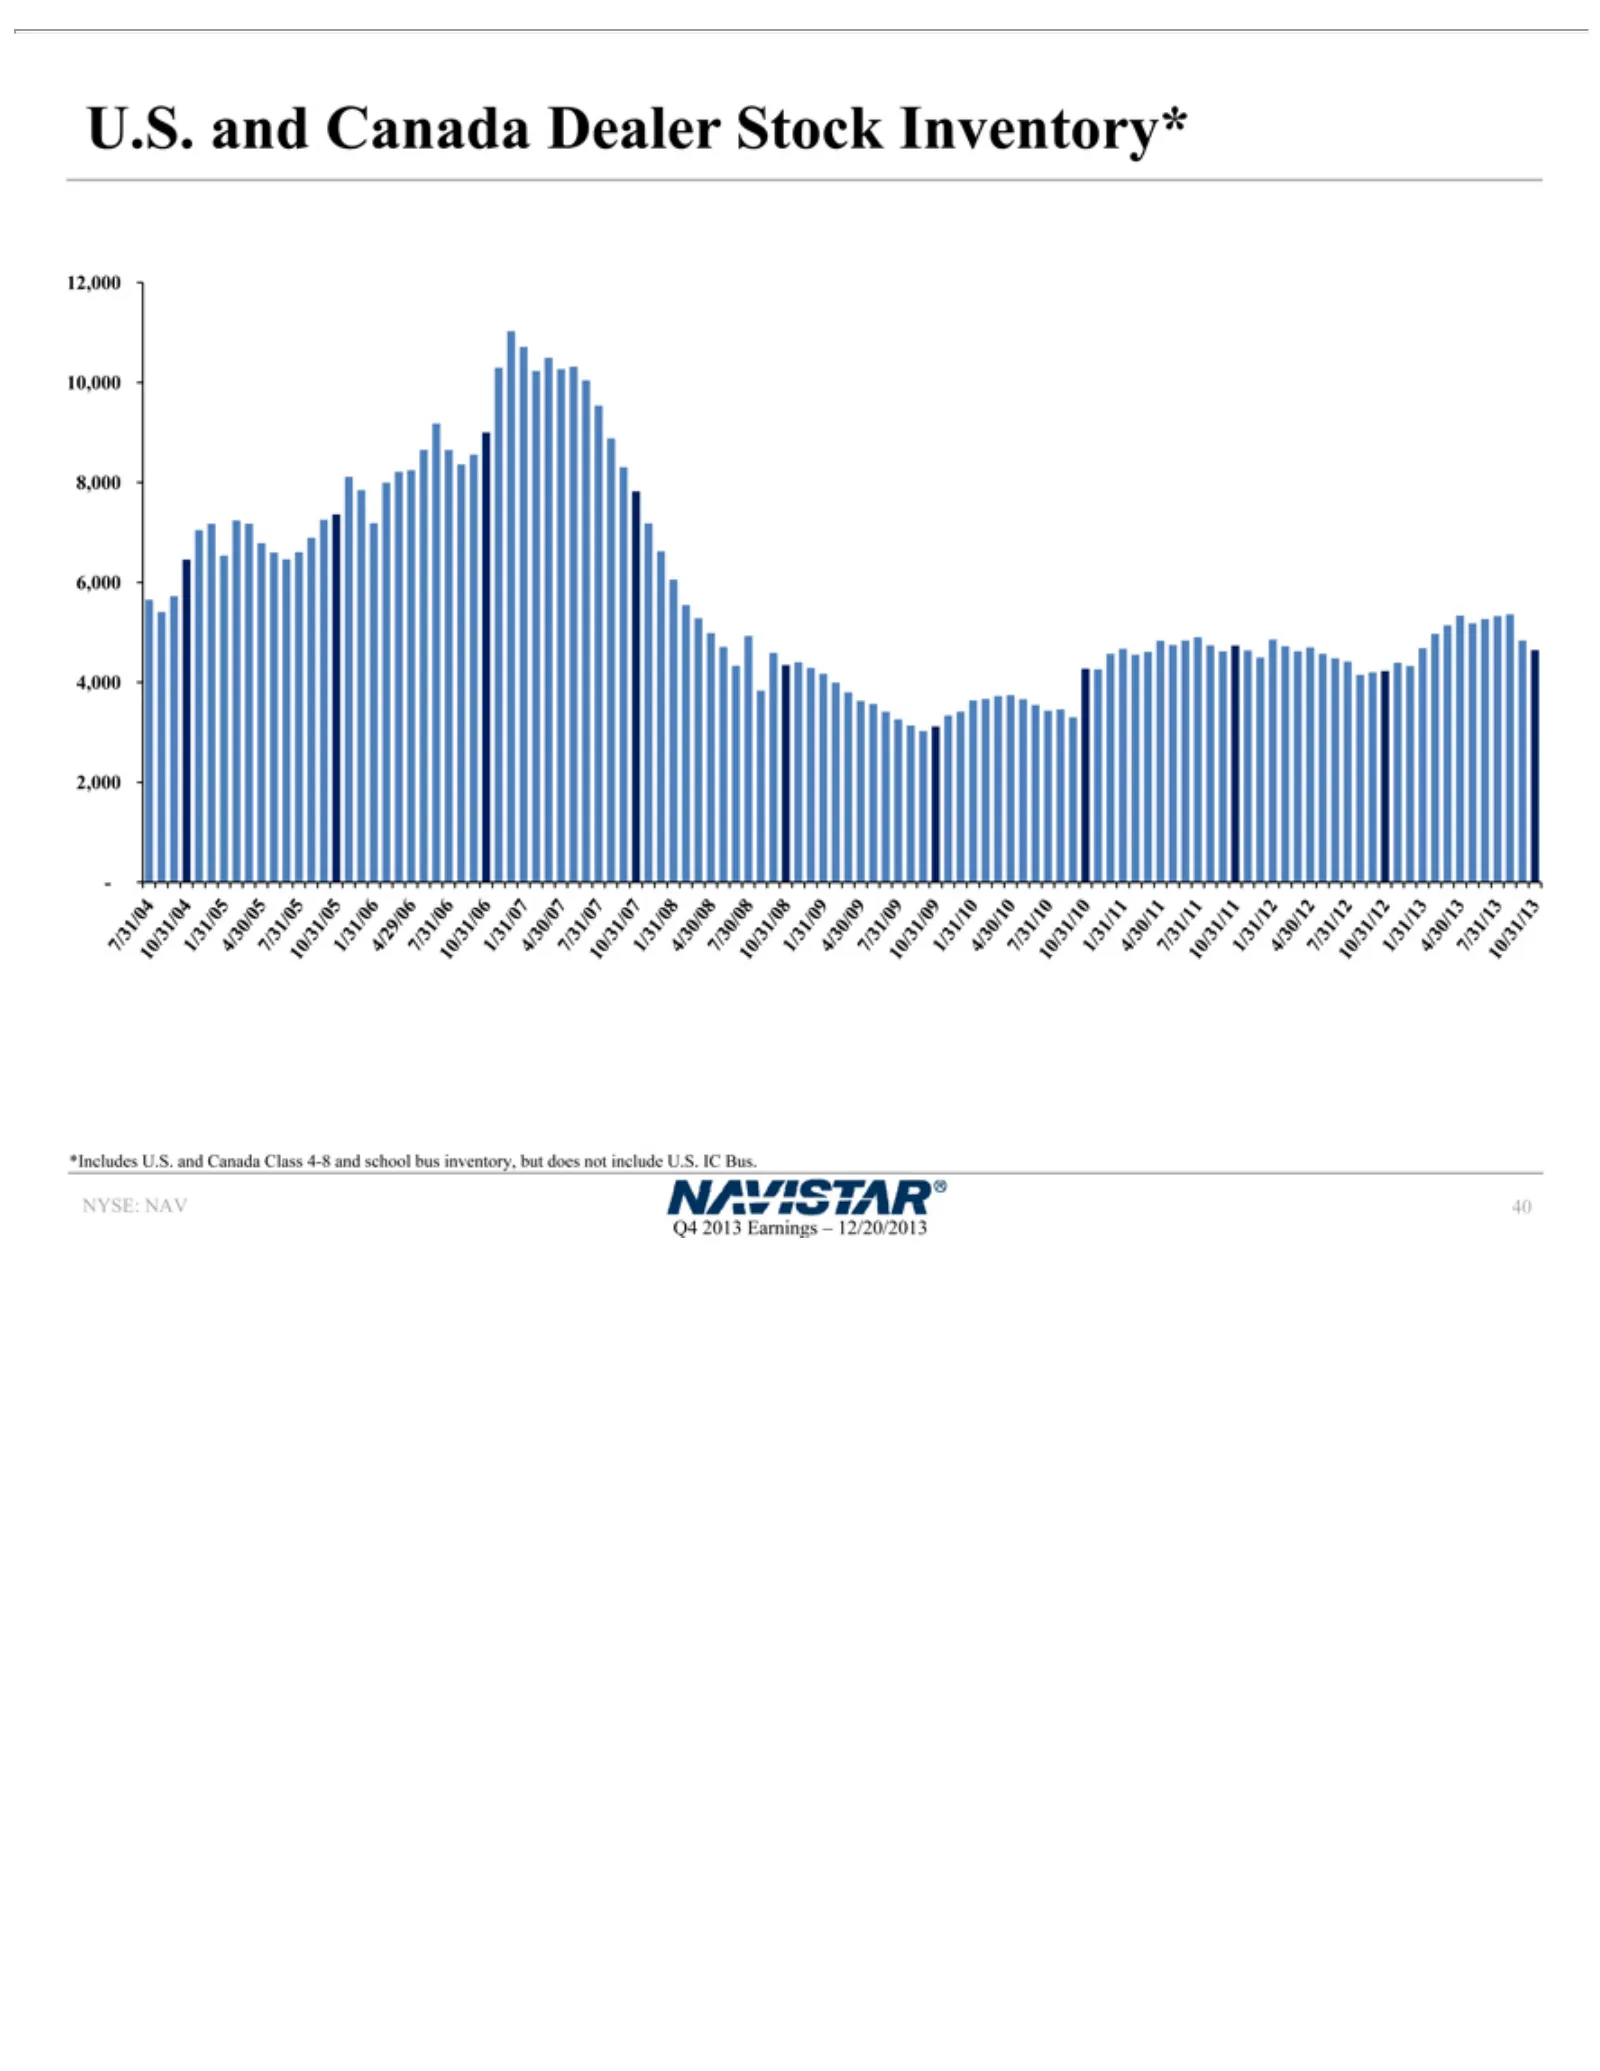
U.S.2013 Includes 12,000 4/30/09 NYSE: Q4 40 and10,000 NAV 7/31/09 U.S. Earnings Canada and 8,000 10/31/09 Dealer Canada – 12/20/2013 6,000 Stock 1/31/10 Class 4,000 Inventory* 4-8 2,000 4/30/10 and7/31/04 school 7/31/10 * bus 10/31/04 10/31/10 inventory, 1/31/05 1/31/11 but 4/30/05 does 4/30/11 not
Slide 41: Frequently Asked Questions
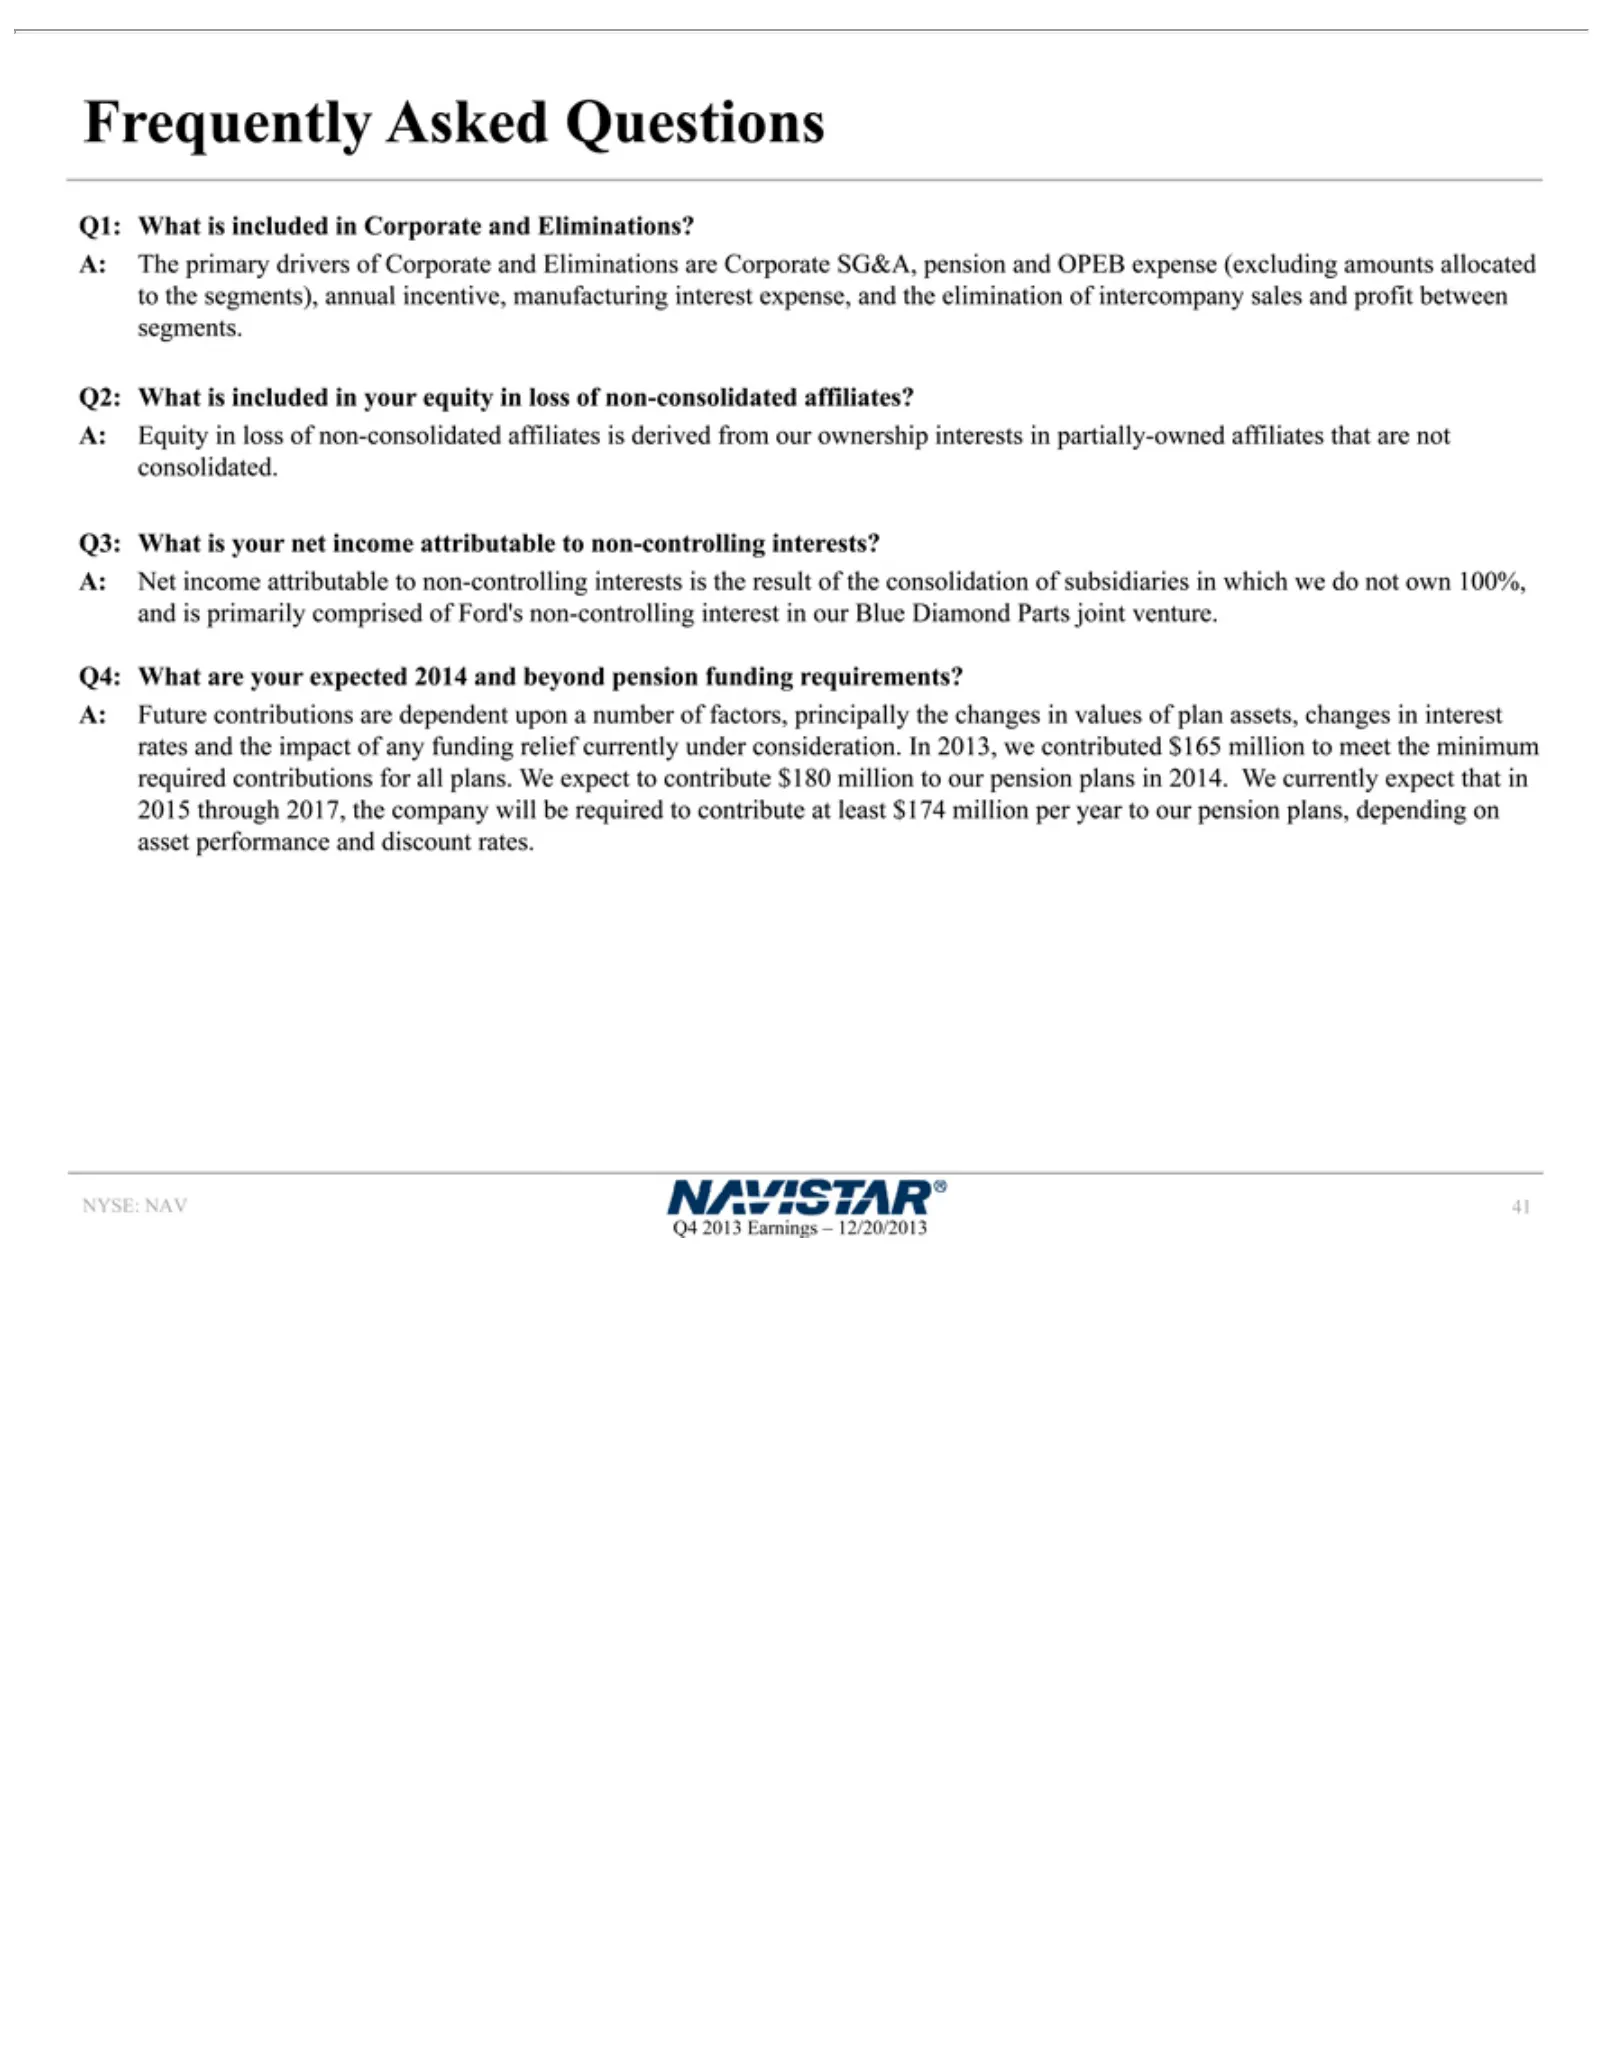
Frequently Q1: incentive, consolidated non-controlling are impact 2014. NYSE: Q4 41 your 2013 What Weof NAV expected Earnings currently any is manufacturing Asked included affiliates funding interests Questions 2014 –expect 12/20/2013 in is relief and Corporate derived isinterest that the beyond cur
Slide 42: Frequently Asked Questions
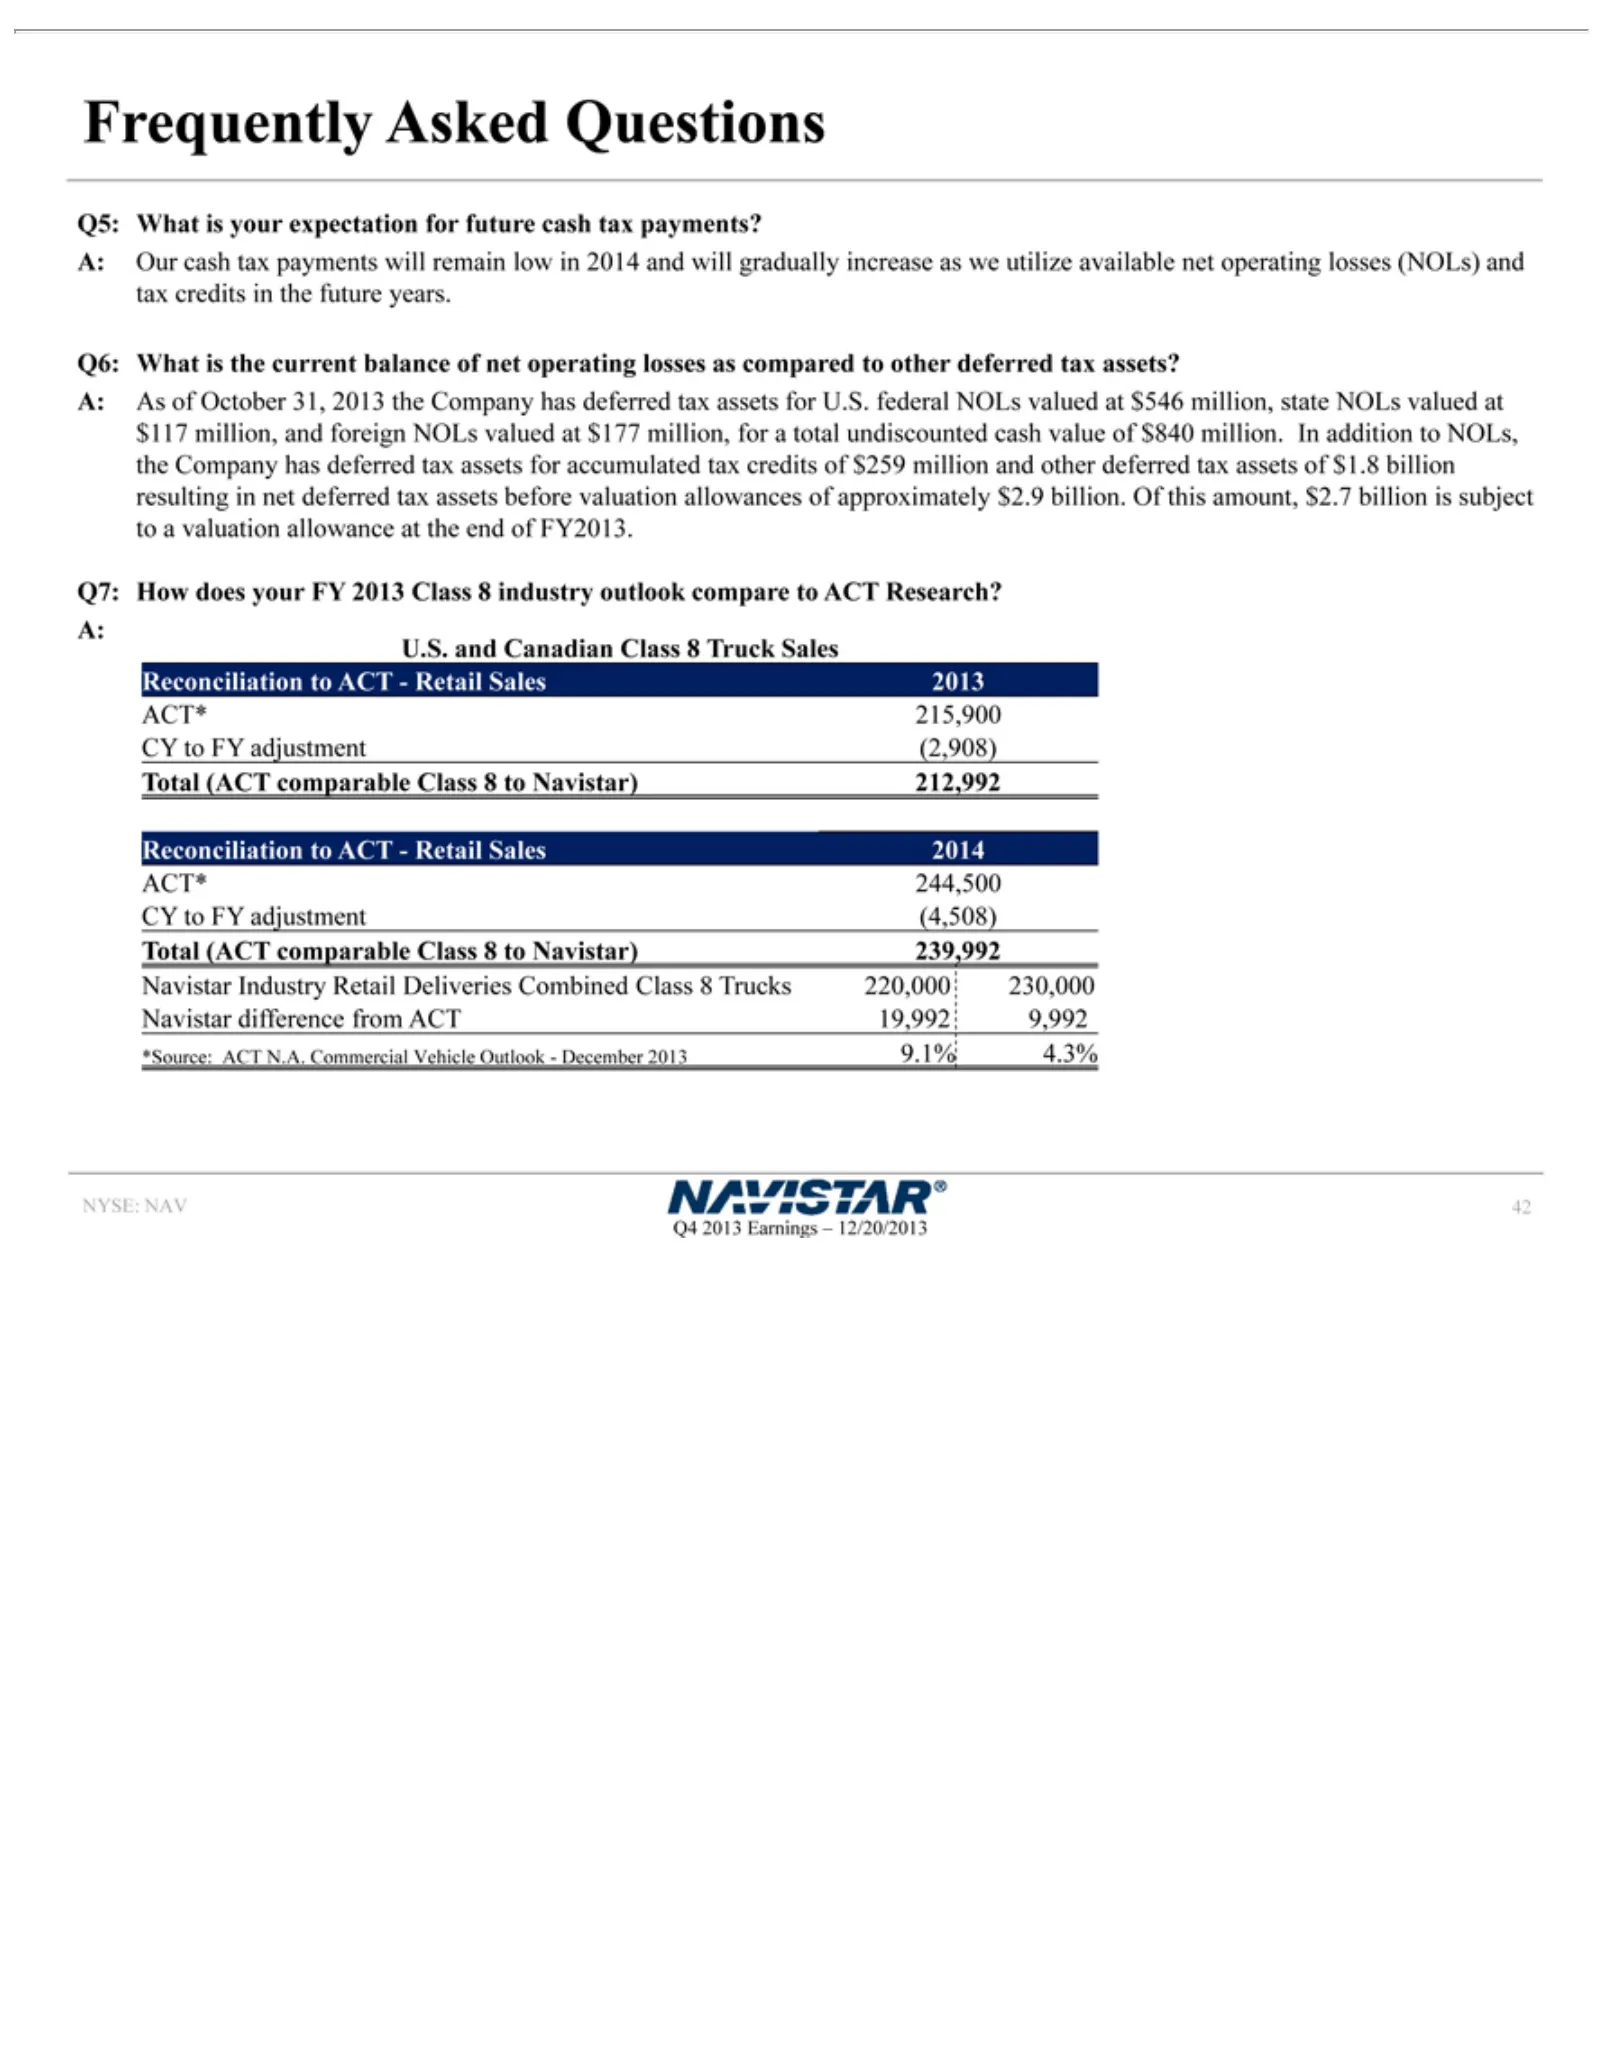
Frequently Q5: years. state of at adjustment Navistar NYSE: Q4 42 the $259 2013 What NOLs end Q6: NAV million Industry Earnings of isWhat Asked (2,908) valued your FY2013. and isexpectation Retail Questions –the at Total other 12/20/2013 $117 Q7: current Deliveries ACT deferred How million, for bala
Slide 43: Frequently Asked Questions
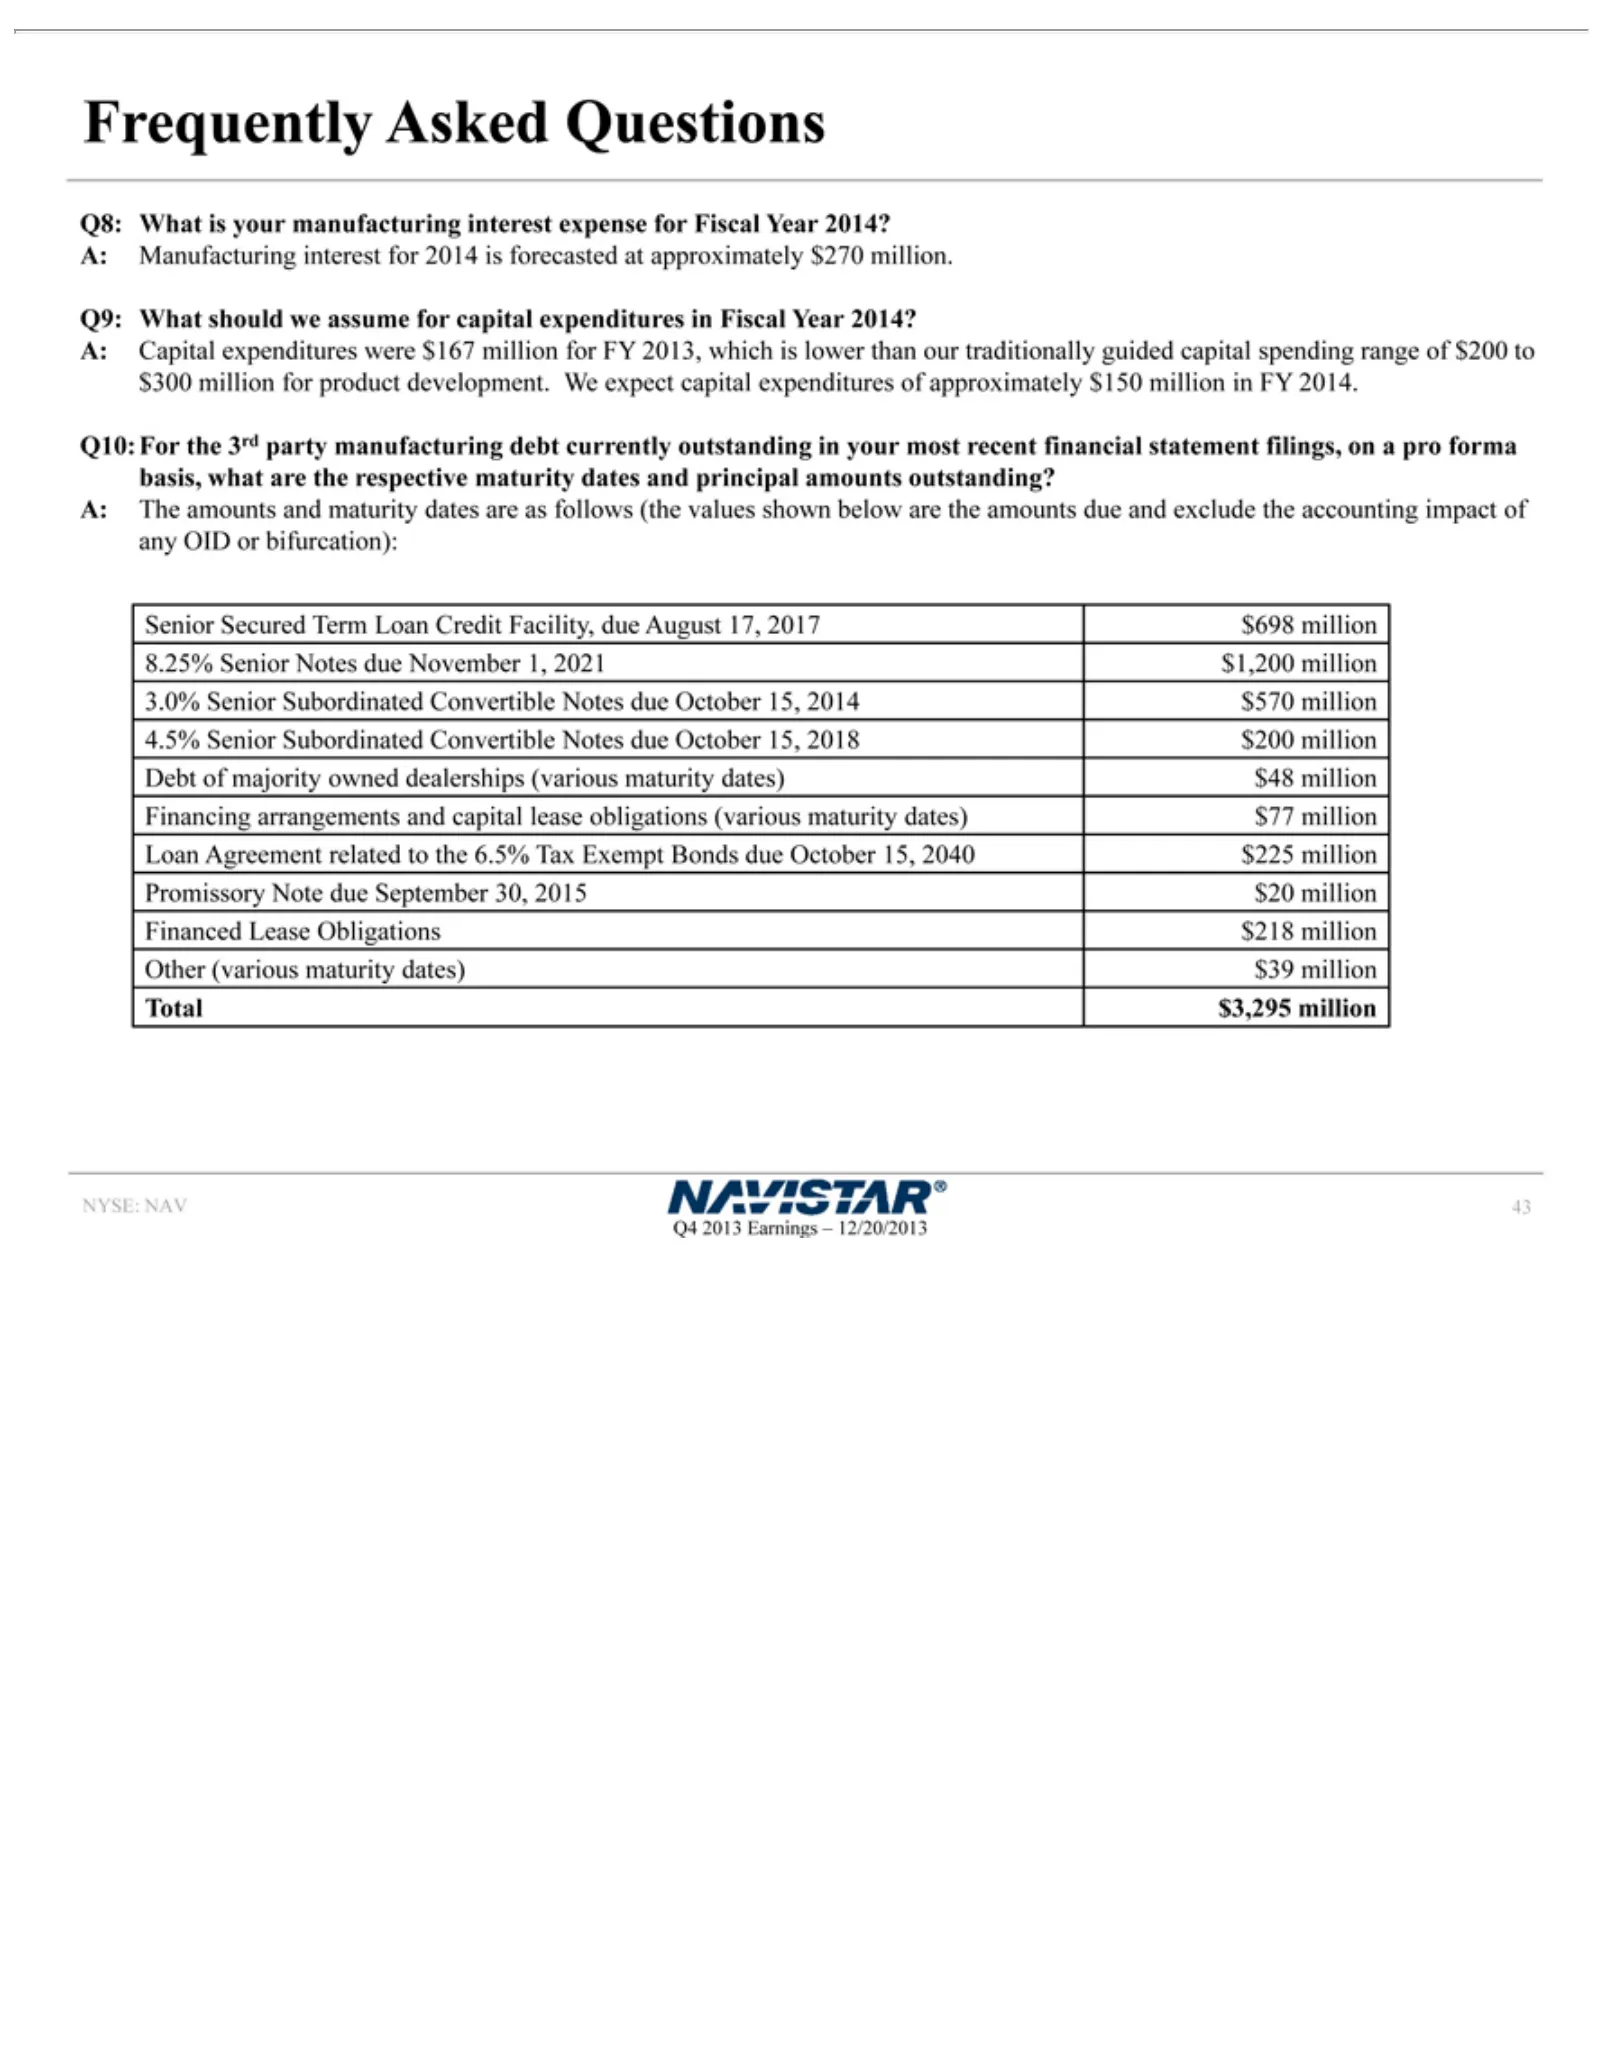
Frequently Q8: Year of and Loan Subordinated dates) (various NYSE: Q4 43 approximately 2013 principal What 2014? Credit $77 NAV maturity Earnings ismillion Asked A: Facility, your amounts Convertible Capital $150 manufacturing dates) Questions –Loan 12/20/2013 due expenditures outstanding? million A
Slide 44: Outstanding Debt
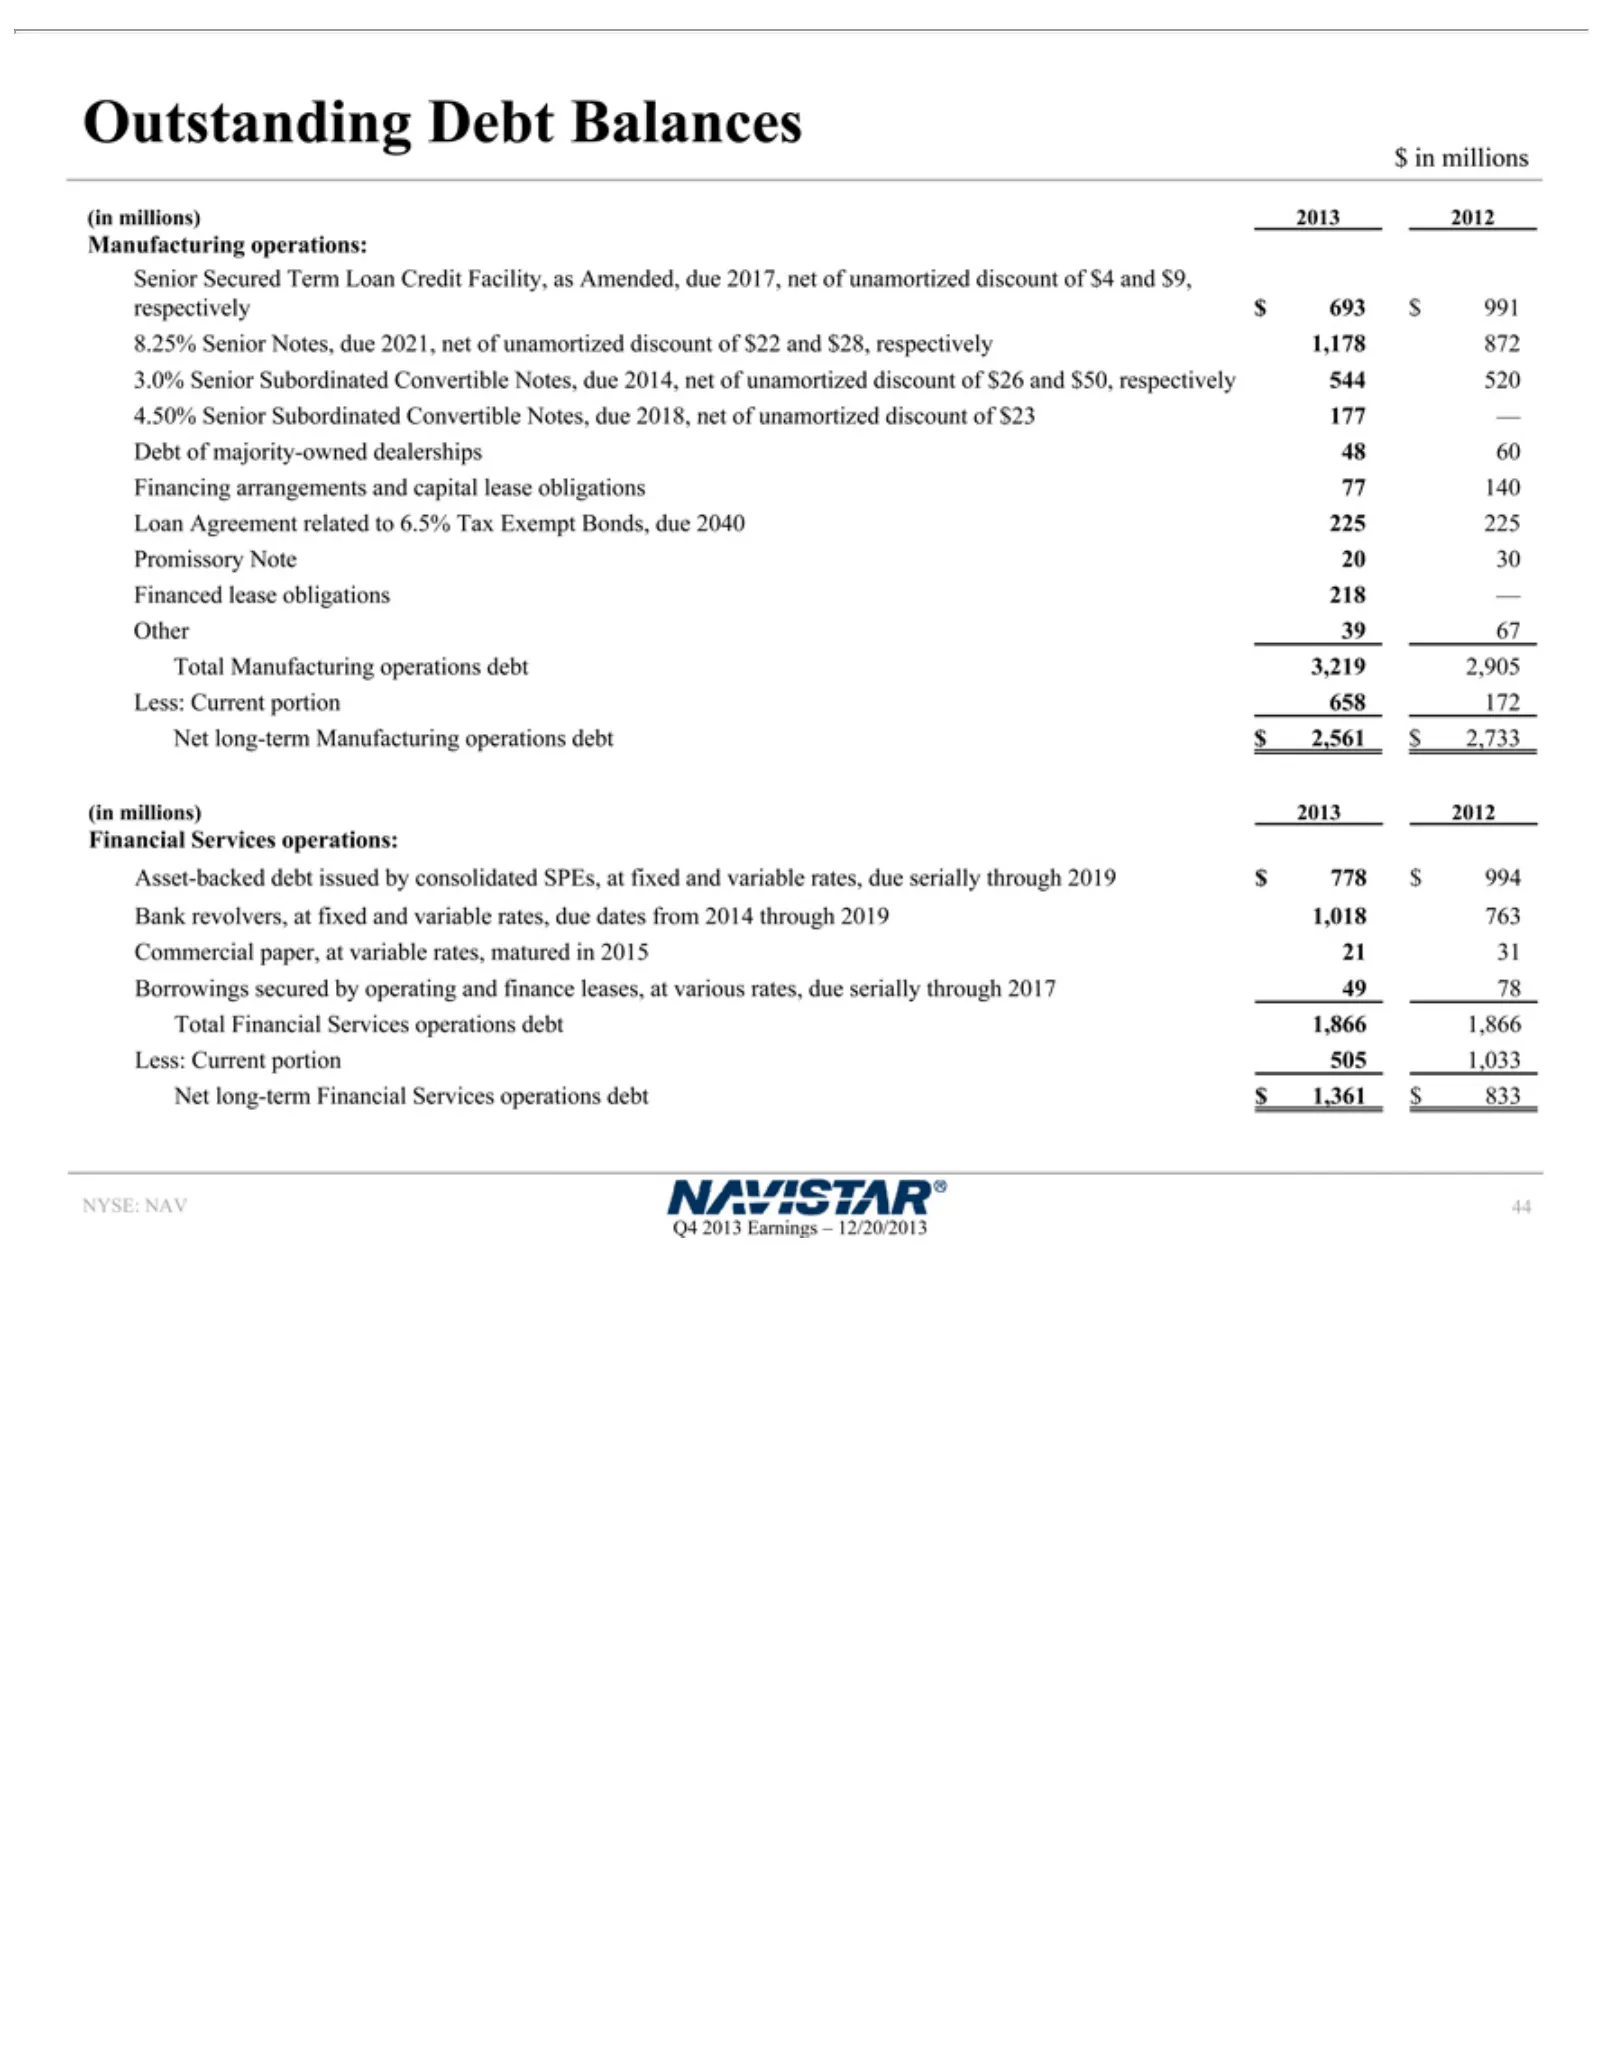
$Outstanding Manufacturing Senior respectively 8.25% 3.0% 4.50% Debt Financing Loan Promissory Financed Other (in Financial Asset-backed Bank Commercial Borrowings Total Less: Net NYSE: Q4 44inmillions) 2013 long-term millions of Agreement Manufacturing Financial Senior revolvers, Current 39 Senior
Slide 45: Manufacturing Cash Flow
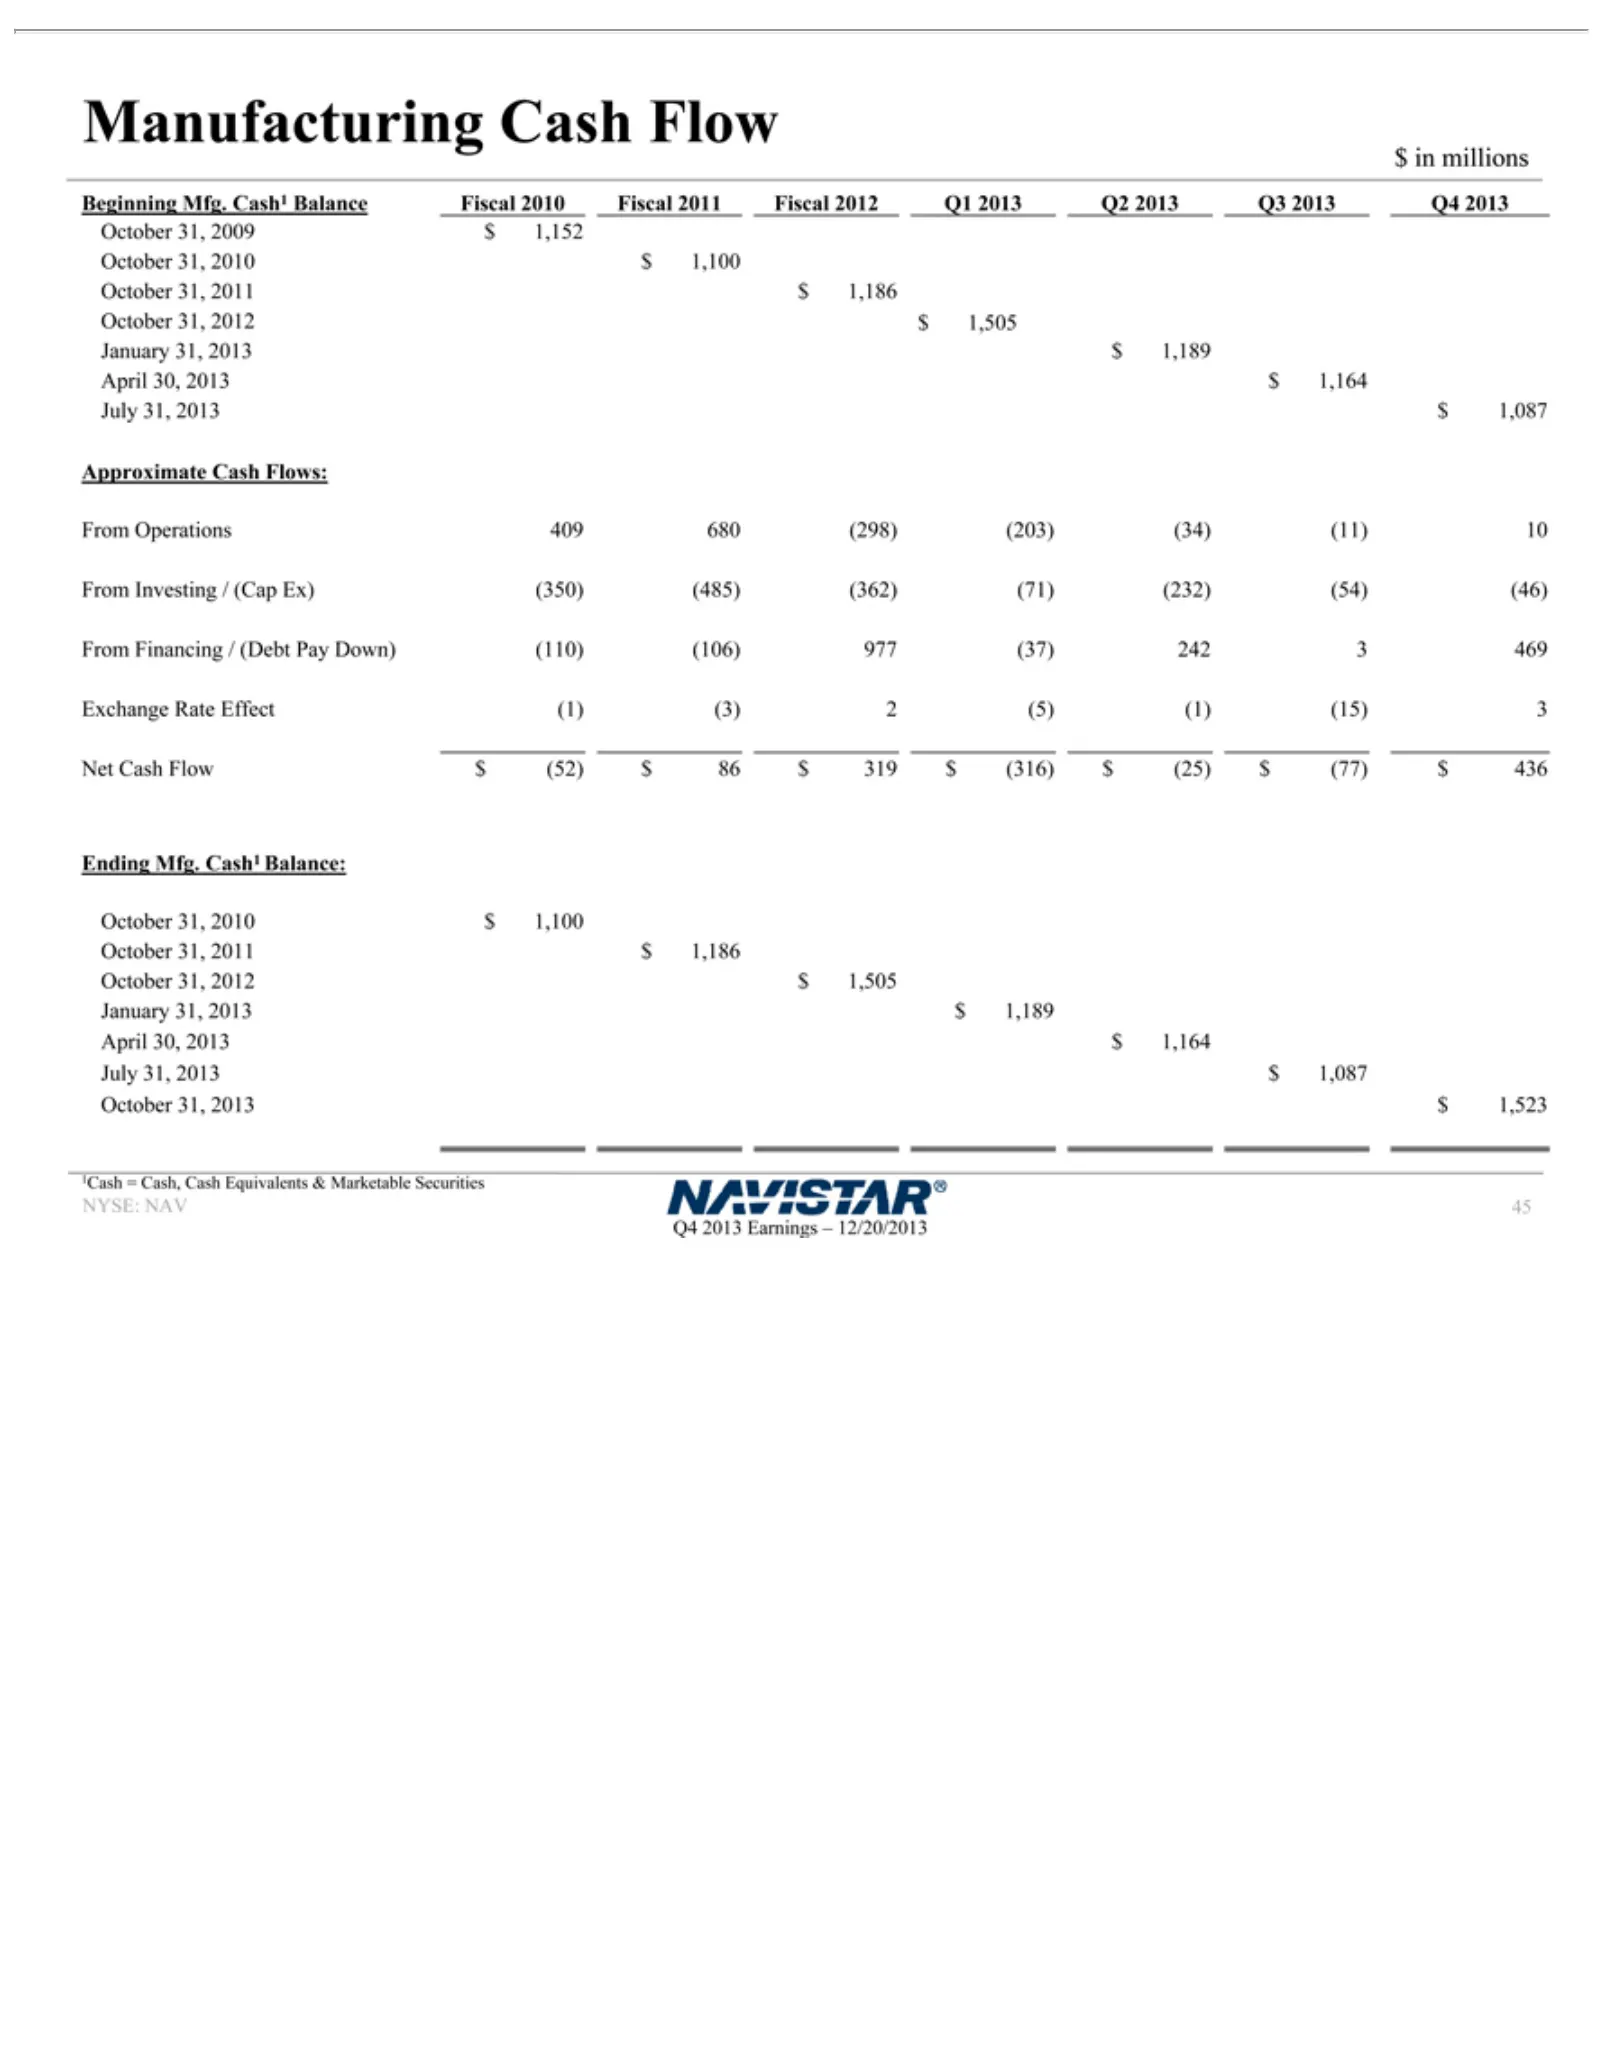
Manufacturing Beginning January (350) Ending Cash, NYSE: Q4 45 2013 (485) Cash Mfg. NAV 31, Earnings Mfg. Equivalents (362) 2013 Cash1 Cash Cash1 $(71) –1,189 Balance: 12/20/2013 Flow (232) Balance &April Marketable (54) October 30, Fiscal (46) 2013 31, From 2010 Securities $2010 1,164 Fiscal Financ
Slide 46: SEC Regulation G Non-GAAP Reconciliation
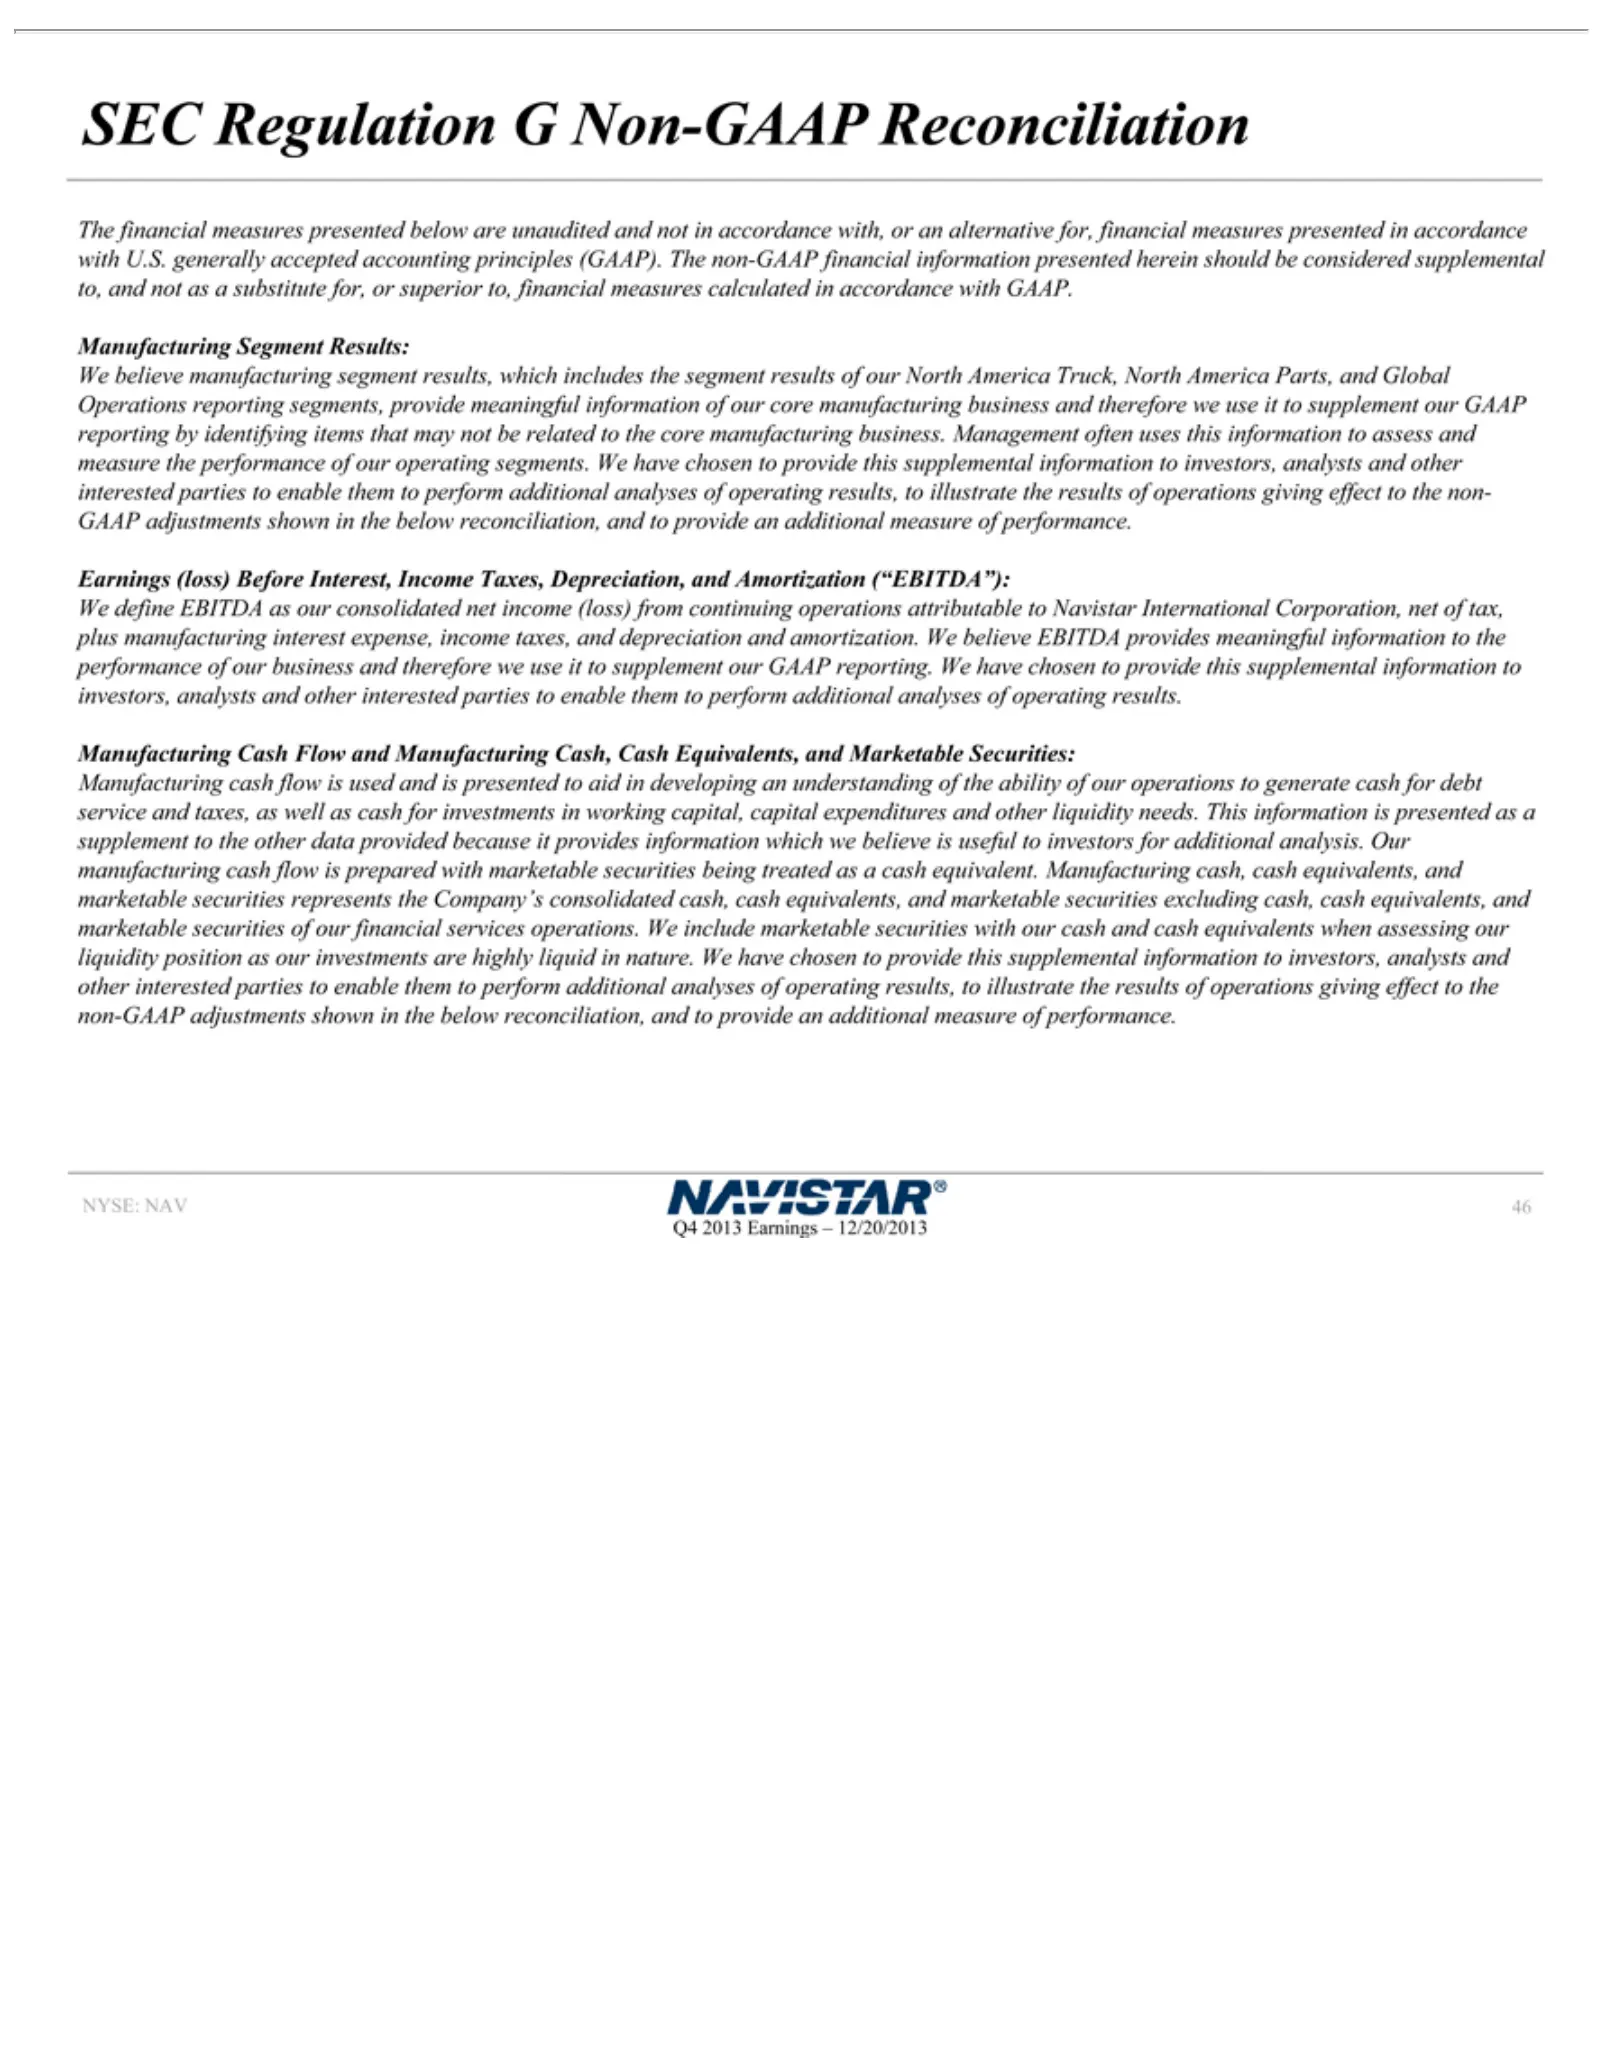
SEC The non-GAAP Results: assess of Interest, plus our Flow debt information and include investors, reconciliation, NYSE: Q4 46 operating 2013 core GAAP marketable financial manufacturing service Regulation and and NAV marketable We Income manufacturing Earnings Manufacturing analysts measure report
Slide 47: SEC Regulation G Manufacturing Cash Reconciliation
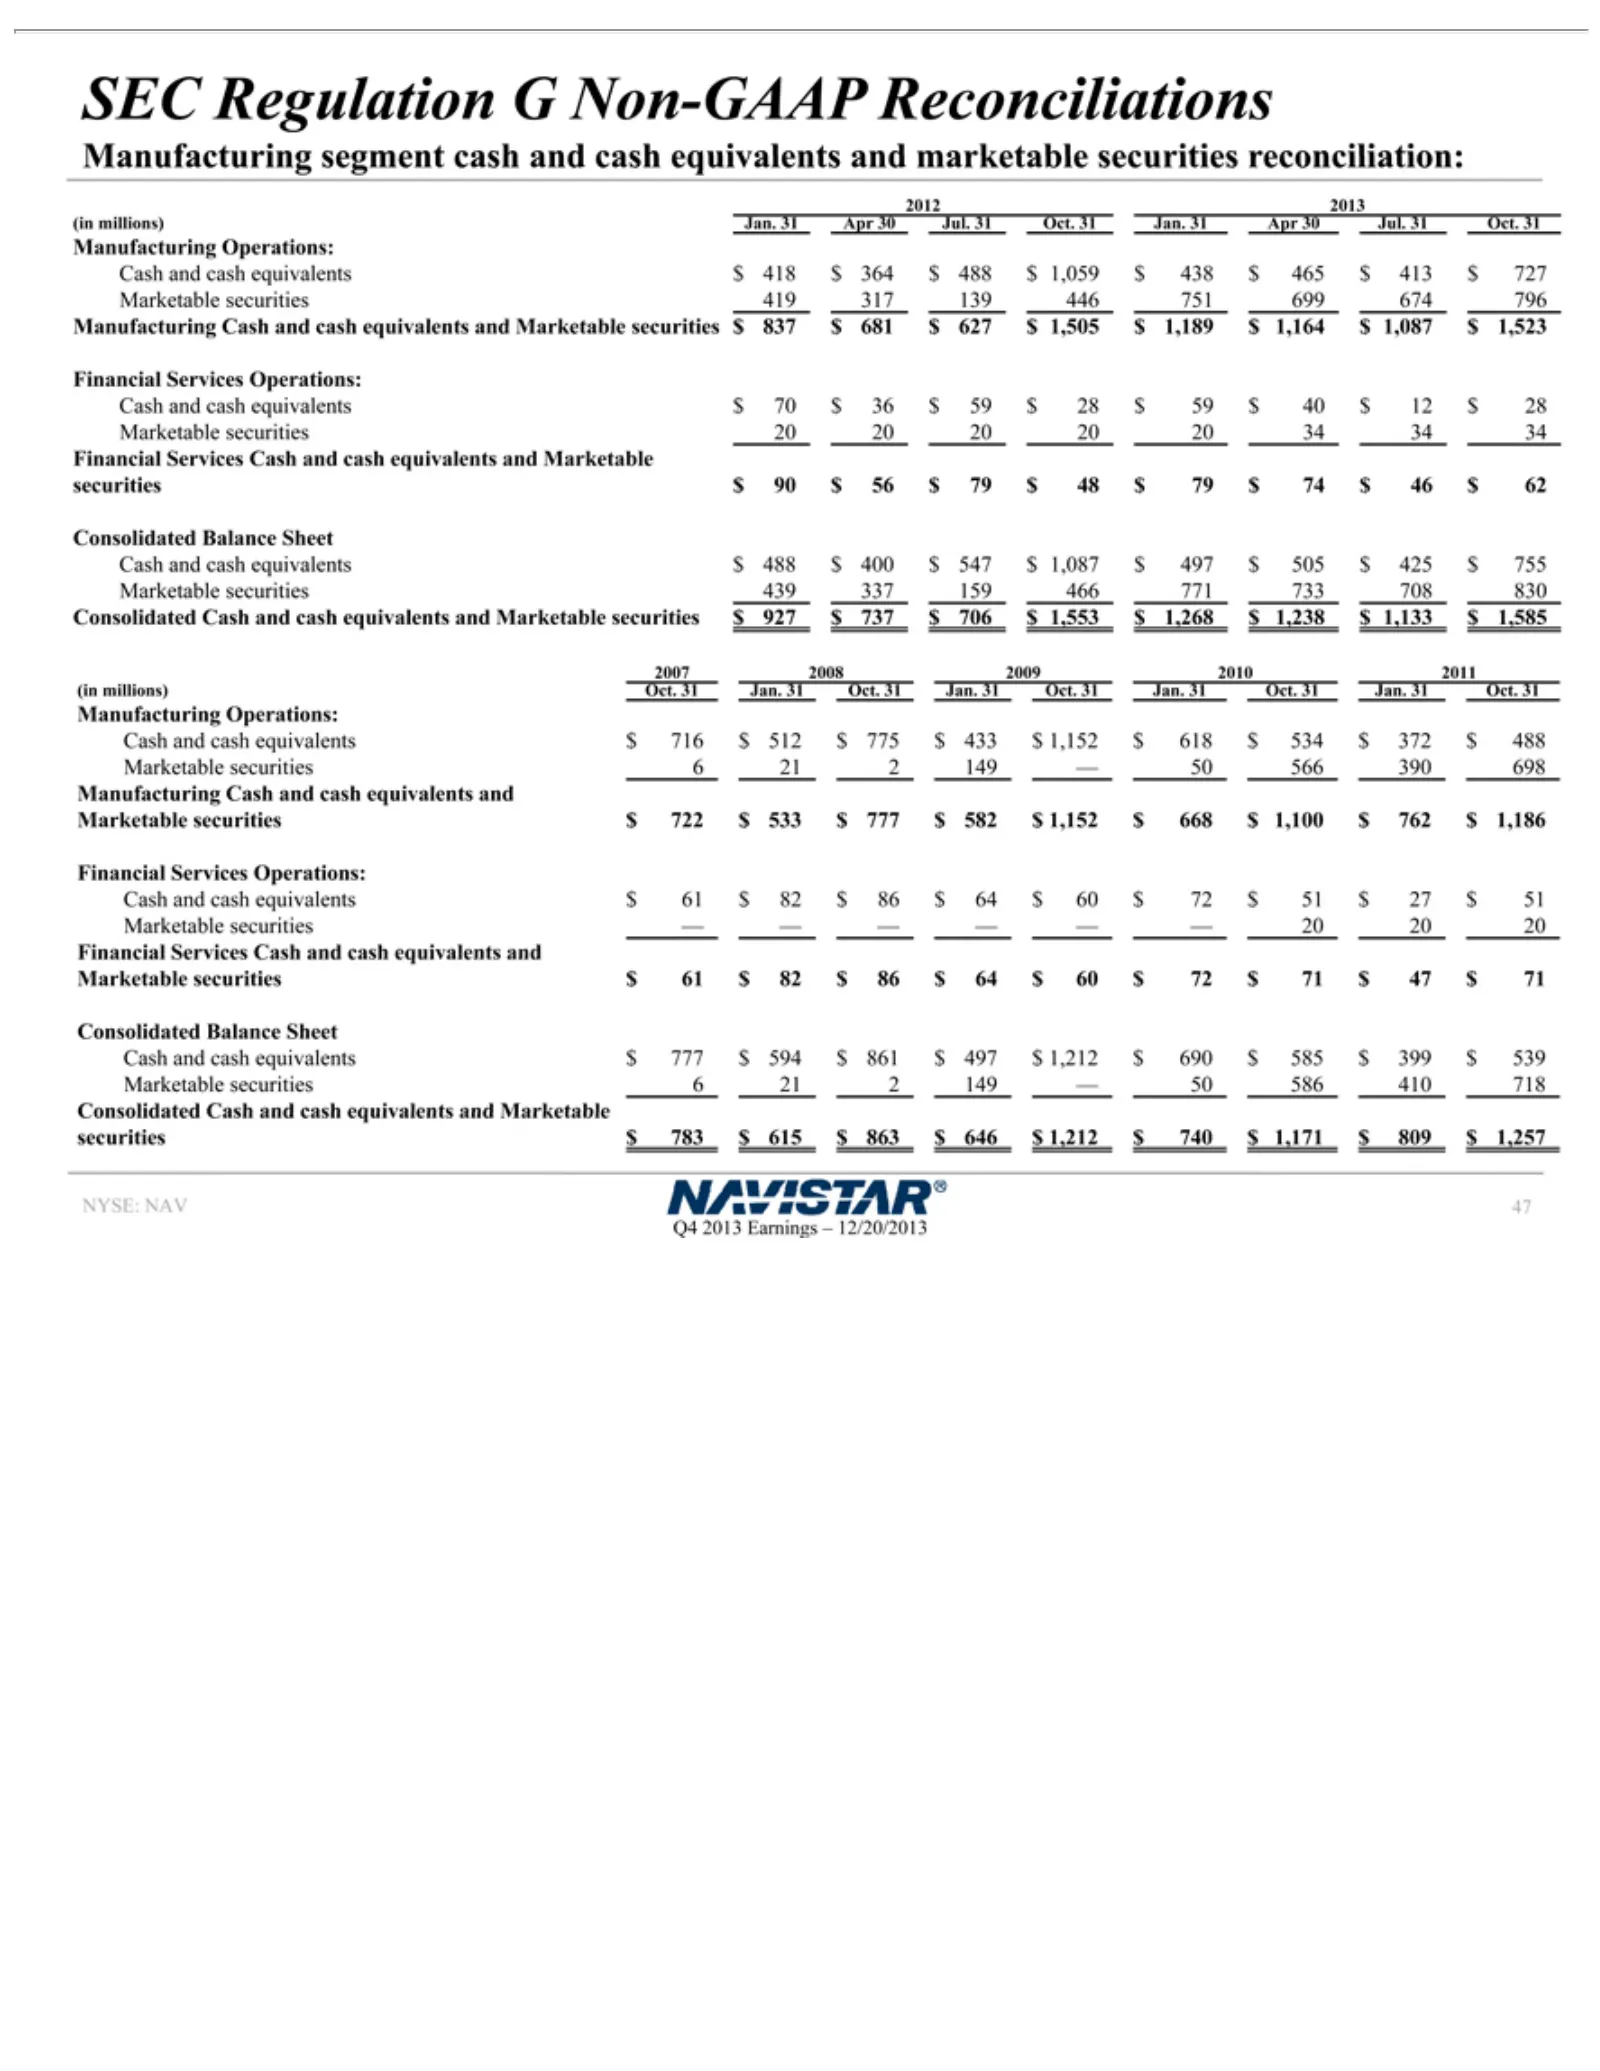
SECmillions) 2012 2007 (in Manufacturing Manufacturingg Financial Cash Marketable Consolidated securities NYSE: Q4 47 2013 Regulation 2013 2008 and NAV Earnings cash Services $2009 90 783 securities Jan. Oct. Balance Cash equivalents $Operations: segment Cash $Cash G 2010 56 31 31 615 –Cash Operatio
Slide 48: SEC Regulation G Manufacturing Cash Flows
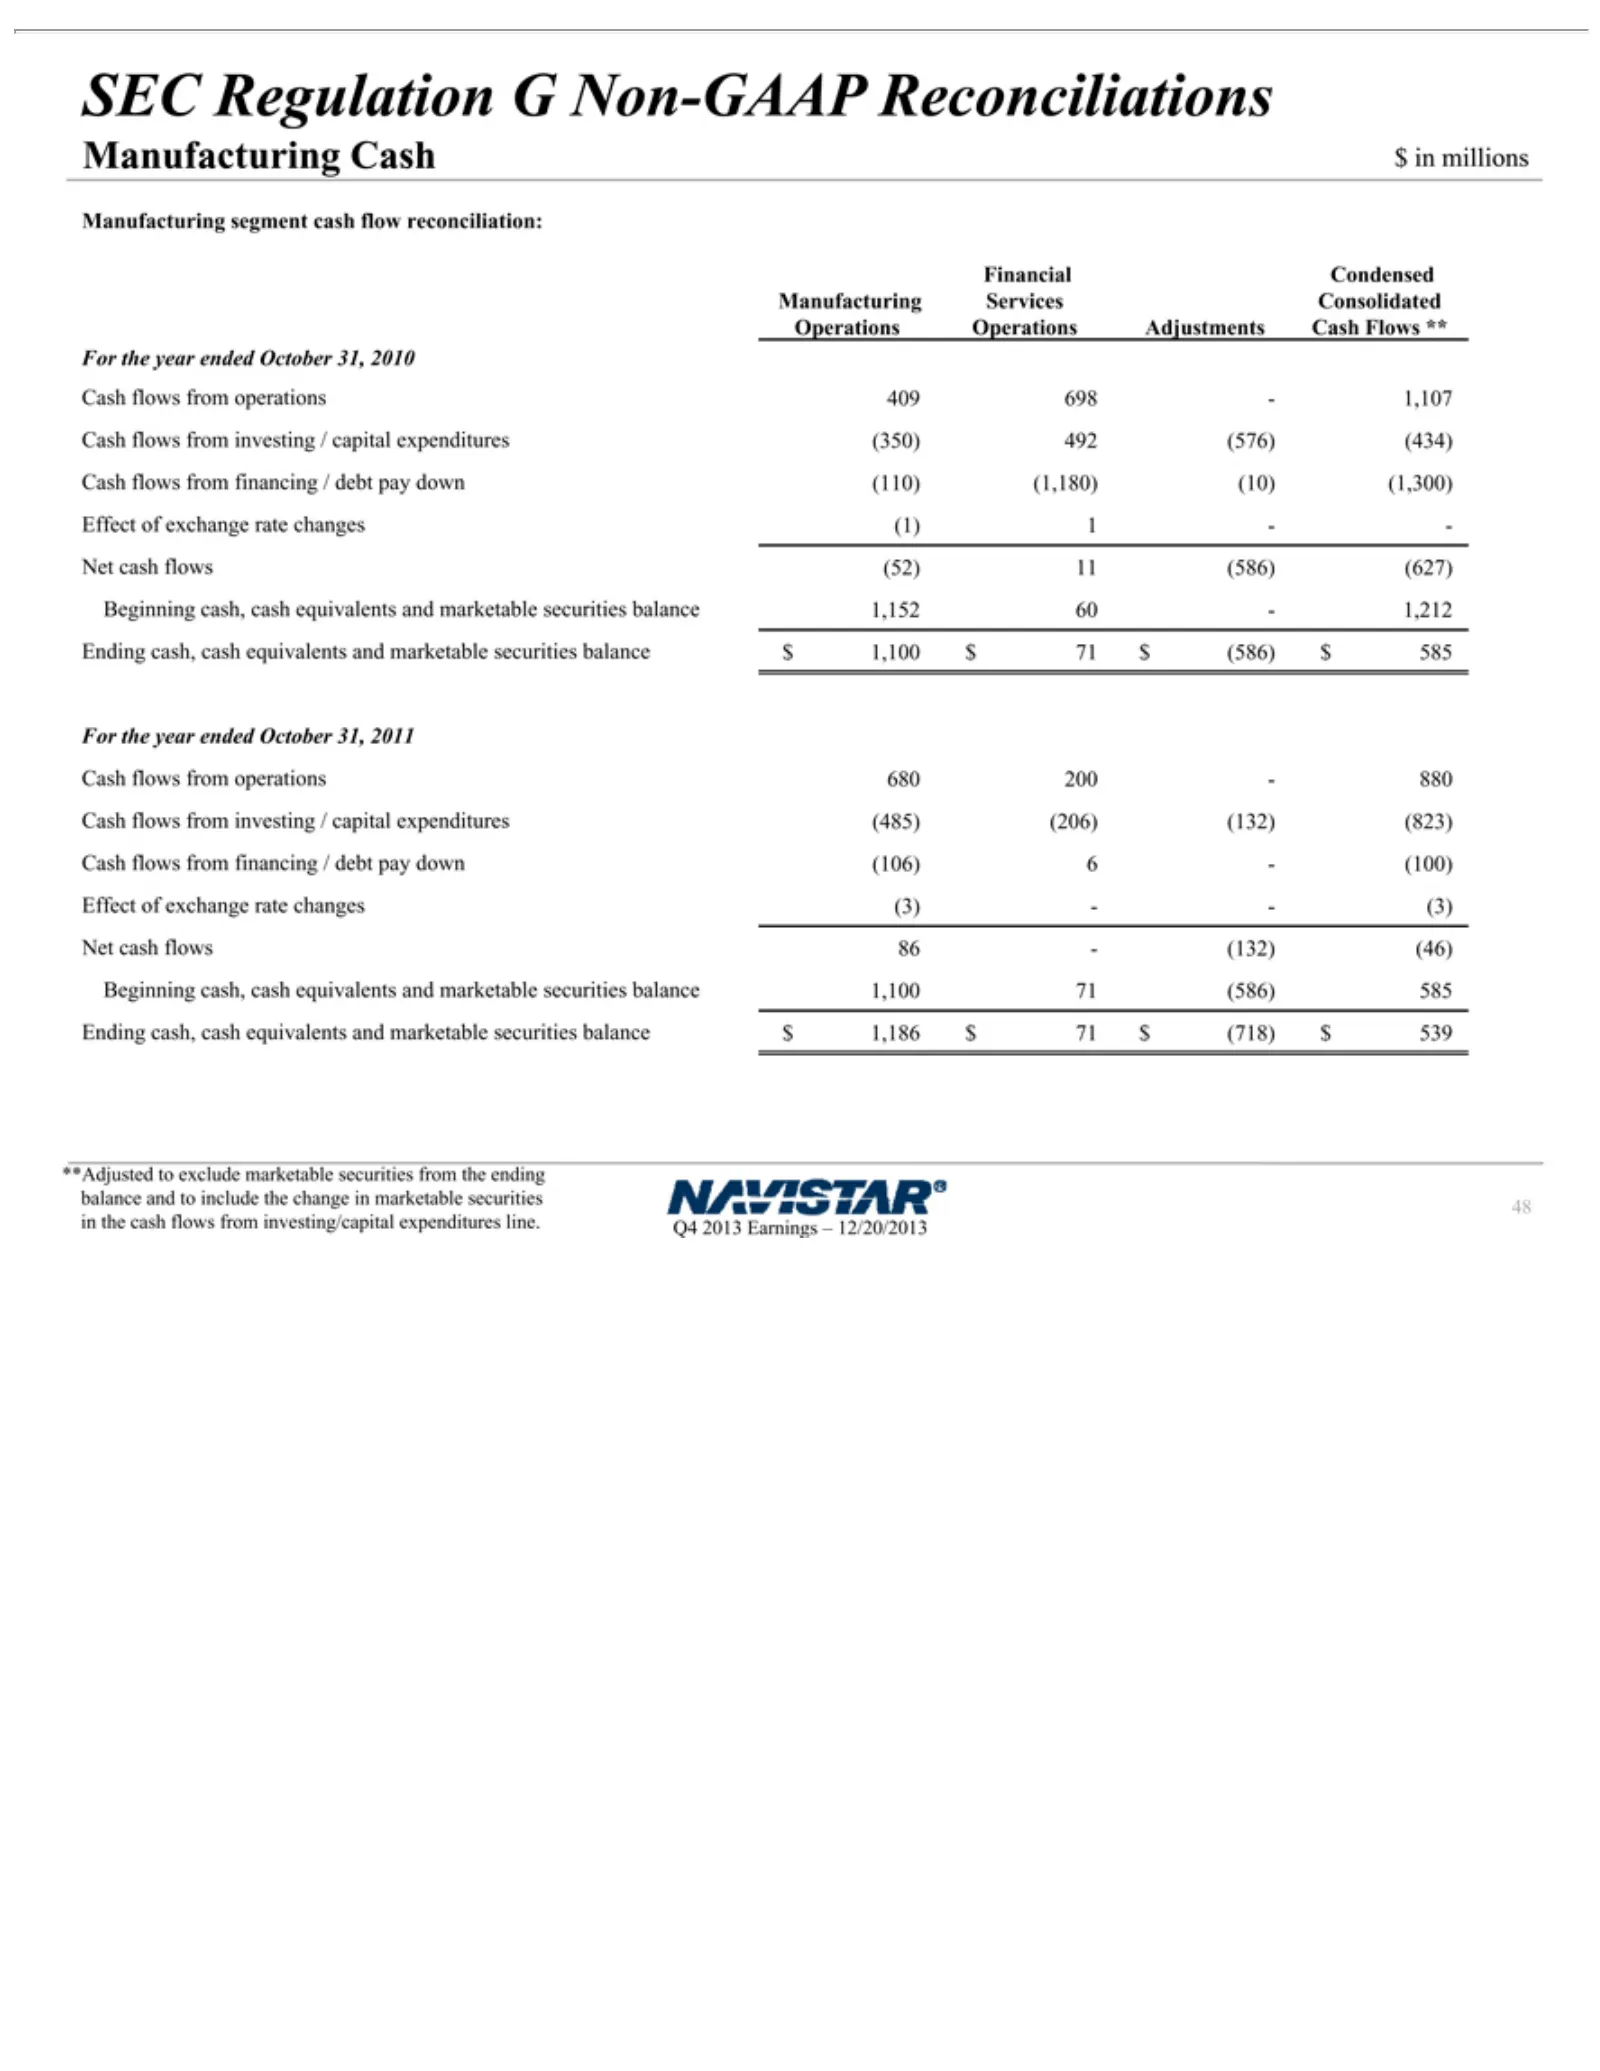
SEC2013 Manufacturing Cash (110) equivalents (485) balance **Adjusted Q4 48 Regulation Flows (1,180) (206) 1,100 Earnings and (132) to **(10) 71 exclude Cash For marketable G(586) (823) (1,300) –Non-GAAP the 12/20/2013 Manufacturing marketable year 585 Cash Effect securities Ending ended flows Recon
Slide 49: SEC Regulation G Manufacturing Cash Flows
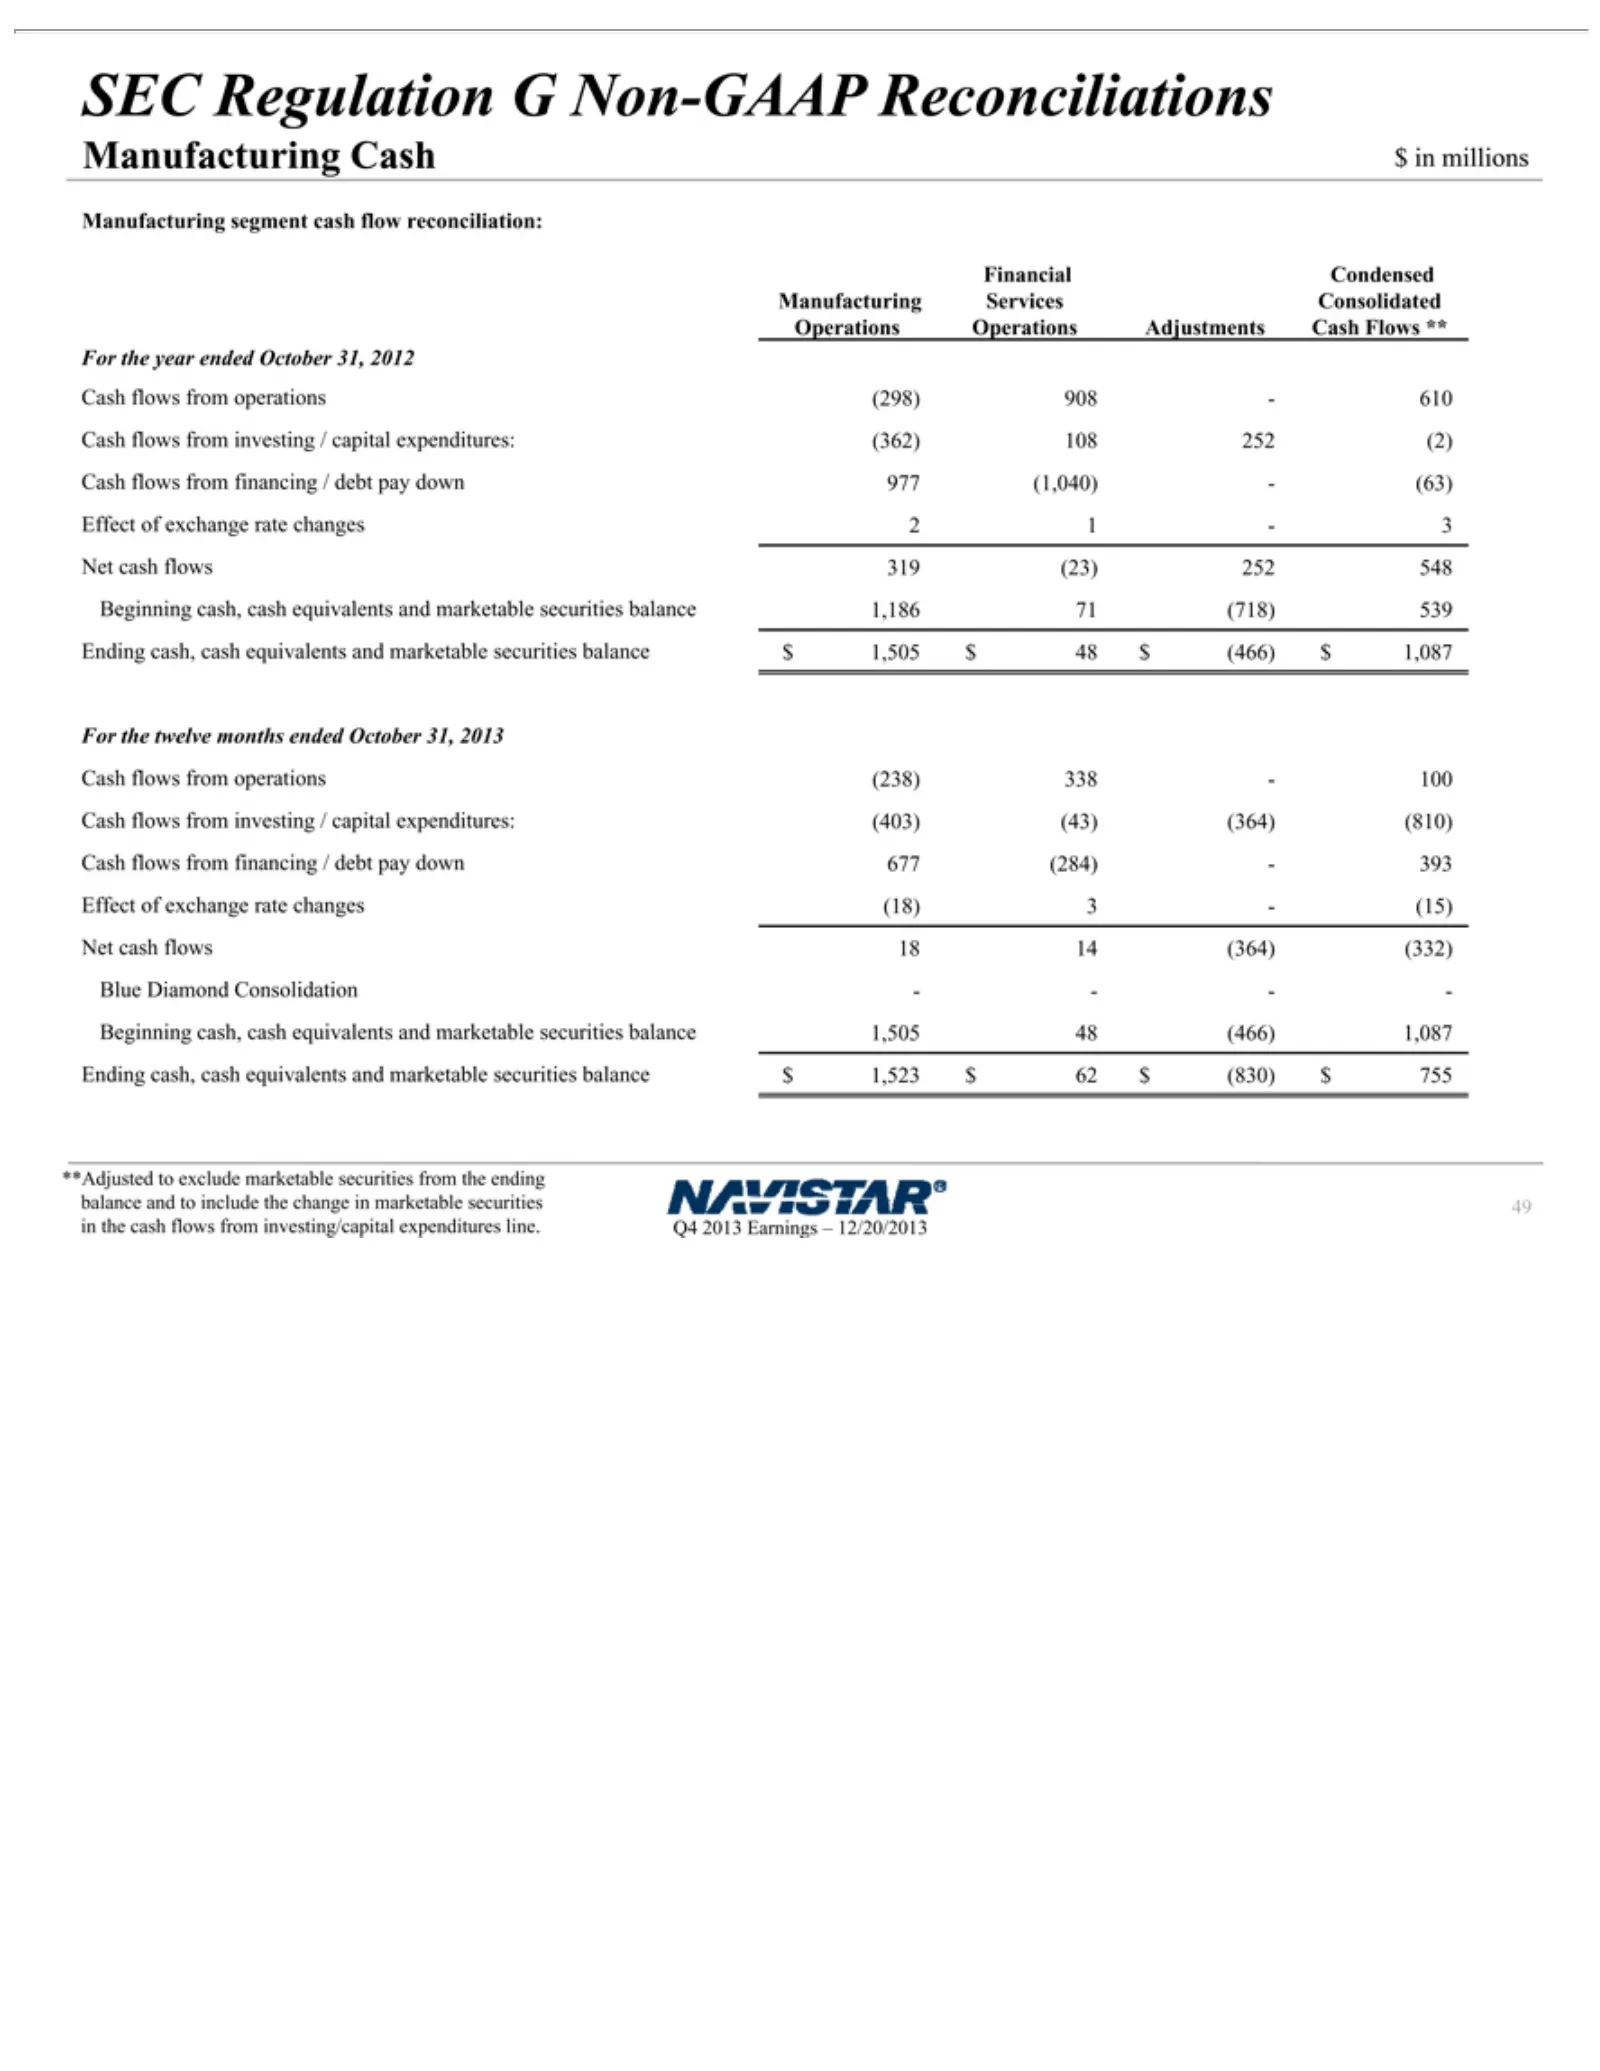
SEC2013 Manufacturing 2012 —3 1,087 677 (466) securities Q4 49 Net (284)—393 Regulation Cash 1,087 Forcash Earnings in the flows Ending the flows twelve Cash cash Effect Gfrom –Non-GAAP 319 cash, 12/20/2013 Manufacturing months flows operations of(23) cash exchange from 252 ended equivalents Reconci
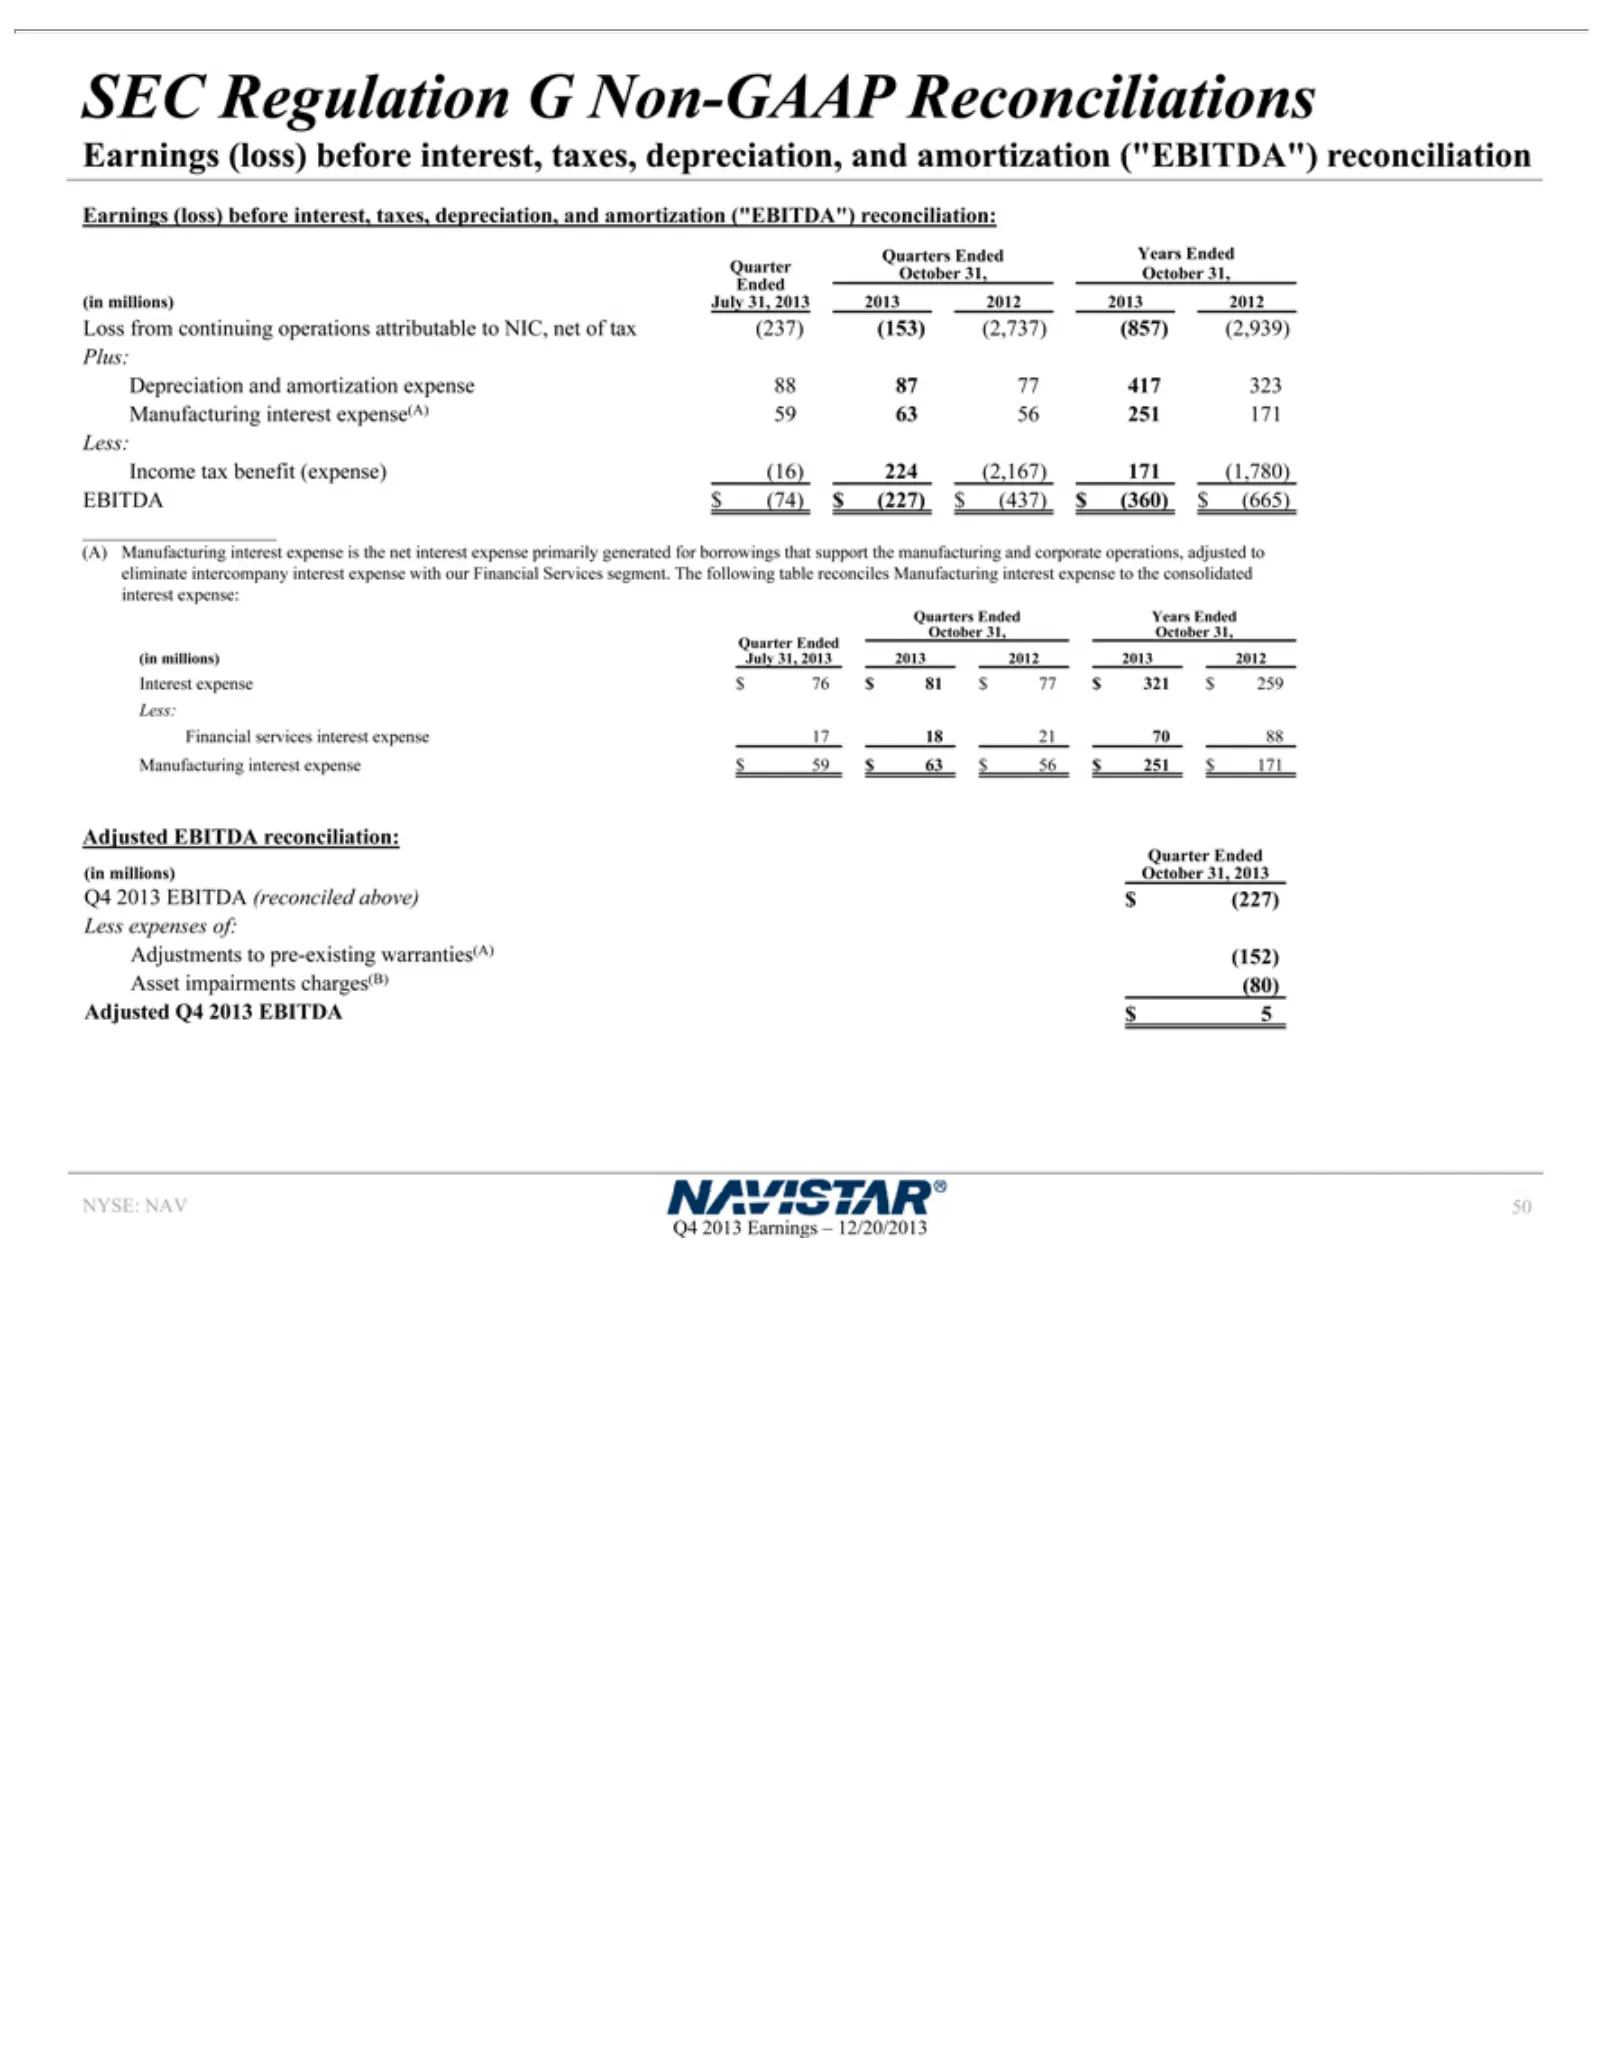
Slide 50: SEC Regulation G EBITDA Reconciliation
SEC Earnings Loss (237) Depreciation Plus: 88 59 Income (16) $(74) EBITDA (A) eliminate interest Quarters Ended July 2013 $Interest Financial Less: 17 Manufacturing $59 Adjusted Quarter (in October Less $(227) Adjustments Asset Adjustedj NYSE: Q4 507618 87 63 millions) 2013 Manufacturing $63 224 31,
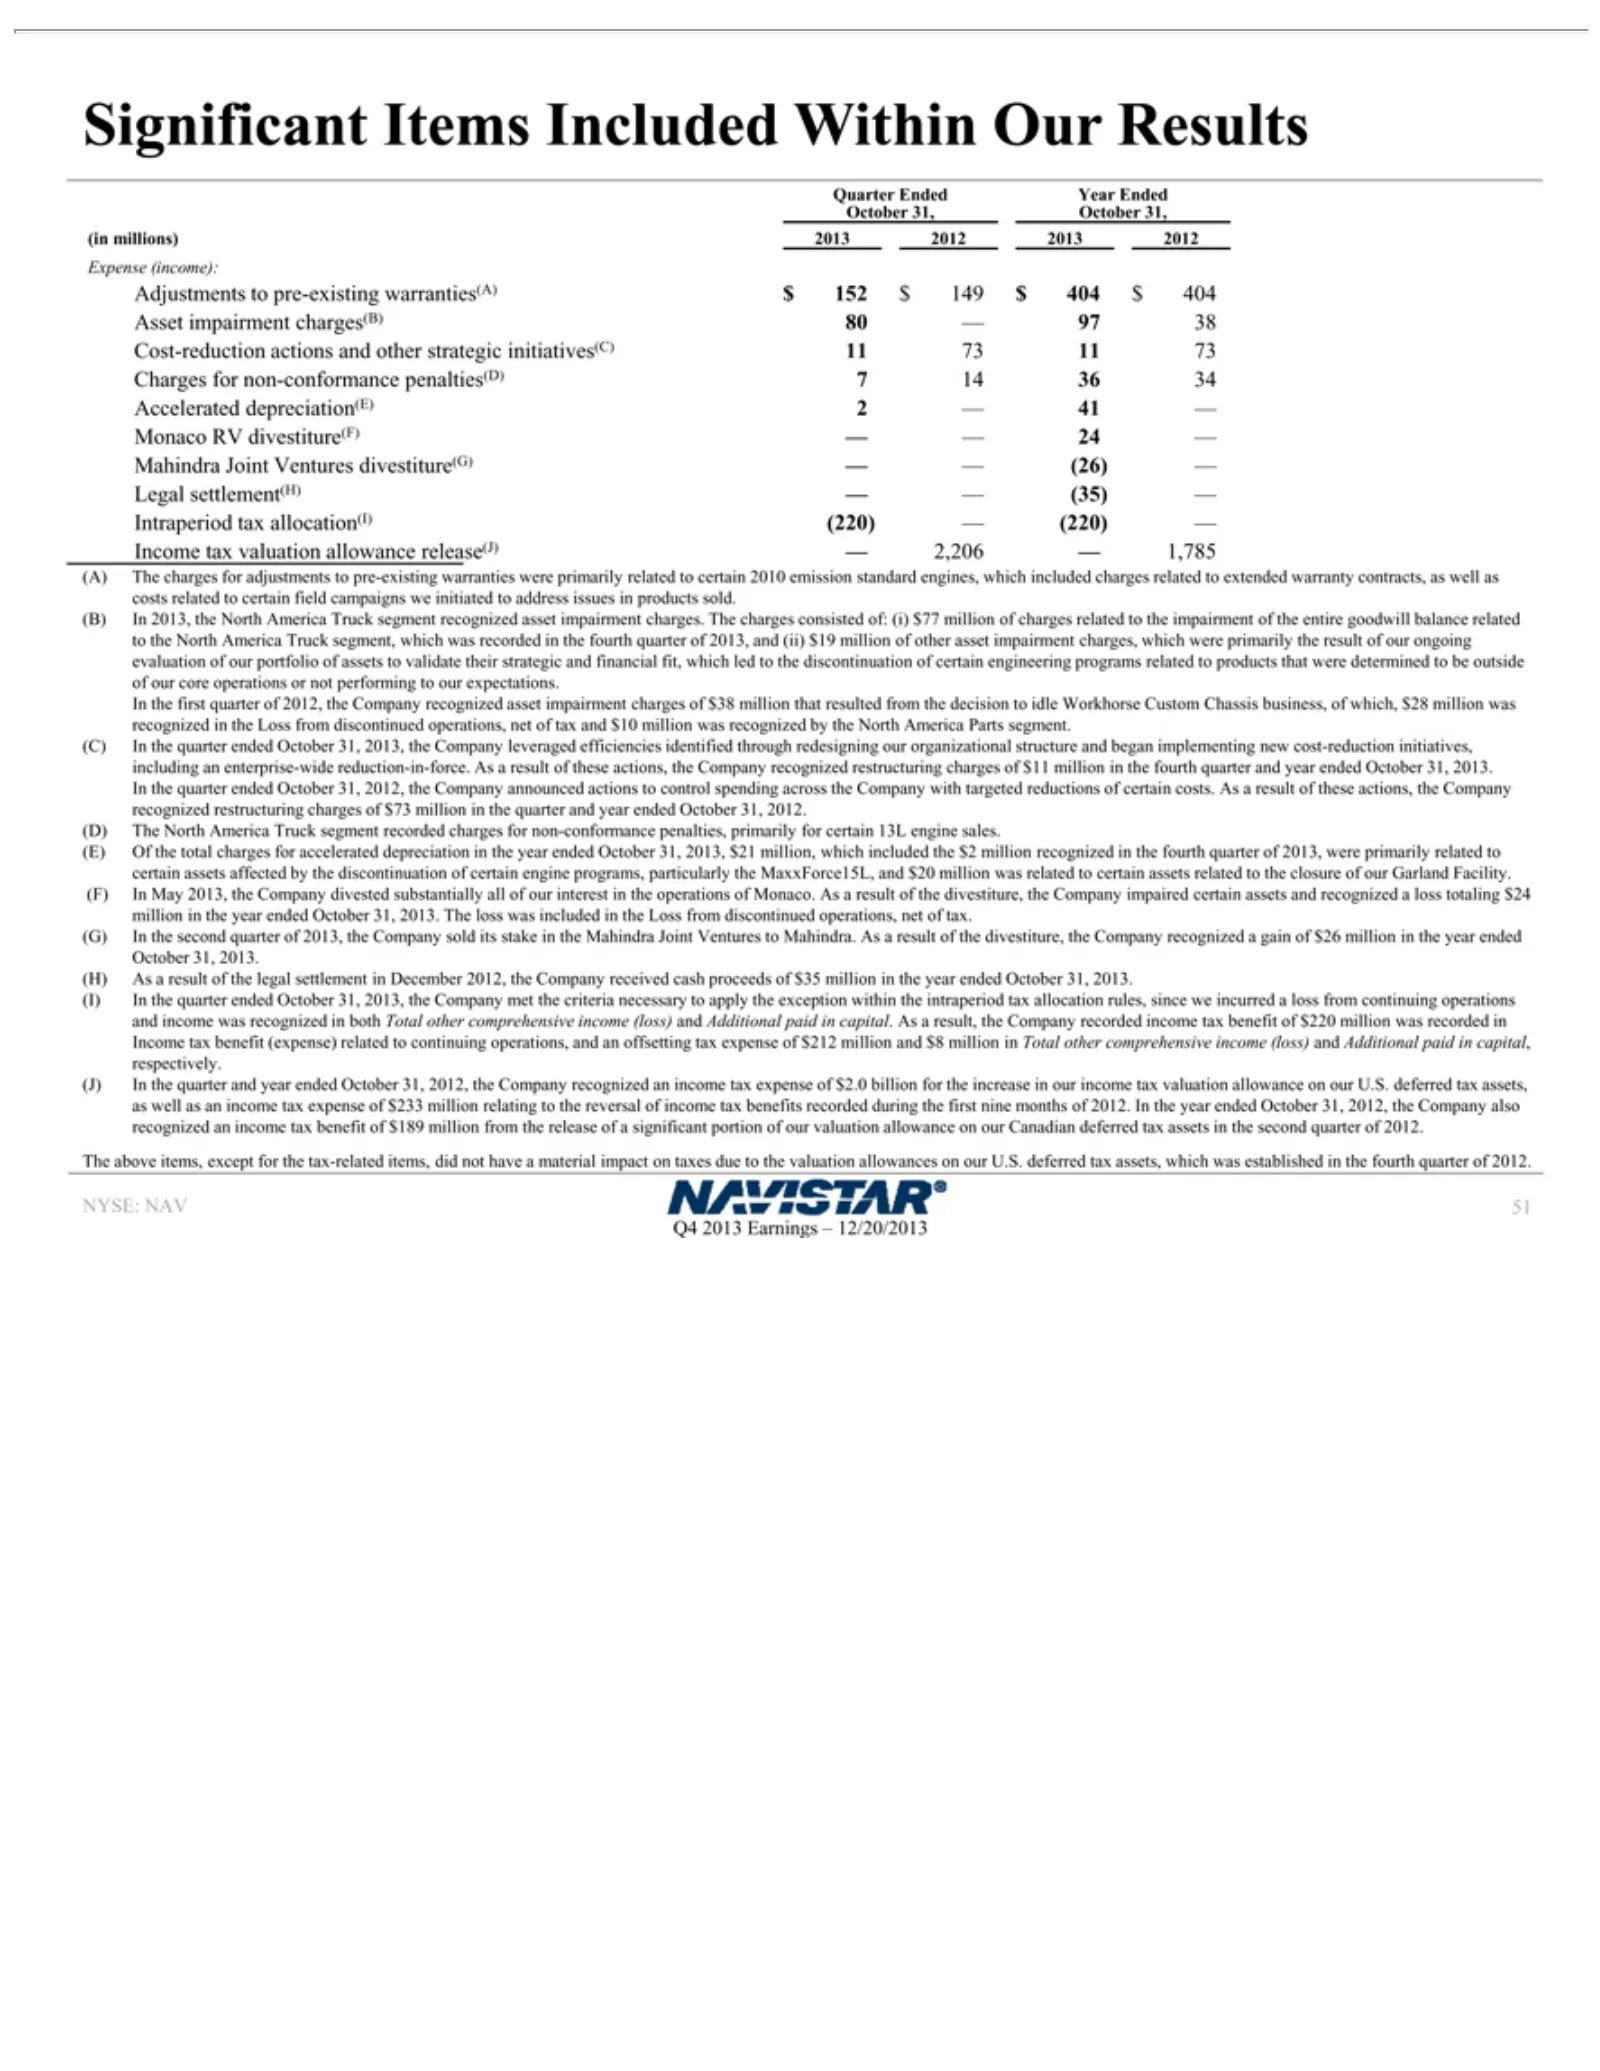
Slide 51: Notes on Significant Items
Significant 404 41 allowance contracts, of: impairment related resulted Parts including accelerated of interest from million October other and recognized income our NYSE: Q4 51 certain — (i) 2013 valuation U.S. an Asset discontinued segment. comprehensive —$77 offsetting to NAV in tax from 31, defer
Source: SEC EDGAR · 8-K filed Dec 20, 2013
More decks from Navistar International Corporation
 Q2 2021 Earnings Presentation20 slides · Jun 8, 2021
 Q1 2021 Earnings Presentation20 slides · Mar 9, 2021
 Q4 2020 Earnings Presentation22 slides · Dec 17, 2020
 Q3 2020 Earnings Presentation21 slides · Sep 9, 2020
 Q2 2020 Earnings Presentation21 slides · Jun 4, 2020
 Q1 2020 Earnings Presentation21 slides · Mar 4, 2020