Heritage Financial Corporation · NASDAQ:HFWA
Heritage Financial — Investor Presentation (July 2019)
34 slides from Heritage Financial's investor presentation, Jul 30, 2019
Slide 1: Investor Presentation Q2 2019
Investor Presentation Q2 2019 Jeff Deuel, Chief Executive Officer Bryan McDonald, Chief Operating Officer Don Hinson, Chief Financial Officer
Slide 2: Forward-Looking Statement
FORWARD – LOOKING STATEMENT This presentation contains forward-looking statements that are subject to risks and uncertainties, including, but not limited to: • The expected revenues, cost savings, synergies and other benefits from our other merger and acquisition activities might not be realized wit
Slide 3: Company Overview
COMPANY OVERVIEW 3
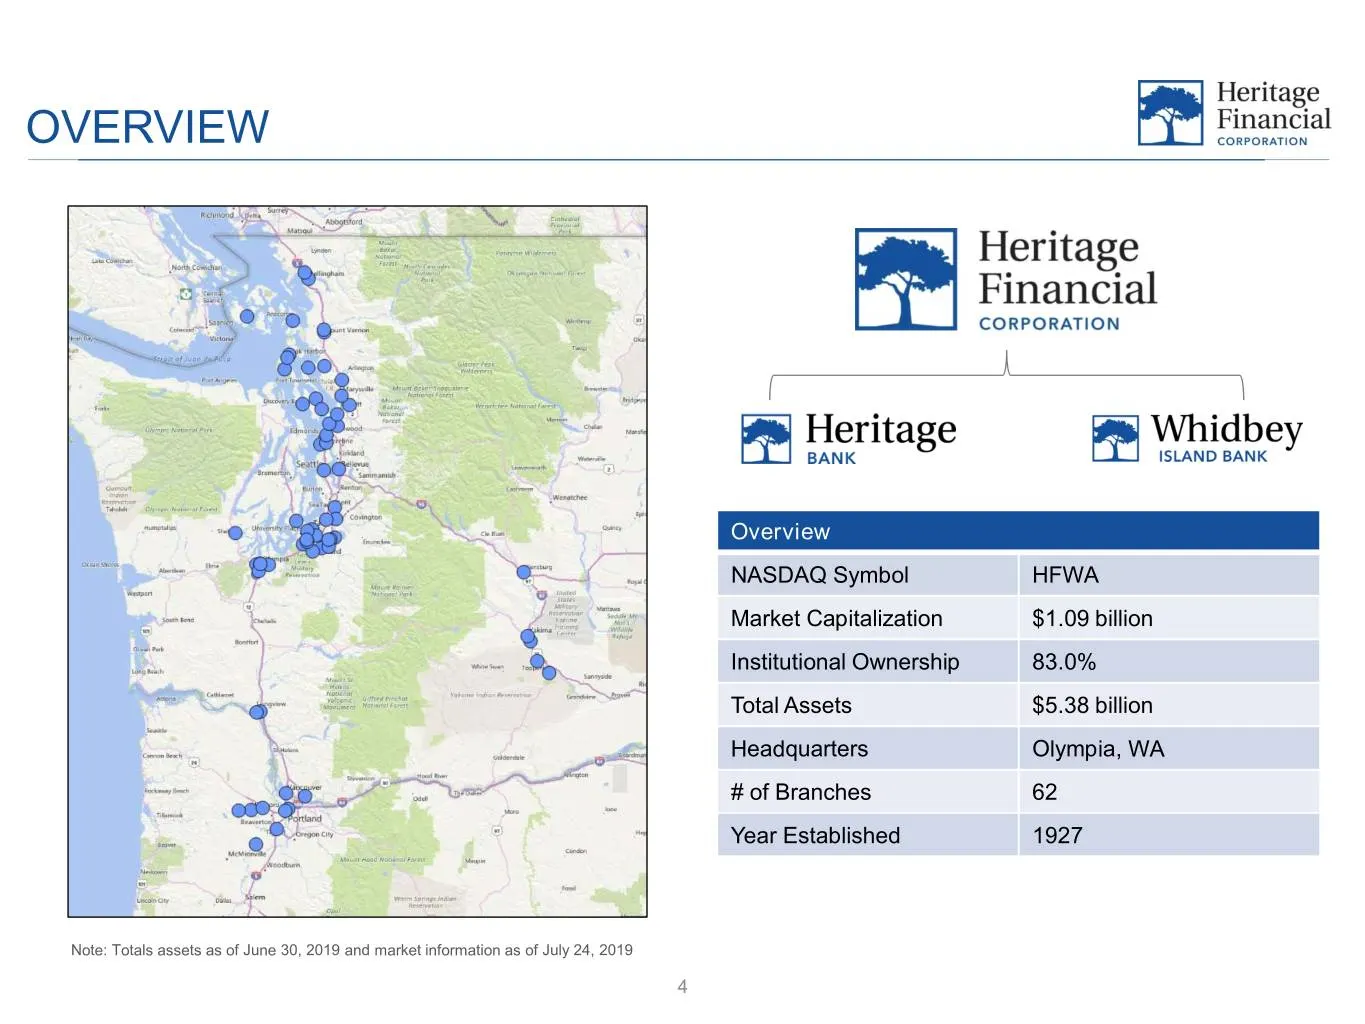
Slide 4: Overview
OVERVIEW Overview NASDAQ Symbol HFWA Market Capitalization $1.09 billion Institutional Ownership 83.0% Total Assets $5.38 billion Headquarters Olympia, WA # of Branches 62 Year Established 1927 Note: Totals assets as of June 30, 2019 and market information as of July 24, 2019 4
Slide 5: Management Team
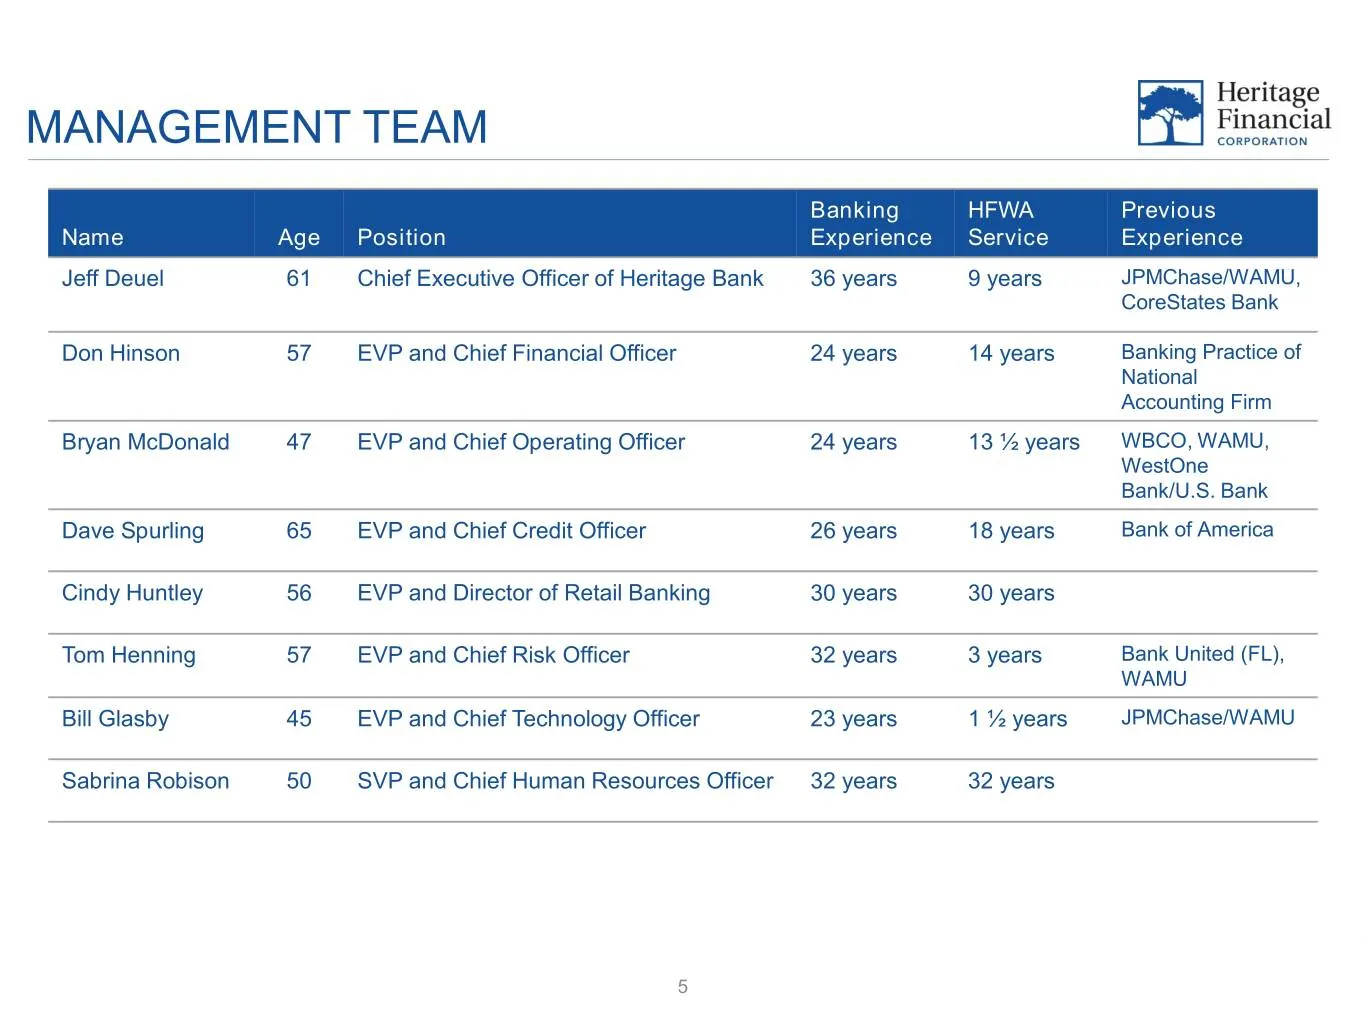
MANAGEMENT TEAM Banking HFWA Previous Name Age Position Experience Service Experience Jeff Deuel 61 Chief Executive Officer of Heritage Bank 36 years 9 years JPMChase/WAMU, CoreStates Bank Don Hinson 57 EVP and Chief Financial Officer 24 years 14 years Banking Practice of National Accounting Firm Br
Slide 6: Company Strategy
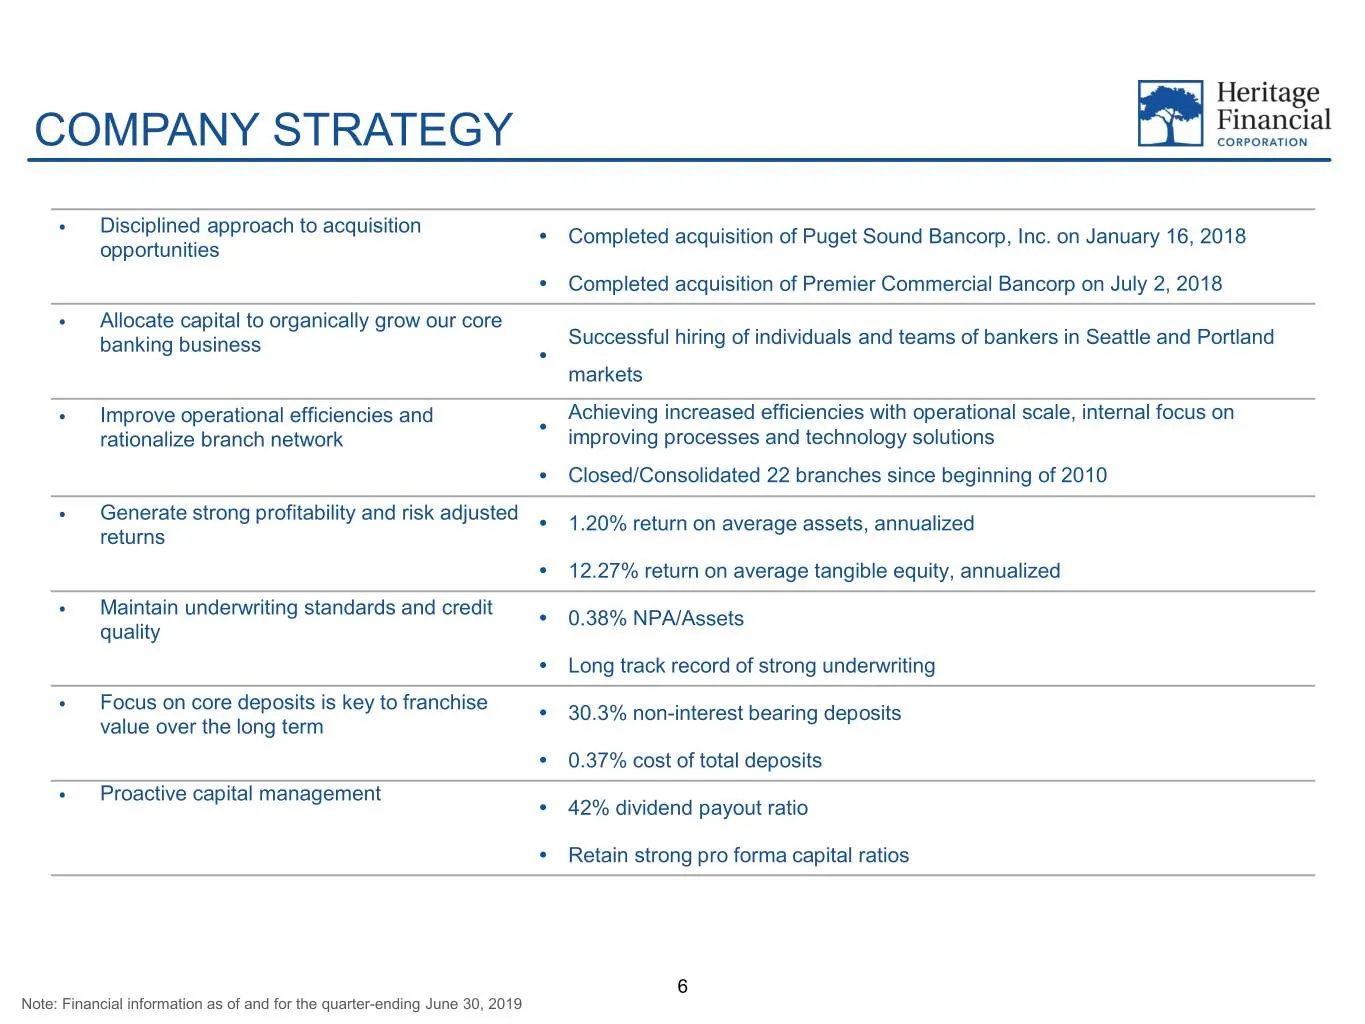
COMPANY STRATEGY Disciplined approach to acquisition Completed acquisition of Puget Sound Bancorp, Inc. on January 16, 2018 opportunities ⦁ Completed acquisition of Premier Commercial Bancorp on July 2, 2018 Allocate capital to organically grow our core banking business Successful hiring of indi
Slide 7: Trajectory of HFWA
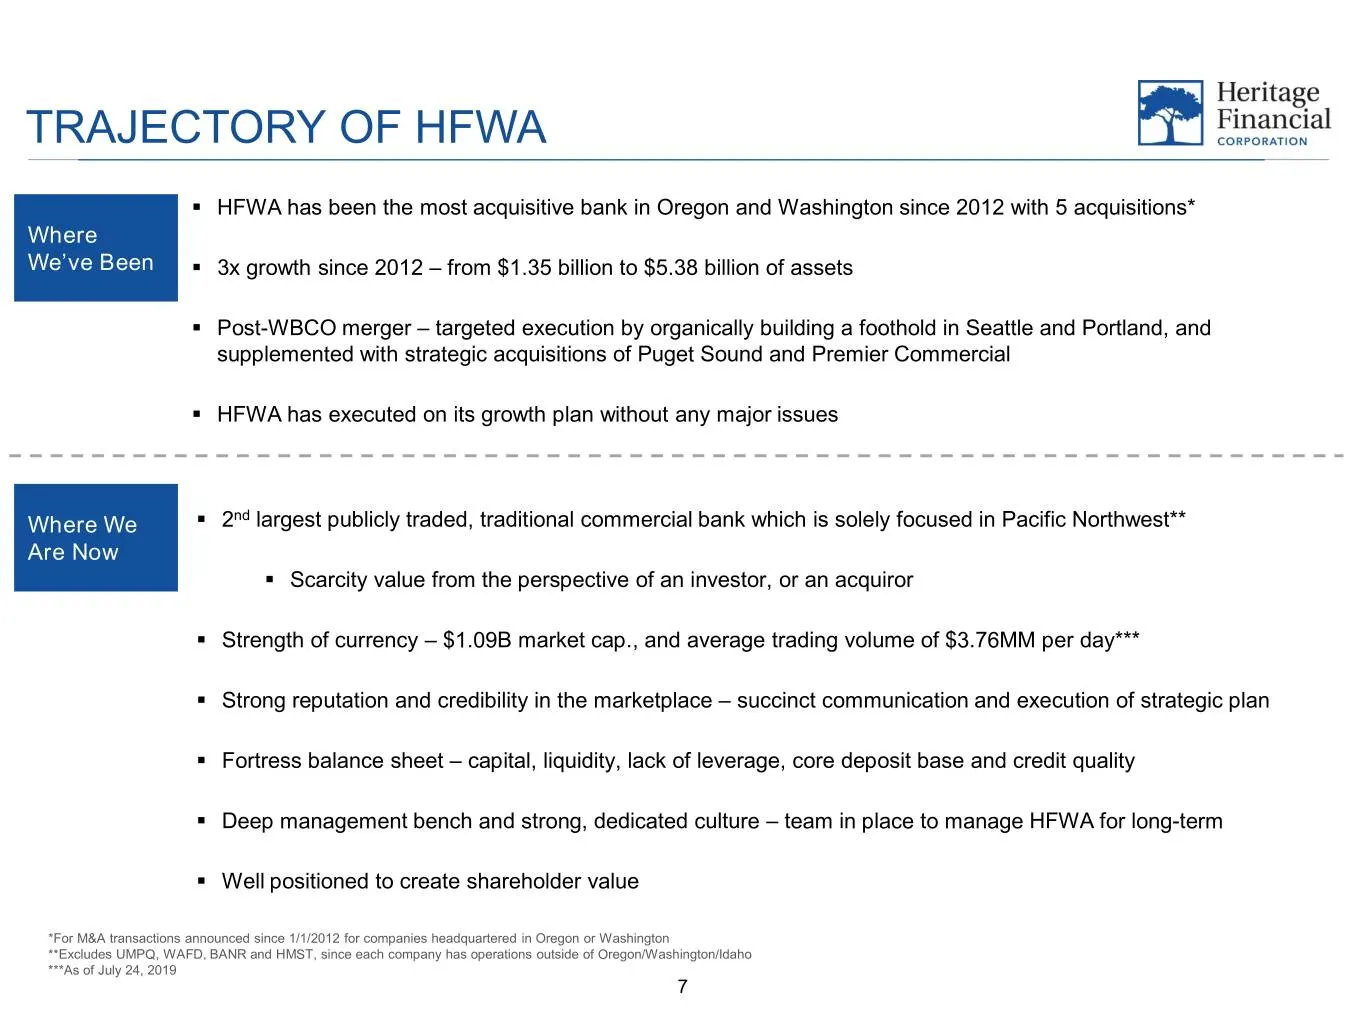
TRAJECTORY OF HFWA . HFWA has been the most acquisitive bank in Oregon and Washington since 2012 with 5 acquisitions* Where We’ve Been . 3x growth since 2012 – from $1.35 billion to $5.38 billion of assets . Post-WBCO merger – targeted execution by organically building a foothold in Seattle and Port
Slide 8: Deposit Market Share
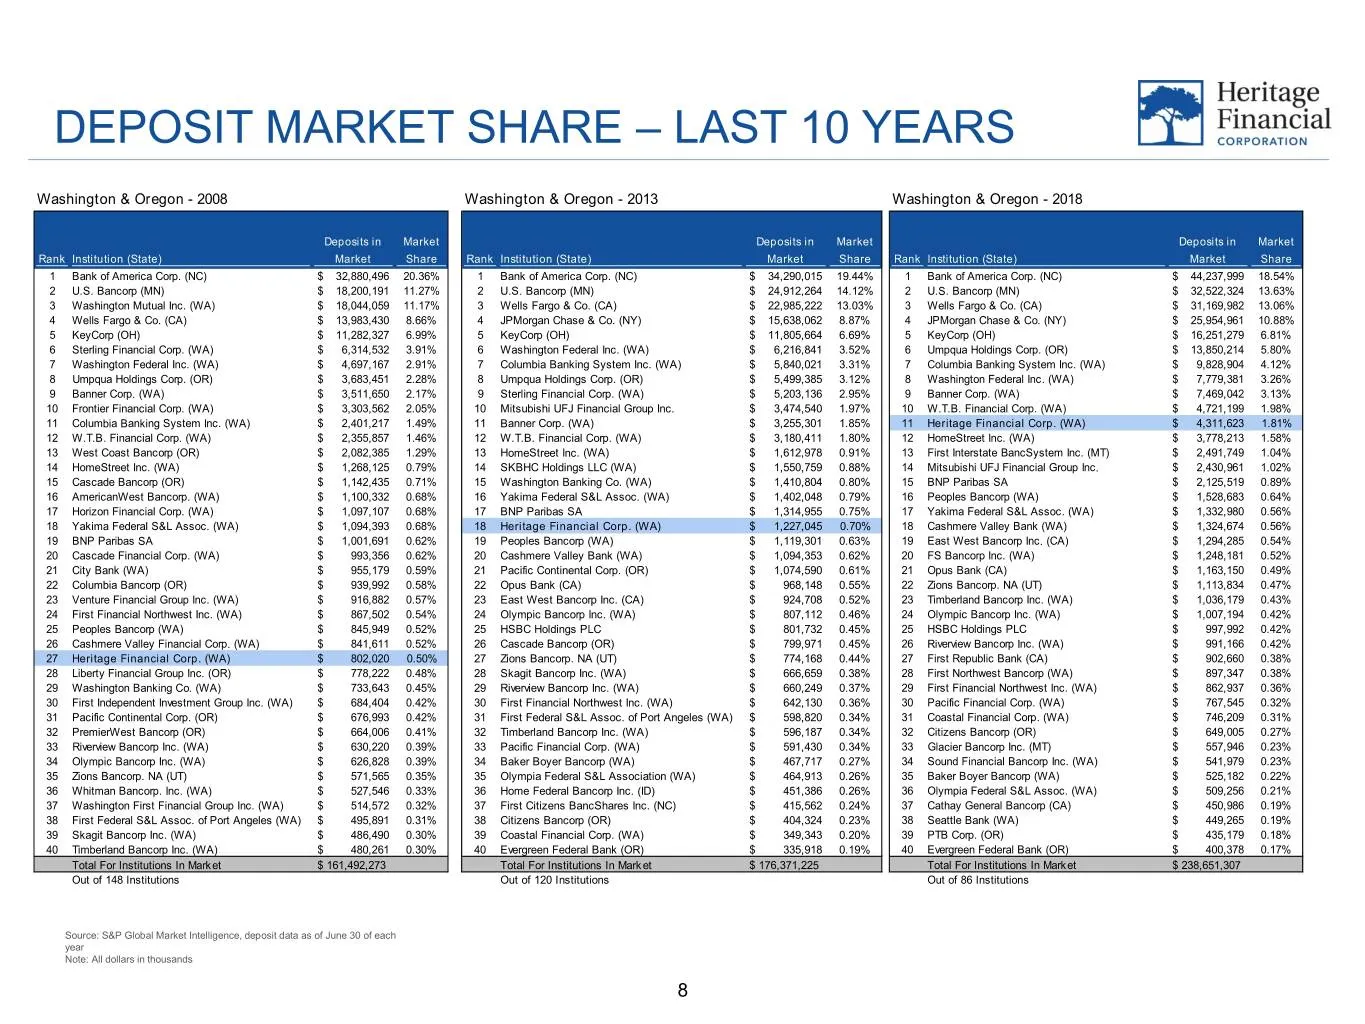
DEPOSIT MARKET SHARE – LAST 10 YEARS Washington & Oregon - 2008 Washington & Oregon - 2013 Washington & Oregon - 2018 Deposits in Market Deposits in Market Deposits in Market Rank Institution (State) Market Share Rank Institution (State) Market Share Rank Institution (State) Market Share 1 Bank of A
Slide 9: Strong and Diverse Economic Landscape
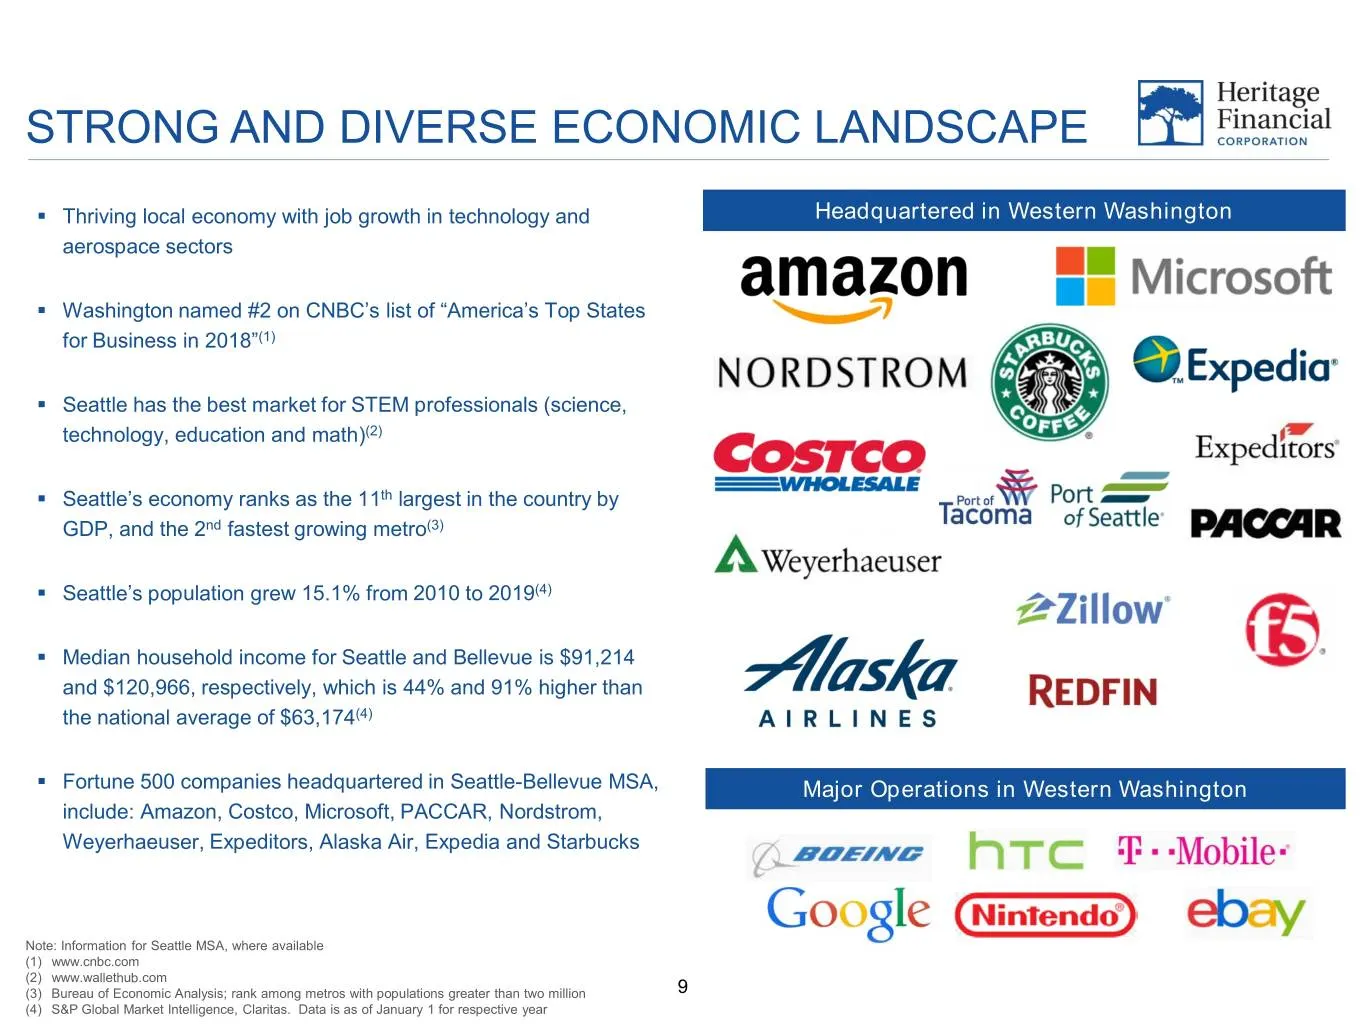
STRONG AND DIVERSE ECONOMIC LANDSCAPE . Thriving local economy with job growth in technology and Headquartered in Western Washington aerospace sectors . Washington named #2 on CNBC’s list of “America’s Top States for Business in 2018”(1) . Seattle has the best market for STEM professionals (science,
Slide 10: Where the Cranes Are
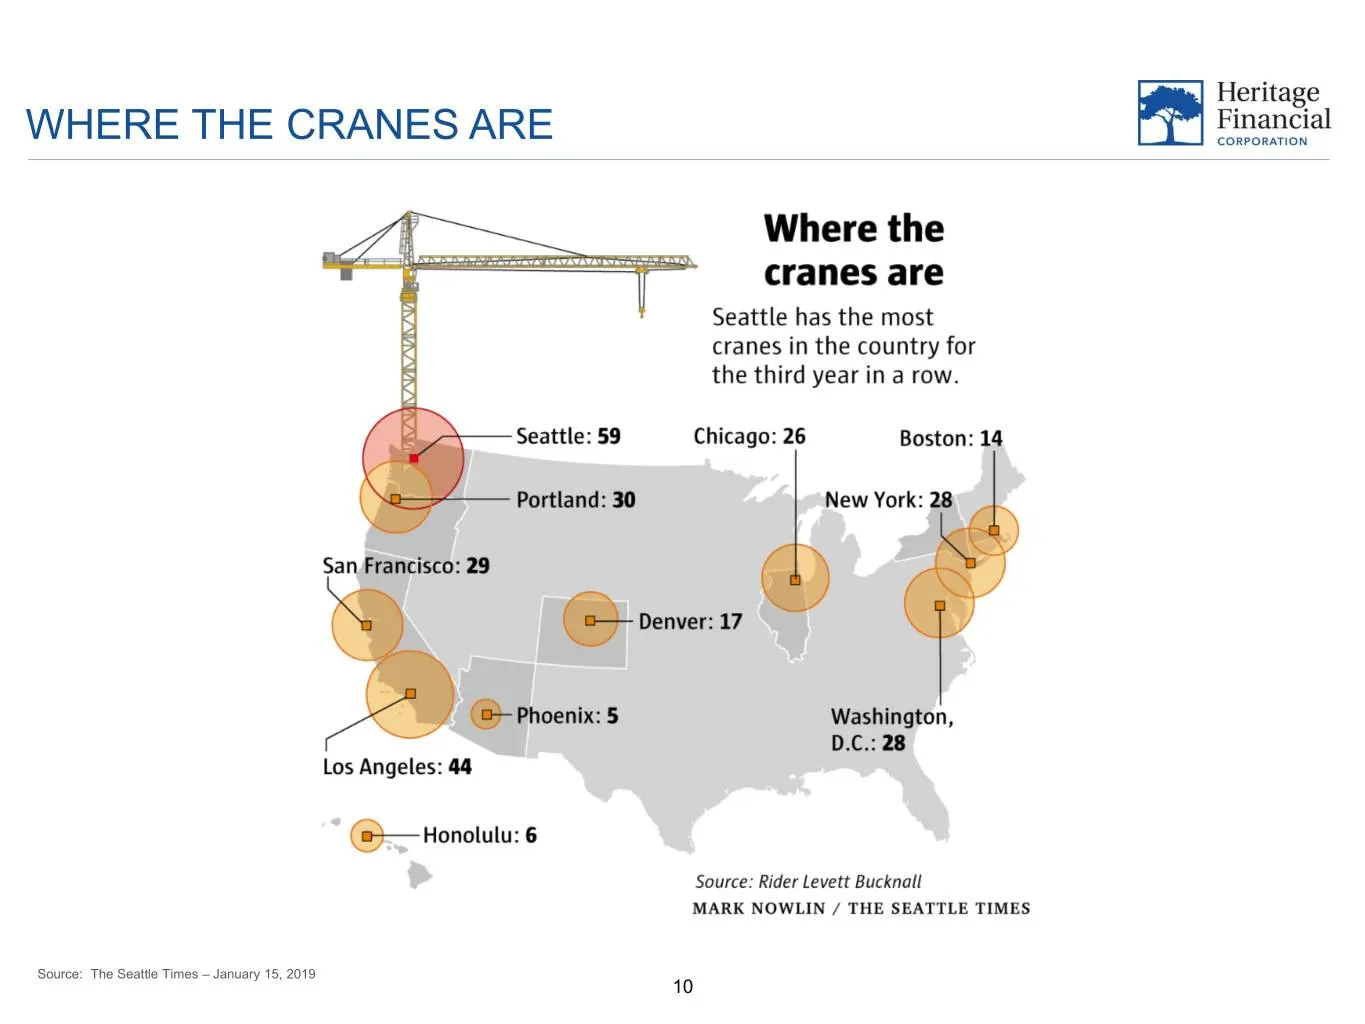
WHERE THE CRANES ARE Source: The Seattle Times – January 15, 2019 10
Slide 11: Seattle Metro Market
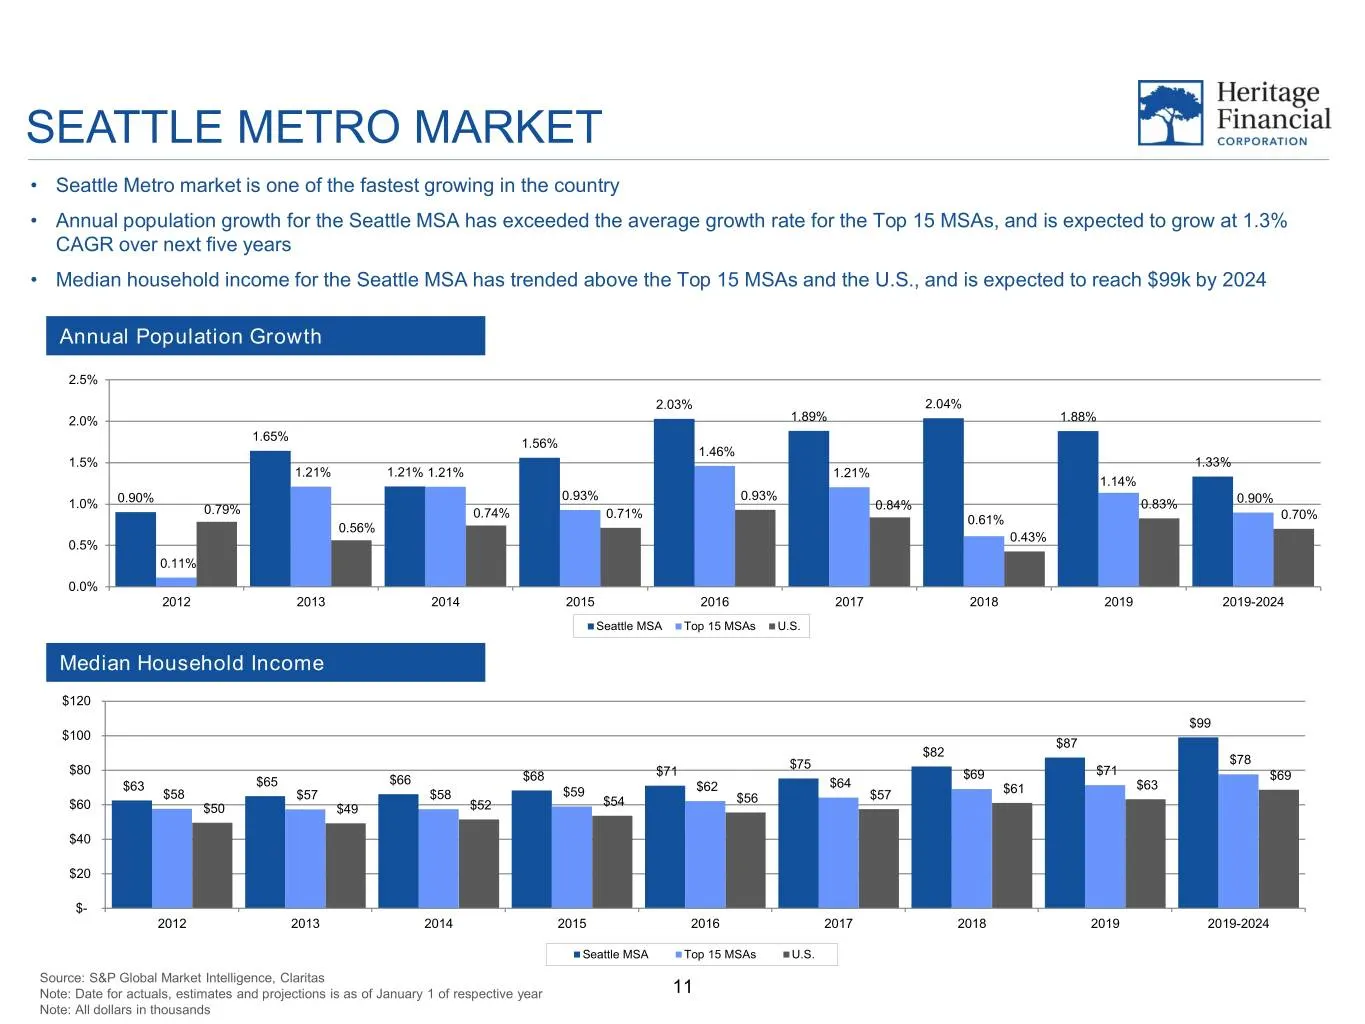
SEATTLE METRO MARKET • Seattle Metro market is one of the fastest growing in the country • Annual population growth for the Seattle MSA has exceeded the average growth rate for the Top 15 MSAs, and is expected to grow at 1.3% CAGR over next five years • Median household income for the Seattle MSA ha
Slide 12: Historical Growth: Organic and Acquisitive
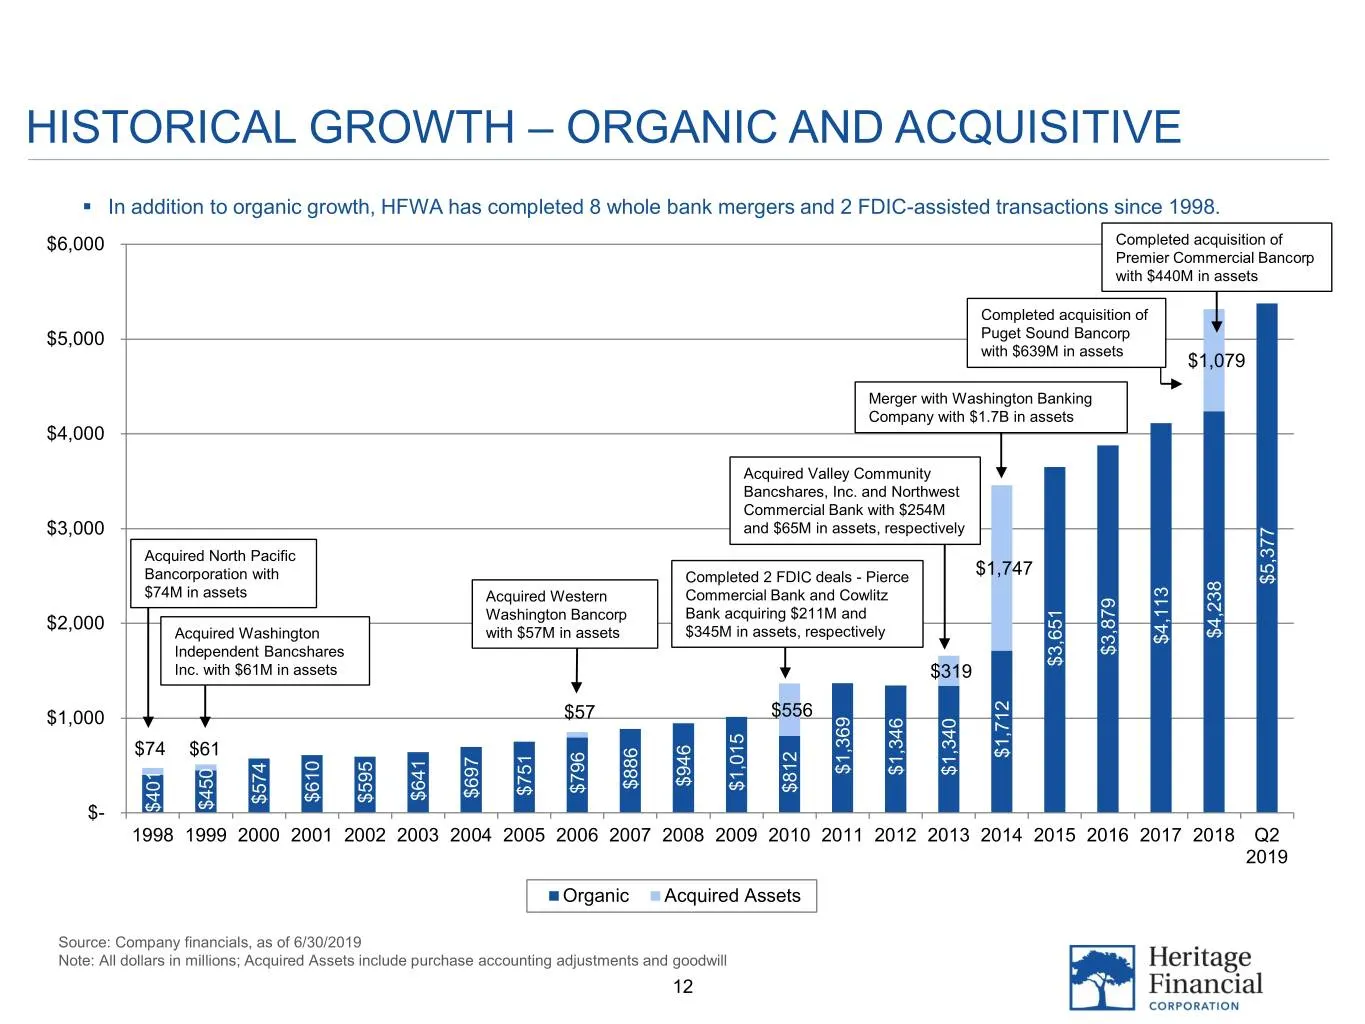
HISTORICAL GROWTH $1,000 $2,000 $3,000 $4,000 $5,000 $6,000 Note: All dollars in millions; Acquired Assets include purchase accounting adjustments goodwill and adjustments accounting purchase include Assets Acquired millions; in dollars All Note: 6/30/2019 as of financials, Company Source: . $- In a
Slide 13: Seattle Metro Market
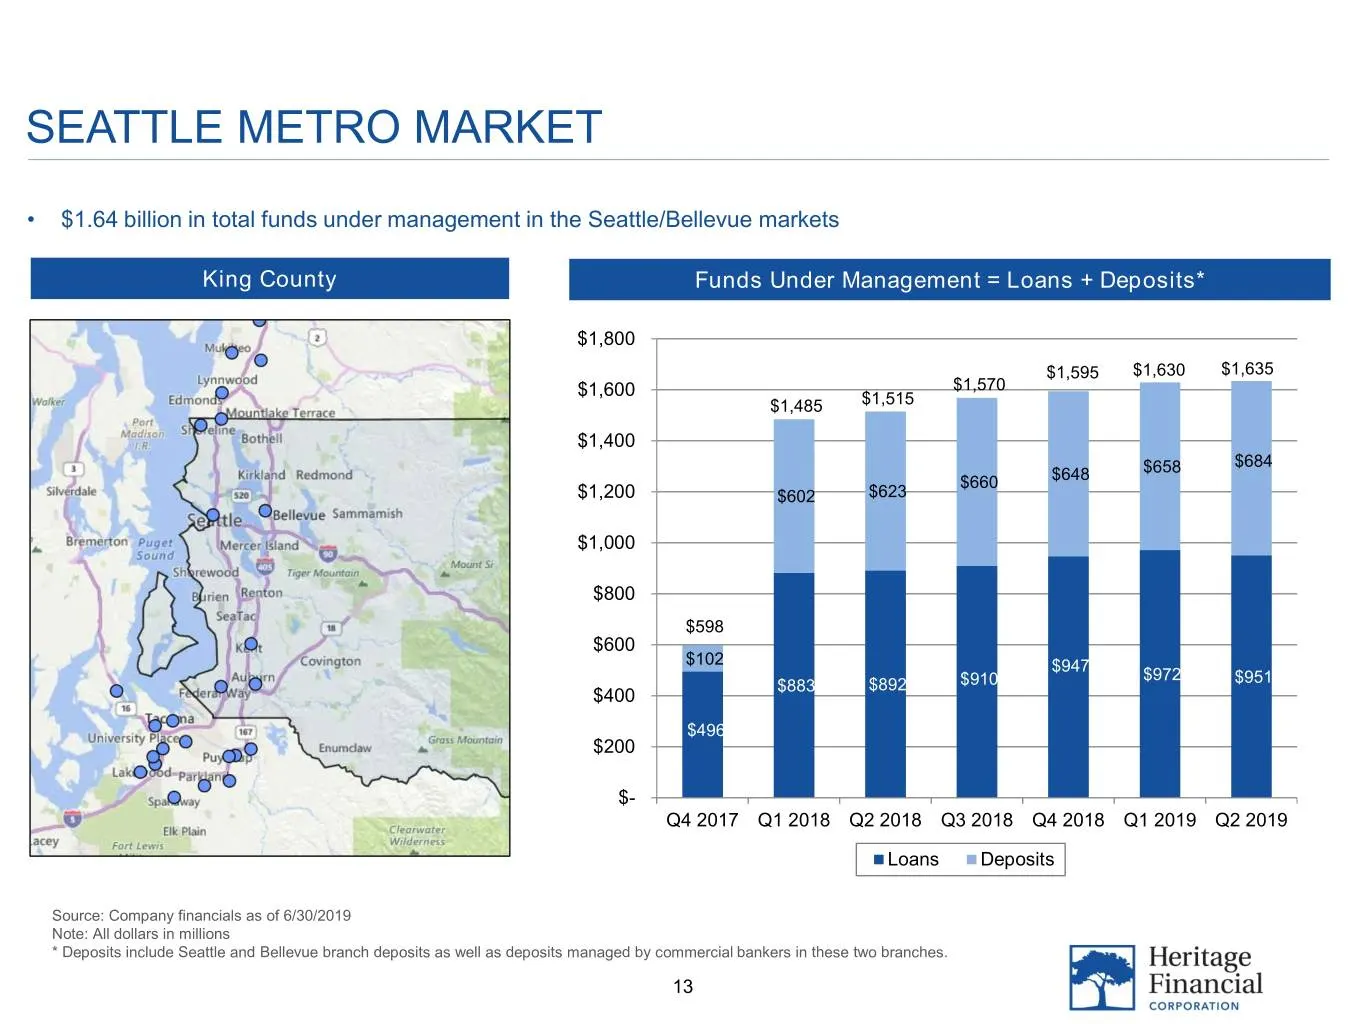
SEATTLE METRO MARKET • $1.64 billion in total funds under management in the Seattle/Bellevue markets King County Funds Under Management = Loans + Deposits* $1,800 $1,595 $1,630 $1,635 $1,600 $1,570 $1,485 $1,515 $1,400 $658 $684 $660 $648 $1,200 $602 $623 $1,000 $800 $598 $600 $102 $947 $972 $892 $9
Slide 14: Portland Metro Market
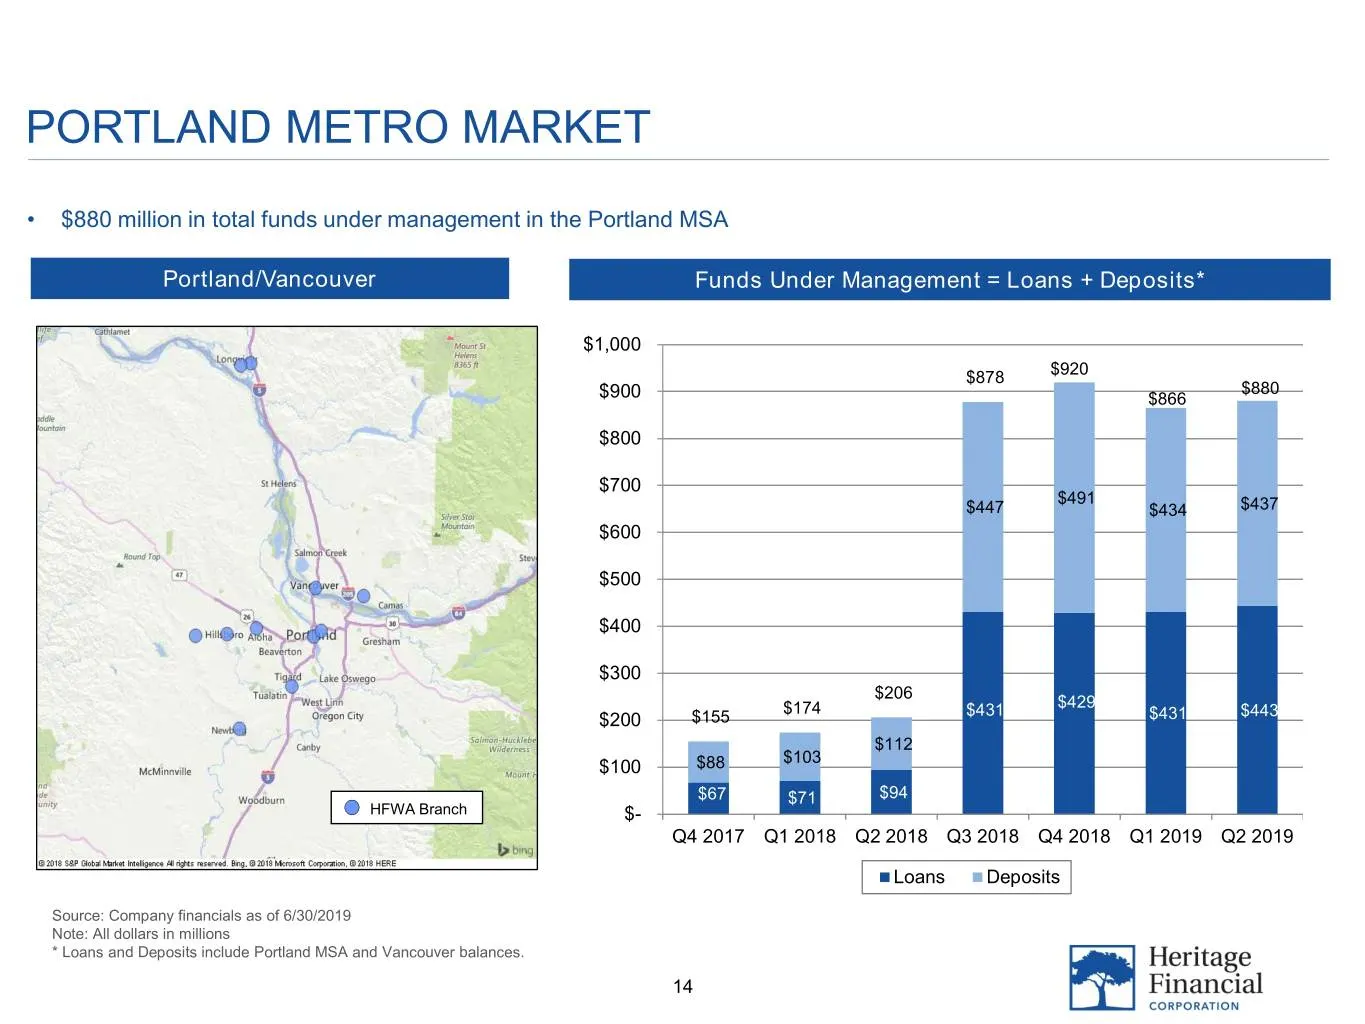
PORTLAND METRO MARKET • $880 million in total funds under management in the Portland MSA Portland/Vancouver Funds Under Management = Loans + Deposits* $1,000 $878 $920 $880 $900 $866 $800 $700 $491 $447 $434 $437 $600 $500 $400 $300 $206 $174 $429 $200 $155 $431 $431 $443 $112 $100 $88 $103 $67 $71
Slide 15: Future Growth and Opportunities
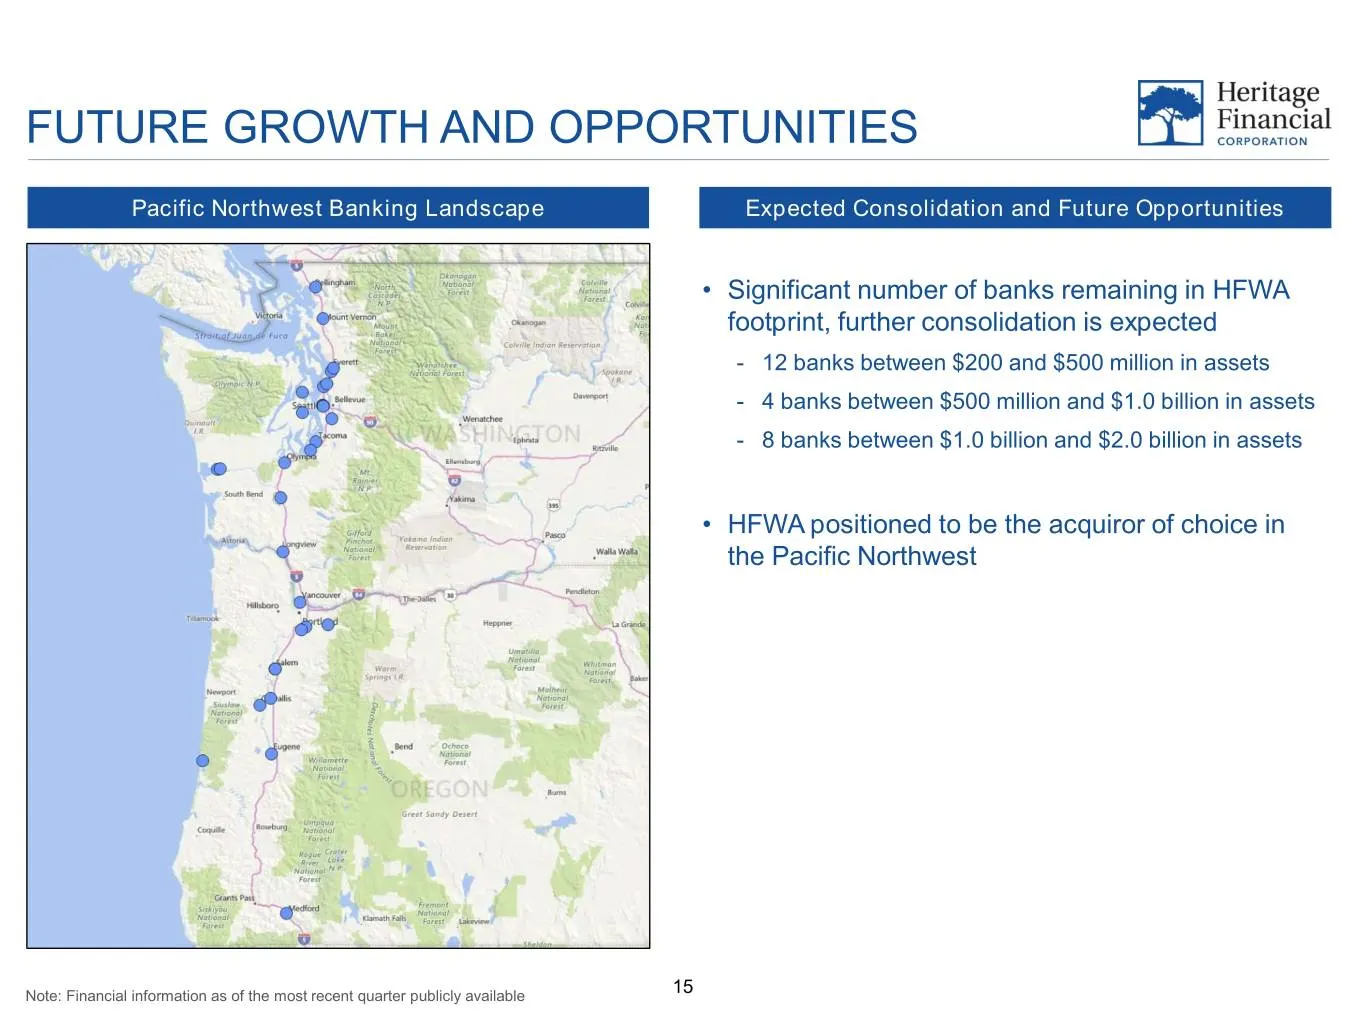
FUTURE GROWTH AND OPPORTUNITIES Pacific Northwest Banking Landscape Expected Consolidation and Future Opportunities • Significant number of banks remaining in HFWA footprint, further consolidation is expected - 12 banks between $200 and $500 million in assets - 4 banks between $500 million and $1.0
Slide 16: Financial Update
FINANCIAL UPDATE 16
Slide 17: Second Quarter Update
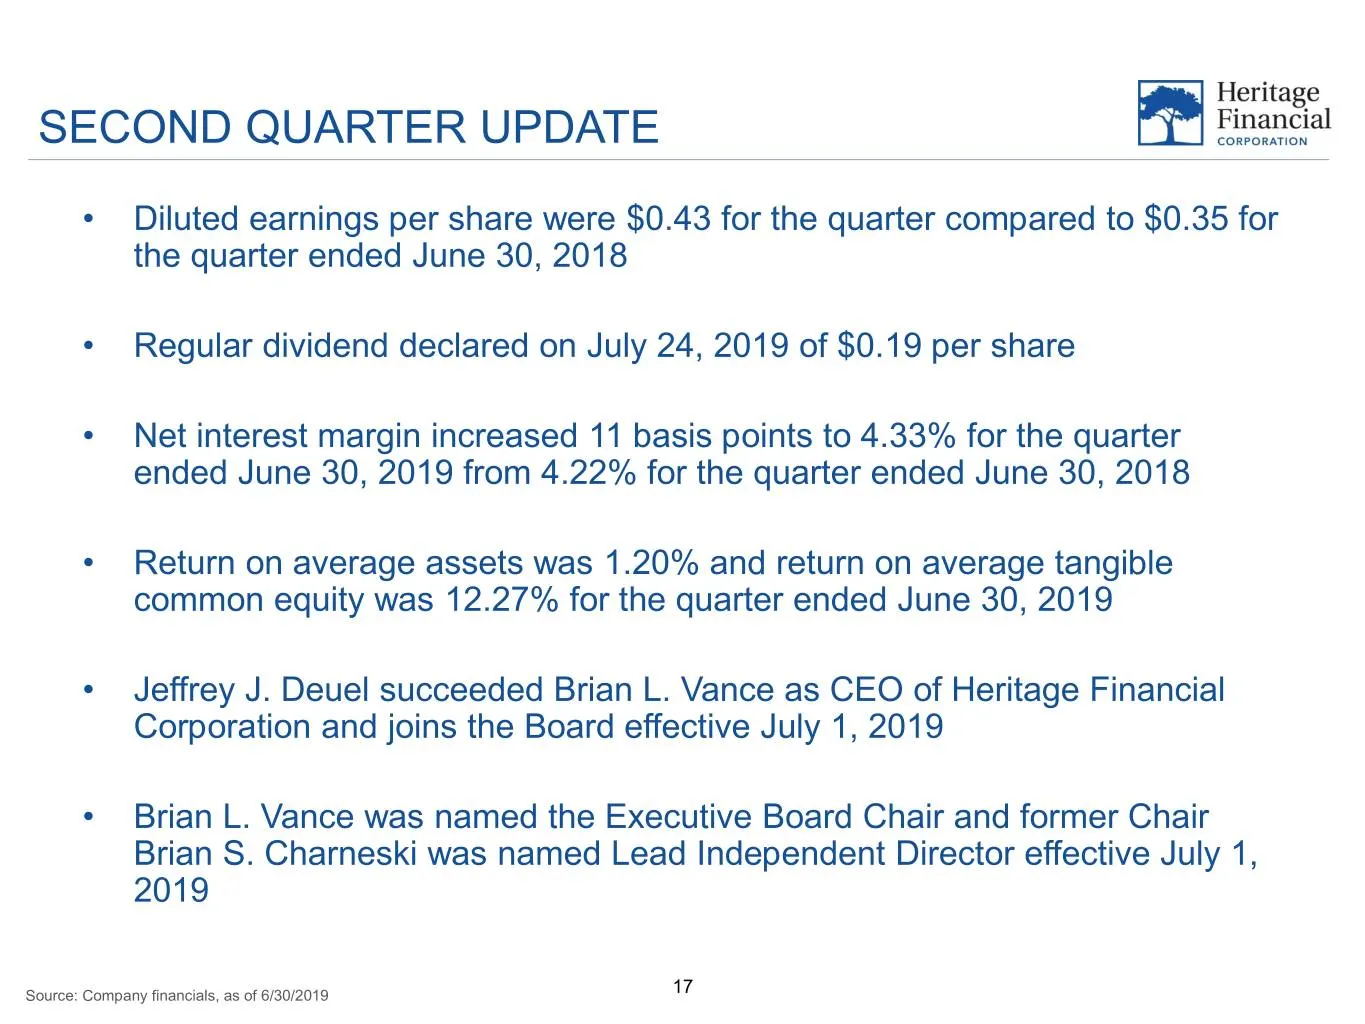
SECOND QUARTER UPDATE • Diluted earnings per share were $0.43 for the quarter compared to $0.35 for the quarter ended June 30, 2018 • Regular dividend declared on July 24, 2019 of $0.19 per share • Net interest margin increased 11 basis points to 4.33% for the quarter ended June 30, 2019 from 4.22%
Slide 18: Balance Sheet Mix
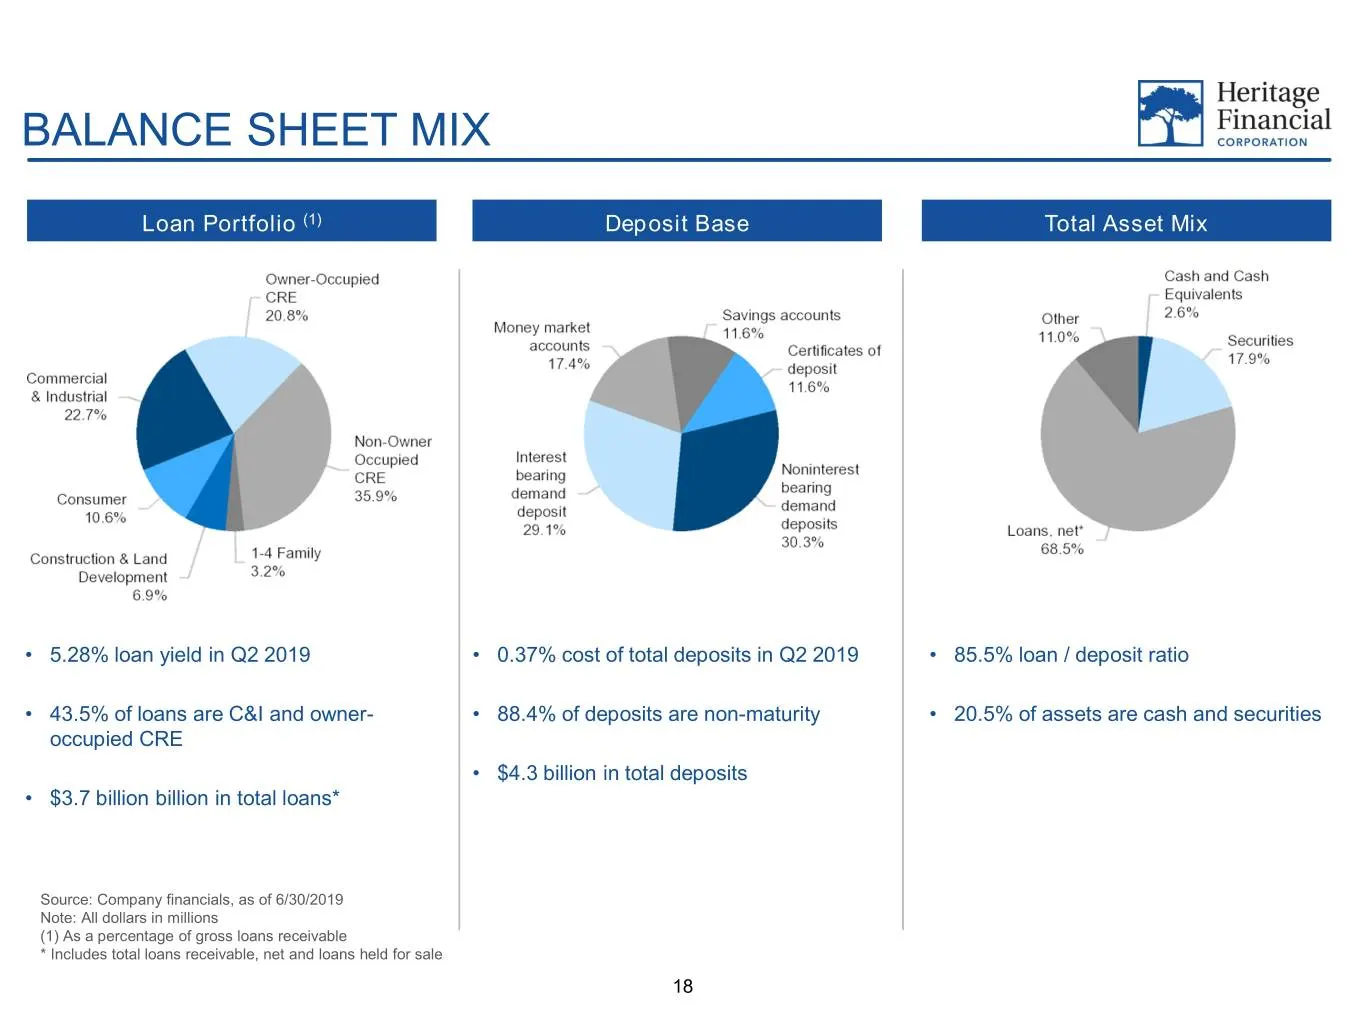
BALANCE SHEET MIX Loan Portfolio (1) Deposit Base Total Asset Mix • 5.28% loan yield in Q2 2019 • 0.37% cost of total deposits in Q2 2019 • 85.5% loan / deposit ratio • 43.5% of loans are C&I and owner- • 88.4% of deposits are non-maturity • 20.5% of assets are cash and securities occupied CRE • $4.
Slide 19: Balance Sheet Trends
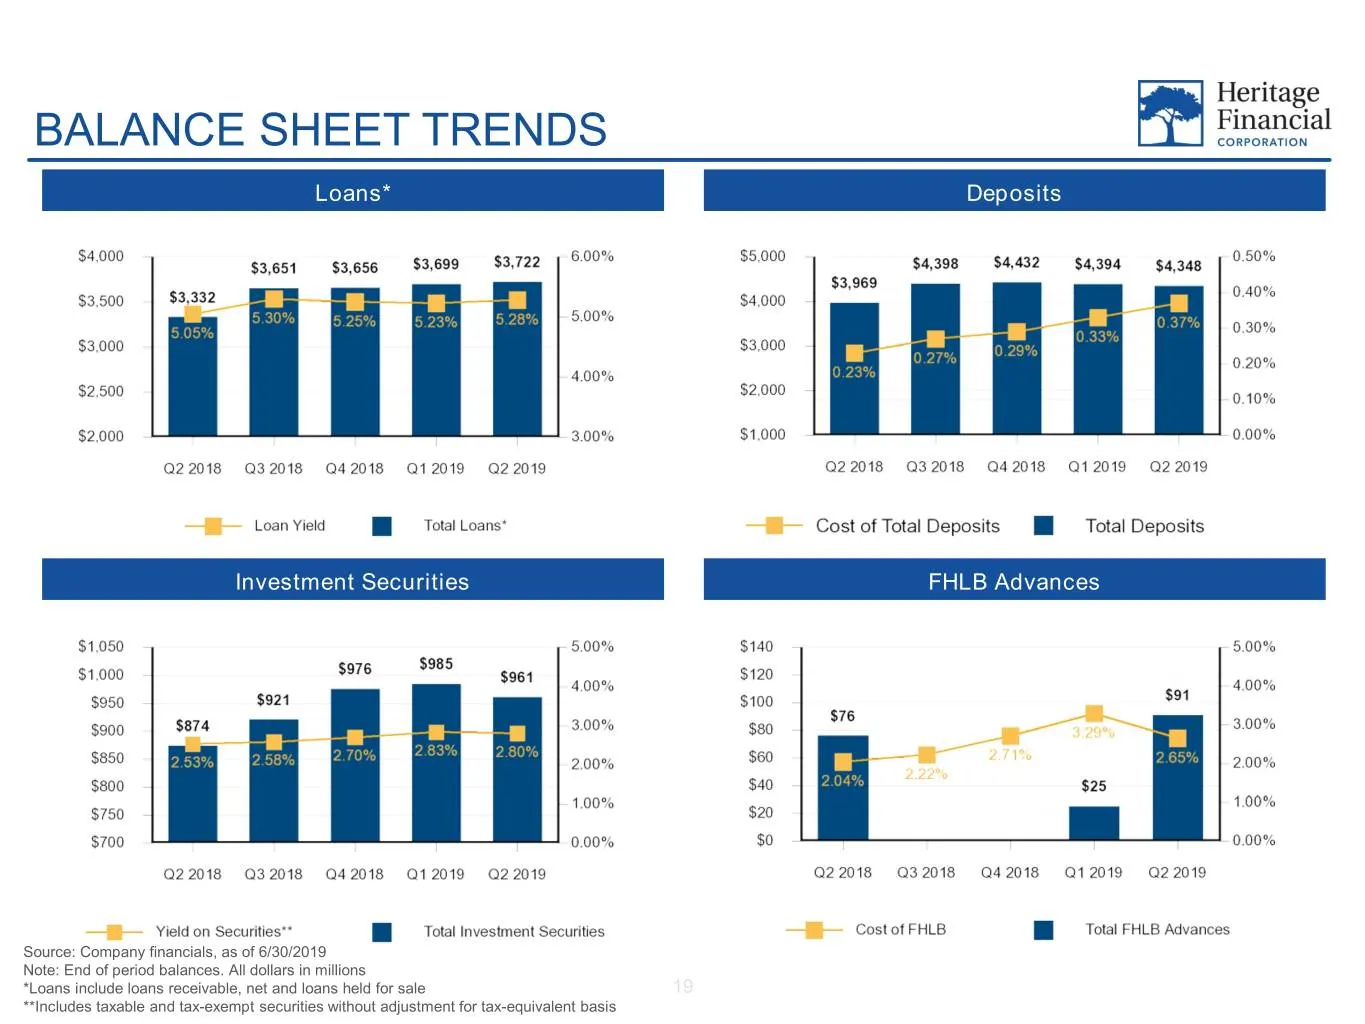
BALANCE SHEET TRENDS Loans* Deposits Investment Securities FHLB Advances Source: Company financials, as of 6/30/2019 Note: End of period balances. All dollars in millions *Loans include loans receivable, net and loans held for sale 19 **Includes taxable and tax-exempt securities without adjustment f
Slide 20: Net Interest Margin
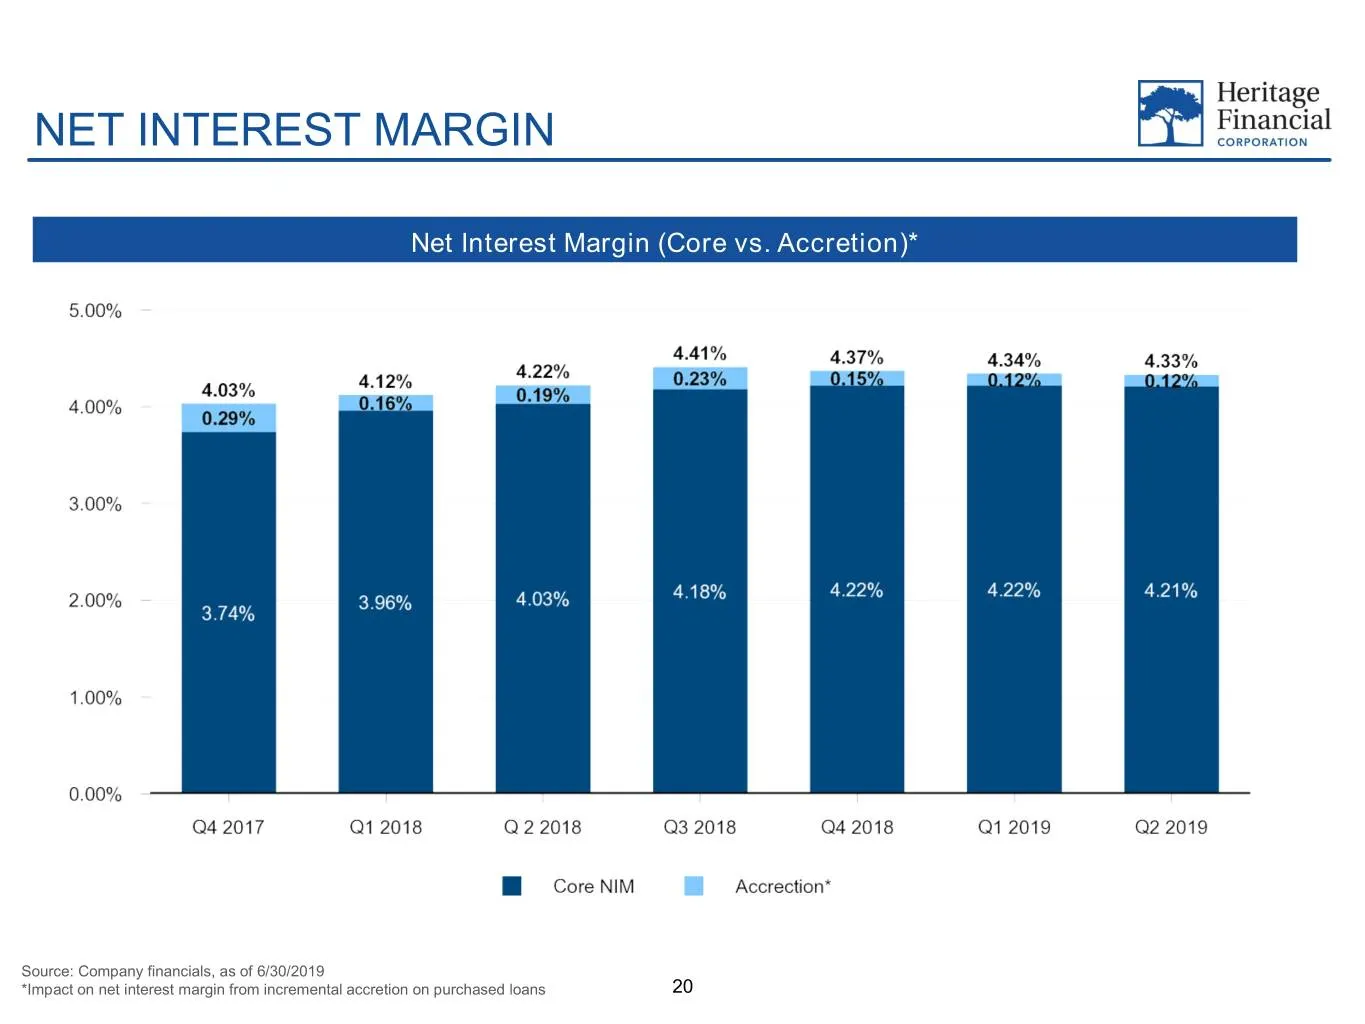
NET INTEREST MARGIN Net Interest Margin (Core vs. Accretion)* Source: Company financials, as of 6/30/2019 *Impact on net interest margin from incremental accretion on purchased loans 20
Slide 21: Core Deposit Franchise
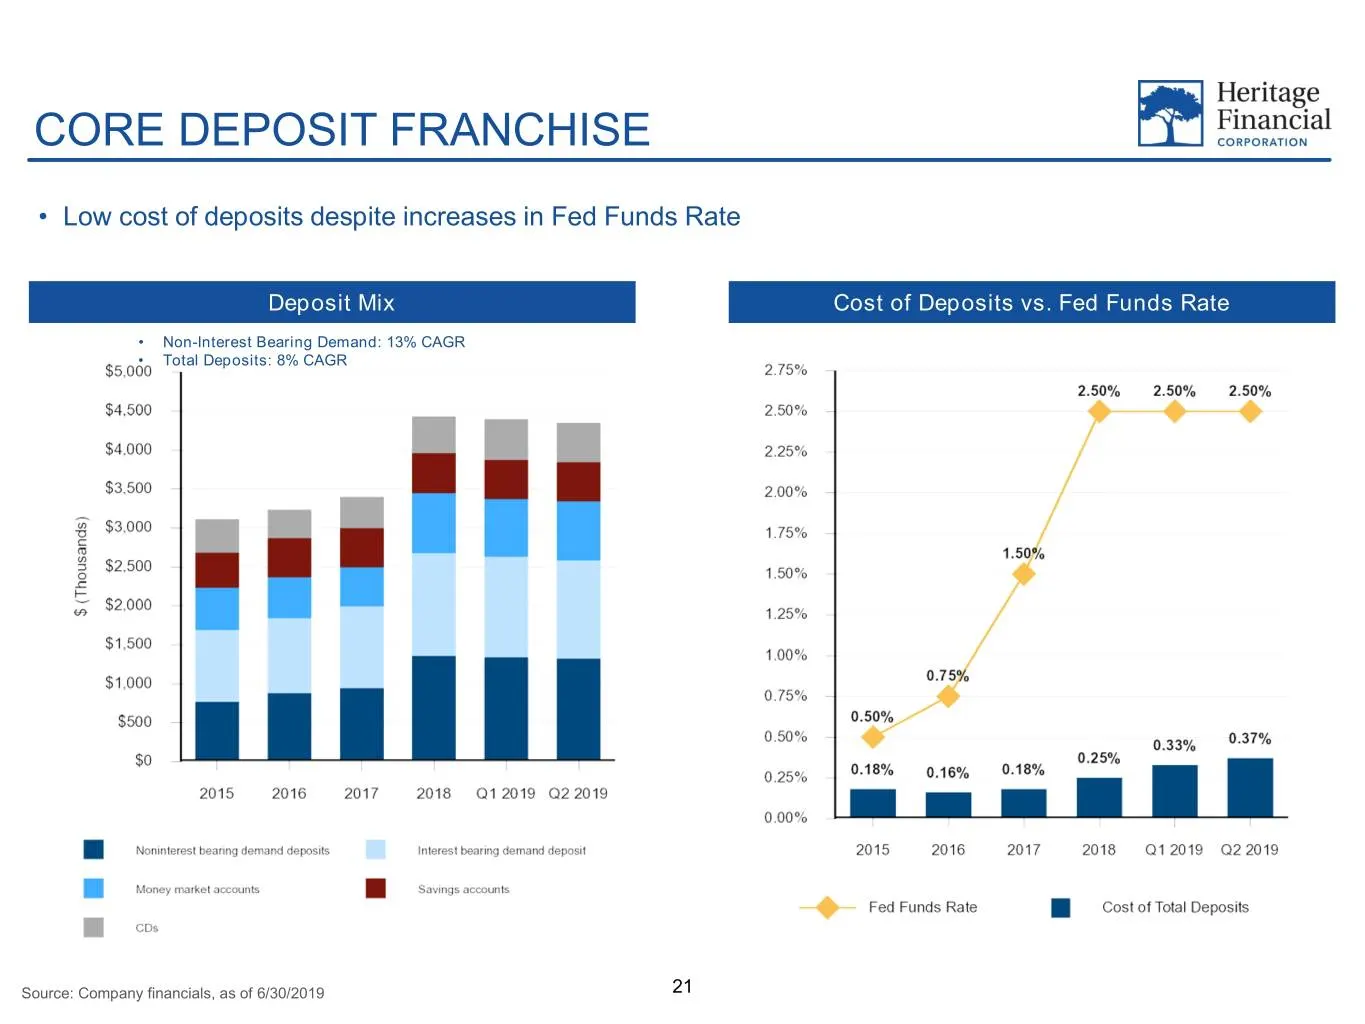
CORE DEPOSIT FRANCHISE • Low cost of deposits despite increases in Fed Funds Rate Deposit Mix Cost of Deposits vs. Fed Funds Rate • Non-Interest Bearing Demand: 13% CAGR • Total Deposits: 8% CAGR Source: Company financials, as of 6/30/2019 21
Slide 22: Profitability Trends
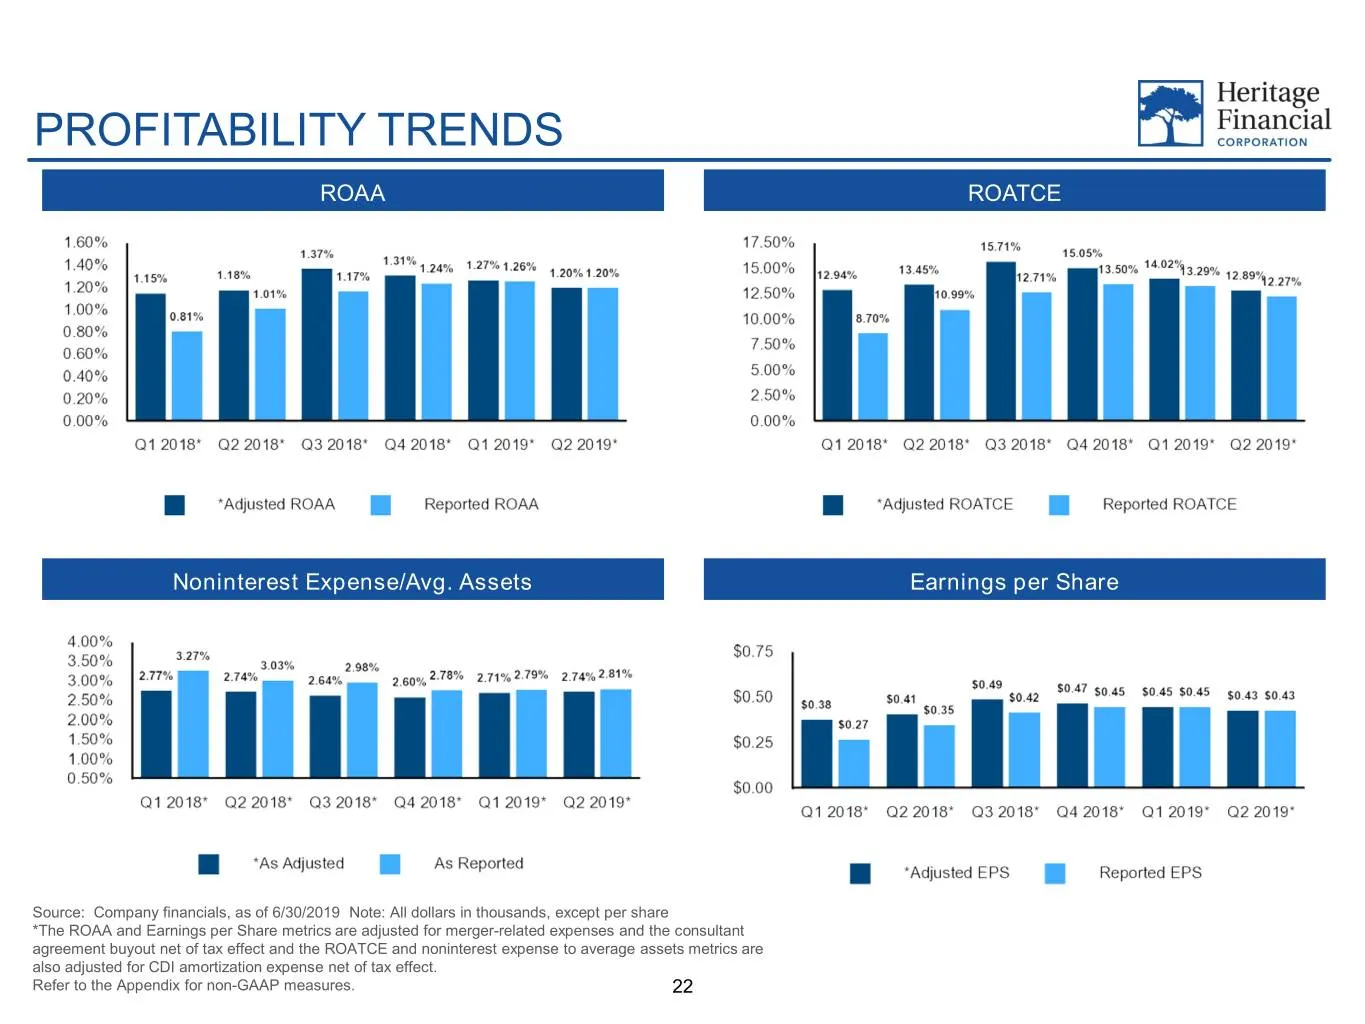
PROFITABILITY TRENDS ROAA ROATCE Noninterest Expense/Avg. Assets Earnings per Share Source: Company financials, as of 6/30/2019 Note: All dollars in thousands, except per share *The ROAA and Earnings per Share metrics are adjusted for merger-related expenses and the consultant agreement buyout net o
Slide 23: Credit Quality Trends
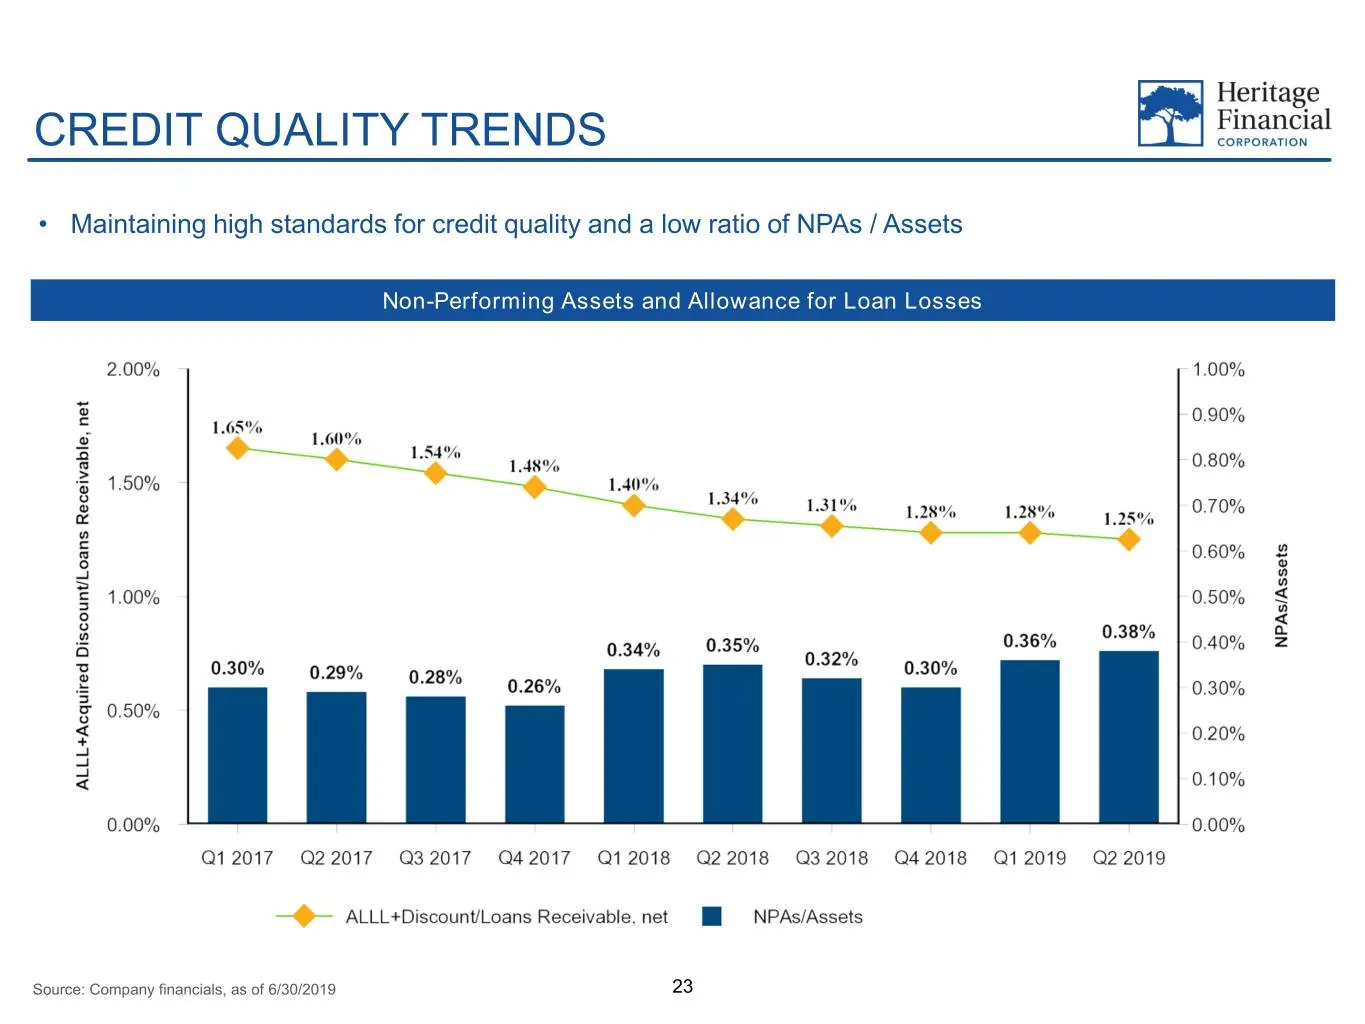
CREDIT QUALITY TRENDS • Maintaining high standards for credit quality and a low ratio of NPAs / Assets Non-Performing Assets and Allowance for Loan Losses Source: Company financials, as of 6/30/2019 23
Slide 24: Capital Ratio Trends
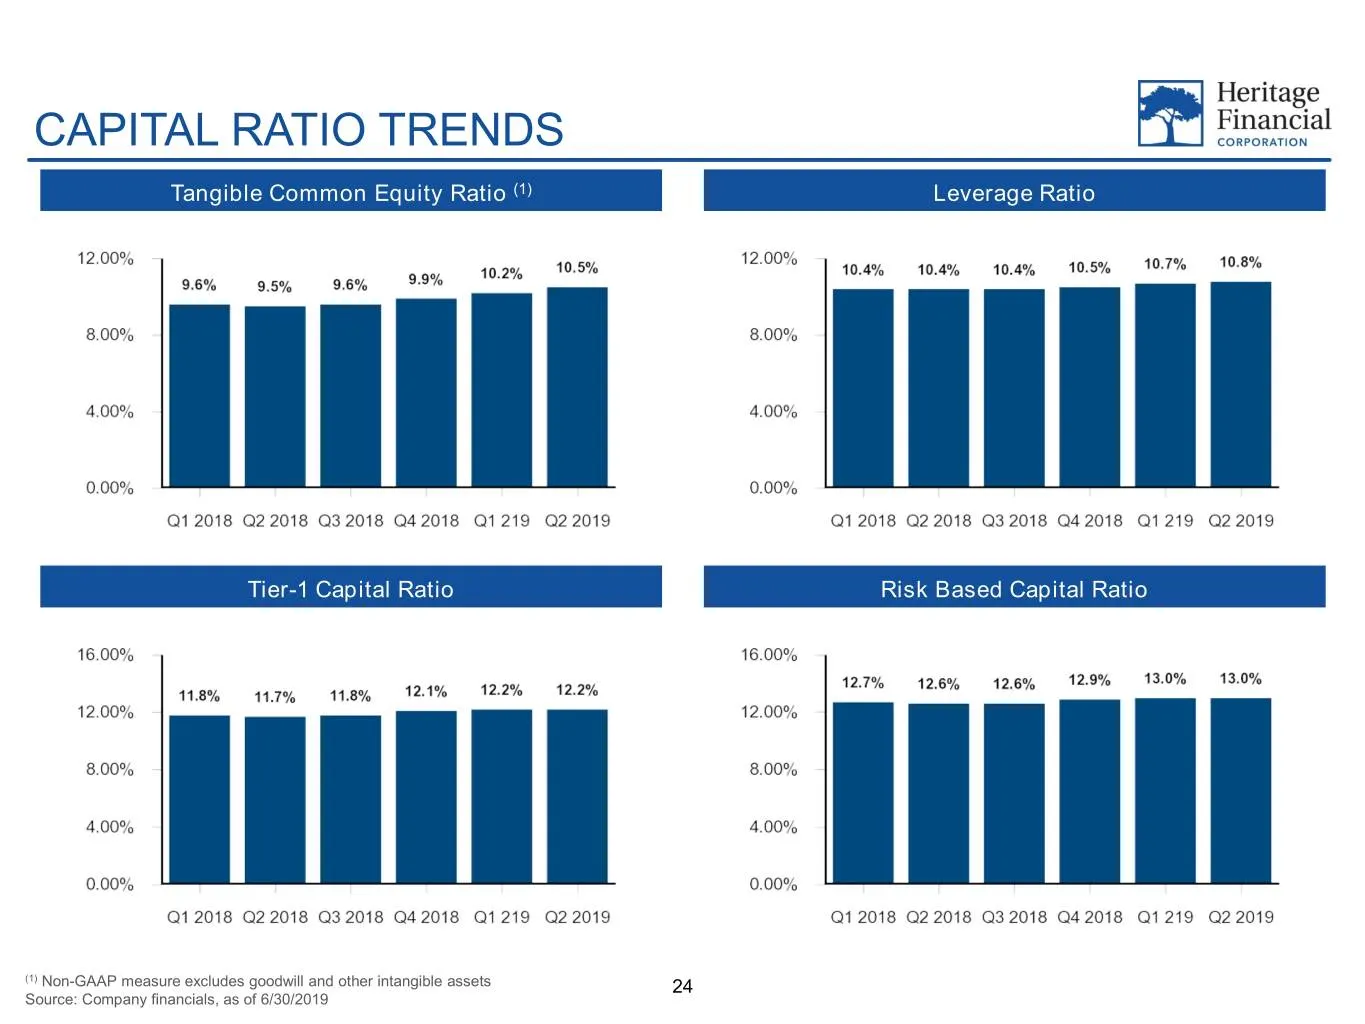
CAPITAL RATIO TRENDS Tangible Common Equity Ratio (1) Leverage Ratio Tier-1 Capital Ratio Risk Based Capital Ratio (1) Non-GAAP measure excludes goodwill and other intangible assets 24 Source: Company financials, as of 6/30/2019
Slide 25: Shareholder Return
SHAREHOLDER RETURN 25
Slide 26: Total Shareholder Return
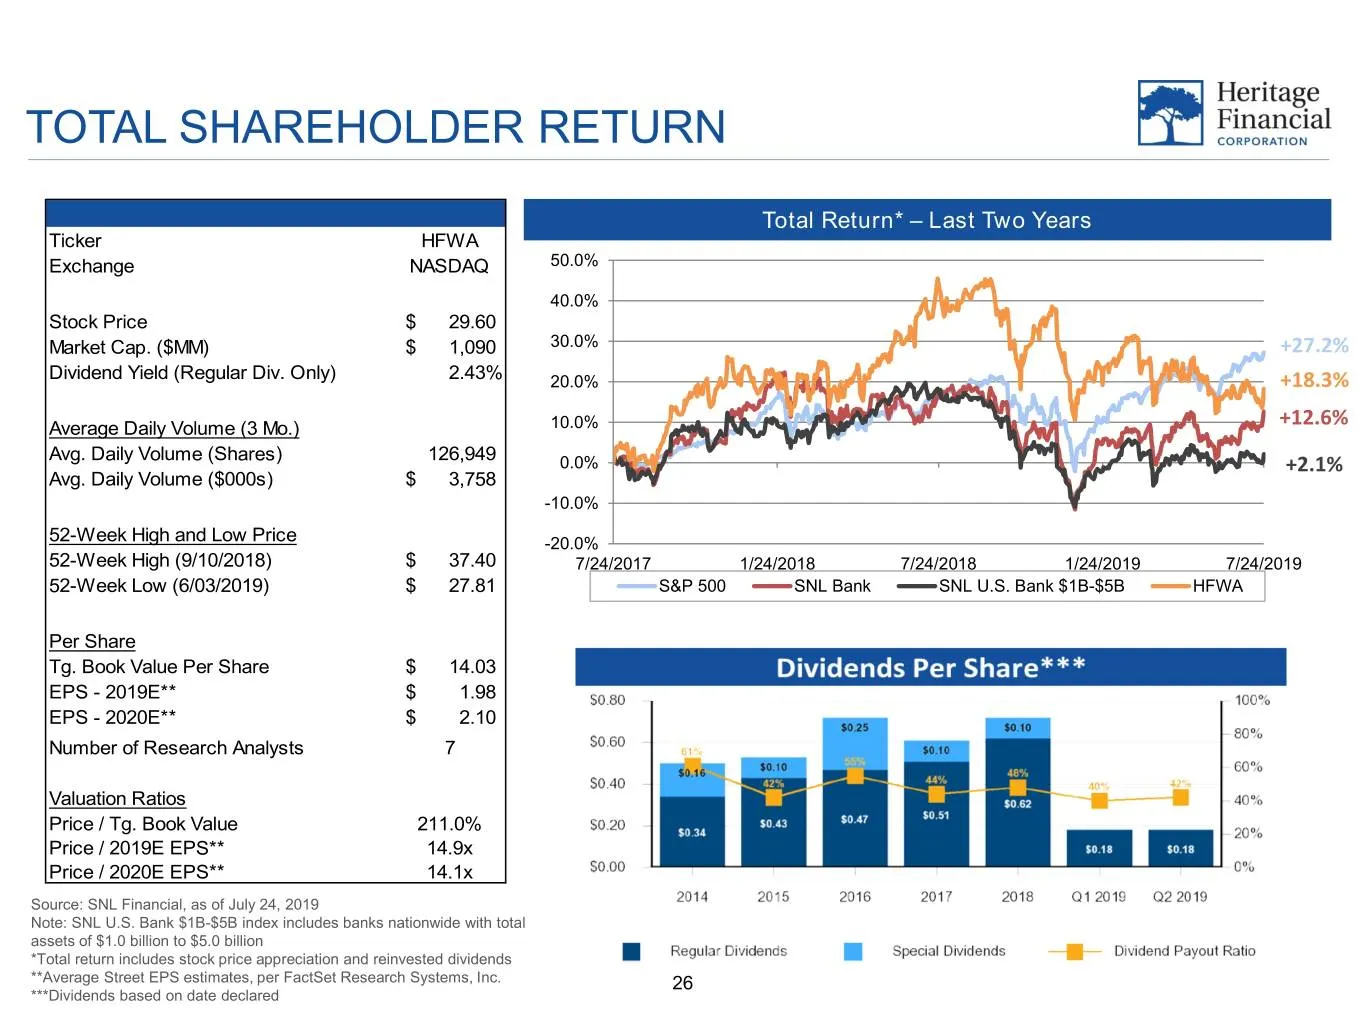
TOTAL SHAREHOLDER RETURN Total Return* – Last Two Years Ticker HFWA Exchange NASDAQ 50.0% 40.0% Stock Price $ 29.60 Market Cap. ($MM) $ 1,090 30.0% +27.2% Dividend Yield (Regular Div. Only) 2.43% 20.0% +18.3% Average Daily Volume (3 Mo.) 10.0% +12.6% Avg. Daily Volume (Shares) 126,949 0.0% +2.1% Avg
Slide 27: Superior Market Performance
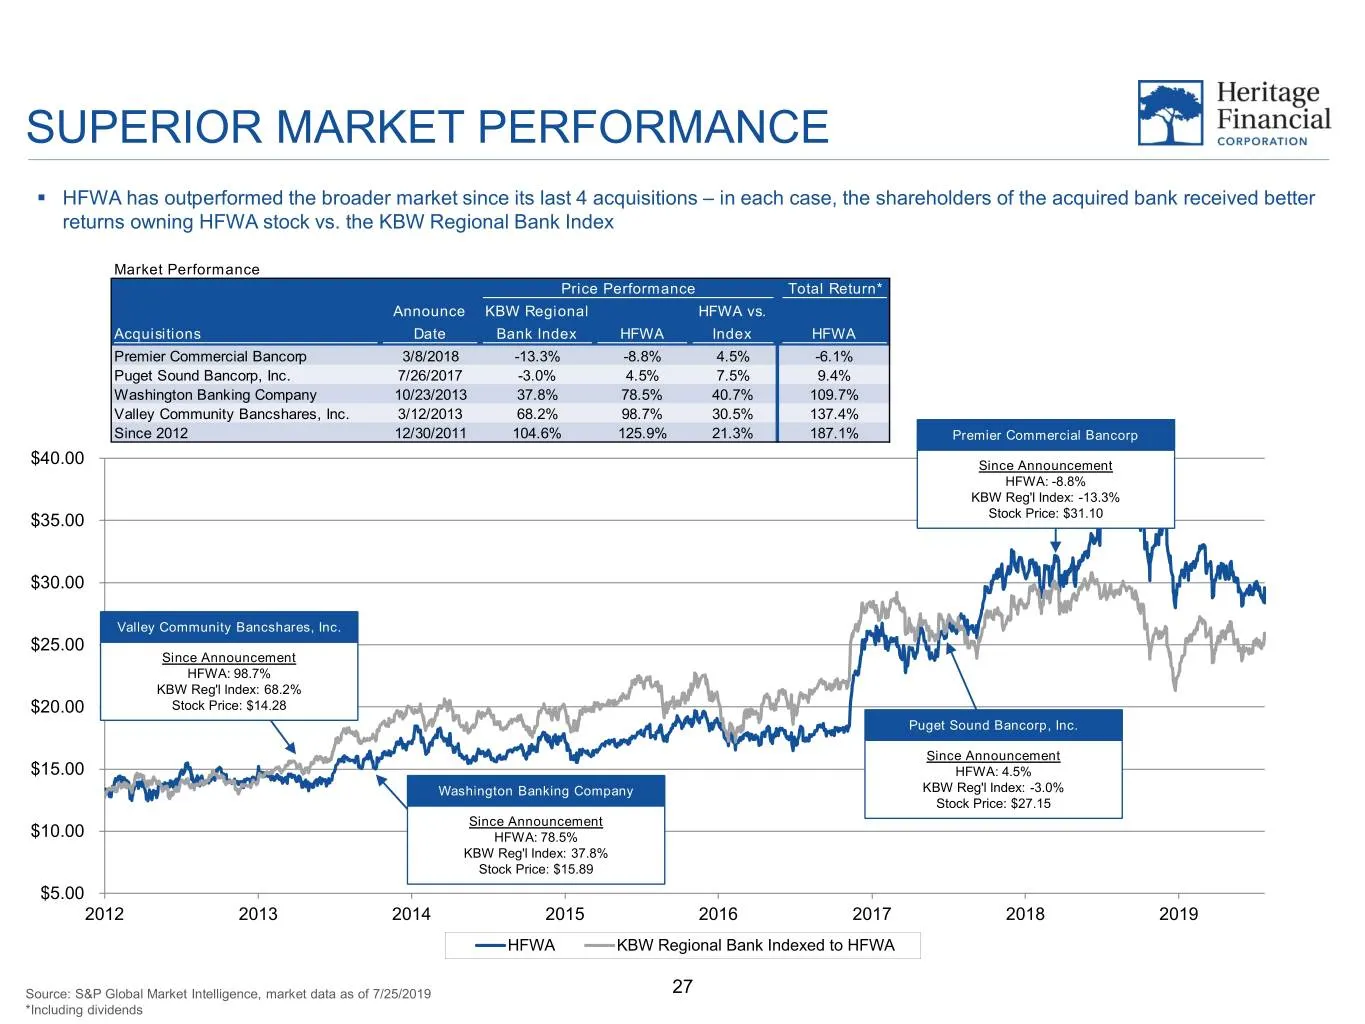
SUPERIOR MARKET PERFORMANCE . HFWA has outperformed the broader market since its last 4 acquisitions – in each case, the shareholders of the acquired bank received better returns owning HFWA stock vs. the KBW Regional Bank Index Market Performance Price Performance Total Return* Announce KBW Regiona
Slide 28: History of Growing Dividends
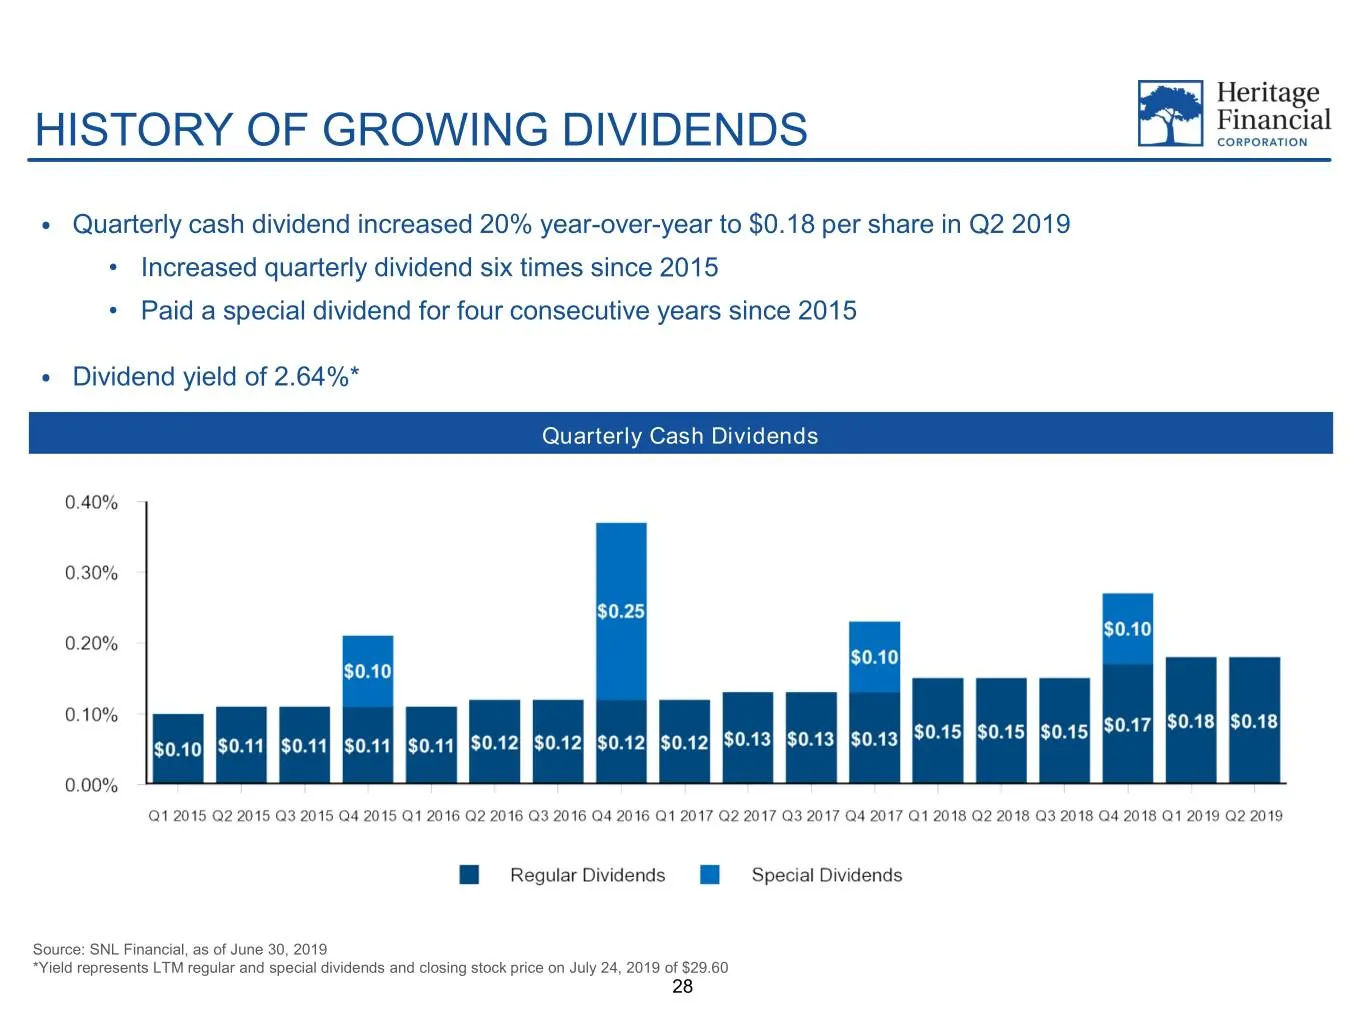
HISTORY OF GROWING DIVIDENDS Quarterly cash dividend increased 20% year-over-year to $0.18 per share in Q2 2019 • Increased quarterly dividend six times since 2015 ⦁ • Paid a special dividend for four consecutive years since 2015 - - Dividend yield of 2.64%* ⦁ Quarterly Cash Dividends Source: SNL Fi
Slide 29: Investment Thesis
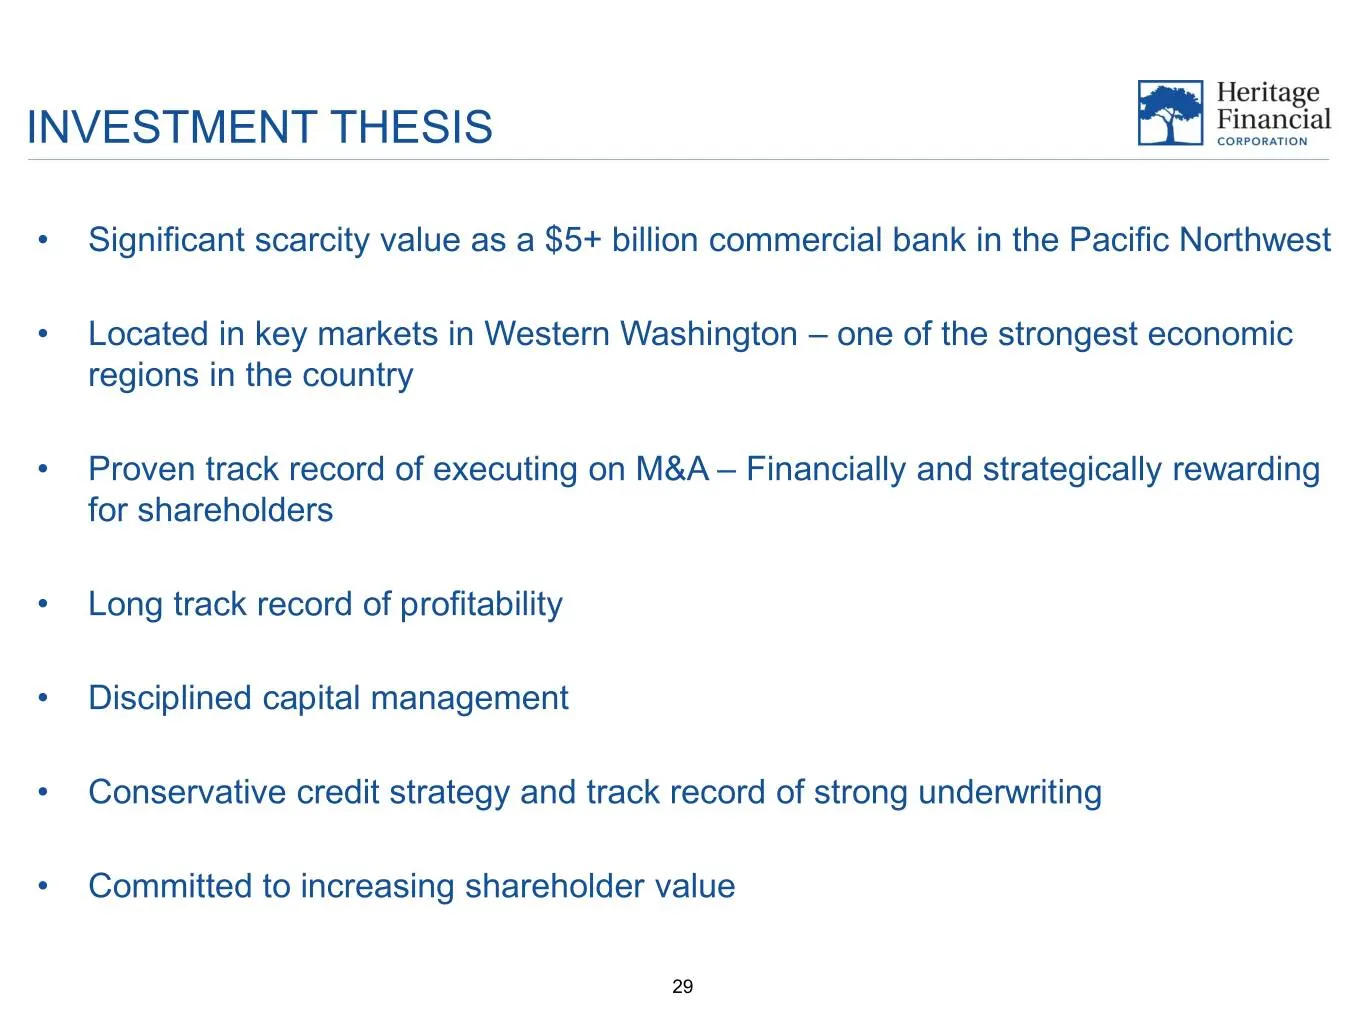
INVESTMENT THESIS • Significant scarcity value as a $5+ billion commercial bank in the Pacific Northwest • Located in key markets in Western Washington – one of the strongest economic regions in the country • Proven track record of executing on M&A – Financially and strategically rewarding for share
Slide 30: Appendix
APPENDIX 30
Slide 31: Non-GAAP Financial Measures: Adjusted ROAA
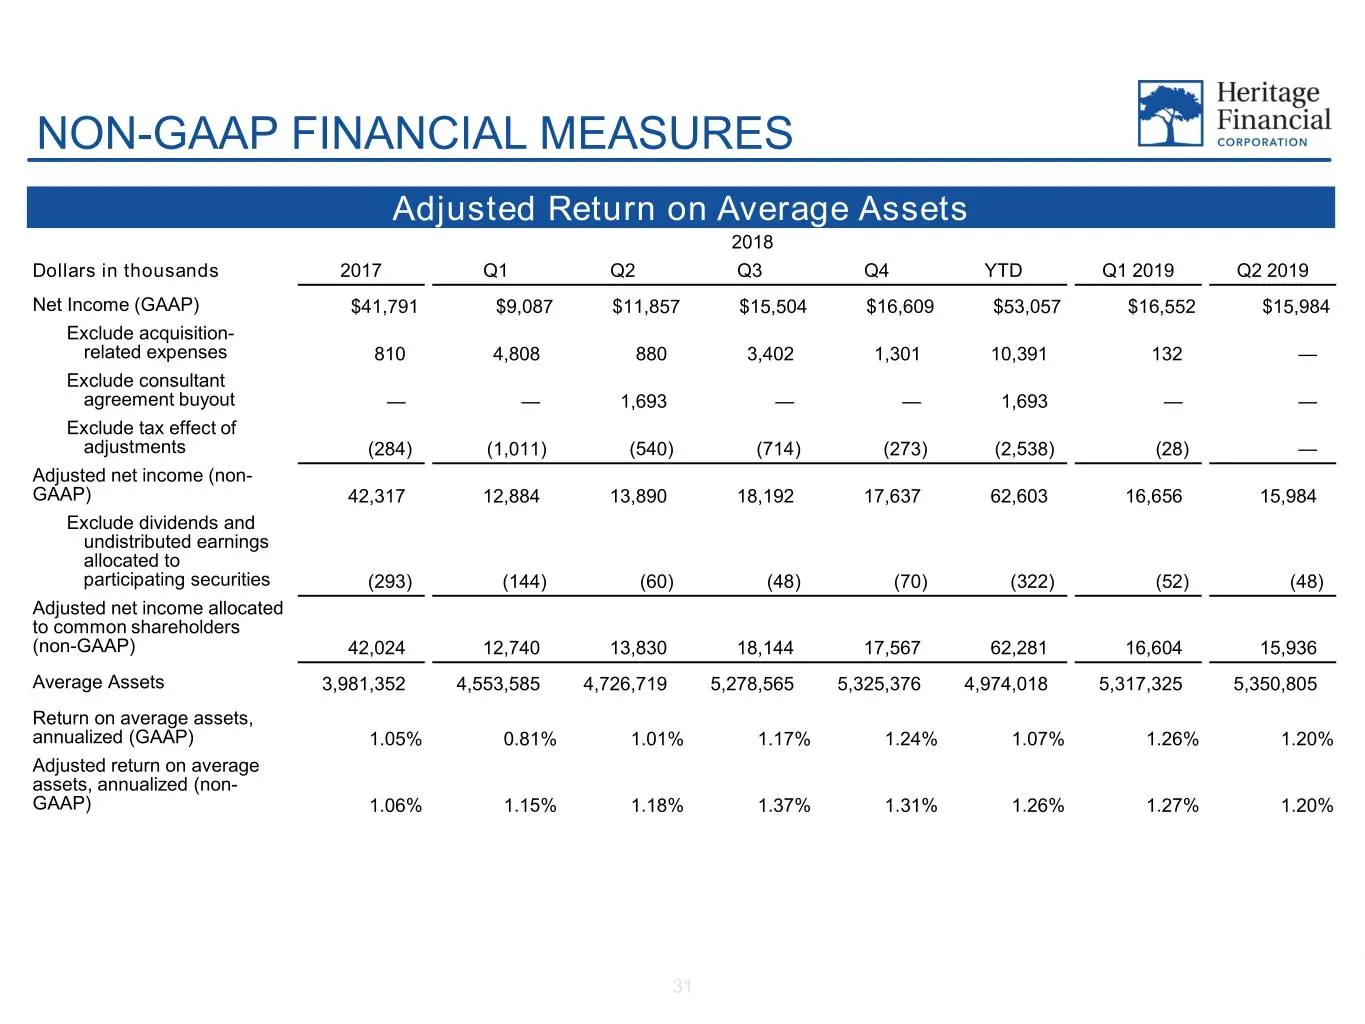
NON-GAAP FINANCIAL MEASURES Adjusted Return on Average Assets 2018 Dollars in thousands 2017 Q1 Q2 Q3 Q4 YTD Q1 2019 Q2 2019 Net Income (GAAP) $41,791 $9,087 $11,857 $15,504 $16,609 $53,057 $16,552 $15,984 Exclude acquisition- related expenses 810 4,808 880 3,402 1,301 10,391 132 — Exclude consultan
Slide 32: Non-GAAP Financial Measures: Adjusted ROATCE
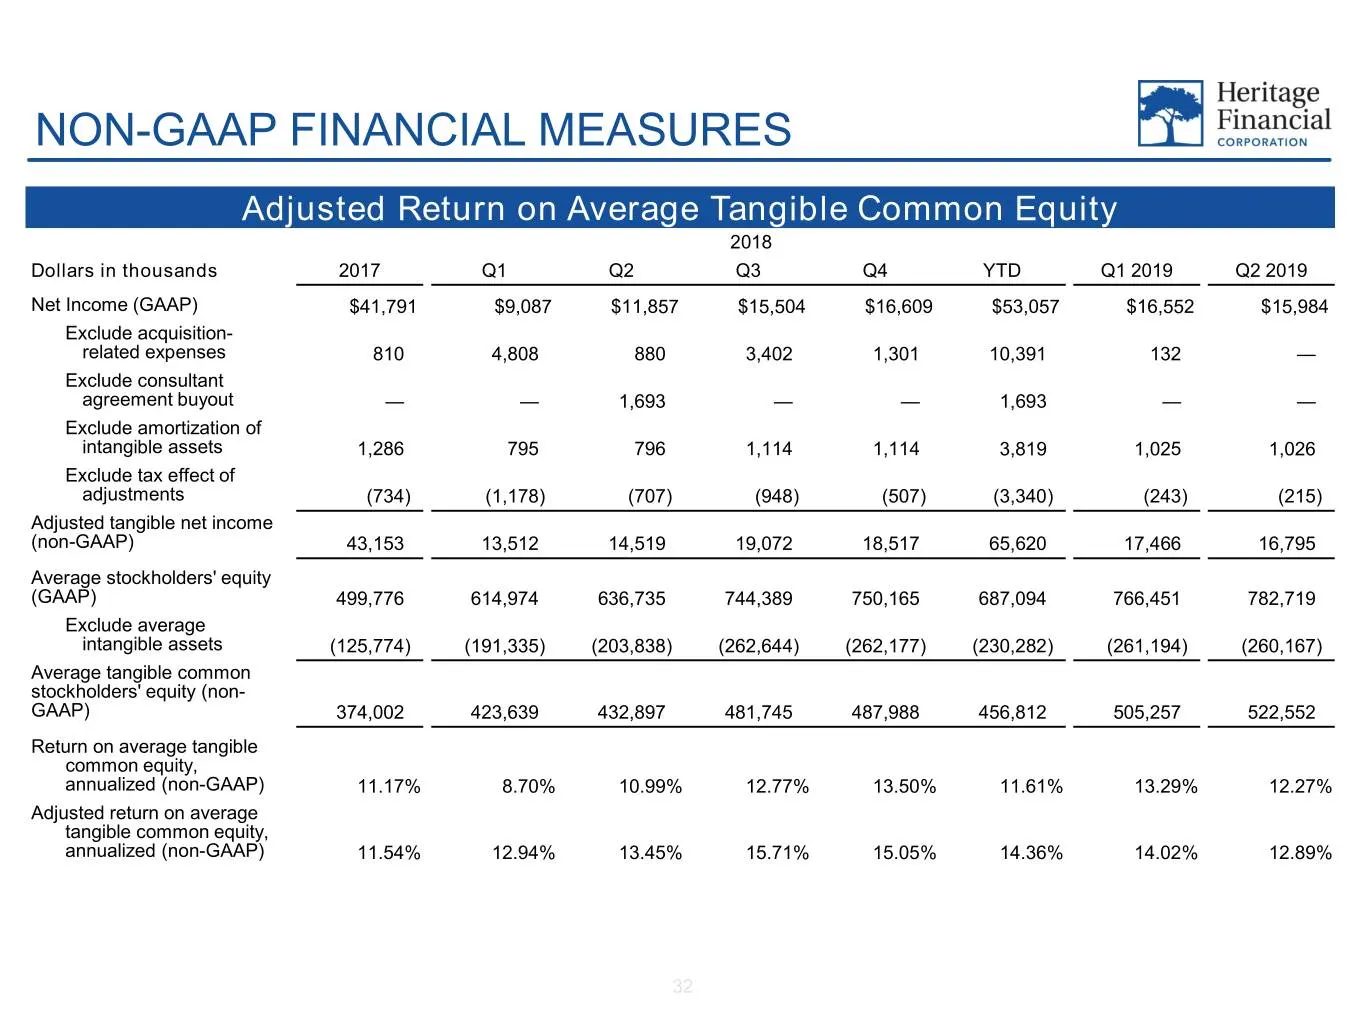
NON-GAAP FINANCIAL MEASURES Adjusted Return on Average Tangible Common Equity 2018 Dollars in thousands 2017 Q1 Q2 Q3 Q4 YTD Q1 2019 Q2 2019 Net Income (GAAP) $41,791 $9,087 $11,857 $15,504 $16,609 $53,057 $16,552 $15,984 Exclude acquisition- related expenses 810 4,808 880 3,402 1,301 10,391 132 — E
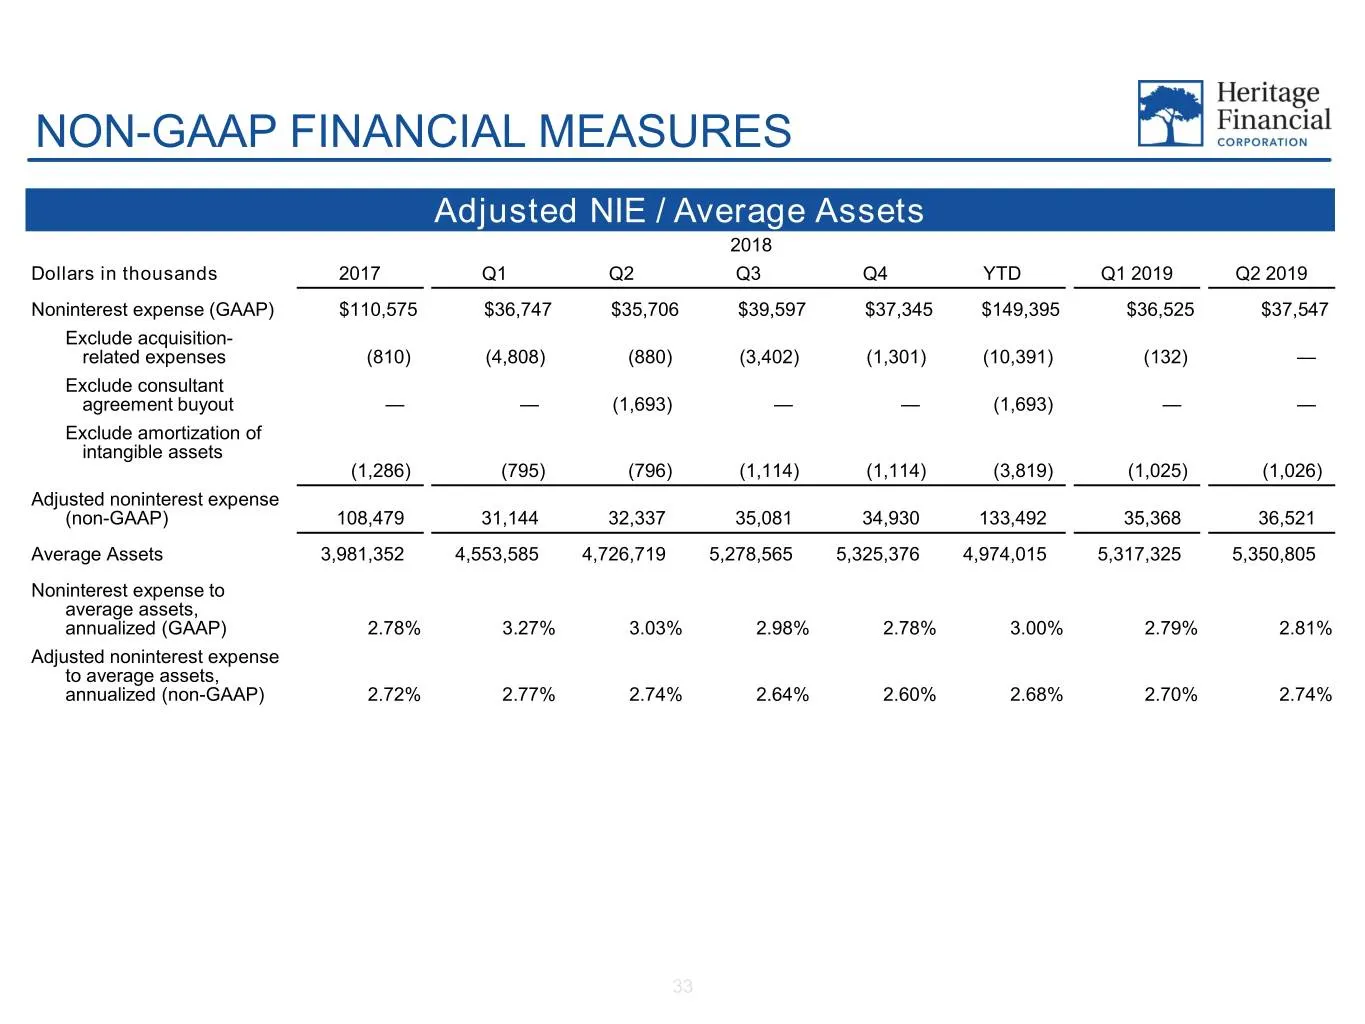
Slide 33: Non-GAAP Financial Measures: Adjusted NIE / Average Assets
NON-GAAP FINANCIAL MEASURES Adjusted NIE / Average Assets 2018 Dollars in thousands 2017 Q1 Q2 Q3 Q4 YTD Q1 2019 Q2 2019 Noninterest expense (GAAP) $110,575 $36,747 $35,706 $39,597 $37,345 $149,395 $36,525 $37,547 Exclude acquisition- related expenses (810) (4,808) (880) (3,402) (1,301) (10,391) (13
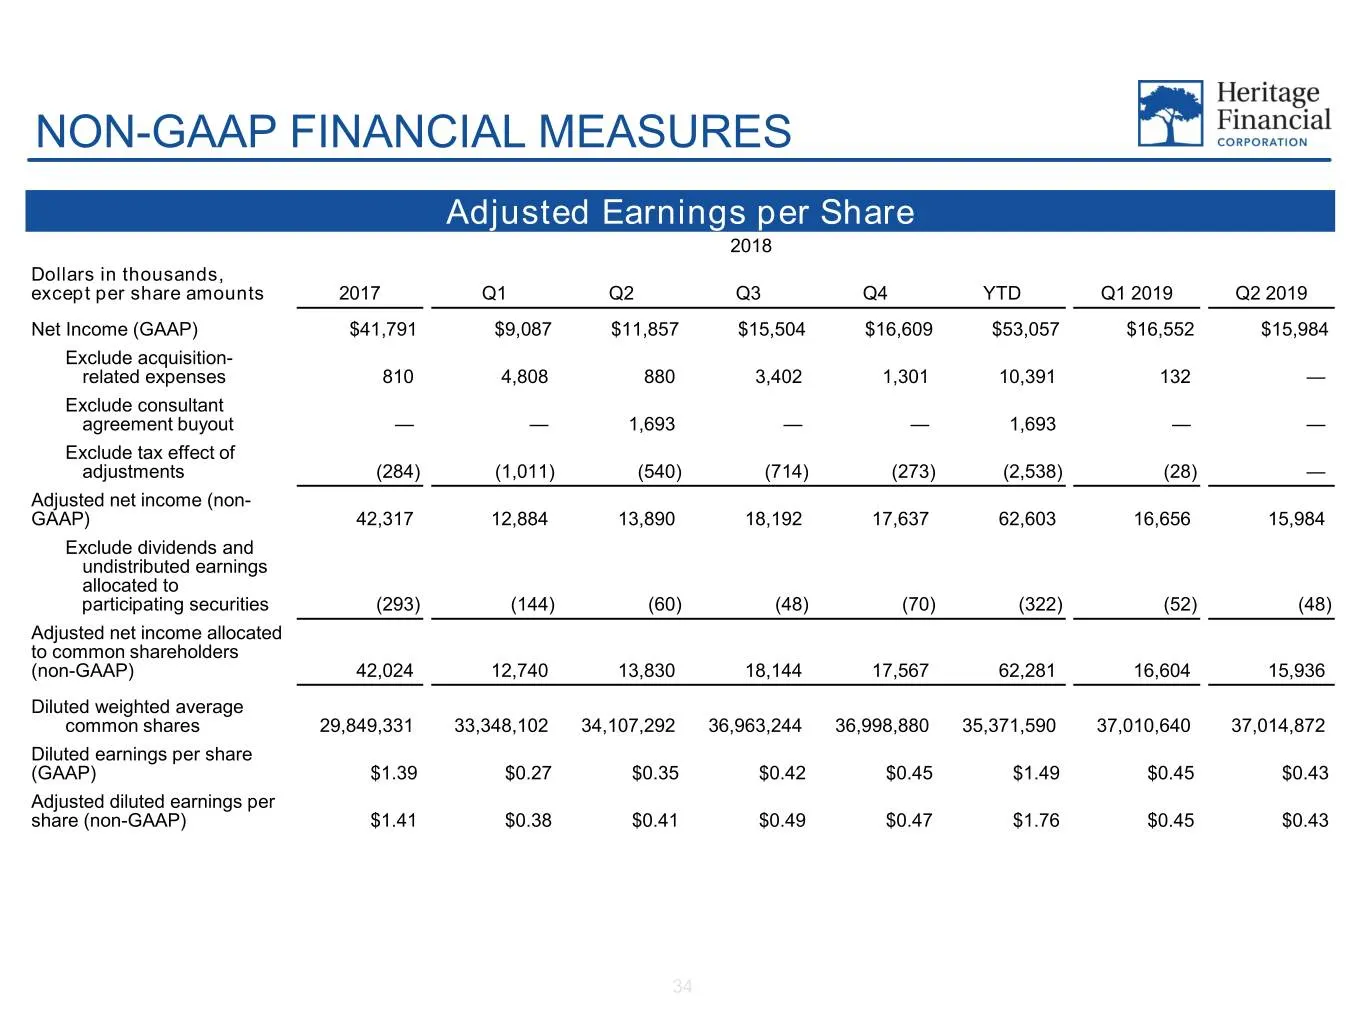
Slide 34: Non-GAAP Financial Measures: Adjusted Earnings per Share
NON-GAAP FINANCIAL MEASURES Adjusted Earnings per Share 2018 Dollars in thousands, except per share amounts 2017 Q1 Q2 Q3 Q4 YTD Q1 2019 Q2 2019 Net Income (GAAP) $41,791 $9,087 $11,857 $15,504 $16,609 $53,057 $16,552 $15,984 Exclude acquisition- related expenses 810 4,808 880 3,402 1,301 10,391 132
Source: SEC EDGAR · 8-K filed Jul 30, 2019
More decks from Heritage Financial Corporation
 Q3 2026 Earnings Presentation39 slides · Oct 22, 2026
 Q2 2026 Earnings Presentation39 slides · Jul 23, 2026
 Q1 2026 Earnings Presentation40 slides · Apr 23, 2026
 Q4 2025 Earnings Presentation41 slides · Jan 22, 2026
 Q3 2025 Earnings Presentation41 slides · Oct 23, 2025
 Merger or Acquisition (October 2025)22 slides · Oct 1, 2025