Worldline SA · EURONEXT:WLN
Worldline SA — FY2024 Earnings Presentation
36 slides from Worldline SA's earnings presentation, Feb 26, 2025

Slide 1: FY 2024 Results
FY 2024 RESULTS February 26th, 2025
Slide 2: Disclaimer
Disclaimer This document contains forward-looking statements that involve risks and uncertainties, including references, concerning the Group's expected growth and profitability in the future which may significantly impact the expected performance indicated in the forward-looking statements. These r

Slide 3: Opening remarks
Opening remarks Wilfried Verstraete Group Chairman
Slide 4: CEO update
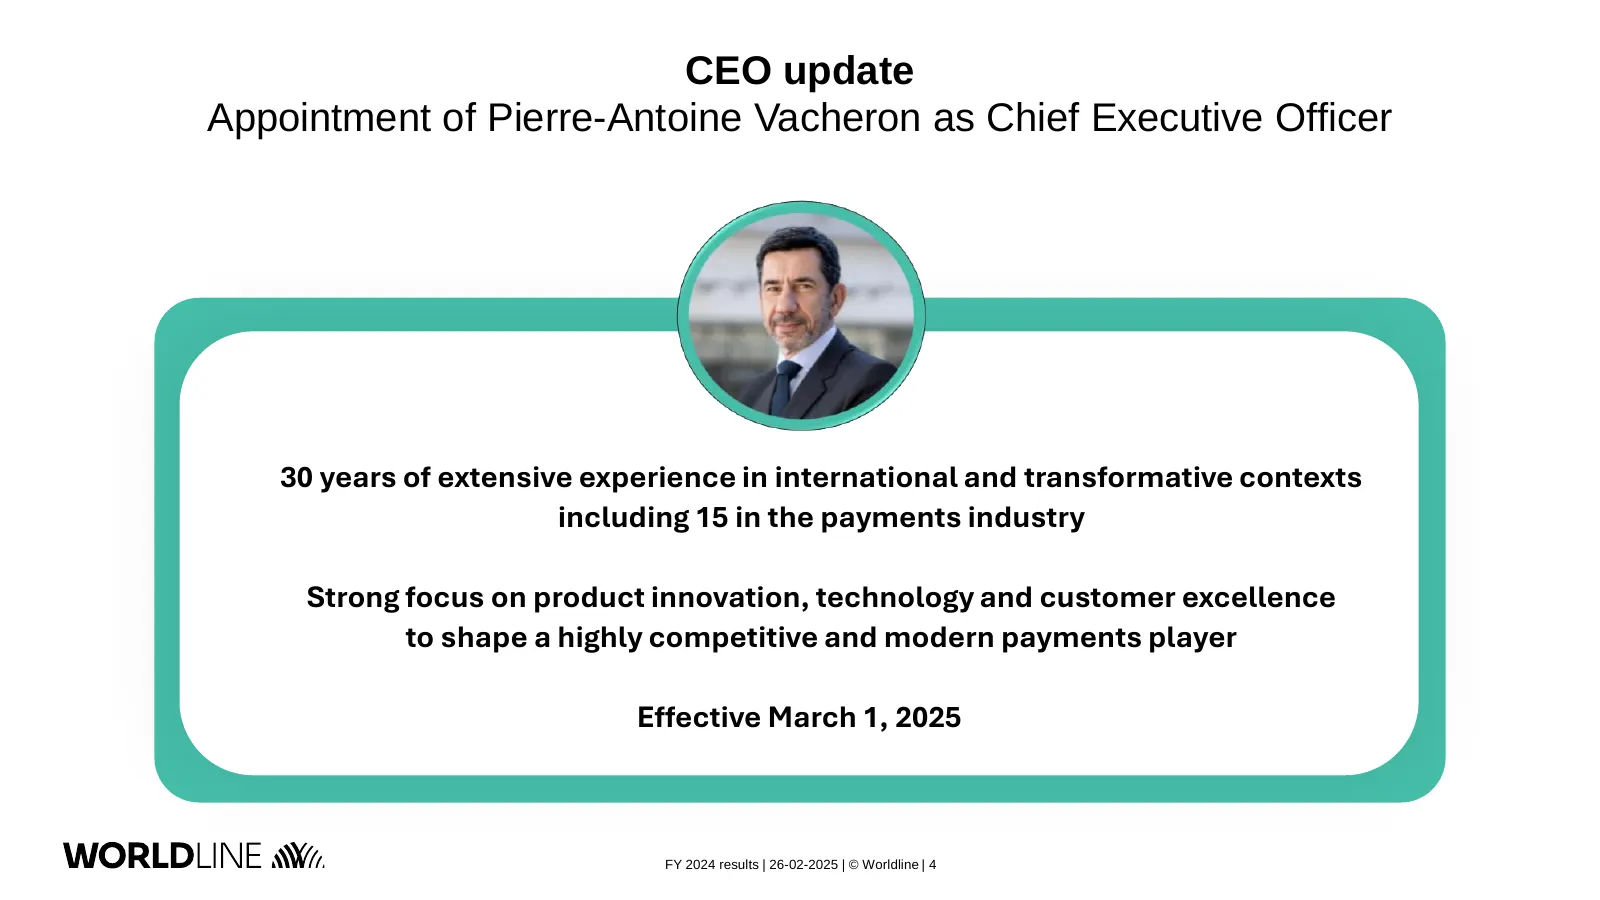
CEO update Appointment of Pierre-Antoine Vacheron as Chief Executive Officer 30 years of extensive experience in international and transformative contexts including 15 in the payments industry Strong focus on product innovation, technology and customer excellence to shape a highly competitive and mo

Slide 5: FY'24 Highlights
FY’24 HIGHLIGHTS Grégory Lambertie Group CFO
Slide 6: Key highlights
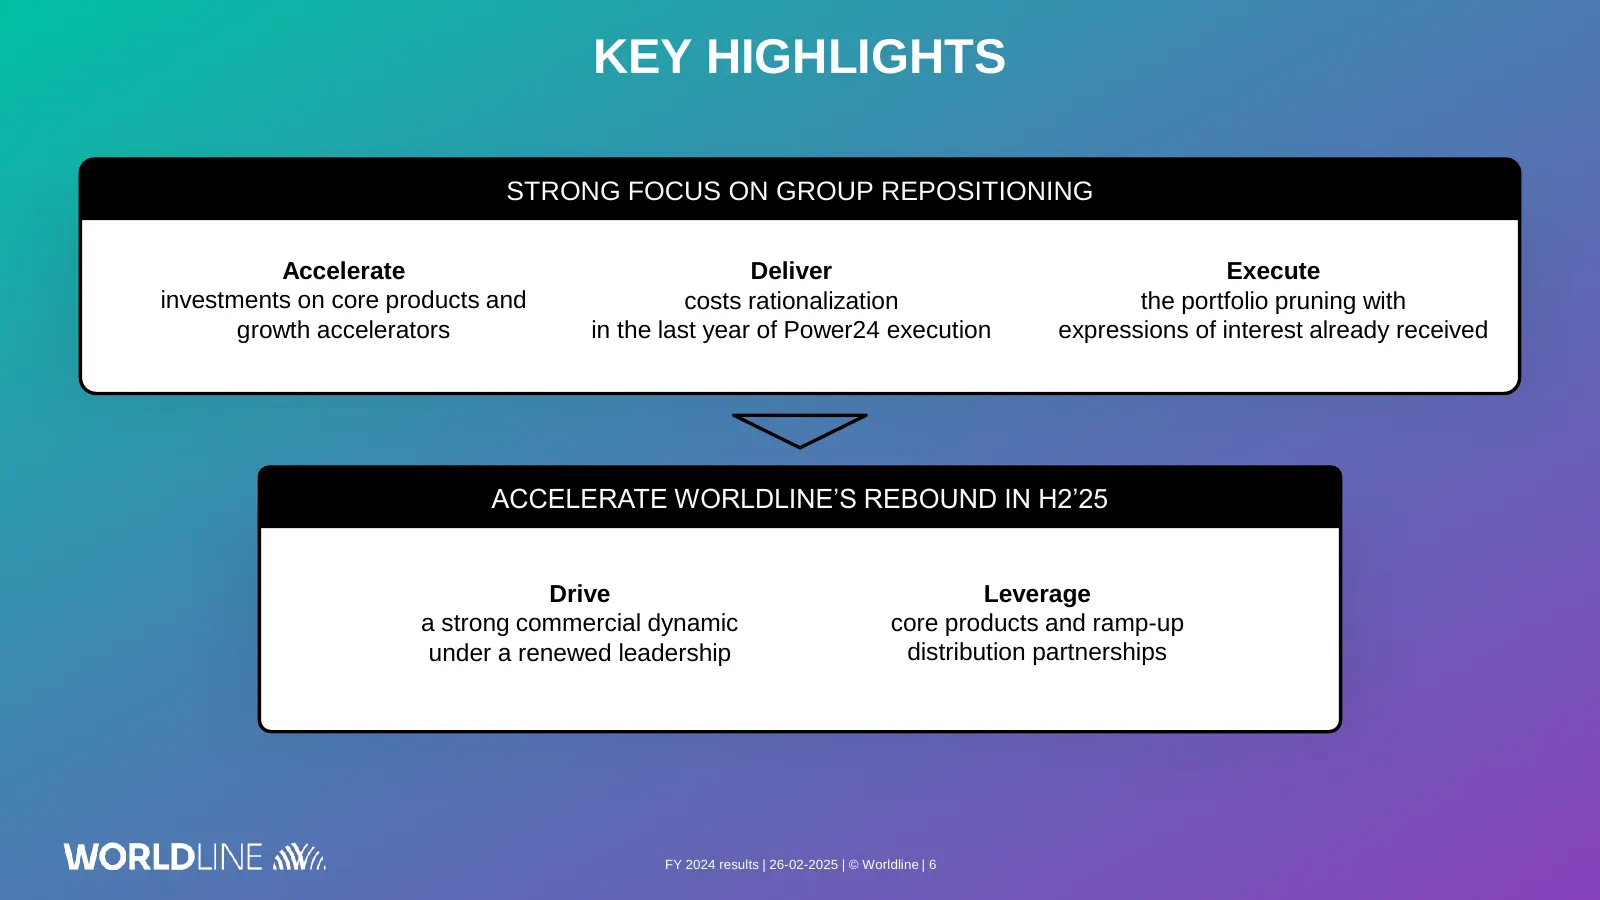
KEY HIGHLIGHTS STRONG FOCUS ON GROUP REPOSITIONING Accelerate Deliver Execute investments on core products and costs rationalization the portfolio pruning with growth accelerators in the last year of Power24 execution expressions of interest already received ACCELERATE WORLDLINE’S REBOUND IN H2’25 D
Slide 7: FY 2024 guidance achieved in a challenging H2'24 context
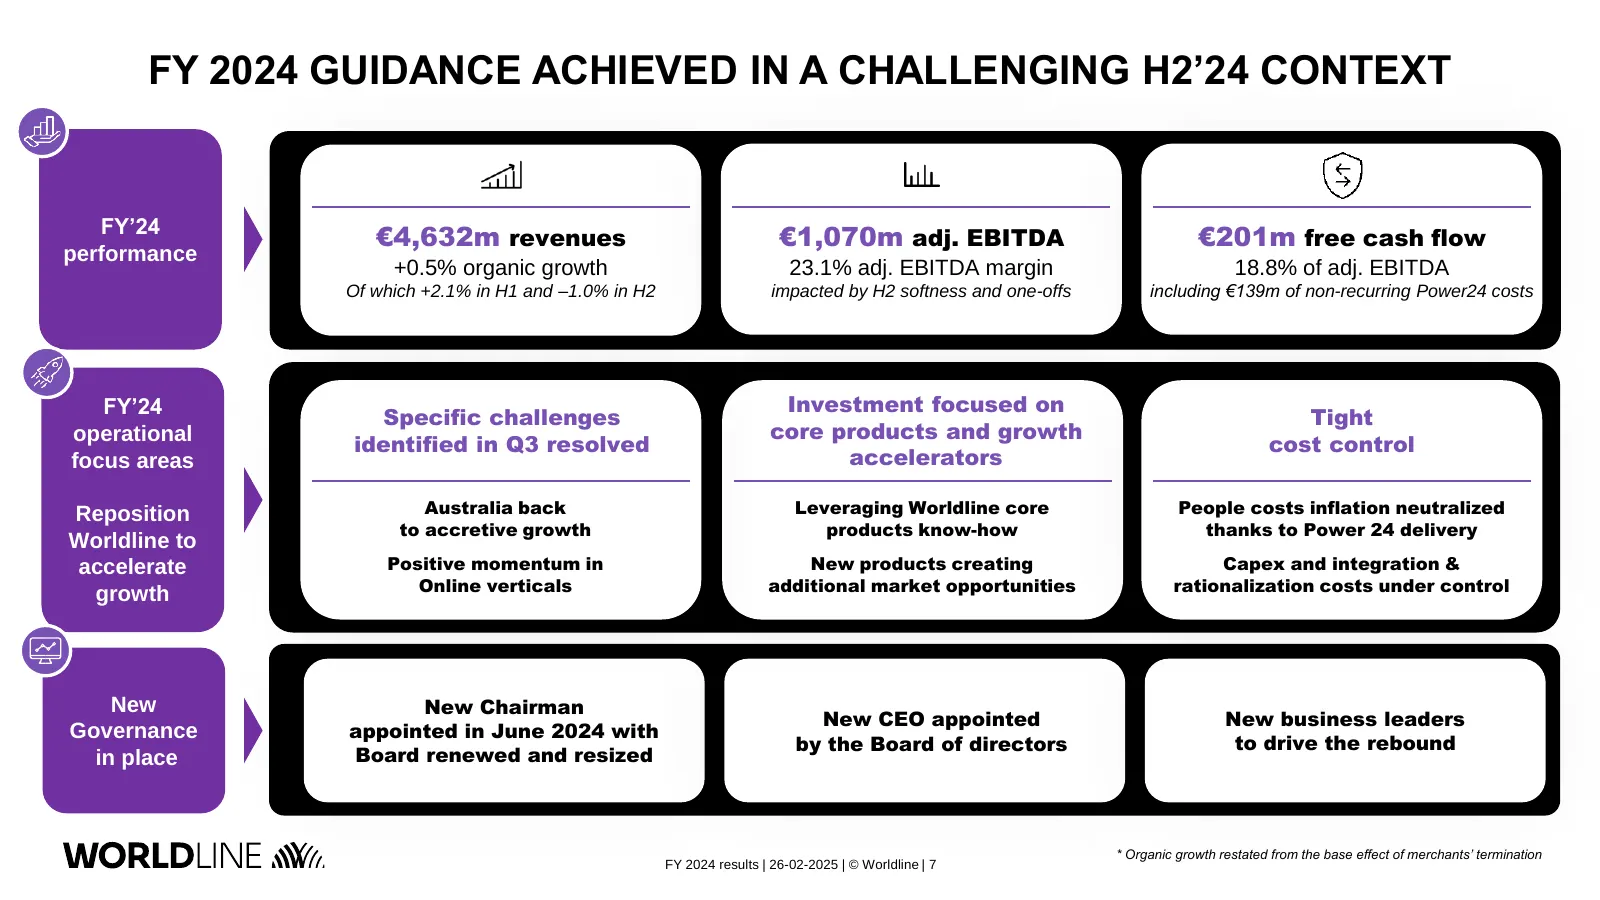
FY 2024 GUIDANCE ACHIEVED IN A CHALLENGING H2’24 CONTEXT FY’24 €4,632m revenues €1,070m adj. EBITDA €201m free cash flow performance +0.5% organic growth 23.1% adj. EBITDA margin 18.8% of adj. EBITDA Of which +2.1% in H1 and –1.0% in H2 impacted by H2 softness and one-offs including €139m of non-rec
Slide 8: FY 2025 – A year of two halves
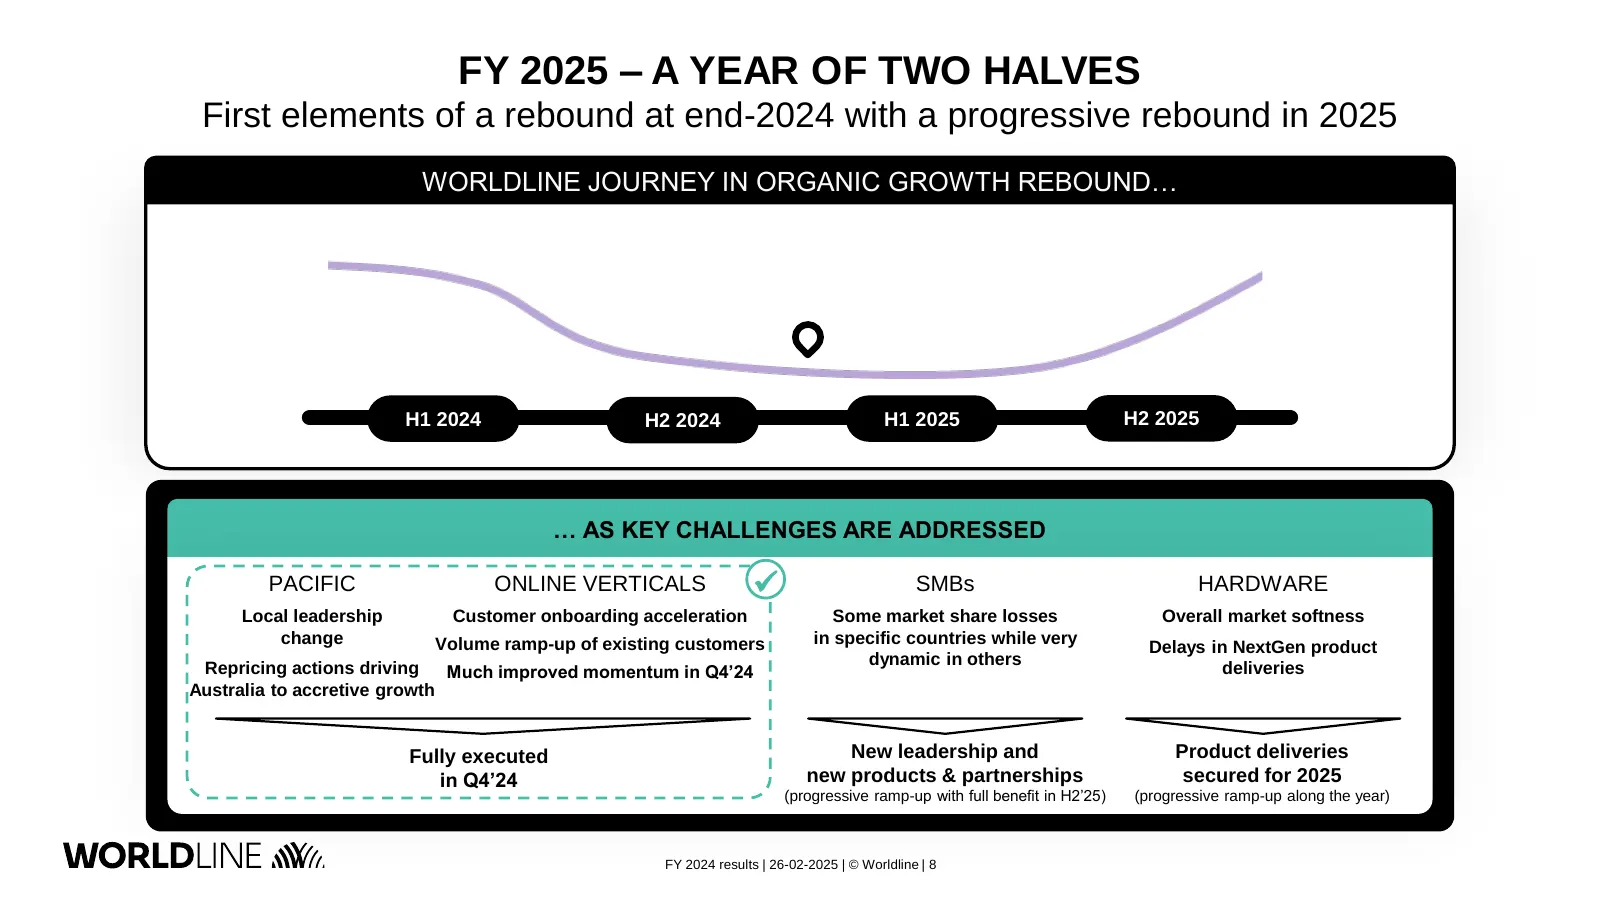
FY 2025 – A YEAR OF TWO HALVES First elements of a rebound at end-2024 with a progressive rebound in 2025 WORLDLINE JOURNEY IN ORGANIC GROWTH REBOUND… H1 2024 H2 2024 H1 2025 H2 2025 … AS KEY CHALLENGES ARE ADDRESSED PACIFIC ONLINE VERTICALS ✓ SMBs HARDWARE Local leadership Customer onboarding accel
Slide 9: Focus on Merchant Services
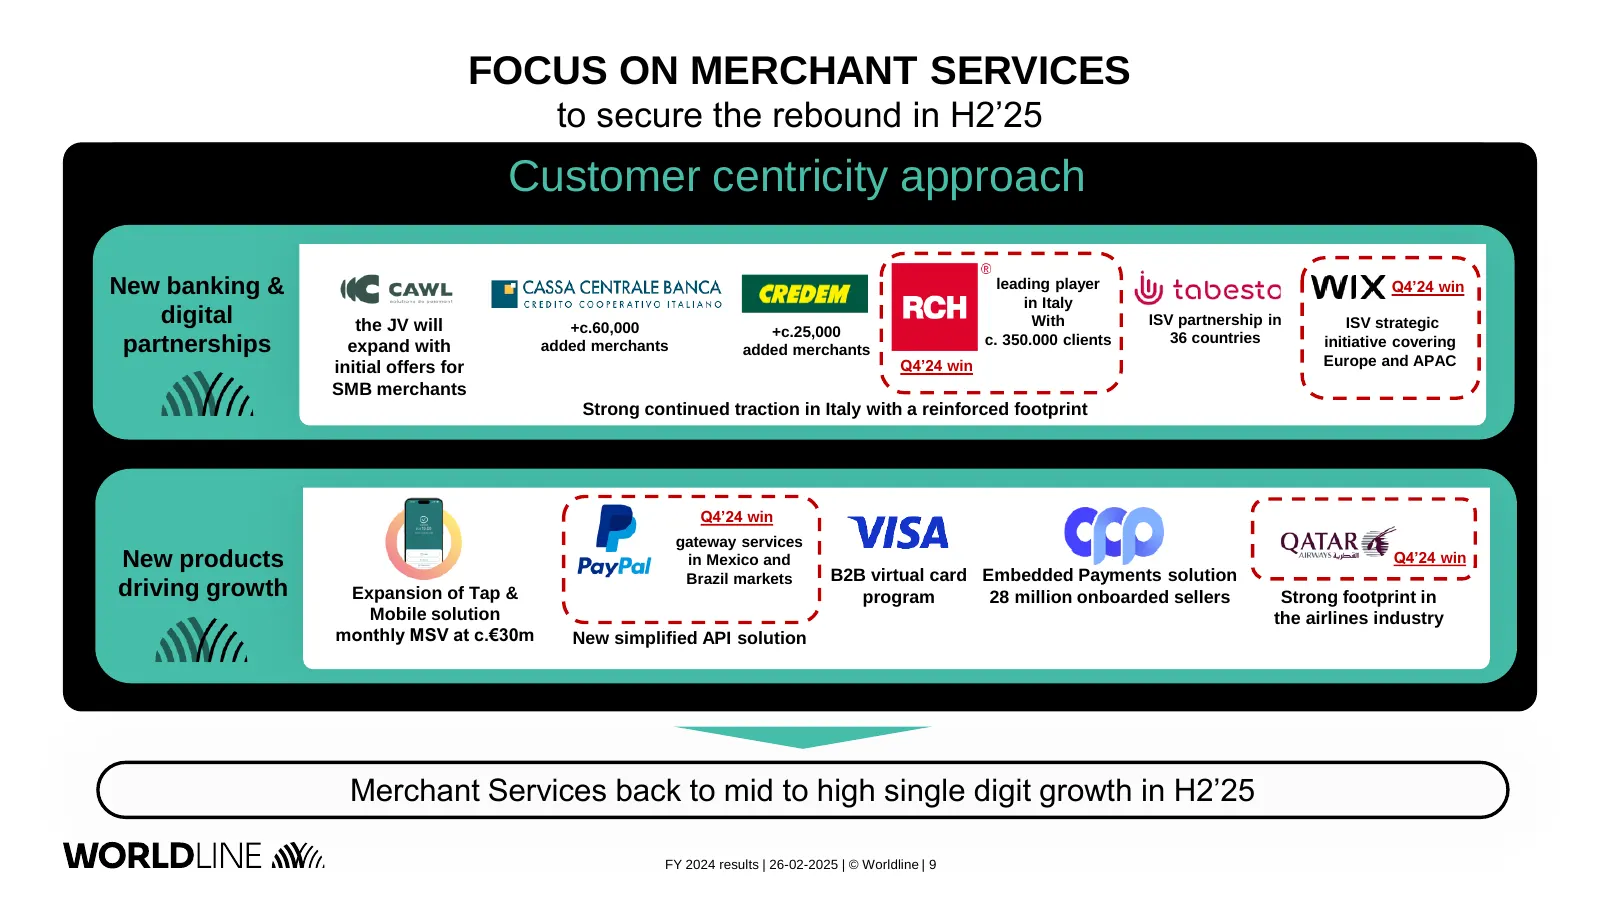
FOCUS ON MERCHANT SERVICES to secure the rebound in H2’25 Customer centricity approach New banking & leading player Q4’24 win in Italy digital the JV will +c.60,000 With ISV partnership in ISV strategic +c.25,000 36 countries partnerships expand with added merchants c. 350.000 clients initiative cov
Slide 10: Focus on Financial Services and Mobility & e-Transactional Services
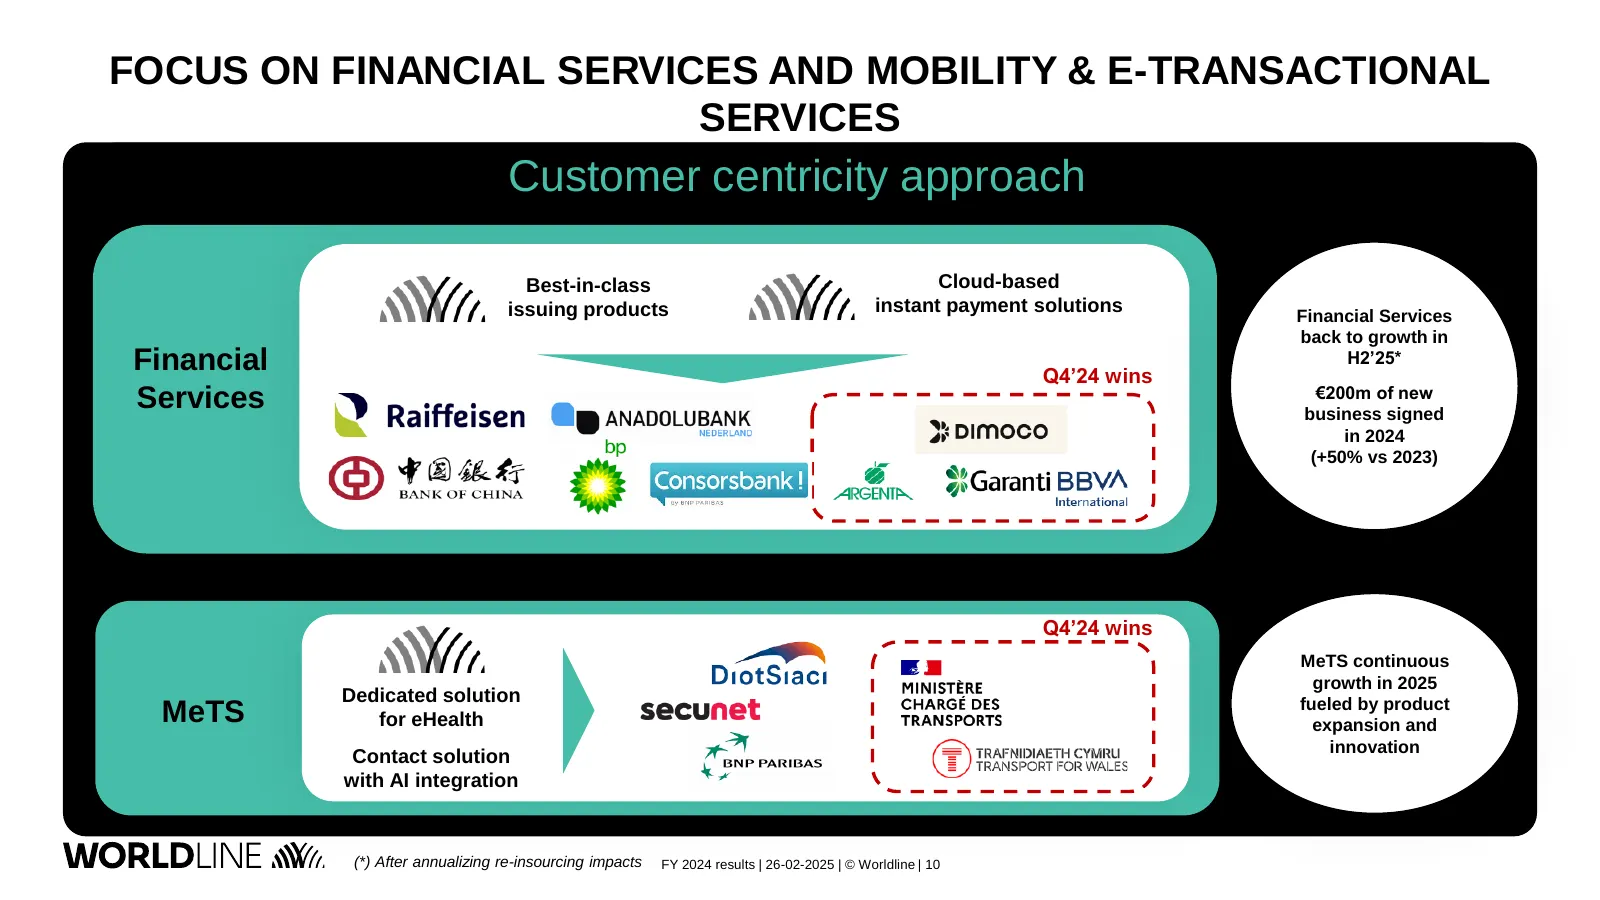
FOCUS ON FINANCIAL SERVICES AND MOBILITY & E-TRANSACTIONAL SERVICES Product Customer development centricity approach Best-in-class Cloud-based issuing products instant payment solutions Financial Services back to growth in Financial Q4’24 wins H2’25* Services €200m of new business signed in 2024 (+5
Slide 11: Strong management actions on costs
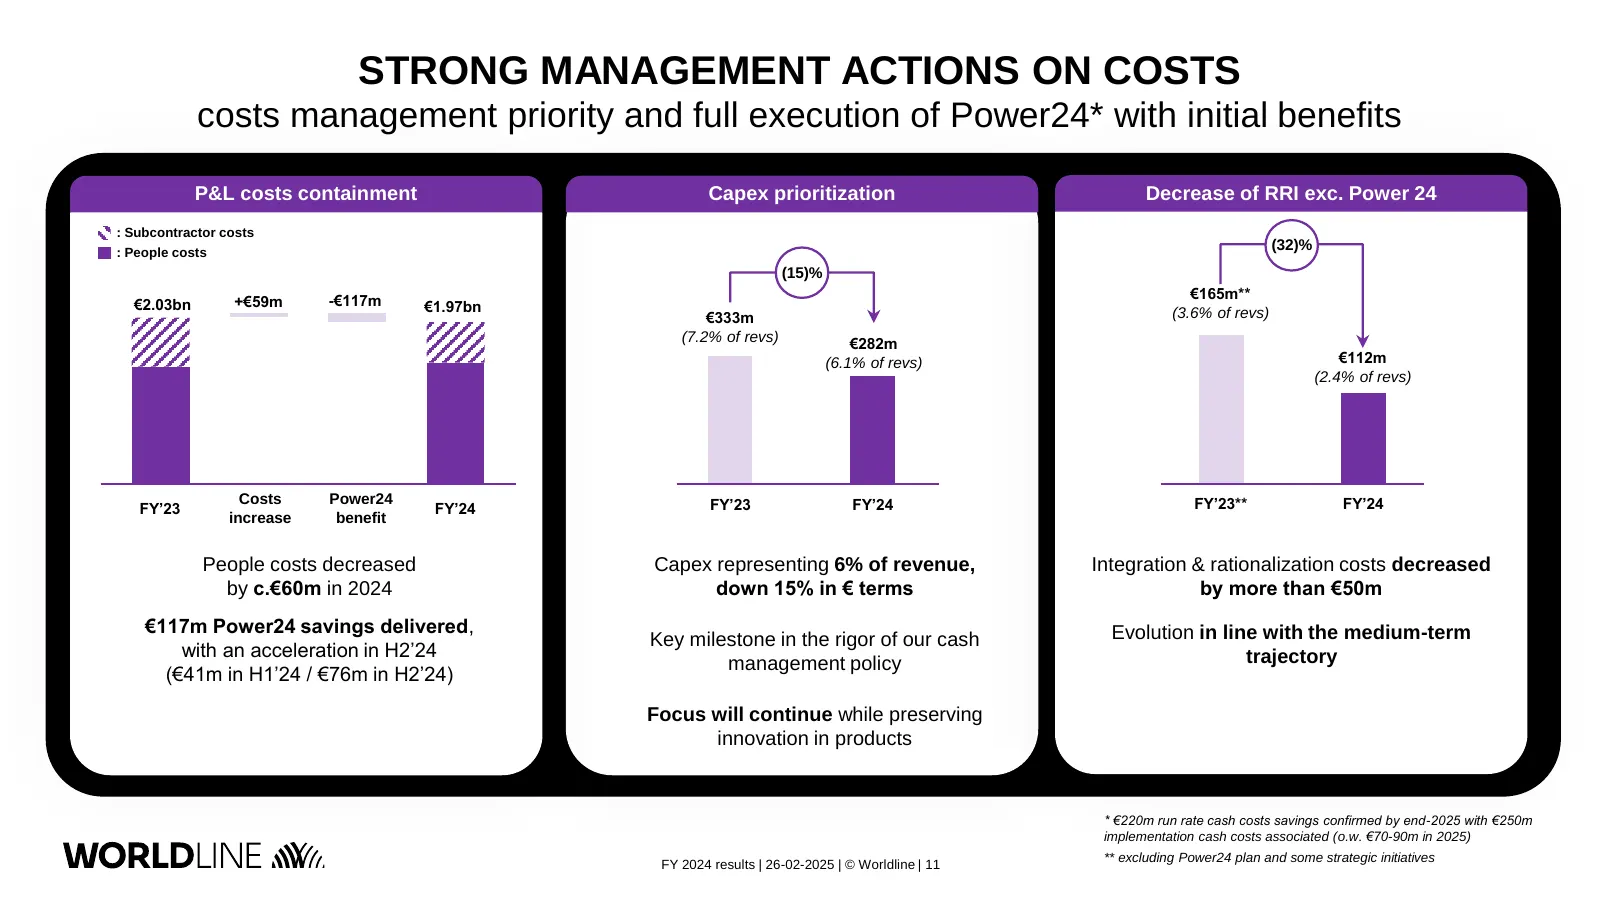
STRONG MANAGEMENT ACTIONS ON COSTS costs management priority and full execution of Power24* with initial benefits P&L costs containment Capex prioritization Decrease of RRI exc. Power 24 : Subcontractor costs : People costs (32)% (15)% +€59m -€117m €165m** €2.03bn €1.97bn €333m (3.6% of revs) (7.2%
Slide 12: FY 2025 Outlook
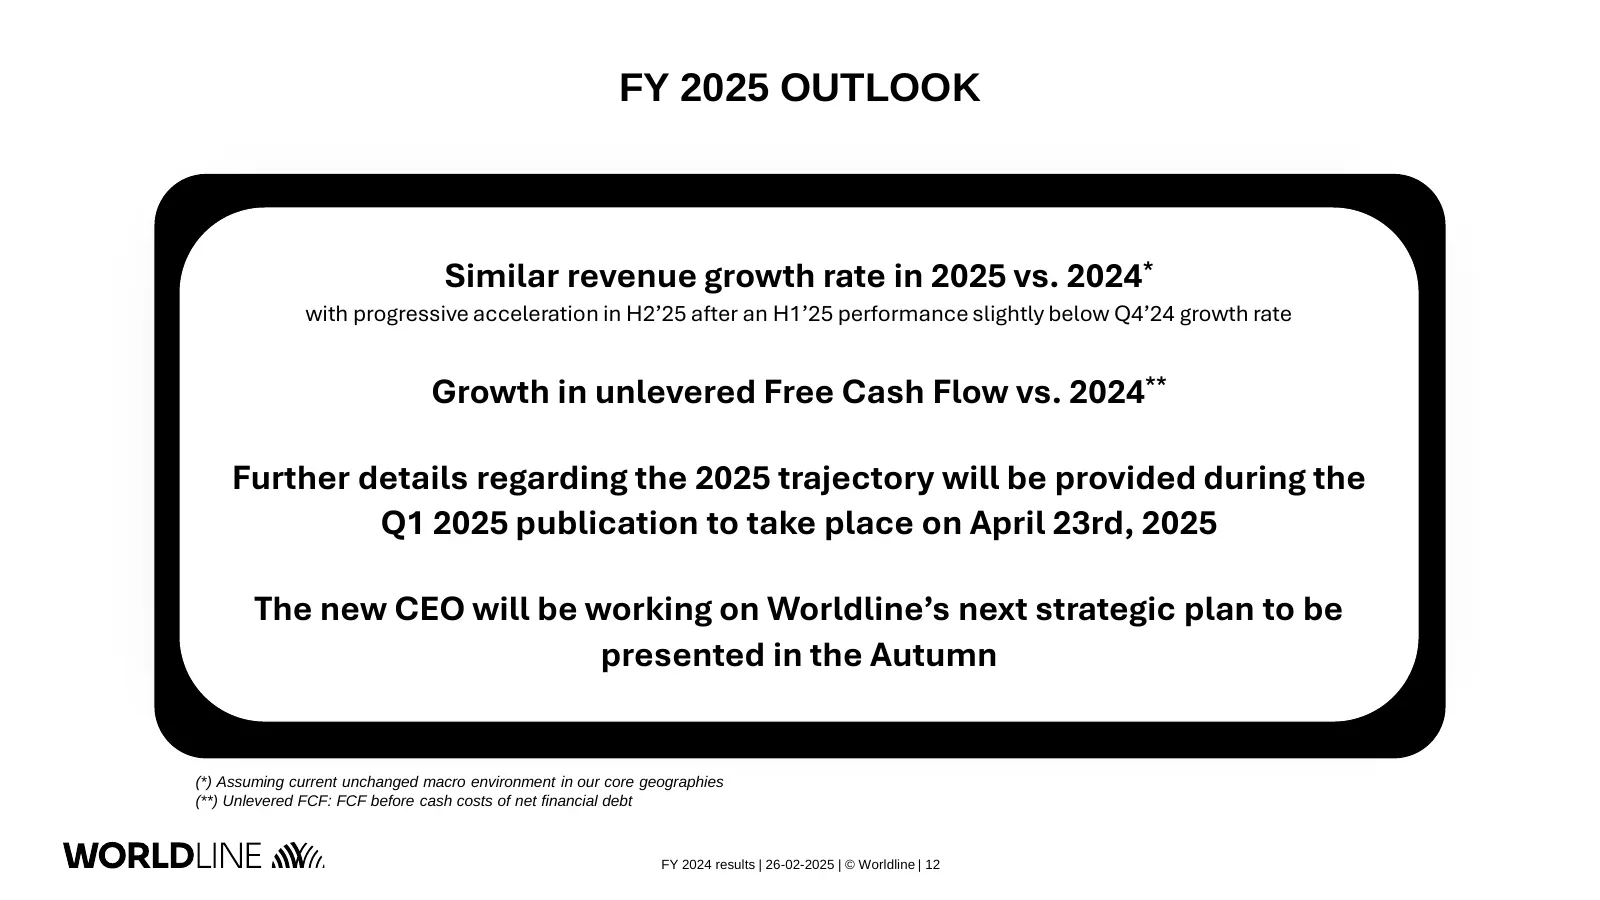
FY 2025 OUTLOOK Similar revenue growth rate in 2025 vs. 2024* with progressive acceleration in H2’25 after an H1’25 performance slightly below Q4’24 growth rate Growth in unlevered Free Cash Flow vs. 2024** Further details regarding the 2025 trajectory will be provided during the Q1 2025 publication

Slide 13: FY'24 Financial Performance
FY’24 FINANCIAL PERFORMANCE Grégory Lambertie Group CFO
Slide 14: FY 2024 Key Financial Highlights
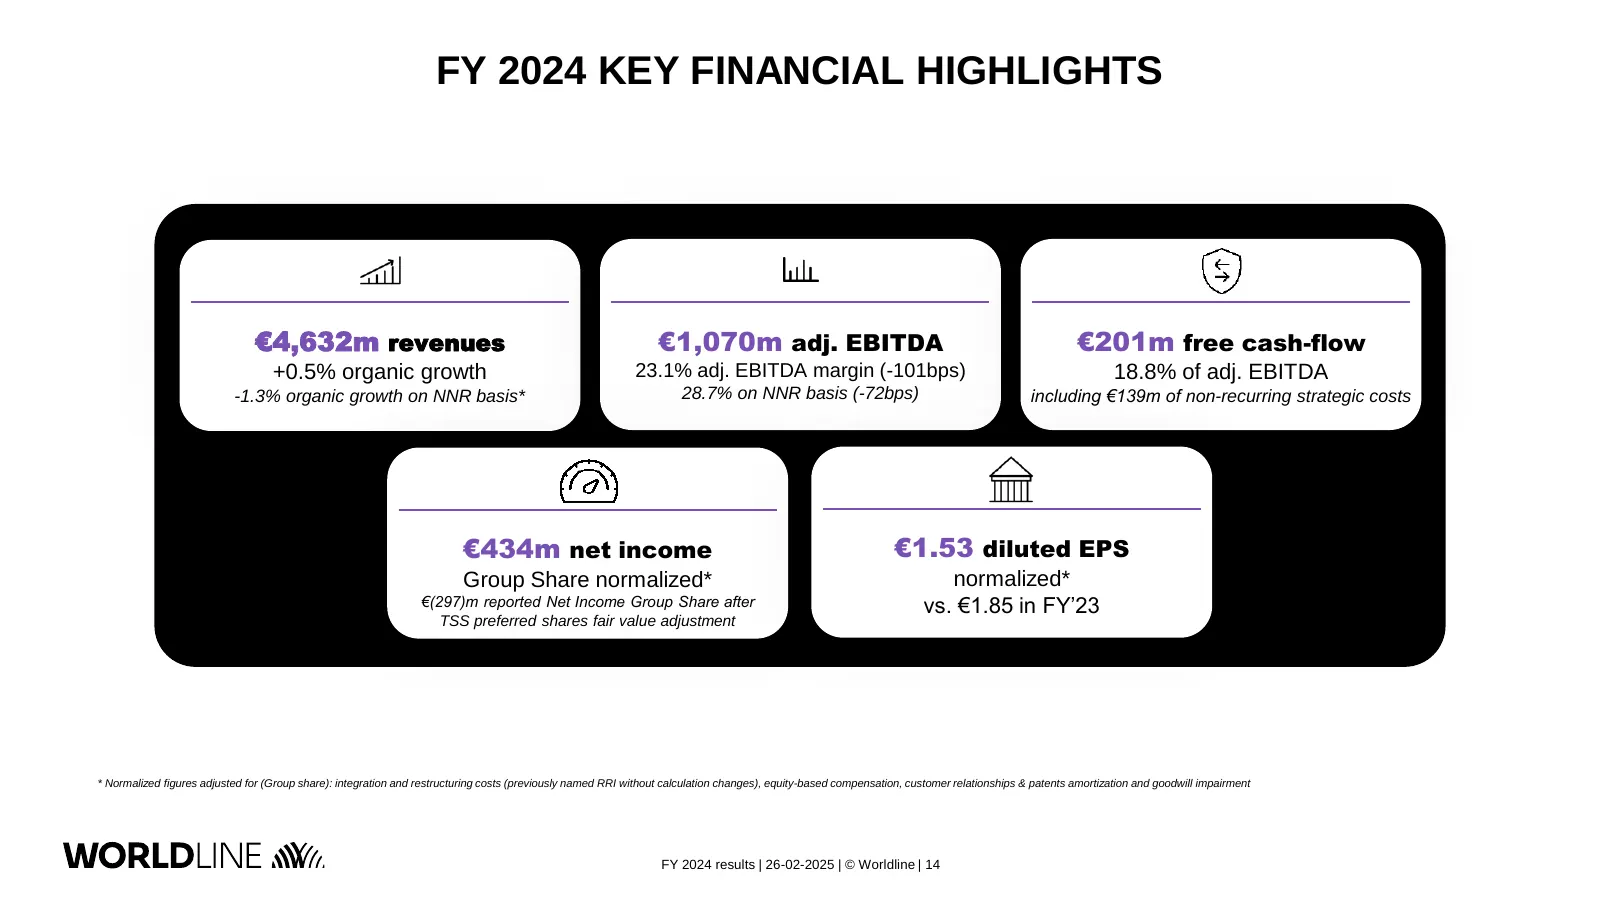
FY 2024 KEY FINANCIAL HIGHLIGHTS €4,632m revenues €1,070m adj. EBITDA €201m free cash-flow +0.5% organic growth 23.1% adj. EBITDA margin (-101bps) 18.8% of adj. EBITDA -1.3% organic growth on NNR basis* 28.7% on NNR basis (-72bps) including €139m of non-recurring strategic costs €434m net income €1.
Slide 15: FY 2024 Financial Performance: Revenue Overview
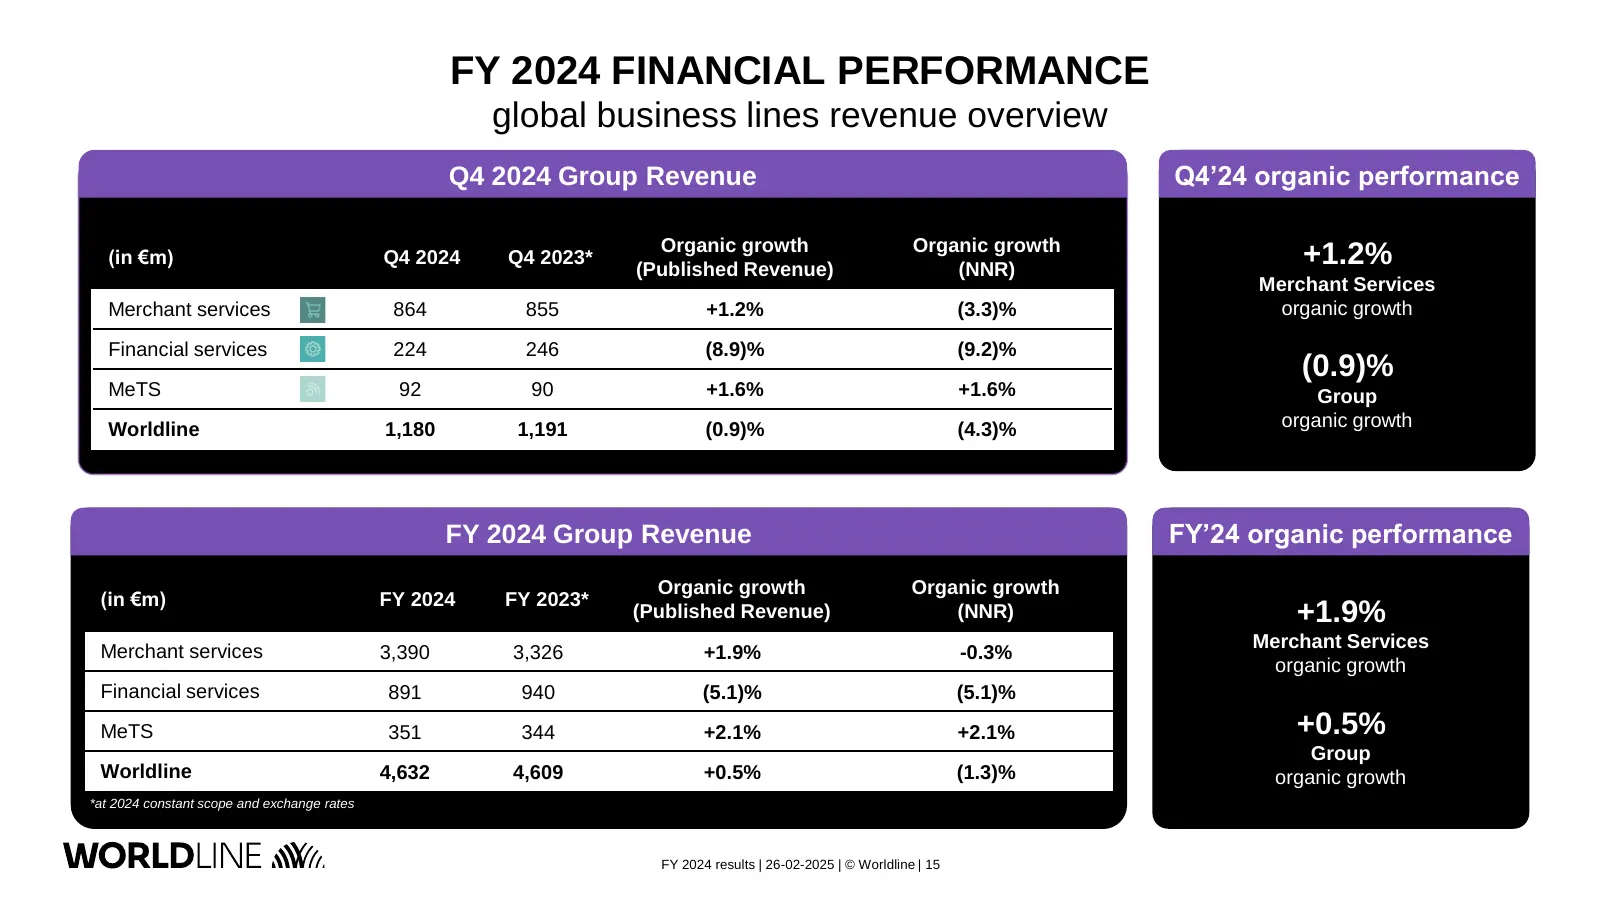
FY 2024 FINANCIAL PERFORMANCE global business lines revenue overview Q4 2024 Group Revenue Q4’24 organic performance Organic growth Organic growth (in €m) Q4 2024 Q4 2023* (Published Revenue) (NNR) +1.2% Merchant Services Merchant services 864 855 +1.2% (3.3)% organic growth Financial services 224 2
Slide 16: FY 2024 Revenue Building Blocks
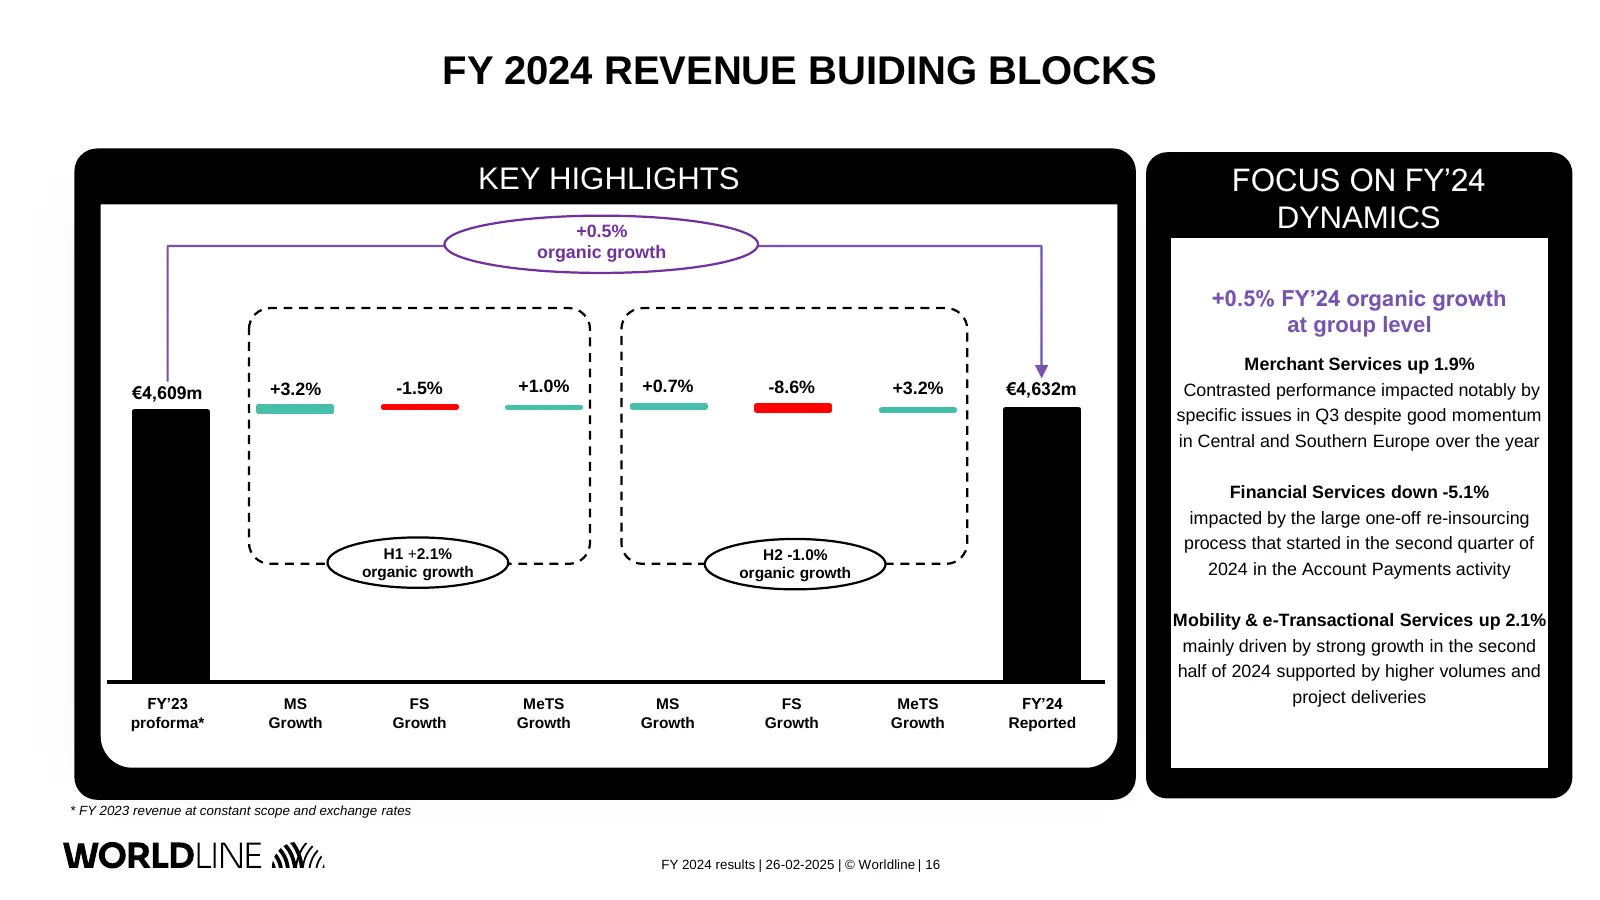
FY 2024 REVENUE BUIDING BLOCKS KEY HIGHLIGHTS FOCUS ON FY’24 +0.5% DYNAMICS organic growth +0.5% FY’24 organic growth at group level Merchant Services up 1.9% €4,609m +3.2% -1.5% +1.0% +0.7% -8.6% +3.2% €4,632m Contrasted performance impacted notably by specific issues in Q3 despite good momentum in
Slide 17: FY 2024 Financial Performance: Adjusted EBITDA Overview
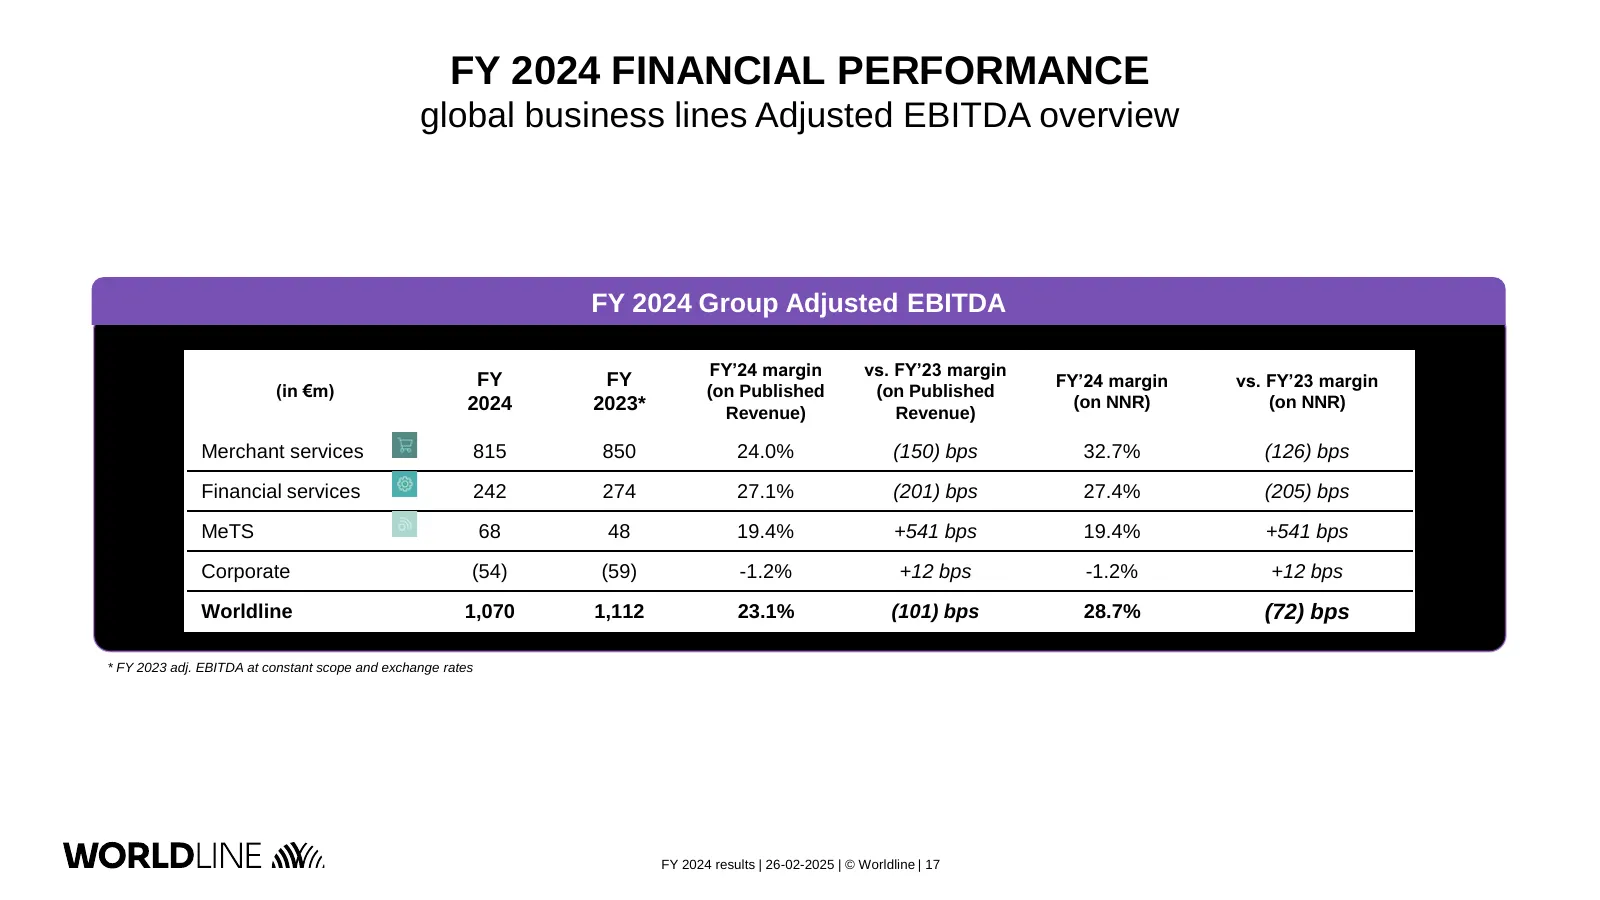
FY 2024 FINANCIAL PERFORMANCE global business lines Adjusted EBITDA overview FY 2024 Group Adjusted EBITDA FY’24 margin vs. FY’23 margin FY FY FY’24 margin vs. FY’23 margin (in €m) (on Published (on Published 2024 2023* (on NNR) (on NNR) Revenue) Revenue) Merchant services 815 850 24.0% (150) bps 32
Slide 18: FY 2024 Adjusted EBITDA Building Blocks
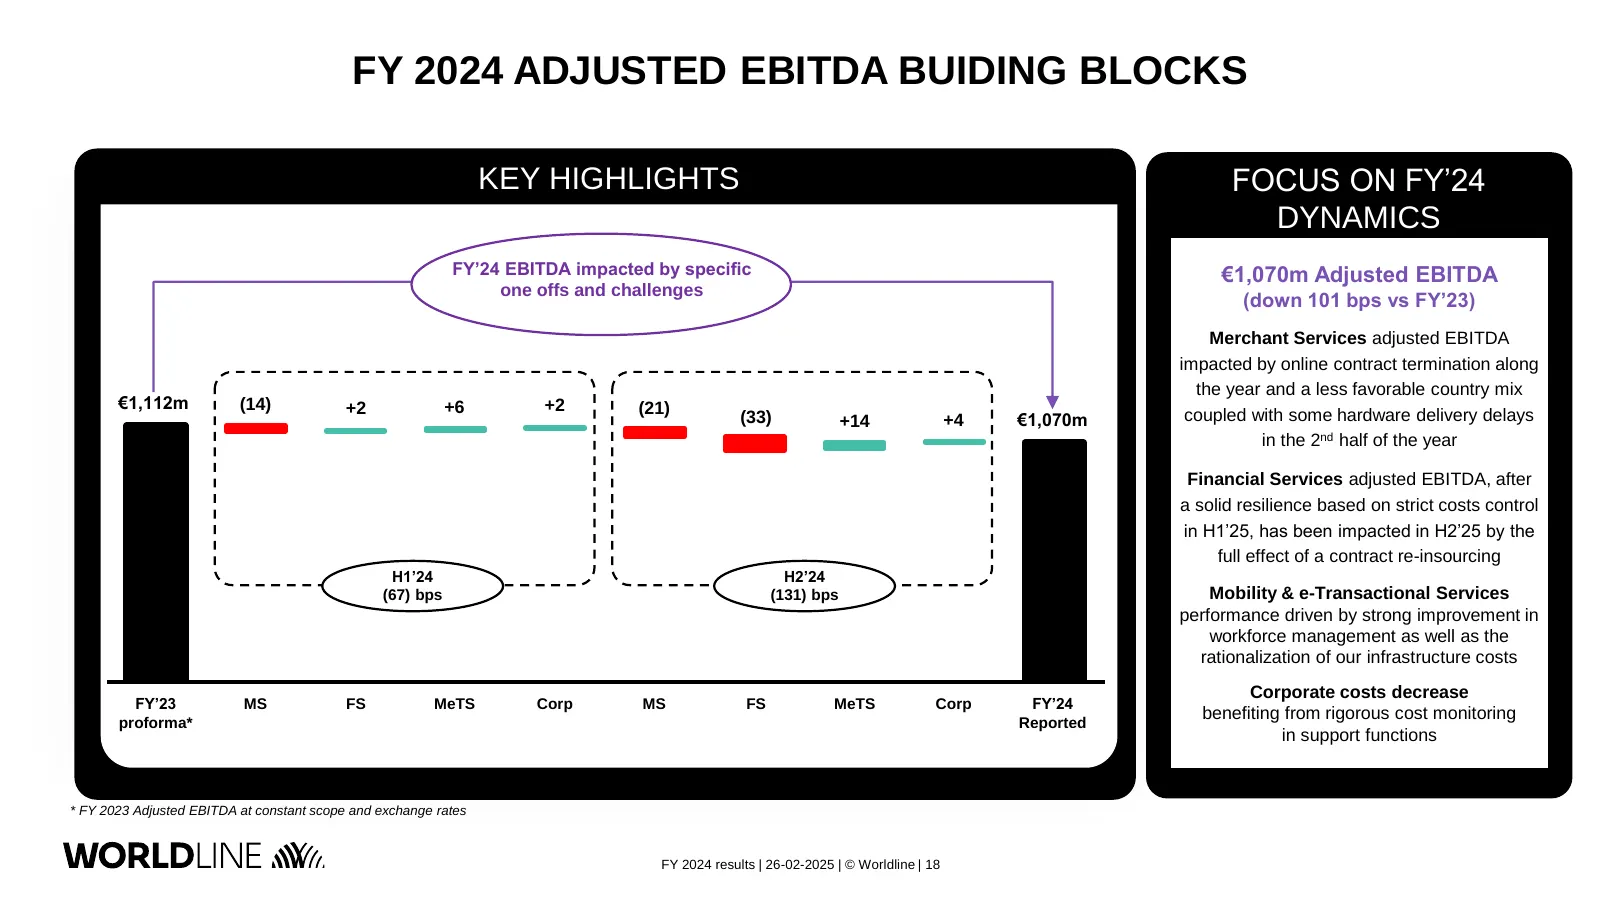
FY 2024 ADJUSTED EBITDA BUIDING BLOCKS KEY HIGHLIGHTS FOCUS ON FY’24 DYNAMICS FY’24 EBITDA impacted by specific €1,070m Adjusted EBITDA one offs and challenges (down 101 bps vs FY’23) Merchant Services adjusted EBITDA impacted by online contract termination along the year and a less favorable countr
Slide 19: Income Statement
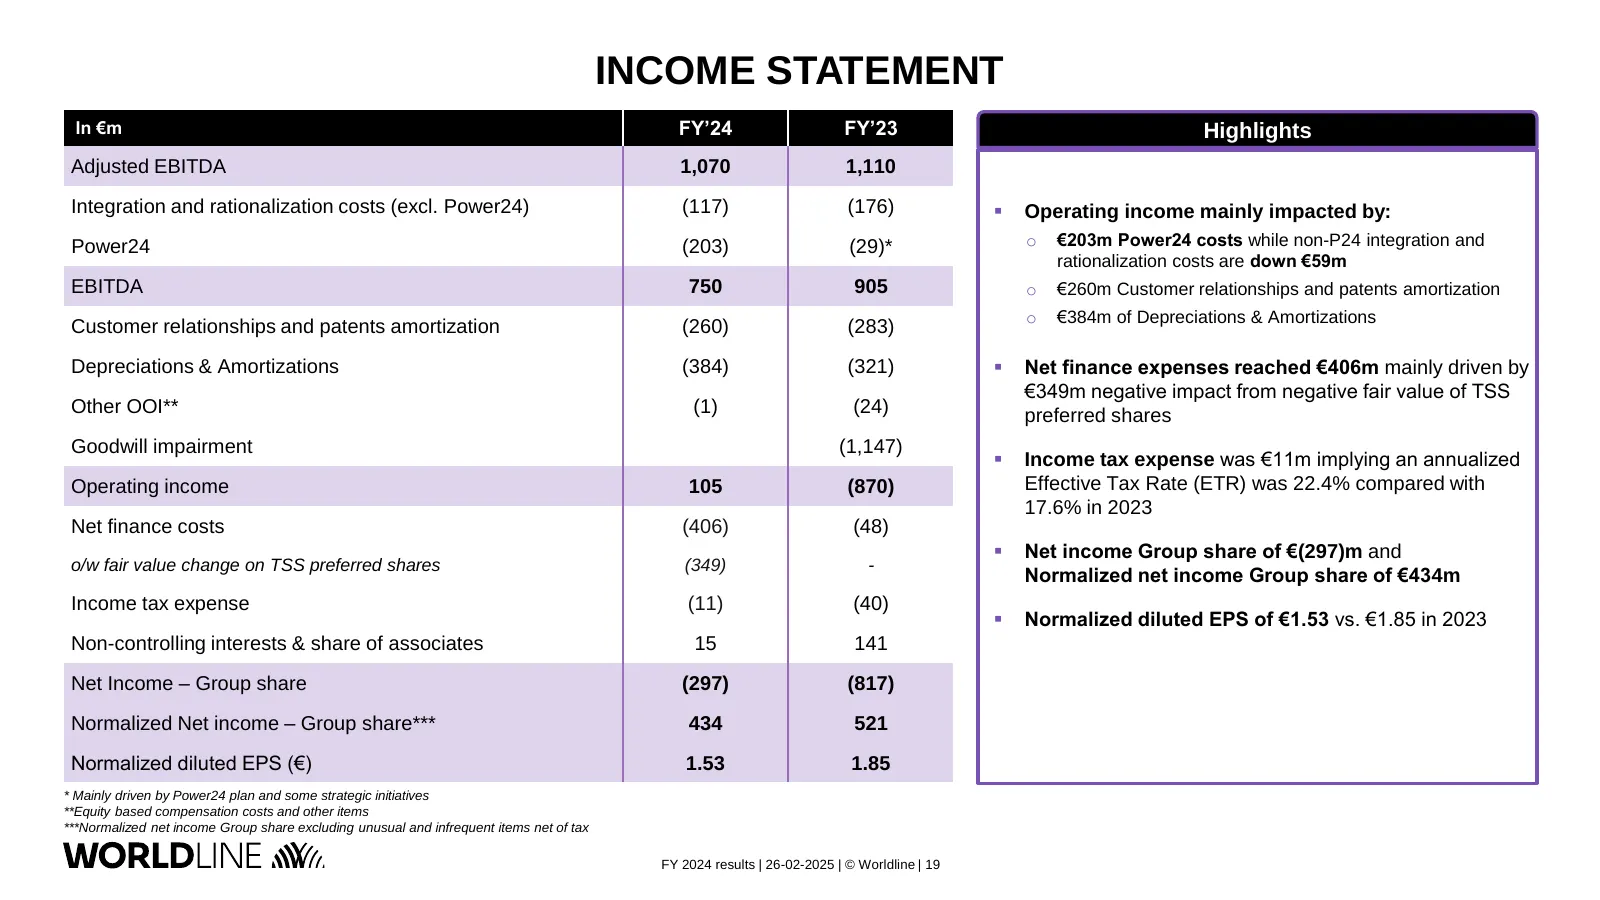
INCOME STATEMENT In €m FY’24 FY’23 Highlights Adjusted EBITDA 1,070 1,110 Integration and rationalization costs (excl. Power24) (117) (176) ▪ Operating income mainly impacted by: Power24 (203) (29)* o €203m Power24 costs while non-P24 integration and rationalization costs are down €59m EBITDA 750 90
Slide 20: Free Cash Flow
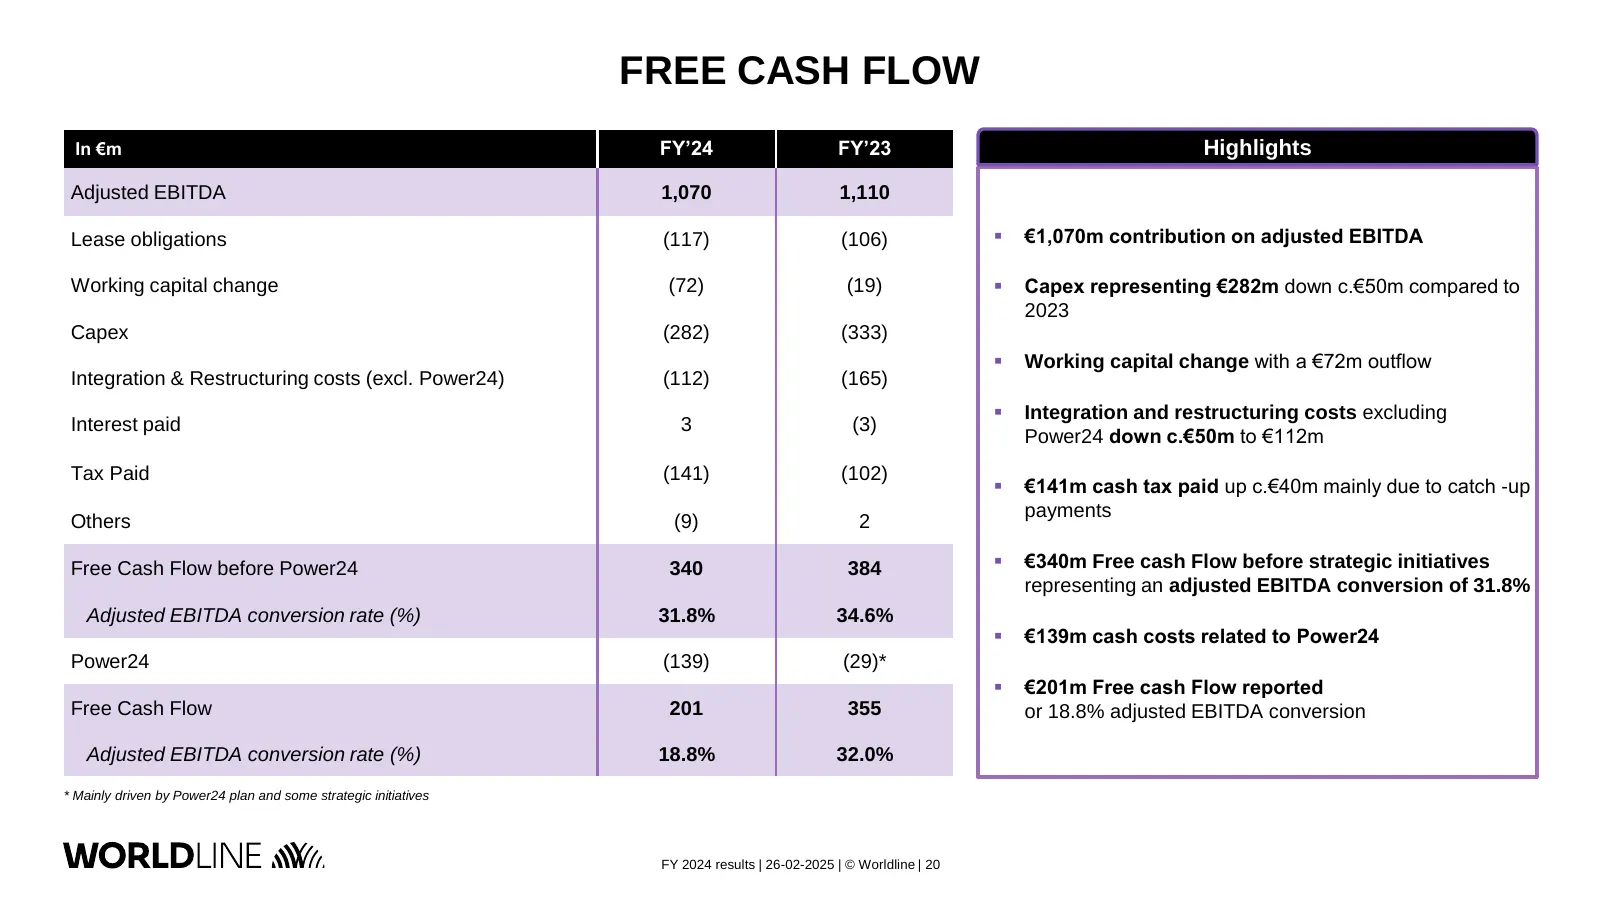
FREE CASH FLOW In €m FY’24 FY’23 Highlights Adjusted EBITDA 1,070 1,110 Lease obligations (117) (106) ▪ €1,070m contribution on adjusted EBITDA Working capital change (72) (19) ▪ Capex representing €282m down c.€50m compared to 2023 Capex (282) (333) ▪ Working capital change with a €72m outflow Inte
Slide 21: Net Debt Evolution
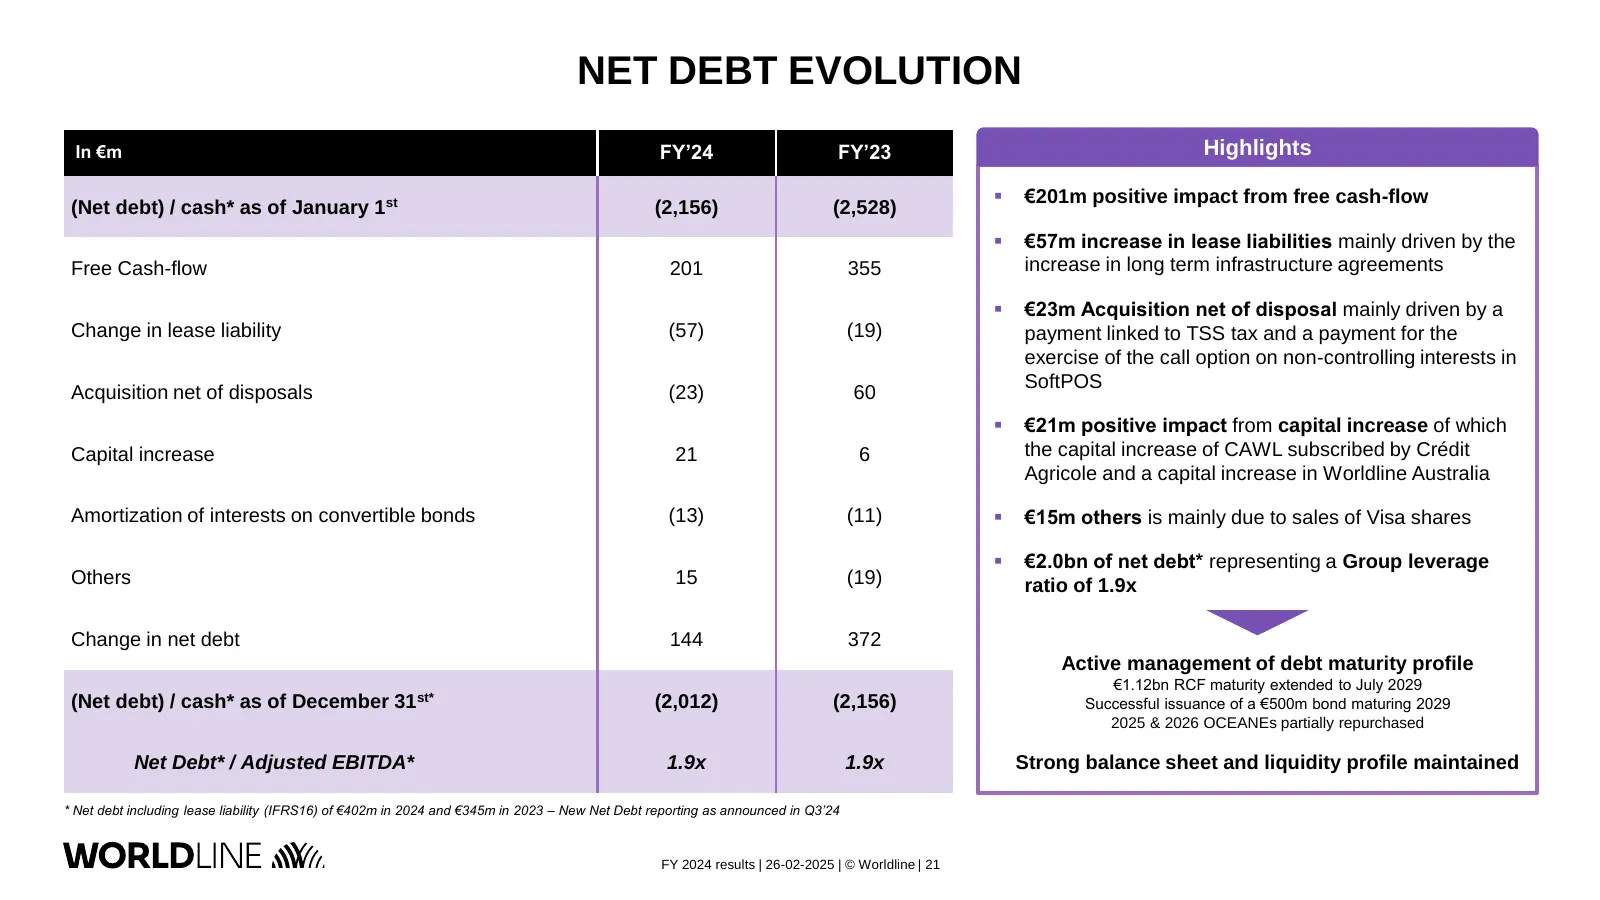
NET DEBT EVOLUTION In €m FY’24 FY’23 Highlights ▪ €201m positive impact from free cash-flow (Net debt) / cash* as of January 1st (2,156) (2,528) ▪ €57m increase in lease liabilities mainly driven by the Free Cash-flow 201 355 increase in long term infrastructure agreements ▪ €23m Acquisition net of

Slide 22: Key Take-aways
KEY TAKE-AWAYS Grégory Lambertie Group CFO
Slide 23: Key Take-aways
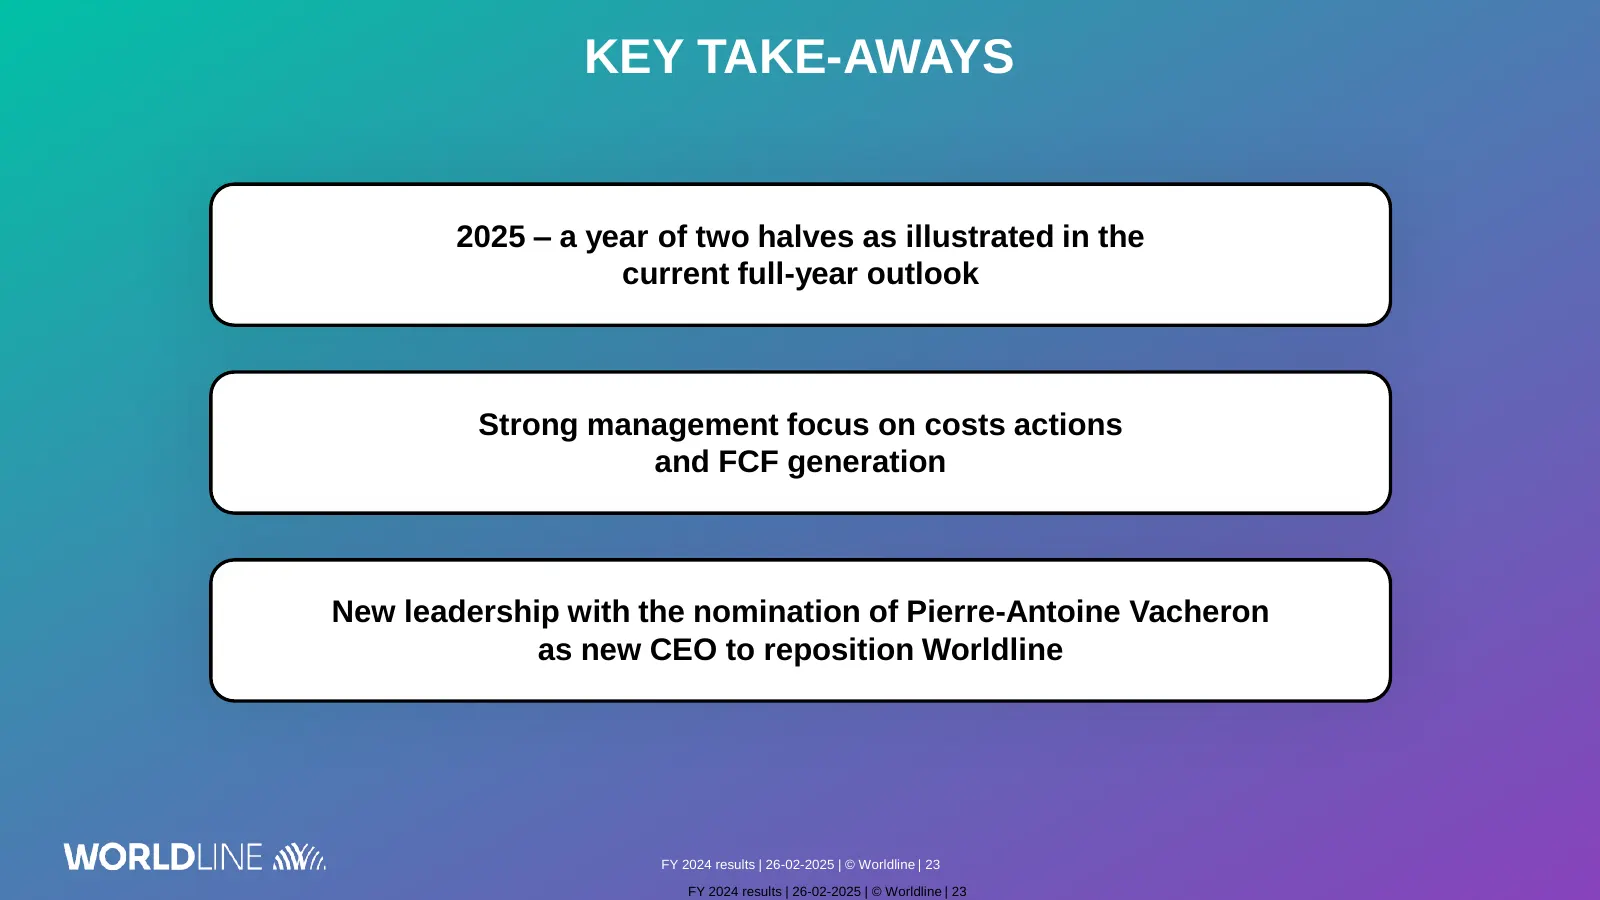
KEY TAKE-AWAYS 2025 – a year of two halves as illustrated in the current full-year outlook Strong management focus on costs actions and FCF generation New leadership with the nomination of Pierre-Antoine Vacheron as new CEO to reposition Worldline FY 2024 results | 26-02-2025 | © Worldline | 23 FY 2

Slide 24: Q&A
Q&A WORLDLINE sW/.

Slide 25: Appendices
Appendices WORLDLINE We,
Slide 26: Merchant Services: Q4 & FY 2024 highlights
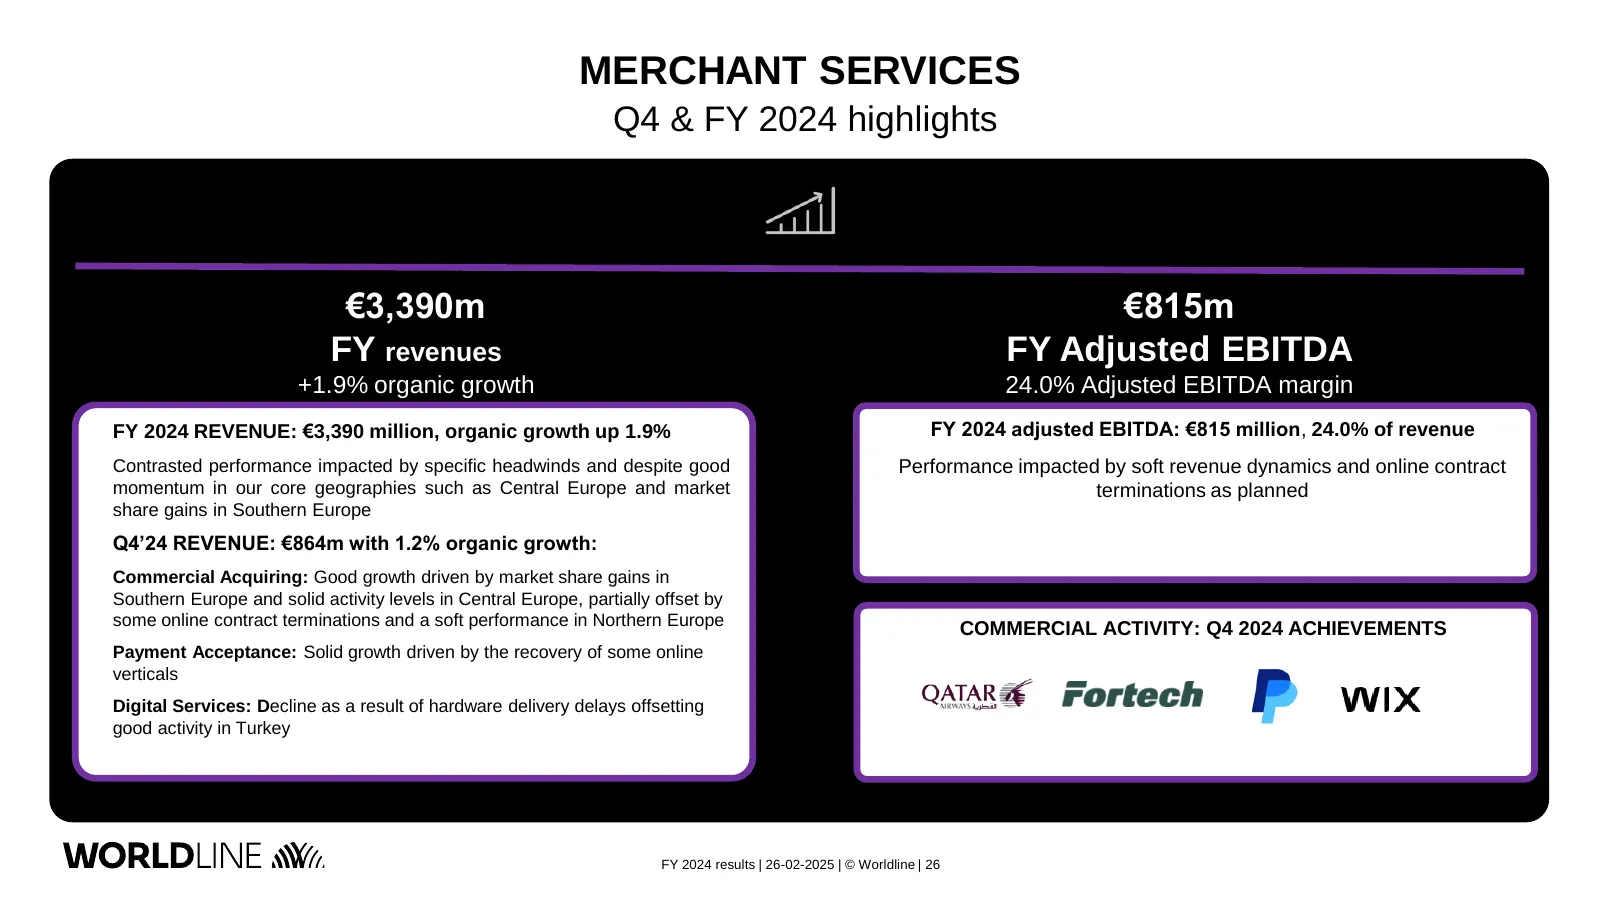
MERCHANT SERVICES Q4 & FY 2024 highlights €3,390m €815m FY revenues FY Adjusted EBITDA +1.9% organic growth 24.0% Adjusted EBITDA margin FY 2024 REVENUE: €3,390 million, organic growth up 1.9% FY 2024 adjusted EBITDA: €815 million, 24.0% of revenue Contrasted performance impacted by specific headwin
Slide 27: Financial Services: Q4 & FY 2024 highlights
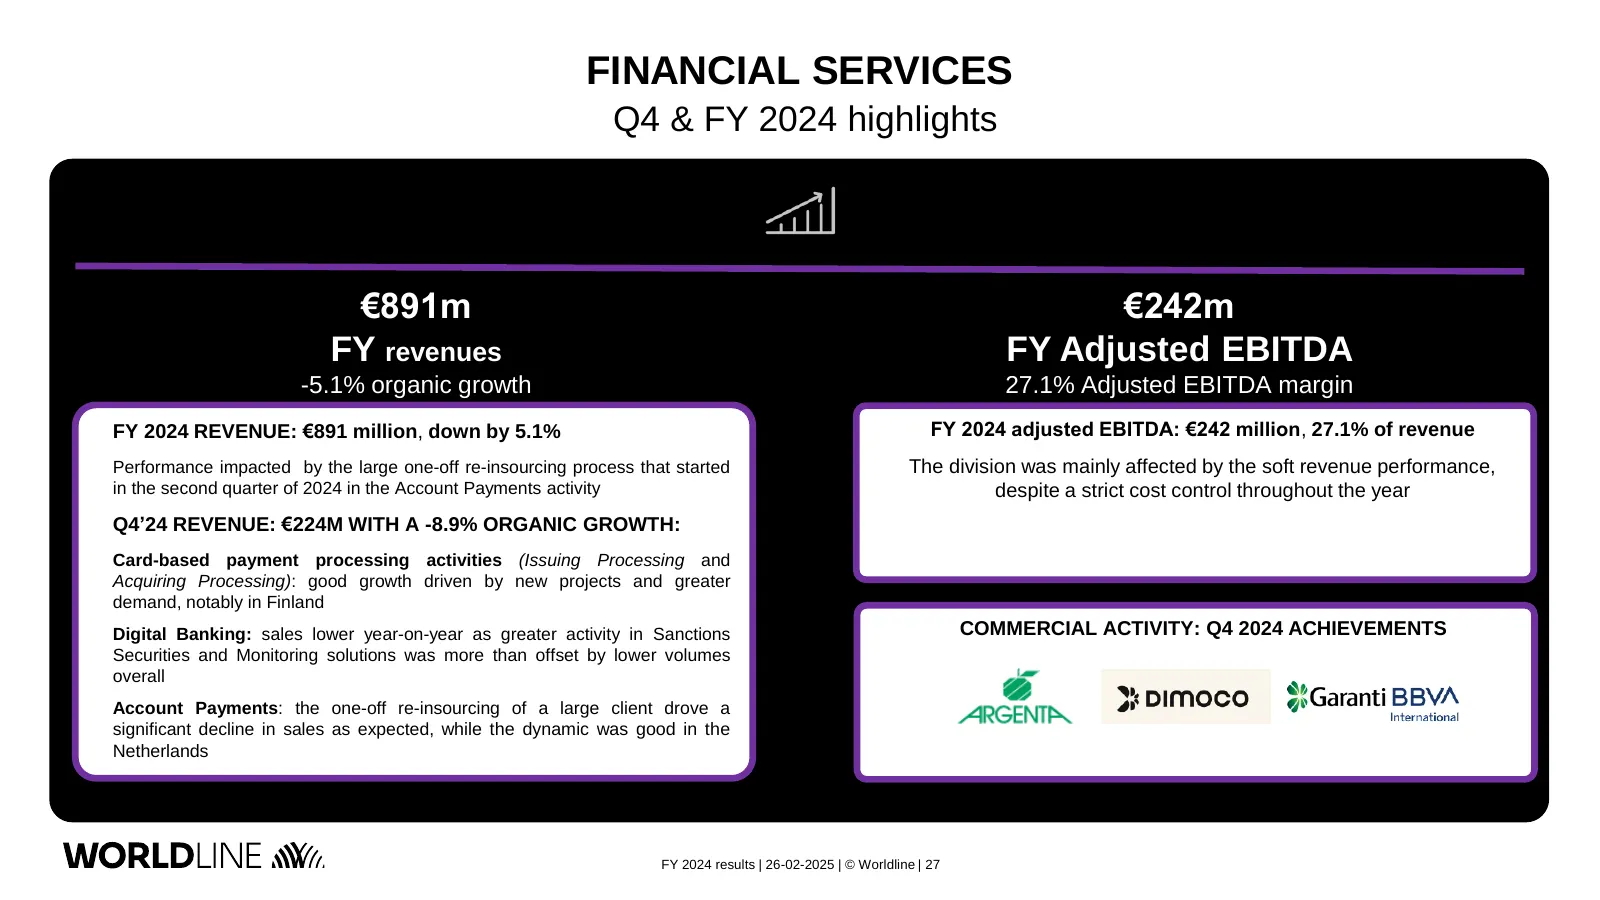
FINANCIAL SERVICES Q4 & FY 2024 highlights €891m €242m FY revenues FY Adjusted EBITDA -5.1% organic growth 27.1% Adjusted EBITDA margin FY 2024 REVENUE: €891 million, down by 5.1% FY 2024 adjusted EBITDA: €242 million, 27.1% of revenue Performance impacted by the large one-off re-insourcing process
Slide 28: Mobility & e-Transactional Services: Q4 & FY 2024 highlights
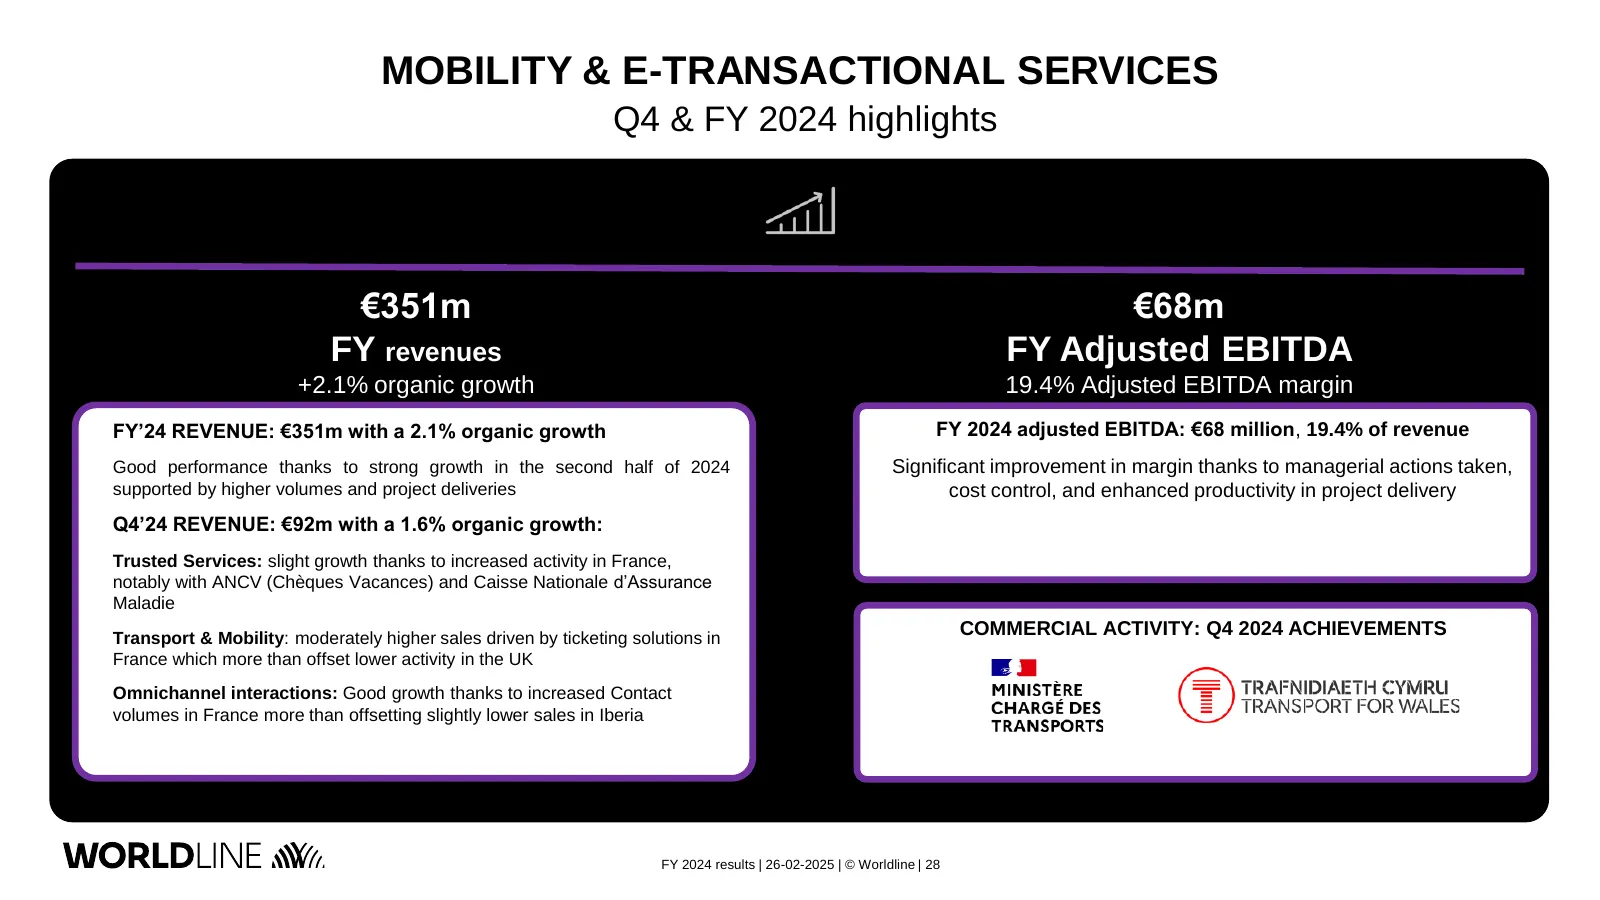
MOBILITY & E-TRANSACTIONAL SERVICES Q4 & FY 2024 highlights €351m €68m FY revenues FY Adjusted EBITDA +2.1% organic growth 19.4% Adjusted EBITDA margin FY’24 REVENUE: €351m with a 2.1% organic growth FY 2024 adjusted EBITDA: €68 million, 19.4% of revenue Good performance thanks to strong growth in t
Slide 29: Acquiring MSV (€m)
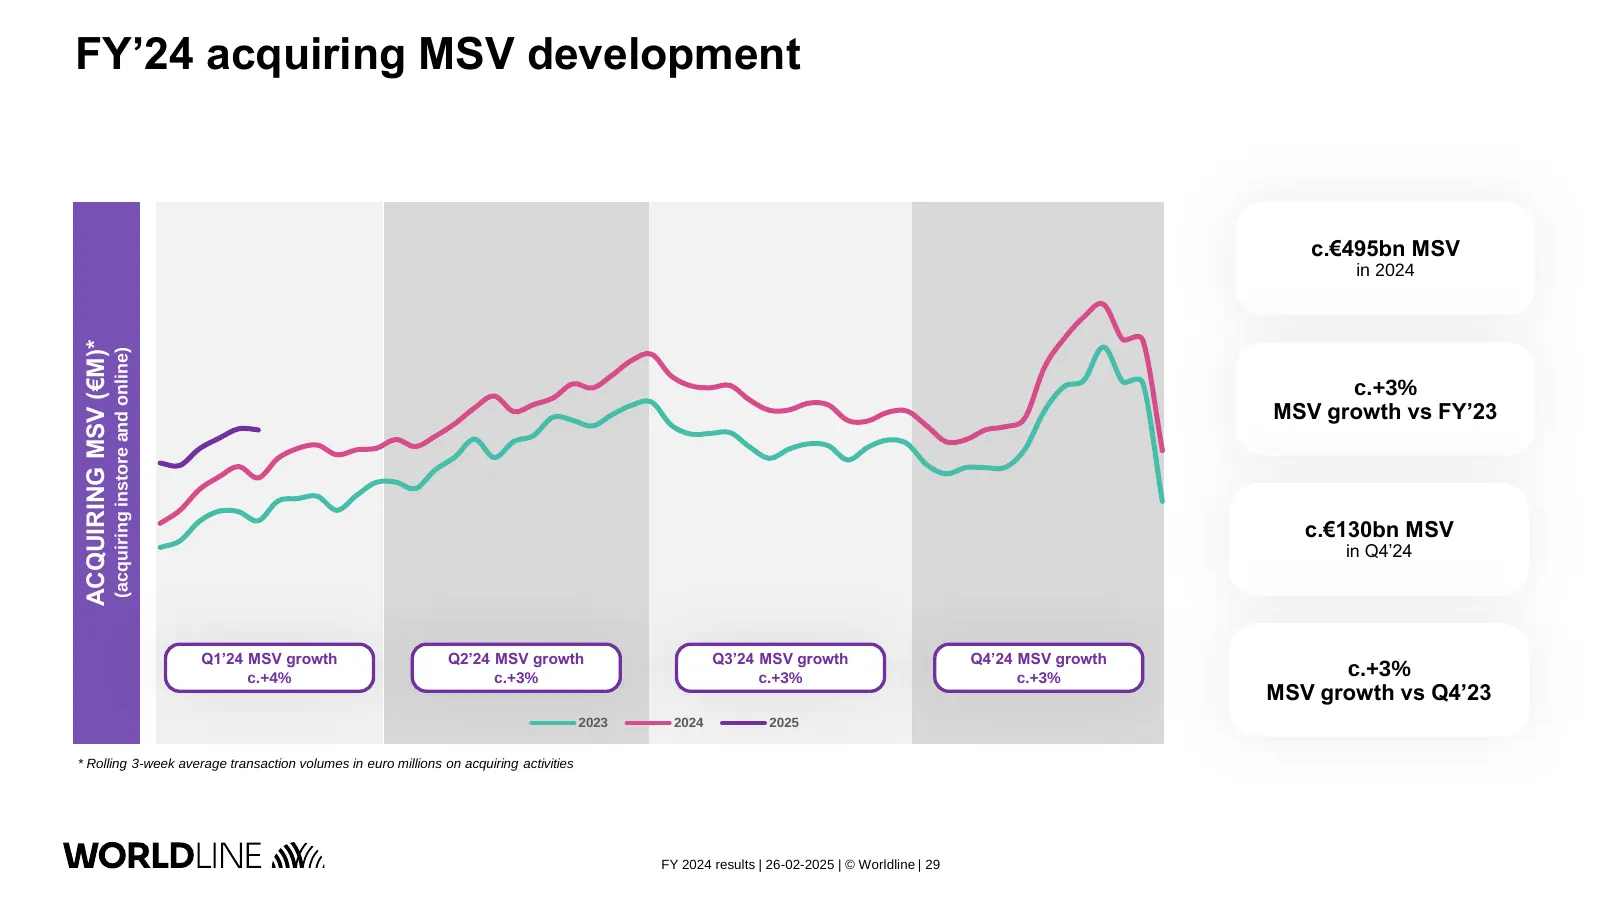
FY’24 acquiring MSV development c.€495bn MSV in 2024 ACQUIRING MSV (€M)* (acquiring instore and online) c.+3% MSV growth vs FY’23 c.€130bn MSV in Q4’24 Q1’24 MSV growth Q2’24 MSV growth Q3’24 MSV growth Q4’24 MSV growth c.+4% c.+3% c.+3% c.+3% c.+3% MSV growth vs Q4’23 2023 2024 2025 * Rolling 3-wee
Slide 30: MS acquiring merchants' base development
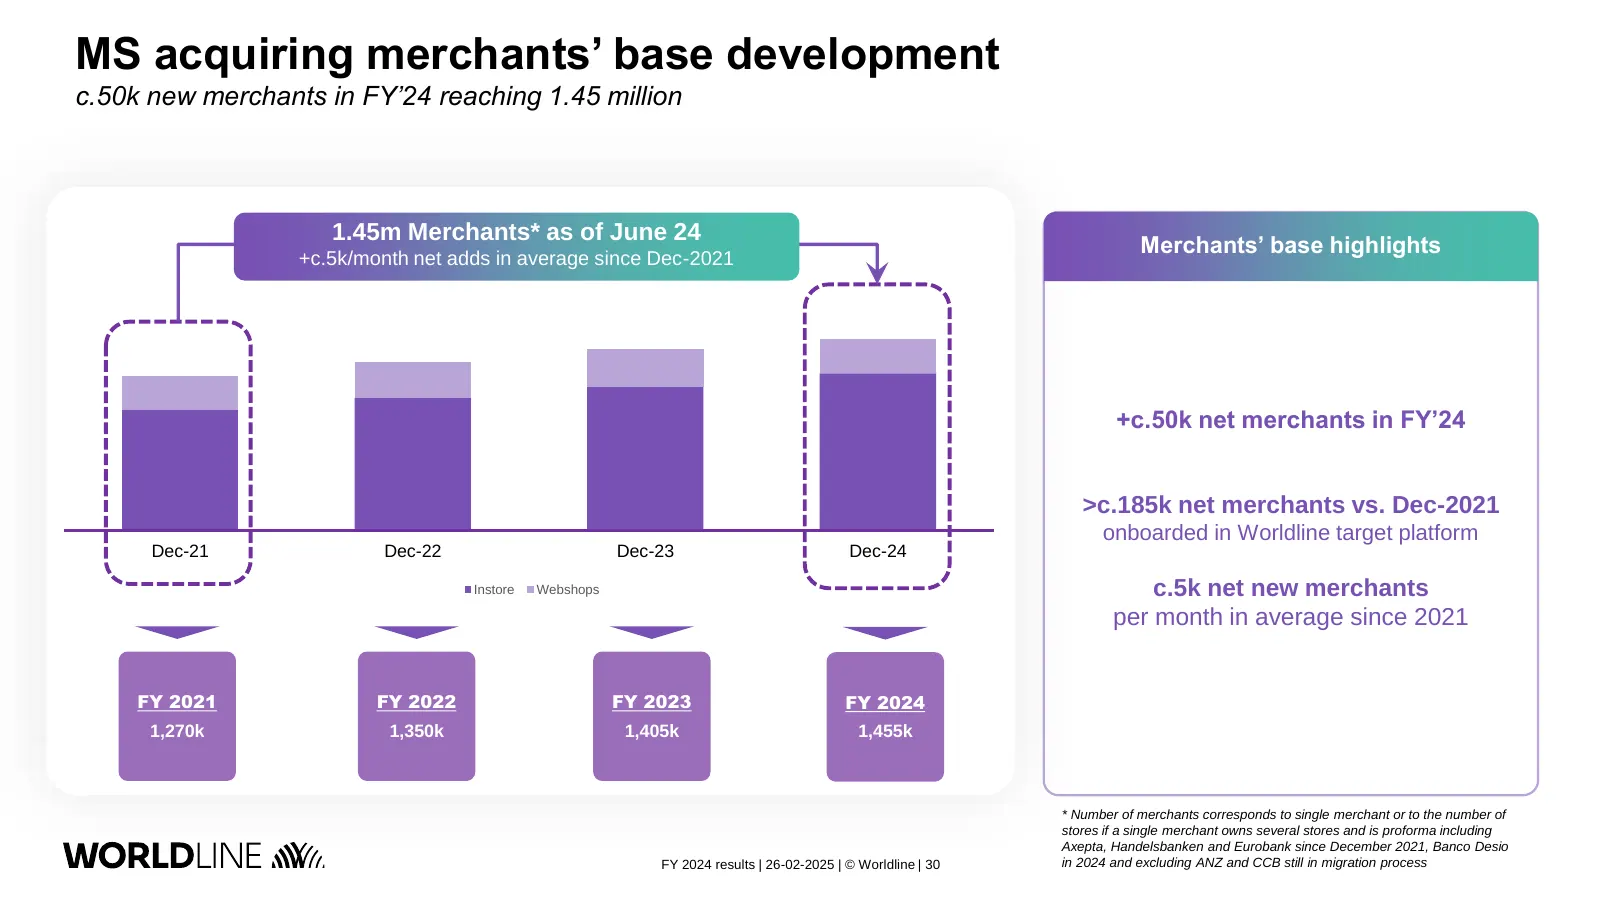
MS acquiring merchants’ base development c.50k new merchants in FY’24 reaching 1.45 million 1.45m Merchants* as of June 24 Merchants’ base highlights +c.5k/month net adds in average since Dec-2021 +c.50k net merchants in FY’24 >c.185k net merchants vs. Dec-2021 onboarded in Worldline target platform
Slide 31: NR to NNR bridge and impacts on adjusted EBITDA
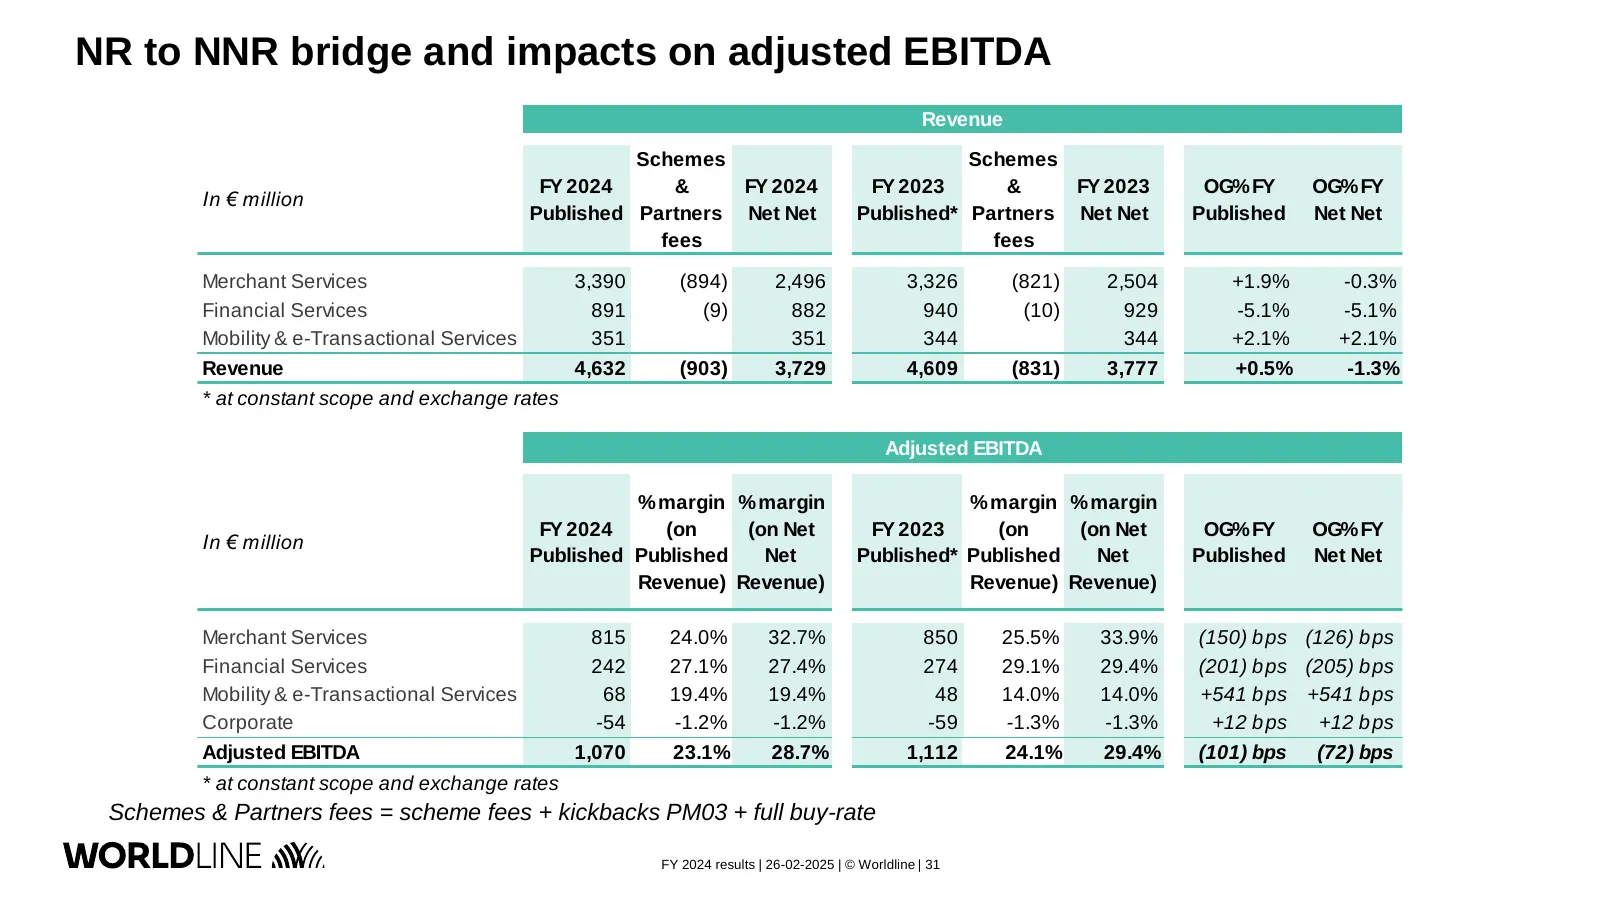
NR to NNR bridge and impacts on adjusted EBITDA Revenue Schemes Schemes FY 2024 & FY 2024 FY 2023 & FY 2023 OG% FY OG% FY In € million Published Partners Net Net Published* Partners Net Net Published Net Net fees fees Merchant Services 3,390 (894) 2,496 3,326 (821) 2,504 +1.9% -0.3% Financial Servic
Slide 32: EBITDA to Adjusted EBITDA & Operating margin to Adjusted EBITDA
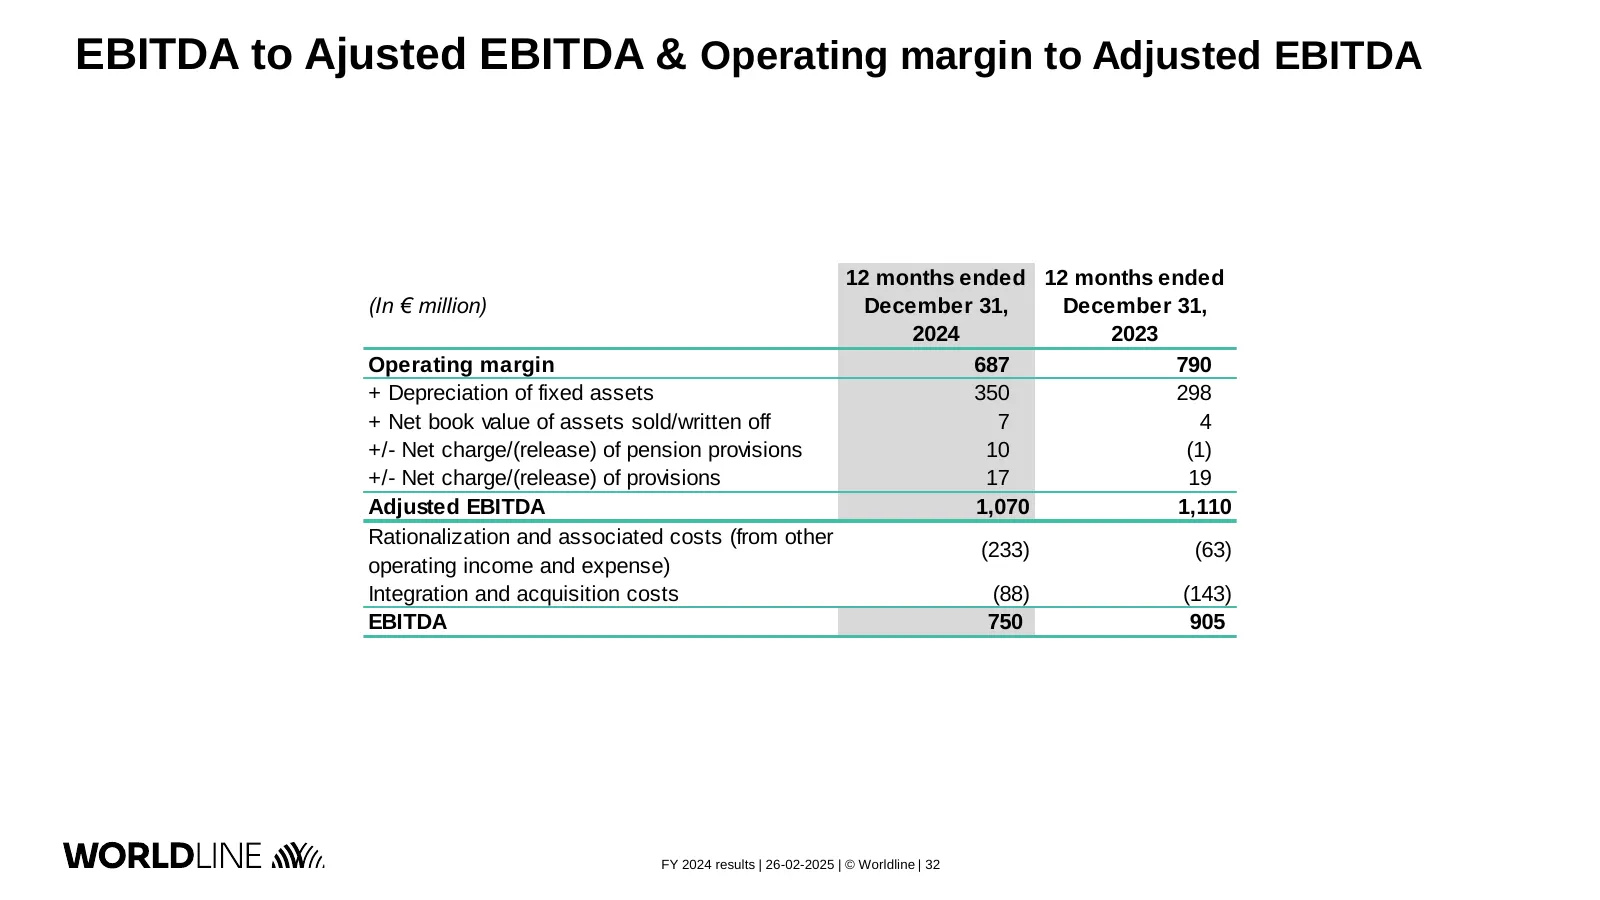
EBITDA to Ajusted EBITDA & Operating margin to Adjusted EBITDA 12 months ended 12 months ended (In € million) December 31, December 31, 2024 2023 Operating margin 687 790 + Depreciation of fixed assets 350 298 + Net book value of assets sold/written off 7 4 +/- Net charge/(release) of pension provis
Slide 33: Net income to normalized net income reconciliation
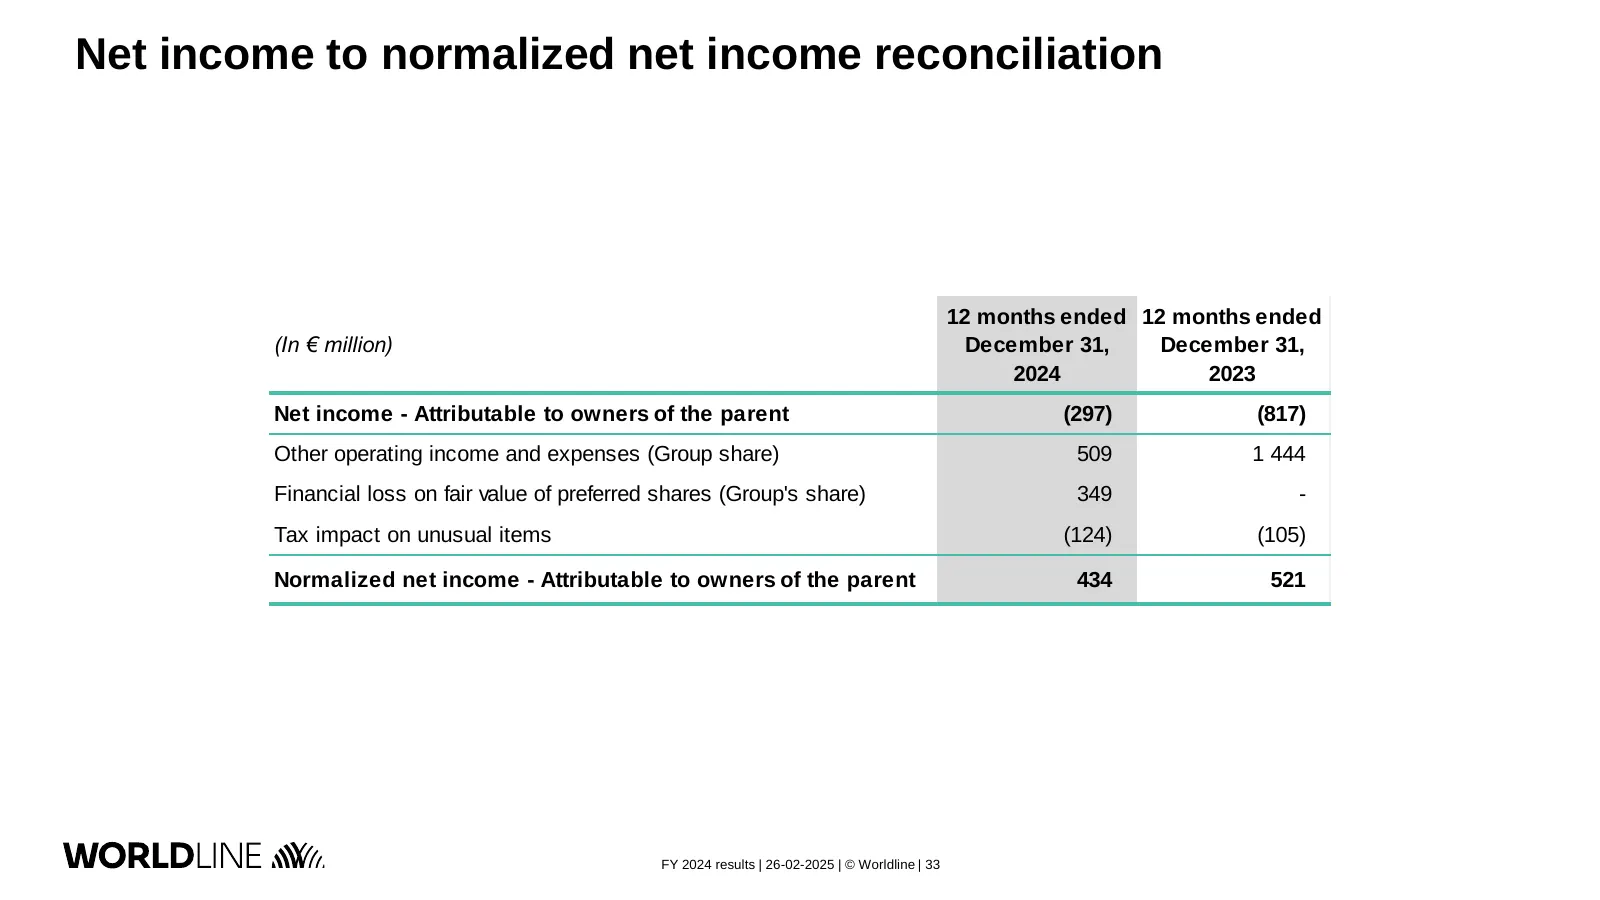
Net income to normalized net income reconciliation 12 months ended 12 months ended (In € million) December 31, December 31, 2024 2023 Net income - Attributable to owners of the parent (297) (817) Other operating income and expenses (Group share) 509 1 444 Financial loss on fair value of preferred sh
Slide 34: Leverage ratio bridge excluding and including IFRS16
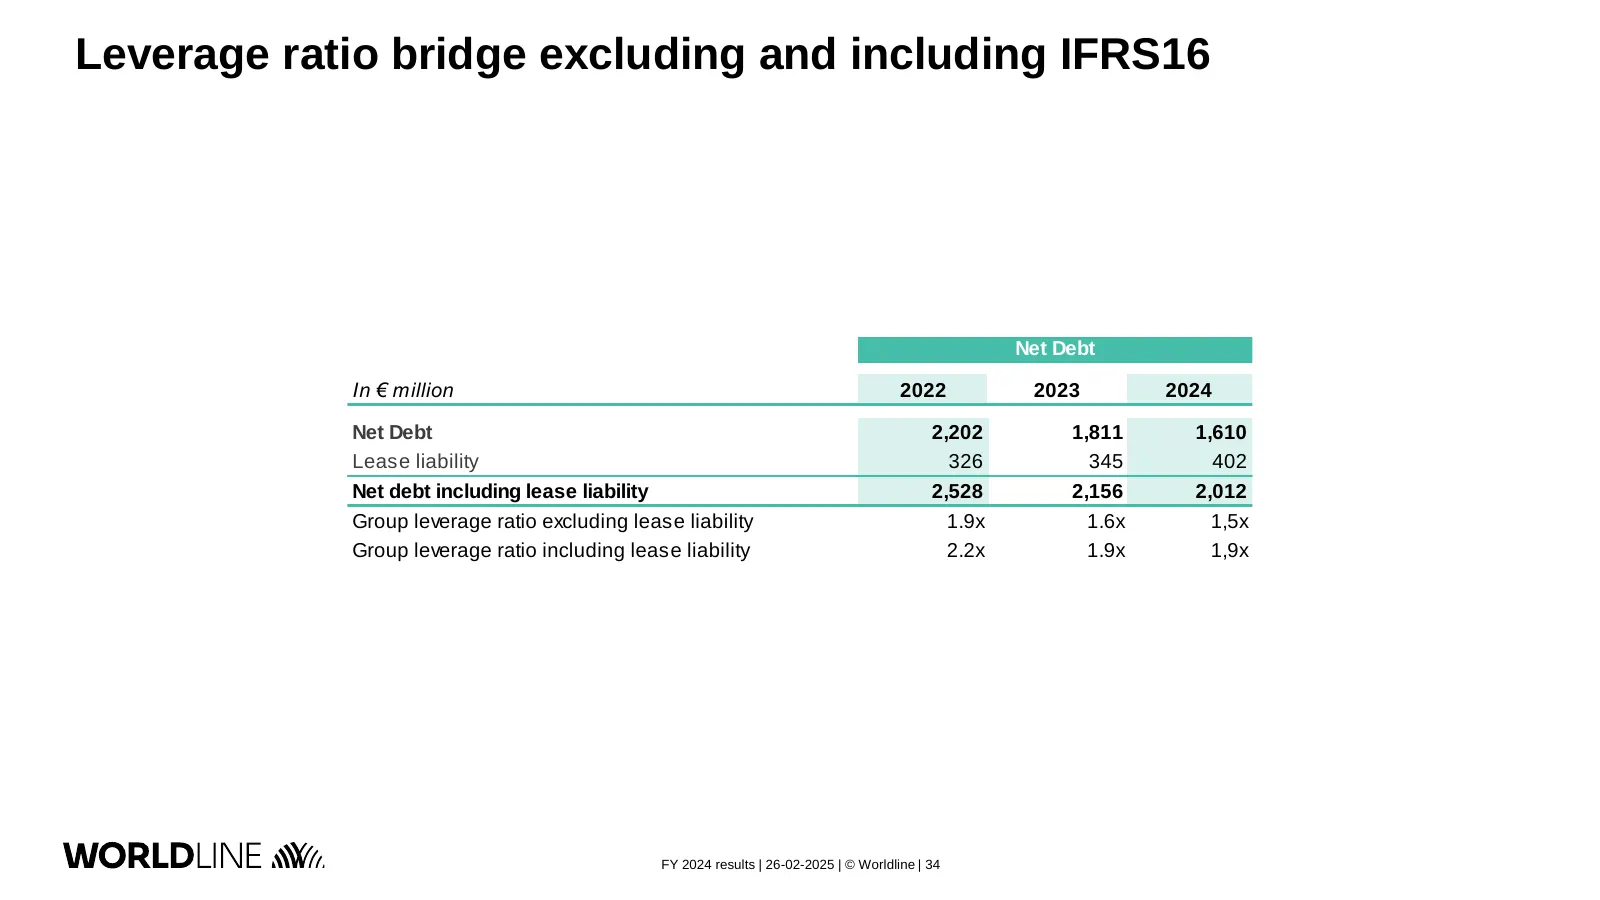
Leverage ratio bridge excluding and including IFRS16 Net Debt In € million 2022 2023 2024 Net Debt 2,202 1,811 1,610 Lease liability 326 345 402 Net debt including lease liability 2,528 2,156 2,012 Group leverage ratio excluding lease liability 1.9x 1.6x 1,5x Group leverage ratio including lease lia
Slide 35: Unlevered Free Cash Flow to Free Cash Flow reconciliation
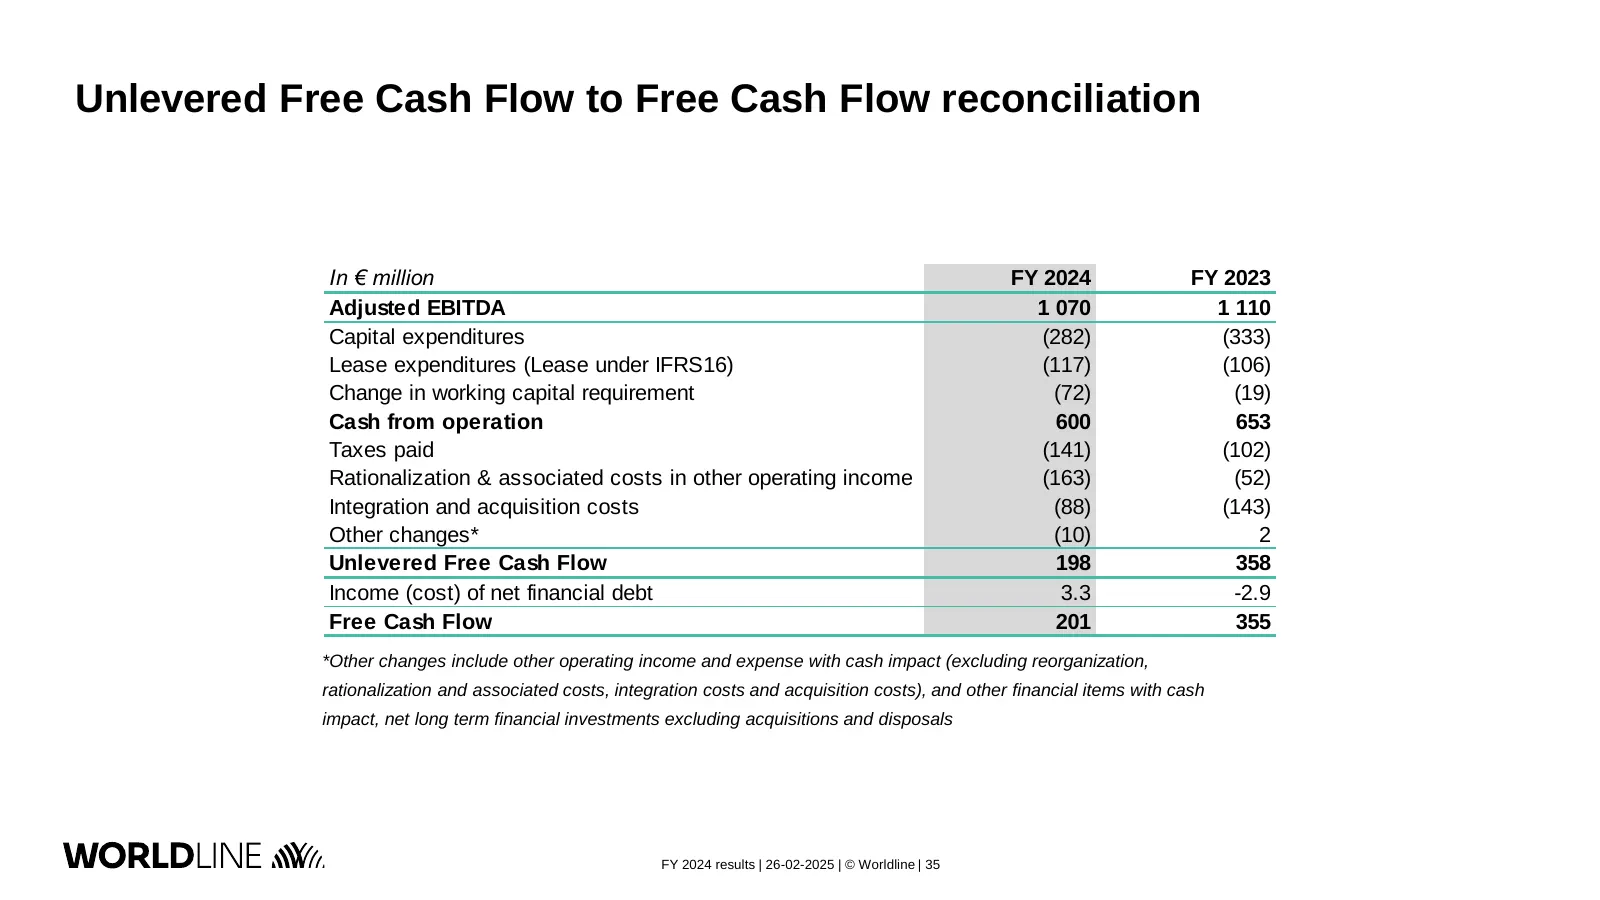
Unlevered Free Cash Flow to Free Cash Flow reconciliation In € million FY 2024 FY 2023 Adjusted EBITDA 1 070 1 110 Capital expenditures (282) (333) Lease expenditures (Lease under IFRS16) (117) (106) Change in working capital requirement (72) (19) Cash from operation 600 653 Taxes paid (141) (102) R

Slide 36: Thank you
THANK YOU For more information, please contact: Laurent Marie Group Head of Investor Relations laurent.marie@worldline.com Peter Farren Investor Relations Manager peter.farren@worldline.com Guillaume Delaunay Investor Relations Officer guillaume.delaunay@worldline.com
Source: Internet Archive copy of investors.worldline.com
More decks from Worldline SA
 Q3 2026 Earnings Presentation24 slides · Oct 27, 2026
 H1 2026 Earnings Presentation42 slides · Jul 30, 2026
 Shareholder Meeting (June 2026)72 slides · Jun 11, 2026
 Q1 2026 Earnings Presentation21 slides · Apr 28, 2026
 FY 2025 Earnings Presentation45 slides · Feb 25, 2026
 Shareholder Meeting (January 2026)32 slides · Jan 8, 2026