Perion Network Ltd · NASDAQ:PERI
Perion Network — Investor Presentation (June 2012)
22 slides from Perion Network's investor presentation, June 2012
Slide 1: Investor Presentation
Investor Presentation June 2012
Slide 2: Safe Harbor Statement
Safe Harbor Statement This presentation contains historical information and forward-looking statements within the meaning of The Private Securities Litigation Reform Act of 1995 with respect to the business, financial condition and results of operations of the Company. The words “believe,” “expect,”
Slide 3: Corporate & Investment Overview
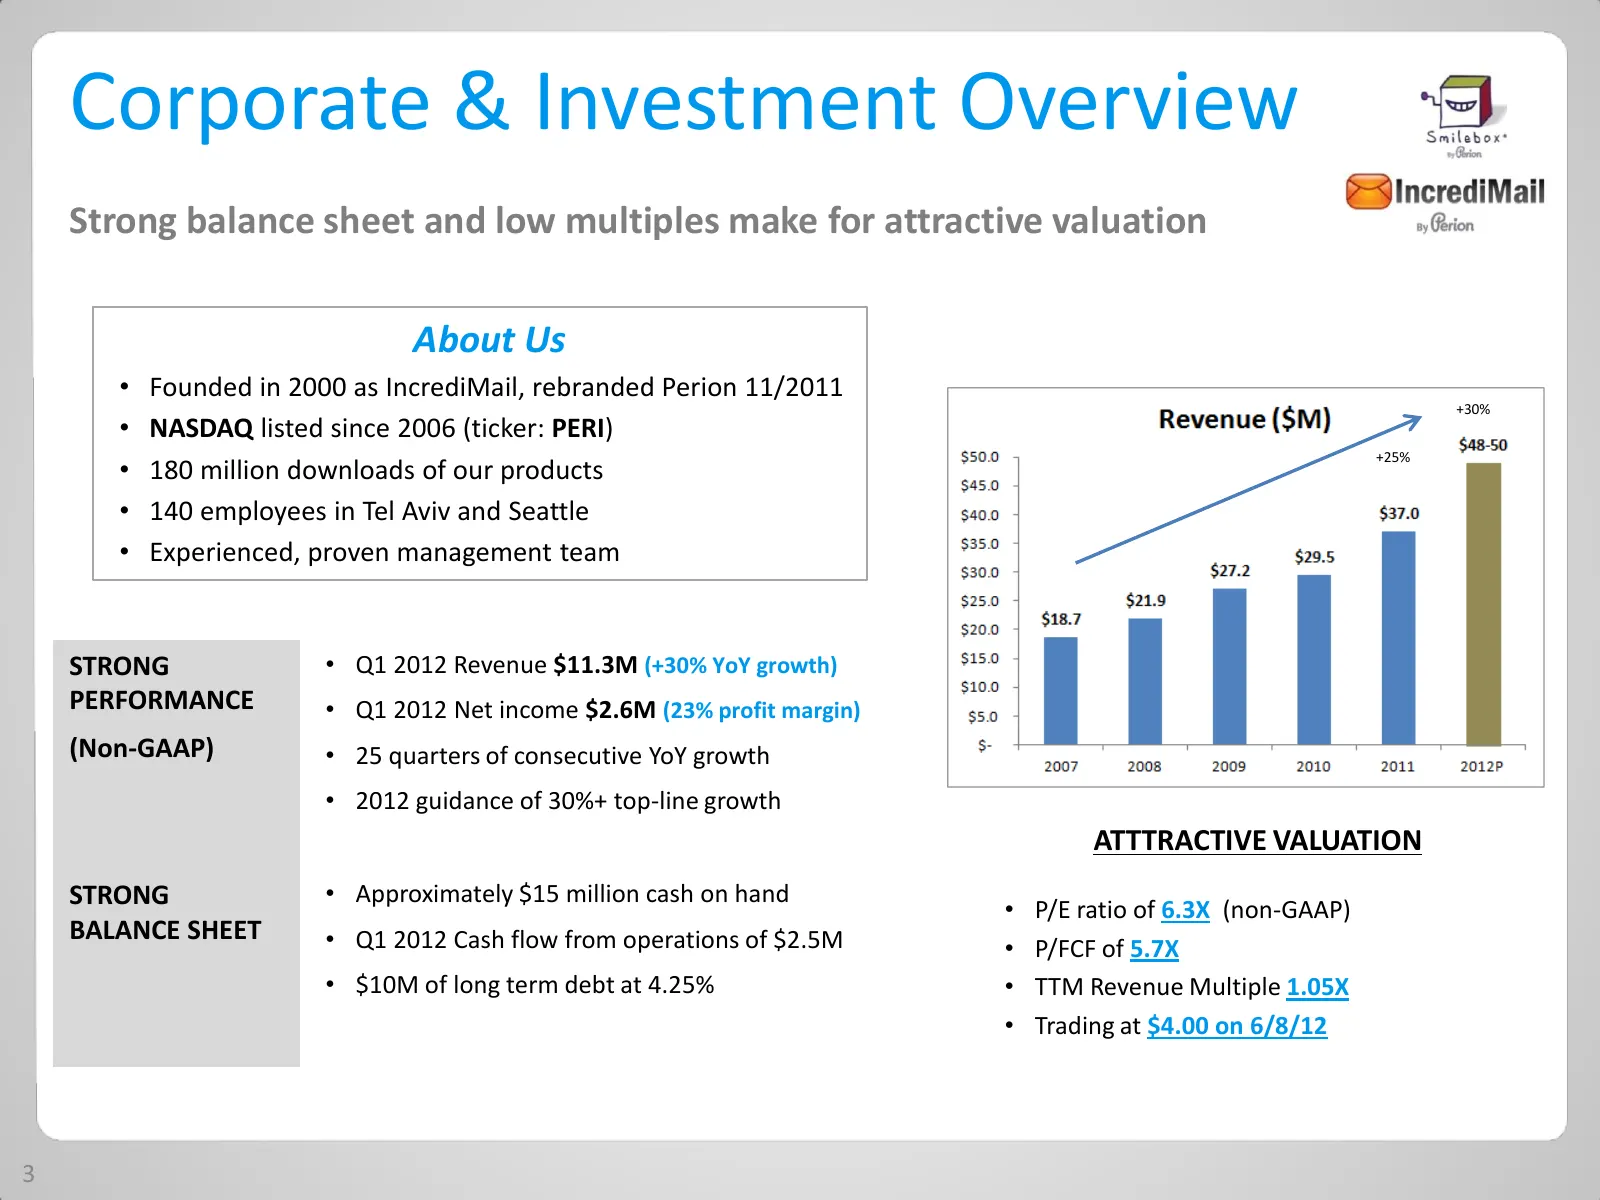
Corporate & Investment Overview Strong balance sheet and low multiples make for attractive valuation About Us • Founded in 2000 as IncrediMail, rebranded Perion 11/2011 +30% • NASDAQ listed since 2006 (ticker: PERI) +25% • 180 million downloads of our products • 140 employees in Tel Aviv and Seattle
Slide 4: Connecting and Sharing Made Easy
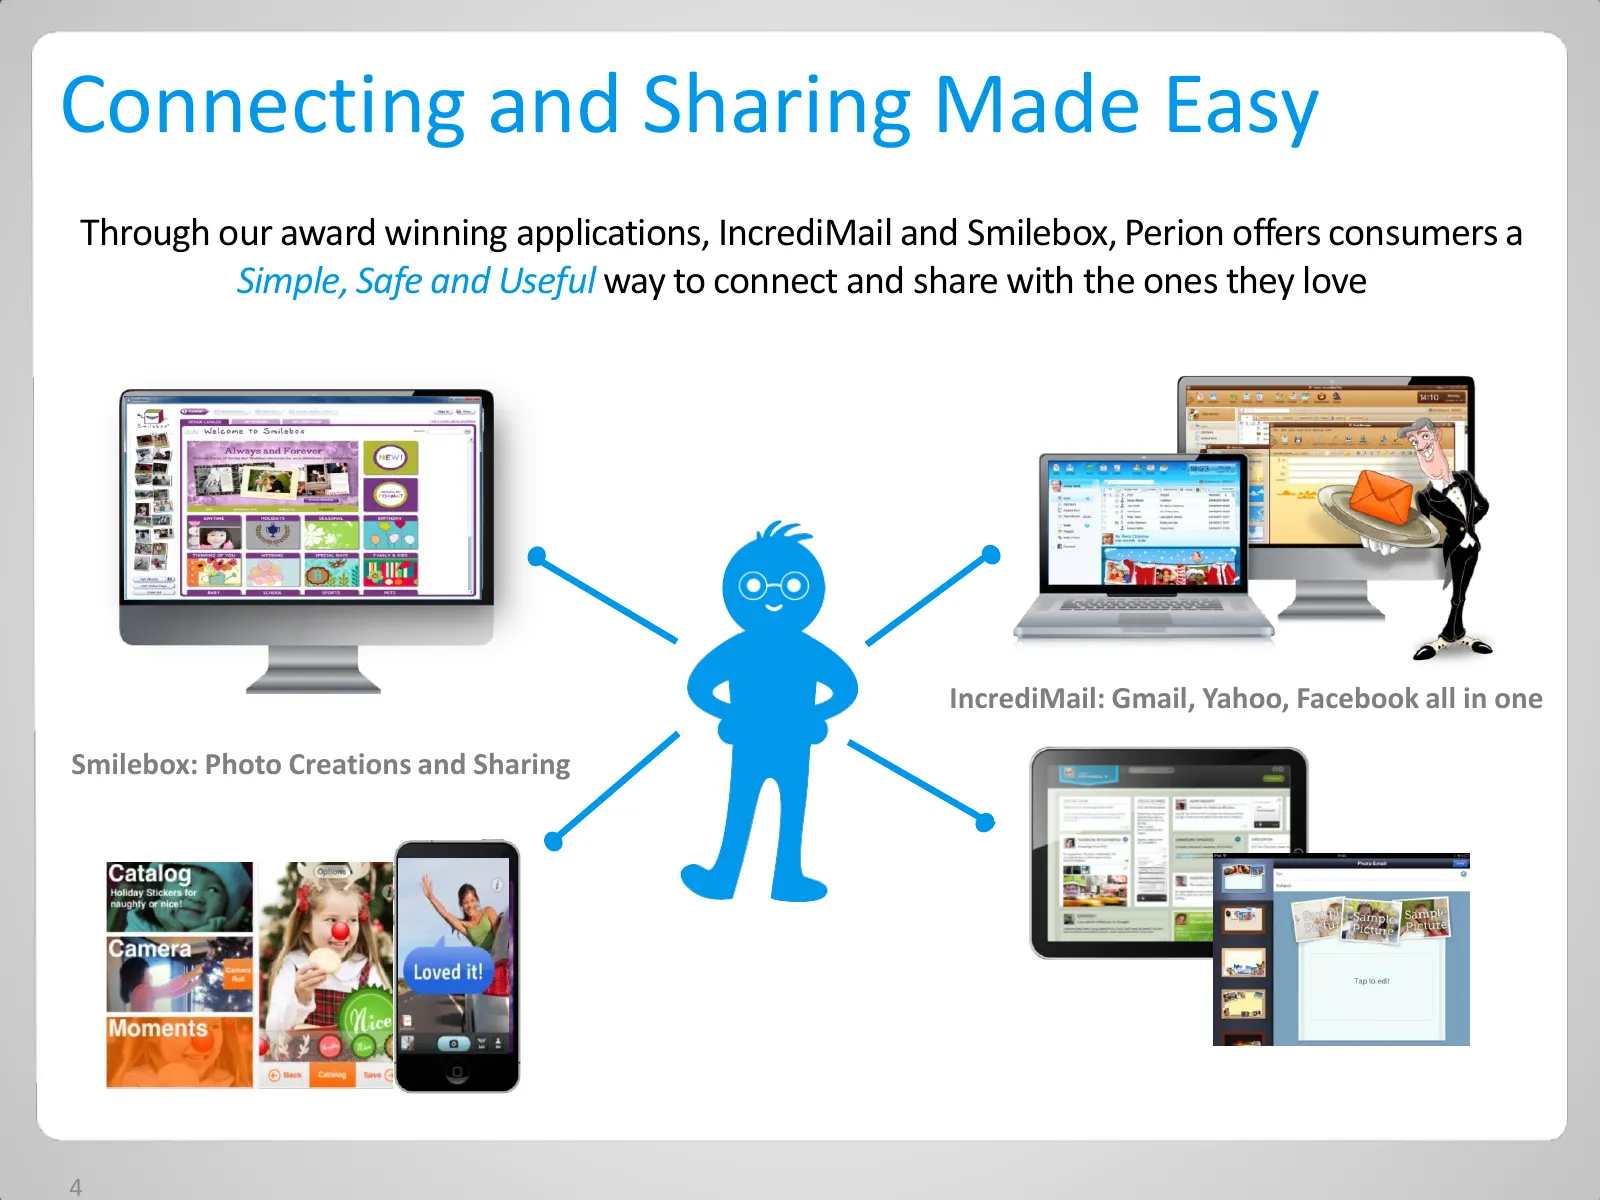
Connecting and Sharing Made Easy Through our award winning applications, IncrediMail and Smilebox, Perion offers consumers a Simple, Safe and Useful way to connect and share with the ones they love IncrediMail: Gmail, Yahoo, Facebook all in one Smilebox: Photo Creations and Sharing 4
Slide 5: Our Consumer: Second Wave Adopters
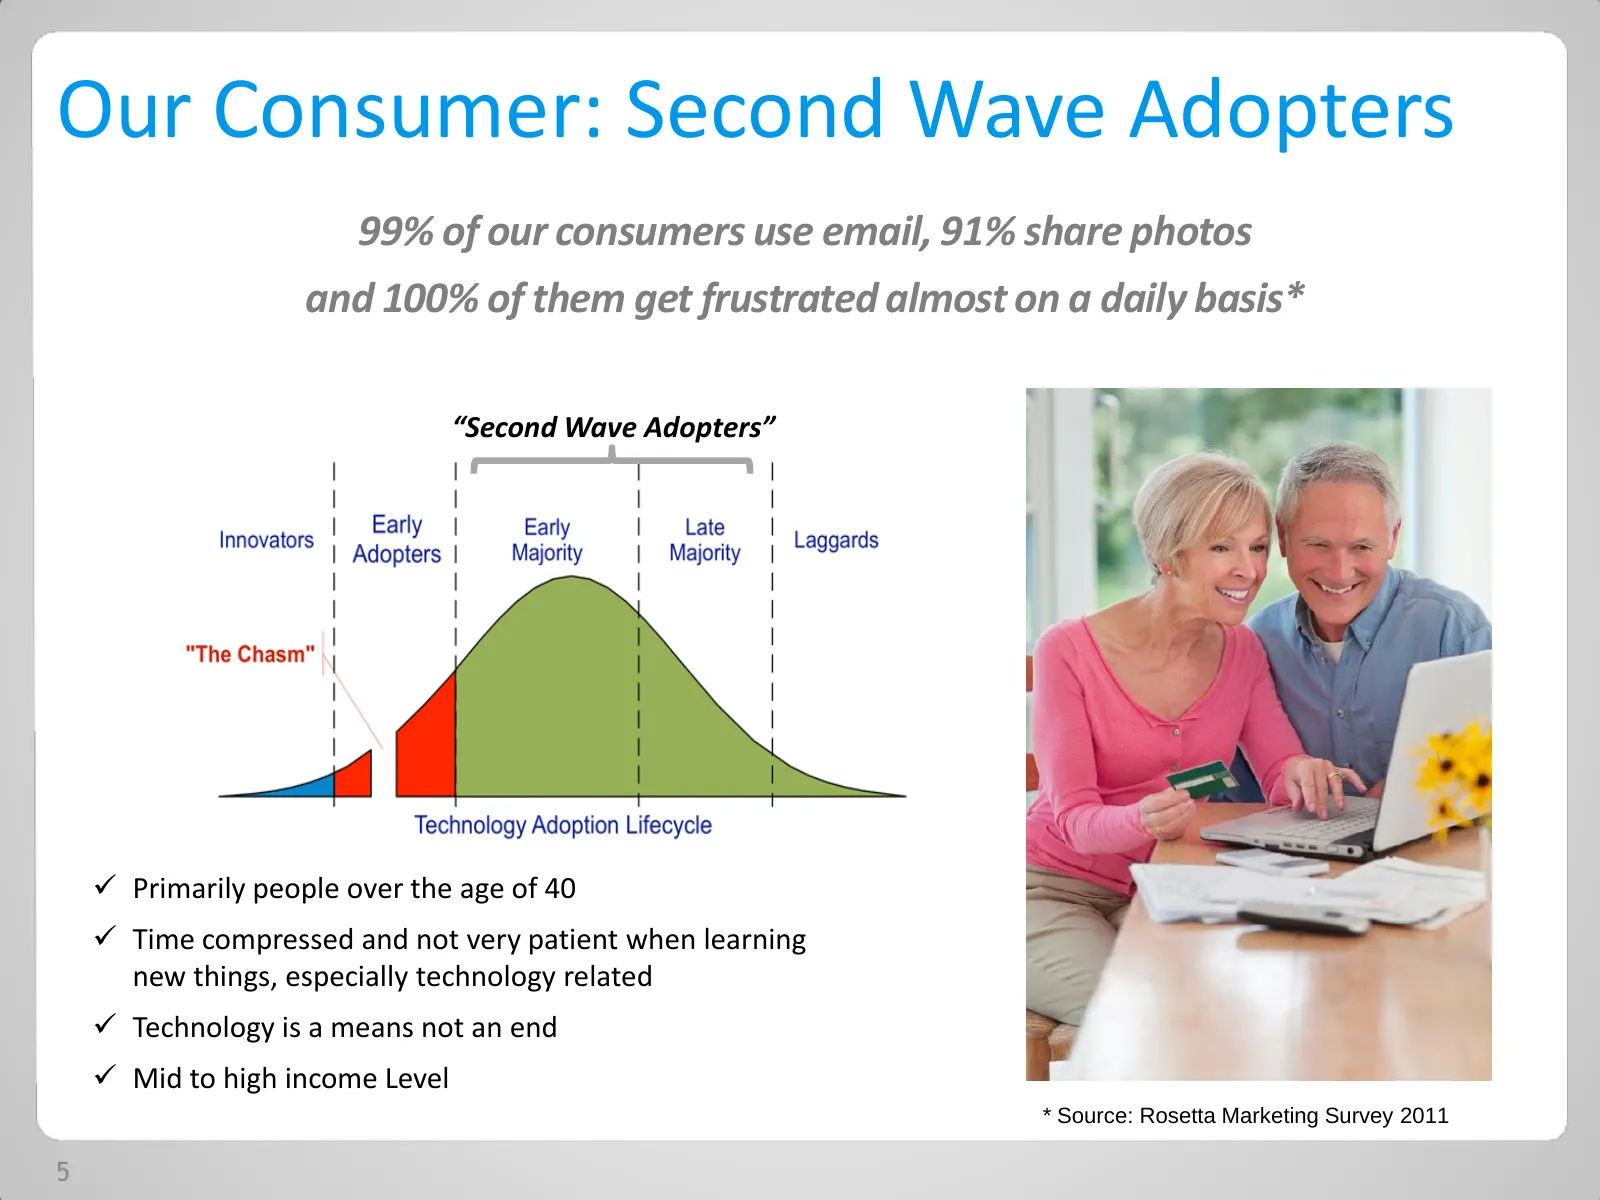
Our Consumer: Second Wave Adopters 99% of our consumers use email, 91% share photos and 100% of them get frustrated almost on a daily basis* “Second Wave Adopters” Primarily people over the age of 40 Time compressed and not very patient when learning new things, especially technology related T
Slide 6: An Attractive Target Market…
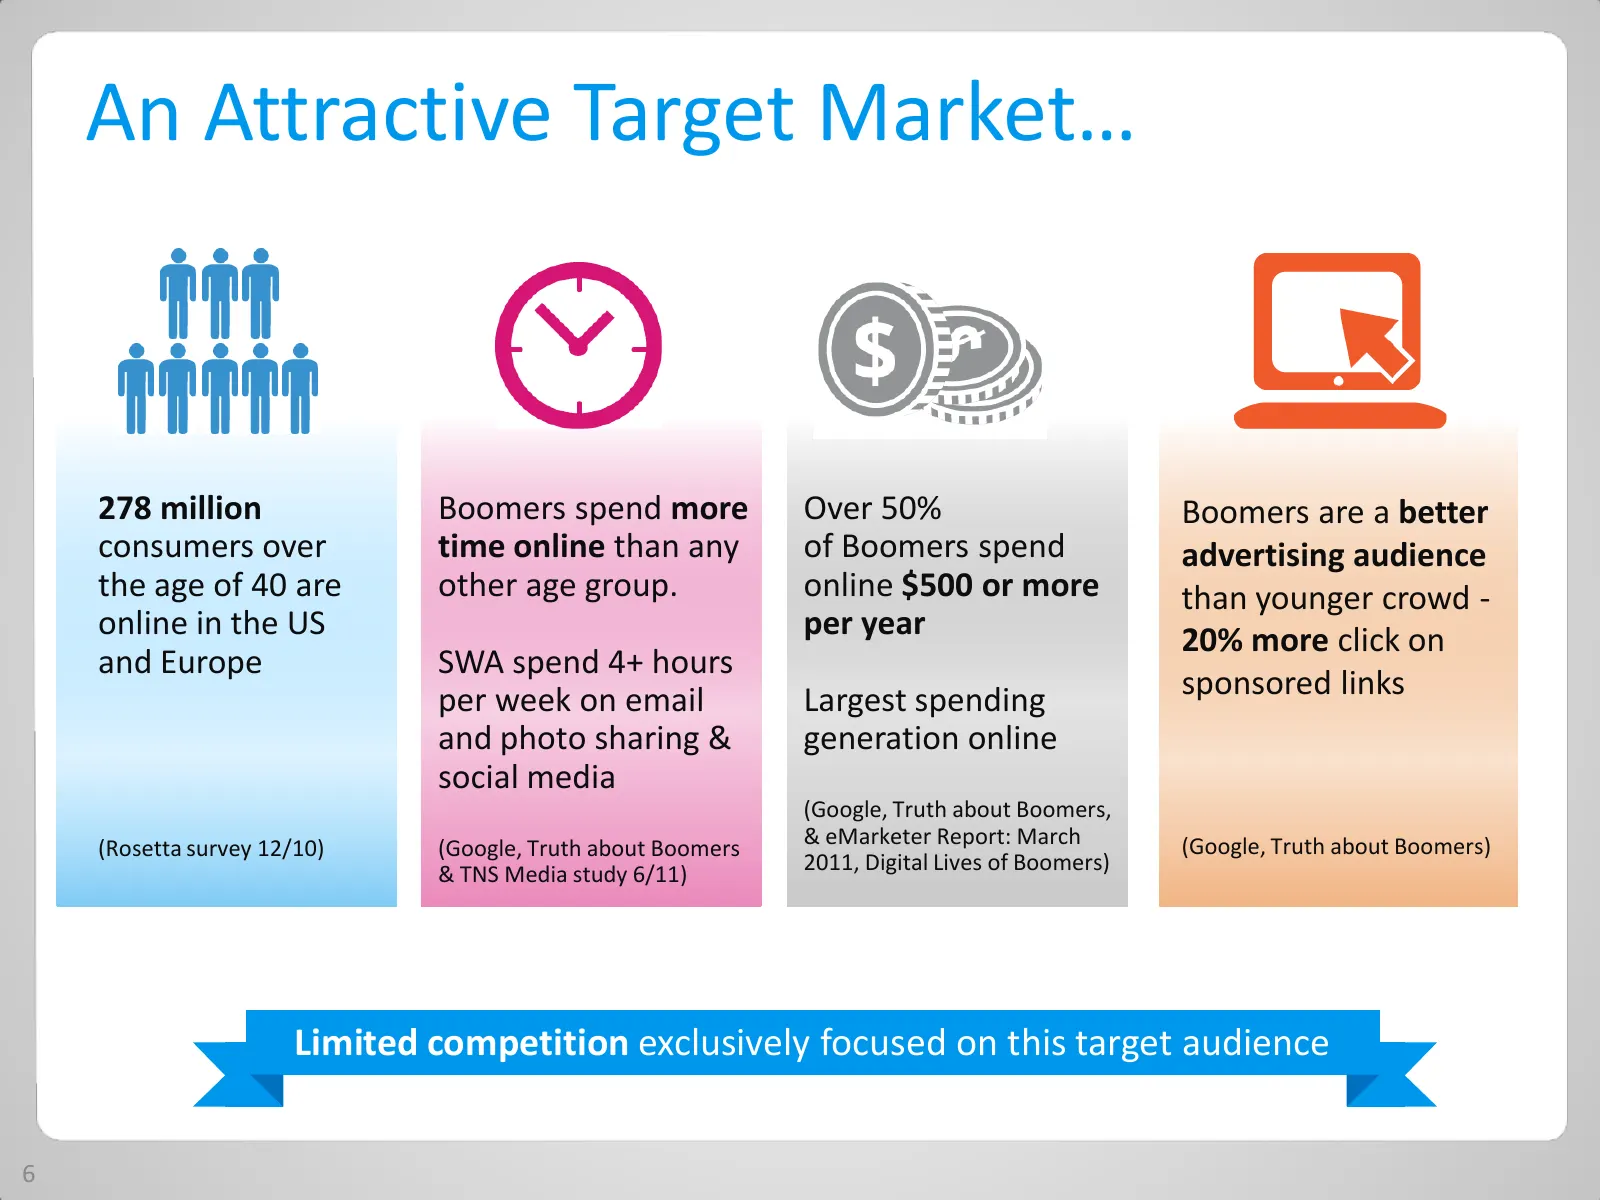
An Attractive Target Market… 278 million Boomers spend more Over 50% Boomers are a better consumers over time online than any of Boomers spend advertising audience the age of 40 are other age group. online $500 or more than younger crowd - online in the US per year 20% more click on and Europe SWA s
Slide 7: …in Billion Dollars Verticals
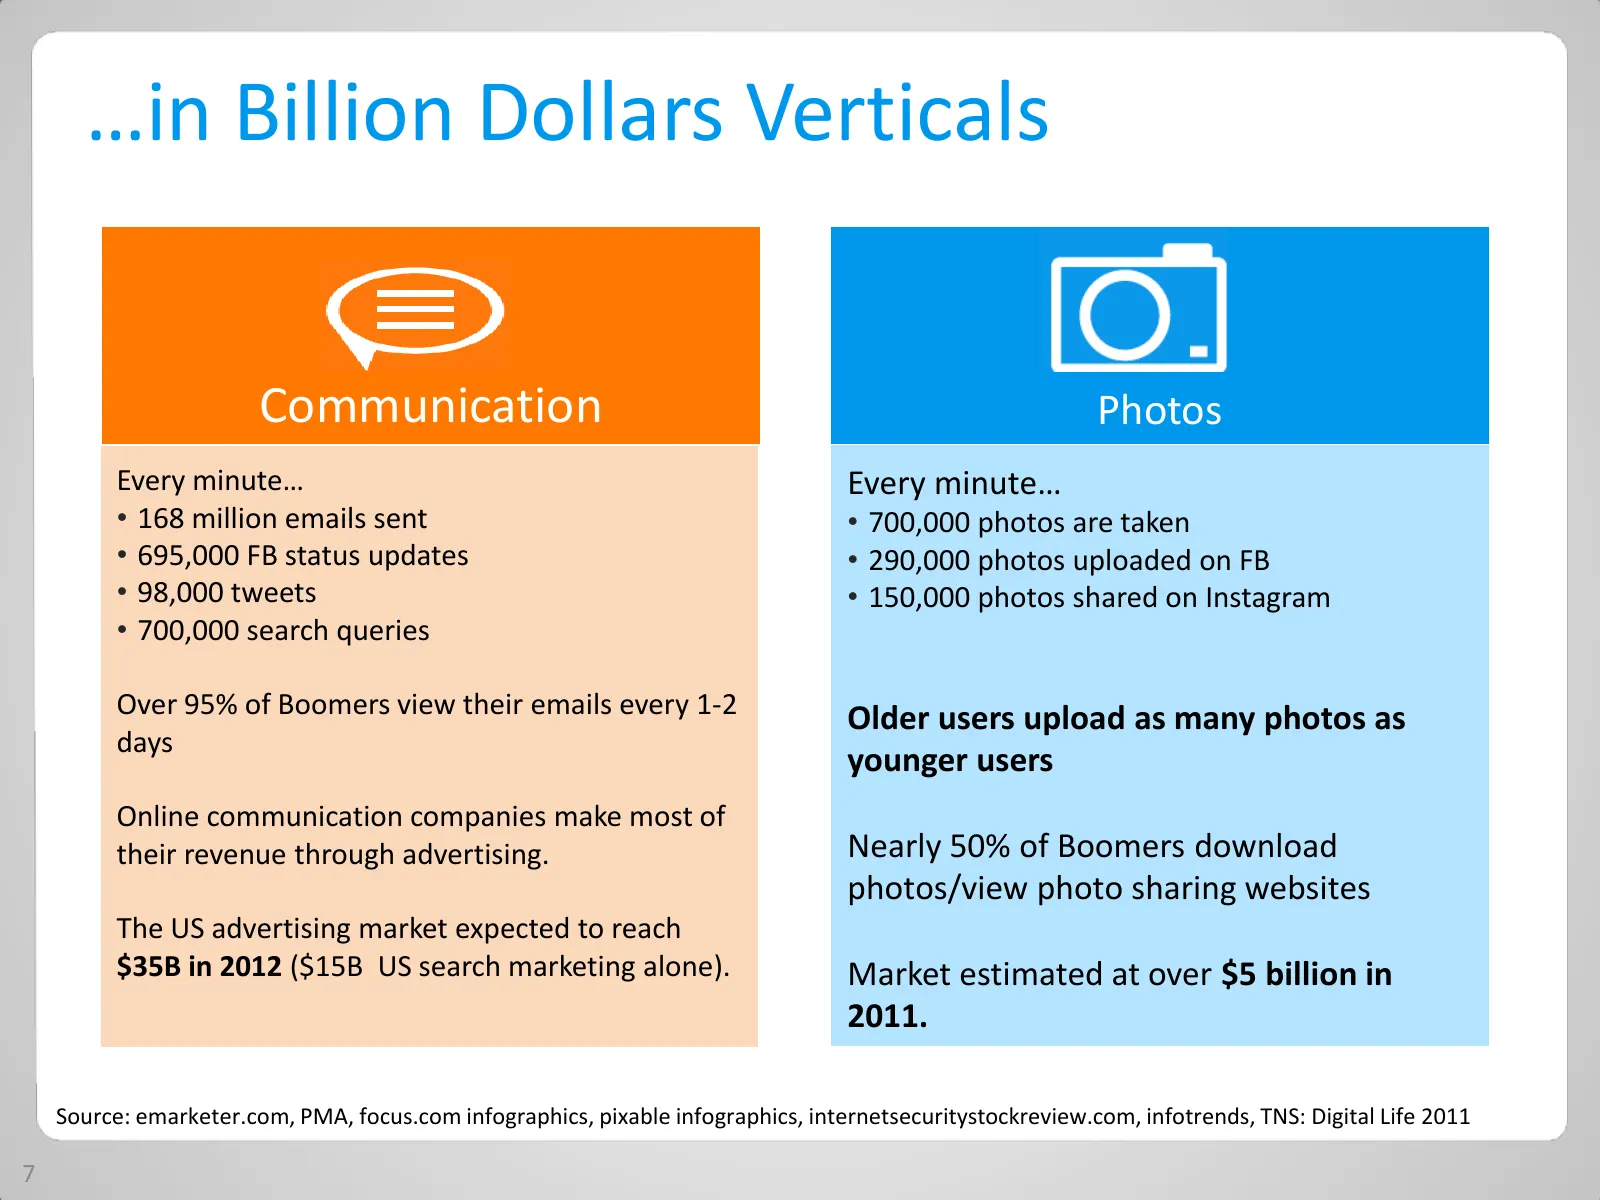
…in Billion Dollars Verticals Communication Photos Every minute… Every minute… • 168 million emails sent • 700,000 photos are taken • 695,000 FB status updates • 290,000 photos uploaded on FB • 98,000 tweets • 150,000 photos shared on Instagram • 700,000 search queries Over 95% of Boomers view their
Slide 8: Our Business Model: Freemium
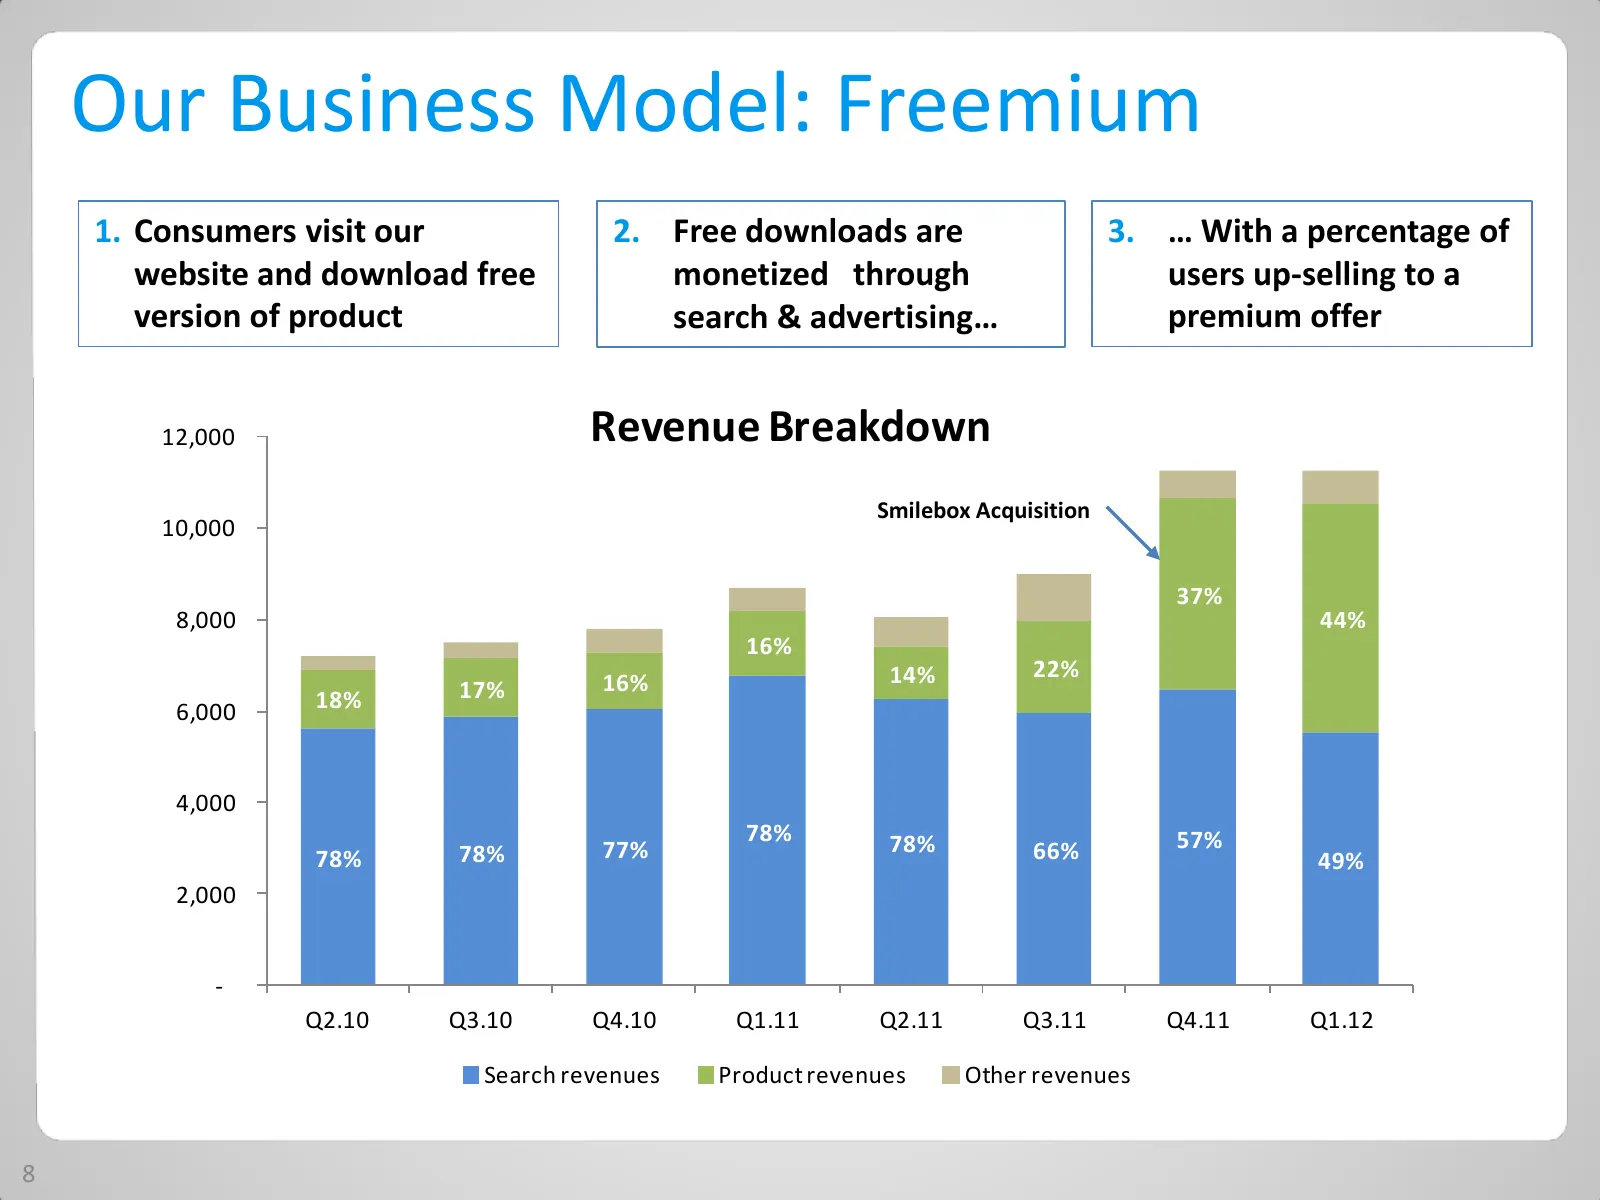
Our Business Model: Freemium 1. Consumers visit our 2. Free downloads are 3. … With a percentage of website and download free monetized through users up-selling to a version of product search & advertising… premium offer 12,000 Revenue Breakdown Smilebox Acquisition 10,000 37% 8,000 44% 16% 14% 22%
Slide 9: Advertising & Search: How Does It Work?
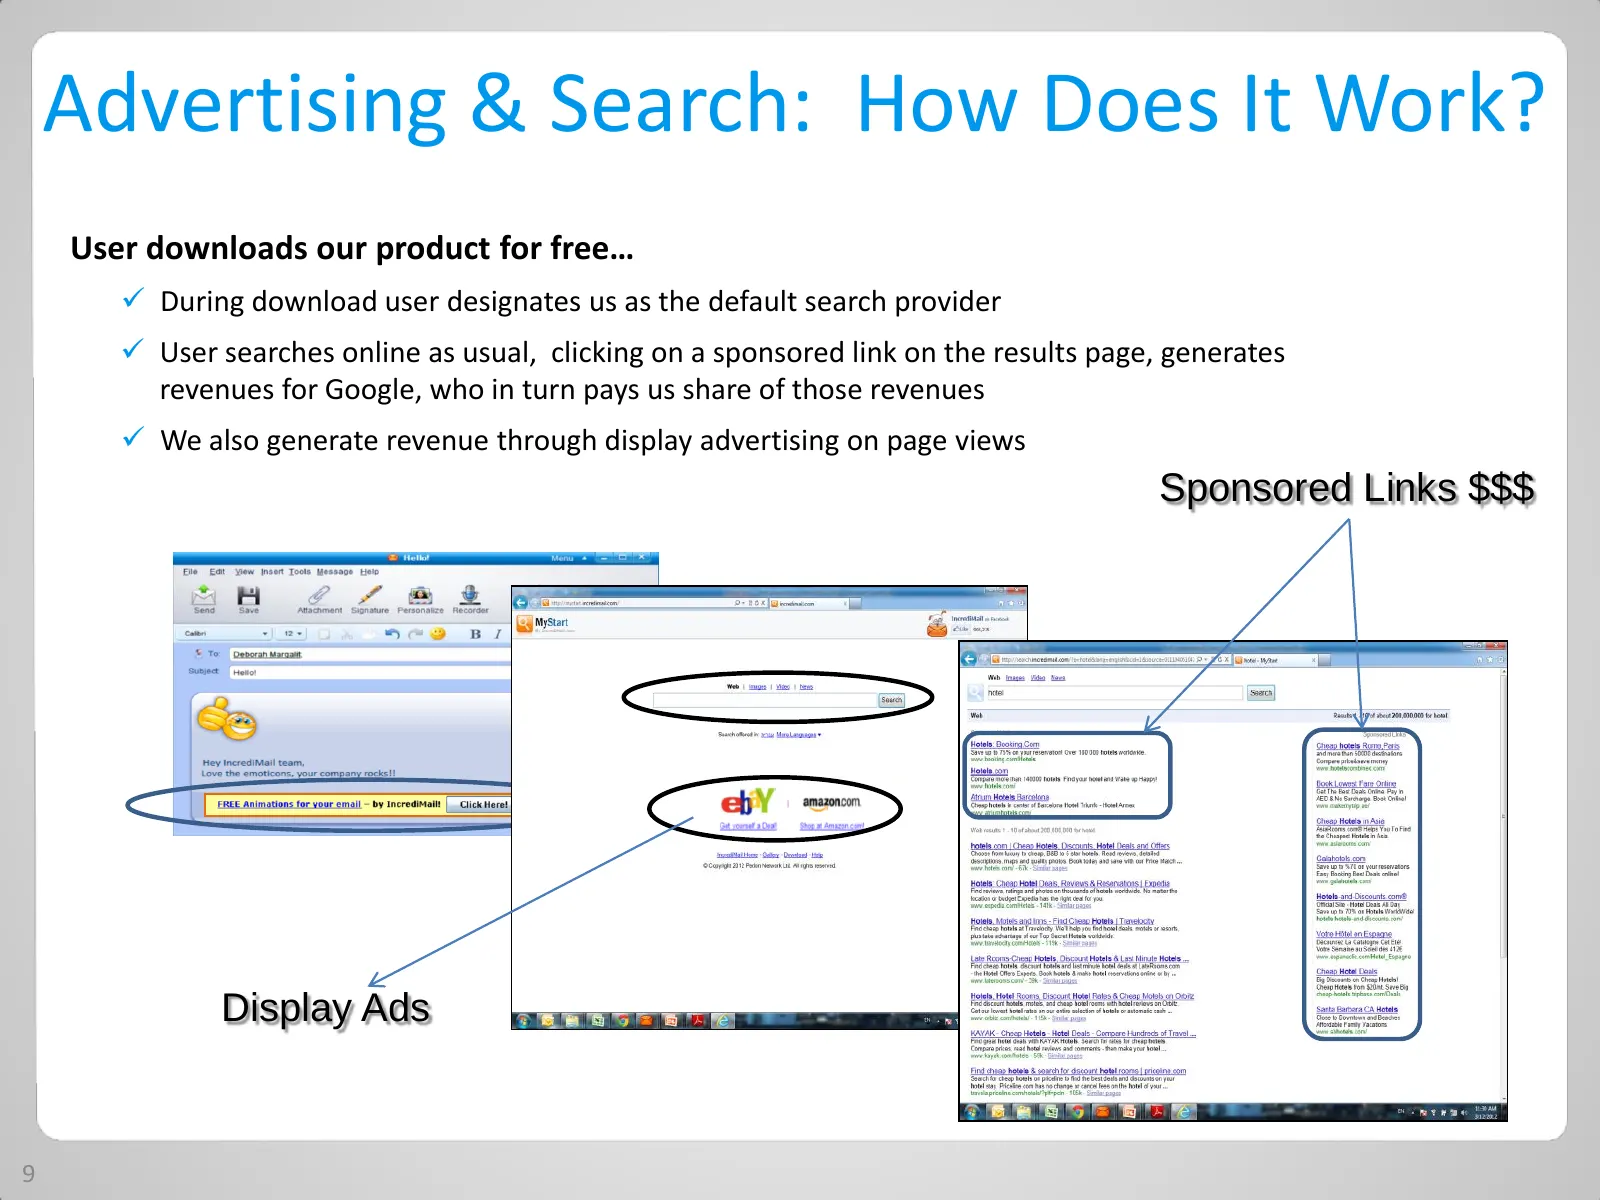
Advertising & Search: How Does It Work? User downloads our product for free… During download user designates us as the default search provider User searches online as usual, clicking on a sponsored link on the results page, generates revenues for Google, who in turn pays us share of those revenu
Slide 10: Premium: What Is It?
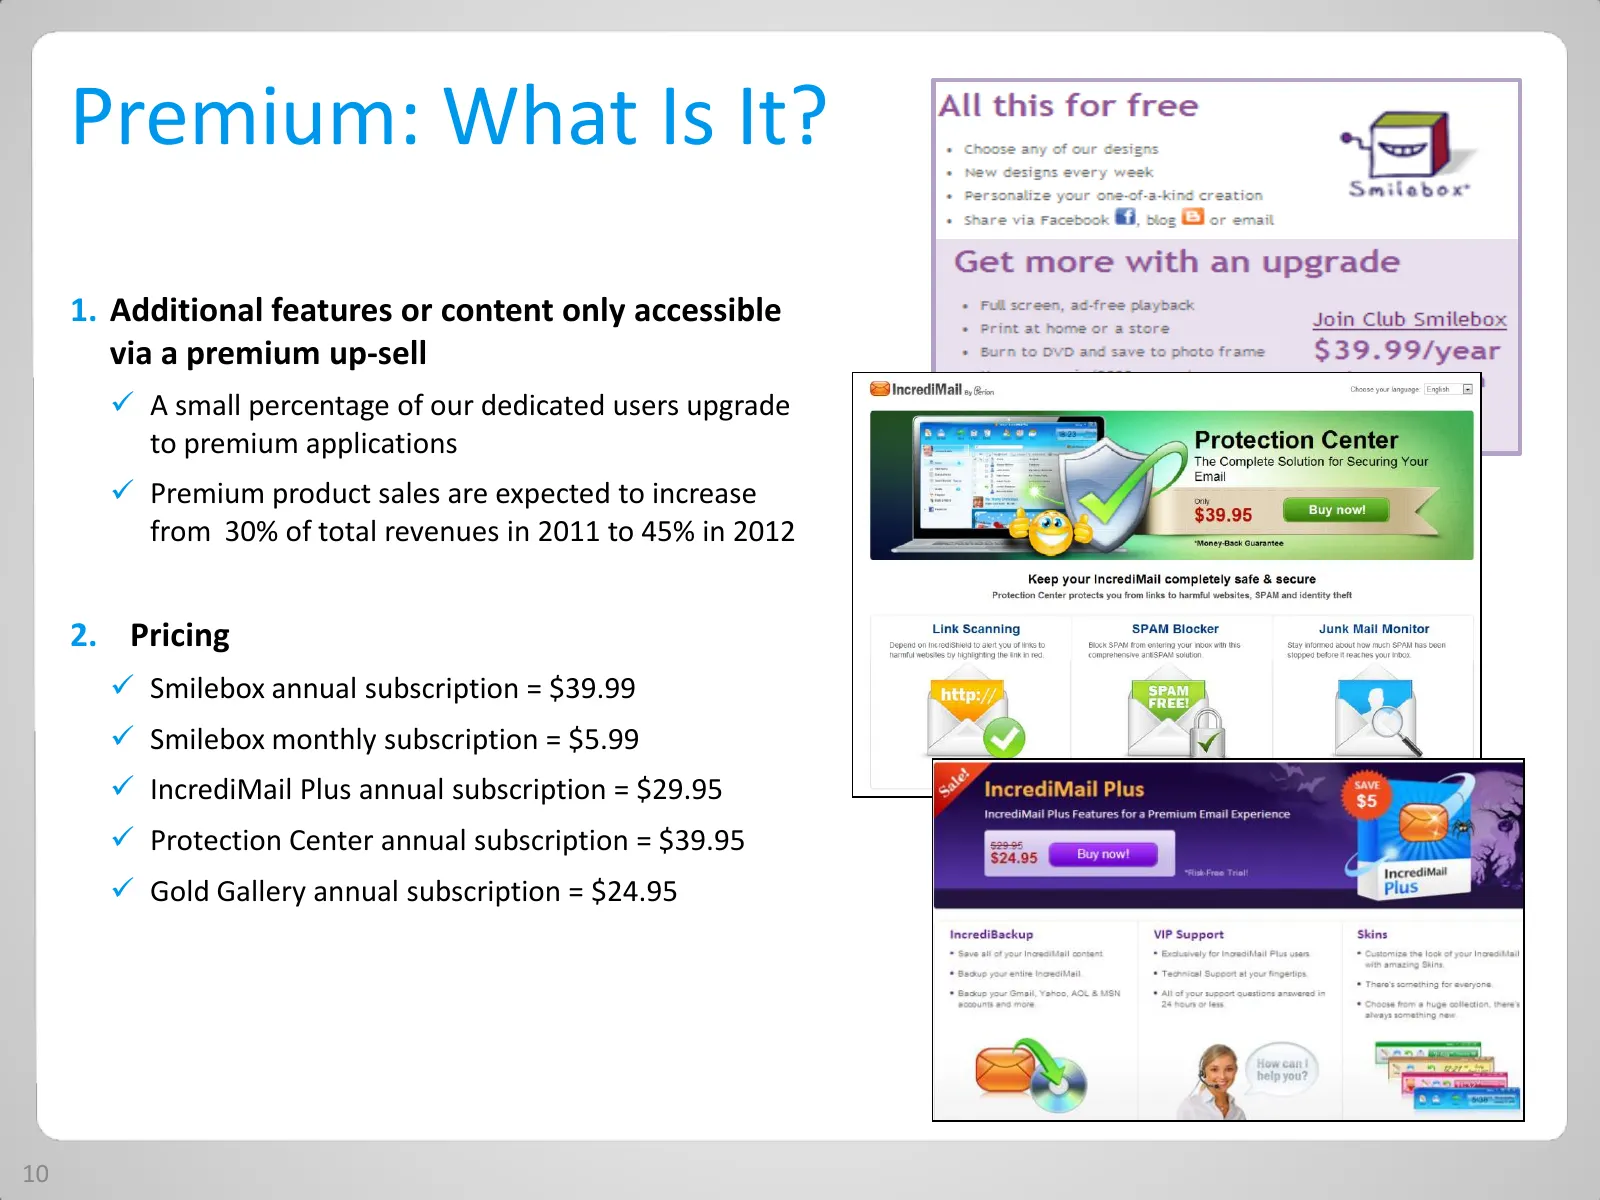
Premium: What Is It? 1. Additional features or content only accessible via a premium up-sell A small percentage of our dedicated users upgrade to premium applications Premium product sales are expected to increase from 30% of total revenues in 2011 to 45% in 2012 2. Pricing Smilebox annual sub
Slide 11: Facebook Integration into our Products
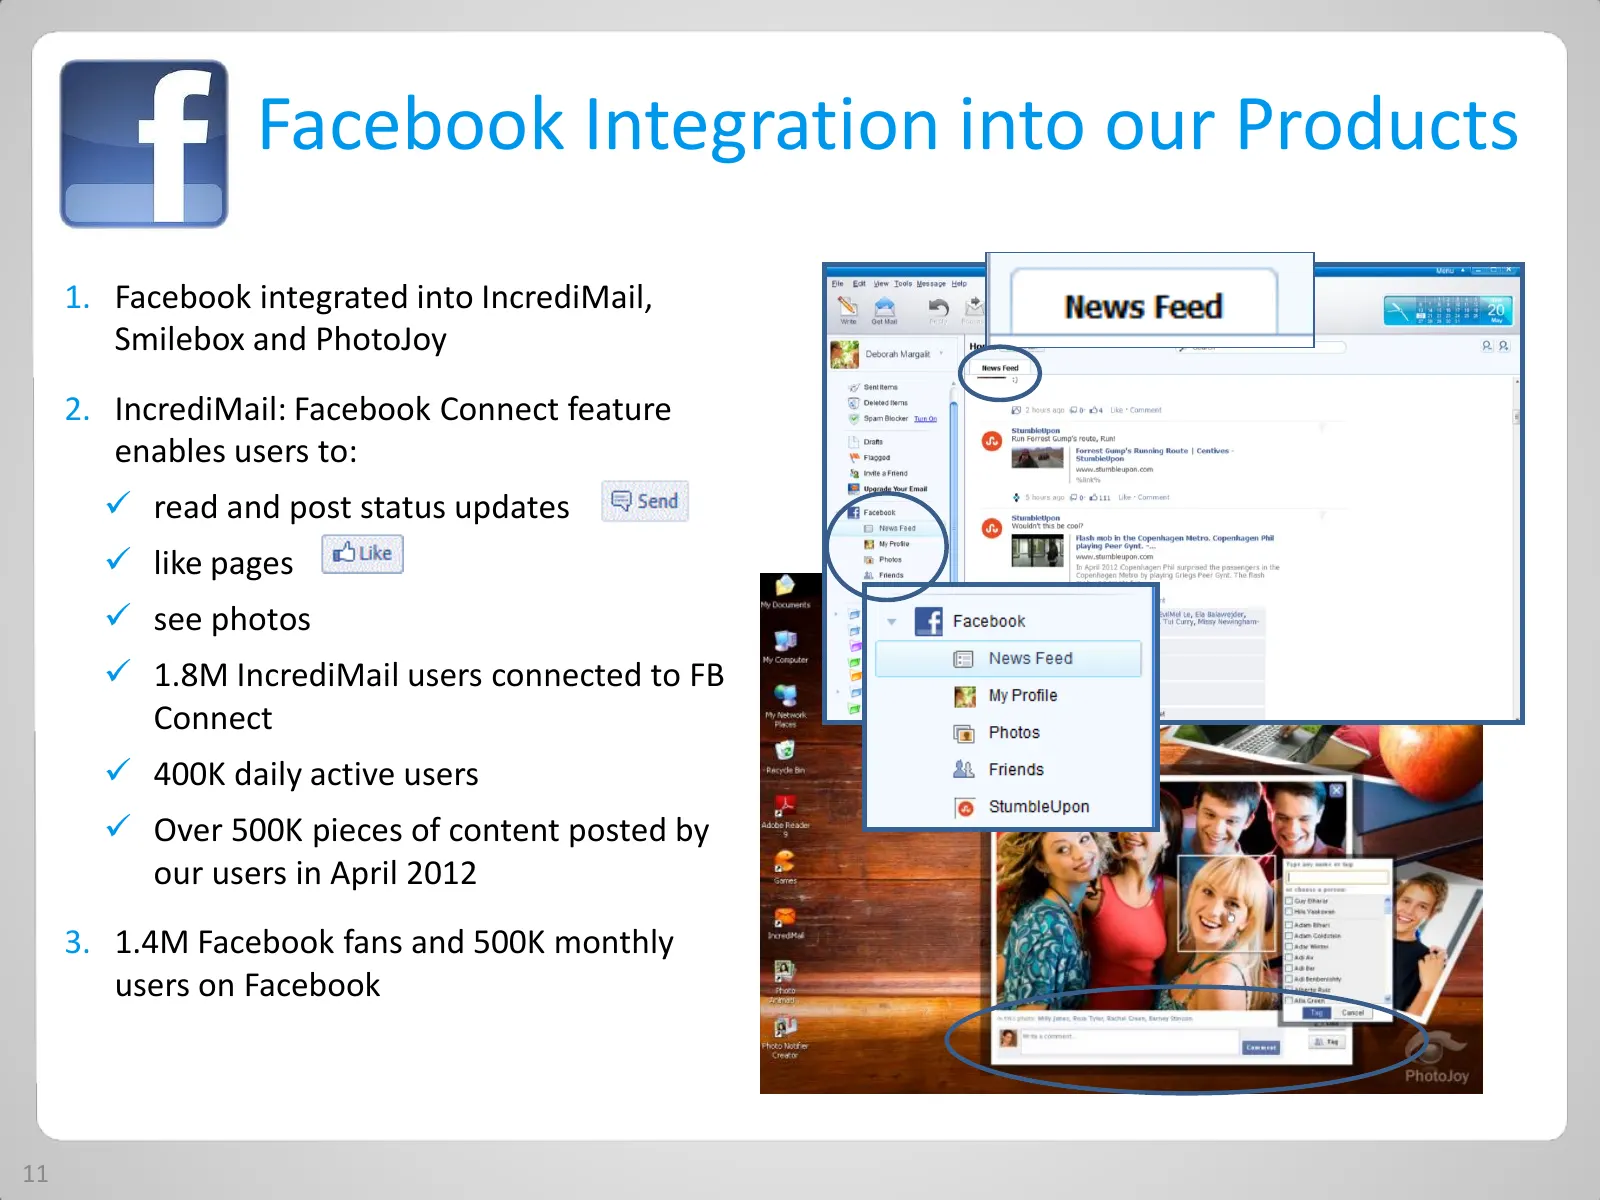
Facebook Integration into our Products 1. Facebook integrated into IncrediMail, Smilebox and PhotoJoy 2. IncrediMail: Facebook Connect feature enables users to: read and post status updates like pages see photos 1.8M IncrediMail users connected to FB Connect 400K daily active users Over
Slide 12: Growing Opportunities on New Platforms
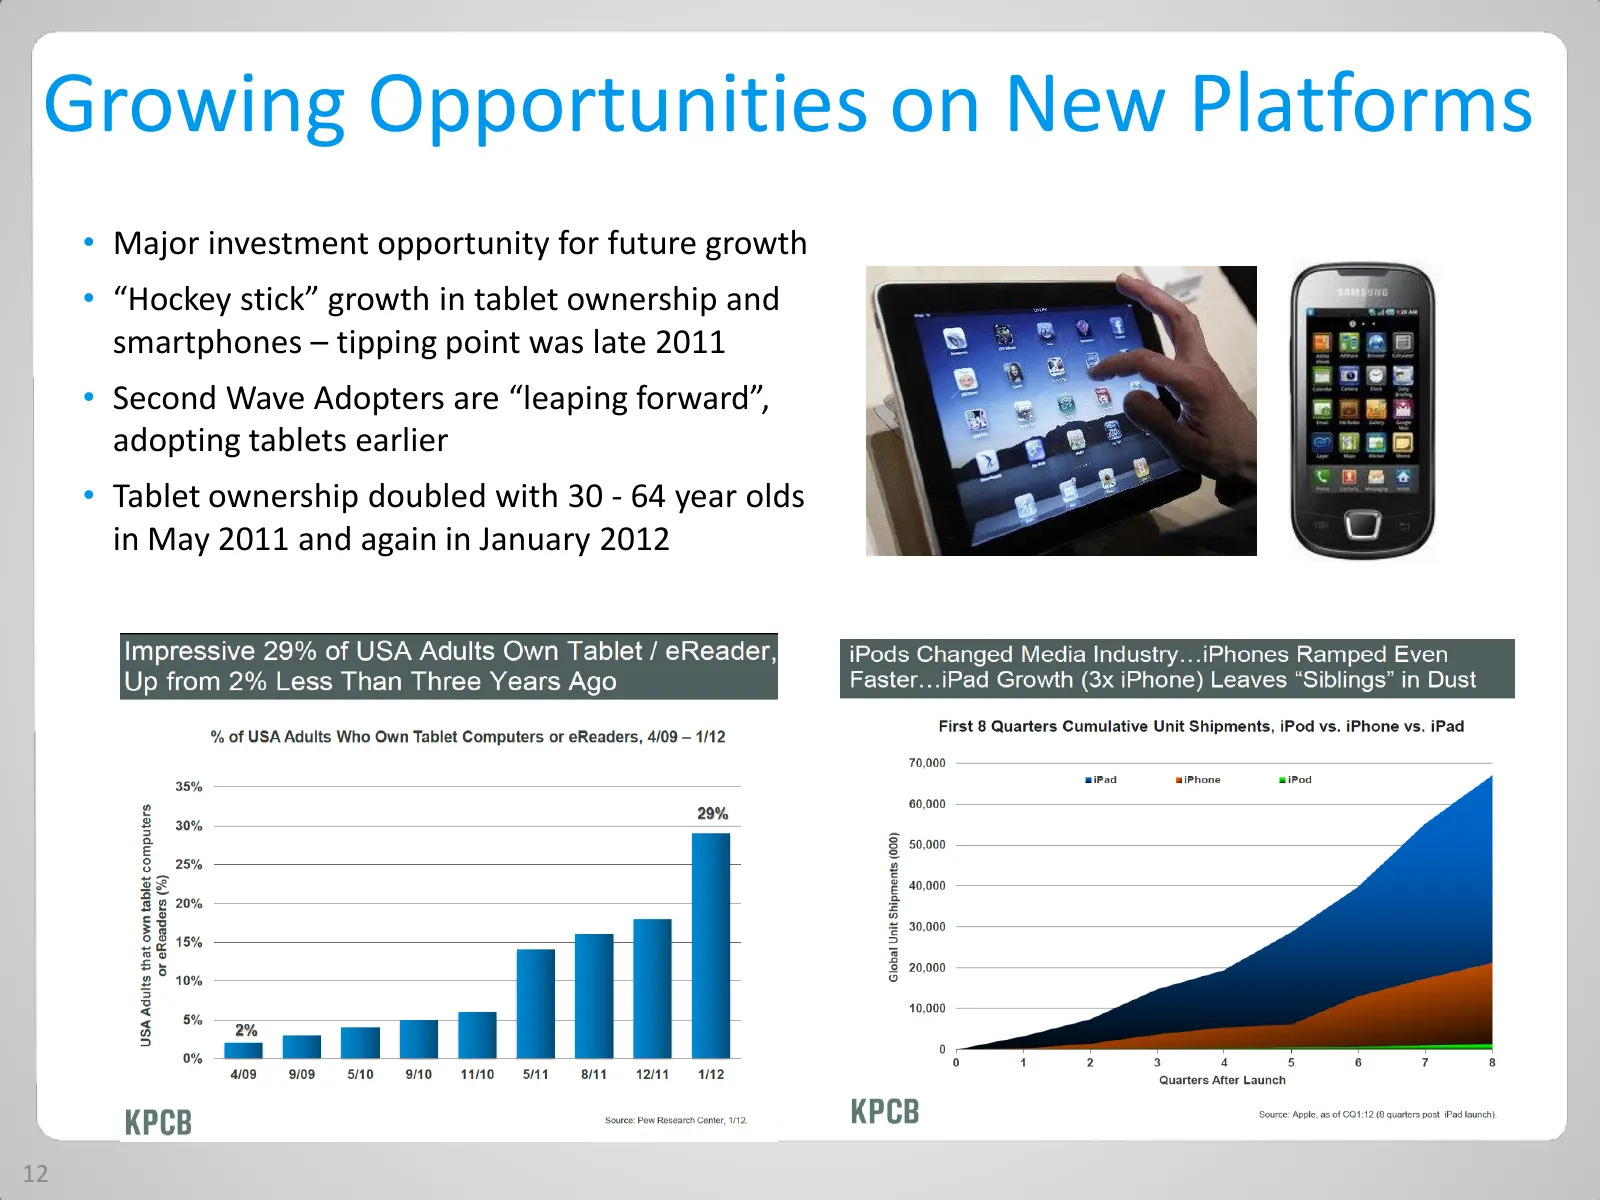
Growing Opportunities on New Platforms • Major investment opportunity for future growth • “Hockey stick” growth in tablet ownership and smartphones – tipping point was late 2011 • Second Wave Adopters are “leaping forward”, adopting tablets earlier • Tablet ownership doubled with 30 - 64 year olds i
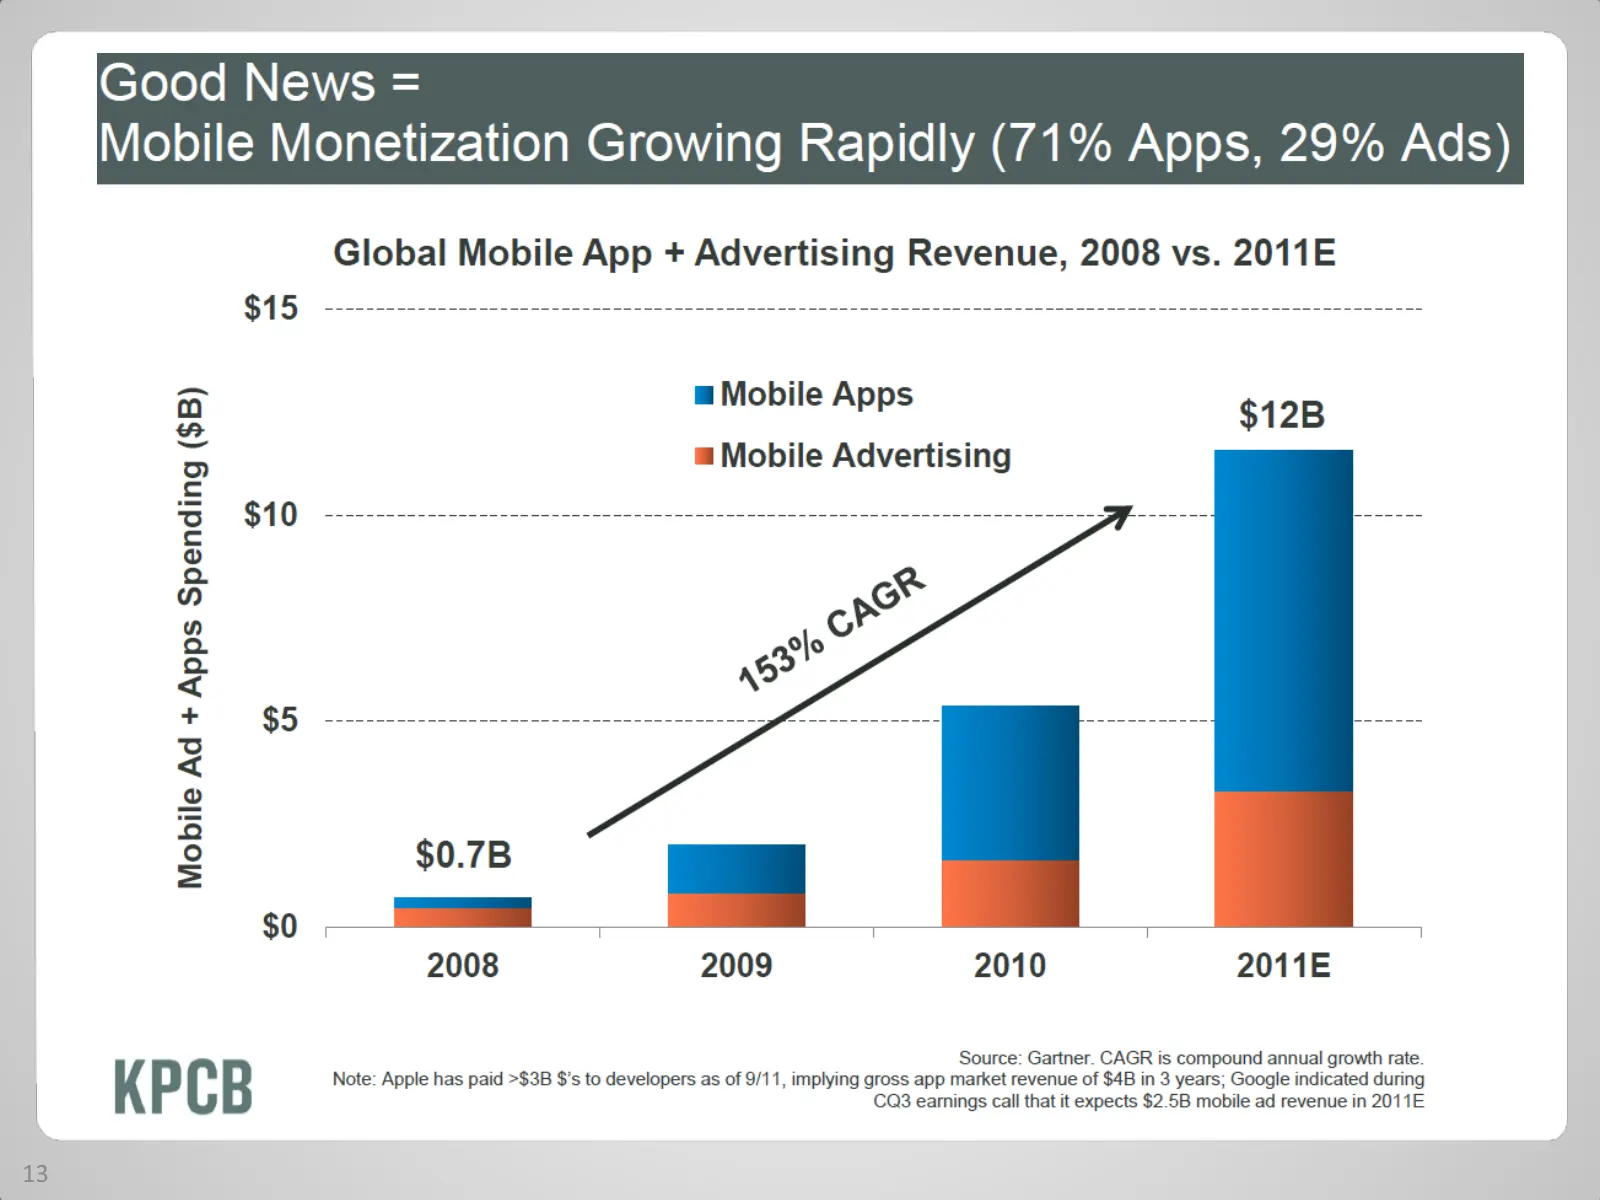
Slide 13: Good News = Mobile Monetization Growing Rapidly
13 Good News = Mobile Monetization Growing Rapidly (71% Apps, 29% Ads) Global Mobile App + Advertising Revenue, 2008 vs. 2011E oa ao = Mobile Apps ha . aoe > = Mobile Advertising S $10 -------------------------- nena nnn nnn c a R ° op? 2 sie < n® Fo GR eK z 2 io) s $0.7B _. $0 2008 2009 2010 2011E
Slide 14: Financial Overview
Financial Overview QRrion
Slide 15: Financial Highlights Non-GAAP
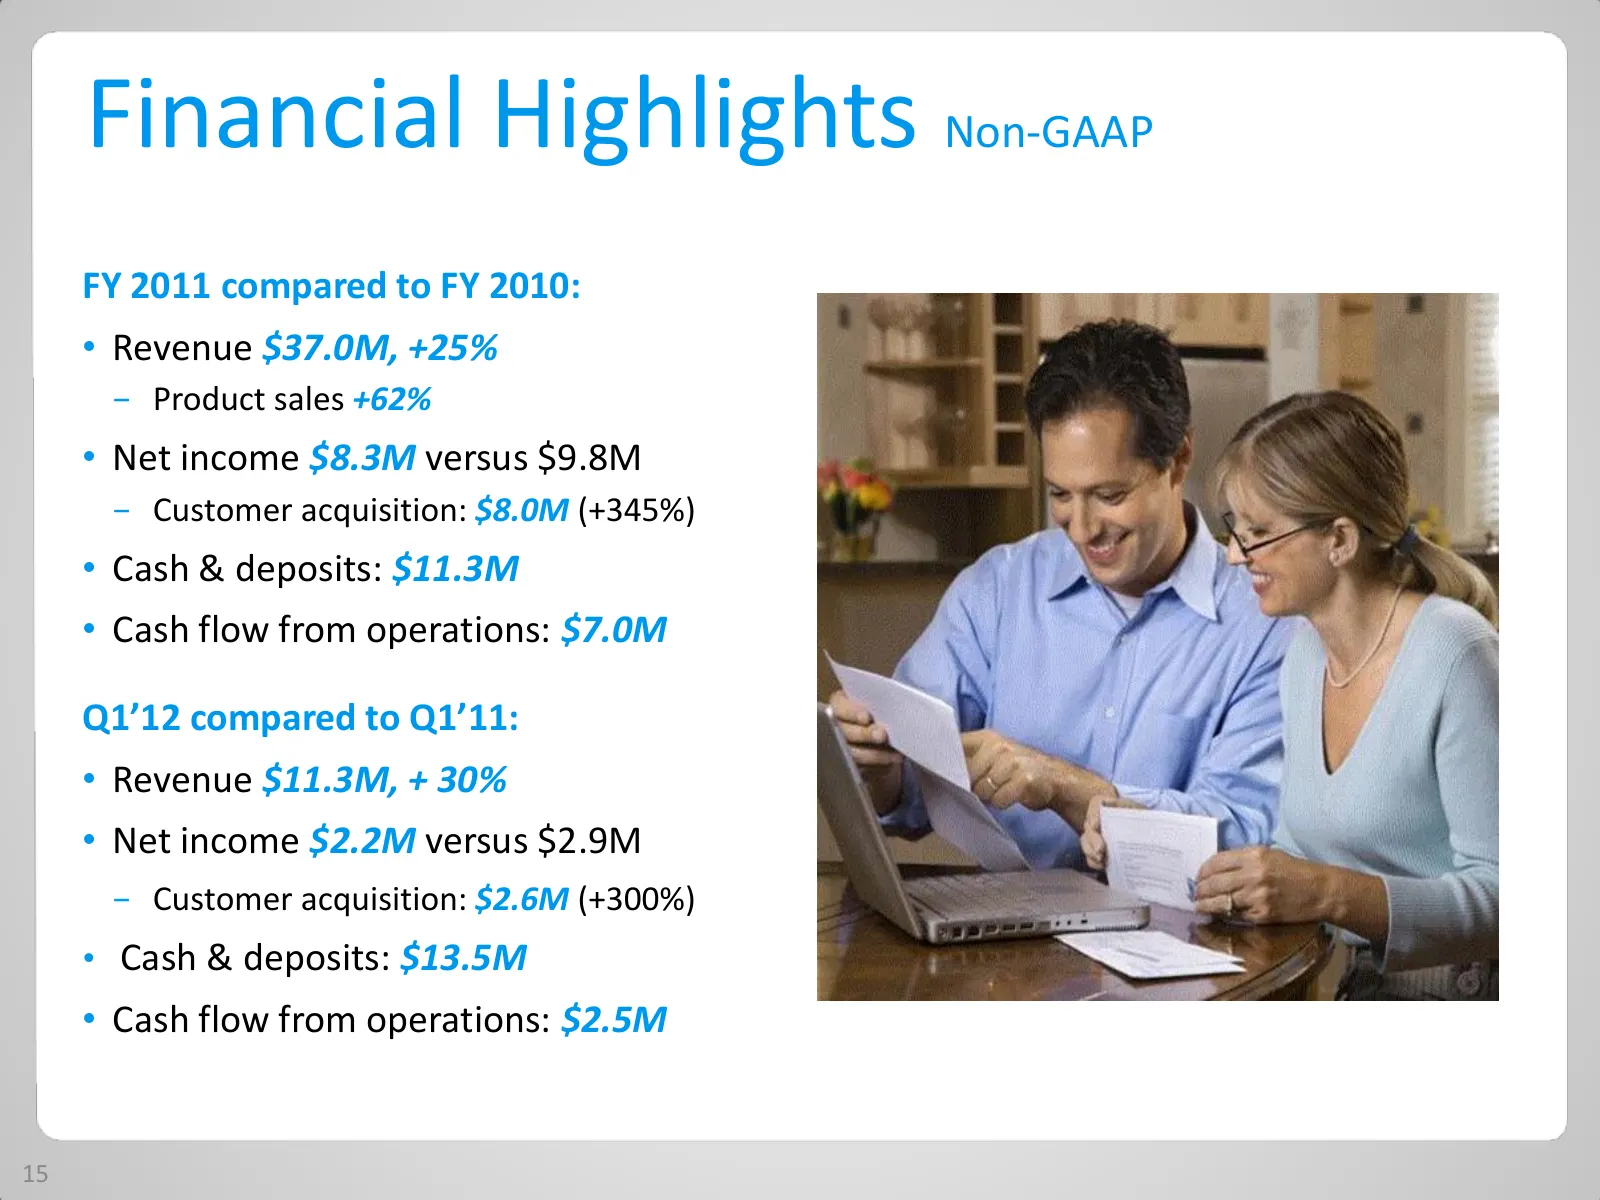
Financial Highlights Non-GAAP FY 2011 compared to FY 2010: • Revenue $37.0M, +25% − Product sales +62% • Net income $8.3M versus $9.8M − Customer acquisition: $8.0M (+345%) • Cash & deposits: $11.3M • Cash flow from operations: $7.0M Q1’12 compared to Q1’11: • Revenue $11.3M, + 30% • Net income $2.2
Slide 16: Q1'12 P&L Comparison
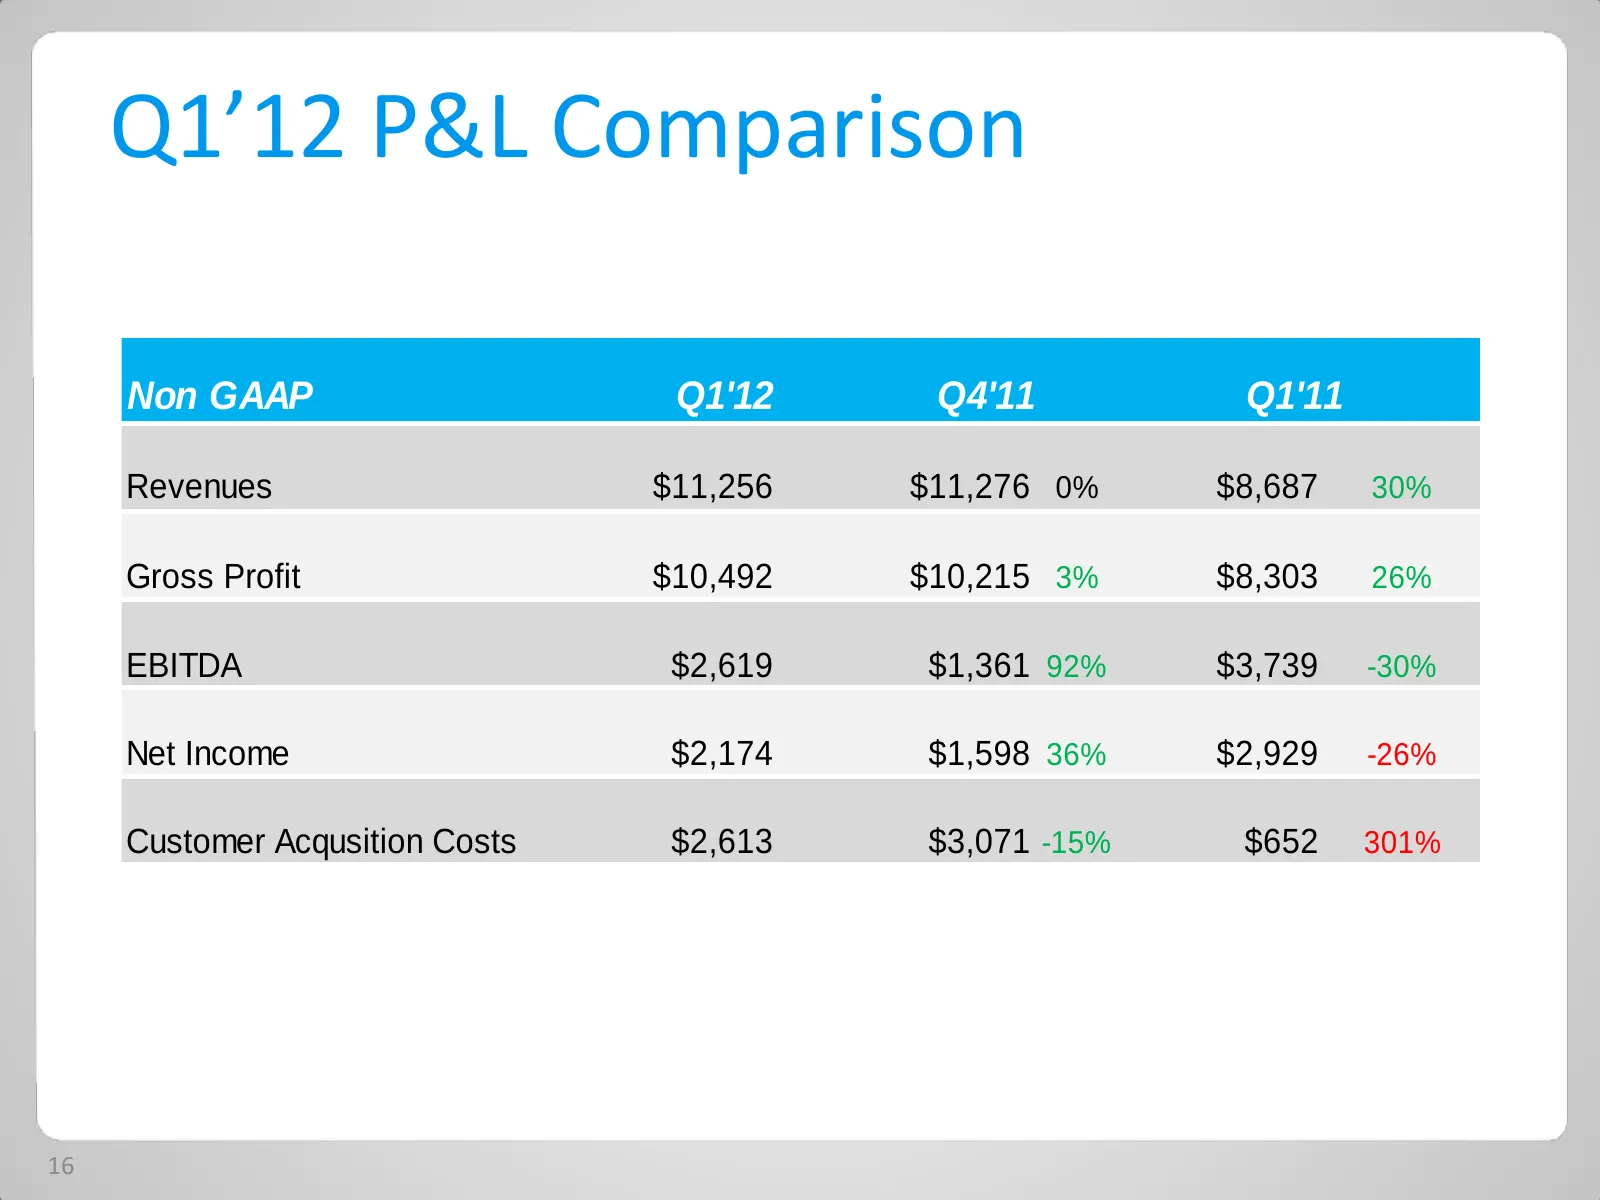
Q1’12 P&L Comparison Non GAAP Q1'12 Q4'11 Q1'11 Revenues $11,256 $11,276 0% $8,687 30% Gross Profit $10,492 $10,215 3% $8,303 26% EBITDA $2,619 $1,361 92% $3,739 -30% Net Income $2,174 $1,598 36% $2,929 -26% Customer Acqusition Costs $2,613 $3,071 -15% $652 301% 16
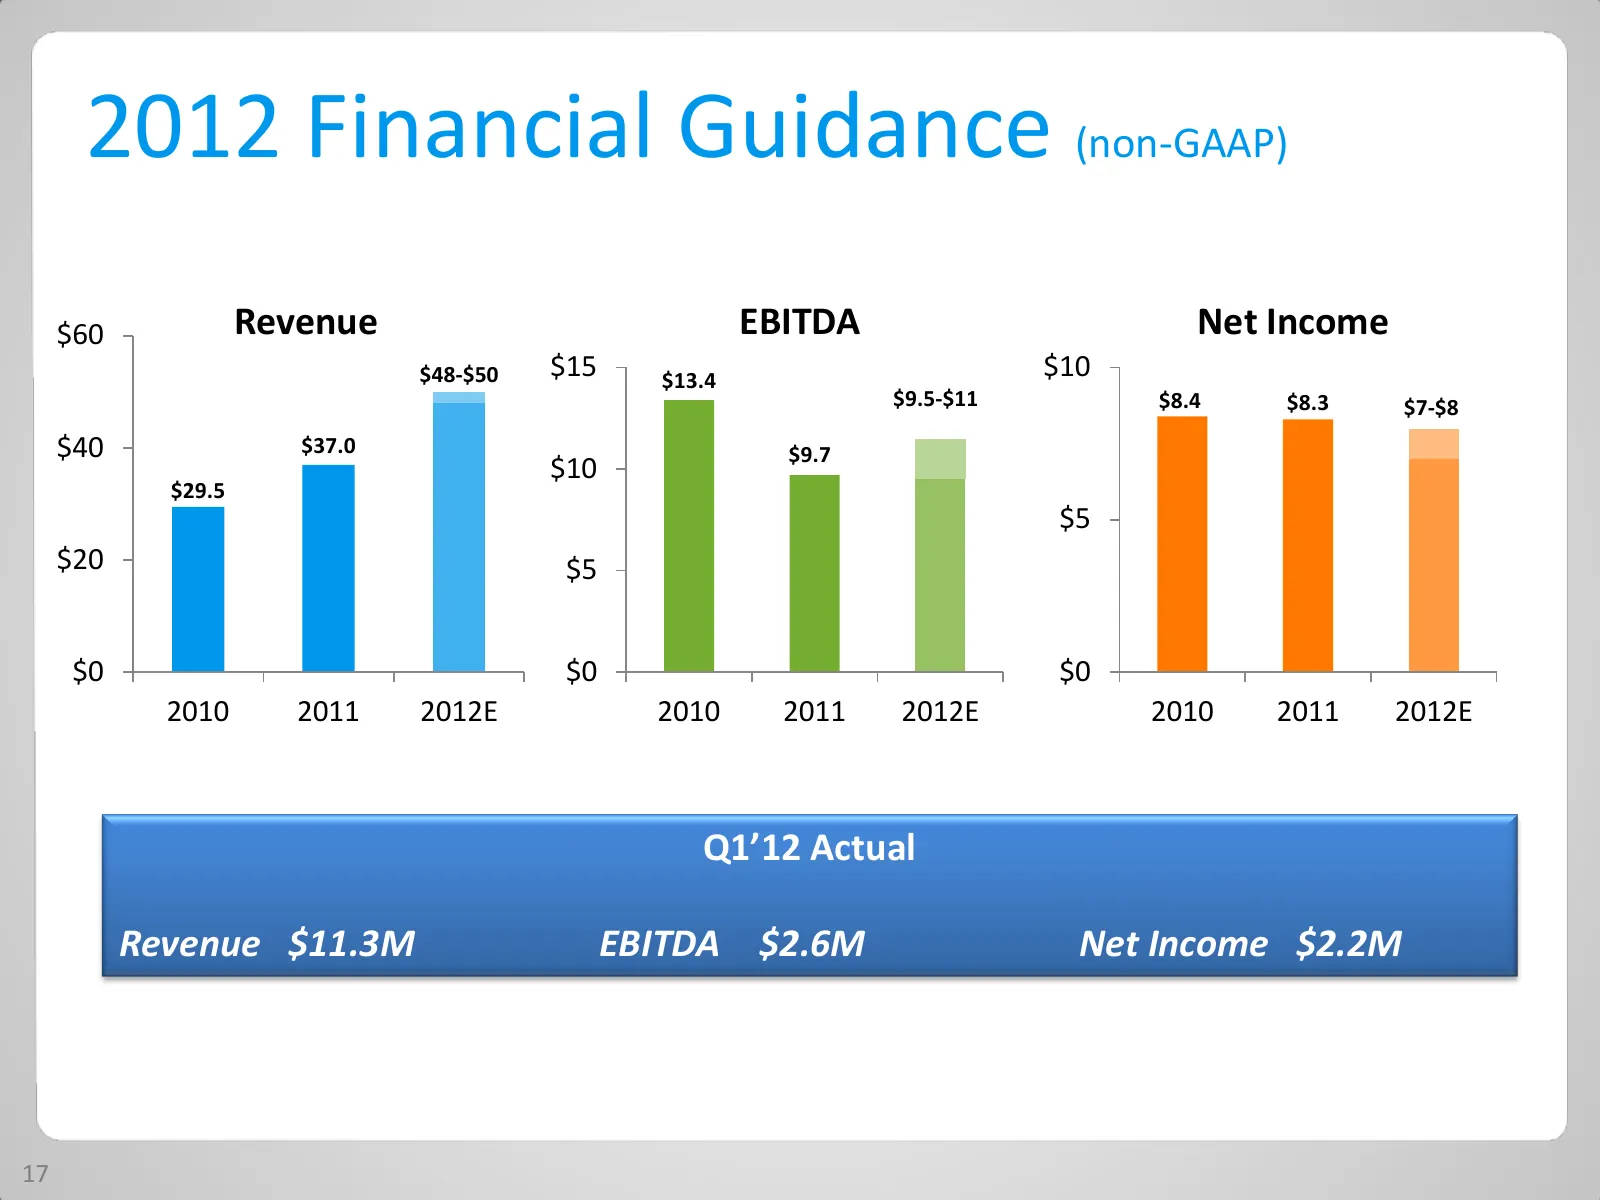
Slide 17: 2012 Financial Guidance (non-GAAP)
2012 Financial Guidance (non-GAAP) $60 Revenue EBITDA Net Income $48-$50 $15 $13.4 $10 $9.5-$11 $8.4 $8.3 $7-$8 $40 $37.0 $9.7 $10 $29.5 $5 $20 $5 $0 $0 $0 2010 2011 2012E 2010 2011 2012E 2010 2011 2012E Q1’12 Actual Revenue $11.3M EBITDA $2.6M Net Income $2.2M 17
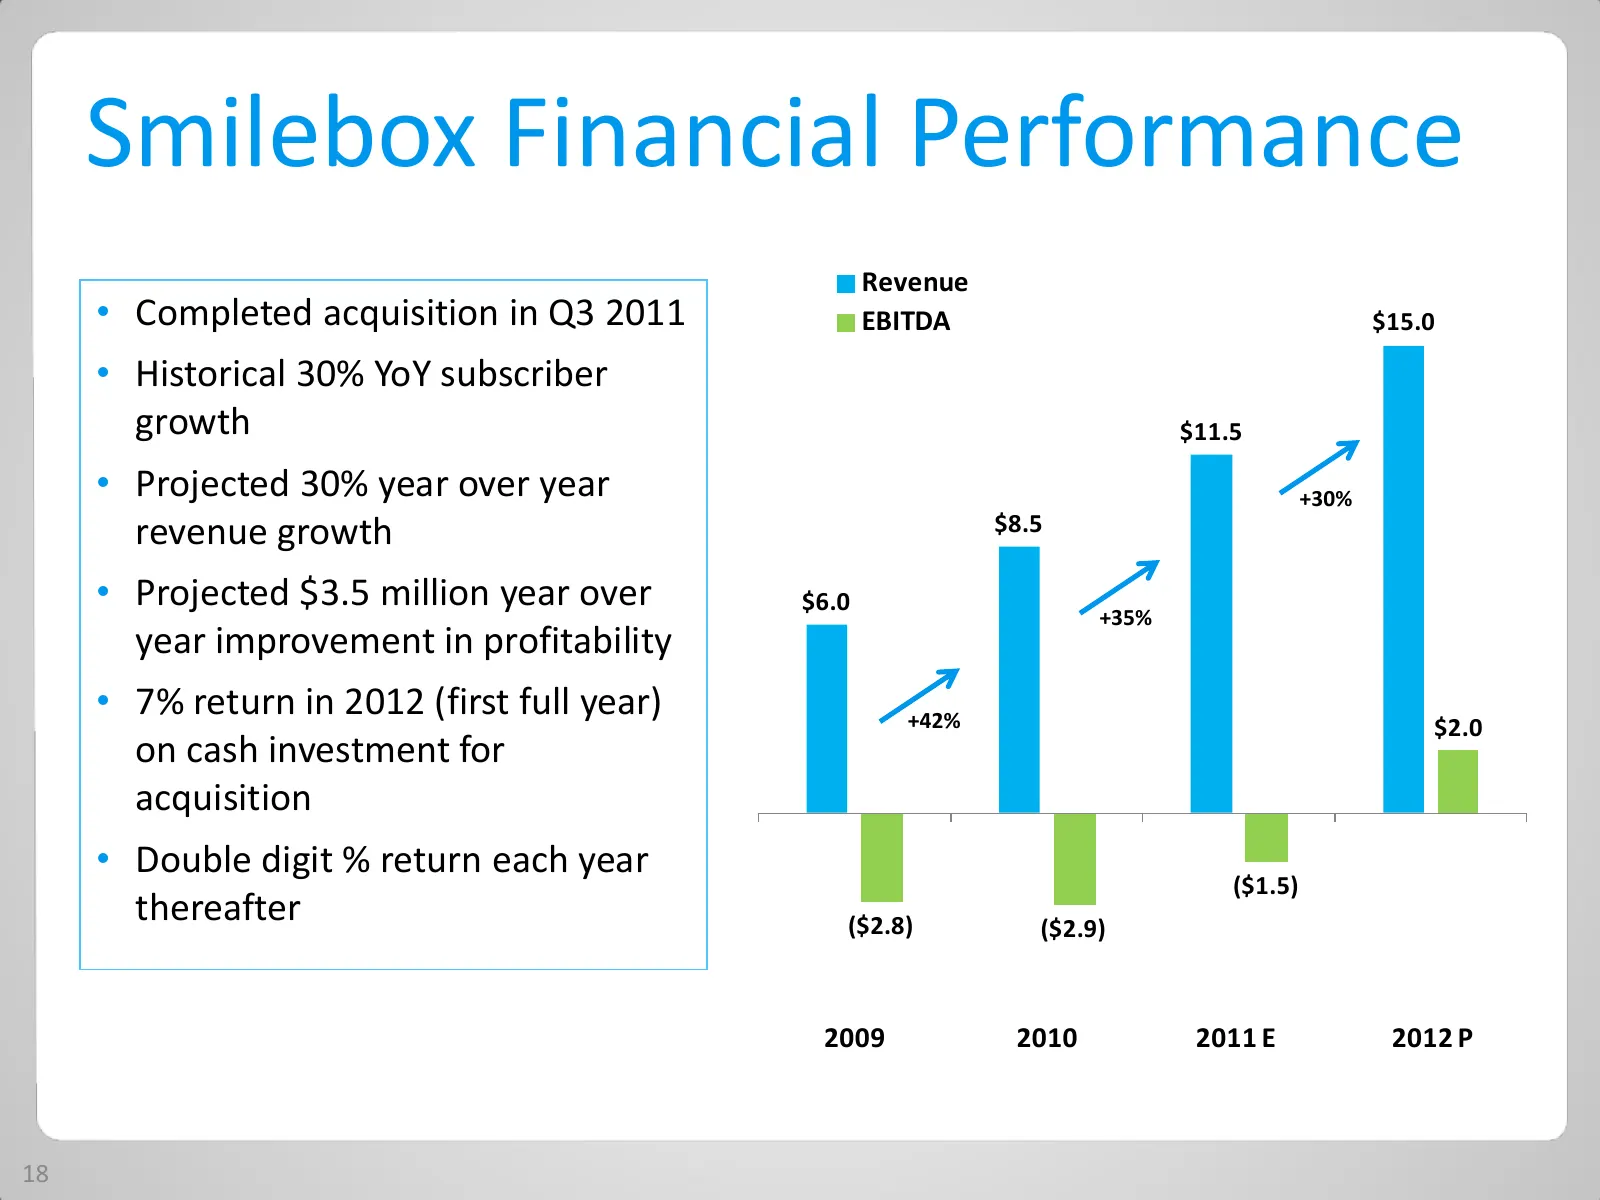
Slide 18: Smilebox Financial Performance
Smilebox Financial Performance Revenue • Completed acquisition in Q3 2011 EBITDA $15.0 • Historical 30% YoY subscriber growth $11.5 • Projected 30% year over year +30% revenue growth $8.5 • Projected $3.5 million year over $6.0 +35% year improvement in profitability • 7% return in 2012 (first full y
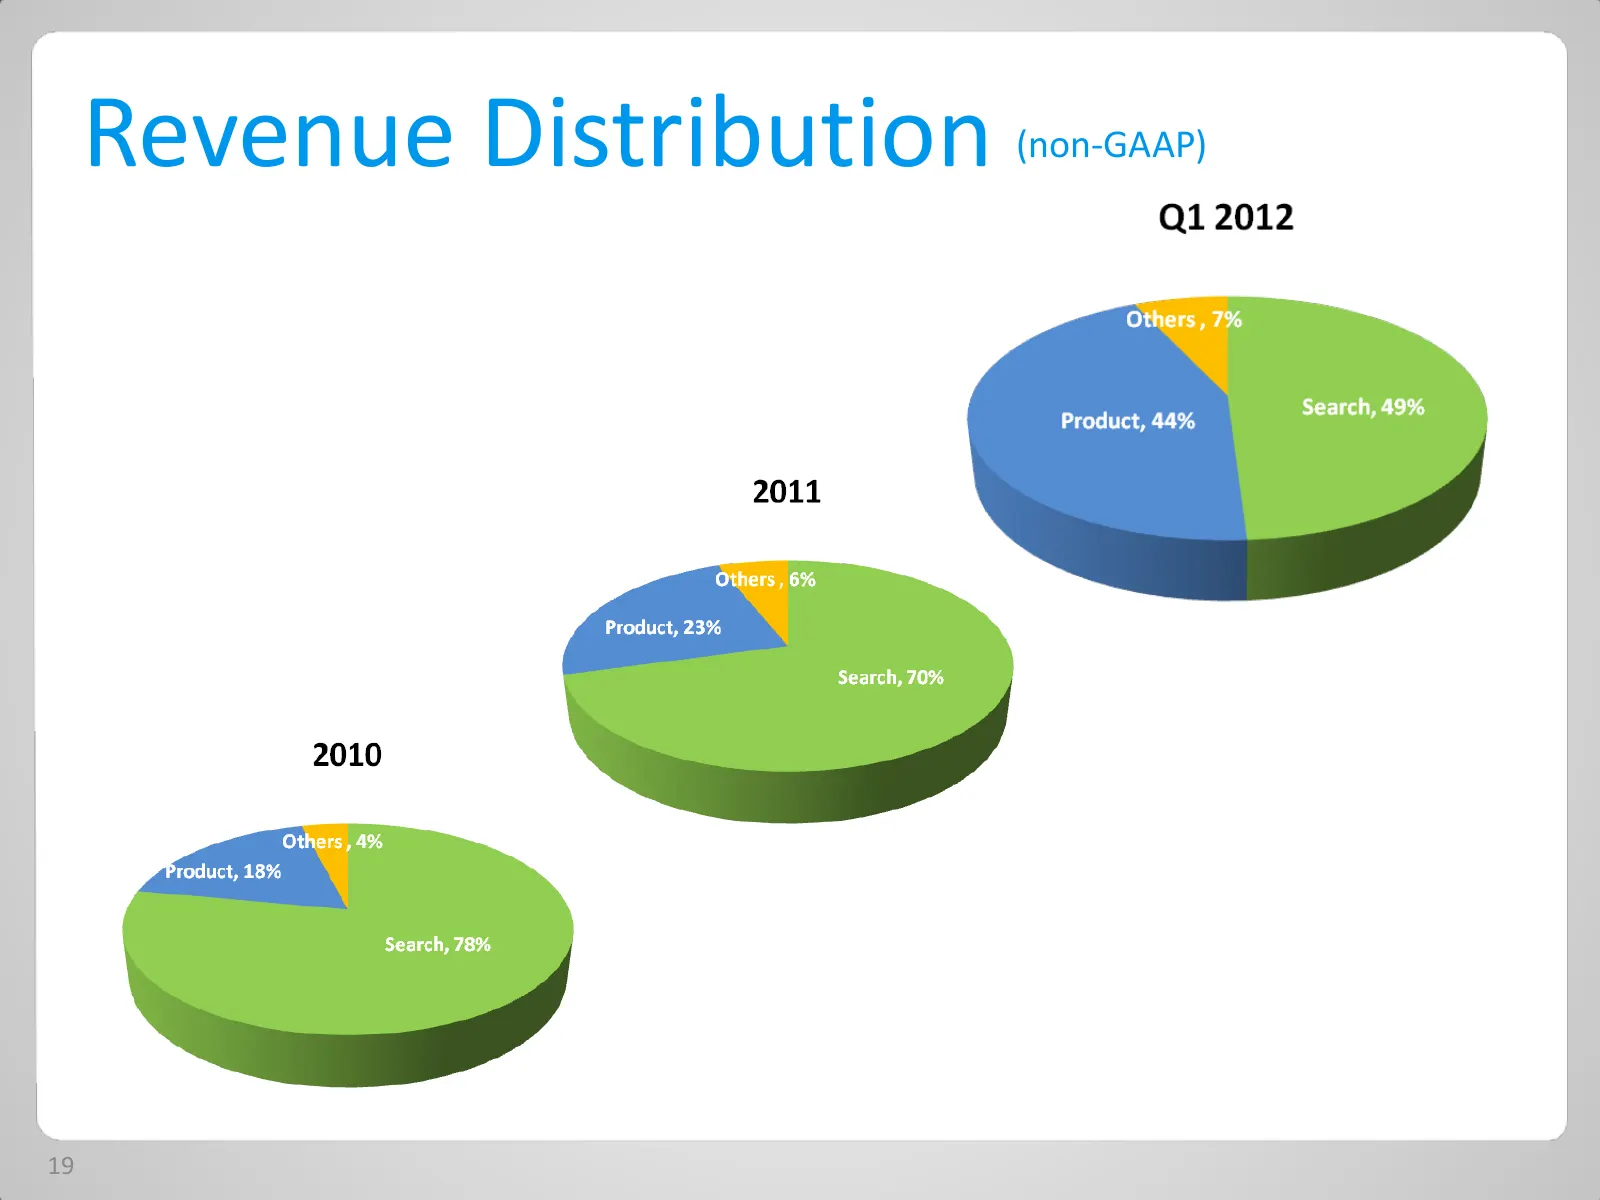
Slide 19: Revenue Distribution
Revenue Distribution (non-GAAP) 19
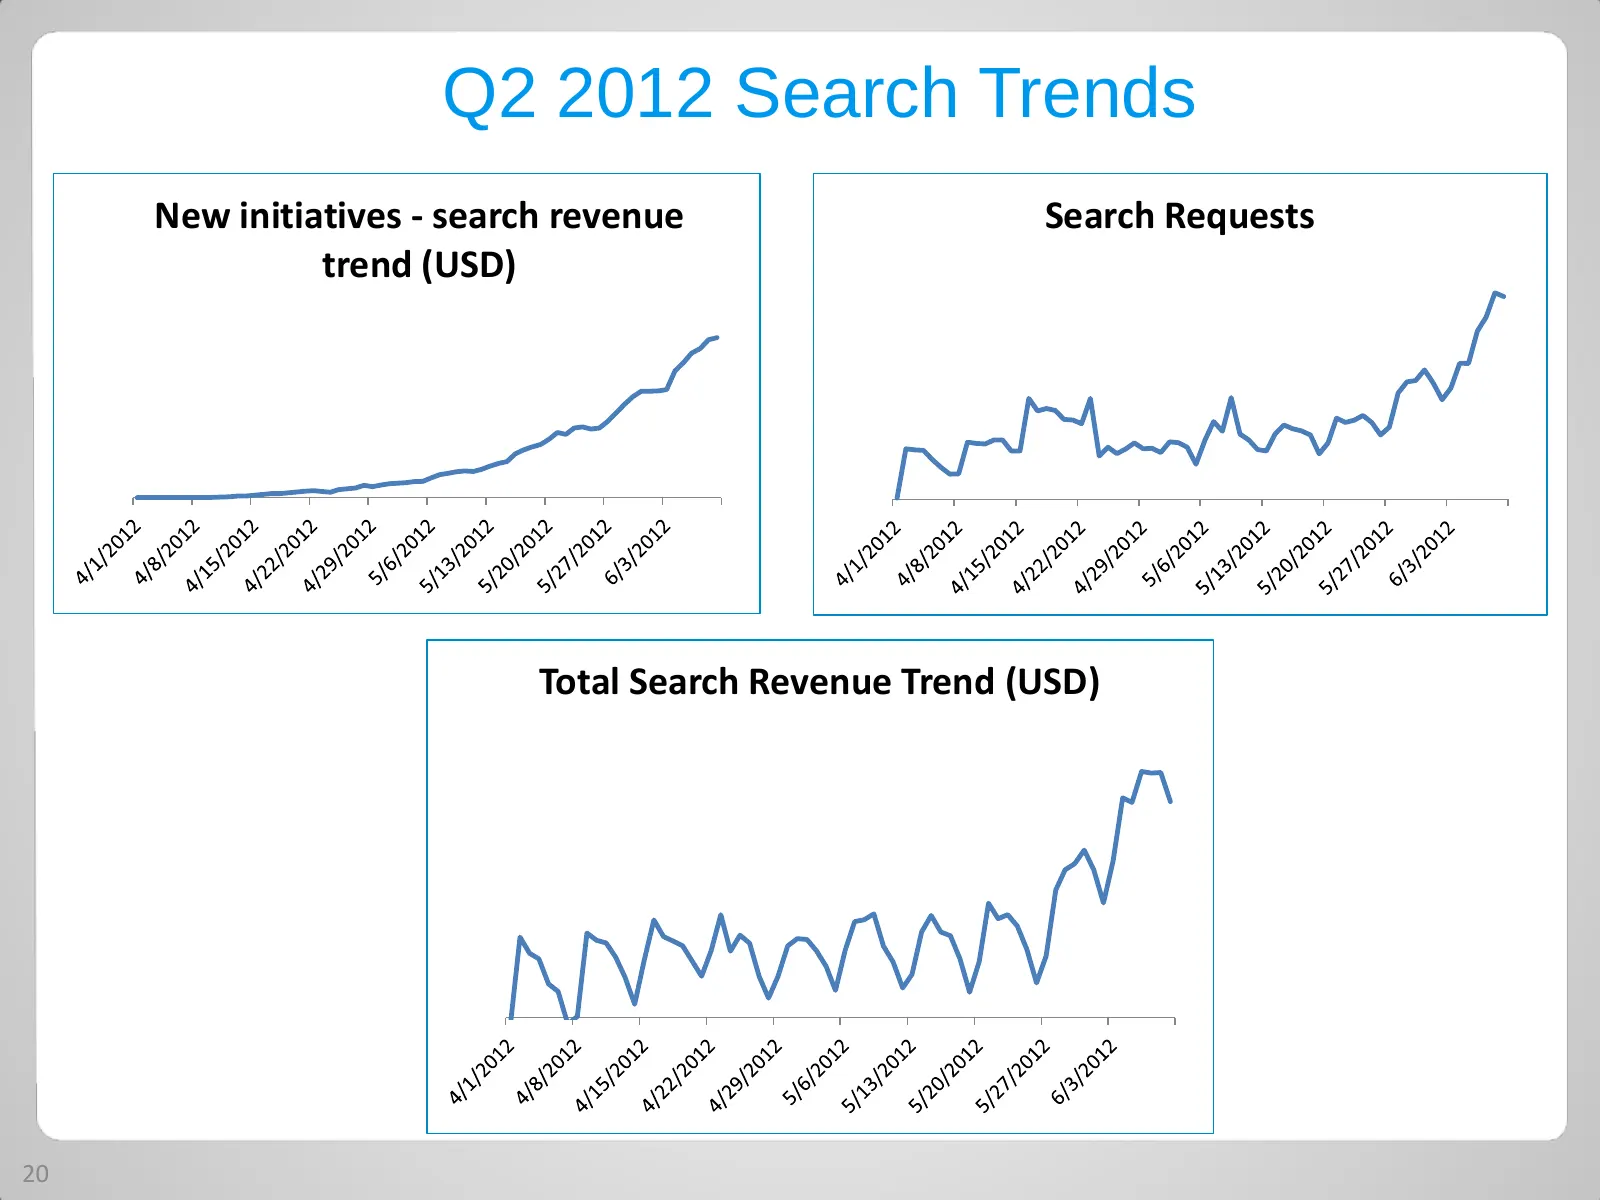
Slide 20: Q2 2012 Search Trends
Q2 2012 Search Trends New initiatives - search revenue Search Requests trend (USD) Total Search Revenue Trend (USD) 20
Slide 21: Peer Comparison
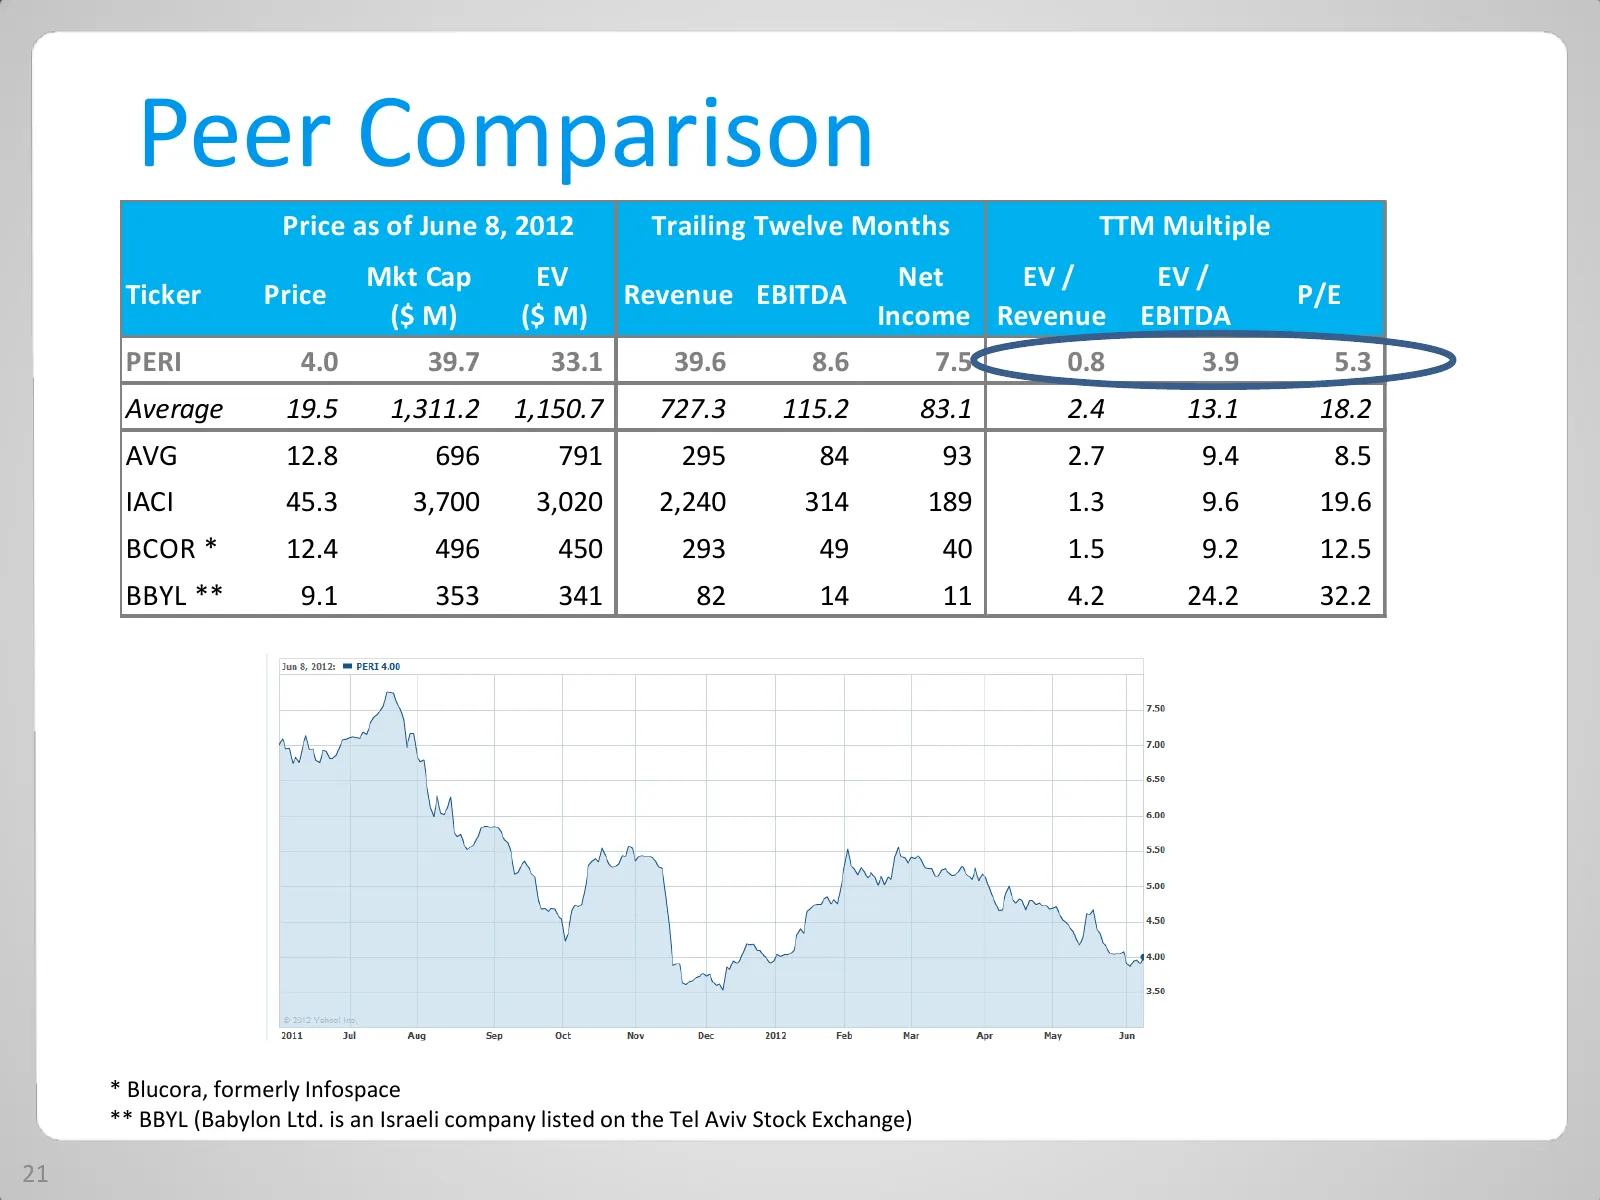
Peer Comparison Price as of June 8, 2012 Trailing Twelve Months TTM Multiple Mkt Cap EV Net EV / EV / Ticker Price Revenue EBITDA P/E ($ M) ($ M) Income Revenue EBITDA PERI 4.0 39.7 33.1 39.6 8.6 7.5 0.8 3.9 5.3 Average 19.5 1,311.2 1,150.7 727.3 115.2 83.1 2.4 13.1 18.2 AVG 12.8 696 791 295 84 93 2

Slide 22: Thank you
Thank you \ | Qrion pe"
Source: Internet Archive copy of perion.com
More decks from Perion Network Ltd
 Q2 2026 Earnings Presentation43 slides · Aug 10, 2026
 Investor Presentation (August 2026)83 slides · August 2026
 Investor Presentation (June 2026)80 slides · Jun 29, 2026
 Q1 2026 Earnings Presentation39 slides · May 20, 2026
 Q4 2025 Earnings Presentation54 slides · Feb 18, 2026
 Q3 2025 Earnings Presentation40 slides · Nov 12, 2025