Vanguard Natural Resources LLC
Vanguard Natural Resources — Investor Presentation (February 2017)
61 slides from Vanguard Natural Resources's investor presentation, Feb 2, 2017

Slide 1: Management Presentation January 2017
Management Presentation January 2017 Confidential – Prepared in connection with settlement discussions Subject to FRE 408 and similar provisions
Slide 2: Forward Looking Statements
36 32 87 89 89 89 83 141 213 168 177 182 Statements made by representatives of Vanguard Natural Resources, LLC during the course of this presentation that are not historical facts are forward looking statements. These statements are based on certain assumptions and expectations made by the Company w
Slide 3: Agenda
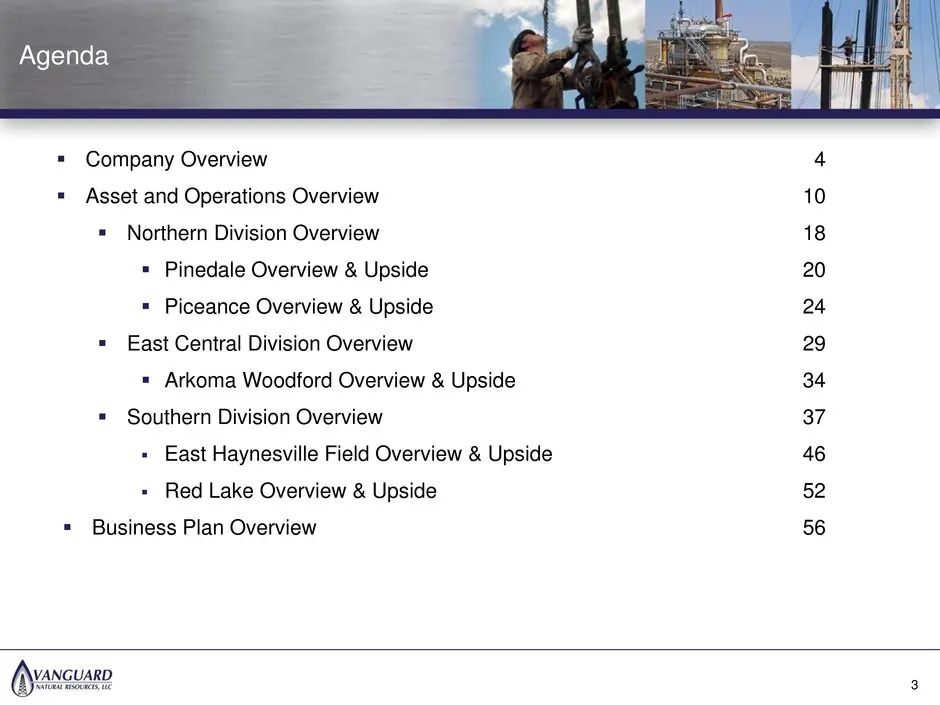
36 32 87 89 89 89 83 141 213 168 177 182 Company Overview Asset and Operations Overview Northern Division Overview Pinedale Overview & Upside Piceance Overview & Upside East Central Division Overview Arkoma Woodford Overview & Upside Southern Division Overview East Haynesville Fiel
Slide 4: Company Overview
36 32 87 89 89 89 83 141 213 168 177 182 Company Overview 4
Slide 5: Management Team
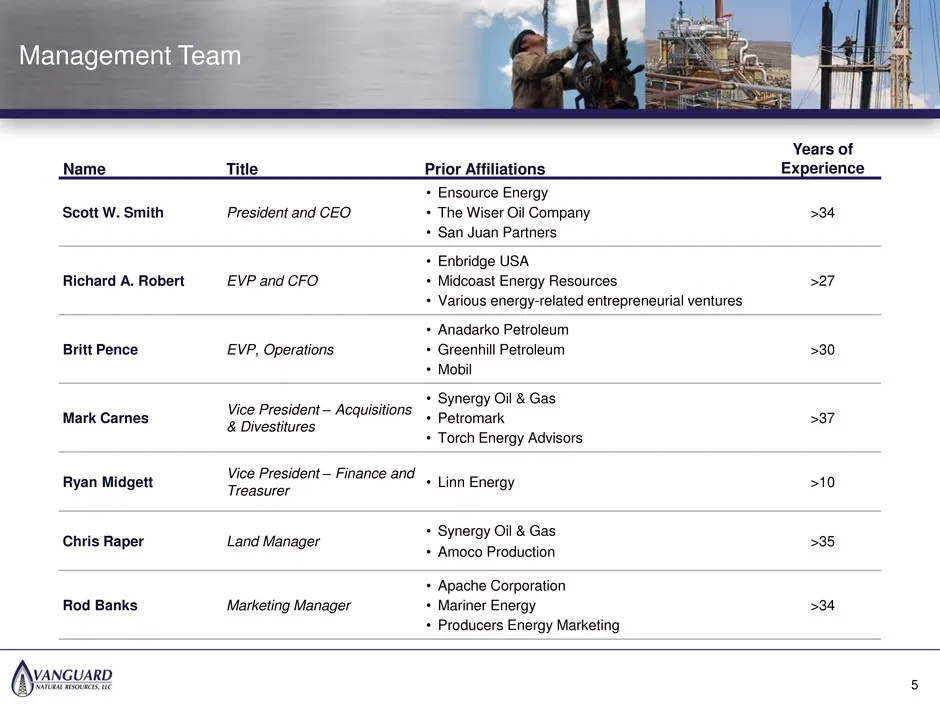
36 32 87 89 89 89 83 141 213 168 177 182 Name Title Prior Affiliations Years of Experience Scott W. Smith President and CEO • Ensource Energy • The Wiser Oil Company • San Juan Partners >34 Richard A. Robert EVP and CFO • Enbridge USA • Midcoast Energy Resources • Various energy-related entrepreneur
Slide 6: Company Highlights
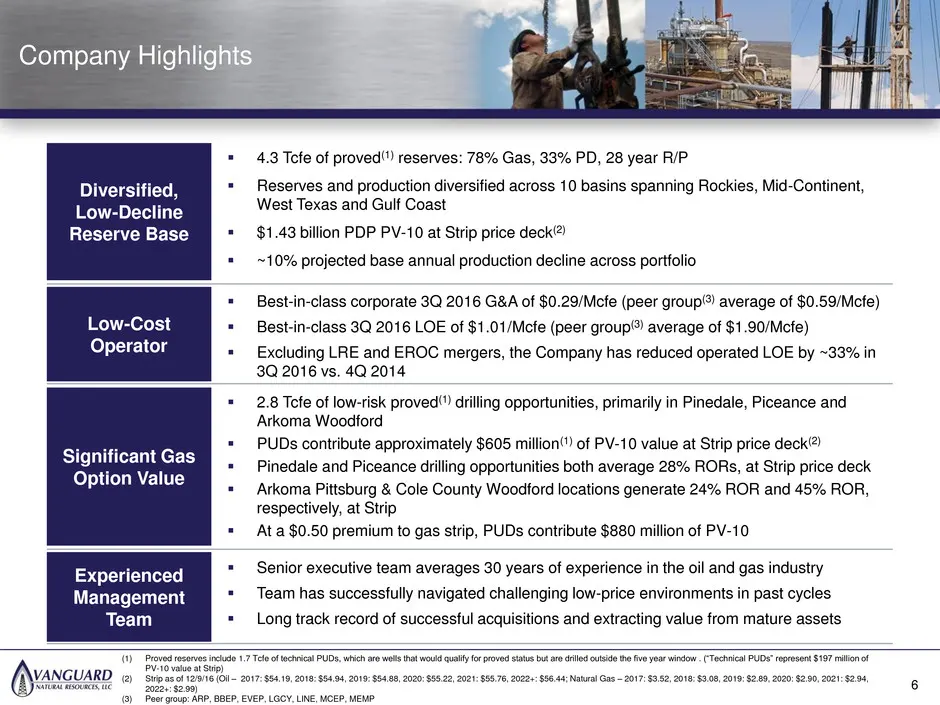
36 32 87 89 89 89 83 141 213 168 177 182 Company Highlights Low-Cost Operator Diversified, Low-Decline Reserve Base Experienced Management Team Significant Gas Option Value 4.3 Tcfe of proved(1) reserves: 78% Gas, 33% PD, 28 year R/P Reserves and production diversified across 10 basins spanning
Slide 7: Asset Profile
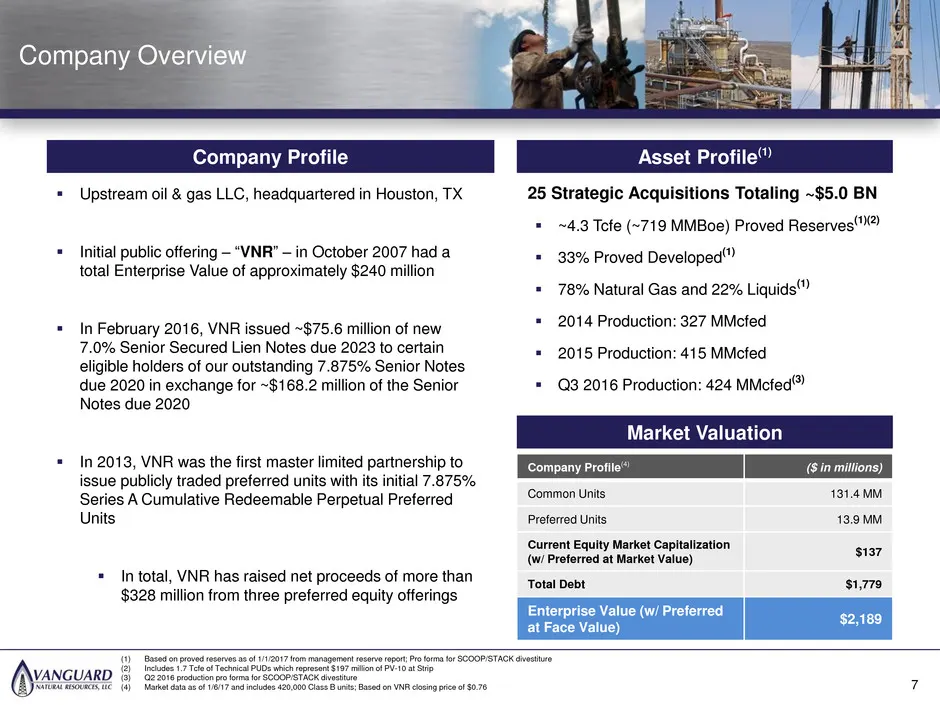
36 32 87 89 89 89 83 141 213 168 177 182 Asset Profile(1) 7 Upstream oil & gas LLC, headquartered in Houston, TX Initial public offering – “VNR” – in October 2007 had a total Enterprise Value of approximately $240 million In February 2016, VNR issued ~$75.6 million of new 7.0% Senior Secured L
Slide 8: Current Capital Structure
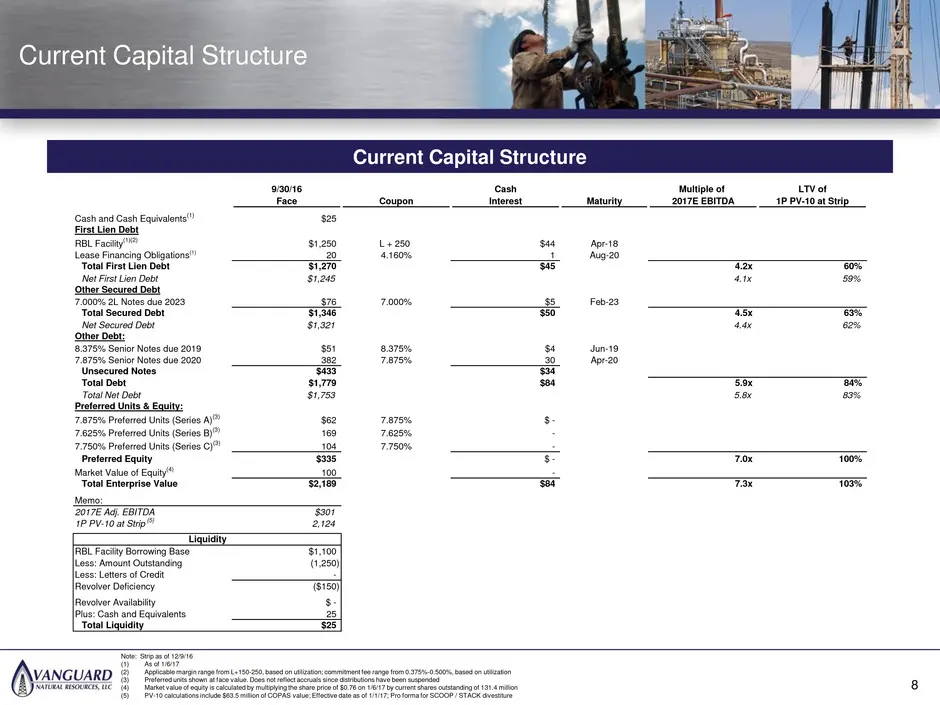
36 32 87 89 89 89 83 141 213 168 177 182 Current Capital Structure Current Capital Structure 1 8 Note: Strip as of 12/9/16 (1) As of 1/6/17 (2) Applicable margin range from L+150-250, based on utilization; commitment fee range from 0.375%-0.500%, based on utilization (3) Preferred units shown at fac
Slide 9: Significant Operating Cost Reductions Achieved Over Last 6 Quarters
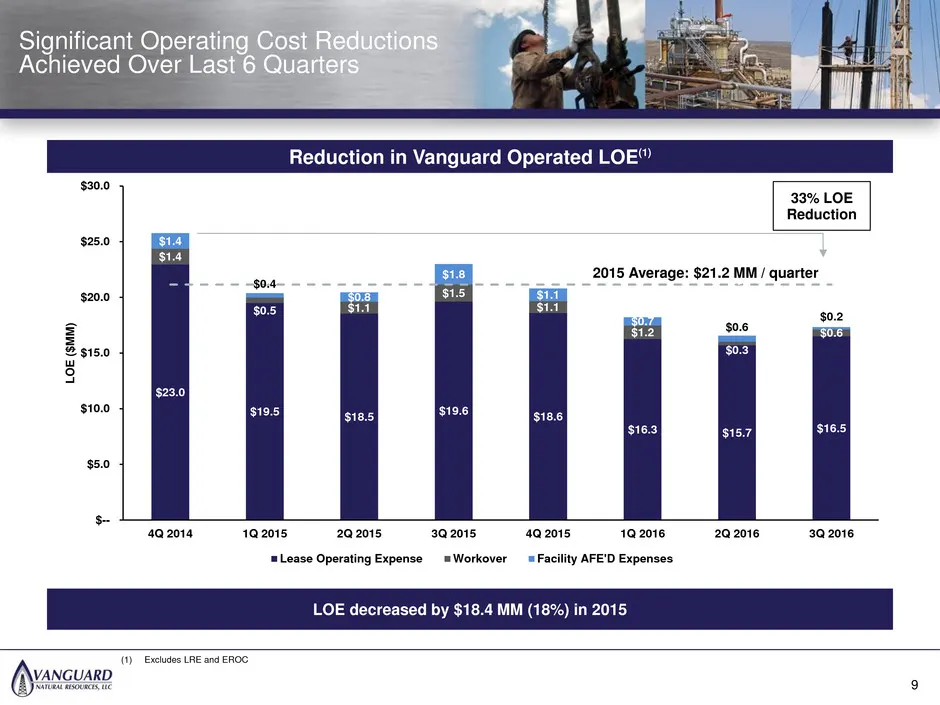
36 32 87 89 89 89 83 141 213 168 177 182 Significant Operating Cost Reductions Achieved Over Last 6 Quarters 9 (1) Excludes LRE and EROC Reduction in Vanguard Operated LOE(1) LOE decreased by $18.4 MM (18%) in 2015 $23.0 $19.5 $18.5 $19.6 $18.6 $16.3 $15.7 $16.5 $1.4 $0.5 $1.1 $1.5 $1.1 $1.2 $0.3 $0
Slide 10: Asset and Operations Overview
36 32 87 89 89 89 83 141 213 168 177 182 Asset and Operations Overview 10
Slide 11: Geographically Diversified Reserve Base
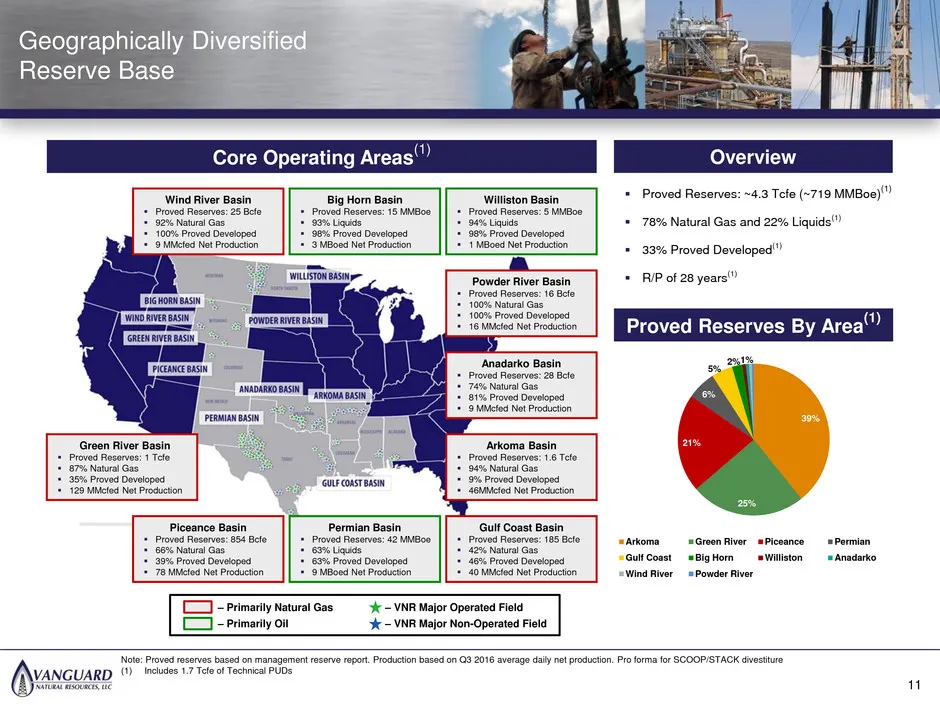
36 32 87 89 89 89 83 141 213 168 177 182 Geographically Diversified Reserve Base Core Operating Areas (1) Overview Proved Reserves By Area (1) 11 Green River Basin Proved Reserves: 1 Tcfe 87% Natural Gas 35% Proved Developed 129 MMcfed Net Production Piceance Basin Proved Reserves: 854 Bcf
Slide 12: Low-Risk Proved Reserve Base with Significant PDP Component
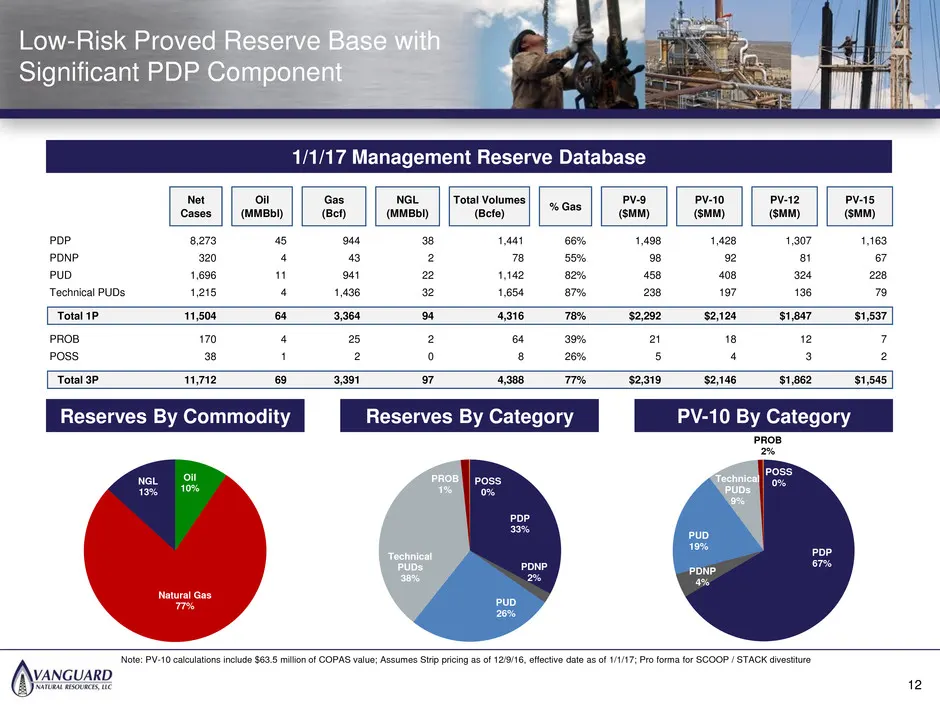
36 32 87 89 89 89 83 141 213 168 177 182 Low-Risk Proved Reserve Base with Significant PDP Component Note: PV-10 calculations include $63.5 million of COPAS value; Assumes Strip pricing as of 12/9/16, effective date as of 1/1/17; Pro forma for SCOOP / STACK divestiture 12 18 1/1/17 Management Reserv
Slide 13: Database Updates
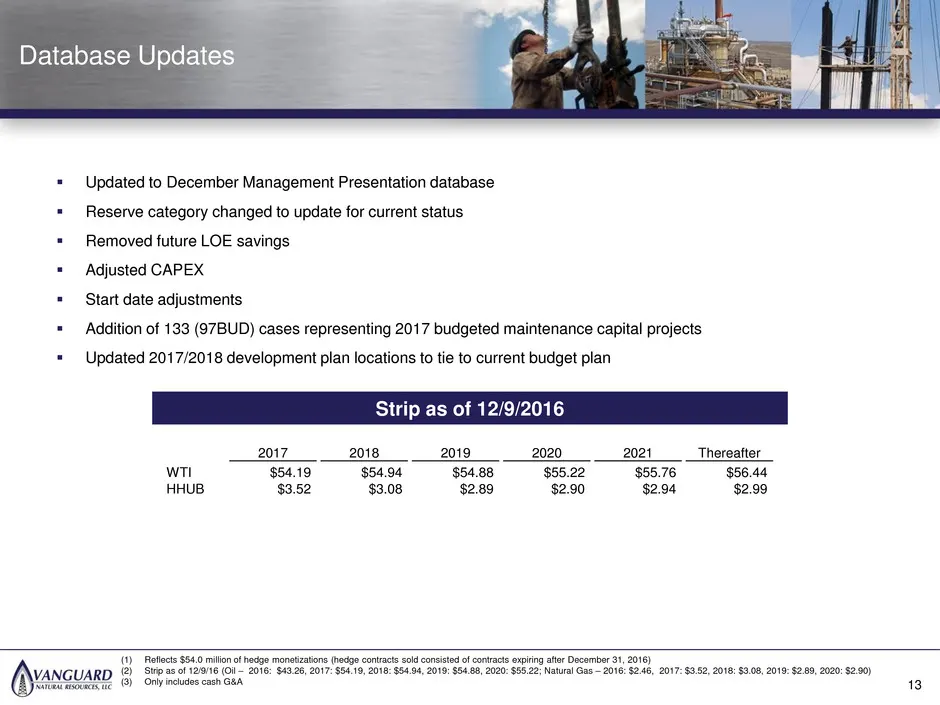
36 32 87 89 89 89 83 141 213 168 177 182 Updated to December Management Presentation database Reserve category changed to update for current status Removed future LOE savings Adjusted CAPEX Start date adjustments Addition of 133 (97BUD) cases representing 2017 budgeted maintenance capita
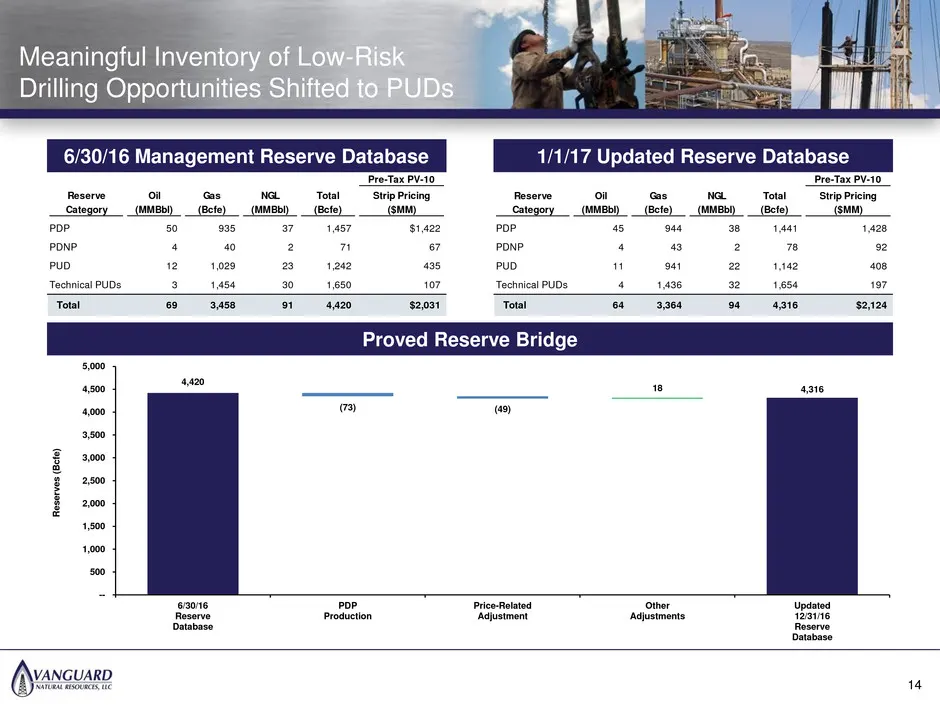
Slide 14: Meaningful Inventory of Low-Risk Drilling Opportunities Shifted to PUDs
36 32 87 89 89 89 83 141 213 168 177 182 Meaningful Inventory of Low-Risk Drilling Opportunities Shifted to PUDs 1/1/17 Updated Reserve Database Proved Reserve Bridge 6/30/16 Management Reserve Database 14 19 Pre-Tax PV-10 Reserve Oil Gas NGL Total Strip Pricing Category (MMBbl) (Bcfe) (MMBbl) (Bcfe
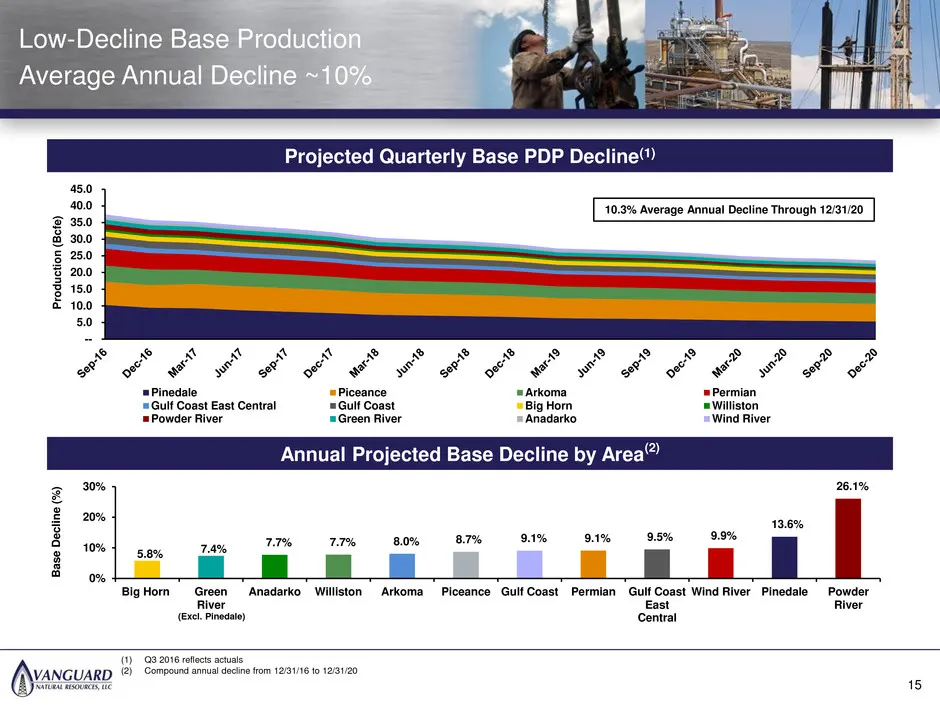
Slide 15: Low-Decline Base Production
36 32 87 89 89 89 83 141 213 168 177 182 -- 5.0 10.0 15.0 20.0 25.0 30.0 35.0 40.0 45.0 Produc tion (Bc fe) Pinedale Piceance Arkoma Permian Gulf Coast East Central Gulf Coast Big Horn Williston Powder River Green River Anadarko Wind River 10.3% Average Annual Decline Through 12/31/20 Low-Decline Ba
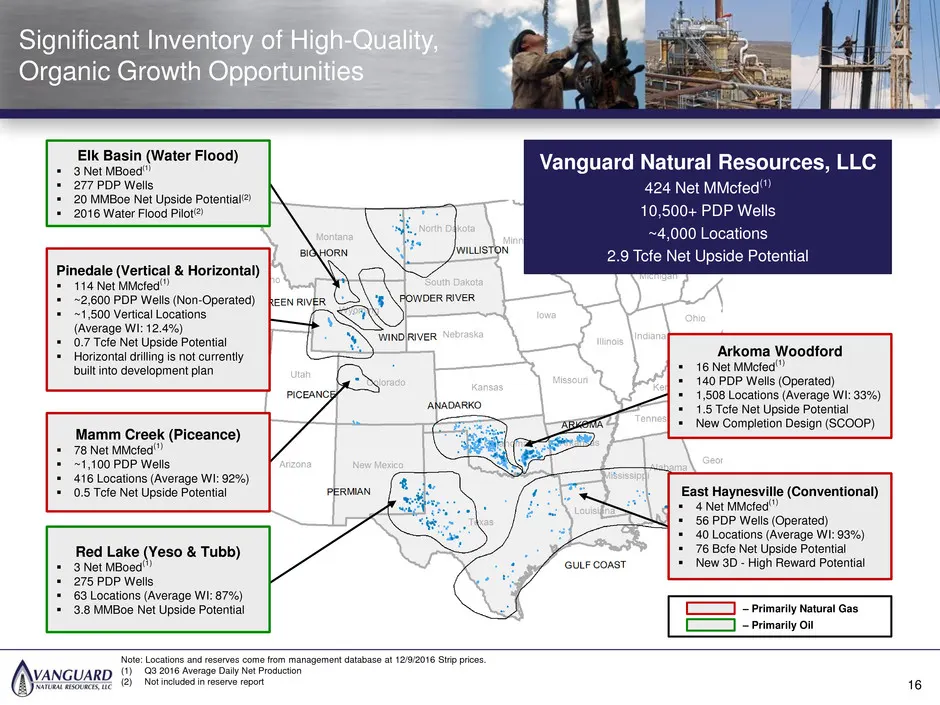
Slide 16: Significant Inventory of High-Quality, Organic Growth Opportunities
36 32 87 89 89 89 83 141 213 168 177 182 Significant Inventory of High-Quality, Organic Growth Opportunities Note: Locations and reserves come from management database at 12/9/2016 Strip prices. (1) Q3 2016 Average Daily Net Production (2) Not included in reserve report – Primarily Natural Gas – Pri
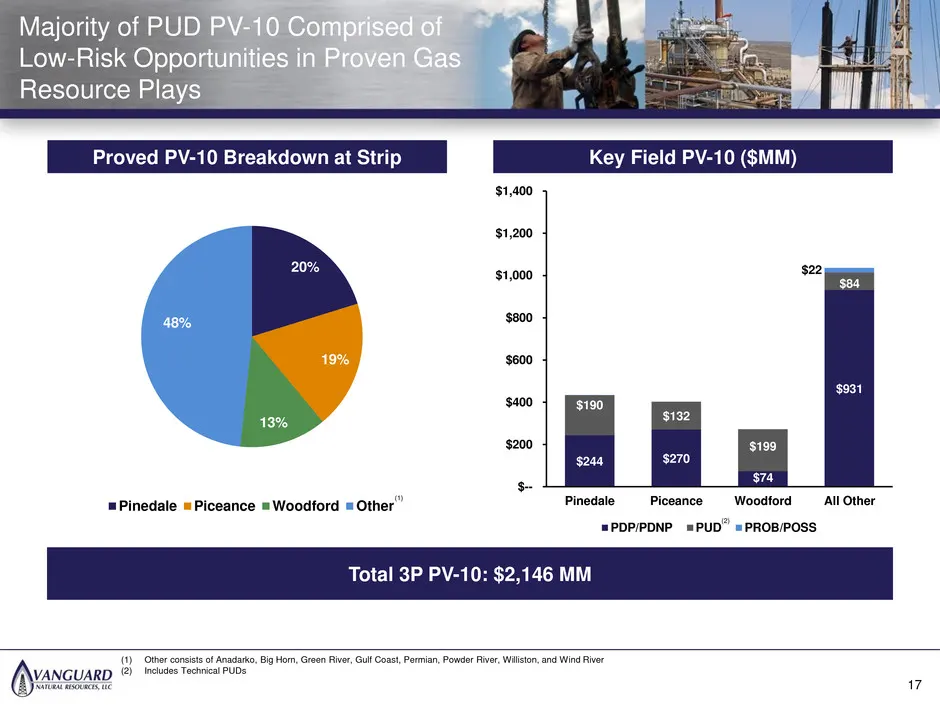
Slide 17: Majority of PUD PV-10 Comprised of Low-Risk Opportunities
36 32 87 89 89 89 83 141 213 168 177 182 Majority of PUD PV-10 Comprised of Low-Risk Opportunities in Proven Gas Resource Plays Key Field PV-10 ($MM) Proved PV-10 Breakdown at Strip 17 26 (1) (1) Other consists of Anadarko, Big Horn, Green River, Gulf Coast, Permian, Powder River, Williston, and Win
Slide 18: Northern Division Overview
36 32 87 89 89 89 83 141 213 168 177 182 Northern Division Overview 18
Slide 19: Northern Division Overview
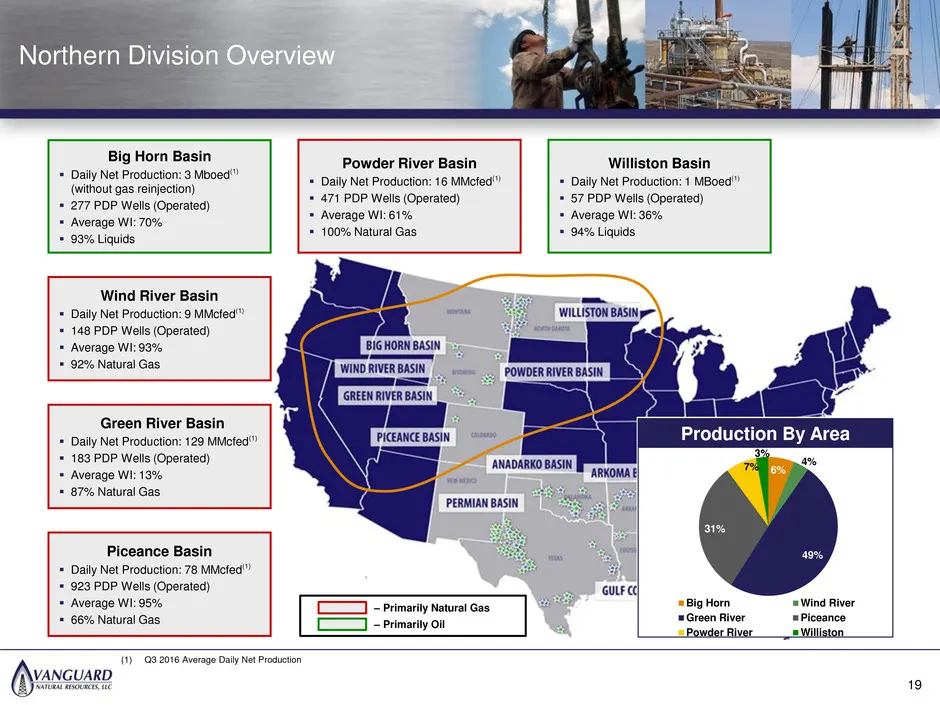
36 32 87 89 89 89 83 141 213 168 177 182 Northern Division Overview – Primarily Natural Gas – Primarily Oil Production By Area Production By Area 6% 4% 49% 31% 7% 3% Big Horn Wind River Green River Piceance Powder River Williston 19 (1) Q3 2016 Average Daily Net Production Piceance Basin Daily Net
Slide 20: Pinedale Overview & Upside
36 32 87 89 89 89 83 141 213 168 177 182 Pinedale Overview & Upside 20
Slide 21: Pinedale Field Overview
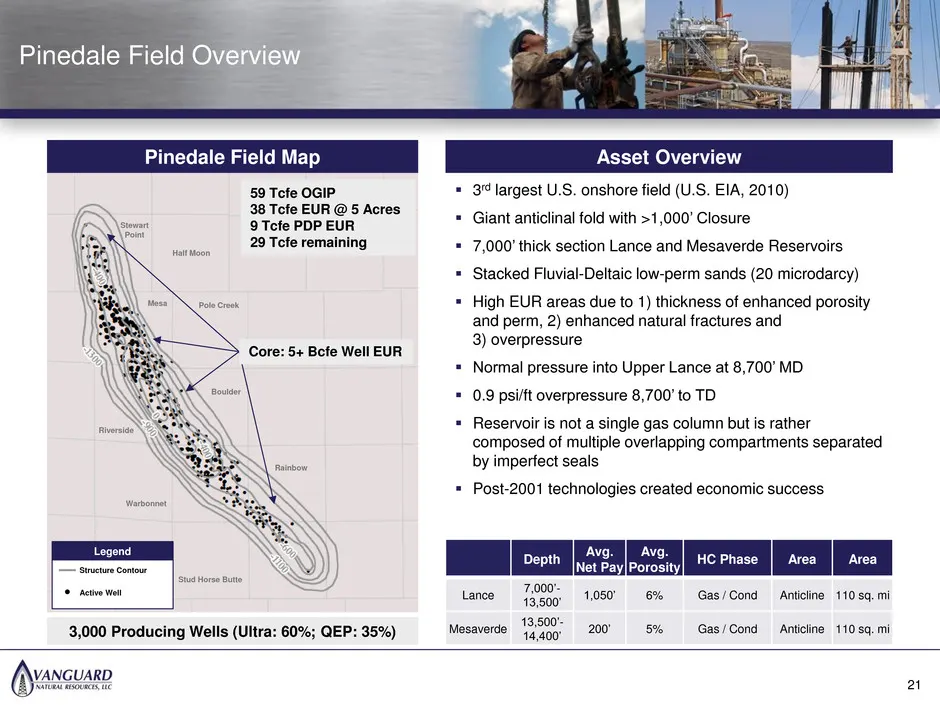
36 32 87 89 89 89 83 141 213 168 177 182 Pinedale Field Overview 3rd largest U.S. onshore field (U.S. EIA, 2010) Giant anticlinal fold with >1,000’ Closure 7,000’ thick section Lance and Mesaverde Reservoirs Stacked Fluvial-Deltaic low-perm sands (20 microdarcy) High EUR areas due to 1) th
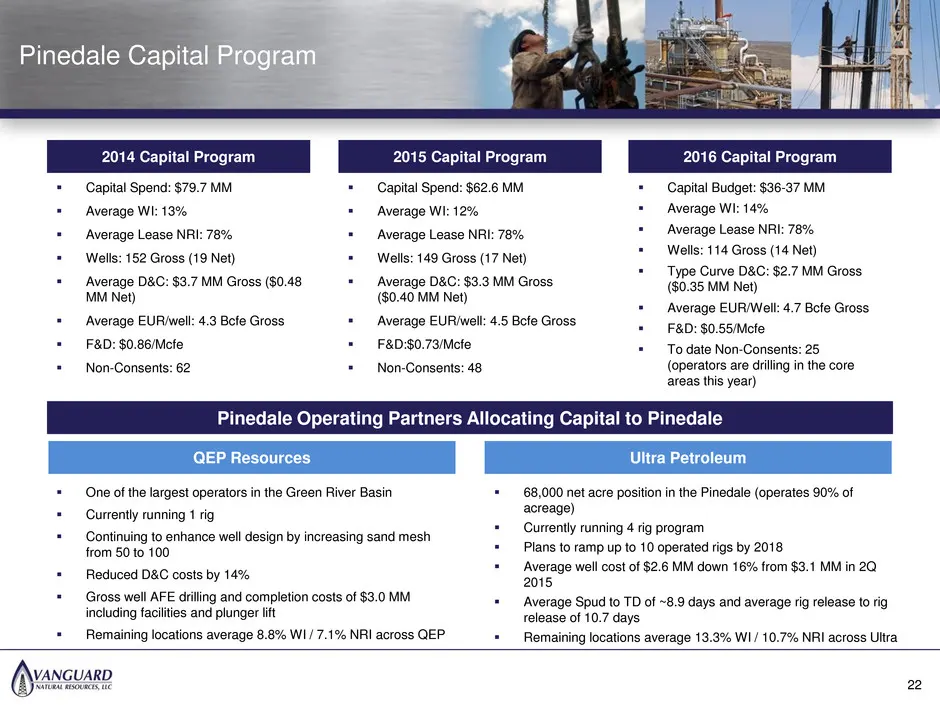
Slide 22: Pinedale Capital Program
36 32 87 89 89 89 83 141 213 168 177 182 Pinedale Capital Program Capital Spend: $79.7 MM Average WI: 13% Average Lease NRI: 78% Wells: 152 Gross (19 Net) Average D&C: $3.7 MM Gross ($0.48 MM Net) Average EUR/well: 4.3 Bcfe Gross F&D: $0.86/Mcfe Non-Consents: 62 2016 Capital Program
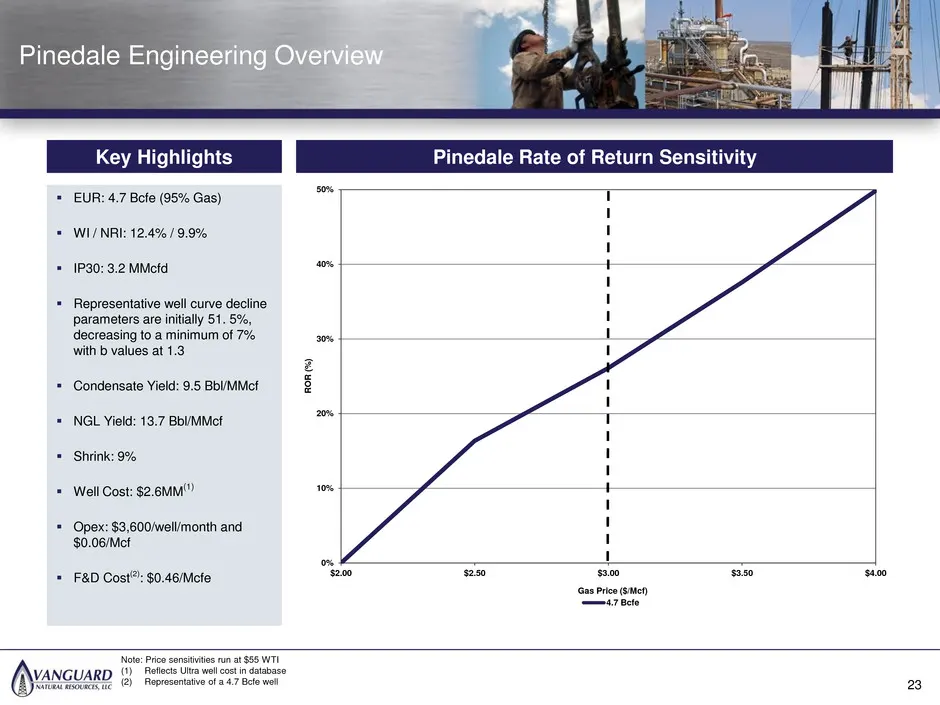
Slide 23: Pinedale Engineering Overview and Rate of Return Sensitivity
36 32 87 89 89 89 83 141 213 168 177 182 EUR: 4.7 Bcfe (95% Gas) WI / NRI: 12.4% / 9.9% IP30: 3.2 MMcfd Representative well curve decline parameters are initially 51. 5%, decreasing to a minimum of 7% with b values at 1.3 Condensate Yield: 9.5 Bbl/MMcf NGL Yield: 13.7 Bbl/MMcf Shrink:
Slide 24: Piceance Overview & Upside
36 32 87 89 89 89 83 141 213 168 177 182 Piceance Overview & Upside 24
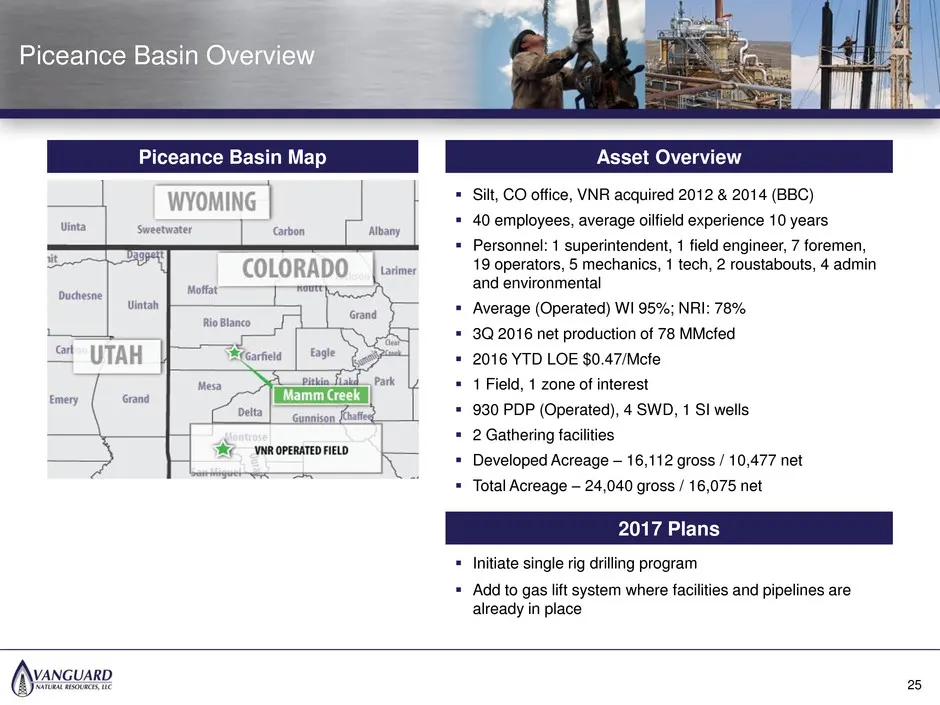
Slide 25: Piceance Basin Overview
36 32 87 89 89 89 83 141 213 168 177 182 Piceance Basin Overview Piceance Basin Map Asset Overview Initiate single rig drilling program Add to gas lift system where facilities and pipelines are already in place 25 Silt, CO office, VNR acquired 2012 & 2014 (BBC) 40 employees, average oilfield
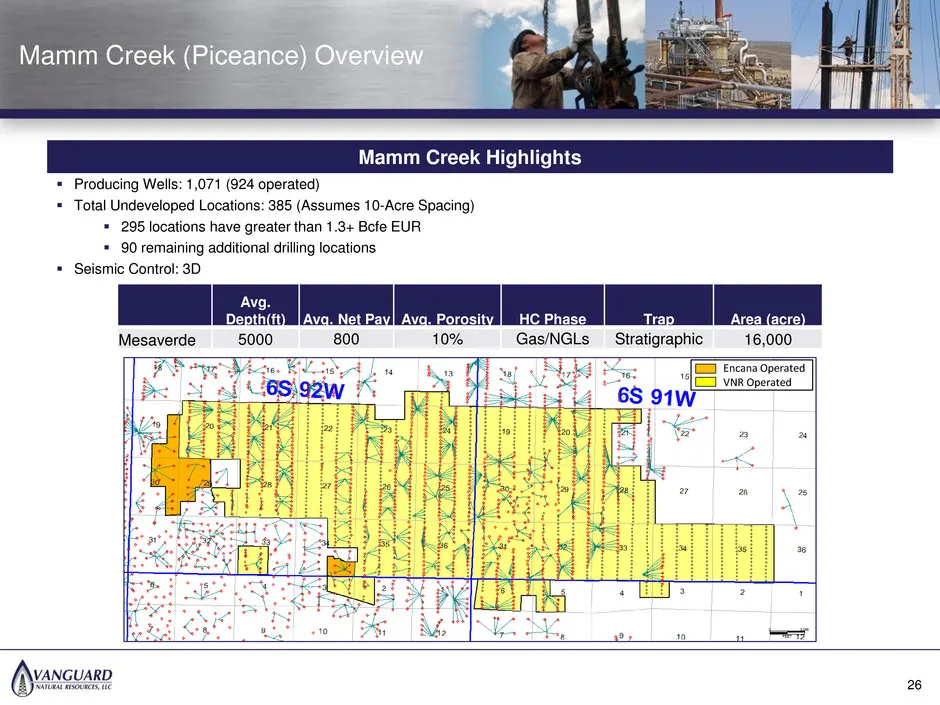
Slide 26: Mamm Creek (Piceance) Overview
36 32 87 89 89 89 83 141 213 168 177 182 Producing Wells: 1,071 (924 operated) Total Undeveloped Locations: 385 (Assumes 10-Acre Spacing) 295 locations have greater than 1.3+ Bcfe EUR 90 remaining additional drilling locations Seismic Control: 3D Avg. Depth(ft) Avg. Net Pay Avg. Porosity H
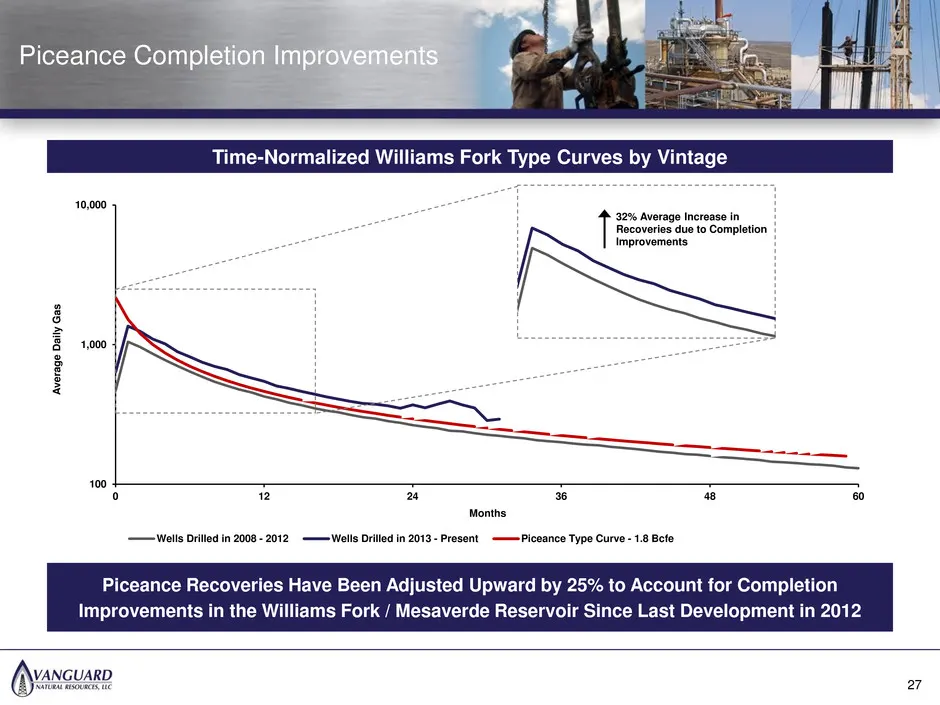
Slide 27: Piceance Completion Improvements
36 32 87 89 89 89 83 141 213 168 177 182 100 1,000 10,000 0 12 24 36 48 60 Av era ge Da ily Ga s Months Wells Drilled in 2008 - 2012 Wells Drilled in 2013 - Present Piceance Type Curve - 1.8 Bcfe Piceance Recoveries Have Been Adjusted Upward by 25% to Account for Completion Improvements in the Willi
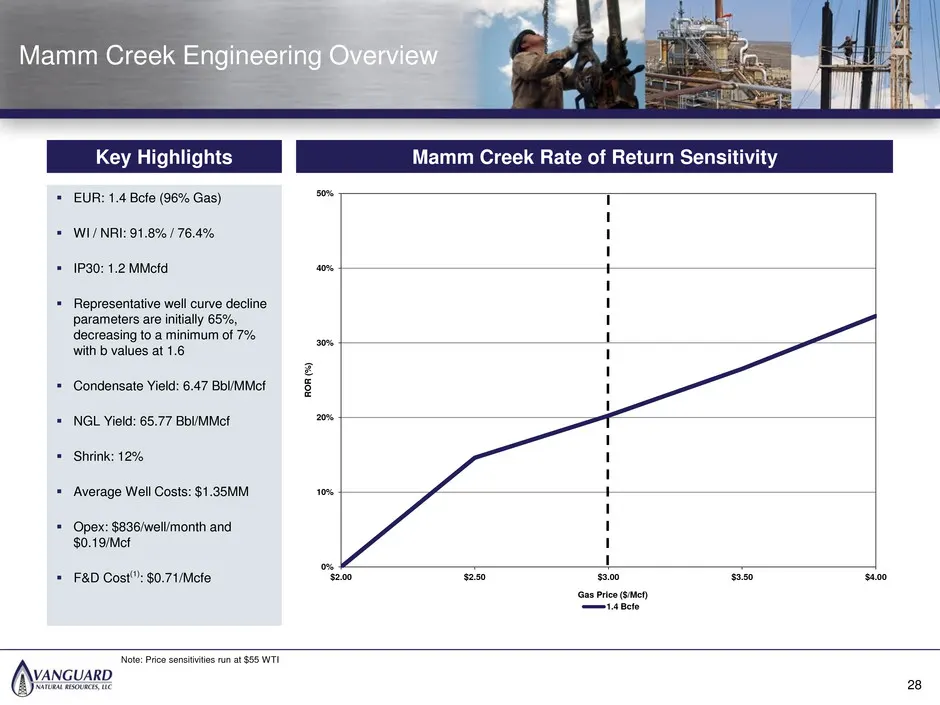
Slide 28: Mamm Creek Engineering Overview and Rate of Return Sensitivity
36 32 87 89 89 89 83 141 213 168 177 182 EUR: 1.4 Bcfe (96% Gas) WI / NRI: 91.8% / 76.4% IP30: 1.2 MMcfd Representative well curve decline parameters are initially 65%, decreasing to a minimum of 7% with b values at 1.6 Condensate Yield: 6.47 Bbl/MMcf NGL Yield: 65.77 Bbl/MMcf Shrink:
Slide 29: East Central Division Overview
36 32 87 89 89 89 83 141 213 168 177 182 East Central Division Overview 29
Slide 30: East Central Region Overview
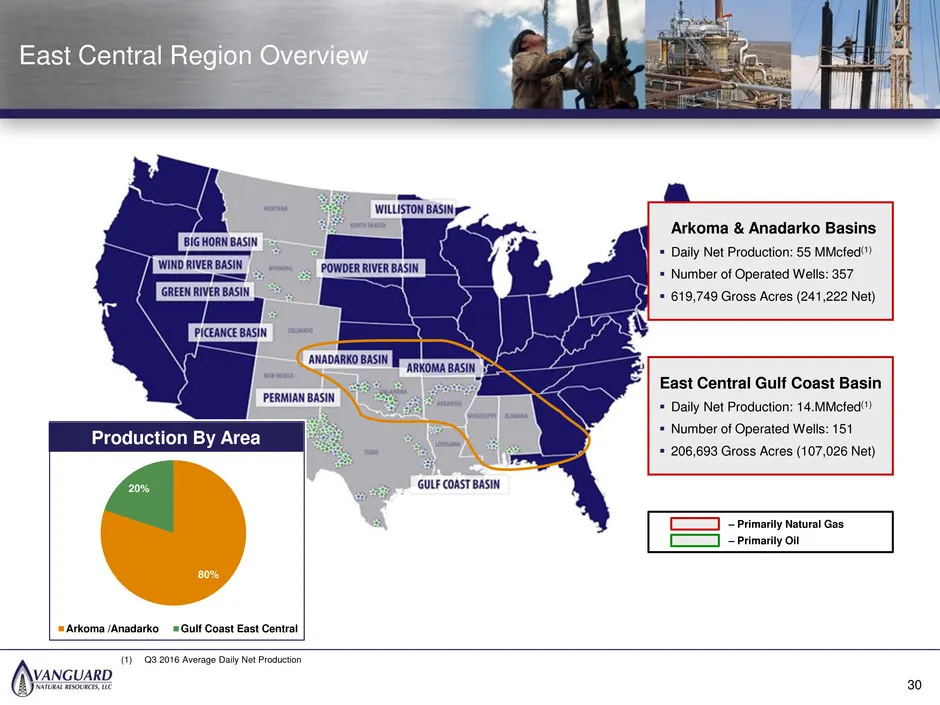
36 32 87 89 89 89 83 141 213 168 177 182 East Central Region Overview East Central Gulf Coast Basin Daily Net Production: 14.MMcfed(1) Number of Operated Wells: 151 206,693 Gross Acres (107,026 Net) Production By Area i Arkoma & Anadarko Basins Daily Net Production: 55 MMcfed(1) Number of
Slide 31: Arkoma Overview
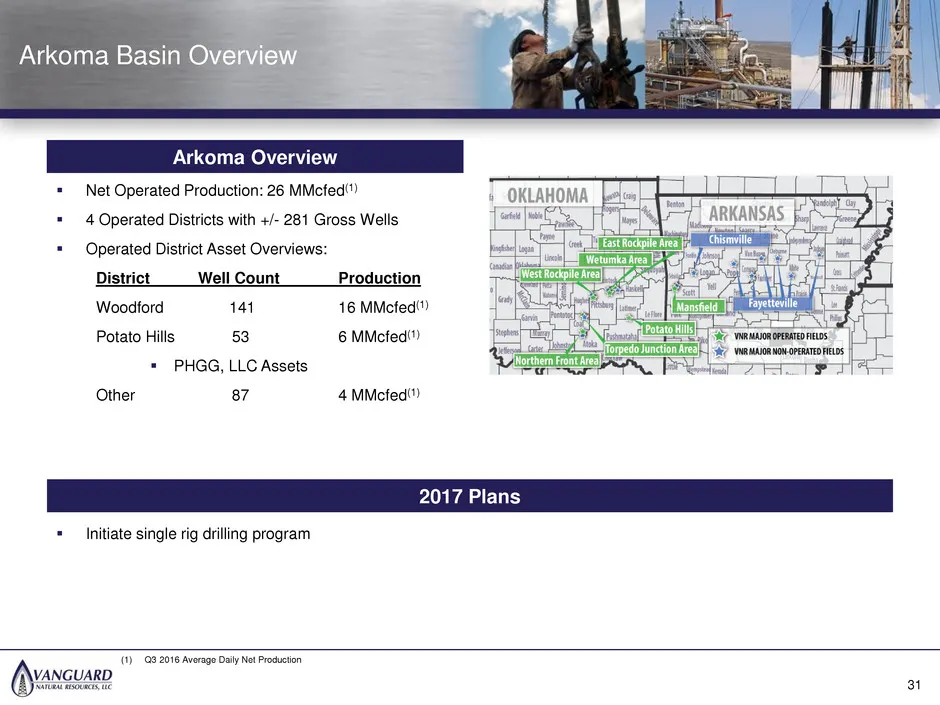
36 32 87 89 89 89 83 141 213 168 177 182 Arkoma Overview 2017 Plans Initiate single rig drilling program Arkoma Basin Overview 31 Net Operated Production: 26 MMcfed(1) 4 Operated Districts with +/- 281 Gross Wells Operated District Asset Overviews: District Well Count Production Woodford 141
Slide 32: Anadarko Basin Overview
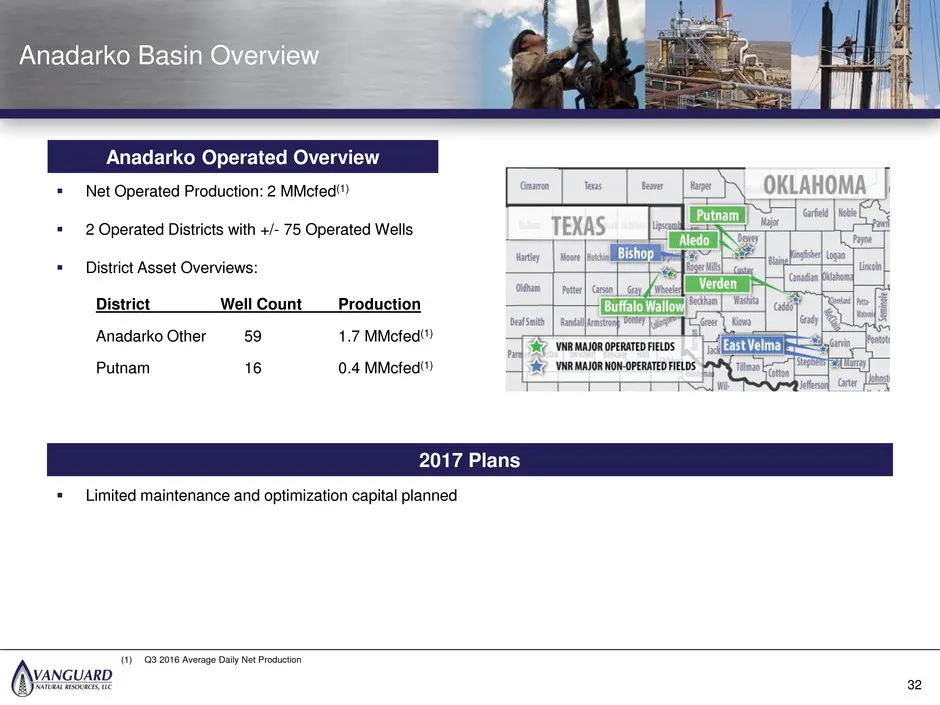
36 32 87 89 89 89 83 141 213 168 177 182 Net Operated Production: 2 MMcfed(1) 2 Operated Districts with +/- 75 Operated Wells District Asset Overviews: District Well Count Production Anadarko Other 59 1.7 MMcfed(1) Putnam 16 0.4 MMcfed(1) Anadarko Operated Overview Anadarko Basin Overview 32 2
Slide 33: East Central Gulf Coast Overview
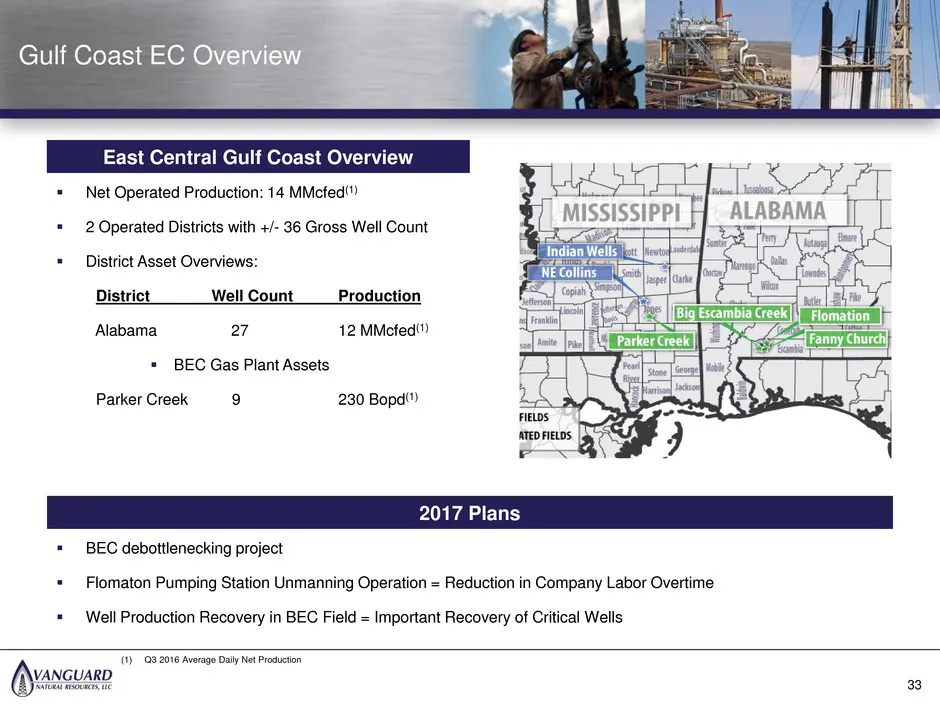
36 32 87 89 89 89 83 141 213 168 177 182 Net Operated Production: 14 MMcfed(1) 2 Operated Districts with +/- 36 Gross Well Count District Asset Overviews: District Well Count Production Alabama 27 12 MMcfed(1) BEC Gas Plant Assets Parker Creek 9 230 Bopd(1) East Central Gulf Coast Overview 2
Slide 34: Arkoma Woodford Overview & Upside
36 32 87 89 89 89 83 141 213 168 177 182 Arkoma Woodford Overview & Upside 34
Slide 35: Arkoma Woodford Overview
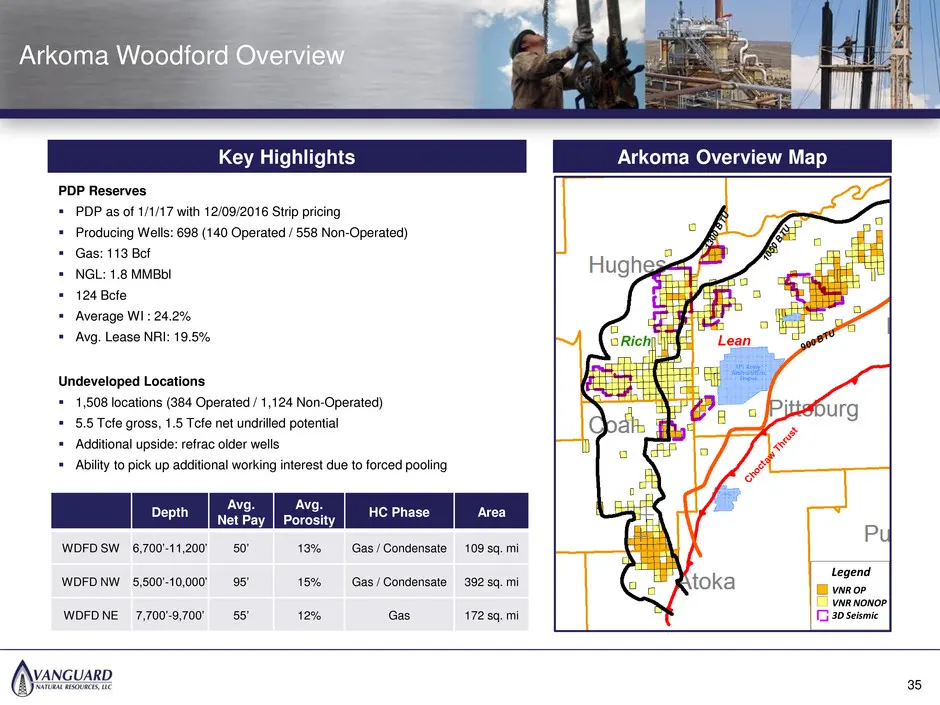
36 32 87 89 89 89 83 141 213 168 177 182 Depth Avg. Net Pay Avg. Porosity HC Phase Area WDFD SW 6,700’-11,200’ 50’ 13% Gas / Condensate 109 sq. mi WDFD NW 5,500’-10,000’ 95’ 15% Gas / Condensate 392 sq. mi WDFD NE 7,700’-9,700’ 55’ 12% Gas 172 sq. mi Arkoma Woodford Overview 54 Key Highlights Arkoma
Slide 36: Arkoma Woodford Returns
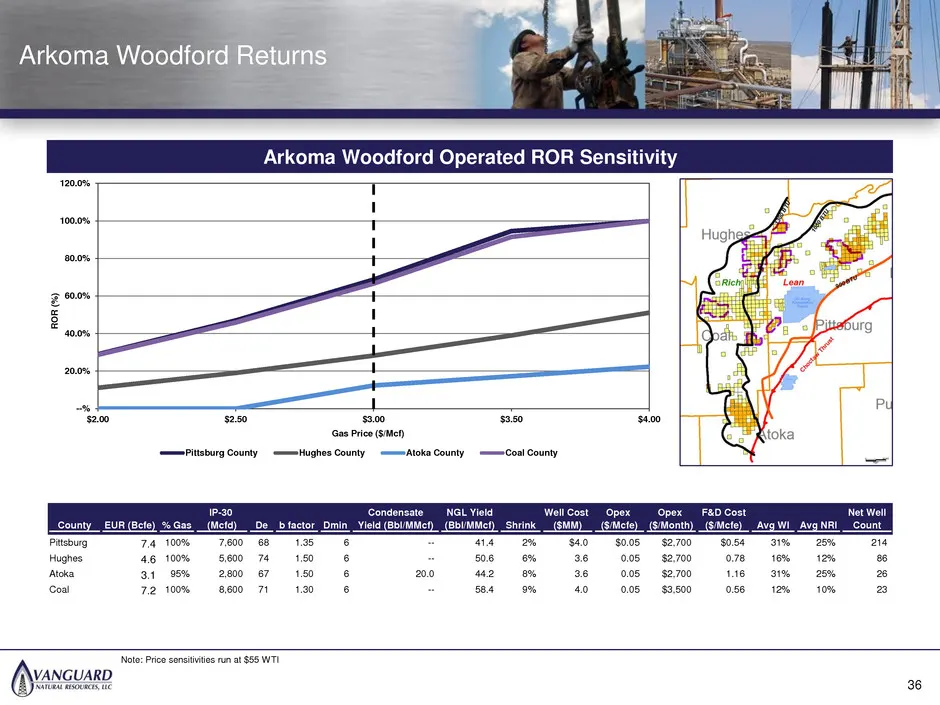
36 32 87 89 89 89 83 141 213 168 177 182 --% 20.0% 40.0% 60.0% 80.0% 100.0% 120.0% $2.00 $2.50 $3.00 $3.50 $4.00 RO R ( %) Gas Price ($/Mcf) Pittsburg County Hughes County Atoka County Coal County Arkoma Woodford Returns Arkoma Woodford Operated ROR Sensitivity 64 36 IP-30 Condensate NGL Yield Well
Slide 37: Southern Division Overview
36 32 87 89 89 89 83 141 213 168 177 182 Southern Division Overview 37
Slide 38: South Region Overview
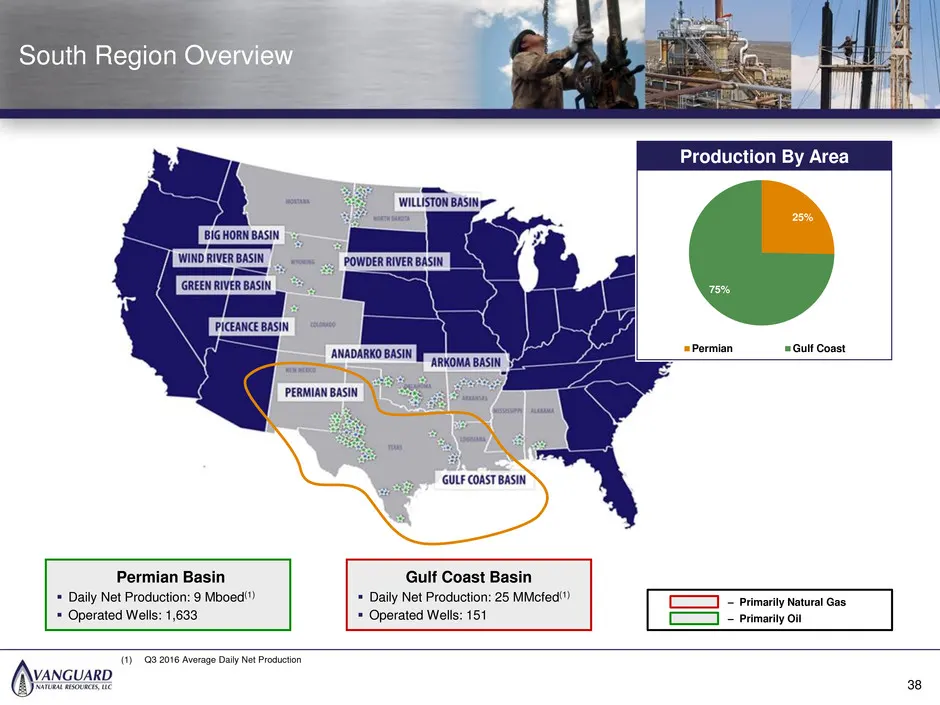
36 32 87 89 89 89 83 141 213 168 177 182 South Region Overview Gulf Coast Basin Daily Net Production: 25 MMcfed(1) Operated Wells: 151 Permian Basin Daily Net Production: 9 Mboed(1) Operated Wells: 1,633 – Primarily Natural Gas – Primarily Oil Production By Area Production By Area 38 (1) Q3
Slide 39: Permian Overview
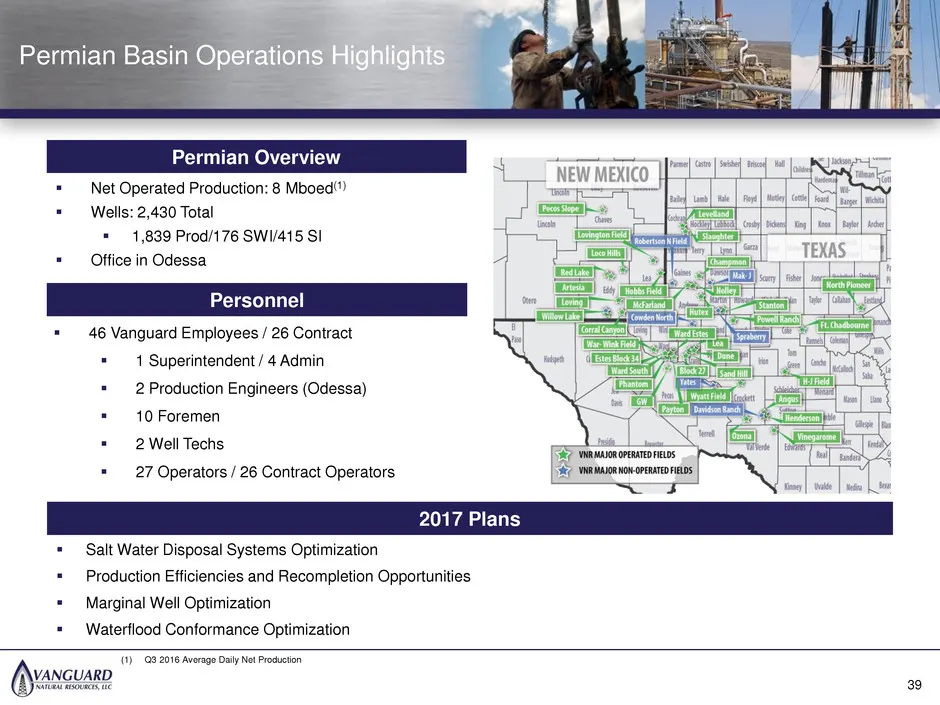
36 32 87 89 89 89 83 141 213 168 177 182 Net Operated Production: 8 Mboed(1) Wells: 2,430 Total 1,839 Prod/176 SWI/415 SI Office in Odessa Permian Overview OPERATIONS MAP Personnel 46 Vanguard Employees / 26 Contract 1 Superintendent / 4 Admin 2 Production Engineers (Odessa) 10 Forem
Slide 40: New Mexico Operations Highlights
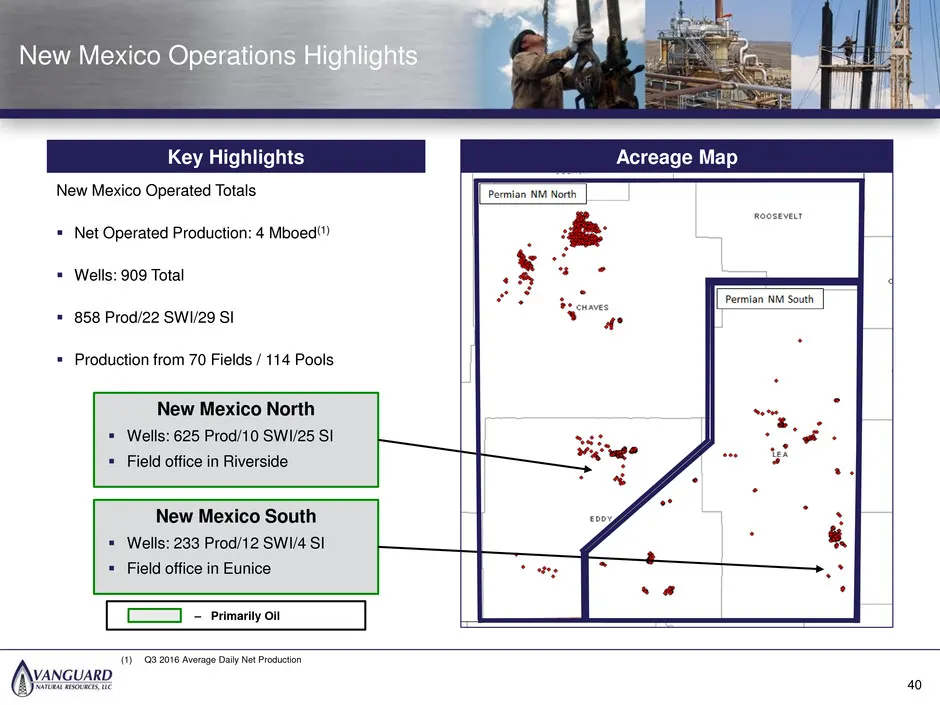
36 32 87 89 89 89 83 141 213 168 177 182 New Mexico North Wells: 625 Prod/10 SWI/25 SI Field office in Riverside New Mexico South Wells: 233 Prod/12 SWI/4 SI Field office in Eunice New Mexico Operated Totals Net Operated Production: 4 Mboed(1) Wells: 909 Total 858 Prod/22 SWI/29 SI P
Slide 41: Permian Texas Operations Highlights
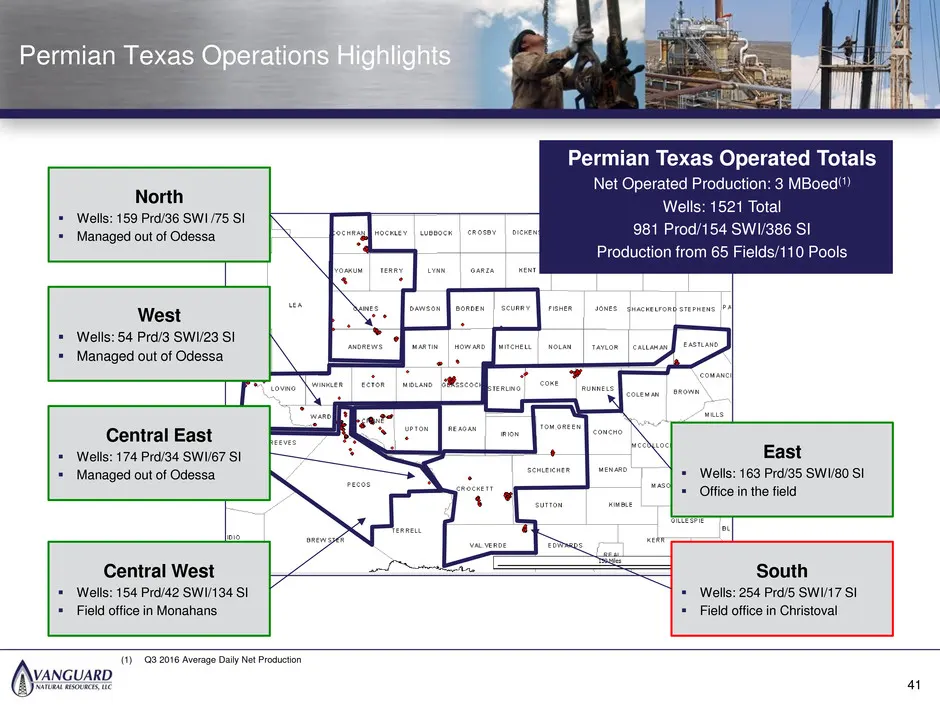
36 32 87 89 89 89 83 141 213 168 177 182 North Wells: 159 Prd/36 SWI /75 SI Managed out of Odessa Central West Wells: 154 Prd/42 SWI/134 SI Field office in Monahans Central East Wells: 174 Prd/34 SWI/67 SI Managed out of Odessa West Wells: 54 Prd/3 SWI/23 SI Managed out of Odessa Eas
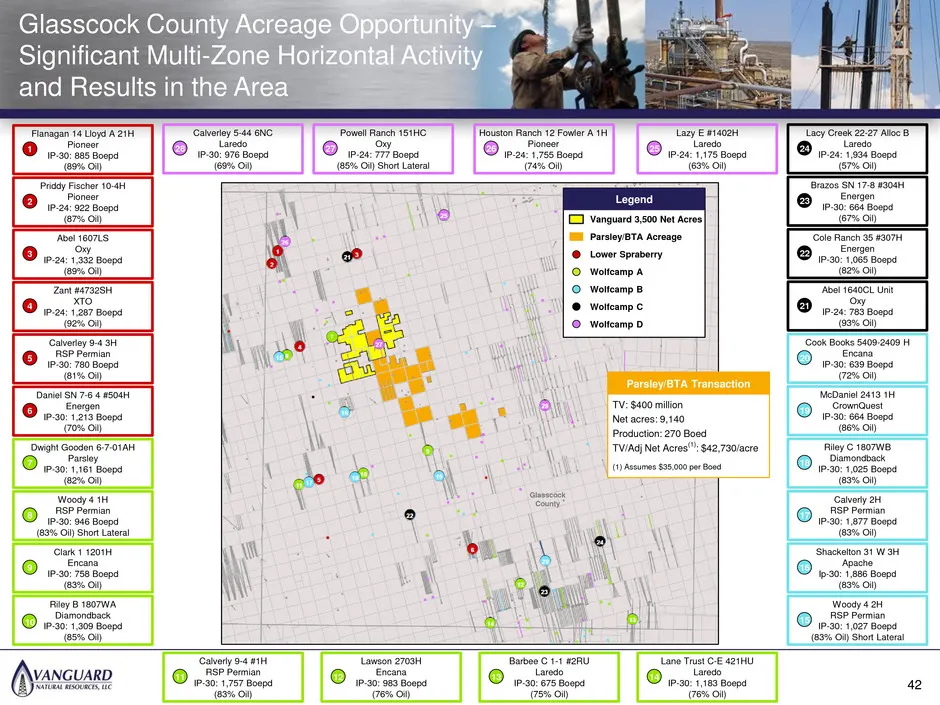
Slide 42: Glasscock County Acreage Opportunity
36 32 87 89 89 89 83 141 213 168 177 182 Glasscock County Glasscock County Acreage Opportunity – Significant Multi-Zone Horizontal Activity and Results in the Area Legend Vanguard 3,500 Net Acres Parsley/BTA Acreage Lower Spraberry Wolfcamp A Wolfcamp B Wolfcamp C Wolfcamp D Flanagan 14 Lloyd A 21H
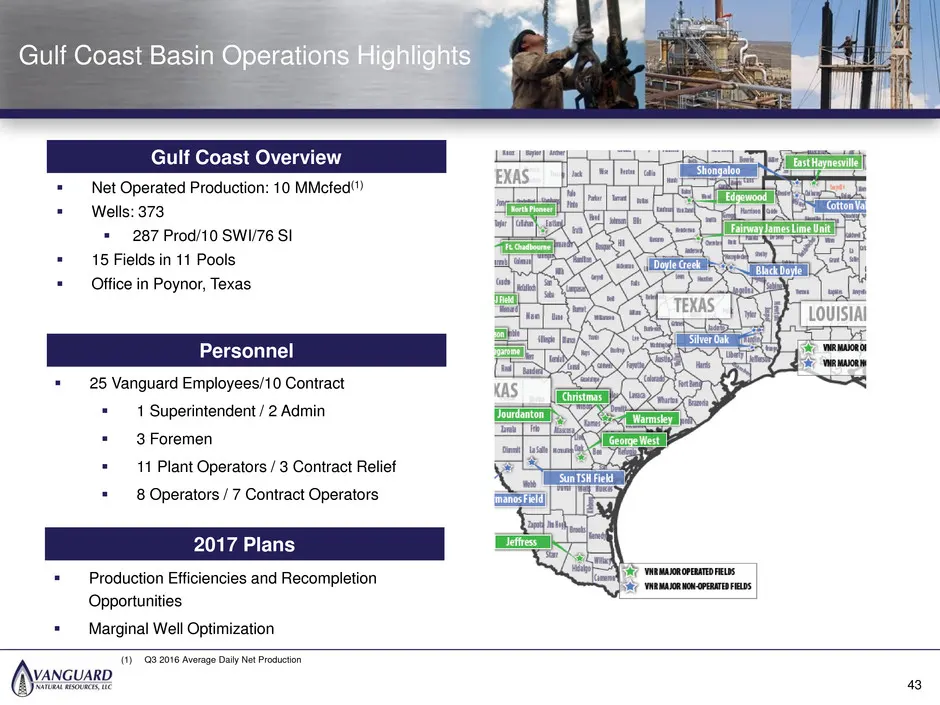
Slide 43: Gulf Coast Overview
36 32 87 89 89 89 83 141 213 168 177 182 Net Operated Production: 10 MMcfed(1) Wells: 373 287 Prod/10 SWI/76 SI 15 Fields in 11 Pools Office in Poynor, Texas Gulf Coast Overview Personnel Production Efficiencies and Recompletion Opportunities Marginal Well Optimization 43 Gulf Coast Ba
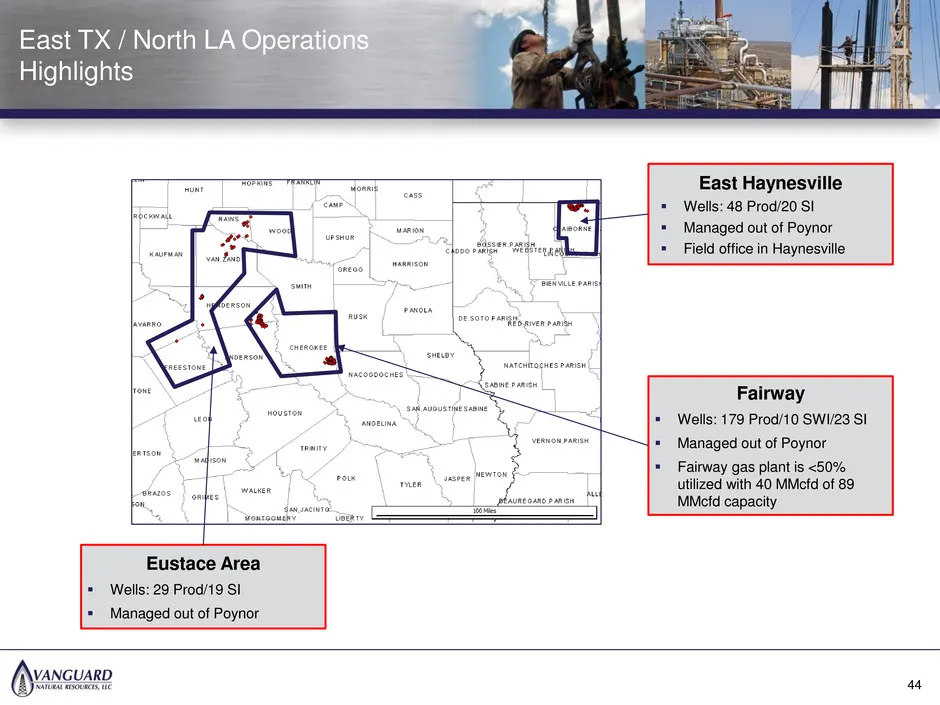
Slide 44: East TX / North LA Operations Highlights
36 32 87 89 89 89 83 141 213 168 177 182 East Haynesville Wells: 48 Prod/20 SI Managed out of Poynor Field office in Haynesville Fairway Wells: 179 Prod/10 SWI/23 SI Managed out of Poynor Fairway gas plant is <50% utilized with 40 MMcfd of 89 MMcfd capacity Eustace Area Wells: 29 Prod/
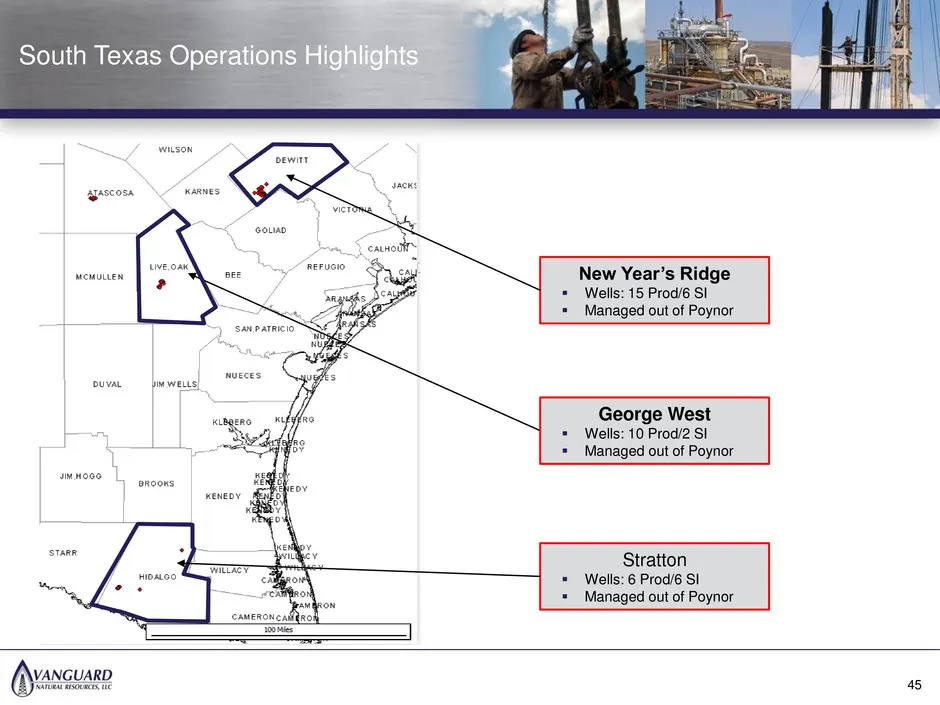
Slide 45: South Texas Operations Highlights
36 32 87 89 89 89 83 141 213 168 177 182 New Year’s Ridge Wells: 15 Prod/6 SI Managed out of Poynor George West Wells: 10 Prod/2 SI Managed out of Poynor Stratton Wells: 6 Prod/6 SI Managed out of Poynor South Texas Operations Highlights 45
Slide 46: East Haynesville Field Overview & Upside
36 32 87 89 89 89 83 141 213 168 177 182 East Haynesville Field Overview & Upside 46
Slide 47: East Haynesville Field Overview
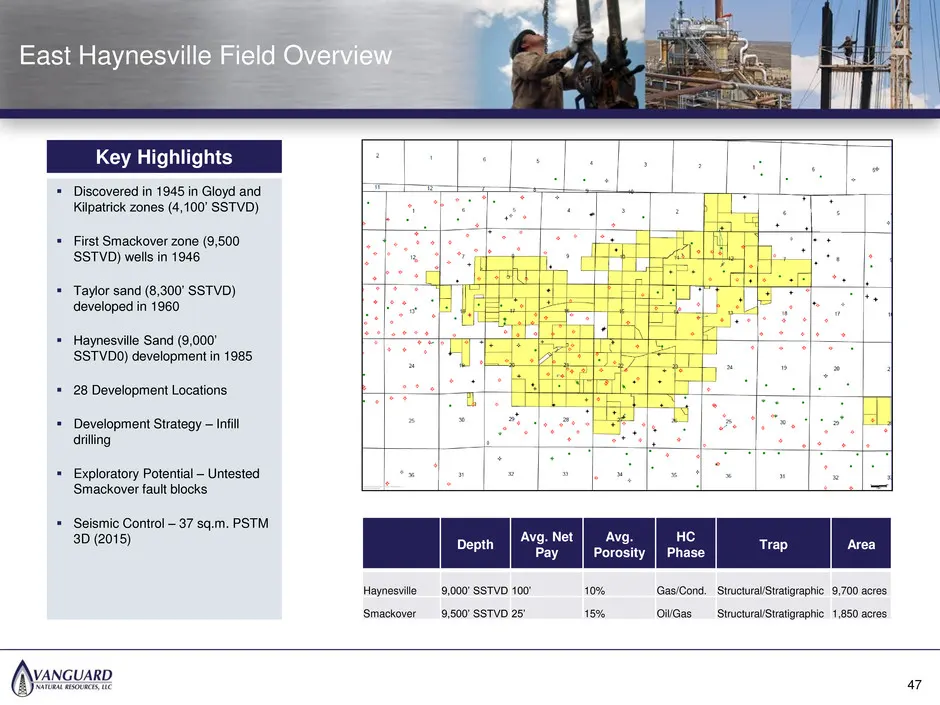
36 32 87 89 89 89 83 141 213 168 177 182 Depth Avg. Net Pay Avg. Porosity HC Phase Trap Area Haynesville 9,000’ SSTVD 100’ 10% Gas/Cond. Structural/Stratigraphic 9,700 acres Smackover 9,500’ SSTVD 25’ 15% Oil/Gas Structural/Stratigraphic 1,850 acres East Haynesville Field Overview Key Highlights D
Slide 48: Haynesville Sand Type Curve
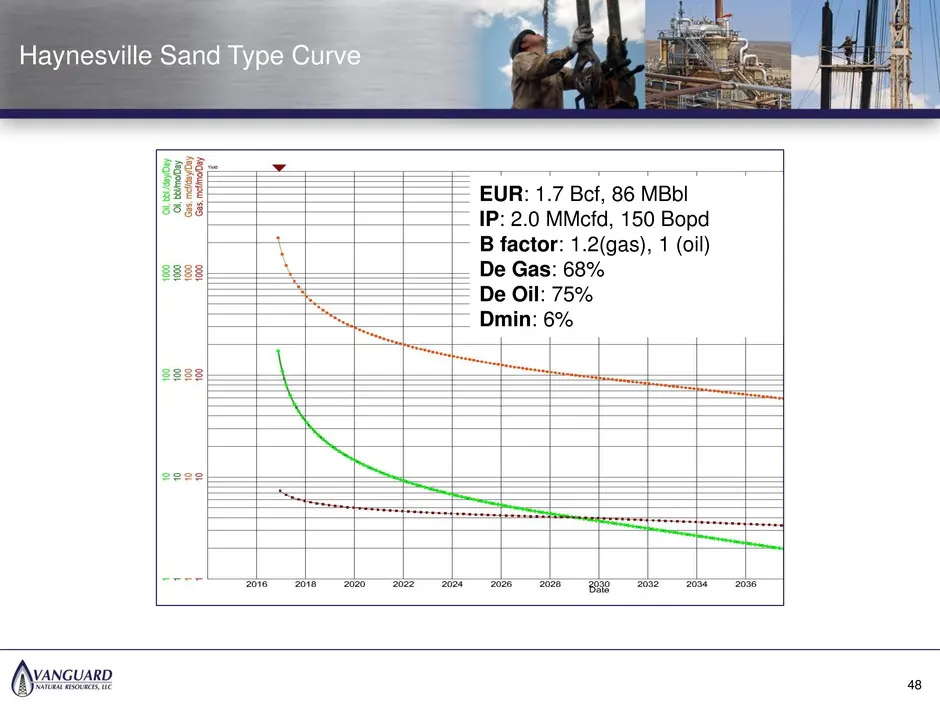
36 32 87 89 89 89 83 141 213 168 177 182 EUR: 1.7 Bcf, 86 MBbl IP: 2.0 MMcfd, 150 Bopd B factor: 1.2(gas), 1 (oil) De Gas: 68% De Oil: 75% Dmin: 6% 48 Haynesville Sand Type Curve
Slide 49: Haynesville Sand Economics
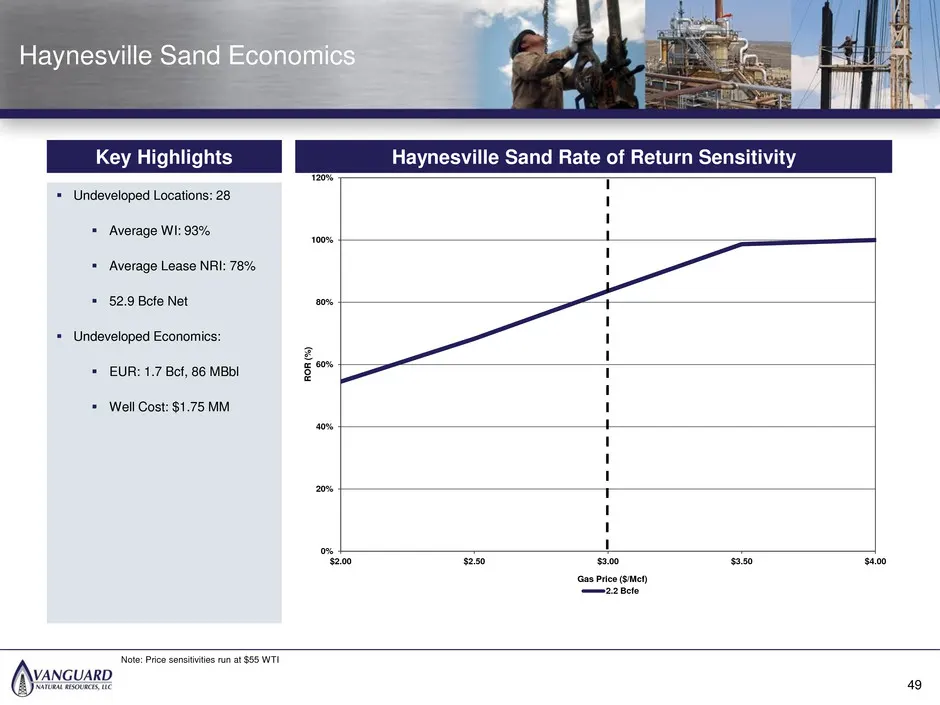
36 32 87 89 89 89 83 141 213 168 177 182 Haynesville Sand Economics Haynesville Sand Rate of Return Sensitivity Key Highlights Undeveloped Locations: 28 Average WI: 93% Average Lease NRI: 78% 52.9 Bcfe Net Undeveloped Economics: EUR: 1.7 Bcf, 86 MBbl Well Cost: $1.75 MM 82 49 0% 20% 40
Slide 50: Smackover Type Curve
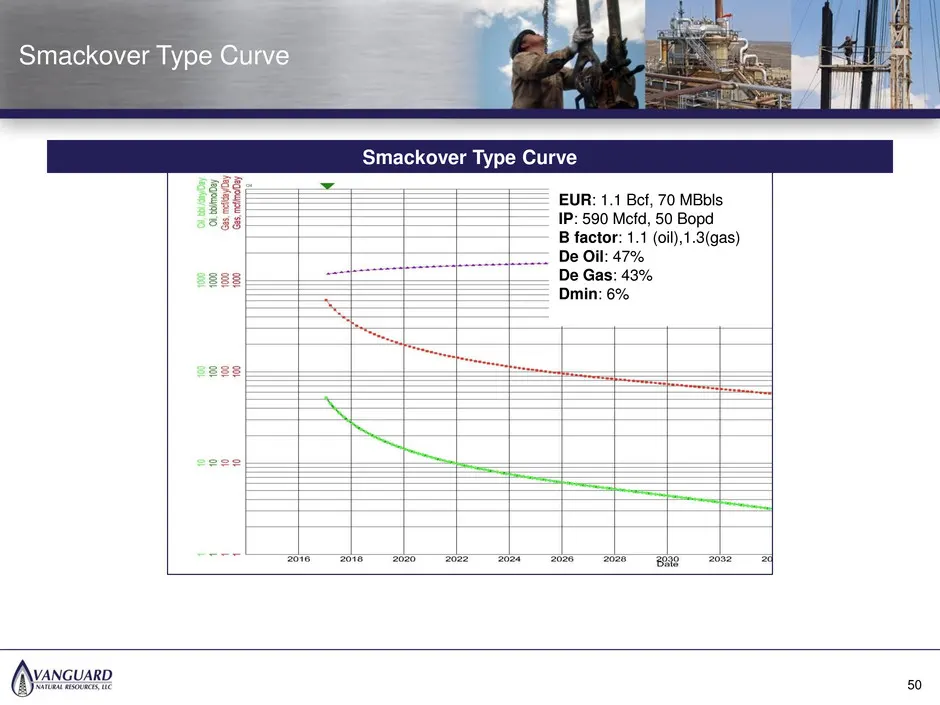
36 32 87 89 89 89 83 141 213 168 177 182 EUR: 1.1 Bcf, 70 MBbls IP: 590 Mcfd, 50 Bopd B factor: 1.1 (oil),1.3(gas) De Oil: 47% De Gas: 43% Dmin: 6% Smackover Type Curve Smackover Type Curve 50
Slide 51: Smackover Economics
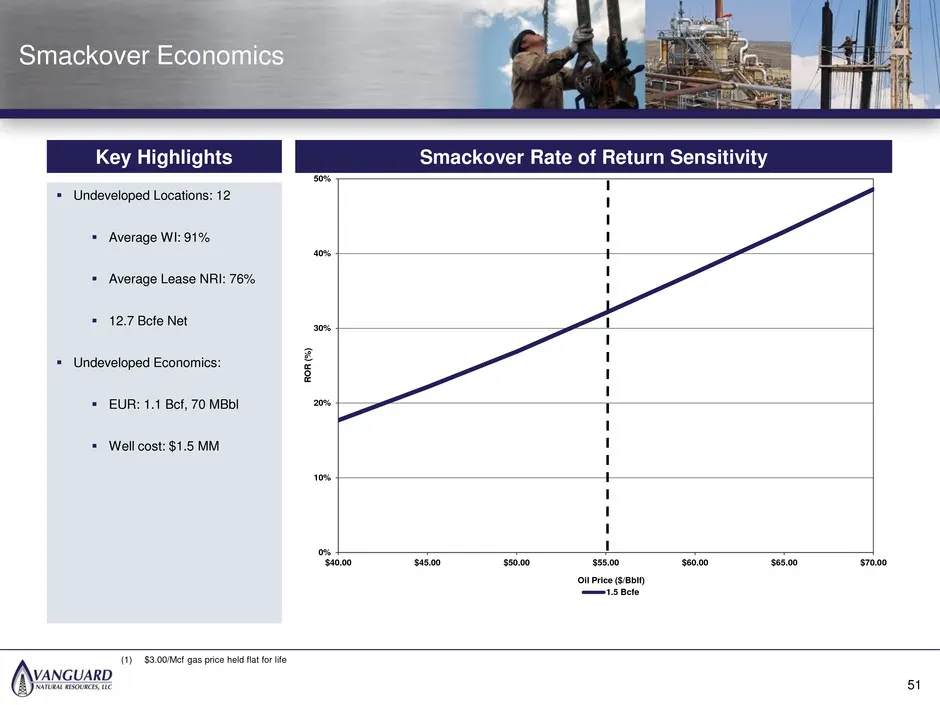
36 32 87 89 89 89 83 141 213 168 177 182 Smackover Economics (1) $3.00/Mcf gas price held flat for life 84 Smackover Rate of Return Sensitivity Key Highlights Undeveloped Locations: 12 Average WI: 91% Average Lease NRI: 76% 12.7 Bcfe Net Undeveloped Economics: EUR: 1.1 Bcf, 70 MBbl Wel
Slide 52: Red Lake Overview & Upside
36 32 87 89 89 89 83 141 213 168 177 182 Red Lake Overview & Upside 52
Slide 53: Red Lake Field – Permian Basin
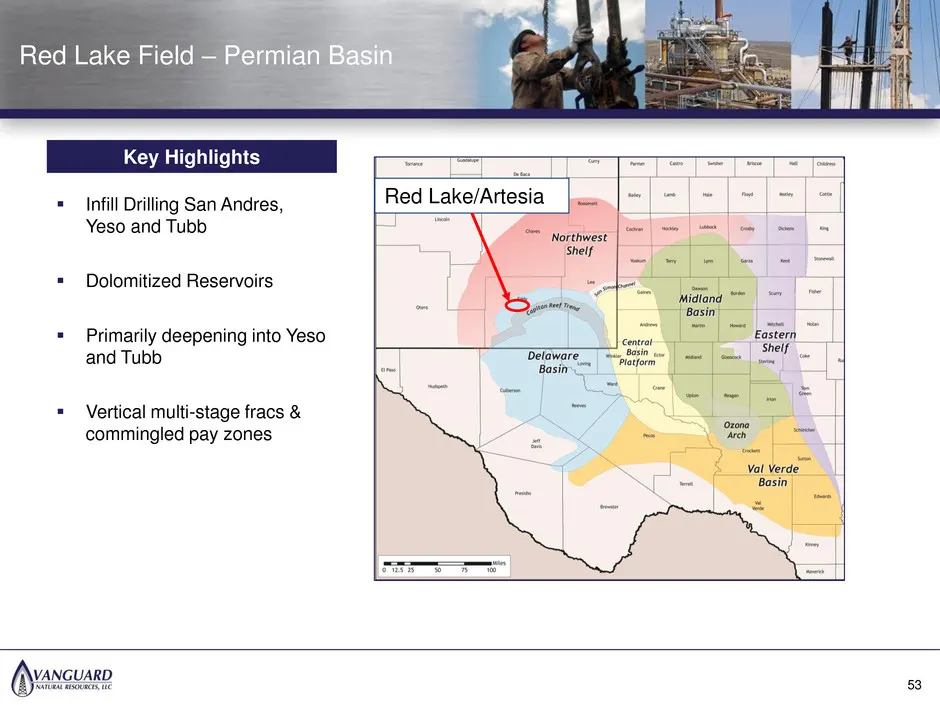
36 32 87 89 89 89 83 141 213 168 177 182 Infill Drilling San Andres, Yeso and Tubb Dolomitized Reservoirs Primarily deepening into Yeso and Tubb Vertical multi-stage fracs & commingled pay zones Red Lake/Artesia Red Lake Field – Permian Basin Key Highlights 53
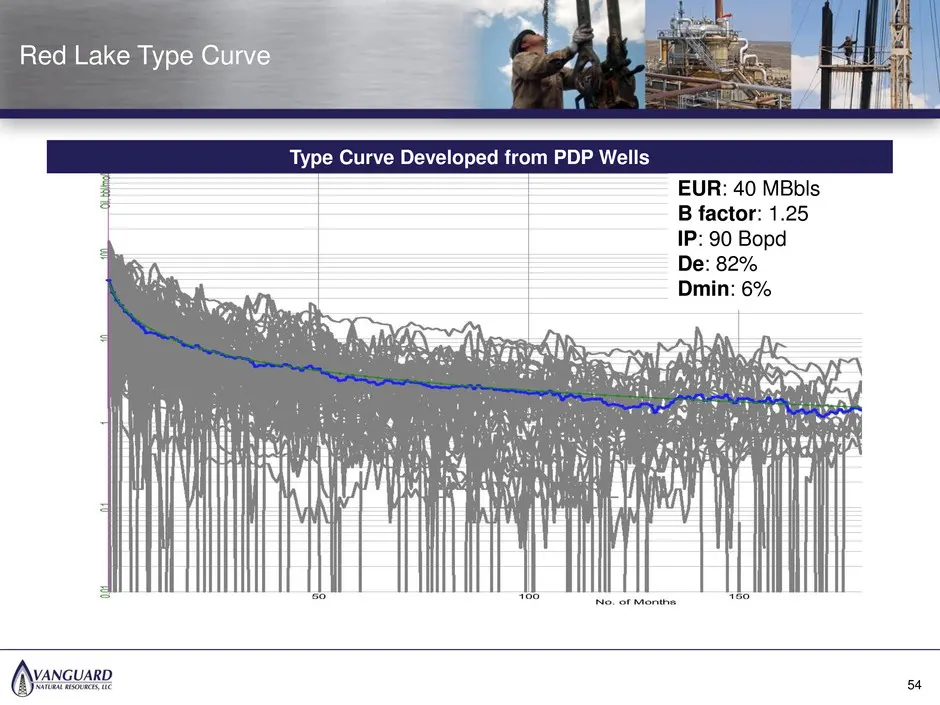
Slide 54: Red Lake Type Curve
36 32 87 89 89 89 83 141 213 168 177 182 EUR: 40 MBbls B factor: 1.25 IP: 90 Bopd De: 82% Dmin: 6% Red Lake Type Curve 54 Type Curve Developed from PDP Wells
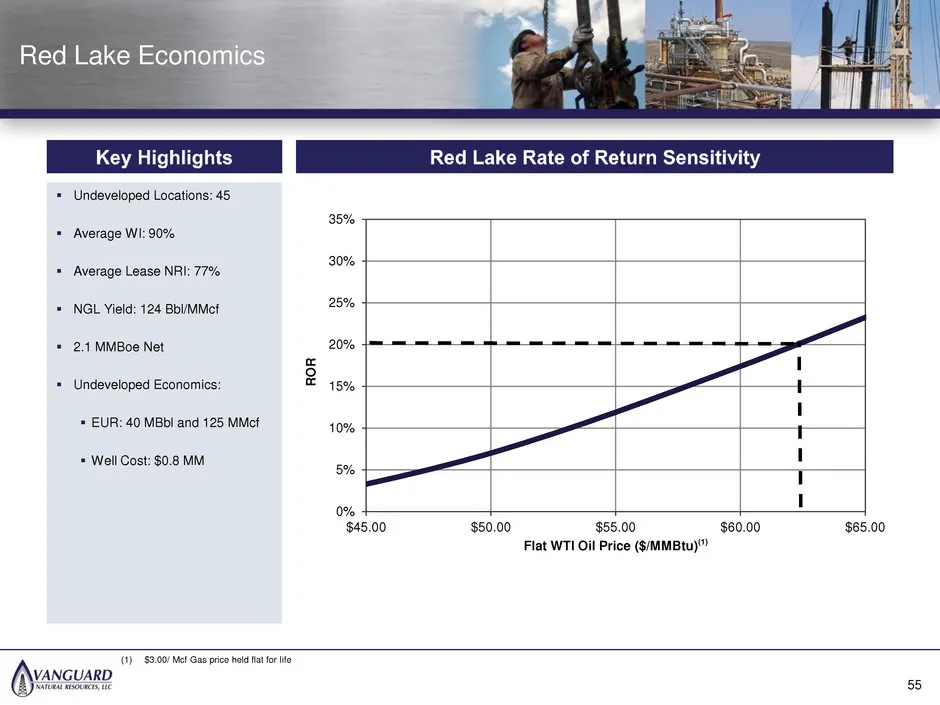
Slide 55: Red Lake Economics
36 32 87 89 89 89 83 141 213 168 177 182 Red Lake Economics (1) $3.00/ Mcf Gas price held flat for life Undeveloped Locations: 45 Average WI: 90% Average Lease NRI: 77% NGL Yield: 124 Bbl/MMcf 2.1 MMBoe Net Undeveloped Economics: EUR: 40 MBbl and 125 MMcf Well Cost: $0.8 MM 0% 5% 10%
Slide 56: Business Plan Overview
36 32 87 89 89 89 83 141 213 168 177 182 Business Plan Overview 56
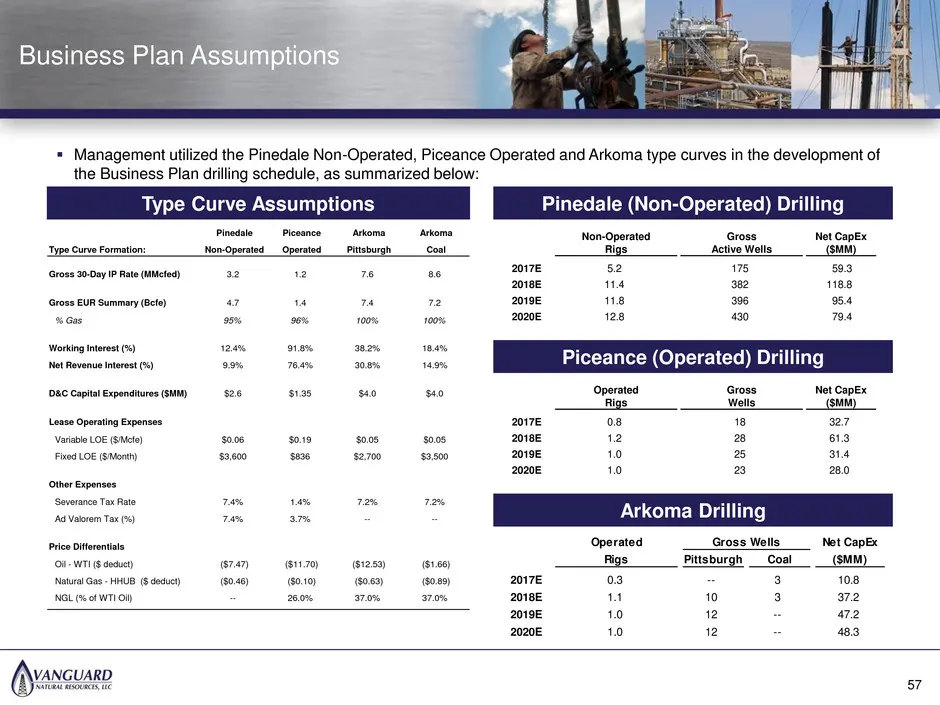
Slide 57: Business Plan Assumptions
36 32 87 89 89 89 83 141 213 168 177 182 Business Plan Assumptions Management utilized the Pinedale Non-Operated, Piceance Operated and Arkoma type curves in the development of the Business Plan drilling schedule, as summarized below: Pinedale Piceance Arkoma Arkoma Type Curve Formation: Non-Opera
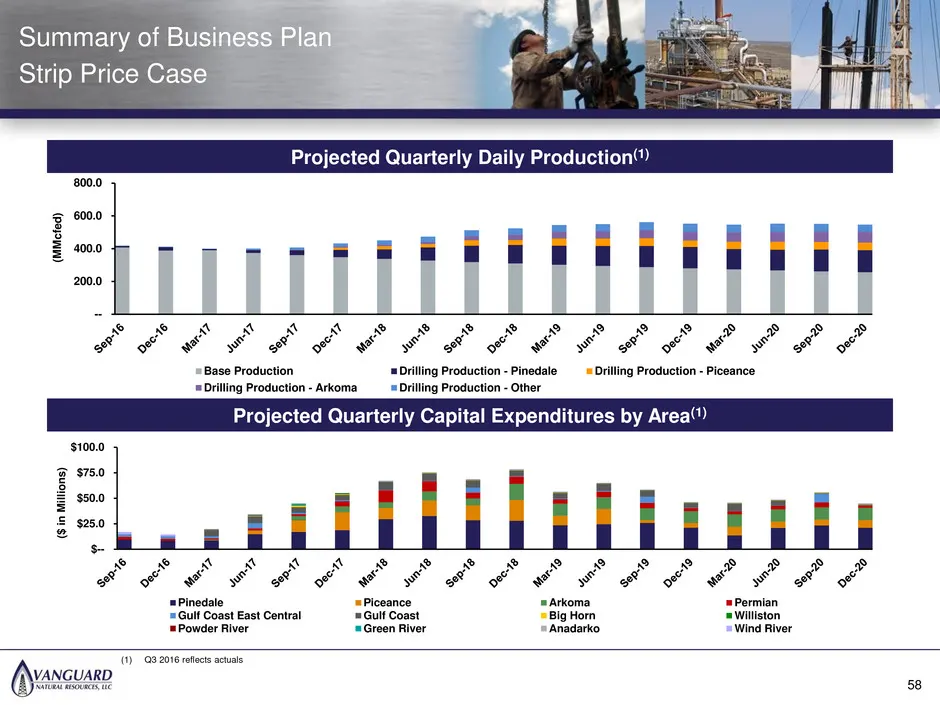
Slide 58: Summary of Business Plan
36 32 87 89 89 89 83 141 213 168 177 182 Summary of Business Plan Strip Price Case Projected Quarterly Daily Production(1) Projected Quarterly Capital Expenditures by Area(1) 58 -- 200.0 400.0 600.0 800.0 (MM cfed ) Base Production Drilling Production - Pinedale Drilling Production - Piceance Drilli
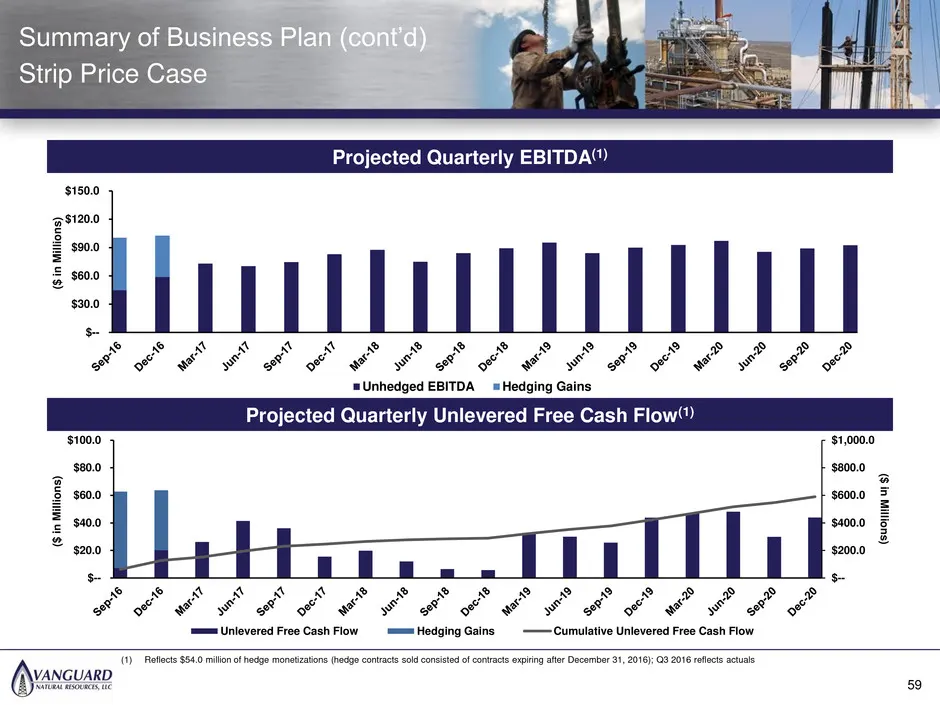
Slide 59: Summary of Business Plan (cont'd)
36 32 87 89 89 89 83 141 213 168 177 182 Summary of Business Plan (cont’d) Strip Price Case Projected Quarterly EBITDA(1) Projected Quarterly Unlevered Free Cash Flow(1) 59 $-- $30.0 $60.0 $90.0 $120.0 $150.0 ($ in Mill ions ) Unhedged EBITDA Hedging Gains $-- $200.0 $400.0 $600.0 $800.0 $1,000.0 $-
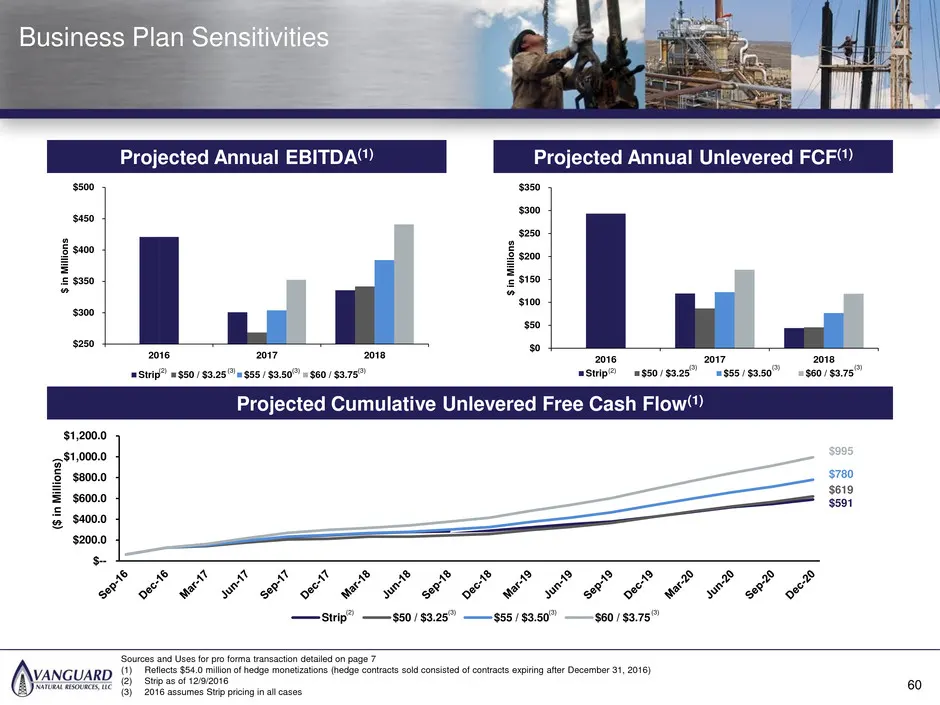
Slide 60: Business Plan Sensitivities
36 32 87 89 89 89 83 141 213 168 177 182 Business Plan Sensitivities Projected Annual EBITDA(1) Projected Annual Unlevered FCF(1) 60 Projected Cumulative Unlevered Free Cash Flow(1) $250 $300 $350 $400 $450 $500 2016 2017 2018 $ i n M illi on s Strip $50 / $3.25 $55 / $3.50 $60 / $3.75 $0 $50 $100 $
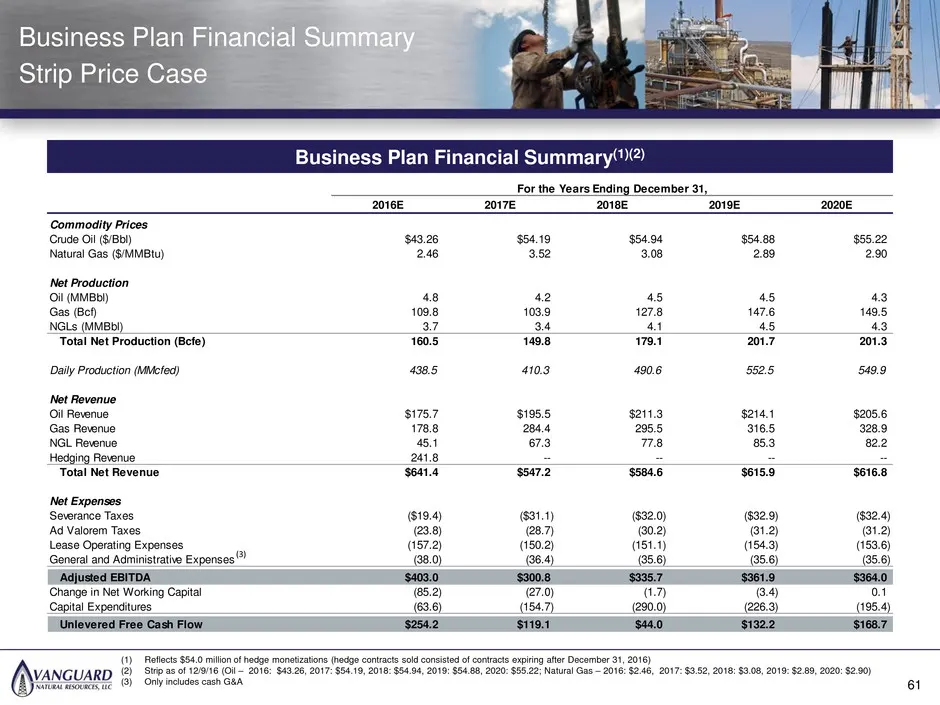
Slide 61: Business Plan Financial Summary
36 32 87 89 89 89 83 141 213 168 177 182 Business Plan Financial Summary Strip Price Case Business Plan Financial Summary(1)(2) 61 For the Years Ending December 31, 2016E 2017E 2018E 2019E 2020E Commodity Prices Crude Oil ($/Bbl) $43.26 $54.19 $54.94 $54.88 $55.22 Natural Gas ($/MMBtu) 2.46 3.52 3.0
Source: SEC EDGAR · 8-K filed Feb 2, 2017
More decks from Vanguard Natural Resources LLC
 Debt Investor Presentation (April 2019)14 slides · Apr 1, 2019
 Investor Presentation (August 2018)26 slides · Aug 13, 2018
 Presentation (May 2017)6 slides · May 25, 2017
 Technical Presentation (May 2017)5 slides · May 25, 2017
 Debt Investor Presentation (May 2017)10 slides · May 25, 2017
 Investor Presentation (October 2016)75 slides · Oct 7, 2016