Oaktree Strategic Income Corporation
Oaktree Strategic Income — Q4 2018 Earnings Presentation
21 slides from Oaktree Strategic Income's earnings presentation, Nov 29, 2018
Slide 1: Fourth Quarter Fiscal Year 2018 Earnings Presentation
Fourth Quarter Fiscal Year 2018 Earnings Presentation November 29, 2018 Nasdaq: OCSI Exhibit 99.2
Slide 2: Forward Looking Statements
Forward Looking Statements Some of the statements in this presentation constitute forward-looking statements because they relate to future events or our future performance or financial condition. The forward-looking statements contained in this presentation may include statements as to: our future o
Slide 3: Accomplishments Since Oaktree Became Investment Adviser on October 17, 2017
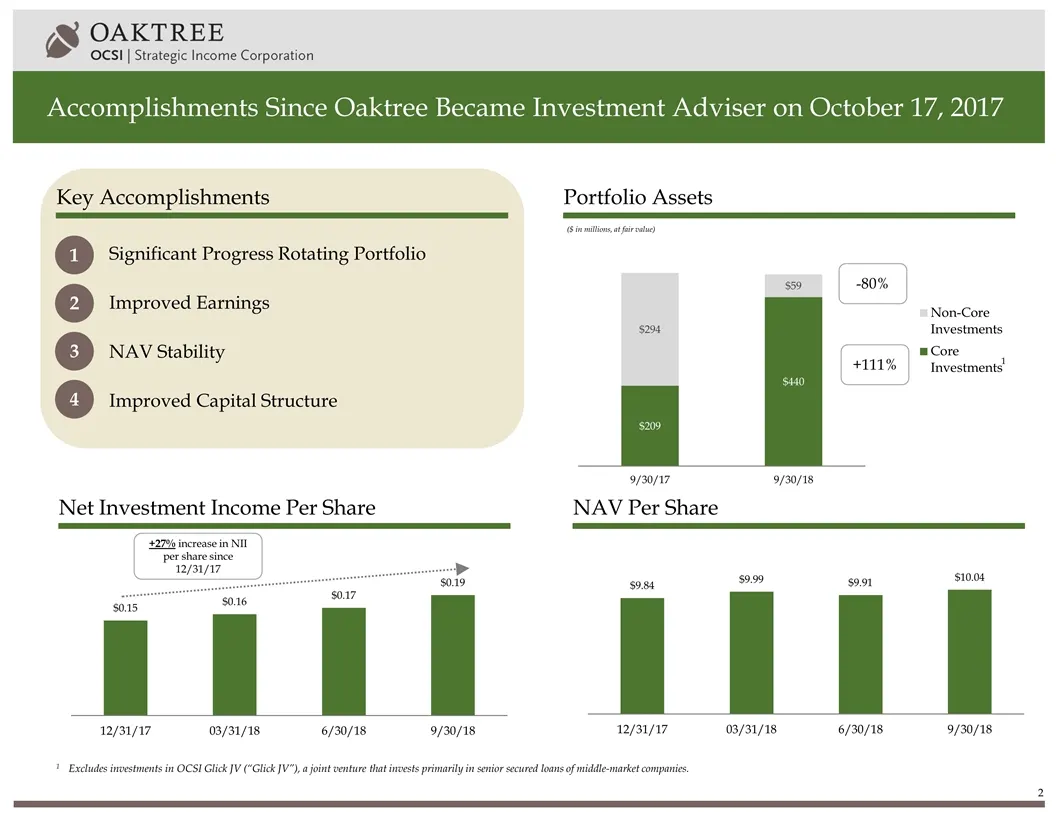
Accomplishments Since Oaktree Became Investment Adviser on October 17, 2017 Significant Progress Rotating Portfolio Improved Earnings NAV Stability Improved Capital Structure ($ in millions, at fair value) 1 Net Investment Income Per Share Portfolio Assets NAV Per Share Key Accomplishments +27% incr
Slide 4: Q4 2018 Highlights
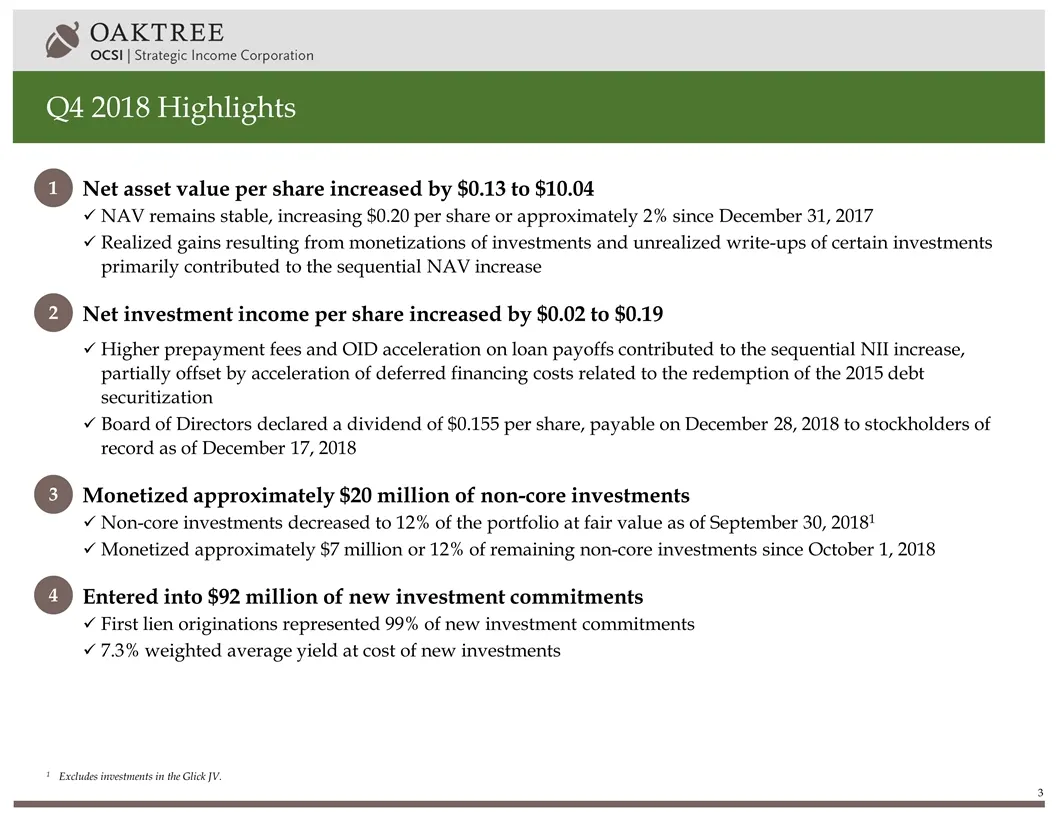
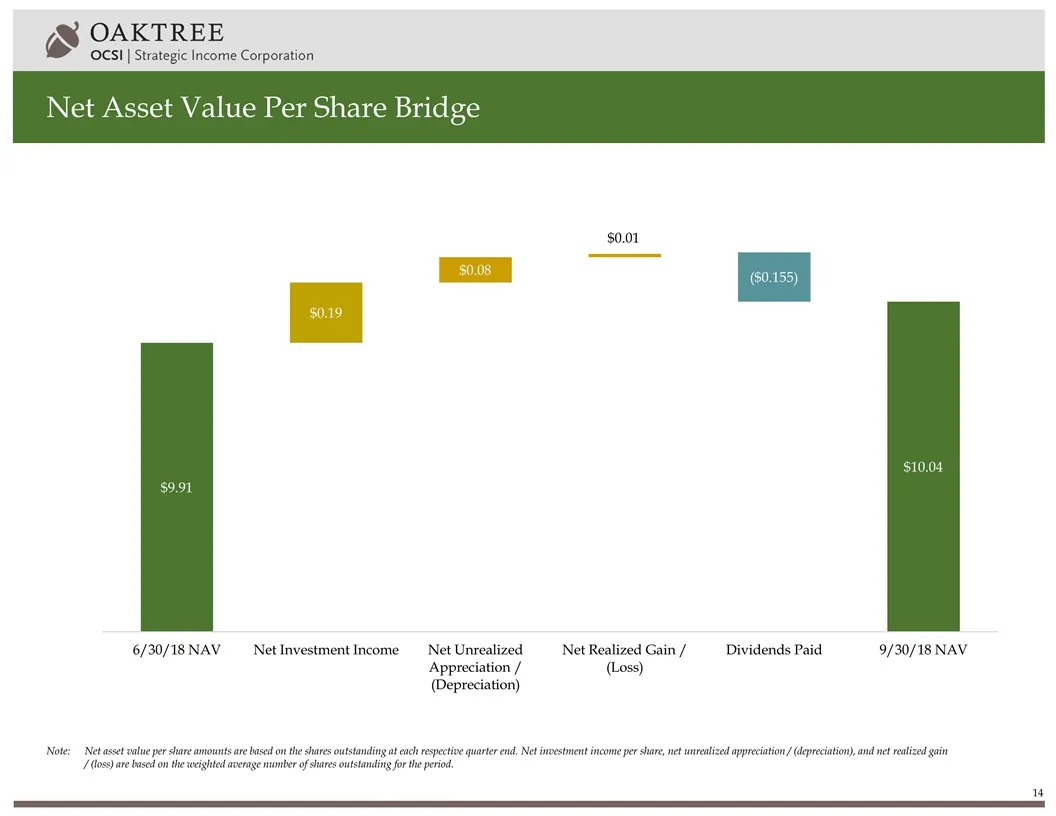
Q4 2018 Highlights Net asset value per share increased by $0.13 to $10.04 NAV remains stable, increasing $0.20 per share or approximately 2% since December 31, 2017 Realized gains resulting from monetizations of investments and unrealized write-ups of certain investments primarily contributed to the
Slide 5: Historical Portfolio Progression
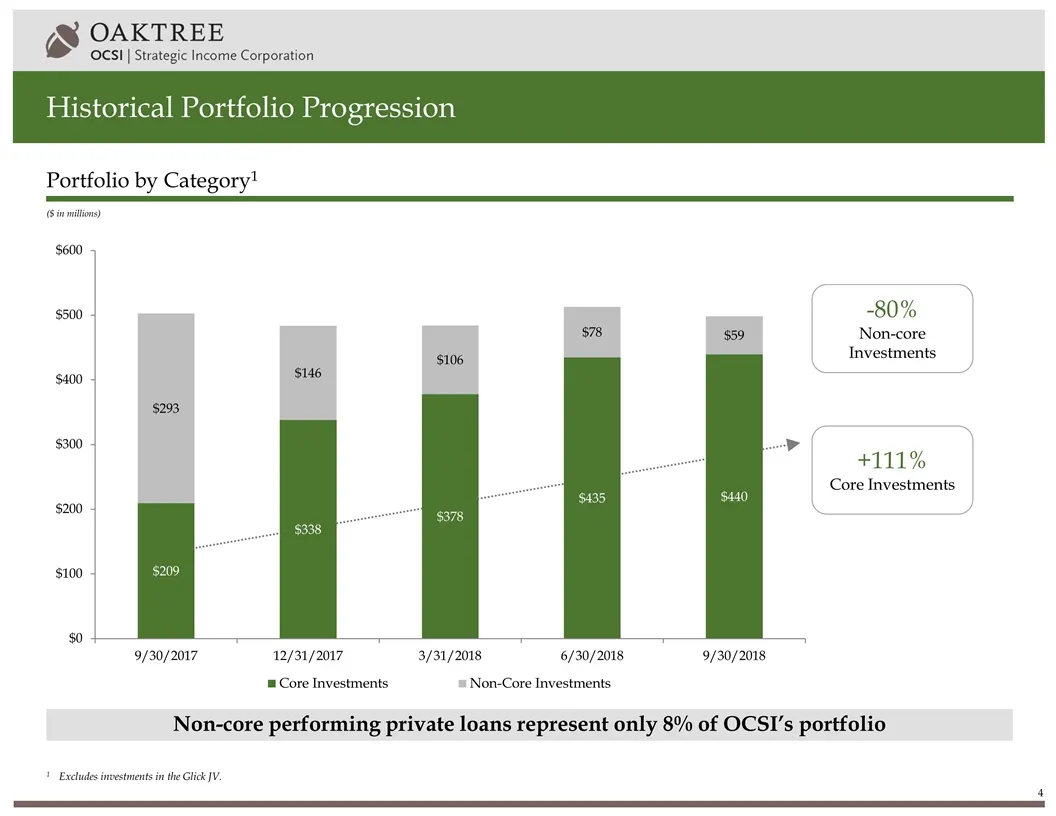
Historical Portfolio Progression Non-core performing private loans represent only 8% of OCSI’s portfolio ($ in millions) Portfolio by Category1 +111% Core Investments -80% Non-core Investments 1Excludes investments in the Glick JV.
Slide 6: Non-core Investment Portfolio Detail
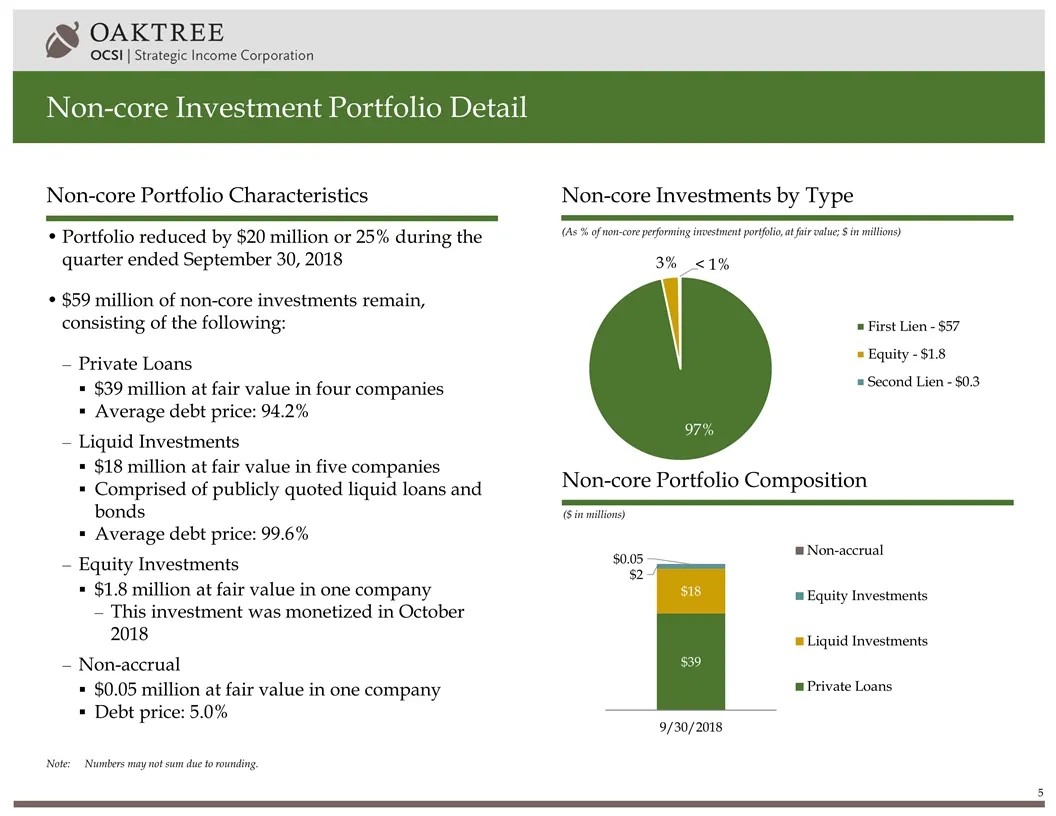
Note:Numbers may not sum due to rounding. Non-core Investment Portfolio Detail Non-core Portfolio Characteristics Portfolio reduced by $20 million or 25% during the quarter ended September 30, 2018 $59 million of non-core investments remain, consisting of the following: Private Loans $39 million at
Slide 7: Portfolio Summary as of September 30, 2018
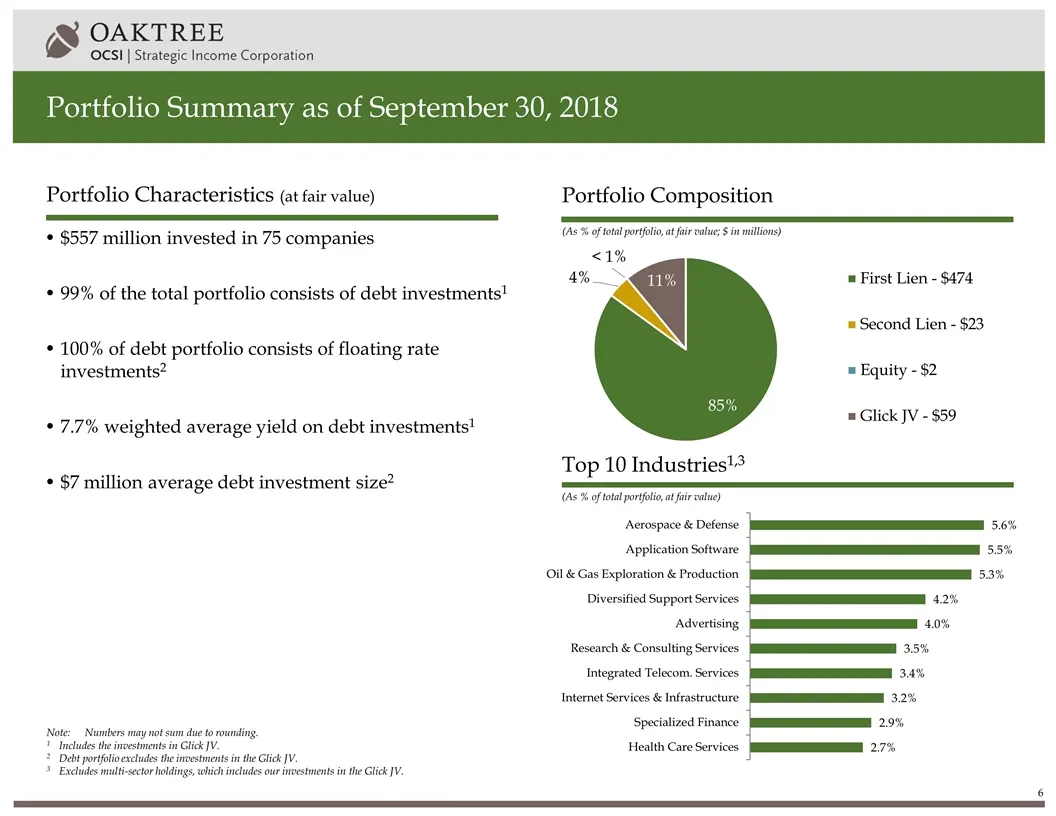
Portfolio Summary as of September 30, 2018 (As % of total portfolio, at fair value; $ in millions) (As % of total portfolio, at fair value) Portfolio Composition Top 10 Industries1,3 Portfolio Characteristics (at fair value) $557 million invested in 75 companies 99% of the total portfolio consists o
Slide 8: Core Portfolio Progression
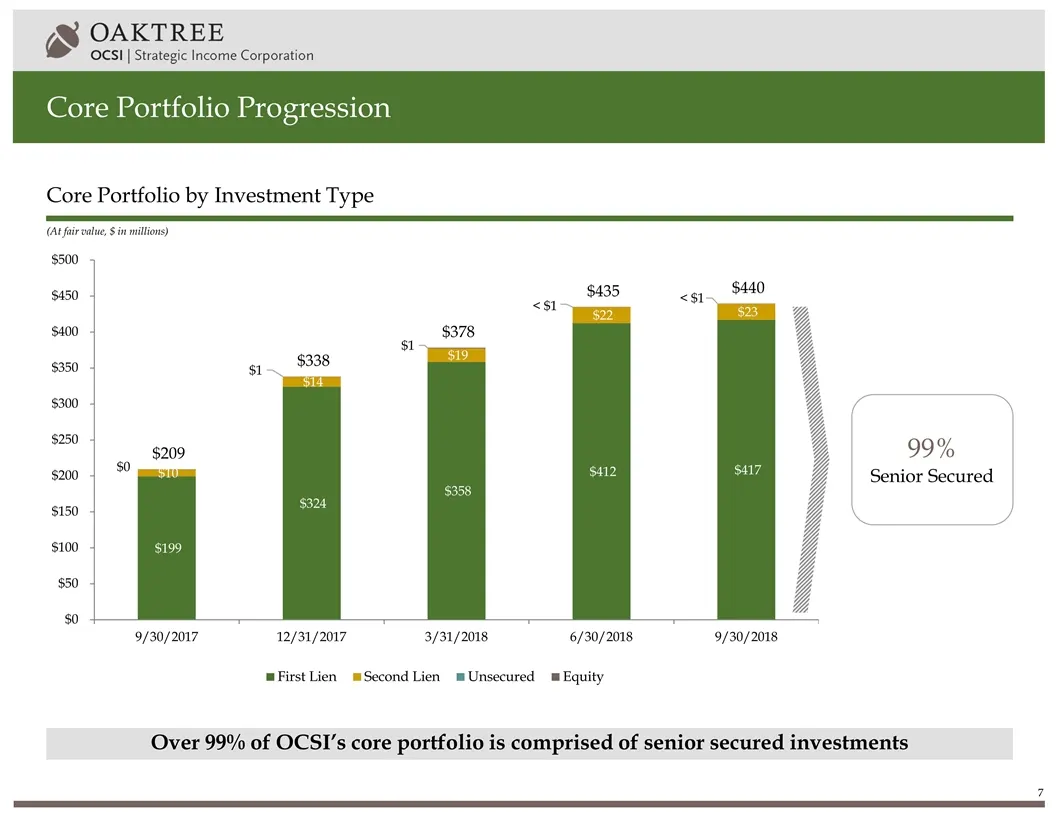
Core Portfolio Progression Over 99% of OCSI’s core portfolio is comprised of senior secured investments Core Portfolio by Investment Type (At fair value, $ in millions) 99% Senior Secured < $1
Slide 9: Portfolio Diversity
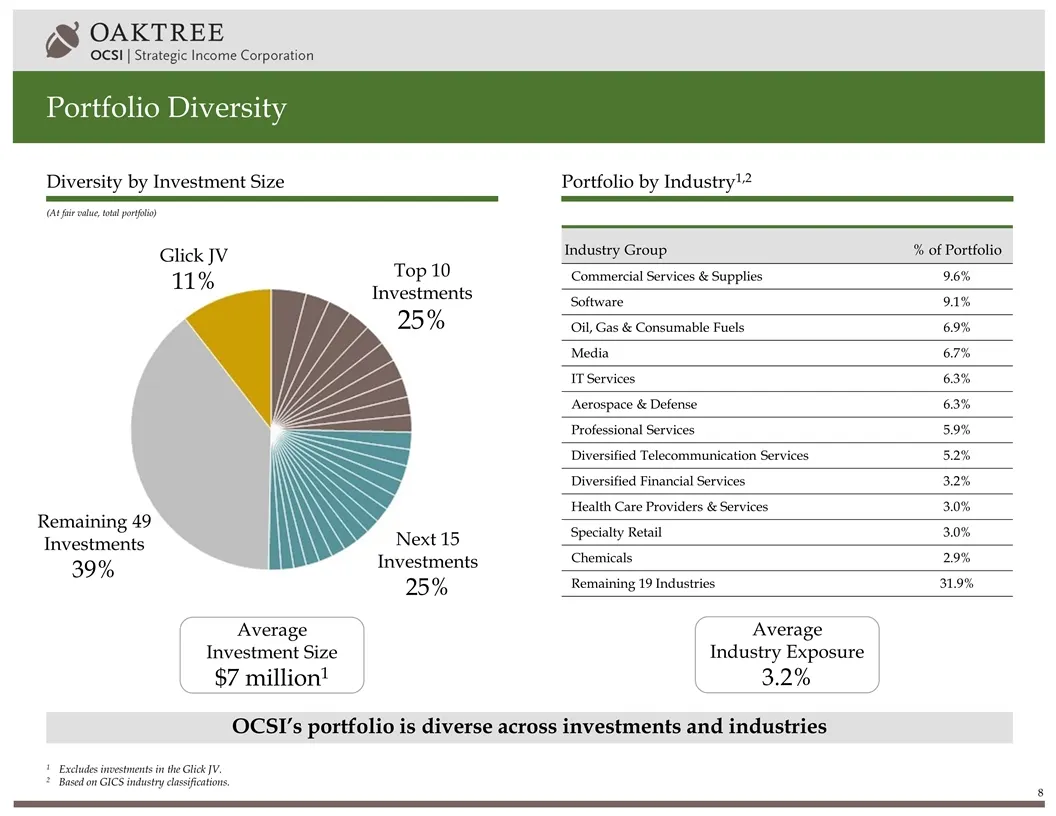
Portfolio Diversity OCSI’s portfolio is diverse across investments and industries (At fair value, total portfolio) Portfolio by Industry1,2 Diversity by Investment Size Top 10 Investments 25% Next 15 Investments 25% Remaining 49 Investments 39% Glick JV 11% Average Investment Size $7 million1 Indust
Slide 10: Debt Portfolio Company Metrics
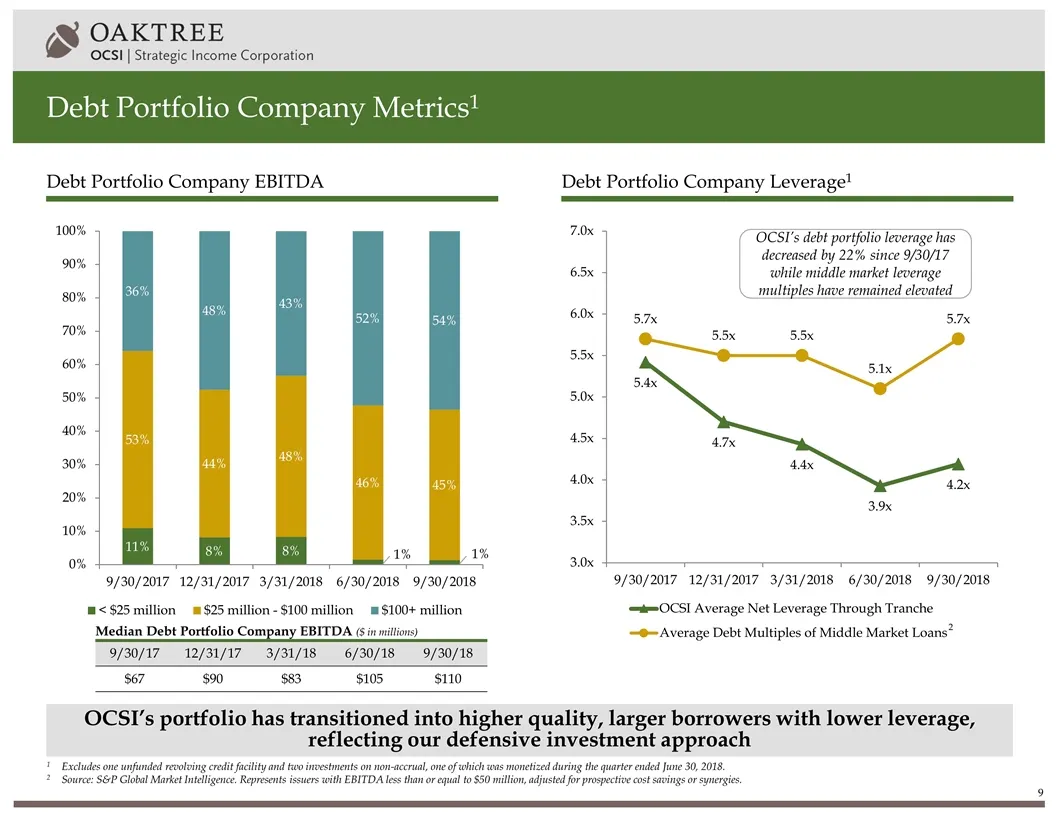
Debt Portfolio Company Metrics1 OCSI’s portfolio has transitioned into higher quality, larger borrowers with lower leverage, reflecting our defensive investment approach Debt Portfolio Company EBITDA Debt Portfolio Company Leverage1 Median Debt Portfolio Company EBITDA ($ in millions) OCSI’s debt po
Slide 11: Q4 2018 Portfolio Originations
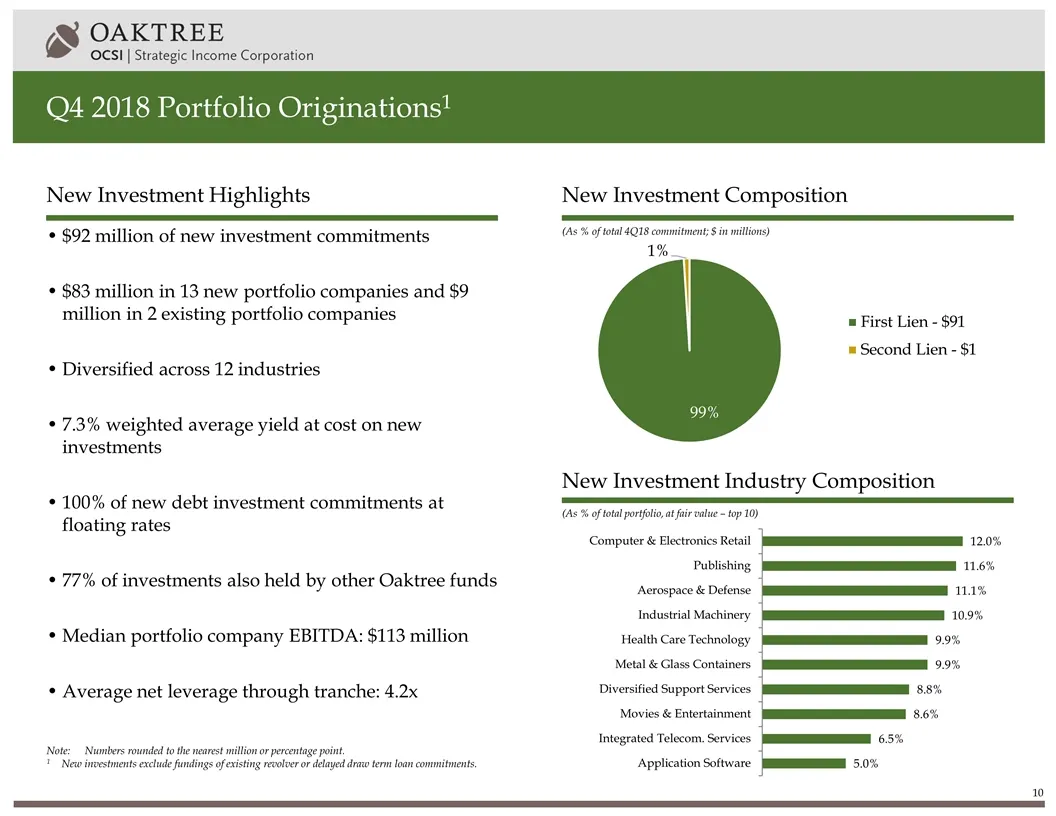
Q4 2018 Portfolio Originations1 $92 million of new investment commitments $83 million in 13 new portfolio companies and $9 million in 2 existing portfolio companies Diversified across 12 industries 7.3% weighted average yield at cost on new investments 100% of new debt investment commitments at floa
Slide 12: Historical Financial Information: Operating Results
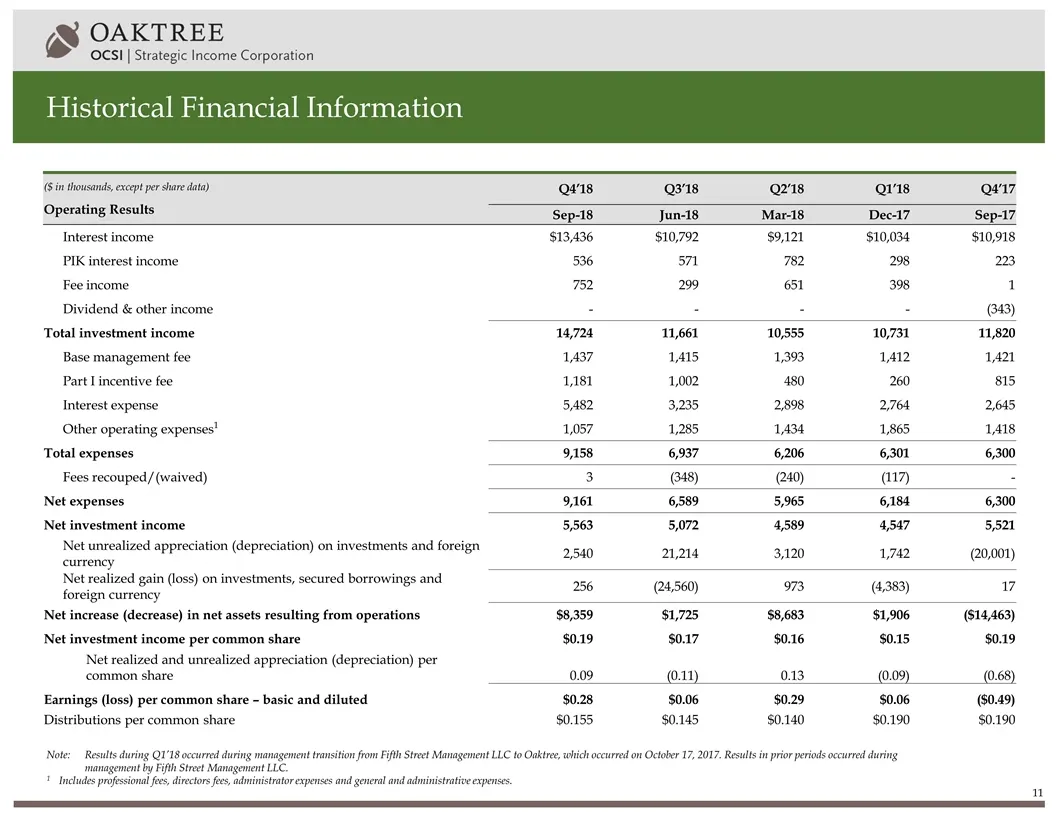
Historical Financial Information ($ in thousands, except per share data) Operating Results Q4’18 Q3’18 Q2’18 Q1’18 Q4’17 Sep-18 Jun-18 Mar-18 Dec-17 Sep-17 Interest income $13,436 $10,792 $9,121 $10,034 $10,918 PIK interest income 536 571 782 298 223 Fee income 752 299 651 398 1 Dividend & other inc
Slide 13: Historical Financial Information: Select Balance Sheet and Other Data
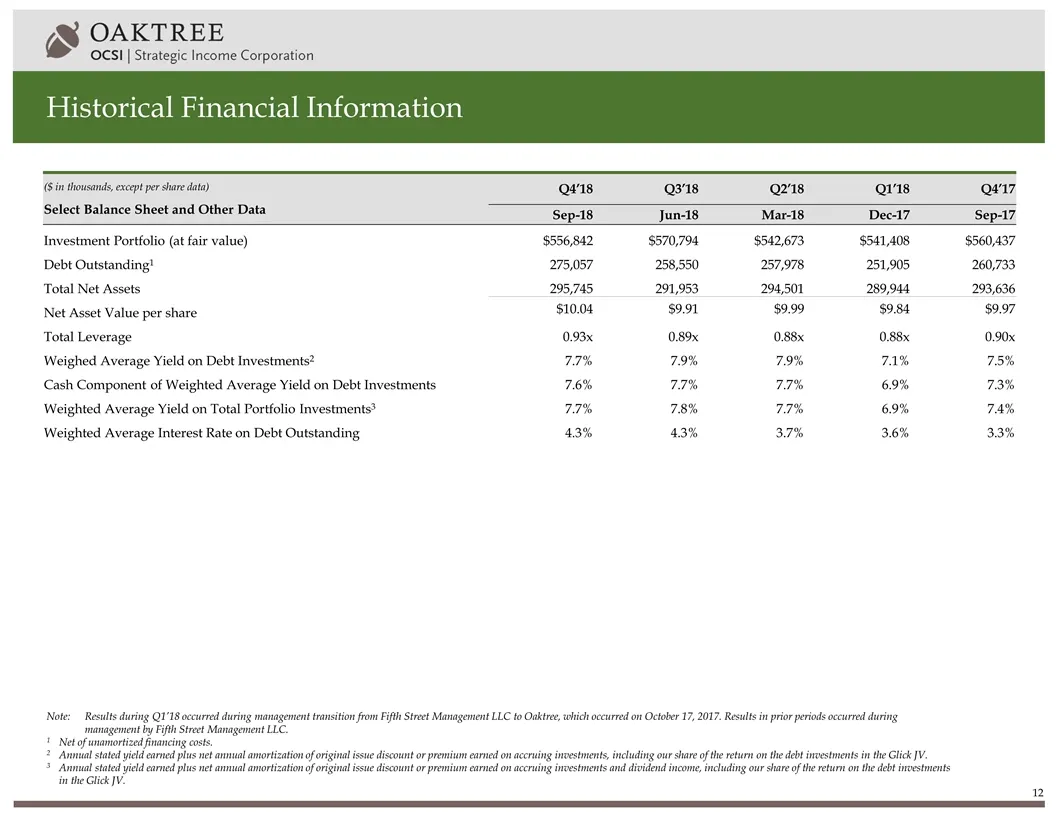
Historical Financial Information ($ in thousands, except per share data) Select Balance Sheet and Other Data Q4’18 Q3’18 Q2’18 Q1’18 Q4’17 Sep-18 Jun-18 Mar-18 Dec-17 Sep-17 Investment Portfolio (at fair value) $556,842 $570,794 $542,673 $541,408 $560,437 Debt Outstanding1 275,057 258,550 257,978 25
Slide 14: Historical Portfolio Activity
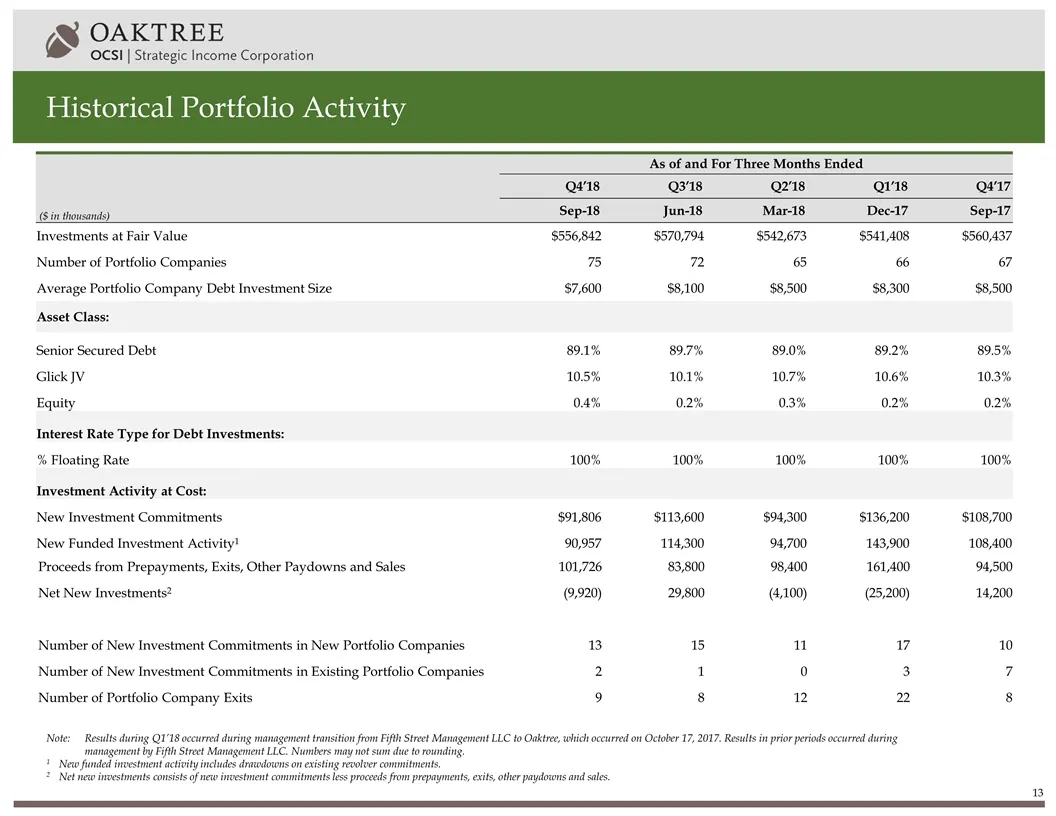
Historical Portfolio Activity ($ in thousands) As of and For Three Months Ended Q4’18 Q3’18 Q2’18 Q1’18 Q4’17 Sep-18 Jun-18 Mar-18 Dec-17 Sep-17 Investments at Fair Value $556,842 $570,794 $542,673 $541,408 $560,437 Number of Portfolio Companies 75 72 65 66 67 Average Portfolio Company Debt Investme
Slide 15: Net Asset Value Per Share Bridge
Net Asset Value Per Share Bridge Note:Net asset value per share amounts are based on the shares outstanding at each respective quarter end. Net investment income per share, net unrealized appreciation / (depreciation), and net realized gain / (loss) are based on the weighted average number of shares
Slide 16: Capital Structure Overview
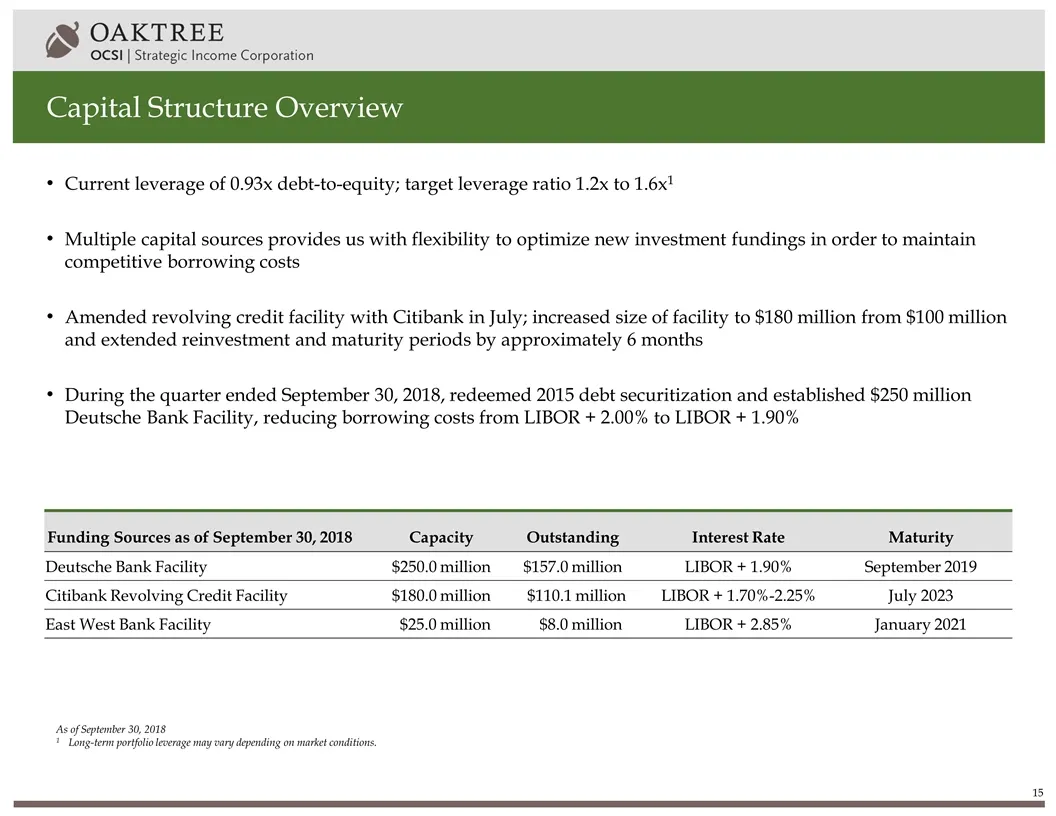
Capital Structure Overview As of September 30, 2018 1Long-term portfolio leverage may vary depending on market conditions. Current leverage of 0.93x debt-to-equity; target leverage ratio 1.2x to 1.6x1 Multiple capital sources provides us with flexibility to optimize new investment fundings in order
Slide 17: Opportunities to Increase Return on Equity
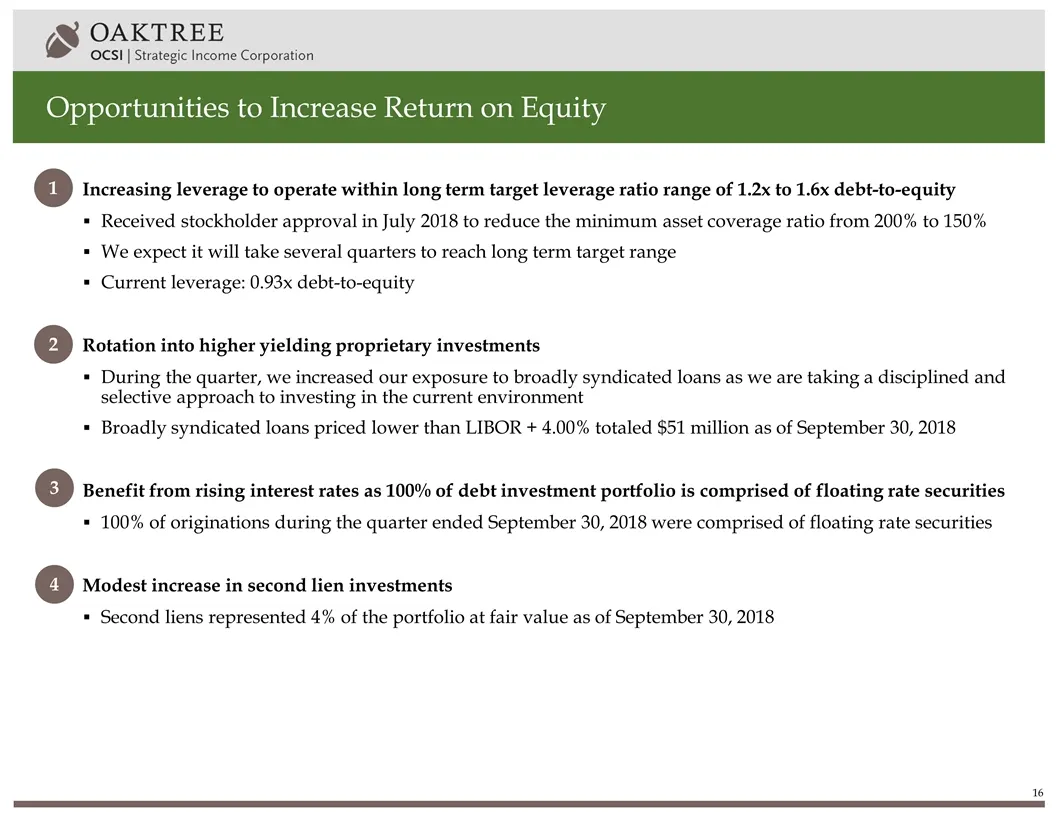
Opportunities to Increase Return on Equity Increasing leverage to operate within long term target leverage ratio range of 1.2x to 1.6x debt-to-equity Received stockholder approval in July 2018 to reduce the minimum asset coverage ratio from 200% to 150% We expect it will take several quarters to rea
Slide 18: Appendix
AY OAKTREE OCSI | Strategic Income Corporation Appendix
Slide 19: Portfolio Summary: Core vs. Non-core Assets
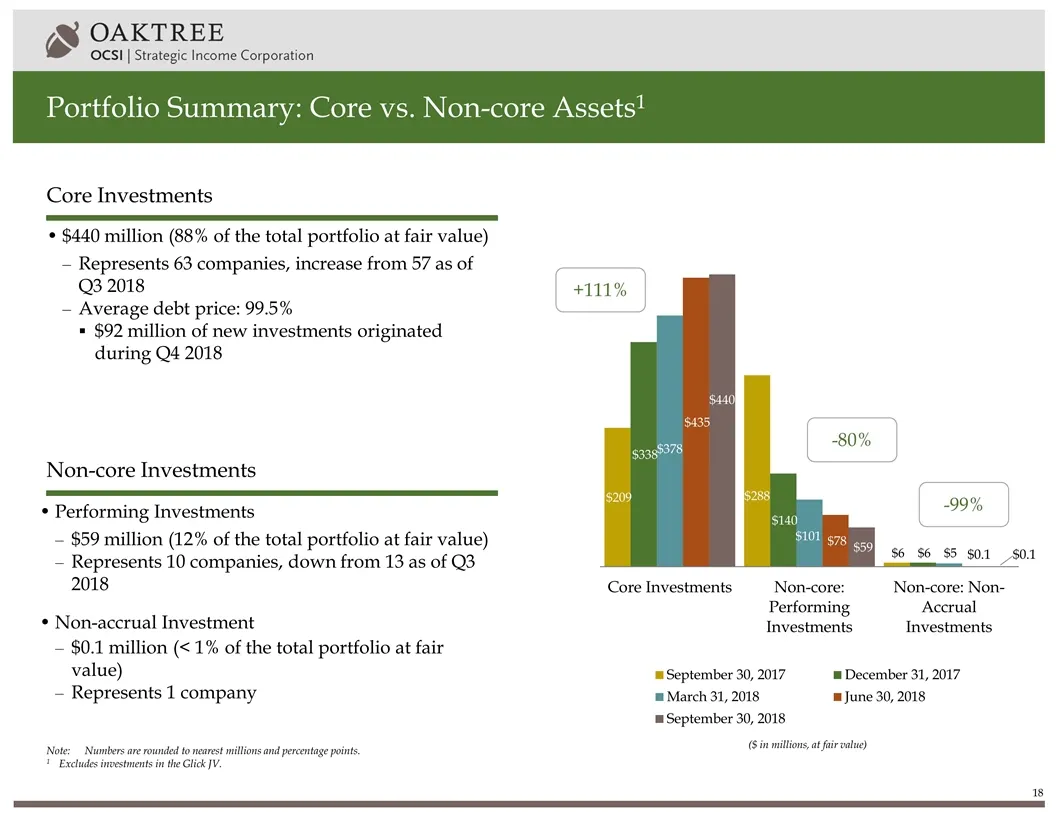
Portfolio Summary: Core vs. Non-core Assets1 ($ in millions, at fair value) $440 million (88% of the total portfolio at fair value) Represents 63 companies, increase from 57 as of Q3 2018 Average debt price: 99.5% $92 million of new investments originated during Q4 2018 Core Investments Non-core Inv
Slide 20: Non-core: Performing Portfolio Characteristics
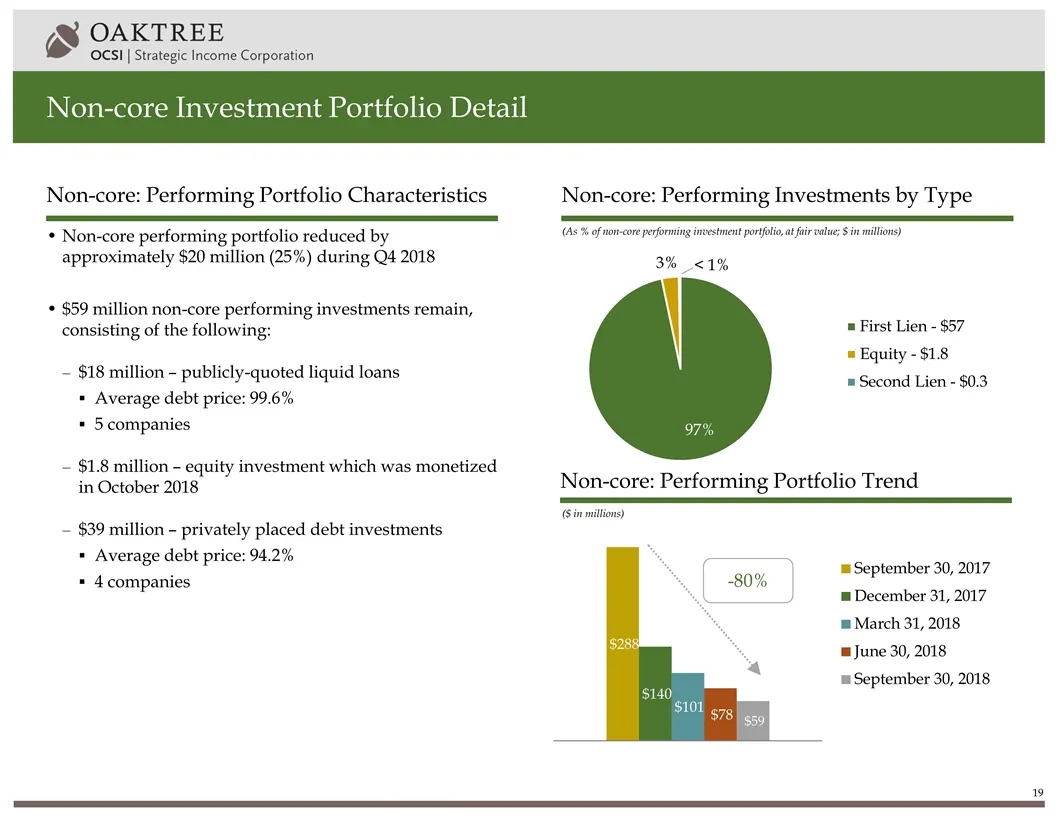
Non-core: Performing Portfolio Characteristics Non-core performing portfolio reduced by approximately $20 million (25%) during Q4 2018 $59 million non-core performing investments remain, consisting of the following: $18 million – publicly-quoted liquid loans Average debt price: 99.6% 5 companies $1.
Slide 21: Contact: Investor Relations
Contact: Michael Mosticchio, Investor Relations ocsi-ir@oaktreecapital.com
Source: SEC EDGAR · 8-K filed Nov 29, 2018
More decks from Oaktree Strategic Income Corporation
 Q1 2021 Earnings Presentation28 slides · Feb 17, 2021
 Q1 2021 Earnings Presentation33 slides · Feb 17, 2021
 Q1 FY2021 Earnings Presentation19 slides · Feb 4, 2021
 Q1 FY2021 Earnings Presentation23 slides · Feb 4, 2021
 Merger or Acquisition (December 2020)27 slides · Dec 8, 2020
 Q4 2020 Earnings Presentation34 slides · Dec 8, 2020