Oaktree Strategic Income Corporation
Oaktree Strategic Income — Merger or Acquisition (December 2020)
27 slides from Oaktree Strategic Income's merger presentation, Dec 8, 2020
Slide 1: Investor Presentation Fourth Quarter 2020
Investor Presentation Fourth Quarter 2020 Nasdaq: OCSI Filed by Oaktree Strategic Income Corporation pursuant to Rule 425 under the Securities Act of 1933 and deemed filed under Rule 14a-12 of the Securities Exchange Act of 1934 Subject Company: Oaktree Strategic Income Corporation Commission File N
Slide 2: Forward Looking Statements & Legal Disclosures
Forward Looking Statements & Legal Disclosures Some of the statements in this presentation constitute forward-looking statements because they relate to future events or our future performance or financial condition. The forward-looking statements contained in this presentation may include statements
Slide 3: Forward Looking Statements & Legal Disclosures (continued)
Forward Looking Statements & Legal Disclosures (continued) Calculation of Assets Under Management References to total "assets under management" or "AUM" represent assets managed by Oaktree and a proportionate amount of the AUM reported by DoubleLine Capital LP ("DoubleLine Capital"), in which Oaktre
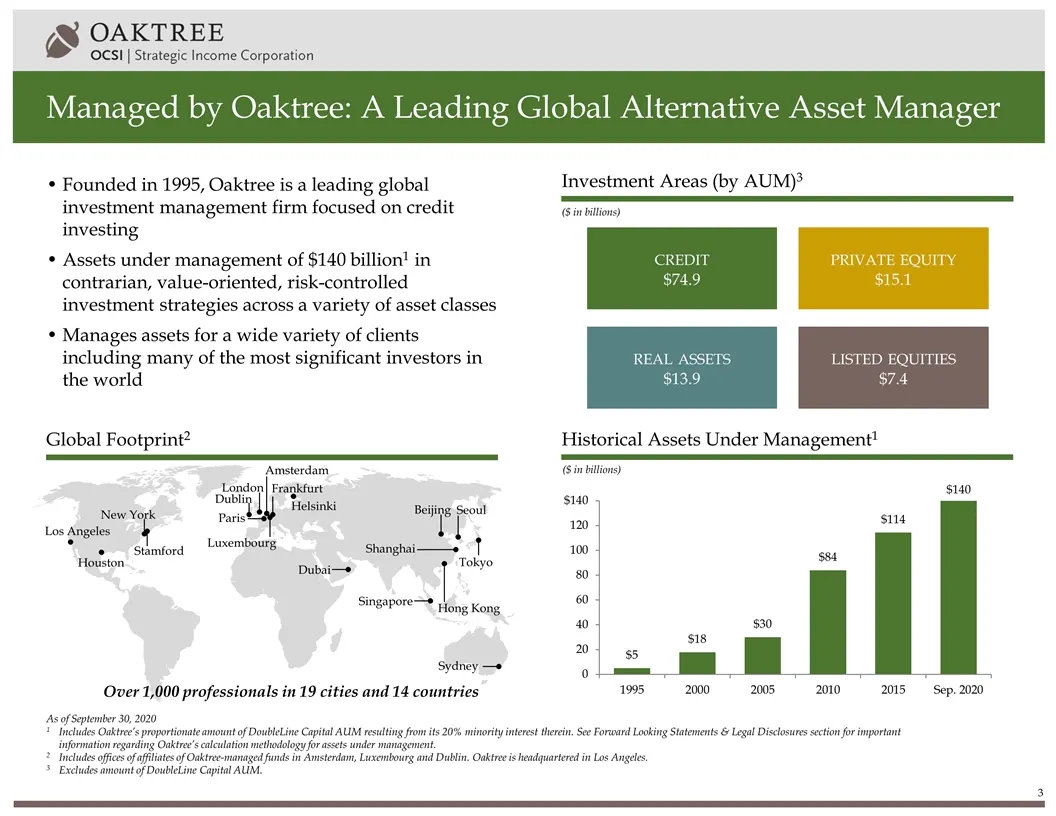
Slide 4: Managed by Oaktree: A Leading Global Alternative Asset Manager
Managed by Oaktree: A Leading Global Alternative Asset Manager ($ in billions) Investment Areas (by AUM)3 Founded in 1995, Oaktree is a leading global investment management firm focused on credit investing Assets under management of $140 billion1 in contrarian, value-oriented, risk-controlled invest
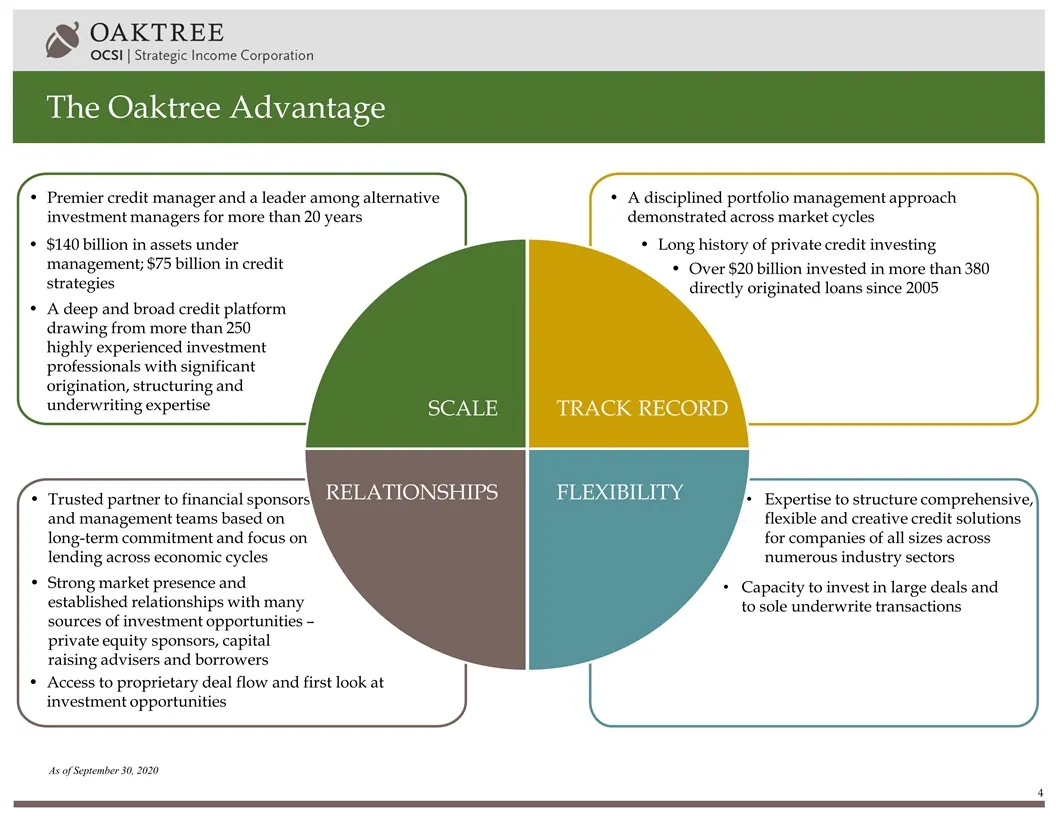
Slide 5: The Oaktree Advantage
Trusted partner to financial sponsors and management teams based on long-term commitment and focus on lending across economic cycles Strong market presence and established relationships with many sources of investment opportunities – private equity sponsors, capital raising advisers and borrowers Th
Slide 6: Experienced Management Team
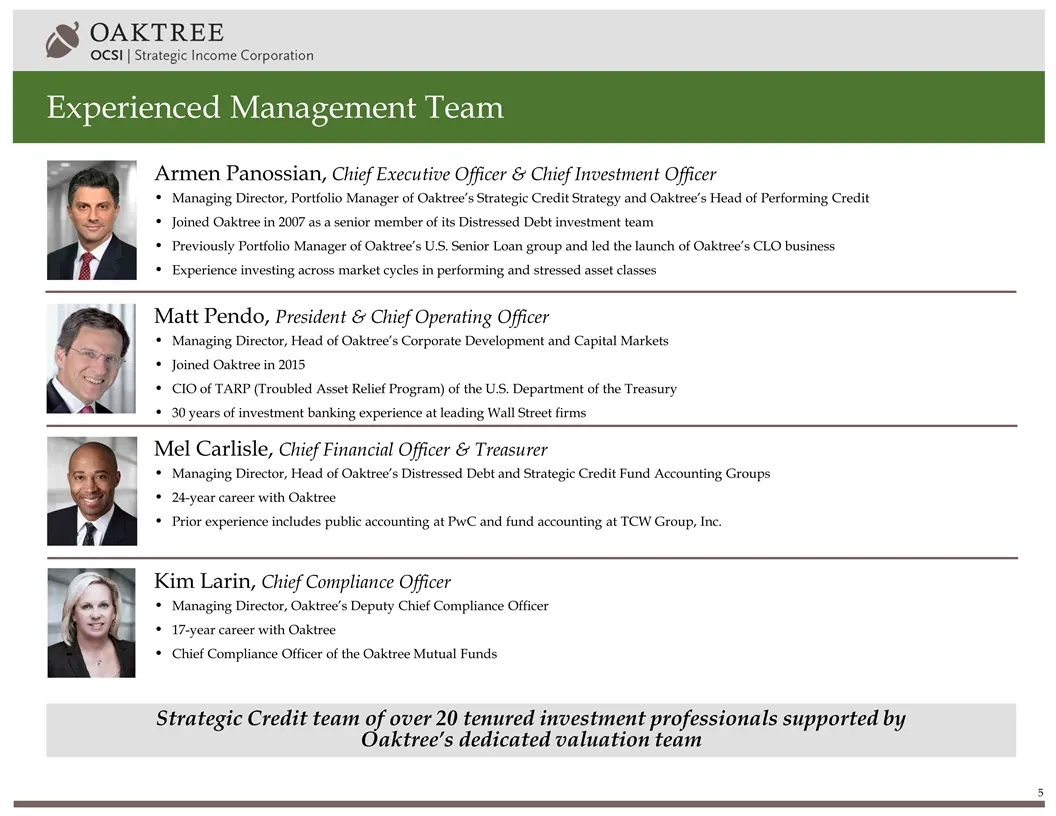
Experienced Management Team Strategic Credit team of over 20 tenured investment professionals supported by Oaktree’s dedicated valuation team Mel Carlisle, Chief Financial Officer & Treasurer Managing Director, Head of Oaktree’s Distressed Debt and Strategic Credit Fund Accounting Groups 24-year car
Slide 7: Oaktree's Investment Philosophy
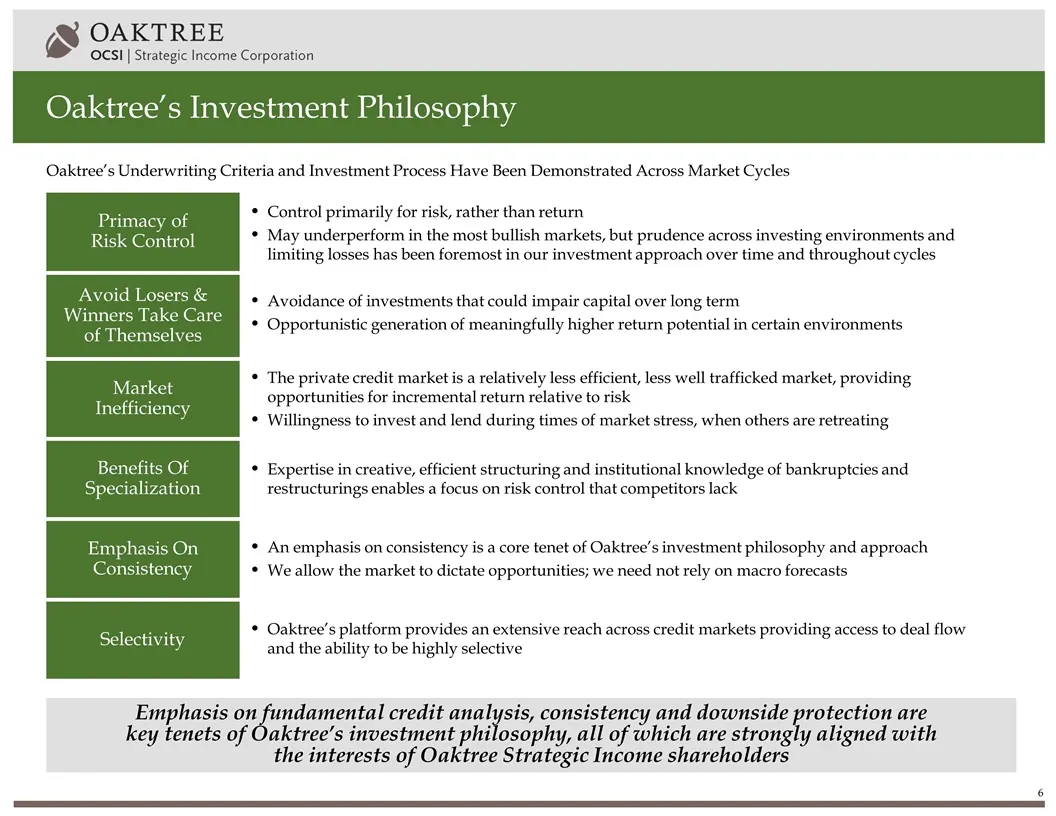
Oaktree’s Investment Philosophy Emphasis on fundamental credit analysis, consistency and downside protection are key tenets of Oaktree’s investment philosophy, all of which are strongly aligned with the interests of Oaktree Strategic Income shareholders Primacy of Risk Control Control primarily for
Slide 8: Oaktree's Approach to Direct Lending
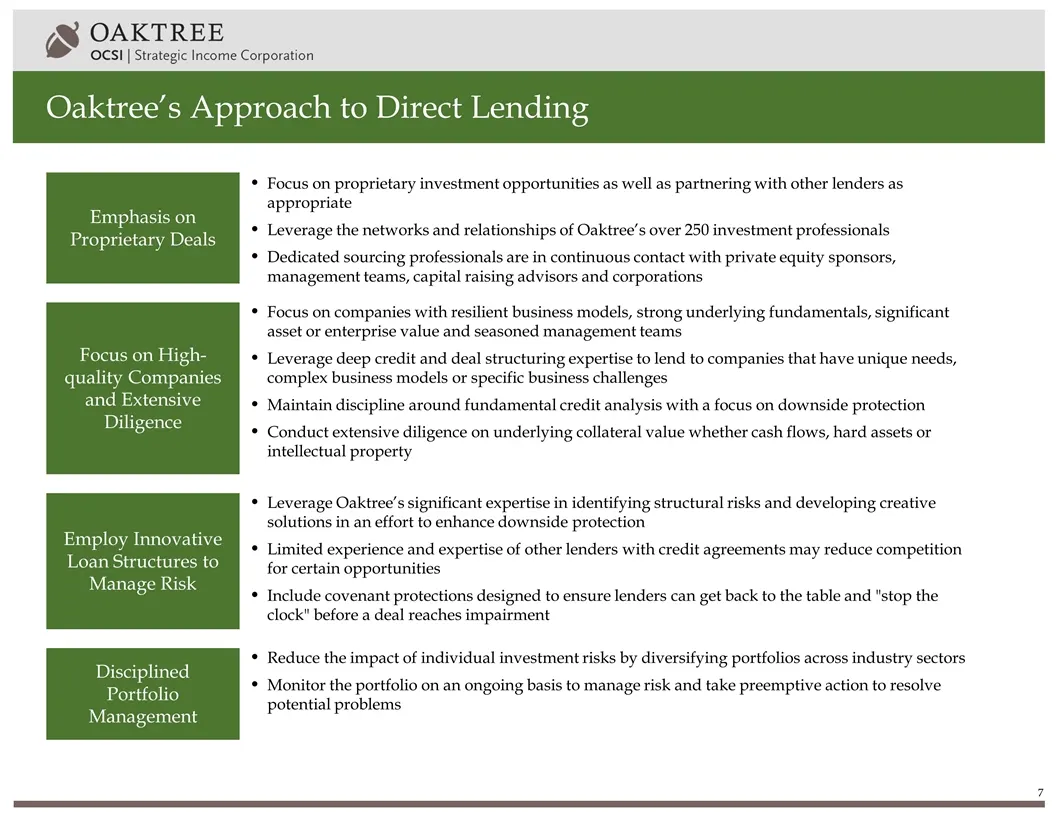
Oaktree’s Approach to Direct Lending Focus on proprietary investment opportunities as well as partnering with other lenders as appropriate Leverage the networks and relationships of Oaktree’s over 250 investment professionals Dedicated sourcing professionals are in continuous contact with private eq
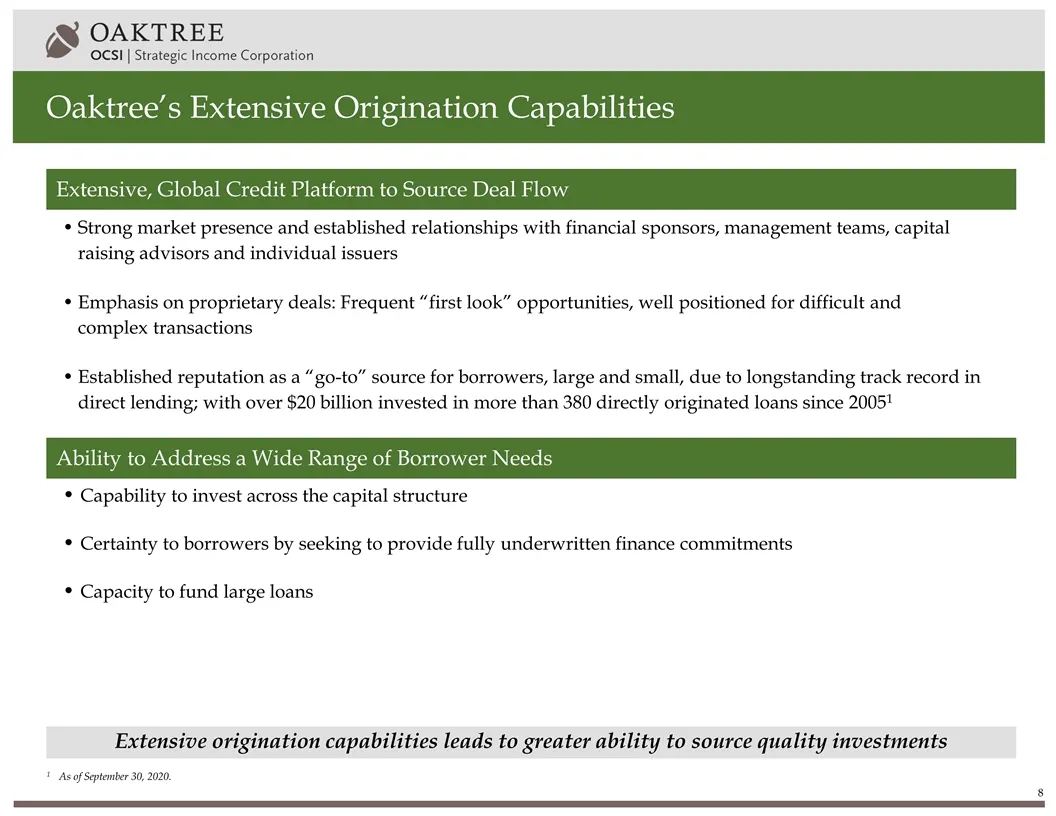
Slide 9: Ability to Address a Wide Range of Borrower Needs
Ability to Address a Wide Range of Borrower Needs Extensive, Global Credit Platform to Source Deal Flow Oaktree’s Extensive Origination Capabilities Strong market presence and established relationships with financial sponsors, management teams, capital raising advisors and individual issuers Emphasi
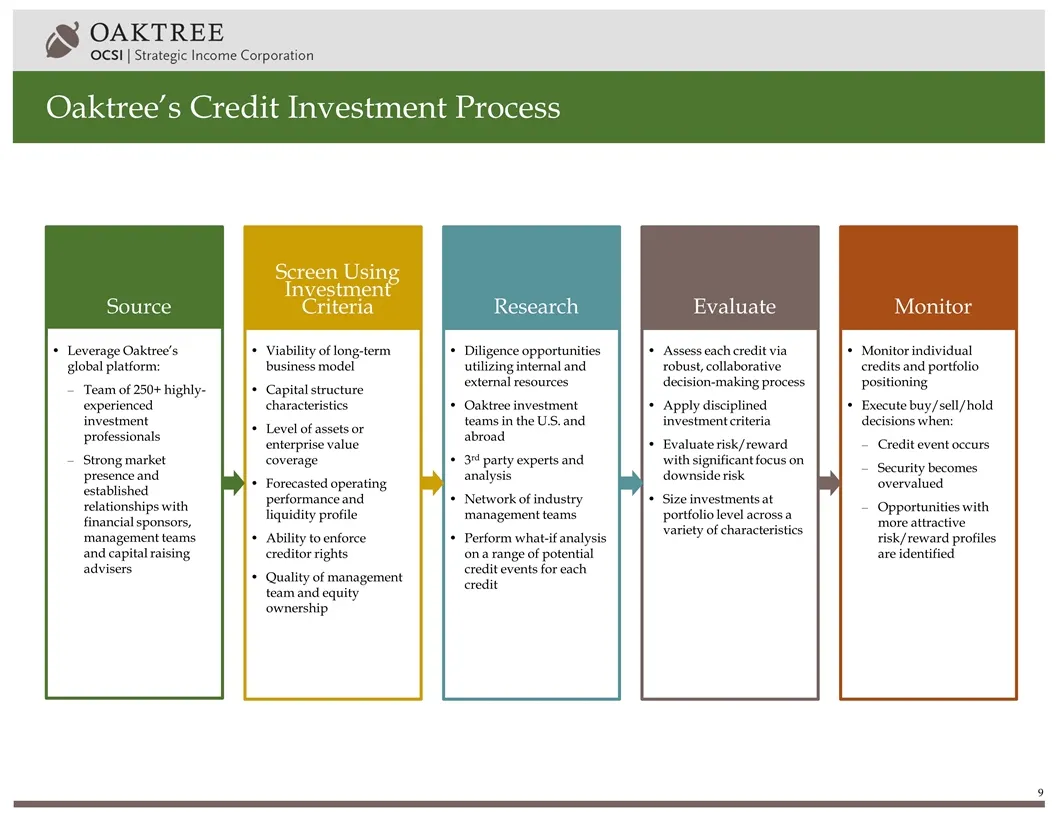
Slide 10: Oaktree's Credit Investment Process
Oaktree’s Credit Investment Process Source Leverage Oaktree’s global platform: Team of 250+ highly- experienced investment professionals Strong market presence and established relationships with financial sponsors, management teams and capital raising advisers Screen Using Investment Criteria Viabil
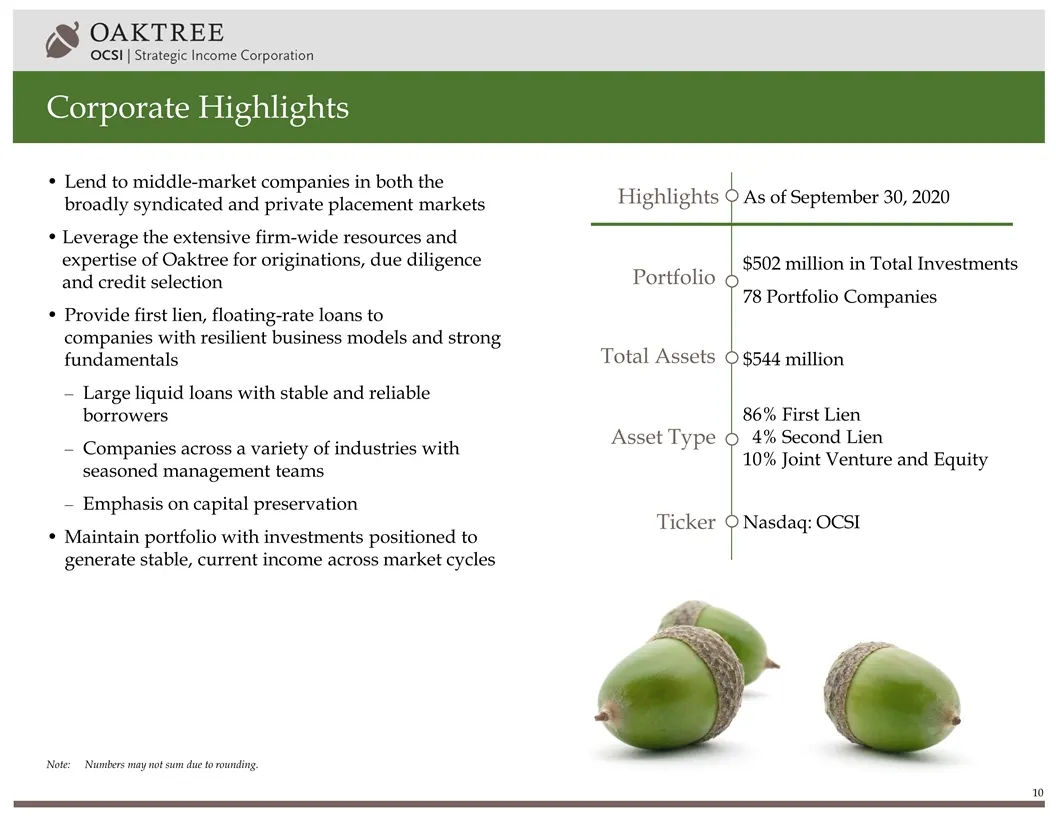
Slide 11: Corporate Highlights
Corporate Highlights Lend to middle-market companies in both the broadly syndicated and private placement markets Leverage the extensive firm-wide resources and expertise of Oaktree for originations, due diligence and credit selection Provide first lien, floating-rate loans to companies with resilie
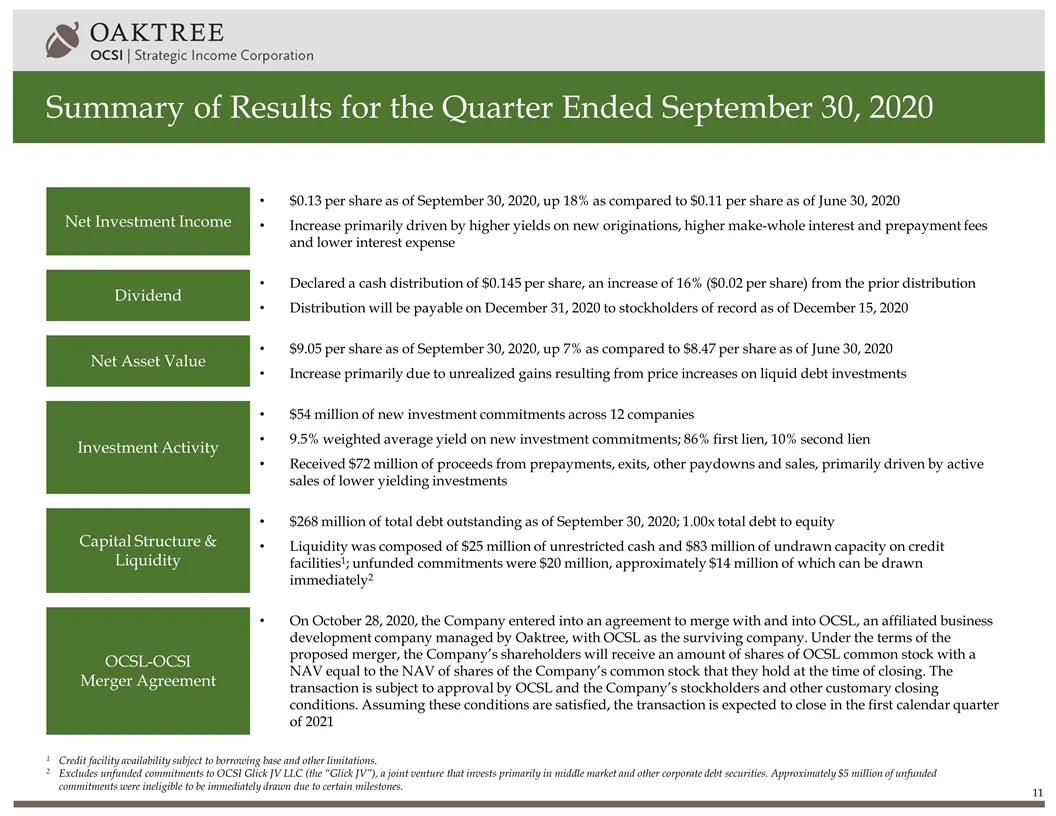
Slide 12: Summary of Results for the Quarter Ended September 30, 2020
Summary of Results for the Quarter Ended September 30, 2020 Net Investment Income $0.13 per share as of September 30, 2020, up 18% as compared to $0.11 per share as of June 30, 2020 Increase primarily driven by higher yields on new originations, higher make-whole interest and prepayment fees and low
Slide 13: Portfolio Summary as of September 30, 2020
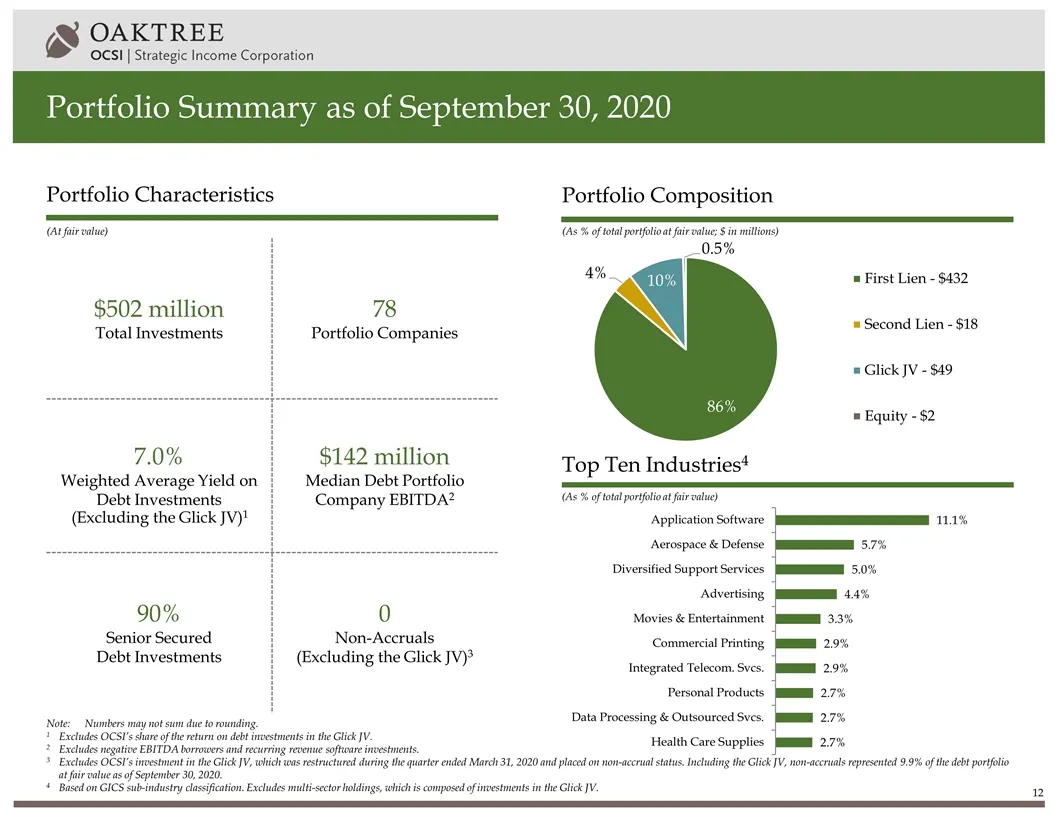
Portfolio Summary as of September 30, 2020 (As % of total portfolio at fair value; $ in millions) (As % of total portfolio at fair value) Portfolio Composition Top Ten Industries4 Portfolio Characteristics Note:Numbers may not sum due to rounding. 1Excludes OCSI’s share of the return on debt investm
Slide 14: Portfolio Diversity
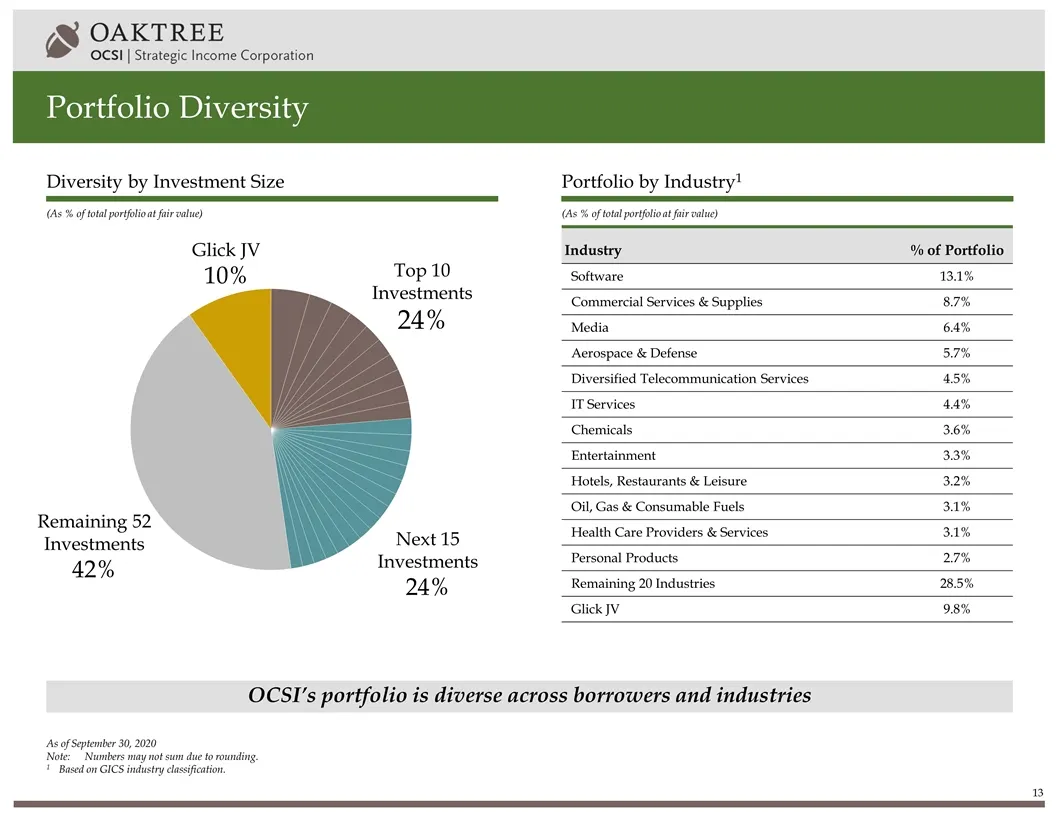
Portfolio Diversity OCSI’s portfolio is diverse across borrowers and industries (As % of total portfolio at fair value) (As % of total portfolio at fair value) Portfolio by Industry1 Diversity by Investment Size Top 10 Investments 24% Next 15 Investments 24% Remaining 52 Investments 42% Glick JV 10%
Slide 15: Portfolio Originations
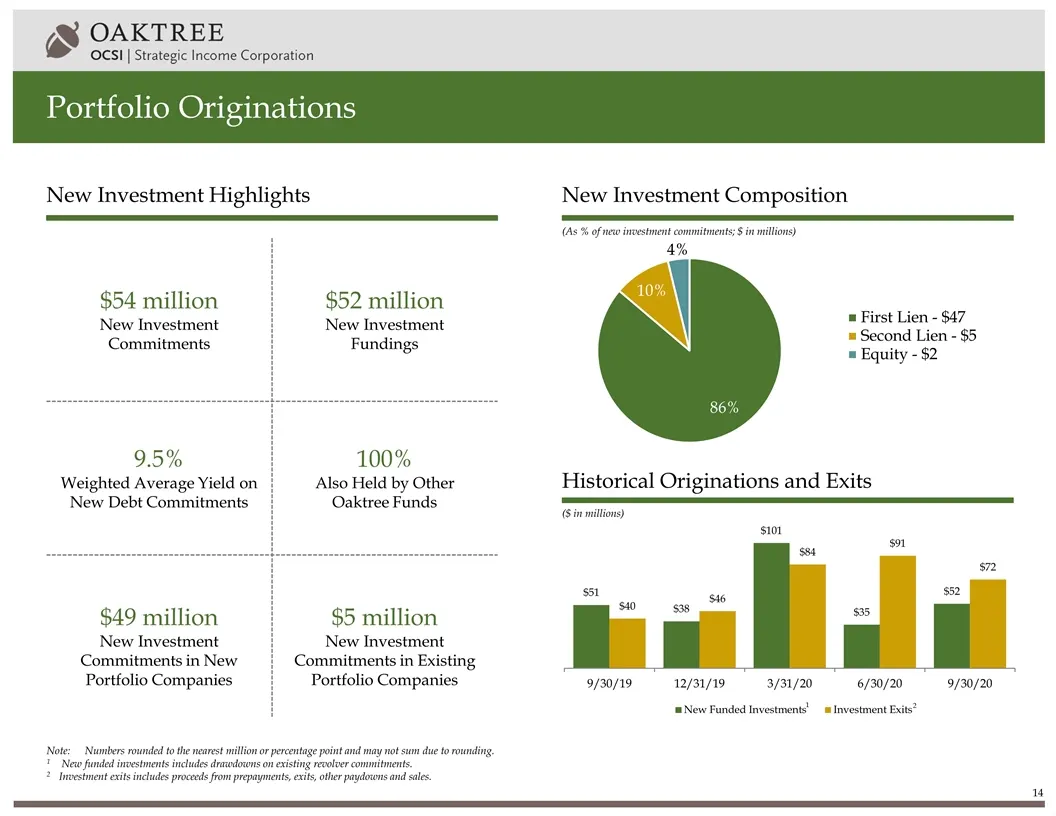
Portfolio Originations New Investment Highlights ($ in millions) Historical Originations and Exits (As % of new investment commitments; $ in millions) New Investment Composition Note:Numbers rounded to the nearest million or percentage point and may not sum due to rounding. 1 New funded investments
Slide 16: Non-Core Investment Portfolio Detail
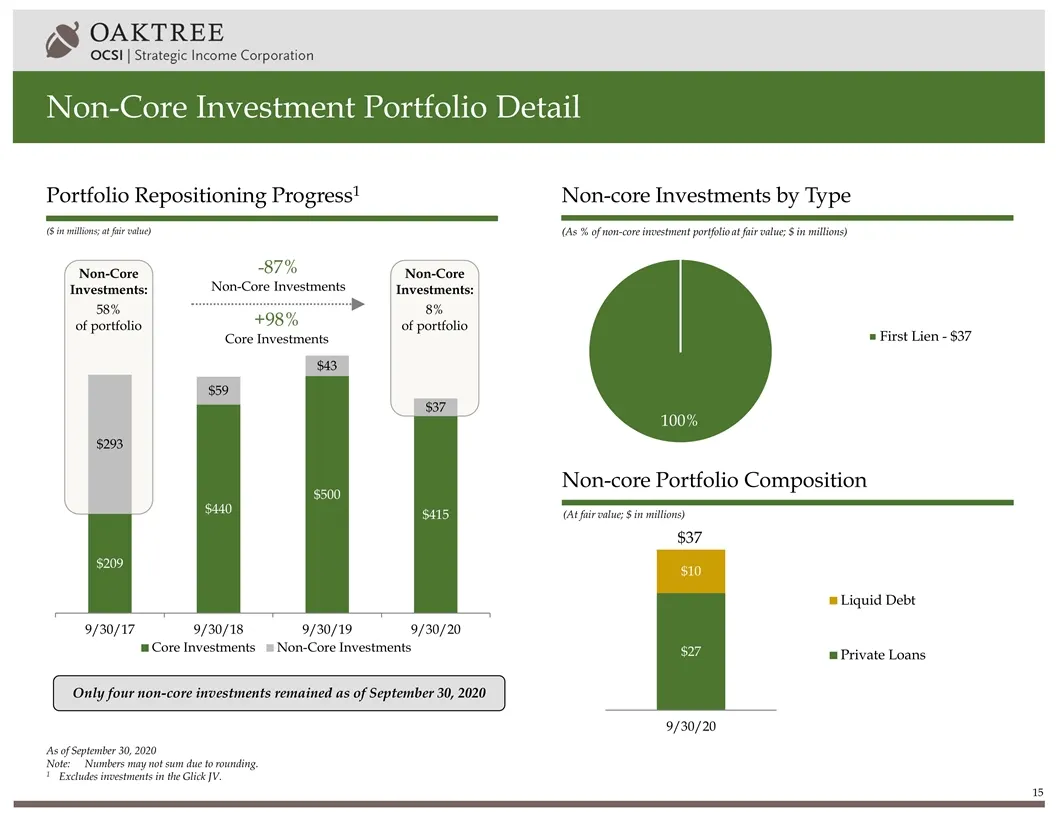
As of September 30, 2020 Note:Numbers may not sum due to rounding. 1Excludes investments in the Glick JV. Non-Core Investment Portfolio Detail Portfolio Repositioning Progress1 (As % of non-core investment portfolio at fair value; $ in millions) Non-core Investments by Type (At fair value; $ in mill
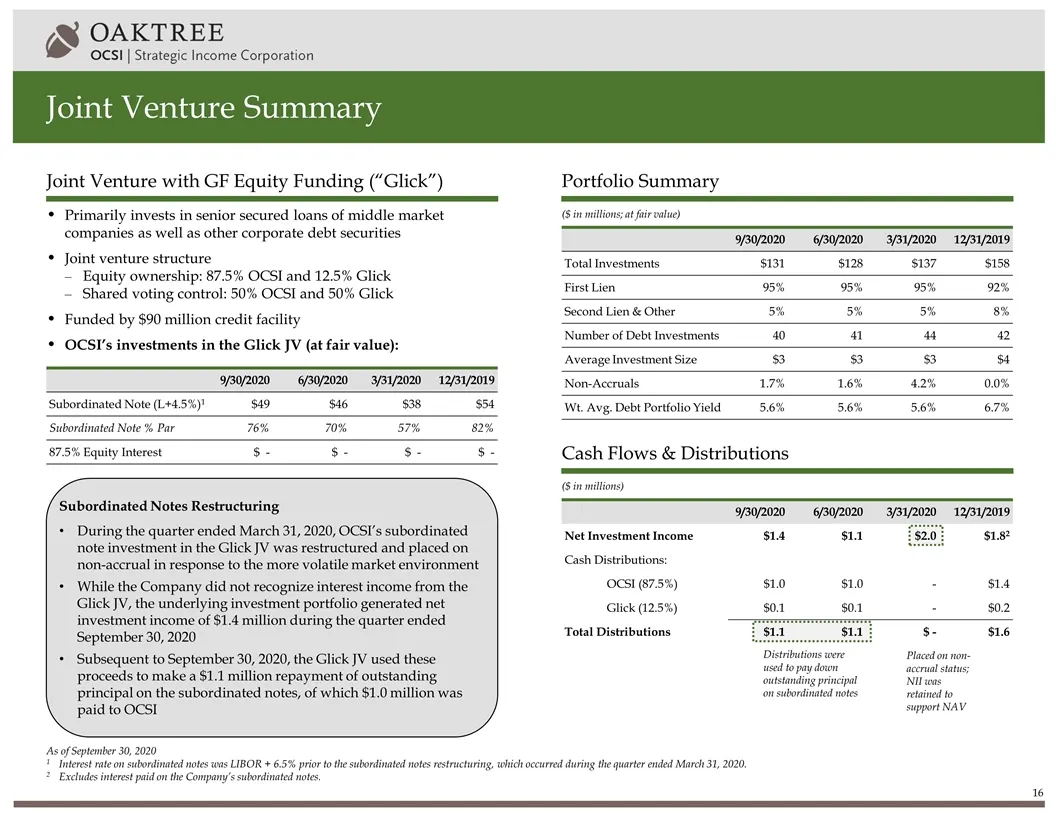
Slide 17: Joint Venture Summary
Joint Venture Summary ($ in millions; at fair value) ($ in millions) Joint Venture with GF Equity Funding (“Glick”) Portfolio Summary Cash Flows & Distributions As of September 30, 2020 1Interest rate on subordinated notes was LIBOR + 6.5% prior to the subordinated notes restructuring, which occurre
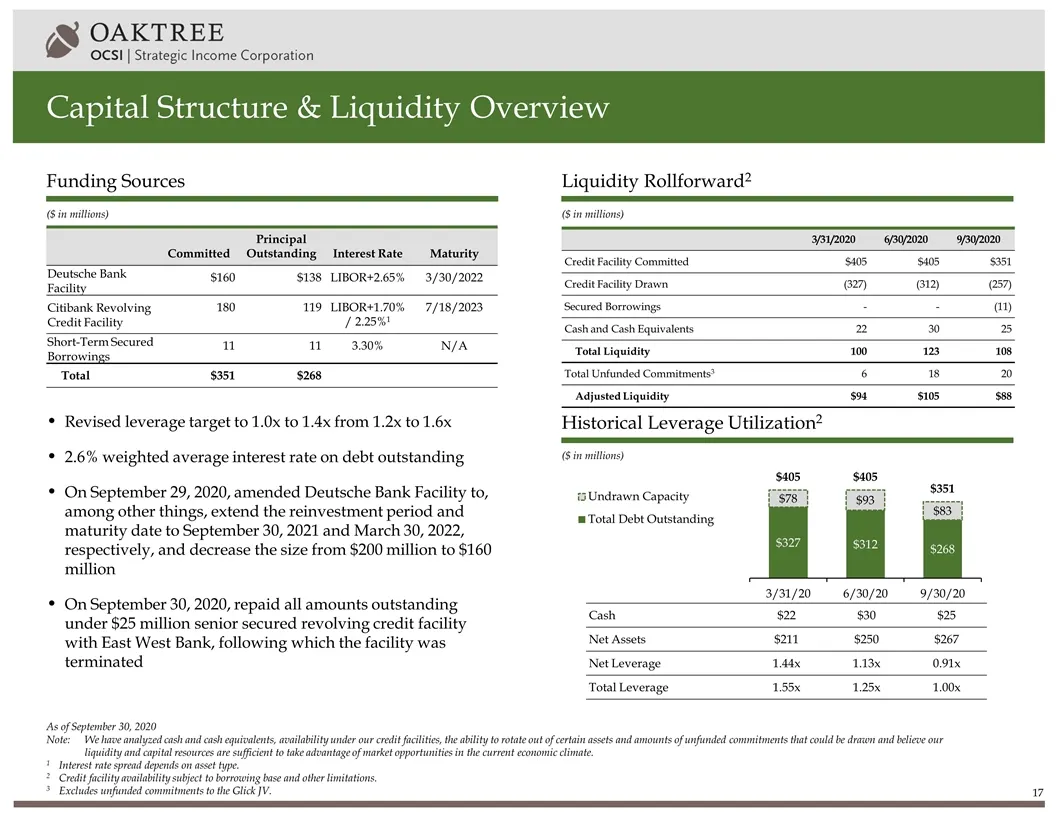
Slide 18: Capital Structure & Liquidity Overview
Capital Structure & Liquidity Overview ($ in millions) ($ in millions) ($ in millions) Funding Sources Liquidity Rollforward2 Historical Leverage Utilization2 Committed Principal Outstanding Interest Rate Maturity Deutsche Bank Facility $160 $138 LIBOR+2.65% 3/30/2022 Citibank Revolving Credit Facil
Slide 19: Appendix
AY OAKTREE OCSI | Strategic Income Corporation Appendix
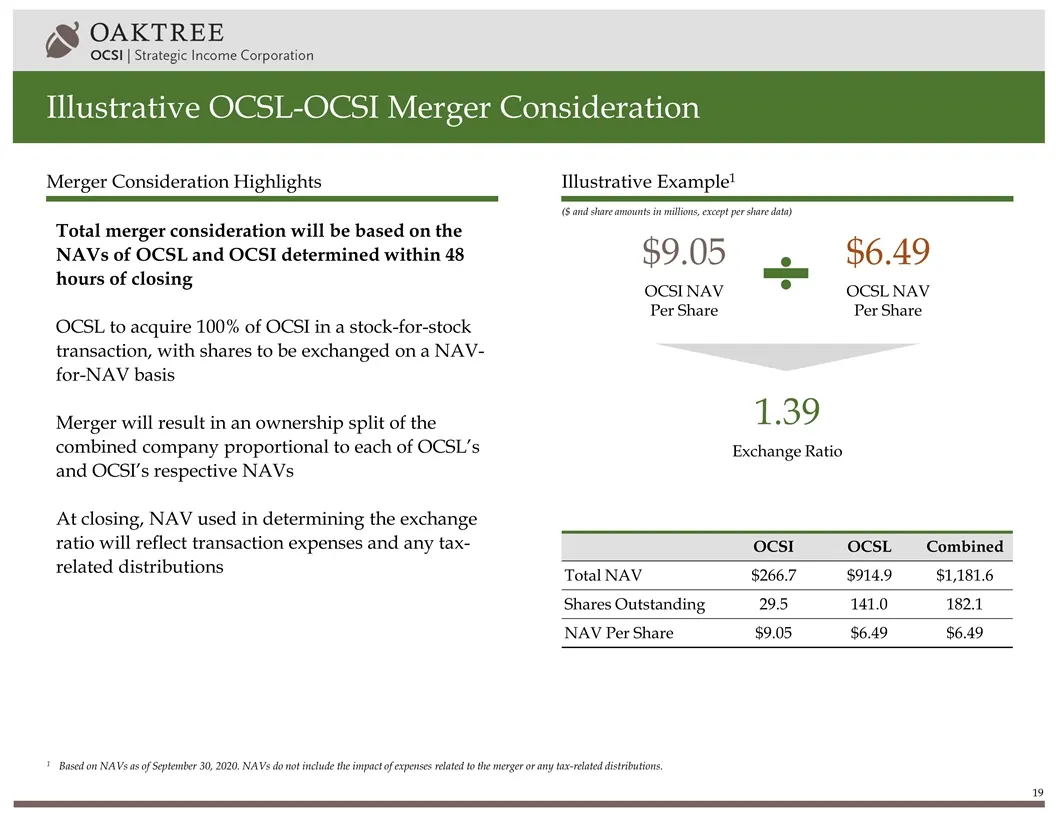
Slide 20: Illustrative OCSL-OCSI Merger Consideration
Illustrative OCSL-OCSI Merger Consideration Merger Consideration Highlights Illustrative Example1 OCSI OCSL Combined Total NAV $266.7 $914.9 $1,181.6 Shares Outstanding 29.5 141.0 182.1 NAV Per Share $9.05 $6.49 $6.49 Total merger consideration will be based on the NAVs of OCSL and OCSI determined w
Slide 21: OCSI & OCSL Comparison
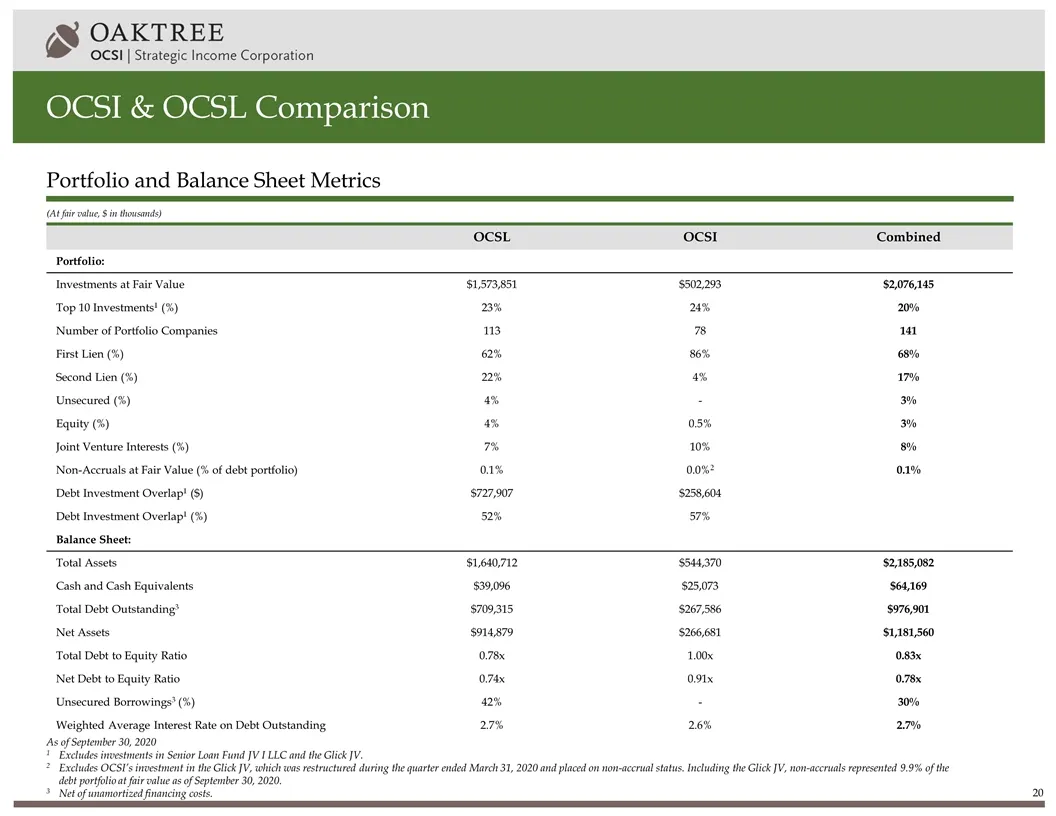
OCSI & OCSL Comparison (At fair value, $ in thousands) Portfolio and Balance Sheet Metrics OCSL OCSI Combined Portfolio: Investments at Fair Value $1,573,851 $502,293 $2,076,145 Top 10 Investments1 (%) 23% 24% 20% Number of Portfolio Companies 113 78 141 First Lien (%) 62% 86% 68% Second Lien (%) 22
Slide 22: Portfolio Highlights
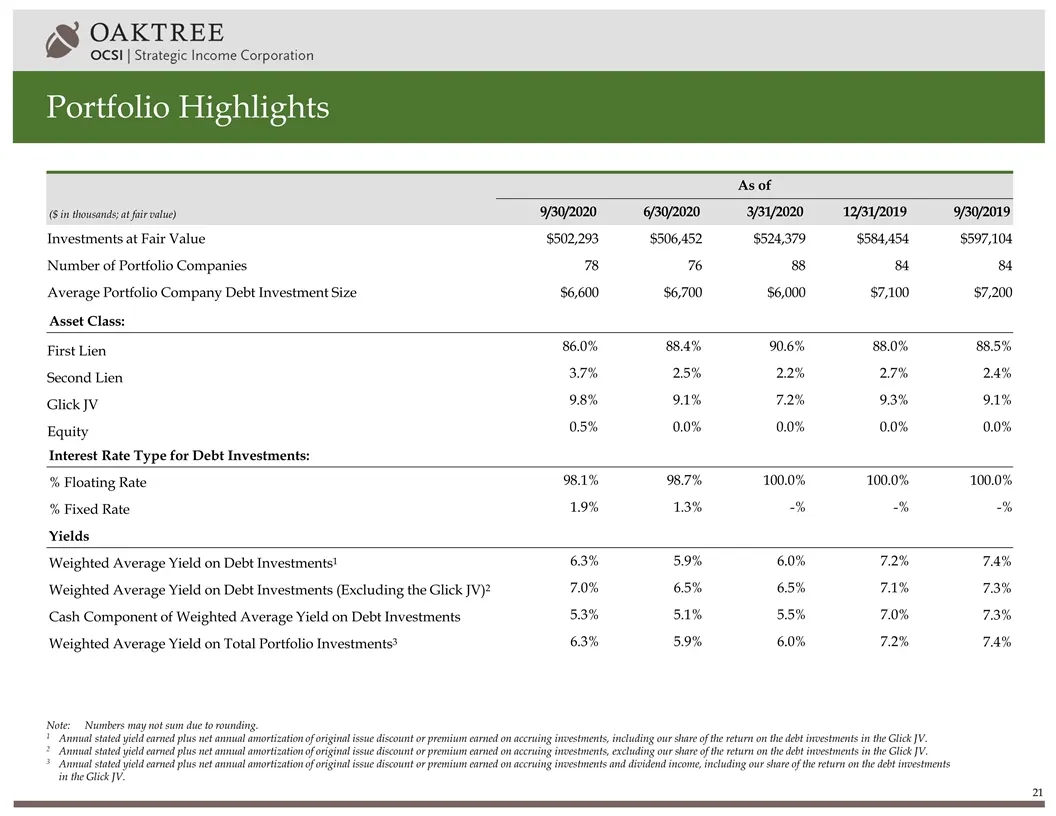
Portfolio Highlights ($ in thousands; at fair value) As of 9/30/2020 6/30/2020 3/31/2020 12/31/2019 9/30/2019 Investments at Fair Value $502,293 $506,452 $524,379 $584,454 $597,104 Number of Portfolio Companies 78 76 88 84 84 Average Portfolio Company Debt Investment Size $6,600 $6,700 $6,000 $7,100
Slide 23: Investment Activity
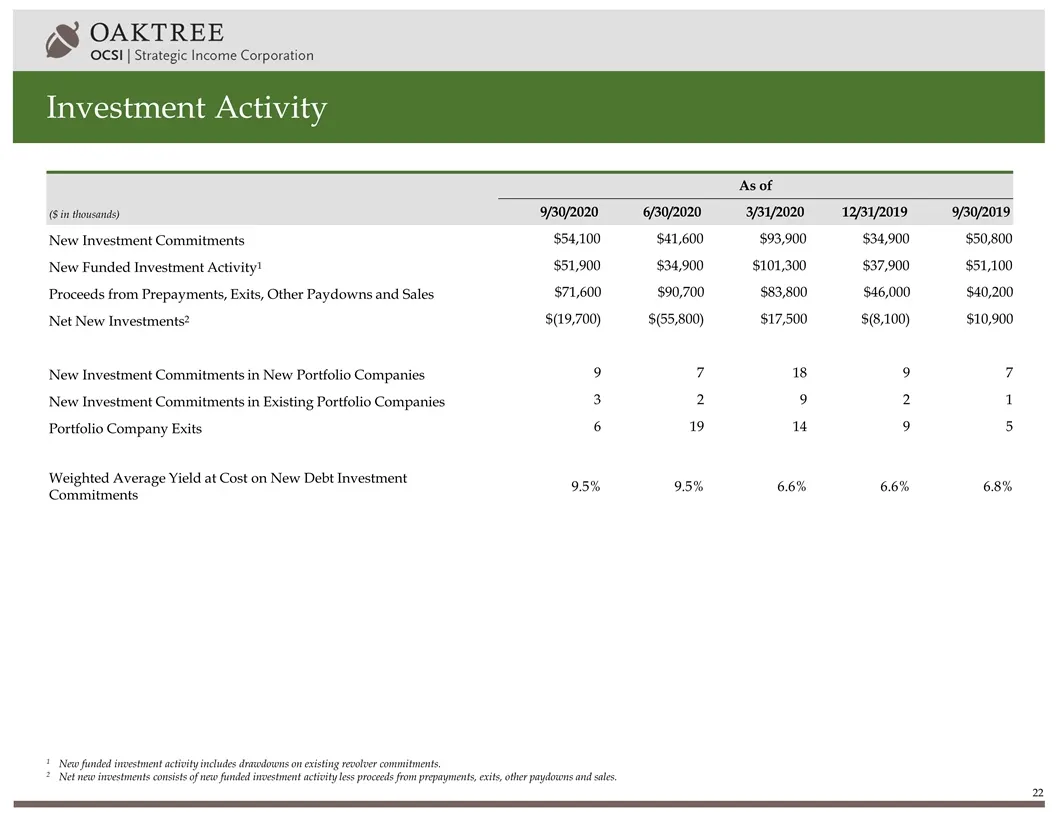
Investment Activity ($ in thousands) As of 9/30/2020 6/30/2020 3/31/2020 12/31/2019 9/30/2019 New Investment Commitments $54,100 $41,600 $93,900 $34,900 $50,800 New Funded Investment Activity1 $51,900 $34,900 $101,300 $37,900 $51,100 Proceeds from Prepayments, Exits, Other Paydowns and Sales $71,600
Slide 24: Financial Highlights
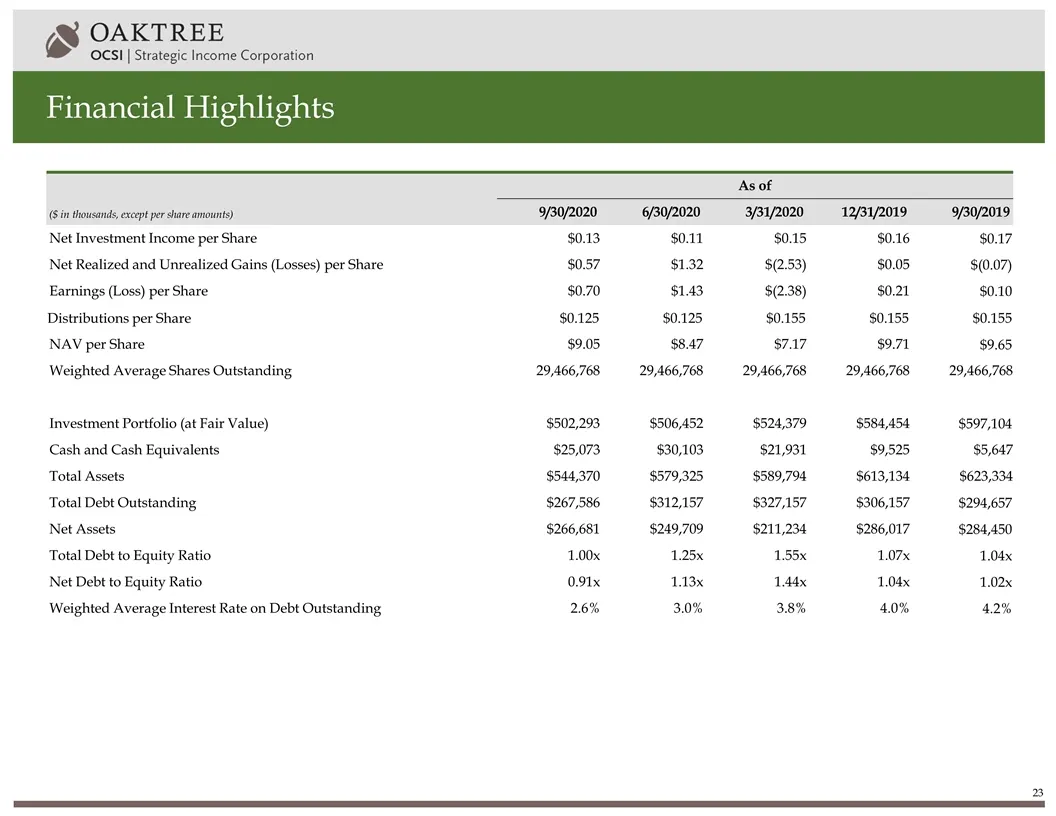
Financial Highlights ($ in thousands, except per share amounts) As of 9/30/2020 6/30/2020 3/31/2020 12/31/2019 9/30/2019 Net Investment Income per Share $0.13 $0.11 $0.15 $0.16 $0.17 Net Realized and Unrealized Gains (Losses) per Share $0.57 $1.32 $(2.53) $0.05 $(0.07) Earnings (Loss) per Share $0.7
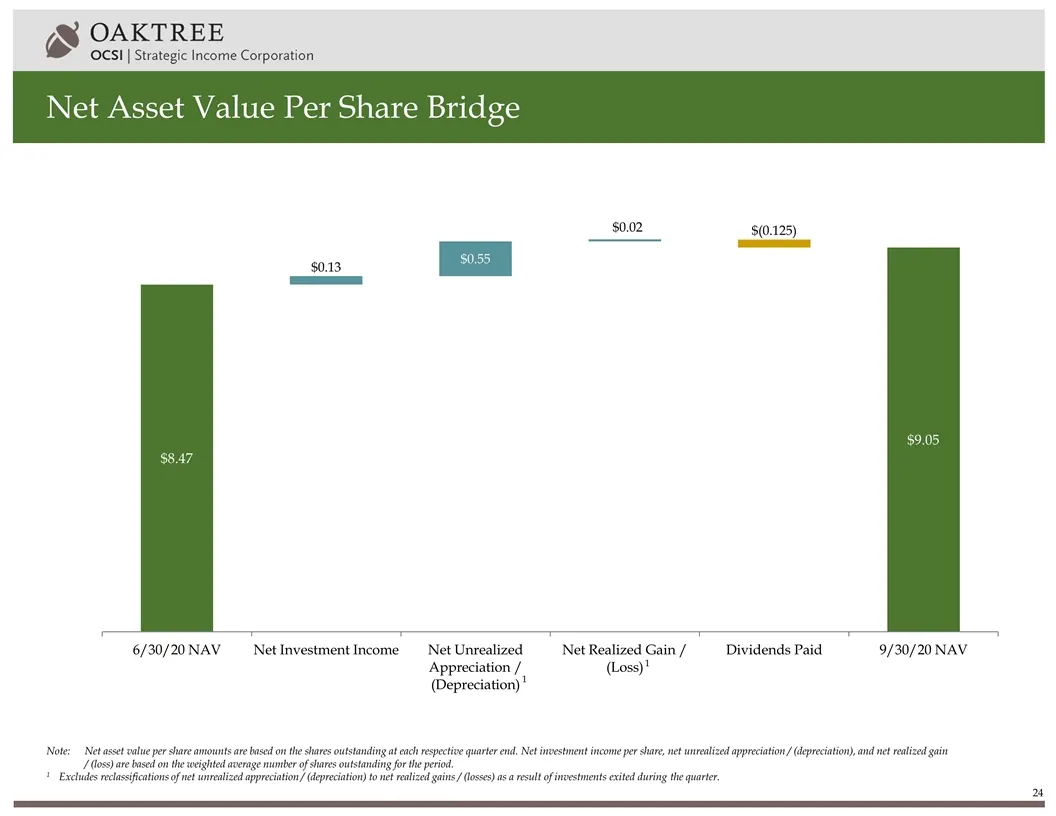
Slide 25: Net Asset Value Per Share Bridge
Net Asset Value Per Share Bridge Note:Net asset value per share amounts are based on the shares outstanding at each respective quarter end. Net investment income per share, net unrealized appreciation / (depreciation), and net realized gain / (loss) are based on the weighted average number of shares
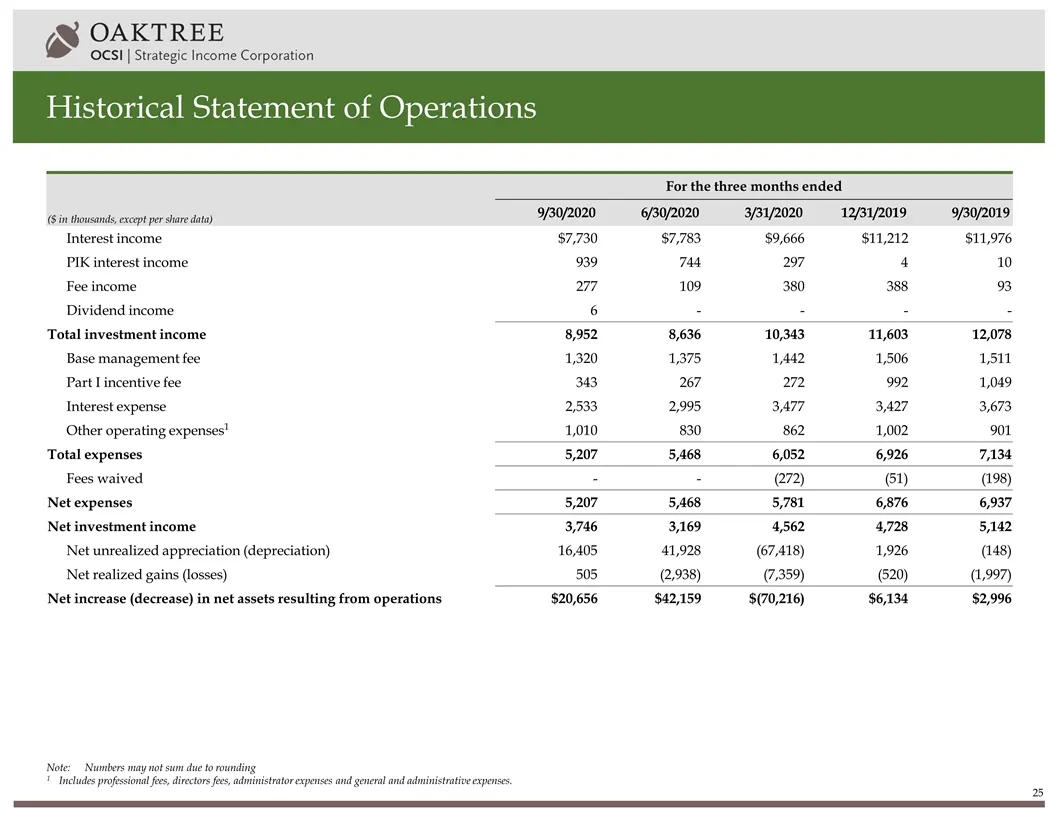
Slide 26: Historical Statement of Operations
Historical Statement of Operations ($ in thousands, except per share data) For the three months ended 9/30/2020 6/30/2020 3/31/2020 12/31/2019 9/30/2019 Interest income $7,730 $7,783 $9,666 $11,212 $11,976 PIK interest income 939 744 297 4 10 Fee income 277 109 380 388 93 Dividend income 6 - - - - T

Slide 27: Contact: Investor Relations
Contact: Michael Mosticchio, Investor Relations ocsi-ir@oaktreecapital.com
Source: SEC EDGAR · 425 filed Dec 8, 2020
More decks from Oaktree Strategic Income Corporation
 Q1 2021 Earnings Presentation28 slides · Feb 17, 2021
 Q1 2021 Earnings Presentation33 slides · Feb 17, 2021
 Q1 FY2021 Earnings Presentation19 slides · Feb 4, 2021
 Q1 FY2021 Earnings Presentation23 slides · Feb 4, 2021
 Q4 2020 Earnings Presentation34 slides · Dec 8, 2020
 Q4 FY2020 Earnings Presentation24 slides · Nov 19, 2020