ams-OSRAM AG · SIX:AMS
ams-OSRAM — Q3 2026 Earnings Presentation
60 slides from ams-OSRAM's earnings presentation, Nov 13, 2026
Slide 1: Third Quarter 2026 Investor Presentation
Sense the power of light Third Quarter 2026 Investor Presentation Aldo Kamper, CEO Rainer Irle, CFO Dr Juergen Rebel, SVP Investor Relations 13 November 2026
Slide 2: Disclaimer
Disclaimer This presentation contains statements related to our future business and financial performance and future events or developments involving ams OSRAM which include management’s expectations, beliefs, intentions, and strategies concerning future events, such as revenue projections, market d
Slide 3: Creating the Leader in Digital Photonics
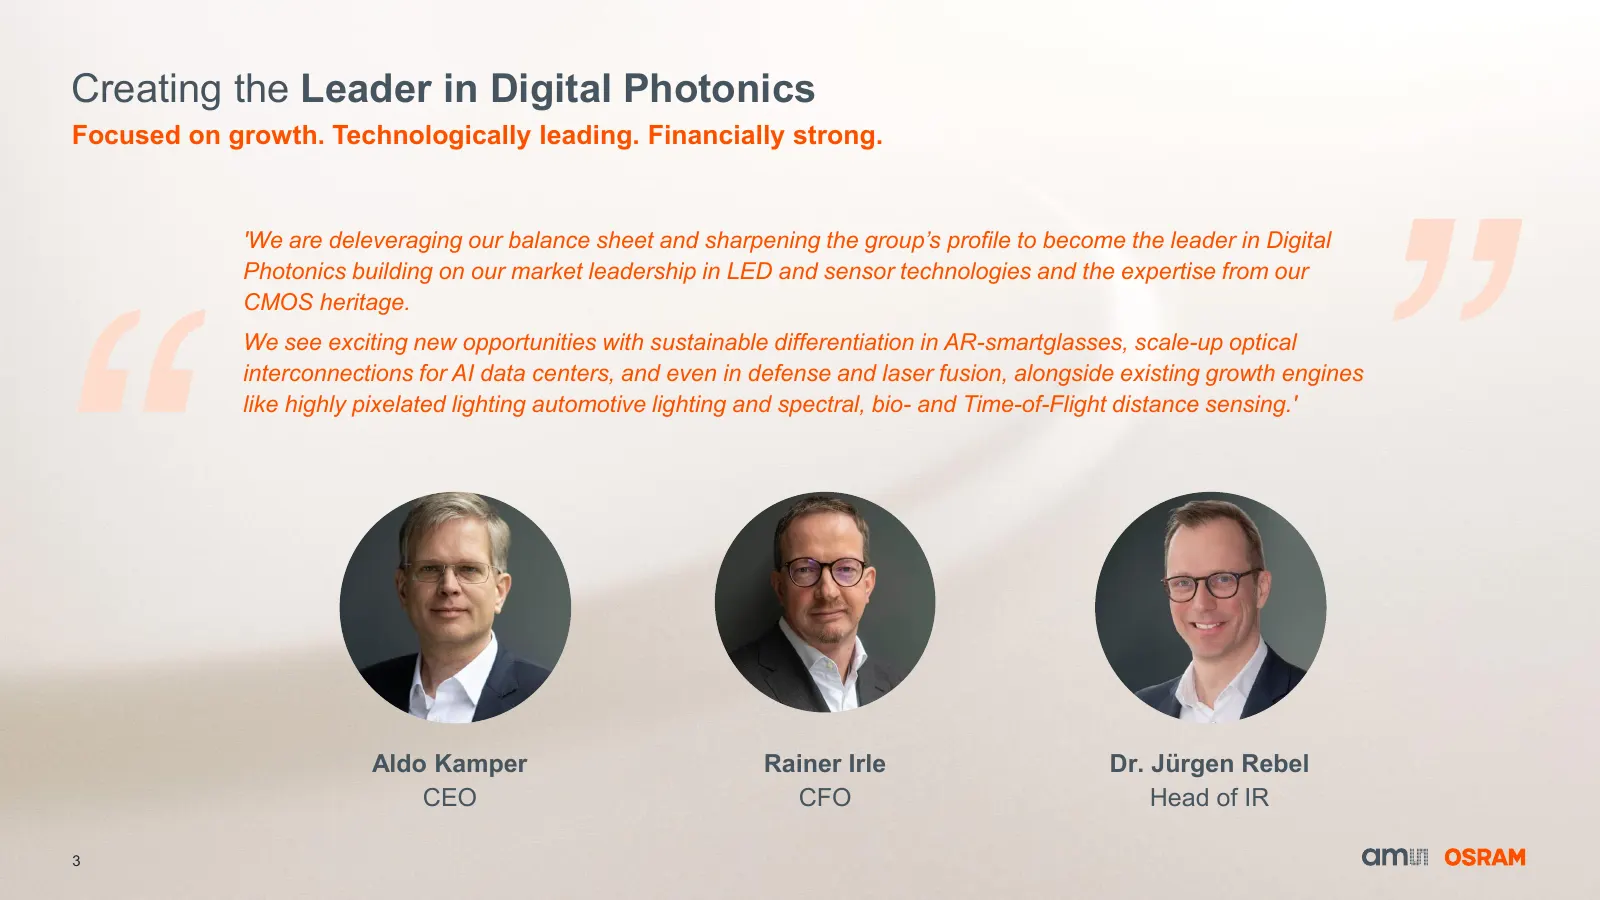
Creating the Leader in Digital Photonics Focused on growth. Technologically leading. Financially strong. 'We are deleveraging our balance sheet and sharpening the group’s profile to become the leader in Digital Photonics building on our market leadership in LED and sensor technologies and the expert
Slide 4: A Photonics Powerhouse: the Leader in Digital Photonics
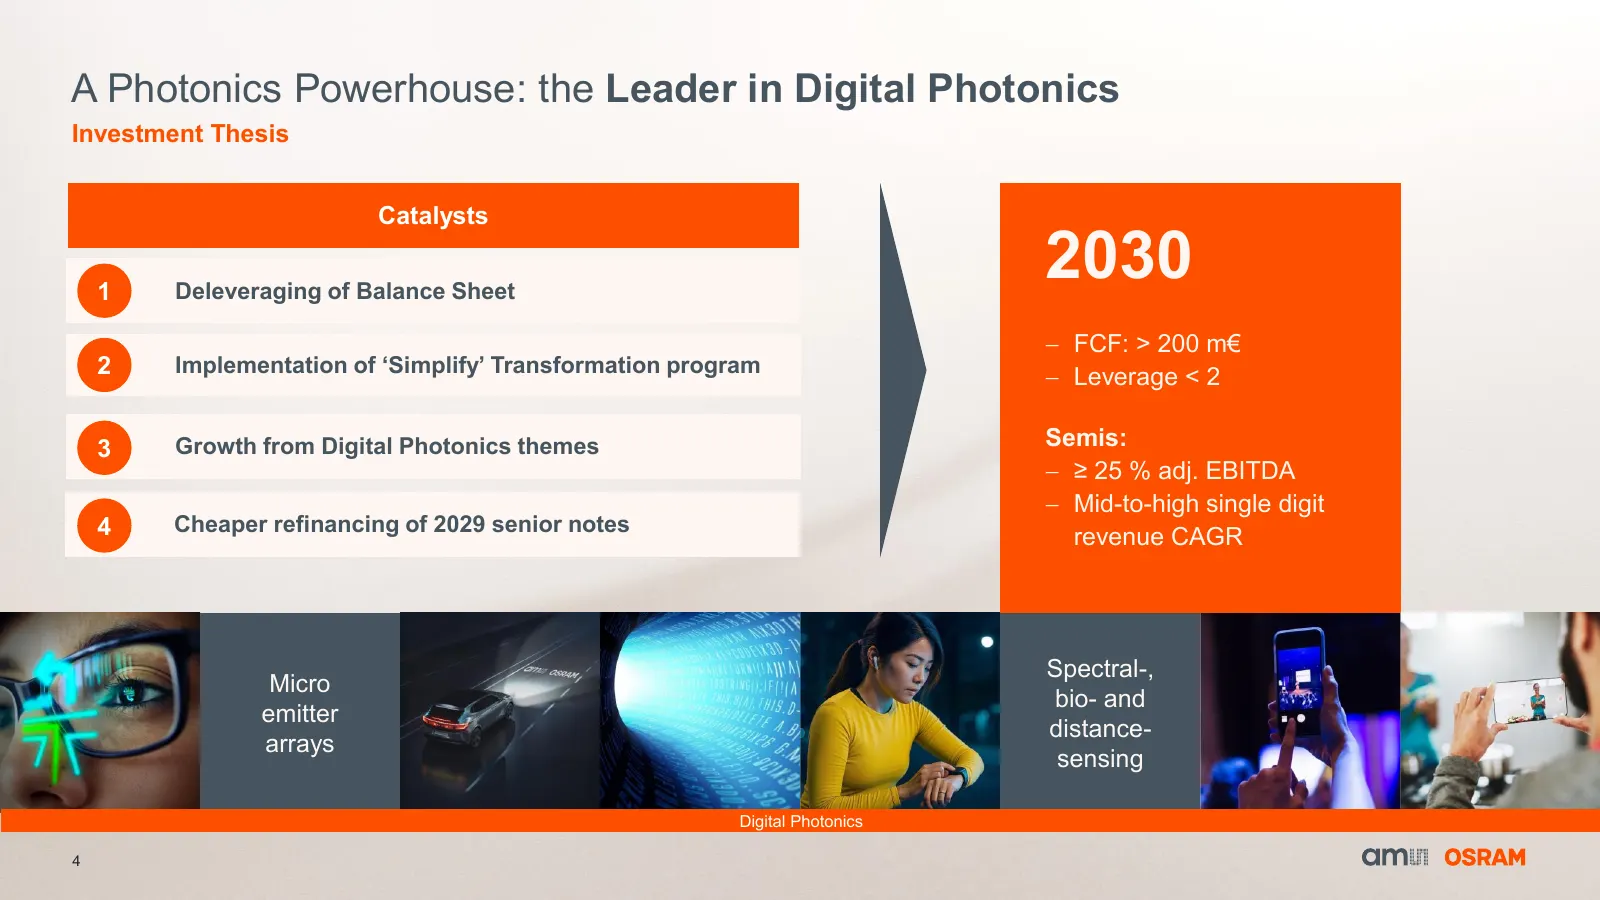
A Photonics Powerhouse: the Leader in Digital Photonics Investment Thesis Catalysts 1 Deleveraging of Balance Sheet 2030 − FCF: > 200 m€ 2 Implementation of ‘Simplify’ Transformation program − Leverage < 2 3 Growth from Digital Photonics themes Semis: − ≥ 25 % adj. EBITDA − Mid-to-high single digit
Slide 5: Q3/26 – Highlights
Sense the power of light Q3 / 26 – Highlights 5
Slide 6: Q3/26 Key Achievements
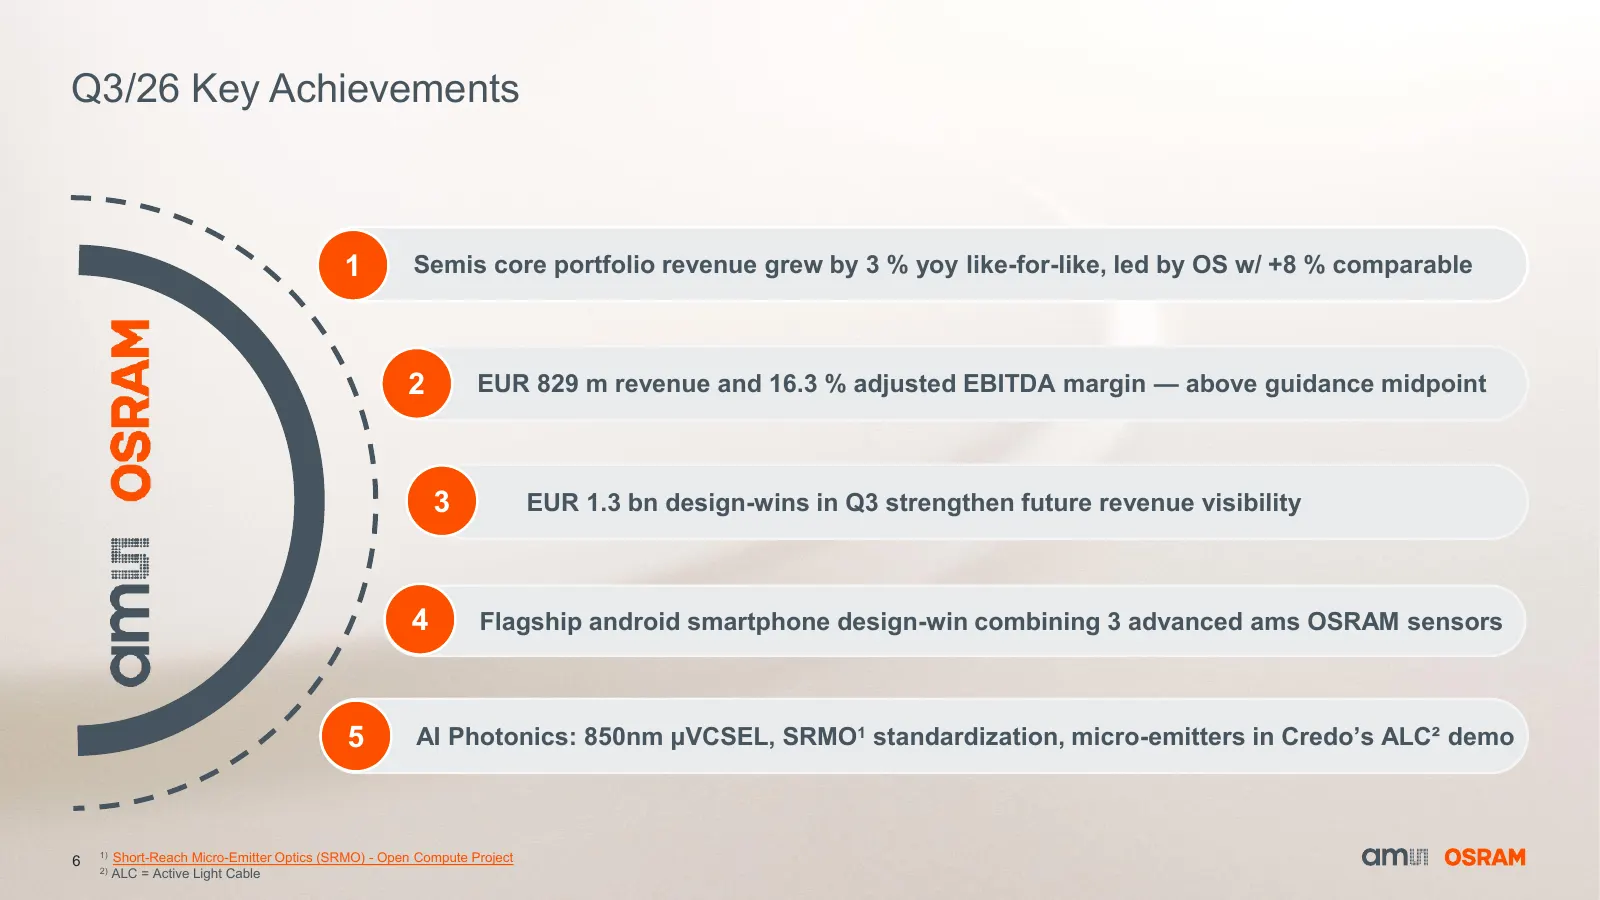
Q3/26 Key Achievements 1 Semis core portfolio revenue grew by 3 % yoy like-for-like, led by OS w/ +8 % comparable 2 EUR 829 m revenue and 16.3 % adjusted EBITDA margin — above guidance midpoint 3 EUR 1.3 bn design-wins in Q3 strengthen future revenue visibility 4 Flagship android smartphone design-w
Slide 7: Outlook
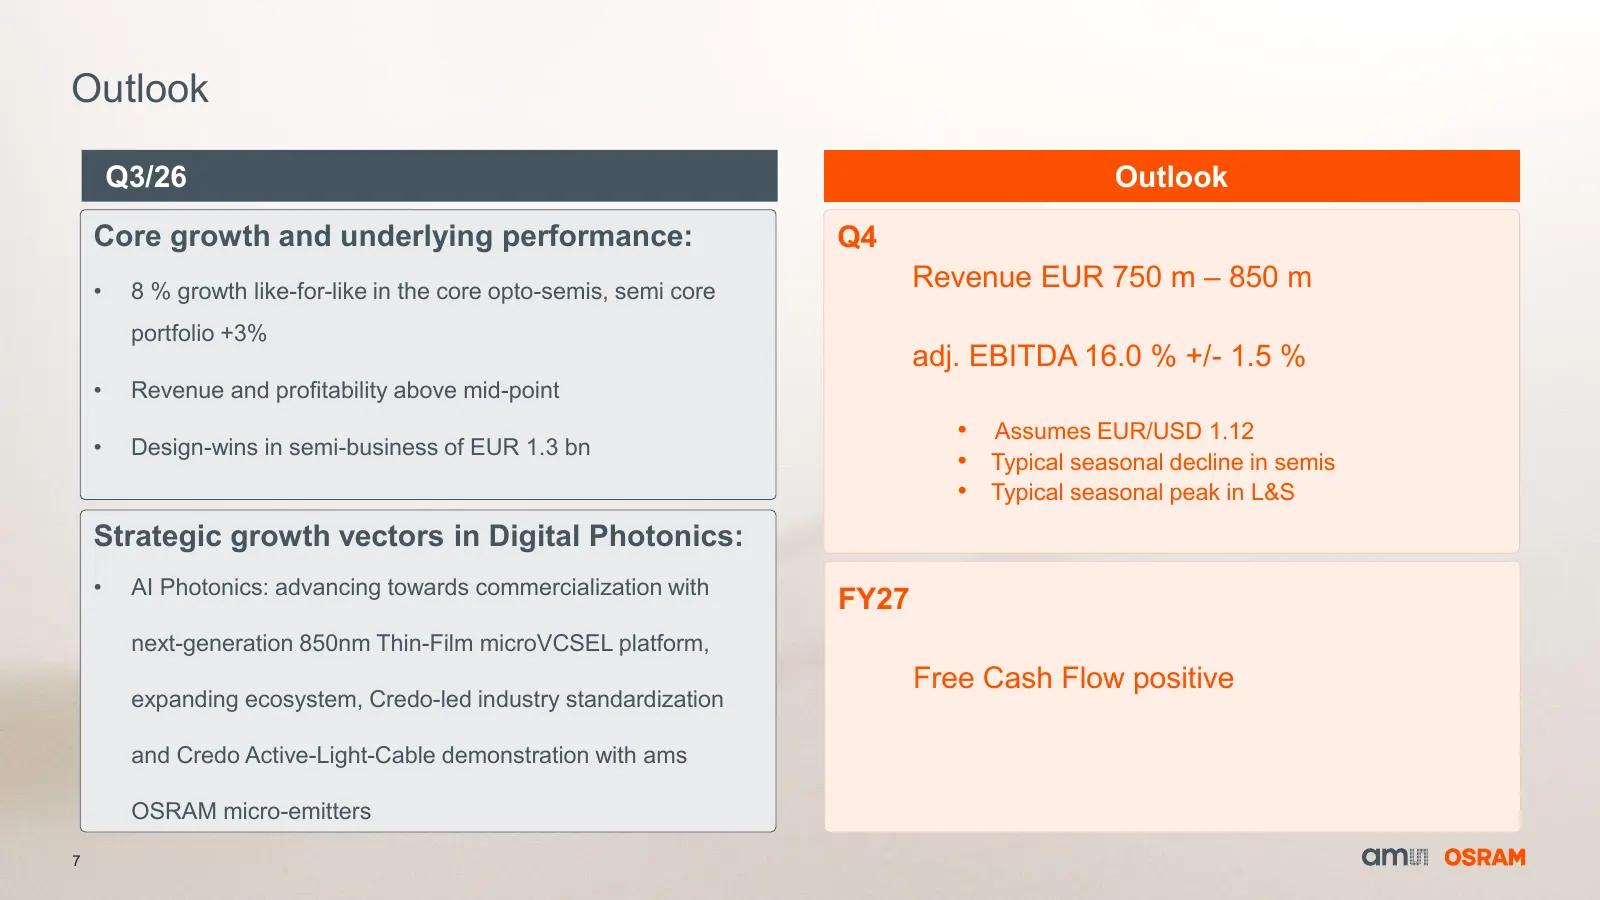
Outlook Q3/26 Outlook Core growth and underlying performance: Q4 • 8 % growth like-for-like in the core opto-semis, semi core Revenue EUR 750 m – 850 m portfolio +3% adj. EBITDA 16.0 % +/- 1.5 % • Revenue and profitability above mid-point • Assumes EUR/USD 1.12 • Design-wins in semi-business of EUR
Slide 8: Q3/26 Revenue & adj. EBITDA Margin Above Guidance Midpoints
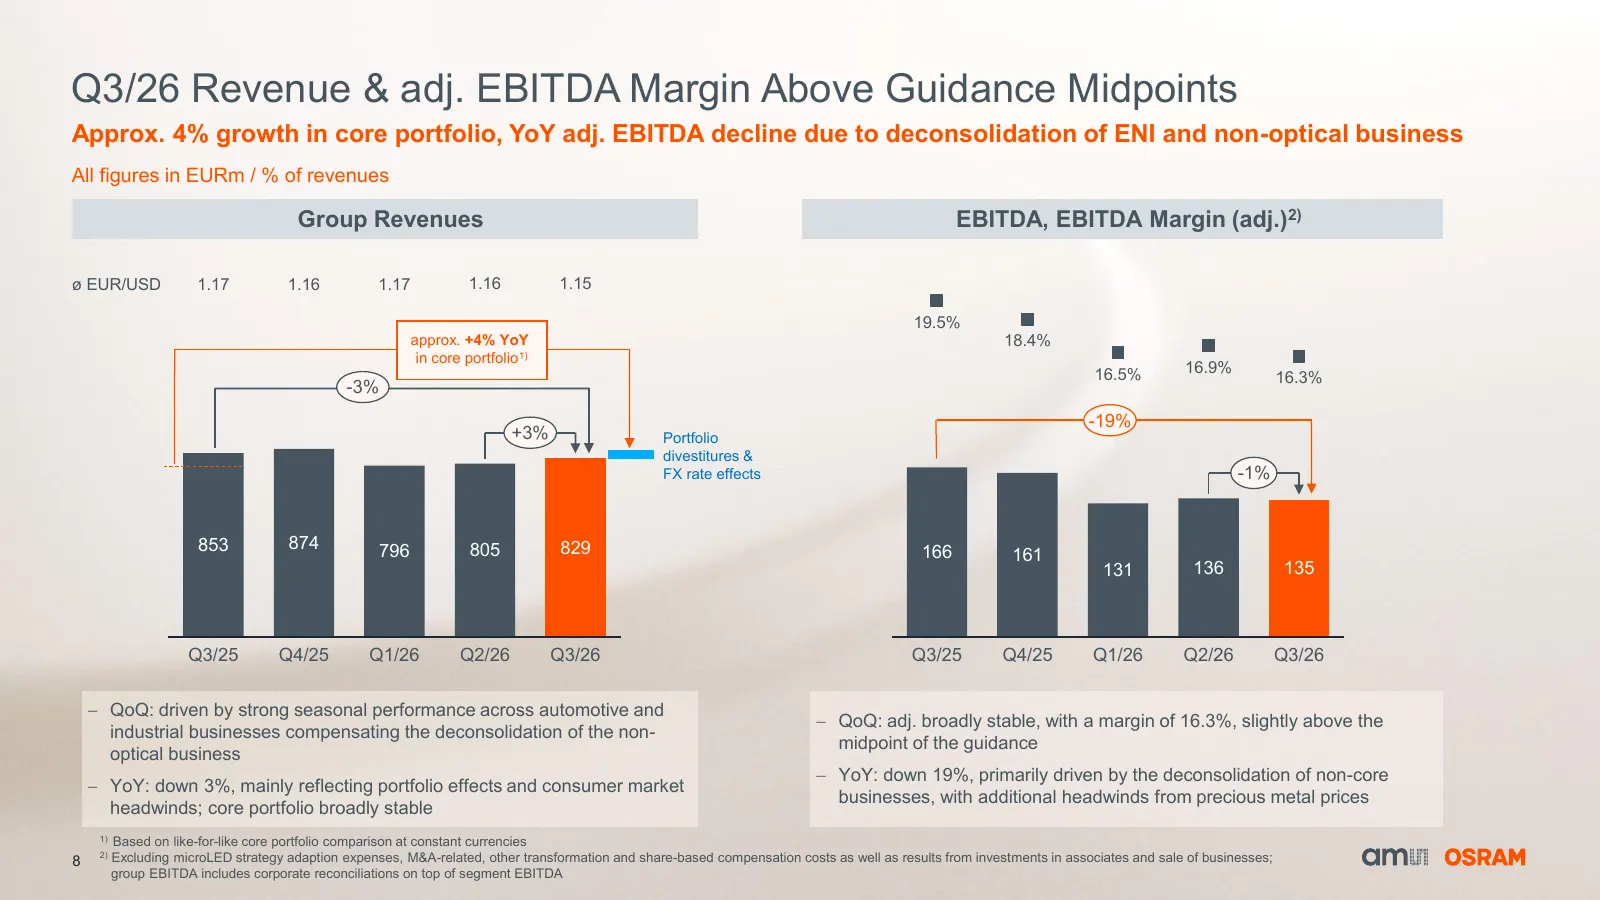
Q3/26 Revenue & adj. EBITDA Margin Above Guidance Midpoints Approx. 4% growth in core portfolio, YoY adj. EBITDA decline due to deconsolidation of ENI and non-optical business All figures in EURm / % of revenues Group Revenues EBITDA, EBITDA Margin (adj.)2) ø EUR/USD 1.17 1.16 1.17 1.16 1.15 19.5% a
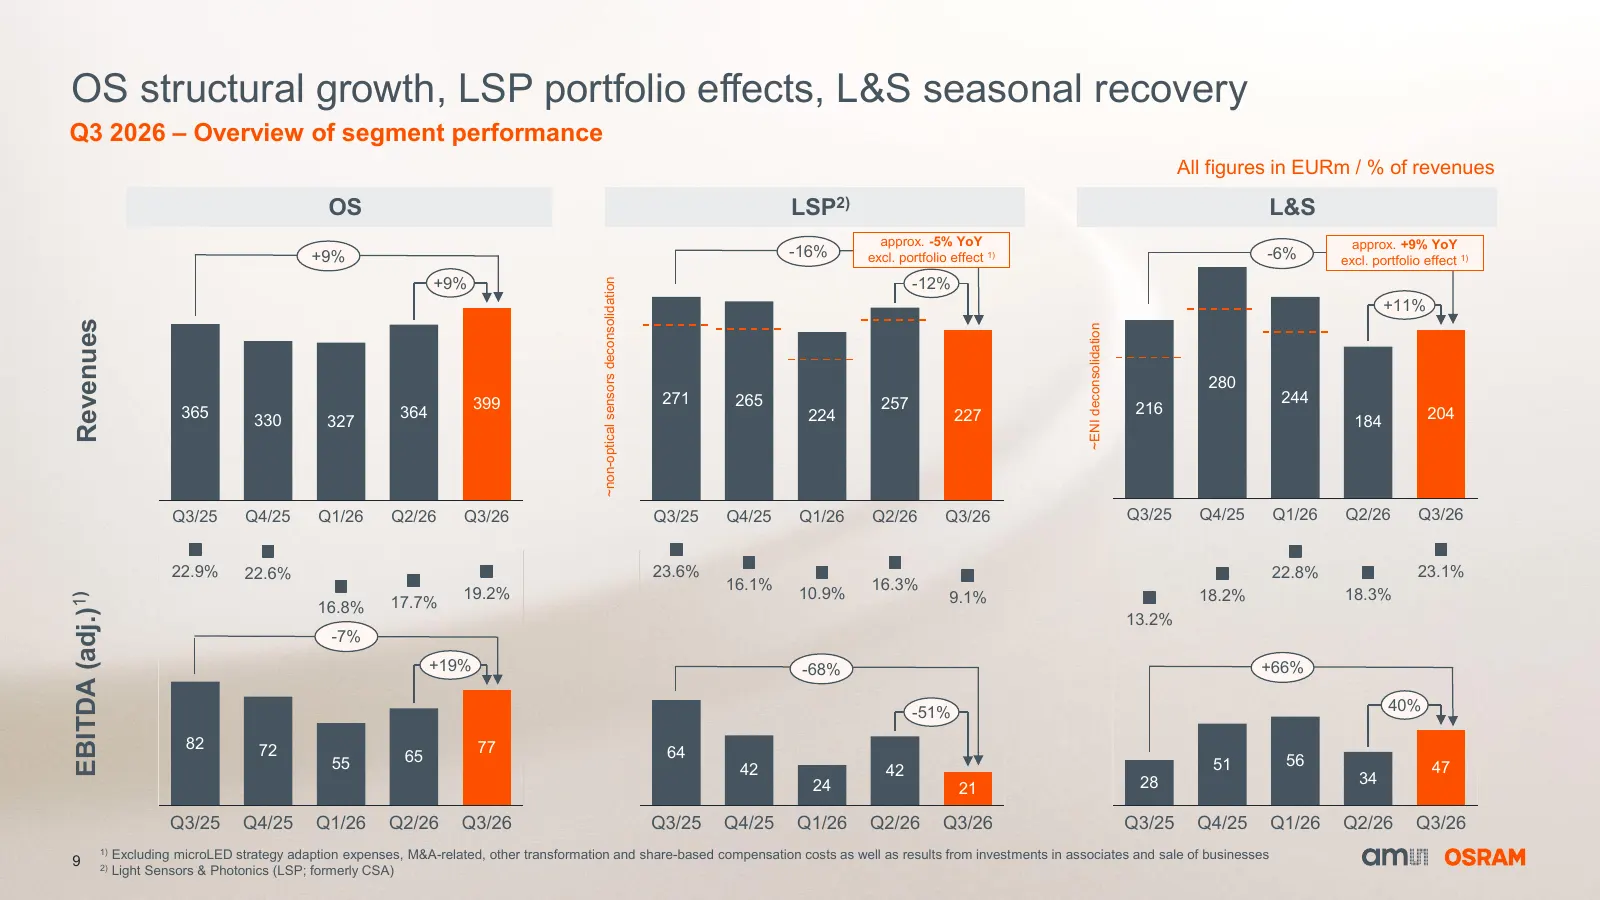
Slide 9: Q3 2026 – Overview of segment performance
OS structural growth, LSP portfolio effects, L&S seasonal recovery Q3 2026 – Overview of segment performance All figures in EURm / % of revenues OS LSP2) L&S approx. -5% YoY approx. +9% YoY +9% -16% excl. portfolio effect 1) -6% excl. portfolio effect 1) +9% -12% ~non-optical sensors deconsolidation
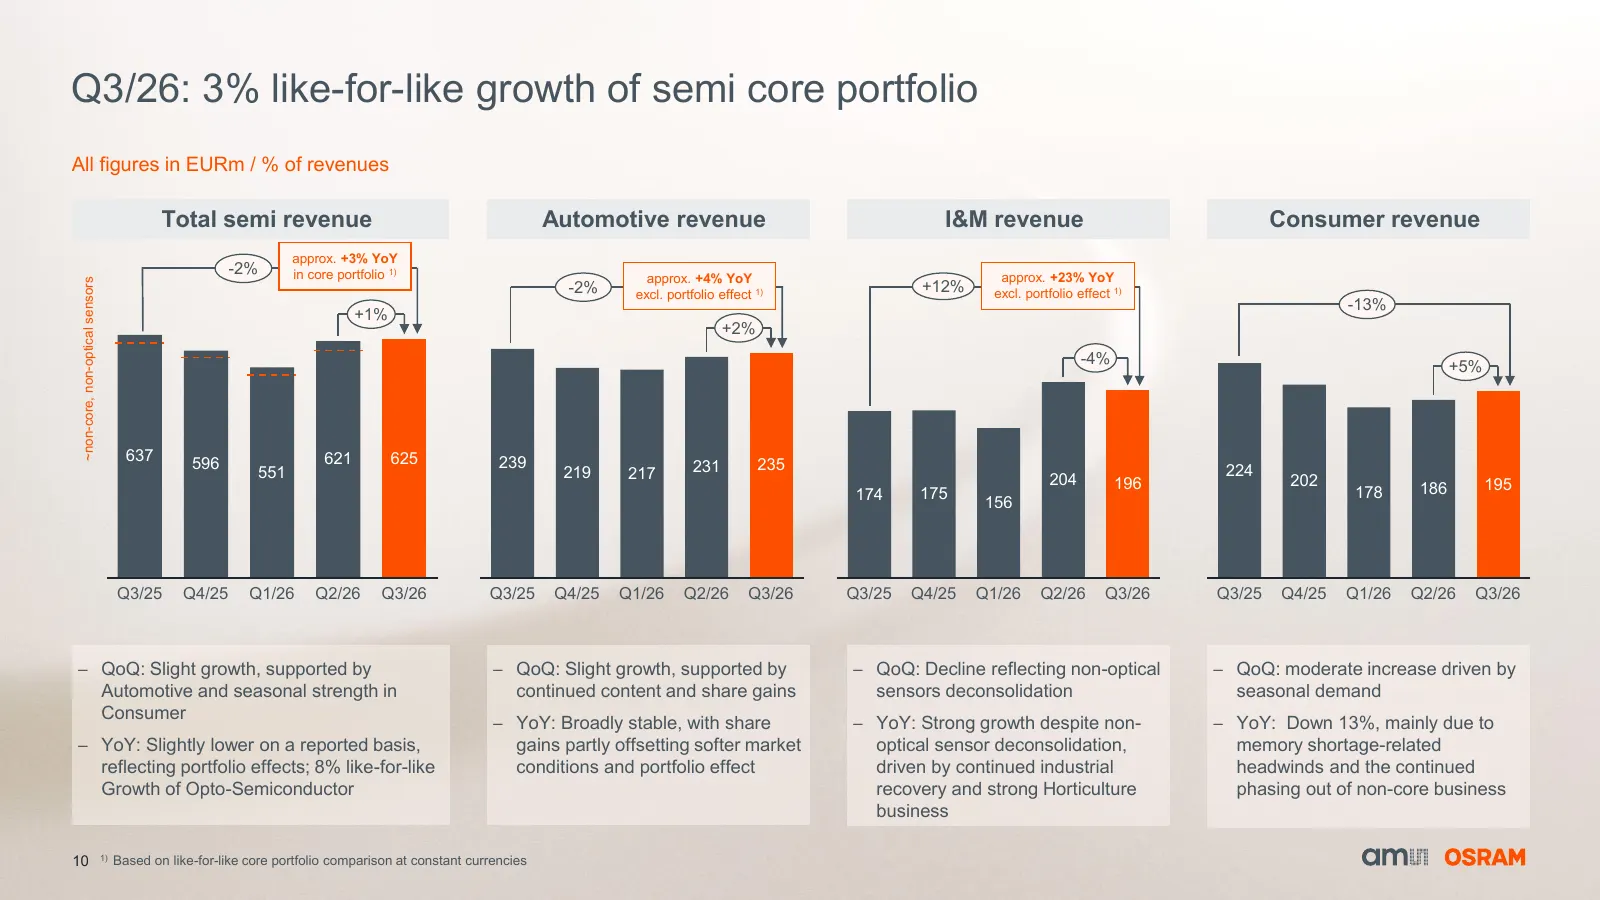
Slide 10: Q3/26: 3% like-for-like growth of semi core portfolio
Q3/26: 3% like-for-like growth of semi core portfolio All figures in EURm / % of revenues Total semi revenue Automotive revenue I&M revenue Consumer revenue approx. +3% YoY -2% in core portfolio 1) approx. +23% YoY approx. +4% YoY ~non-core, non-optical sensors -2% excl. portfolio effect 1) +12% exc
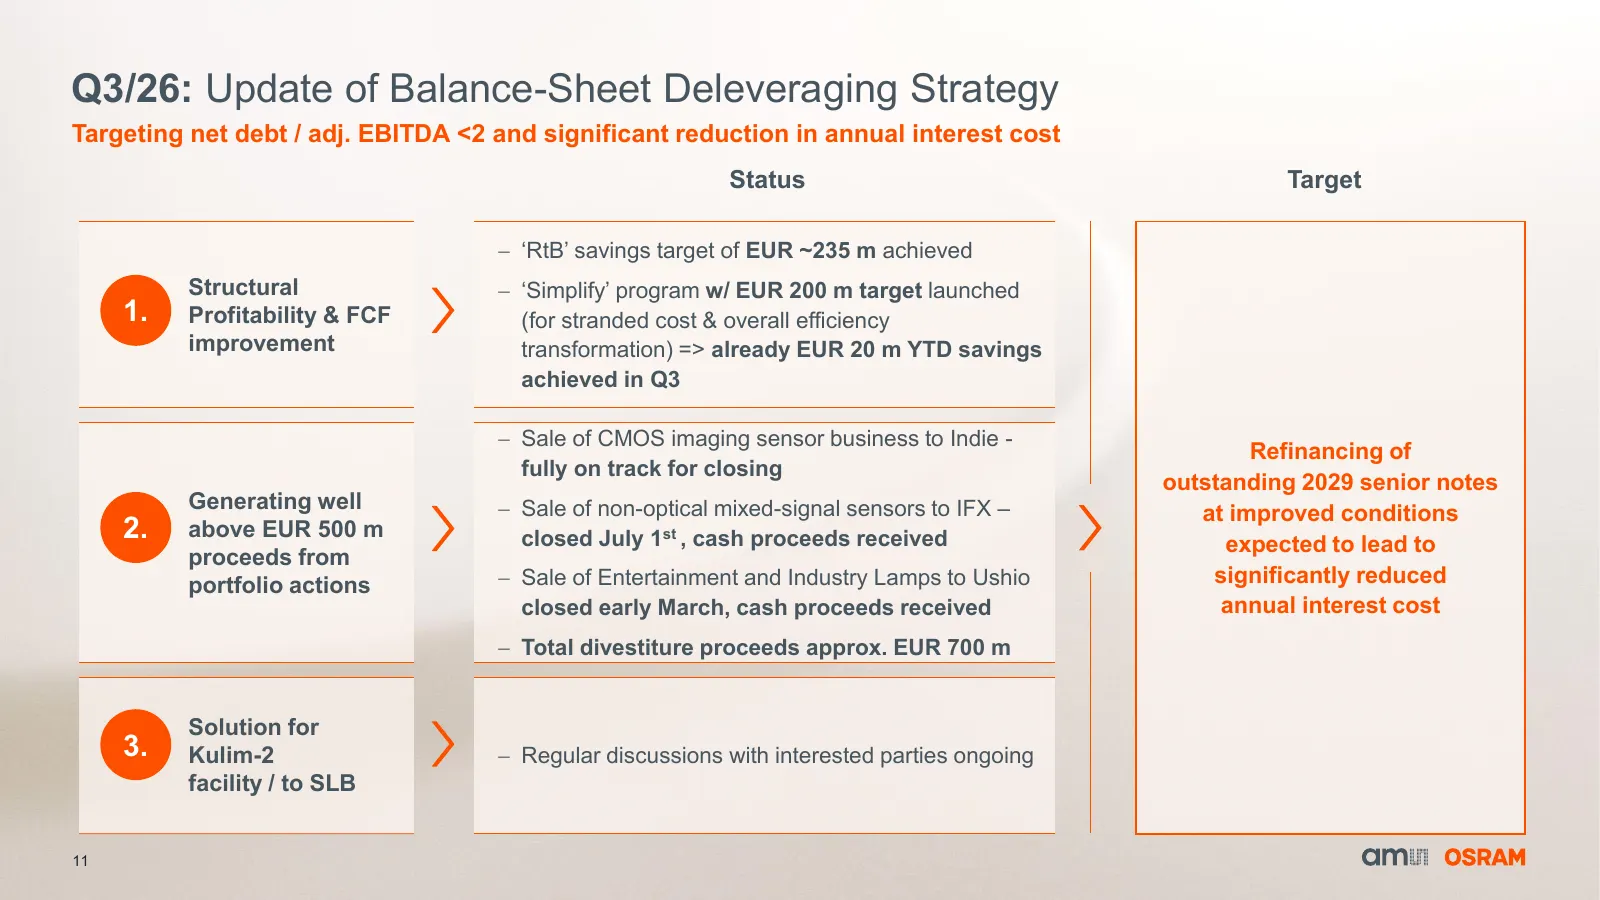
Slide 11: Q3/26: Update of Balance-Sheet Deleveraging Strategy
Q3/26: Update of Balance-Sheet Deleveraging Strategy Targeting net debt / adj. EBITDA <2 and significant reduction in annual interest cost Status Target − ‘RtB’ savings target of EUR ~235 m achieved Structural − ‘Simplify’ program w/ EUR 200 m target launched 1. Profitability & FCF (for stranded cos
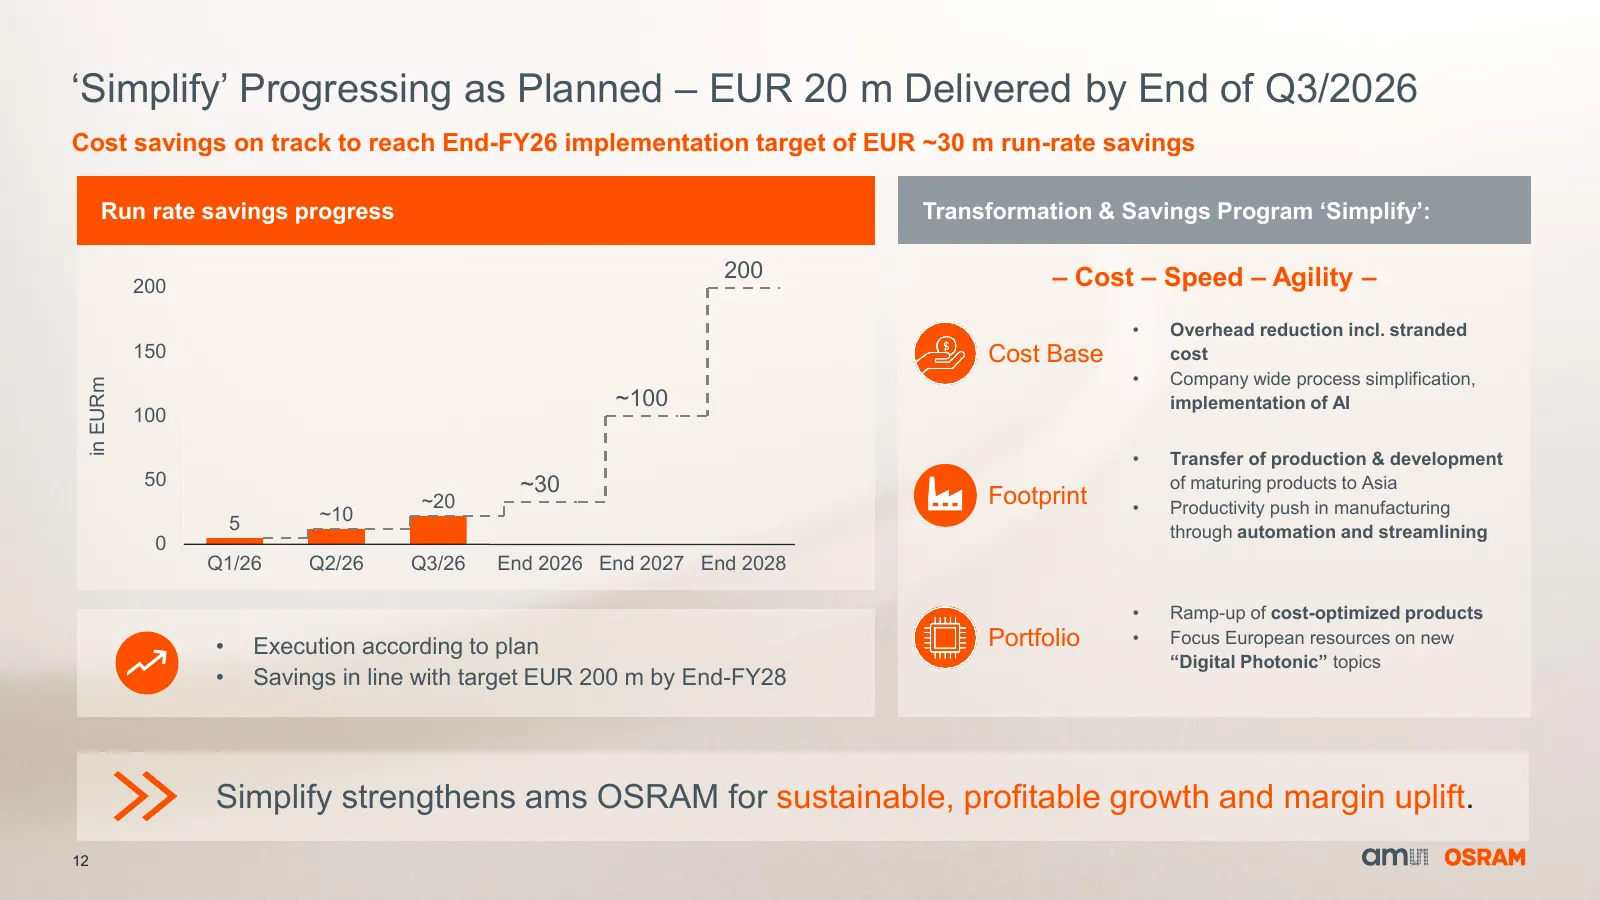
Slide 12: 'Simplify' Progressing as Planned
‘Simplify’ Progressing as Planned – EUR 20 m Delivered by End of Q3/2026 Cost savings on track to reach End-FY26 implementation target of EUR ~30 m run-rate savings Run rate savings progress Transformation & Savings Program ‘Simplify’: 200 – Cost – Speed – Agility – 200 • Overhead reduction incl. st
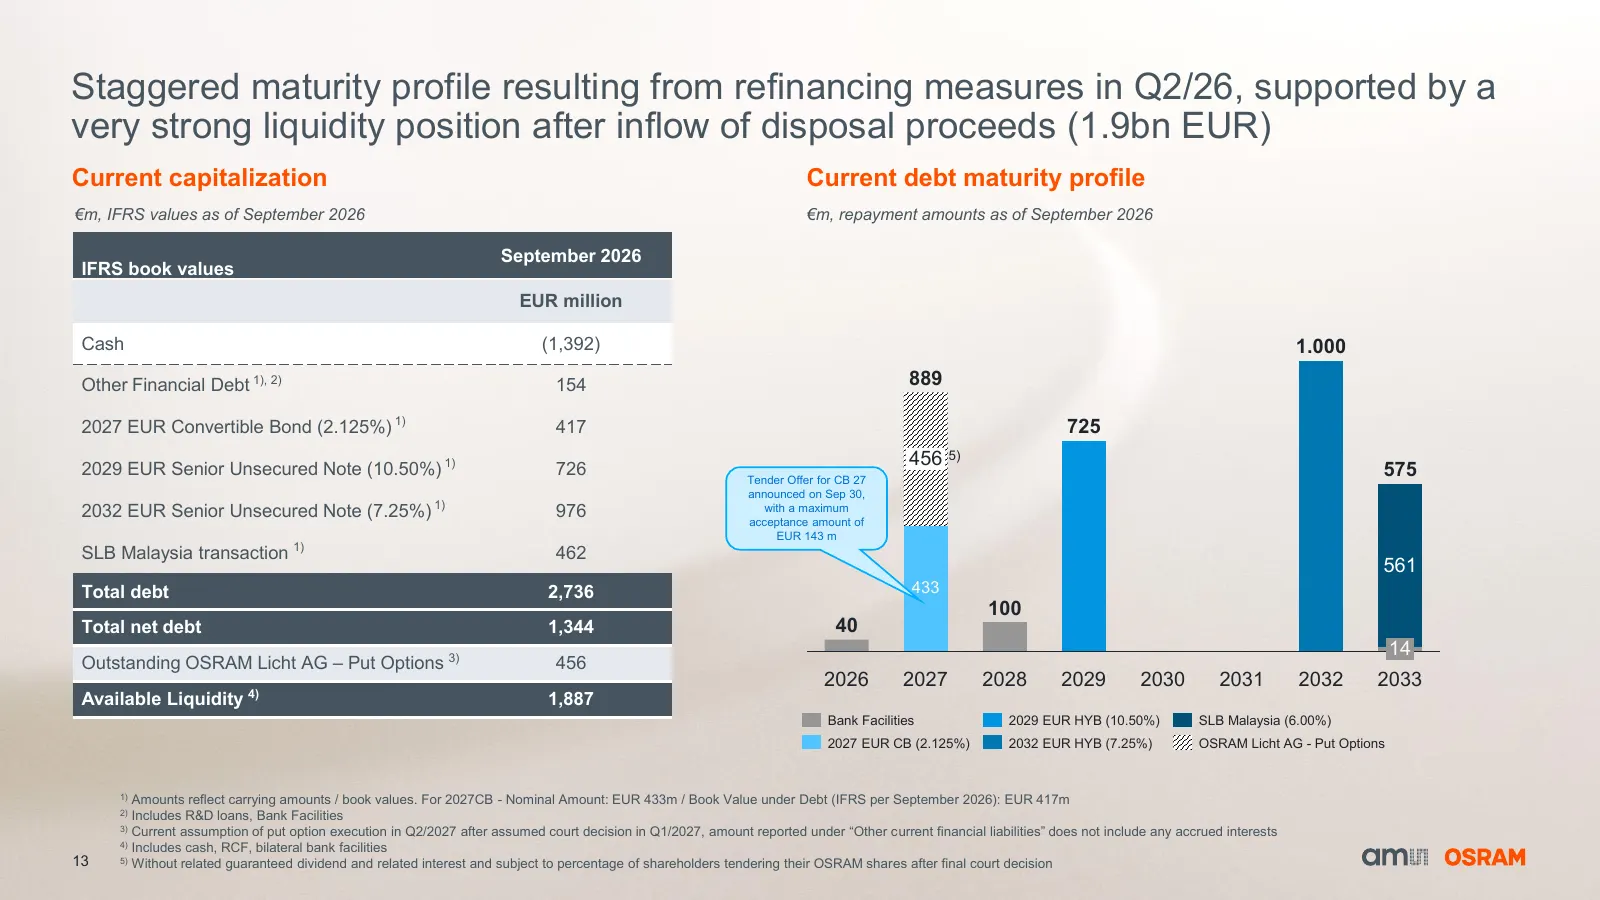
Slide 13: Staggered maturity profile resulting from refinancing measures
Staggered maturity profile resulting from refinancing measures in Q2/26, supported by a very strong liquidity position after inflow of disposal proceeds (1.9bn EUR) Current capitalization Current debt maturity profile €m, IFRS values as of September 2026 €m, repayment amounts as of September 2026 €m
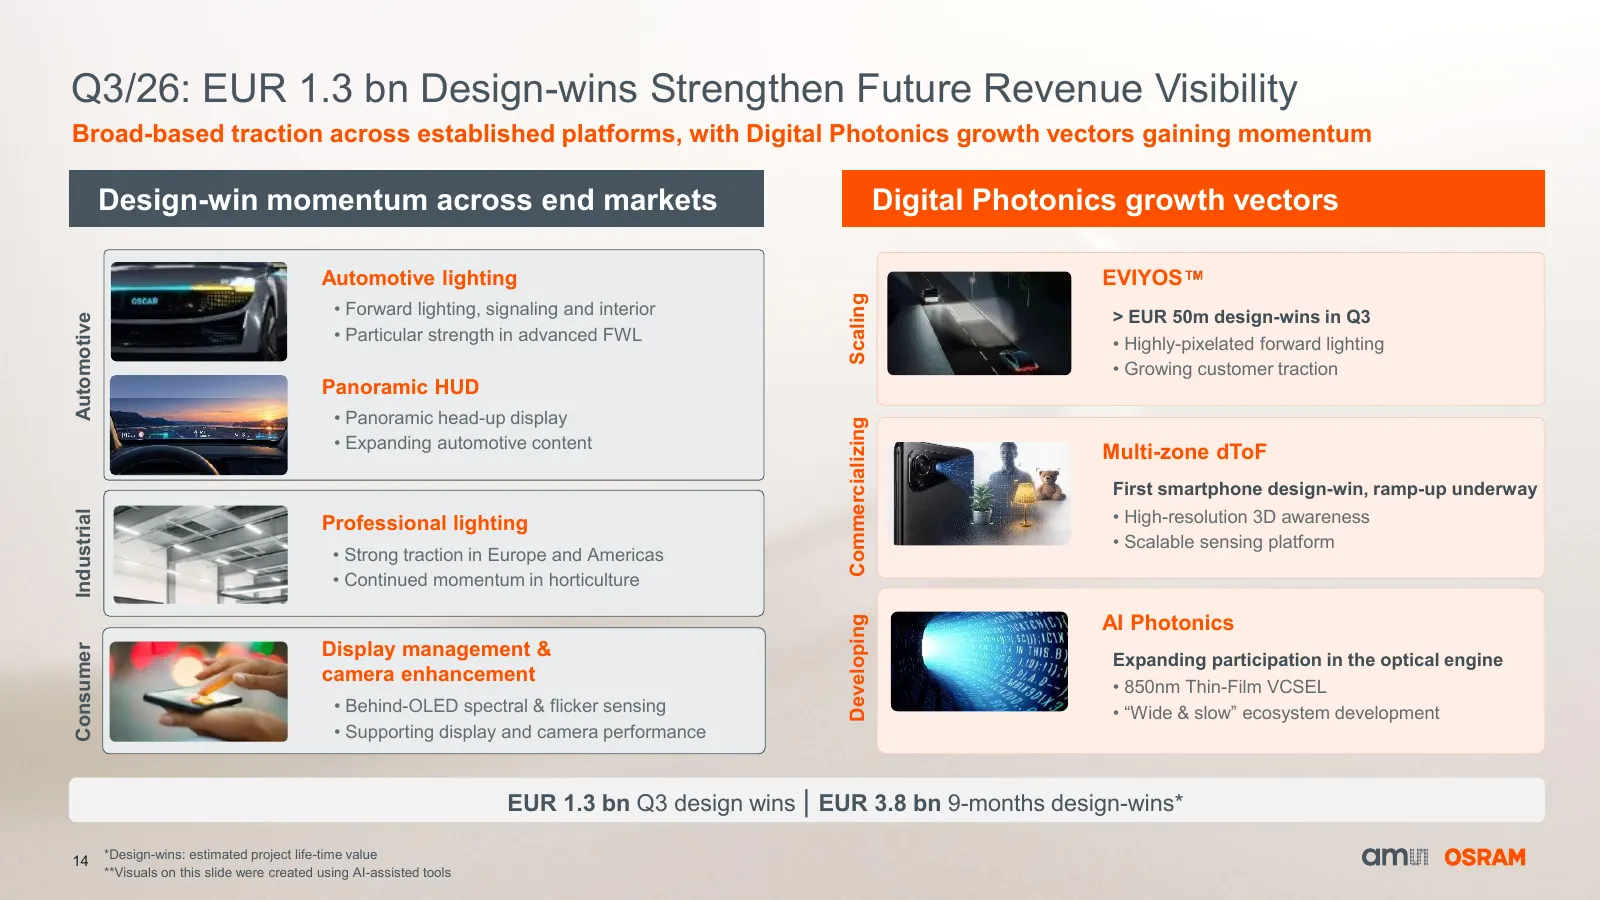
Slide 14: Q3/26: EUR 1.3 bn Design-wins Strengthen Future Revenue Visibility
Q3/26: EUR 1.3 bn Design-wins Strengthen Future Revenue Visibility Broad-based traction across established platforms, with Digital Photonics growth vectors gaining momentum Design-win momentum across end markets Digital Photonics growth vectors Automotive lighting EVIYOS Scaling • Forward lighting,
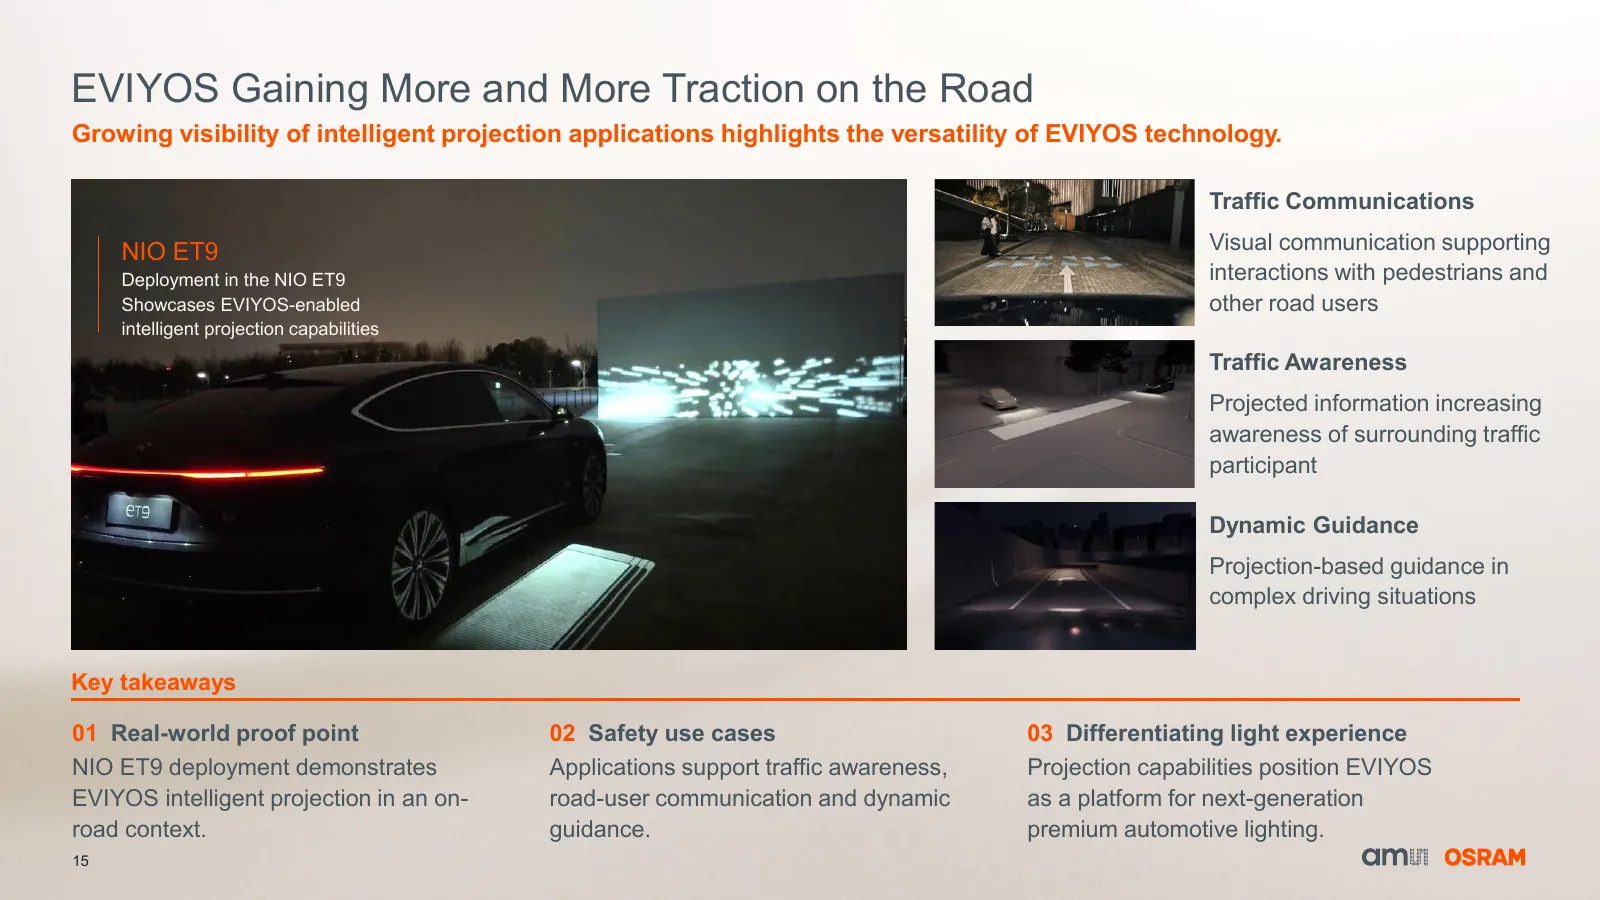
Slide 15: EVIYOS Gaining More and More Traction on the Road
EVIYOS Gaining More and More Traction on the Road Growing visibility of intelligent projection applications highlights the versatility of EVIYOS technology. Traffic Communications NIO ET9 Visual communication supporting Deployment in the NIO ET9 interactions with pedestrians and Showcases EVIYOS-ena
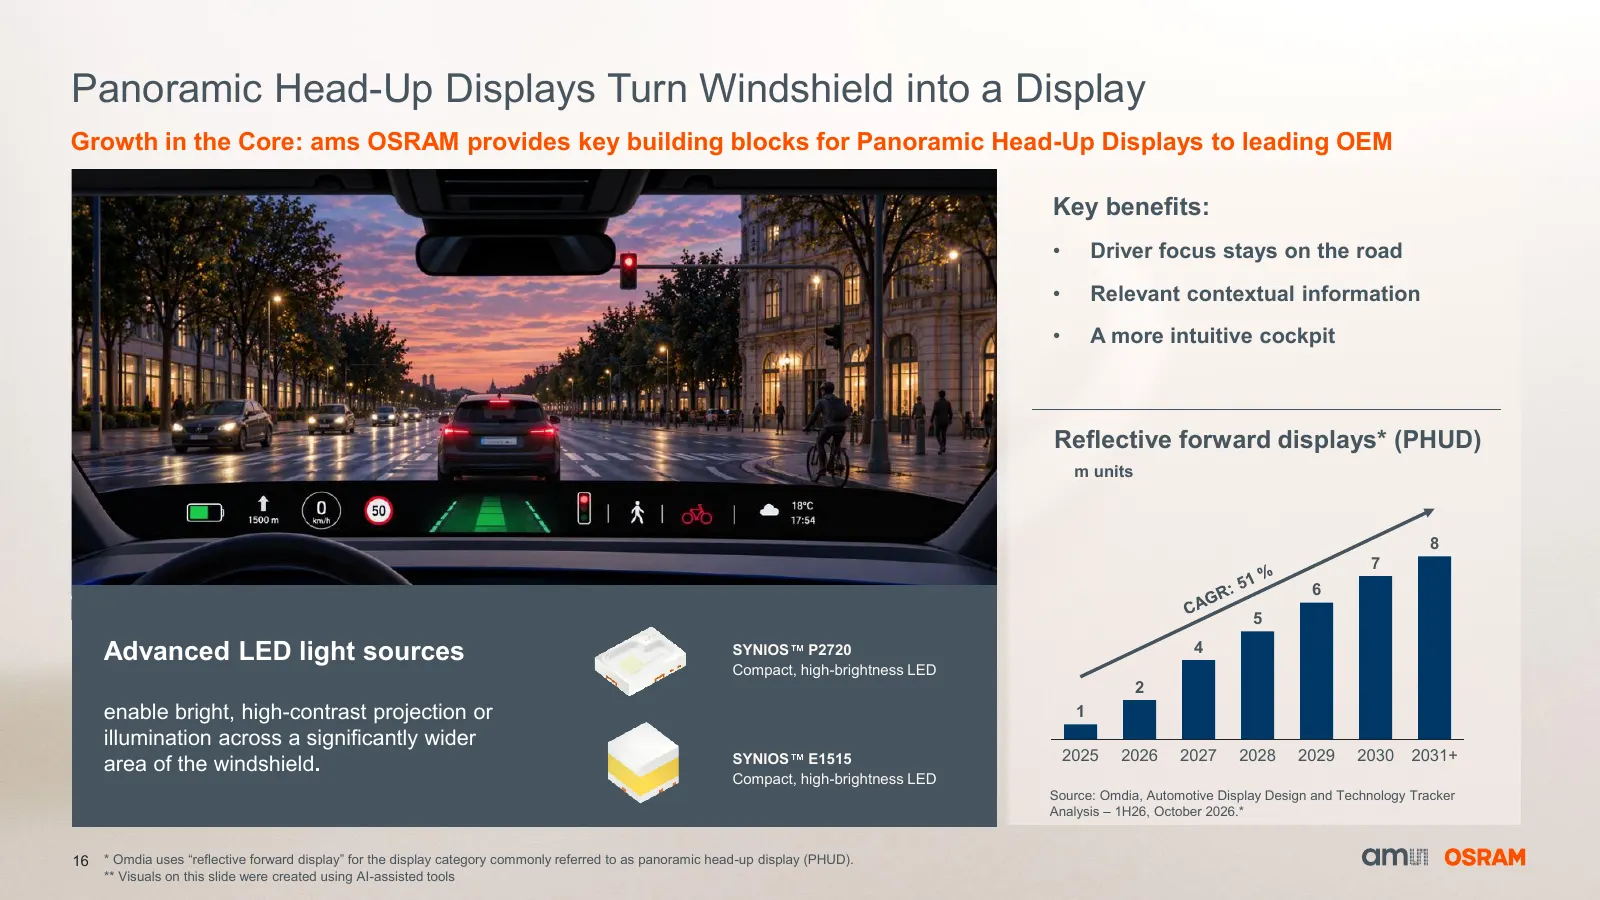
Slide 16: Panoramic Head-Up Displays Turn Windshield into a Display
Panoramic Head-Up Displays Turn Windshield into a Display Growth in the Core: ams OSRAM provides key building blocks for Panoramic Head-Up Displays to leading OEM Key benefits: • Driver focus stays on the road • Relevant contextual information • A more intuitive cockpit Reflective forward displays*
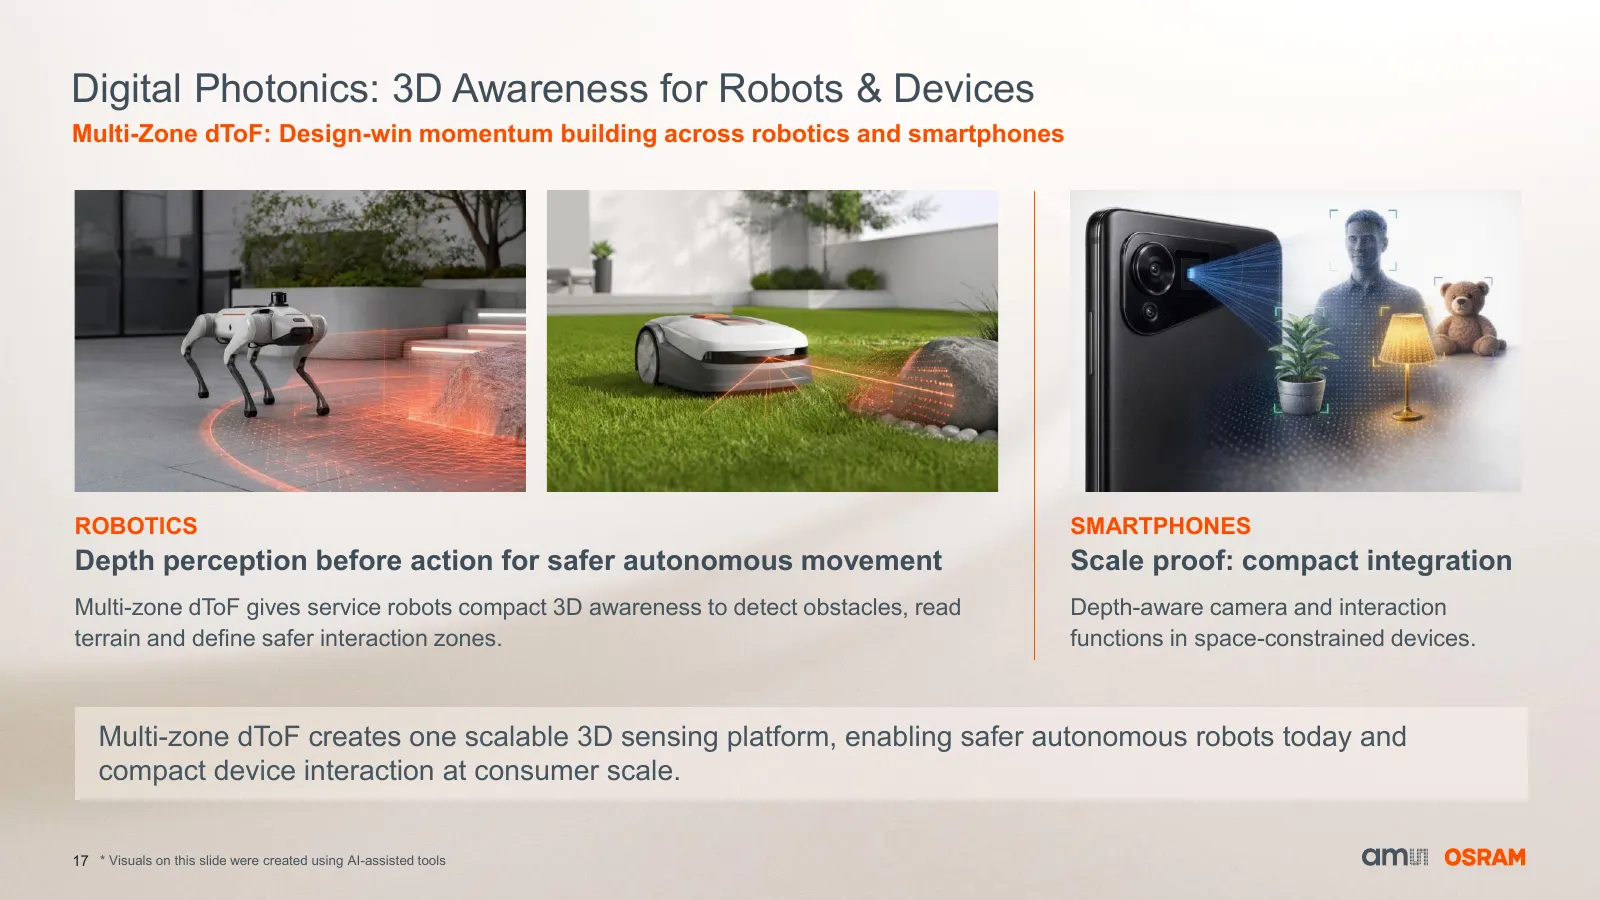
Slide 17: Digital Photonics: 3D Awareness for Robots & Devices
Digital Photonics: 3D Awareness for Robots & Devices Multi-Zone dToF: Design-win momentum building across robotics and smartphones ROBOTICS SMARTPHONES Depth perception before action for safer autonomous movement Scale proof: compact integration Multi-zone dToF gives service robots compact 3D awaren
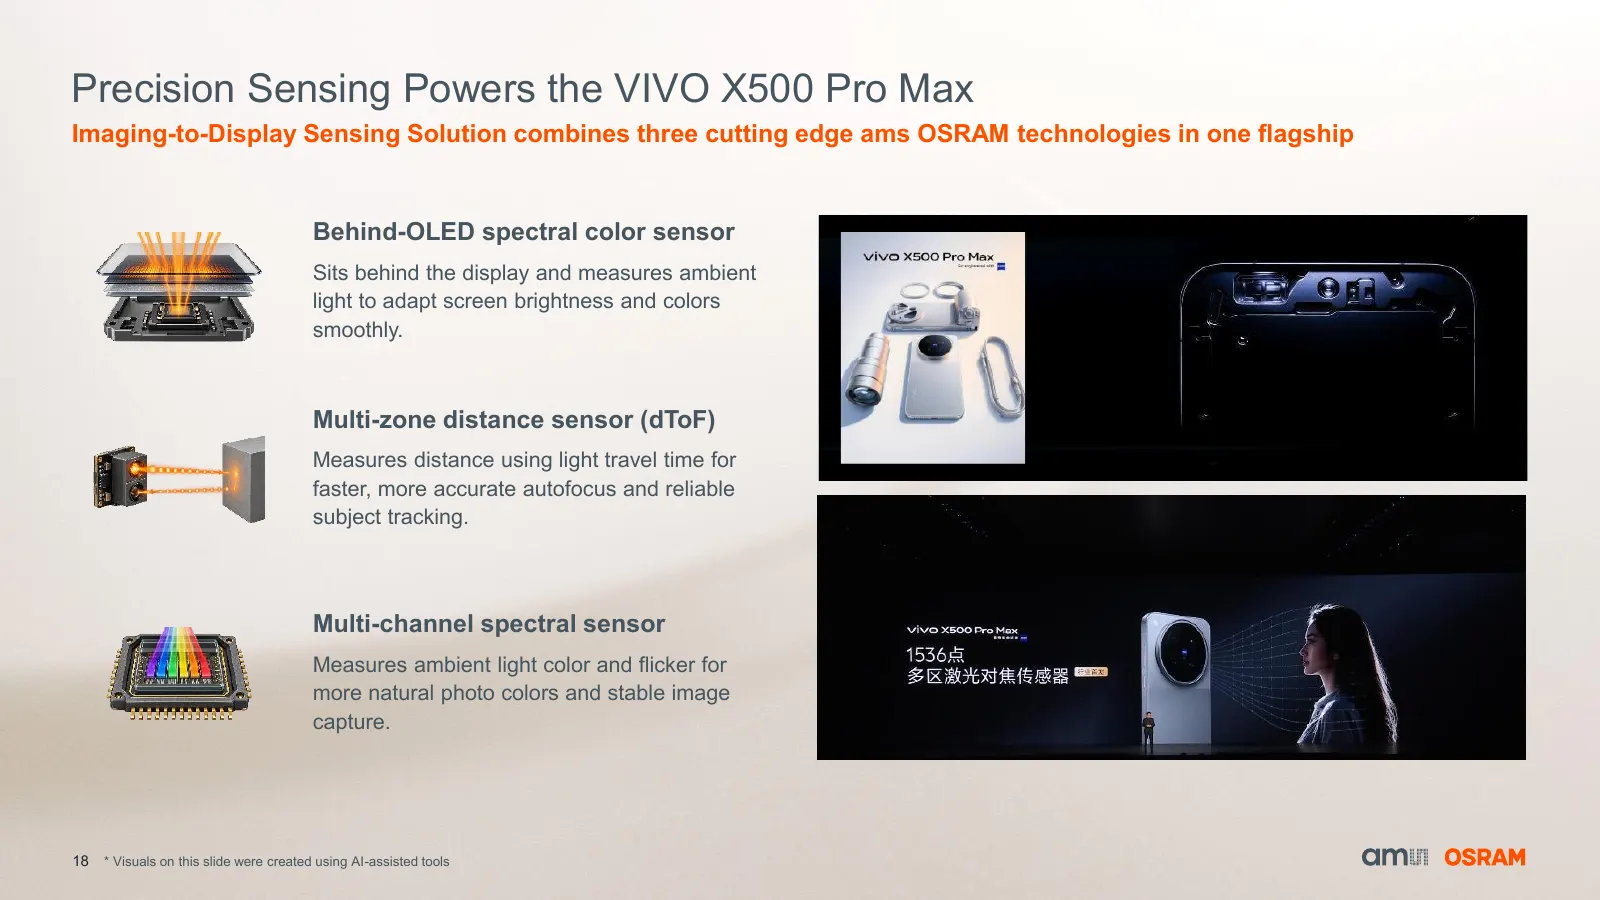
Slide 18: Precision Sensing Powers the VIVO X500 Pro Max
Precision Sensing Powers the VIVO X500 Pro Max Imaging-to-Display Sensing Solution combines three cutting edge ams OSRAM technologies in one flagship Behind-OLED spectral color sensor Sits behind the display and measures ambient light to adapt screen brightness and colors smoothly. Multi-zone distan
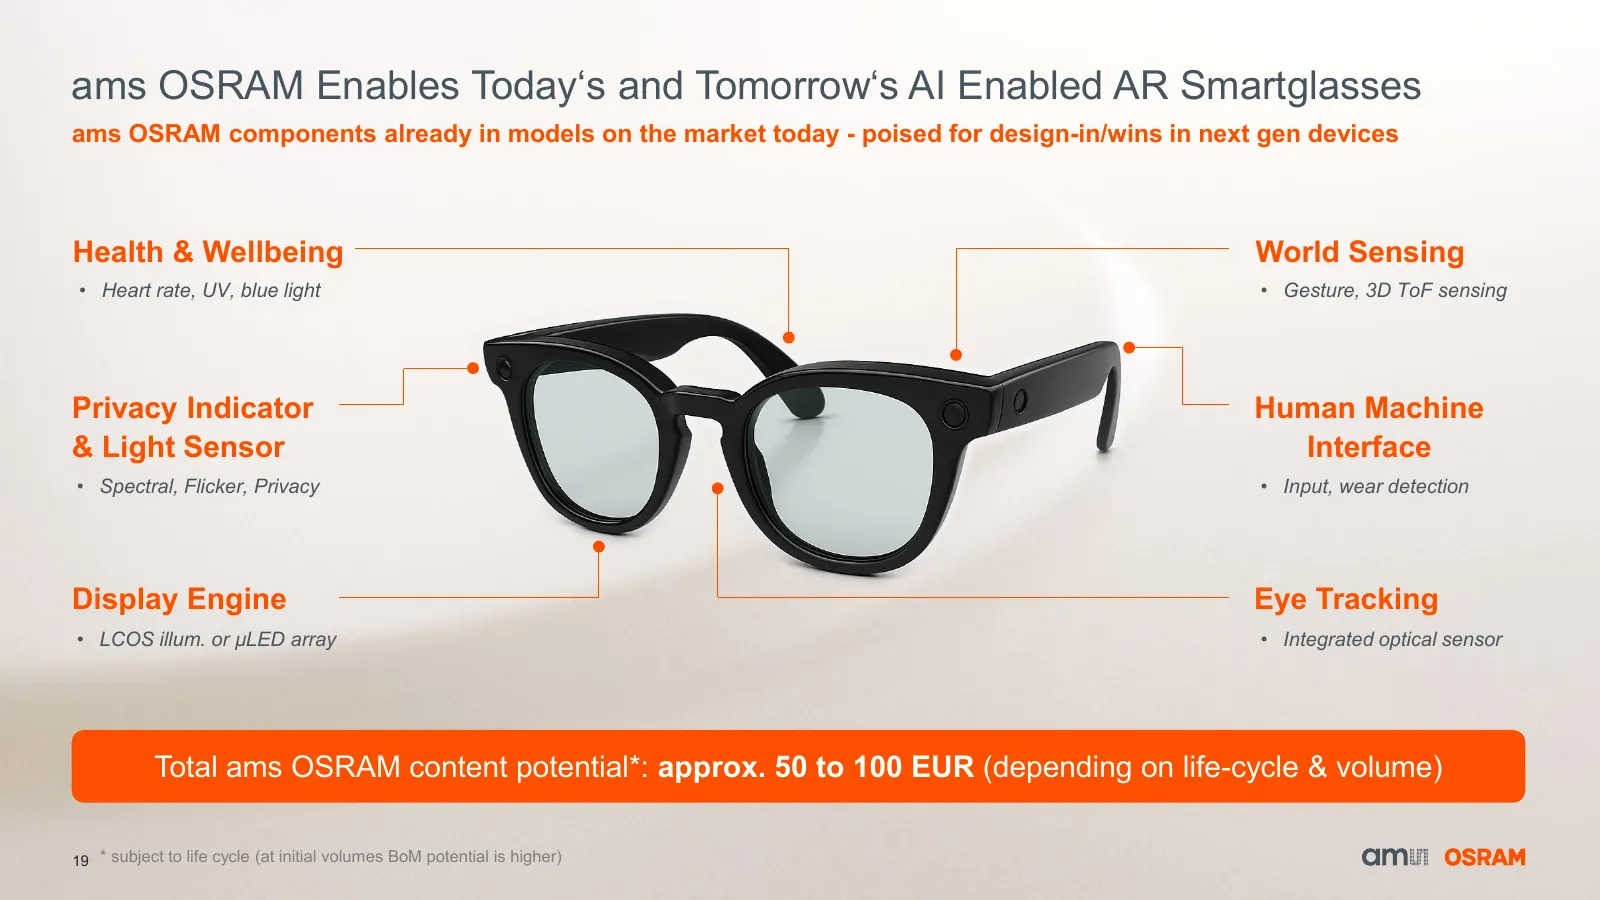
Slide 19: ams OSRAM Enables AI Enabled AR Smartglasses
ams OSRAM Enables Today‘s and Tomorrow‘s AI Enabled AR Smartglasses ams OSRAM components already in models on the market today - poised for design-in/wins in next gen devices Health & Wellbeing World Sensing • Heart rate, UV, blue light • Gesture, 3D ToF sensing Privacy Indicator Human Machine & Lig
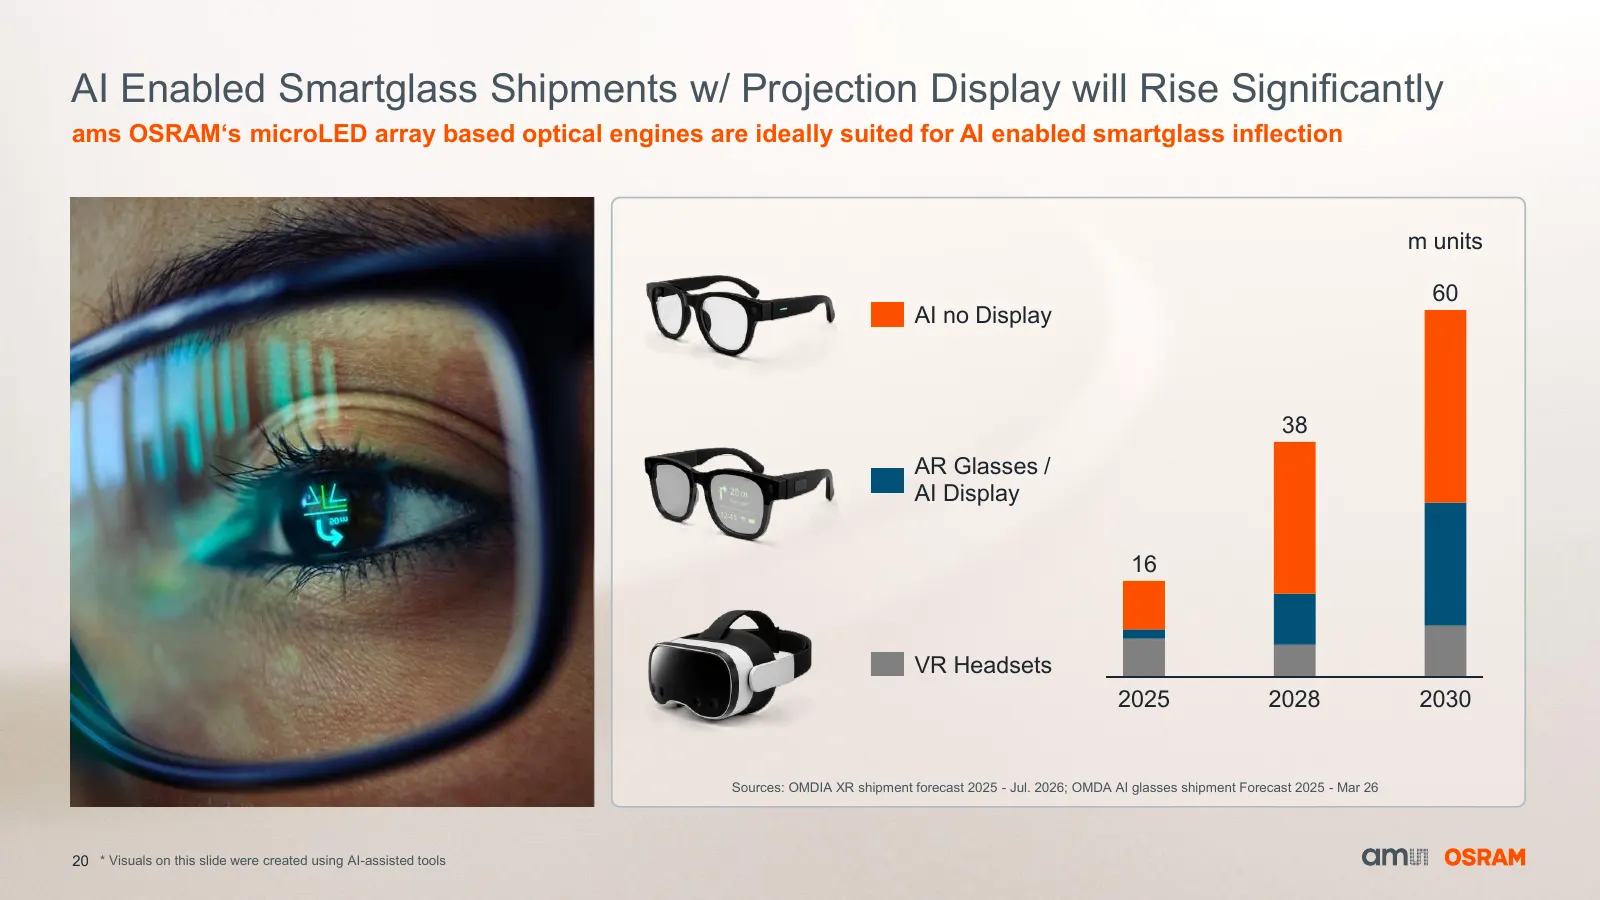
Slide 20: AI Enabled Smartglass Shipments will Rise Significantly
AI Enabled Smartglass Shipments w/ Projection Display will Rise Significantly ams OSRAM‘s microLED array based optical engines are ideally suited for AI enabled smartglass inflection m units 60 AI no Display 38 AR Glasses / AI Display 16 VR Headsets 2025 2028 2030 Sources: OMDIA XR shipment forecast
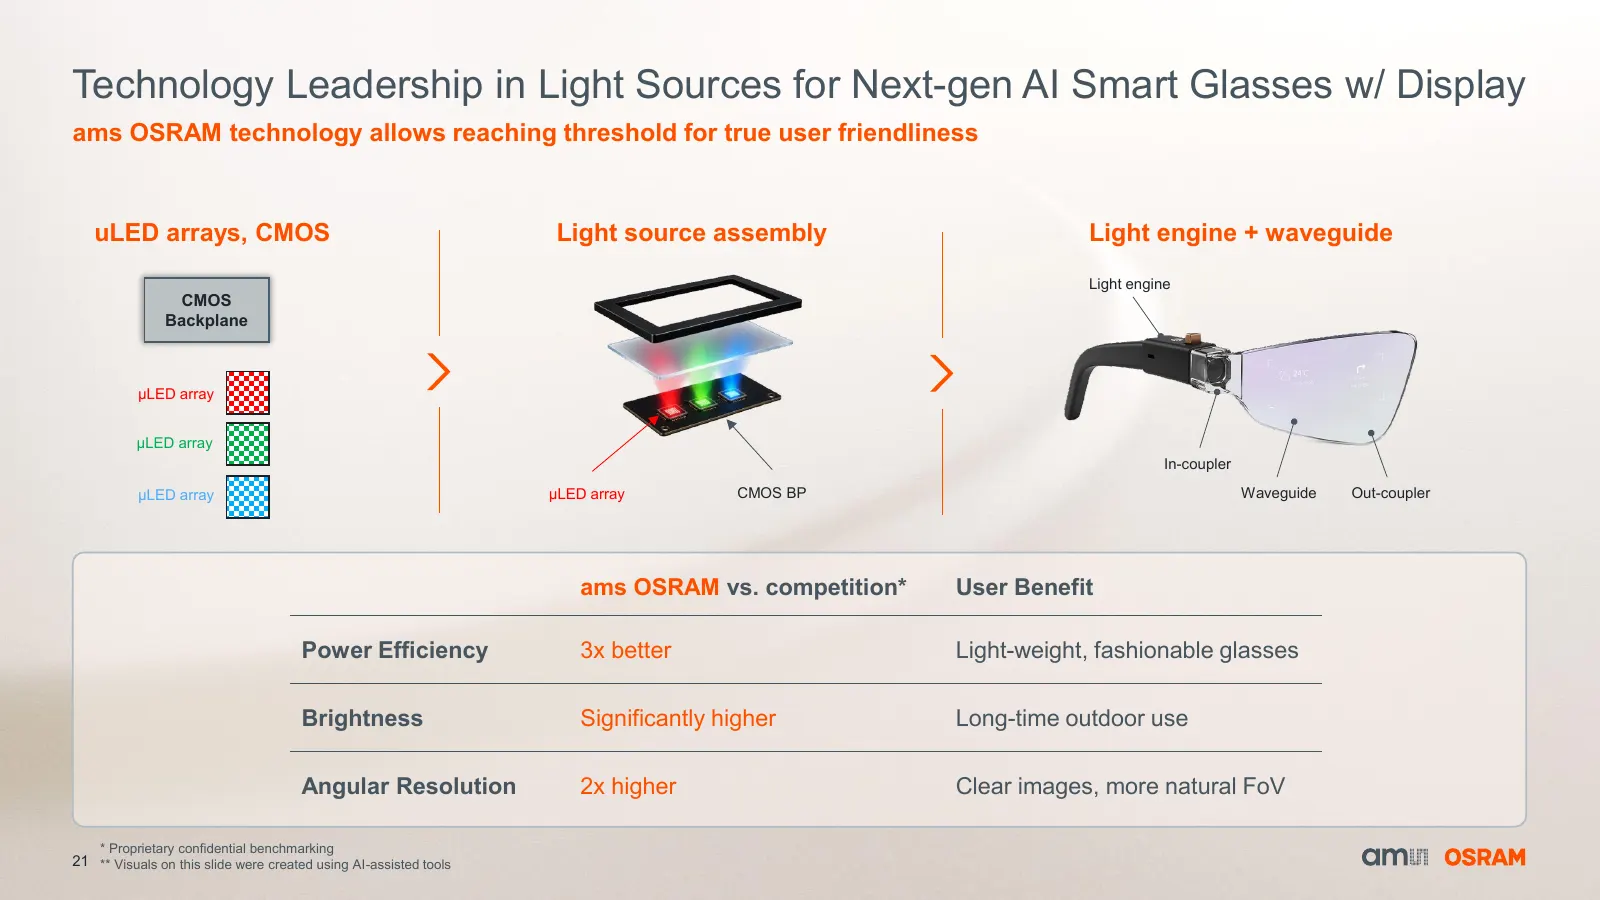
Slide 21: Technology Leadership in Light Sources for Next-gen AI Smart Glasses
Technology Leadership in Light Sources for Next-gen AI Smart Glasses w/ Display ams OSRAM technology allows reaching threshold for true user friendliness uLED arrays, CMOS Light source assembly Light engine + waveguide Light engine CMOS Backplane µLED array µLED array In-coupler µLED array µLED arra
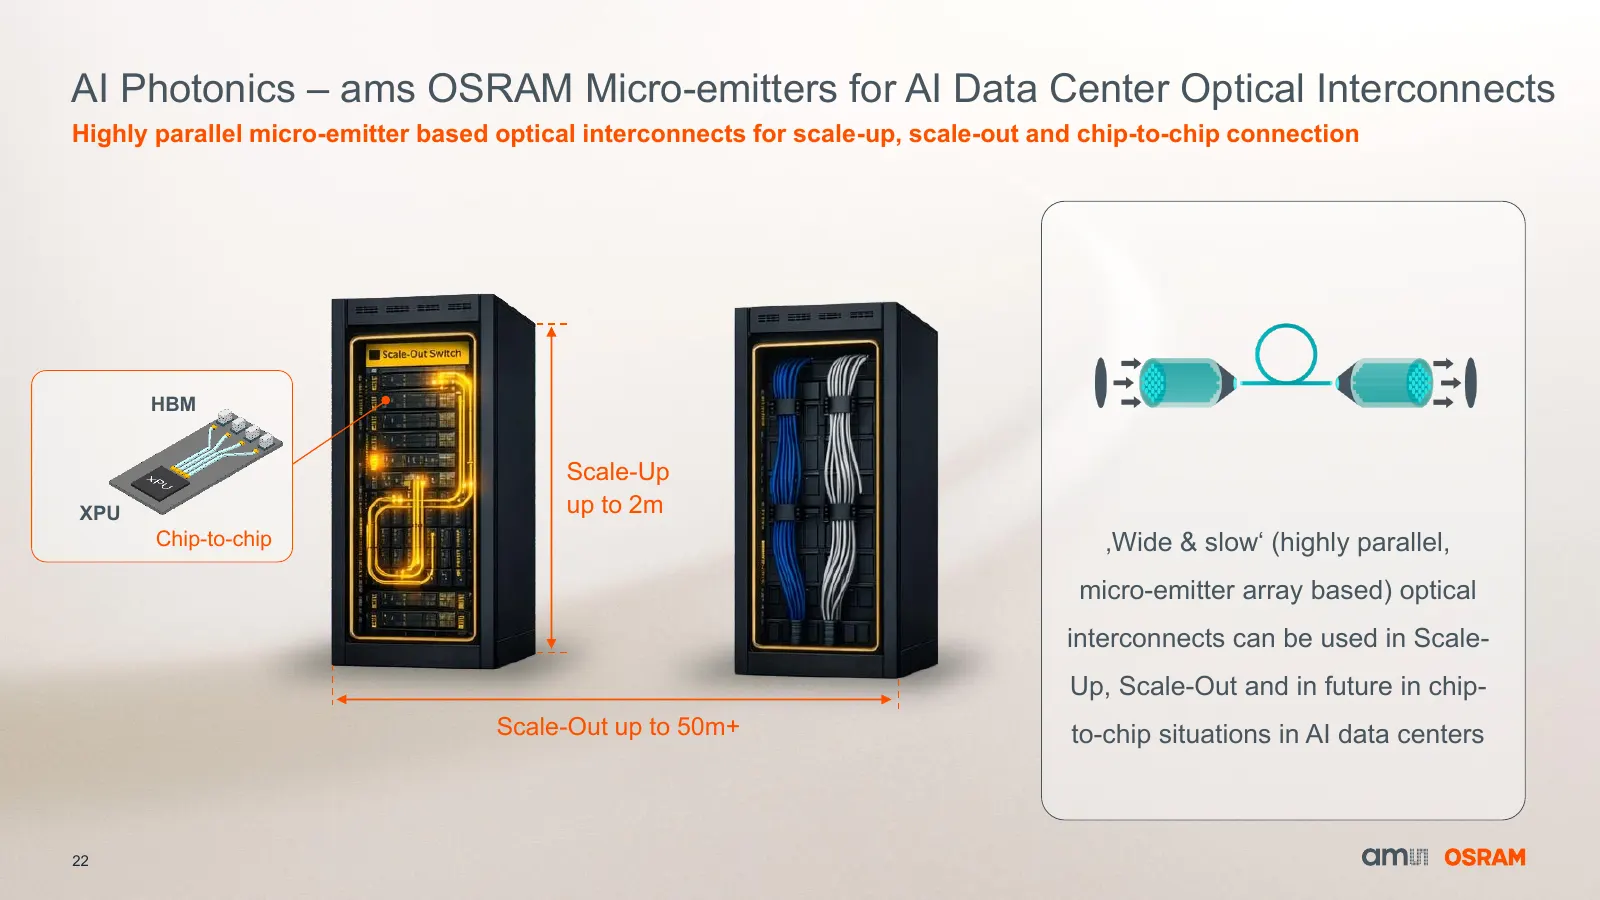
Slide 22: AI Photonics – Micro-emitters for AI Data Center Optical Interconnects
AI Photonics – ams OSRAM Micro-emitters for AI Data Center Optical Interconnects Highly parallel micro-emitter based optical interconnects for scale-up, scale-out and chip-to-chip connection HBM Scale-Up XPU up to 2m Chip-to-chip ‚Wide & slow‘ (highly parallel, micro-emitter array based) optical int
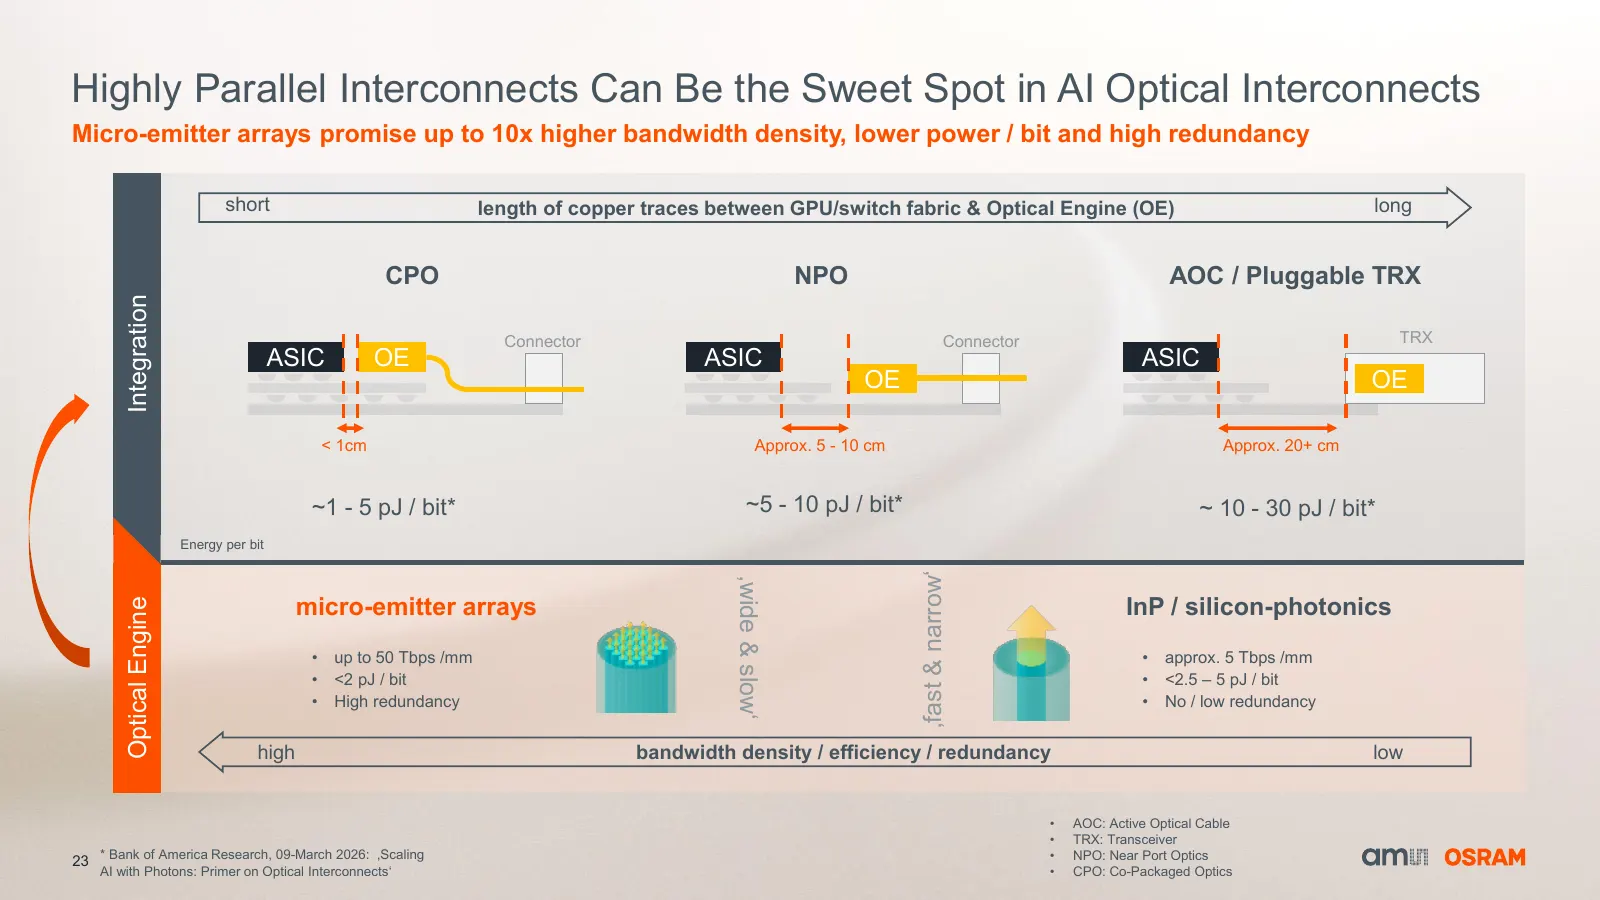
Slide 23: Highly Parallel Interconnects Can Be the Sweet Spot
Highly Parallel Interconnects Can Be the Sweet Spot in AI Optical Interconnects Micro-emitter arrays promise up to 10x higher bandwidth density, lower power / bit and high redundancy short length of copper traces between GPU/switch fabric & Optical Engine (OE) long CPO NPO AOC / Pluggable TRX Integr
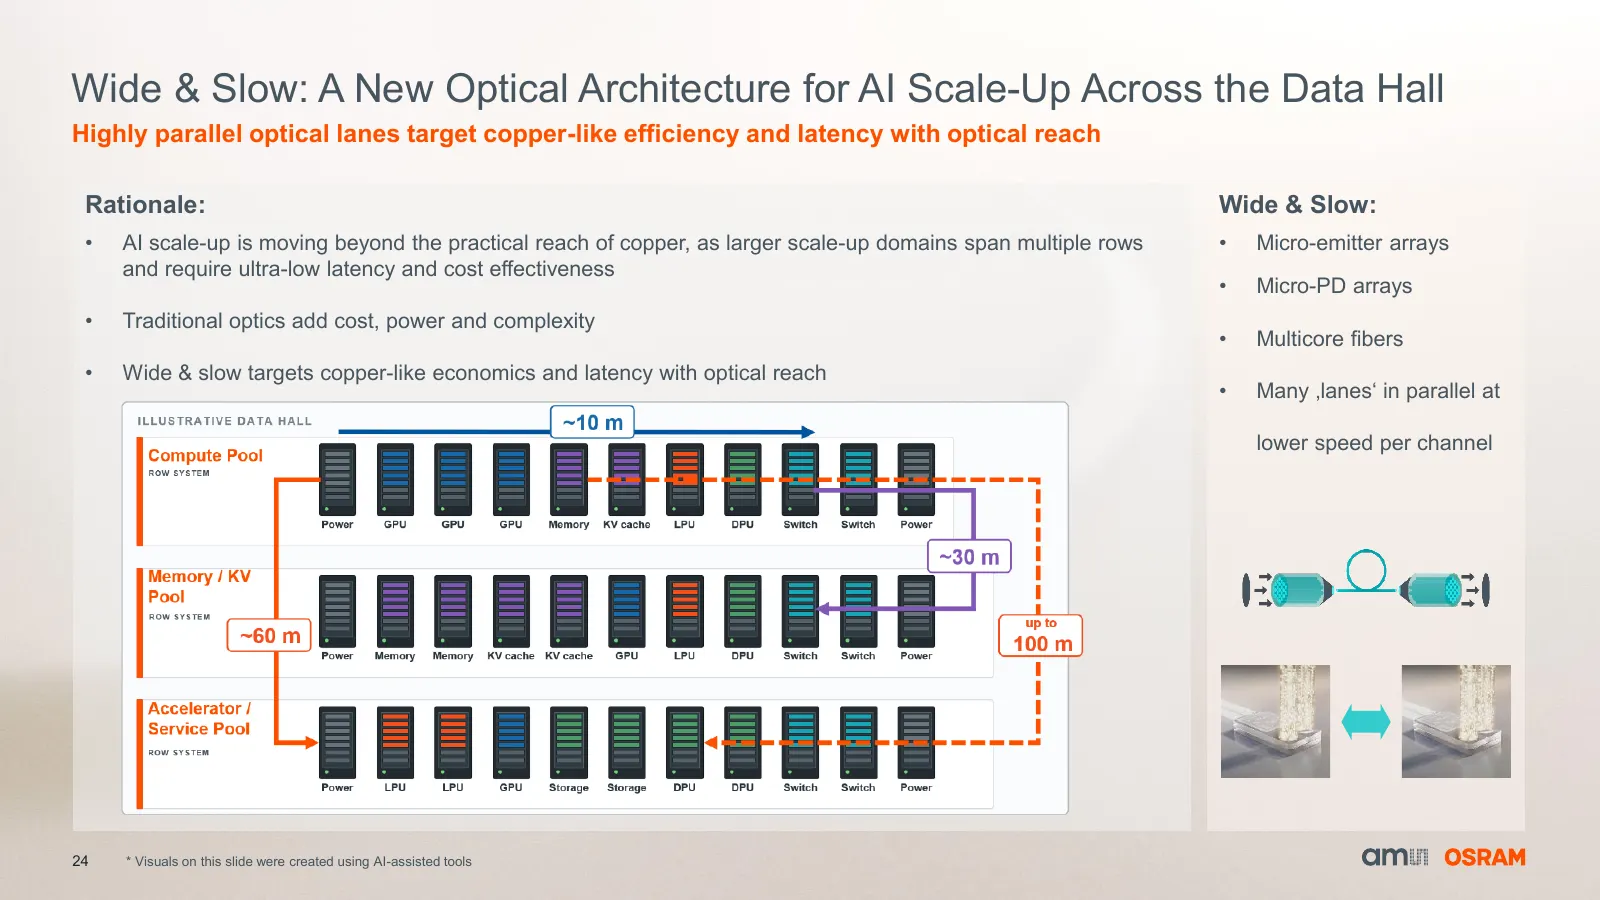
Slide 24: Wide & Slow: A New Optical Architecture for AI Scale-Up
Wide & Slow: A New Optical Architecture for AI Scale-Up Across the Data Hall Highly parallel optical lanes target copper-like efficiency and latency with optical reach Rationale: Wide & Slow: • AI scale-up is moving beyond the practical reach of copper, as larger scale-up domains span multiple rows
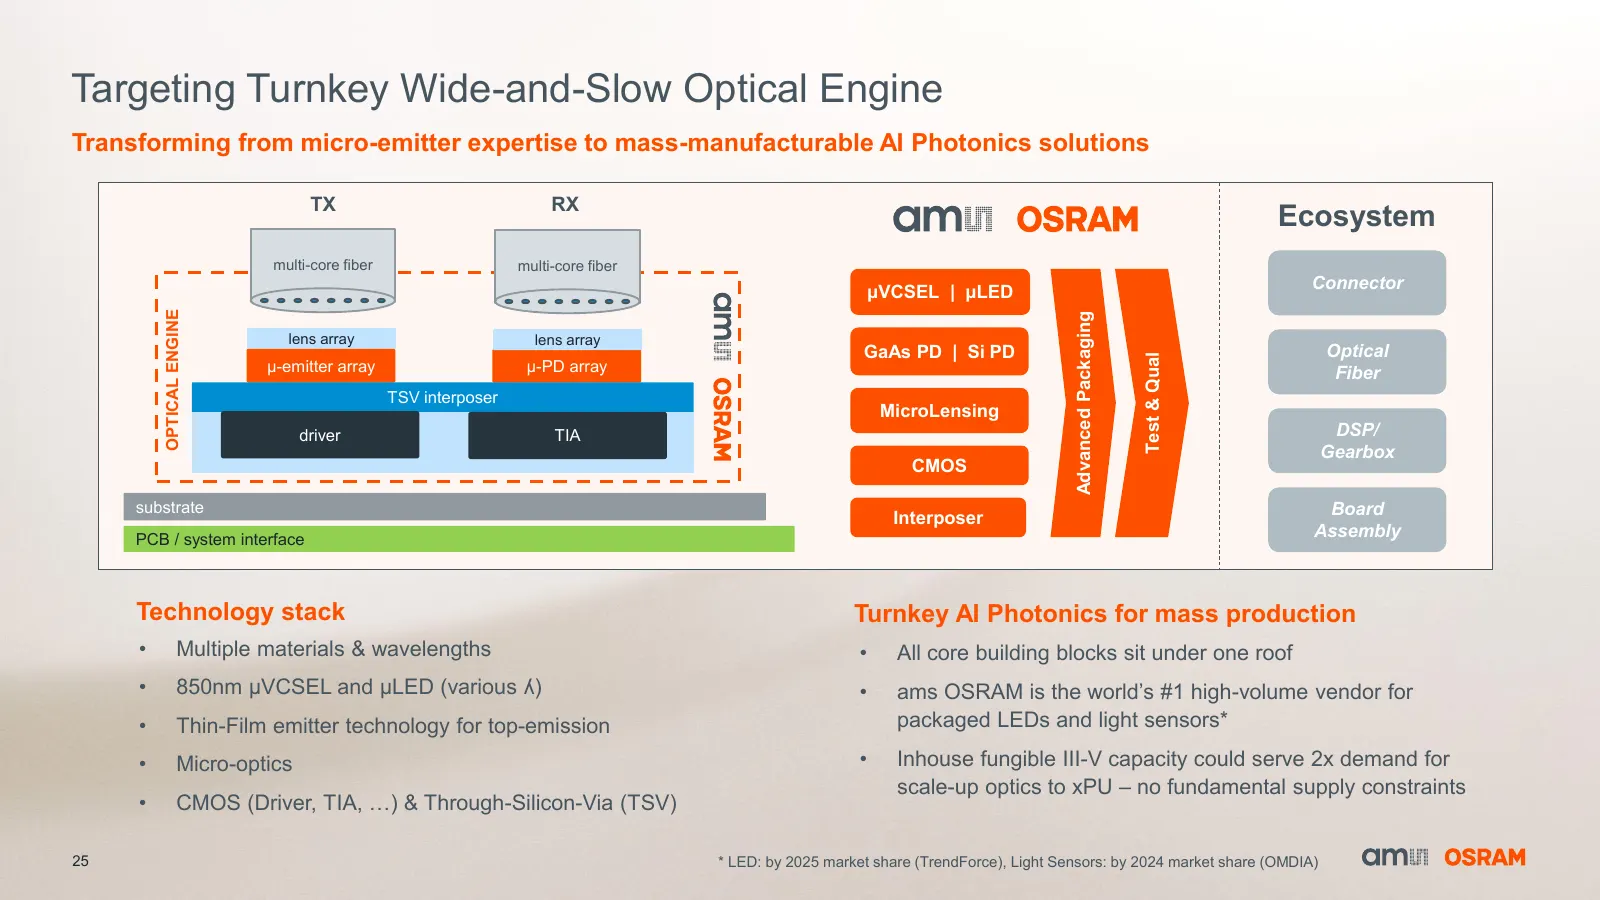
Slide 25: Targeting Turnkey Wide-and-Slow Optical Engine
Targeting Turnkey Wide-and-Slow Optical Engine Transforming from micro-emitter expertise to mass-manufacturable AI Photonics solutions TX RX Ecosystem multi-core fiber multi-core fiber μVCSEL | μLED Connector OPTICAL ENGINE Advanced Packaging lens array lens array GaAs PD | Si PD Optical Test & Qual
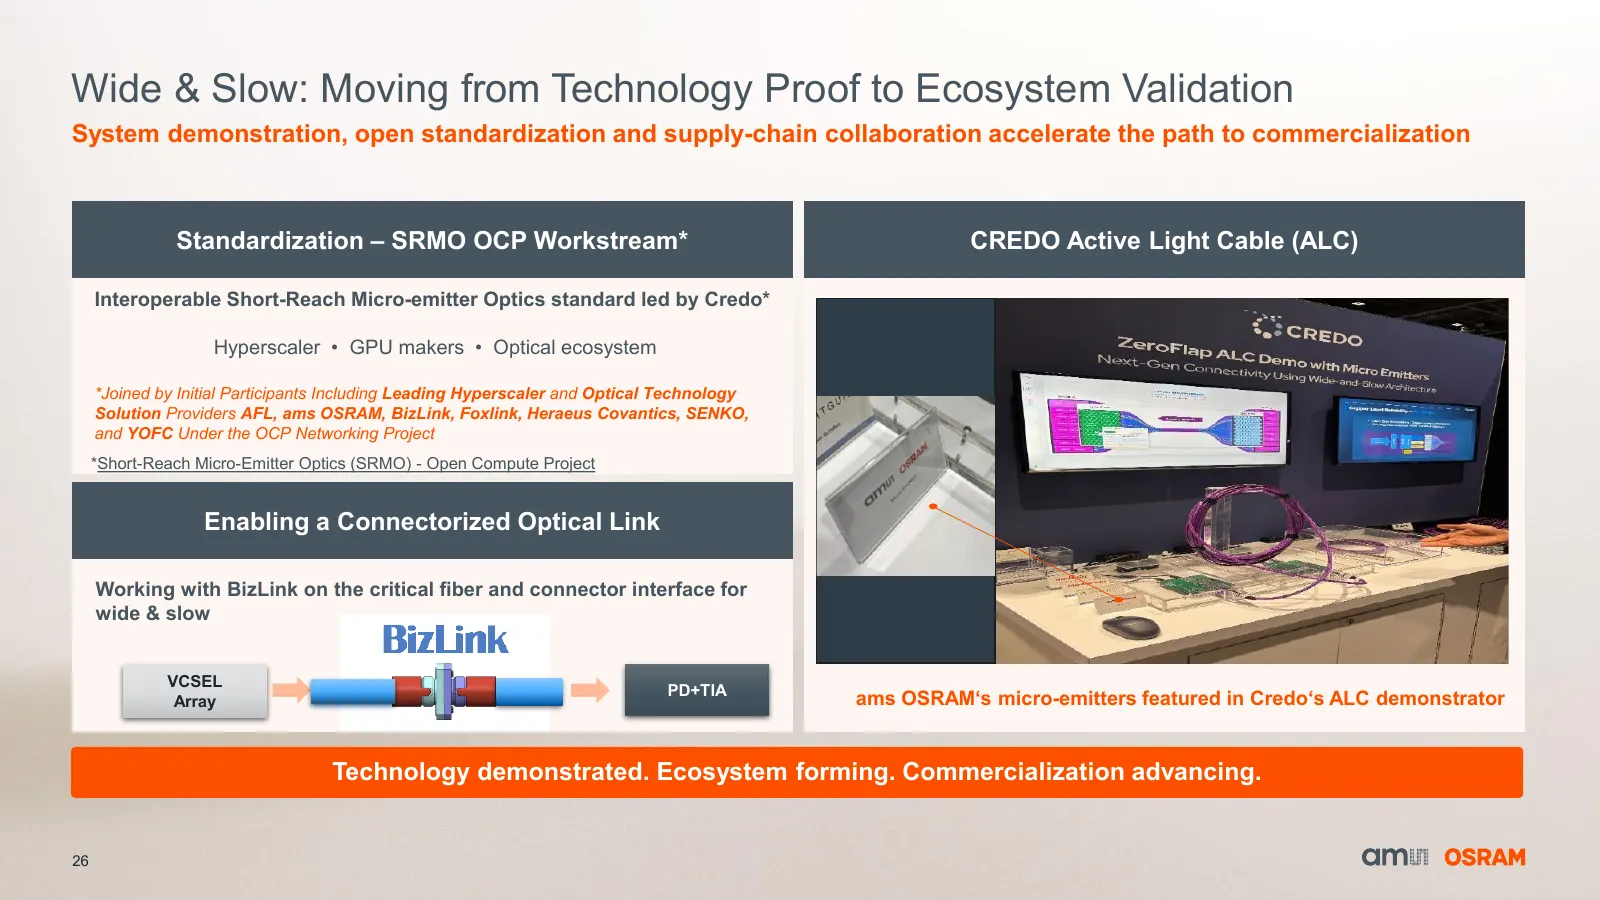
Slide 26: Wide & Slow: Moving from Technology Proof to Ecosystem Validation
Wide & Slow: Moving from Technology Proof to Ecosystem Validation System demonstration, open standardization and supply-chain collaboration accelerate the path to commercialization Standardization – SRMO OCP Workstream* CREDO Active Light Cable (ALC) Interoperable Short-Reach Micro-emitter Optics st
Slide 27: Business Overview
Sense the power of light Business Overview 27
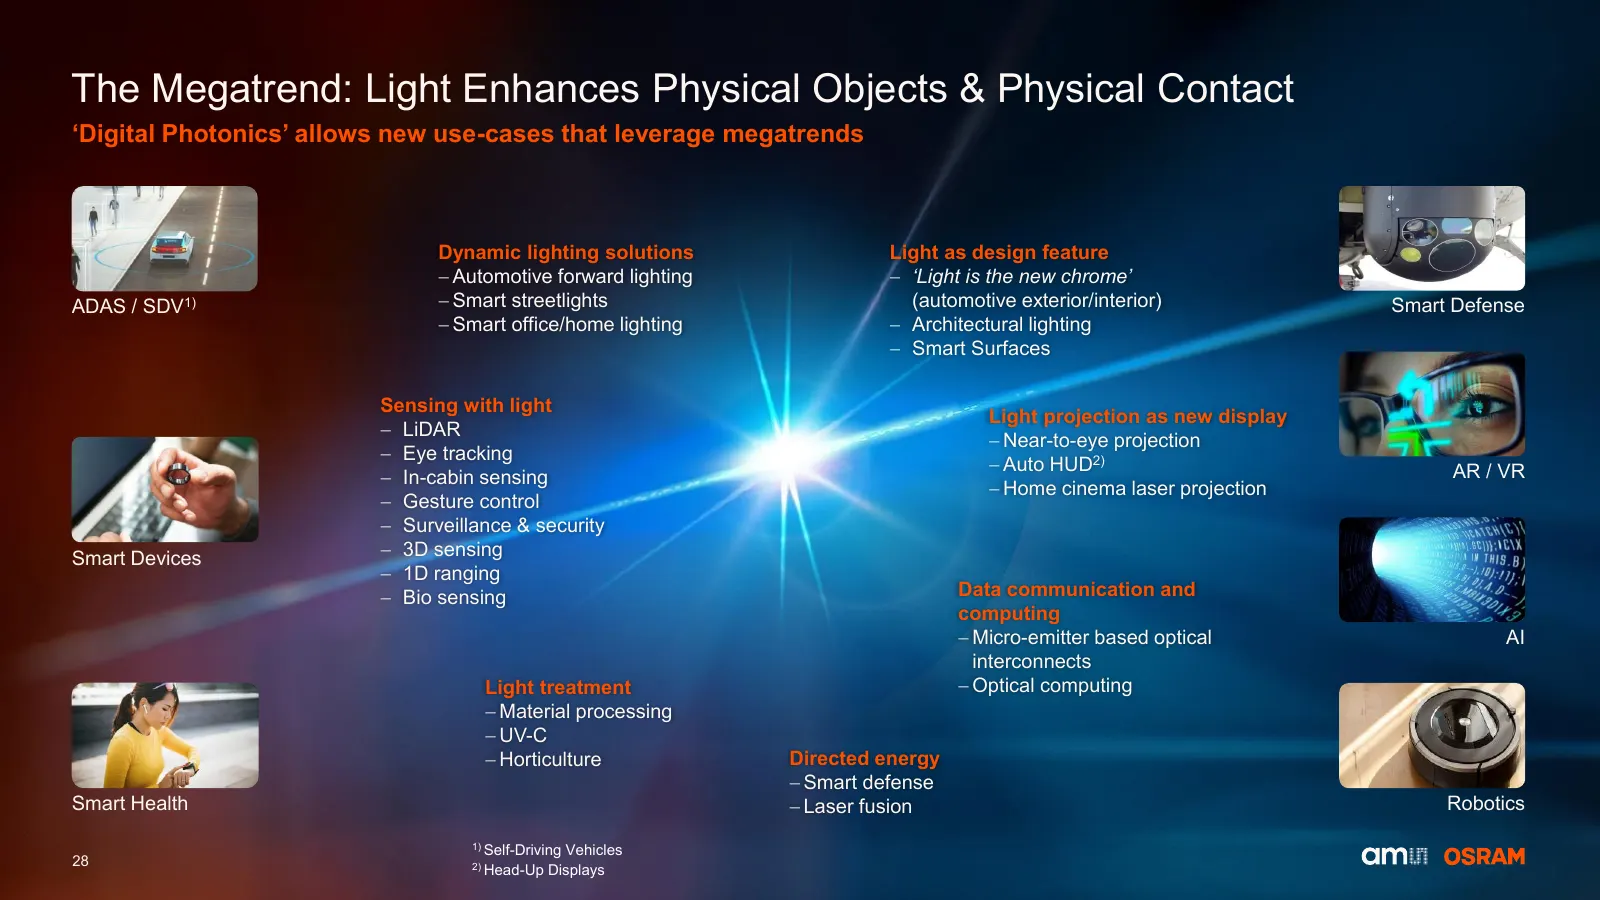
Slide 28: The Megatrend: Light Enhances Physical Objects & Physical Contact
The Megatrend: Light Enhances Physical Objects & Physical Contact ‘Digital Photonics’ allows new use-cases that leverage megatrends Dynamic lighting solutions Light as design feature − Automotive forward lighting − ‘Light is the new chrome’ ADAS / SDV1) − Smart streetlights (automotive exterior/inte
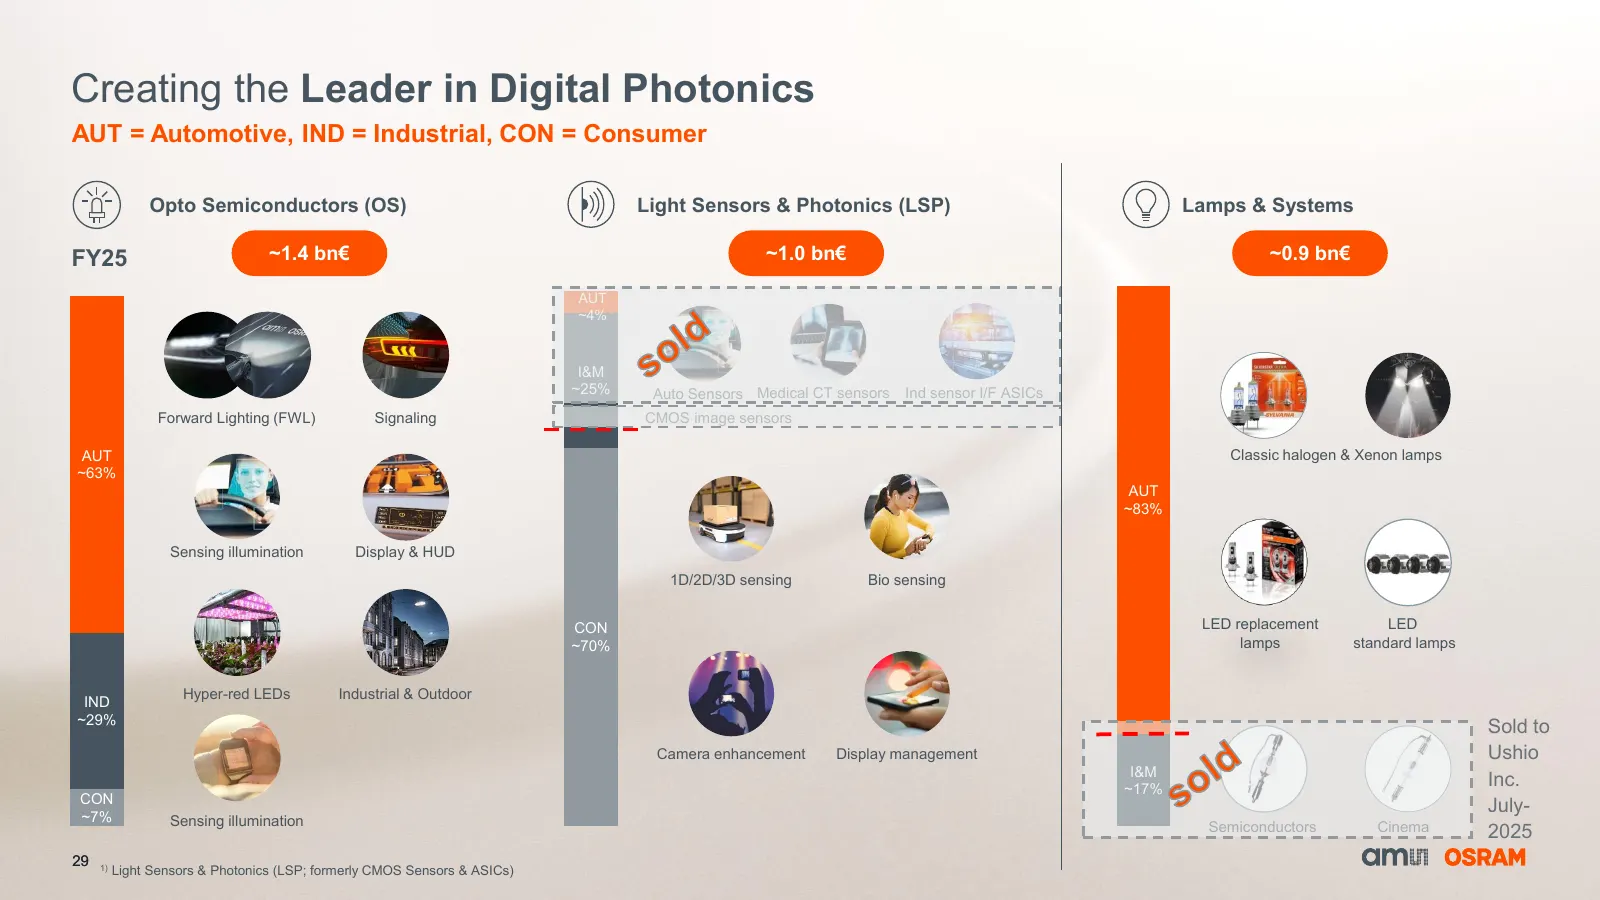
Slide 29: Creating the Leader in Digital Photonics
Creating the Leader in Digital Photonics AUT = Automotive, IND = Industrial, CON = Consumer Opto Semiconductors (OS) Light Sensors & Photonics (LSP) Lamps & Systems FY25 ~1.4 bn€ ~1.0 bn€ ~0.9 bn€ AUT ~4% l d I&M ~25% so Auto Sensors Medical CT sensors Ind sensor I/F ASICs Forward Lighting (FWL) Sig
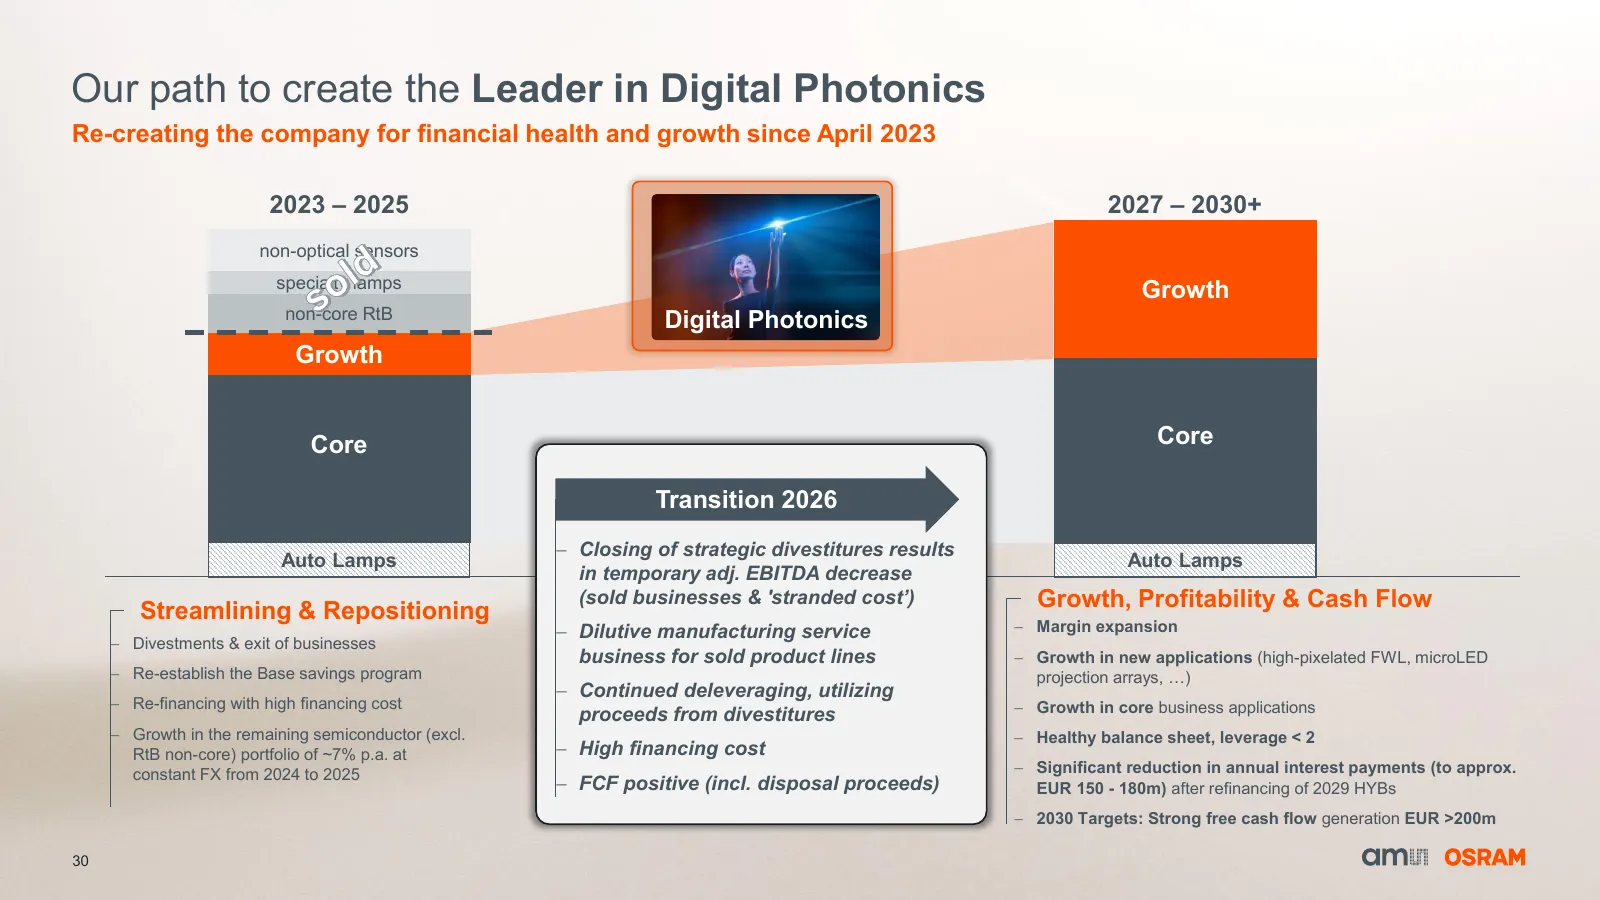
Slide 30: Our path to create the Leader in Digital Photonics
Our path to create the Leader in Digital Photonics Re-creating the company for financial health and growth since April 2023 2023 – 2025 2027 – 2030+ non-optical sensors o ld specialty lamps Growth s RtB non-core Digital Photonics Growth Core Core Transition 2026 − Closing of strategic divestitures r
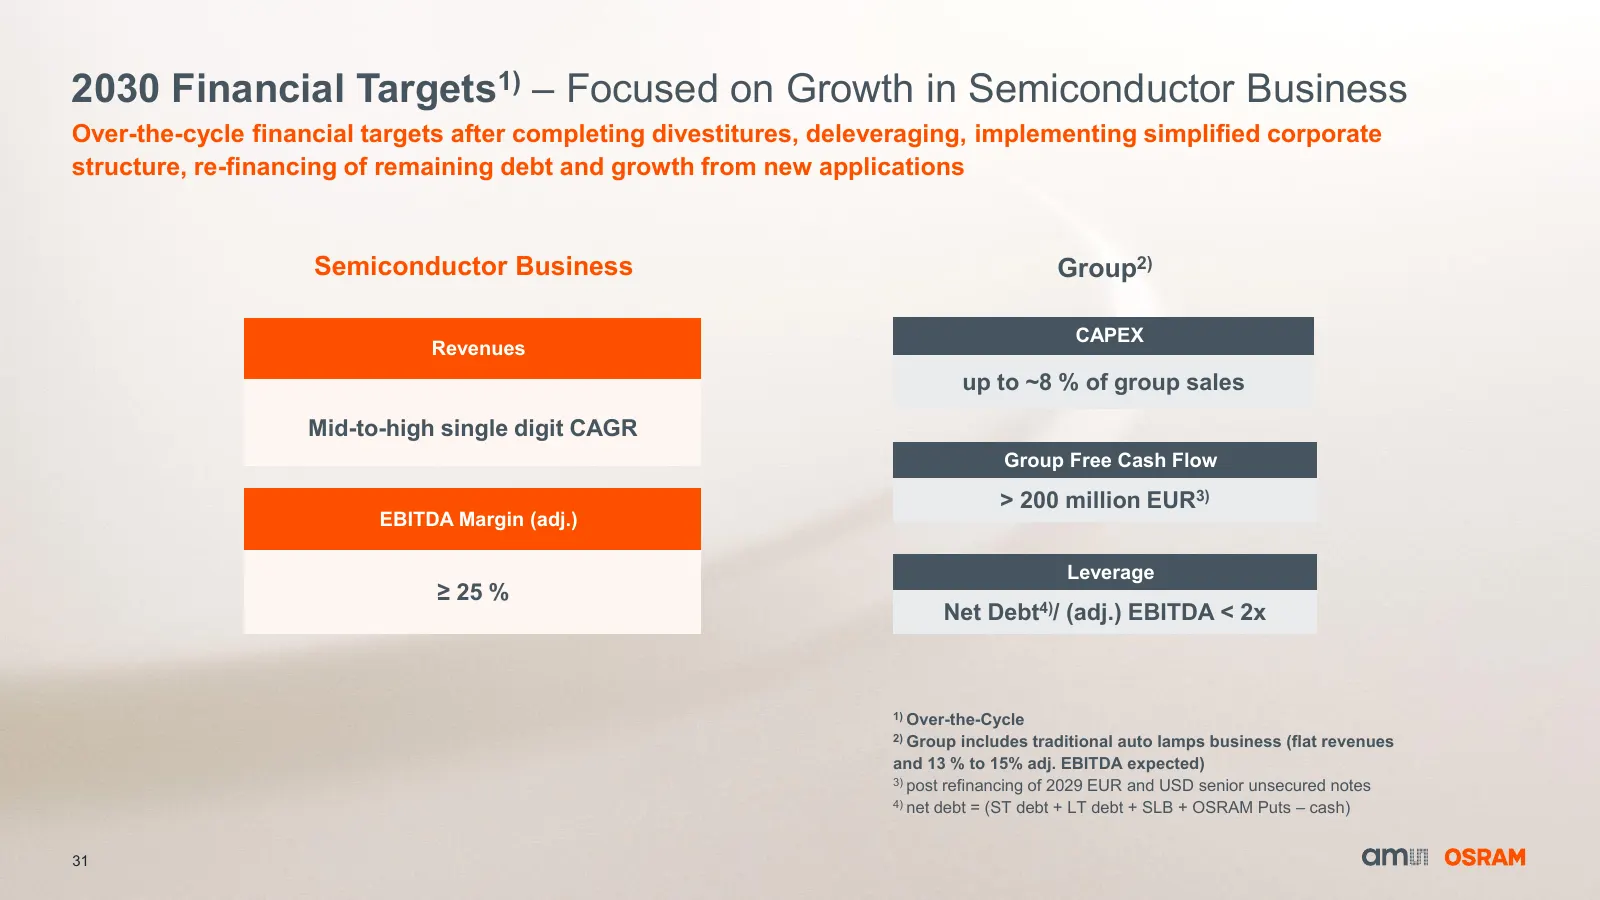
Slide 31: 2030 Financial Targets – Focused on Growth in Semiconductor Business
2030 Financial Targets1) – Focused on Growth in Semiconductor Business Over-the-cycle financial targets after completing divestitures, deleveraging, implementing simplified corporate structure, re-financing of remaining debt and growth from new applications Semiconductor Business Group2) CAPEX Reven
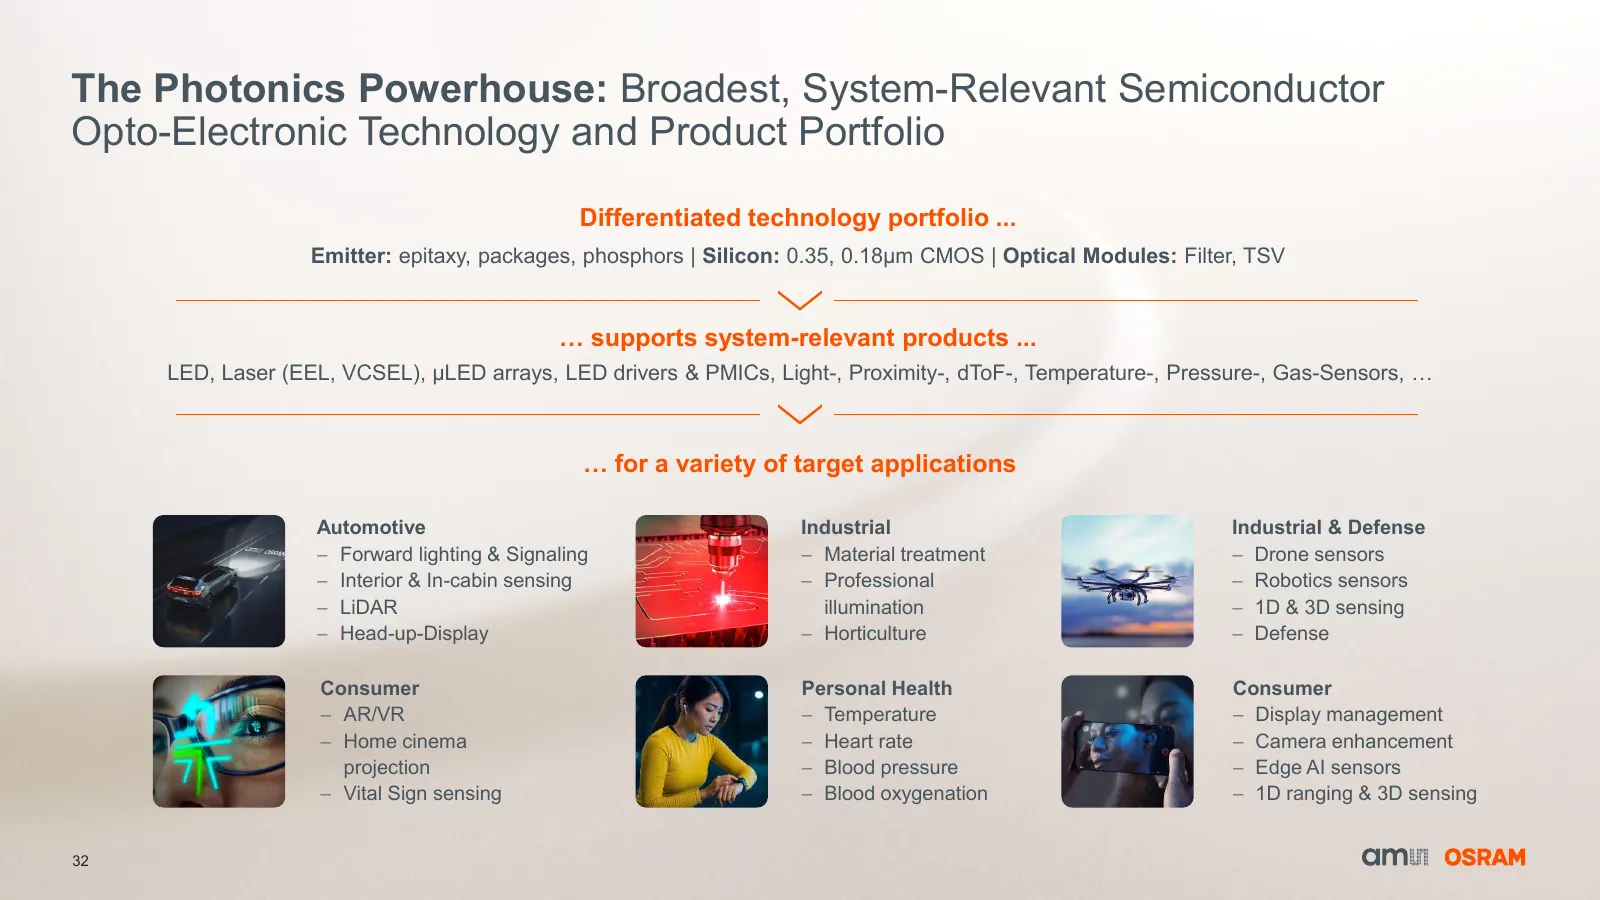
Slide 32: The Photonics Powerhouse: Broadest Opto-Electronic Technology and Product Portfolio
The Photonics Powerhouse: Broadest, System-Relevant Semiconductor Opto-Electronic Technology and Product Portfolio Differentiated technology portfolio ... Emitter: epitaxy, packages, phosphors | Silicon: 0.35, 0.18µm CMOS | Optical Modules: Filter, TSV … supports system-relevant products ... LED, La
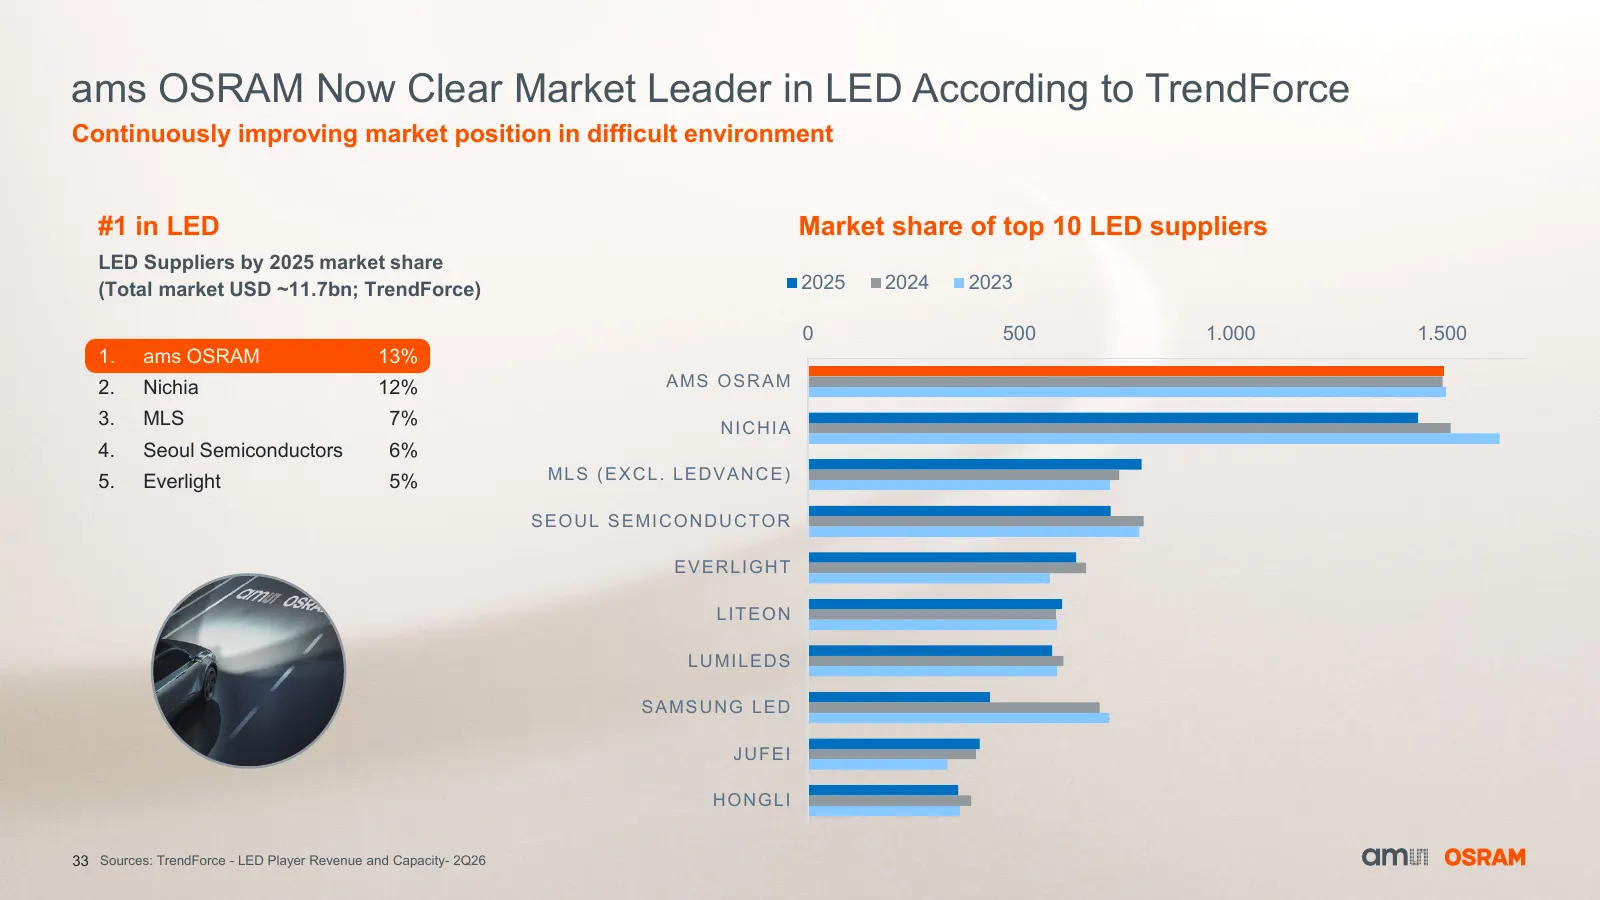
Slide 33: ams OSRAM Now Clear Market Leader in LED According to TrendForce
ams OSRAM Now Clear Market Leader in LED According to TrendForce Continuously improving market position in difficult environment #1 in LED Market share of top 10 LED suppliers LED Suppliers by 2025 market share (Total market USD ~11.7bn; TrendForce) 2025 2024 2023 0 500 1.000 1.500 1. ams OSRAM 13%
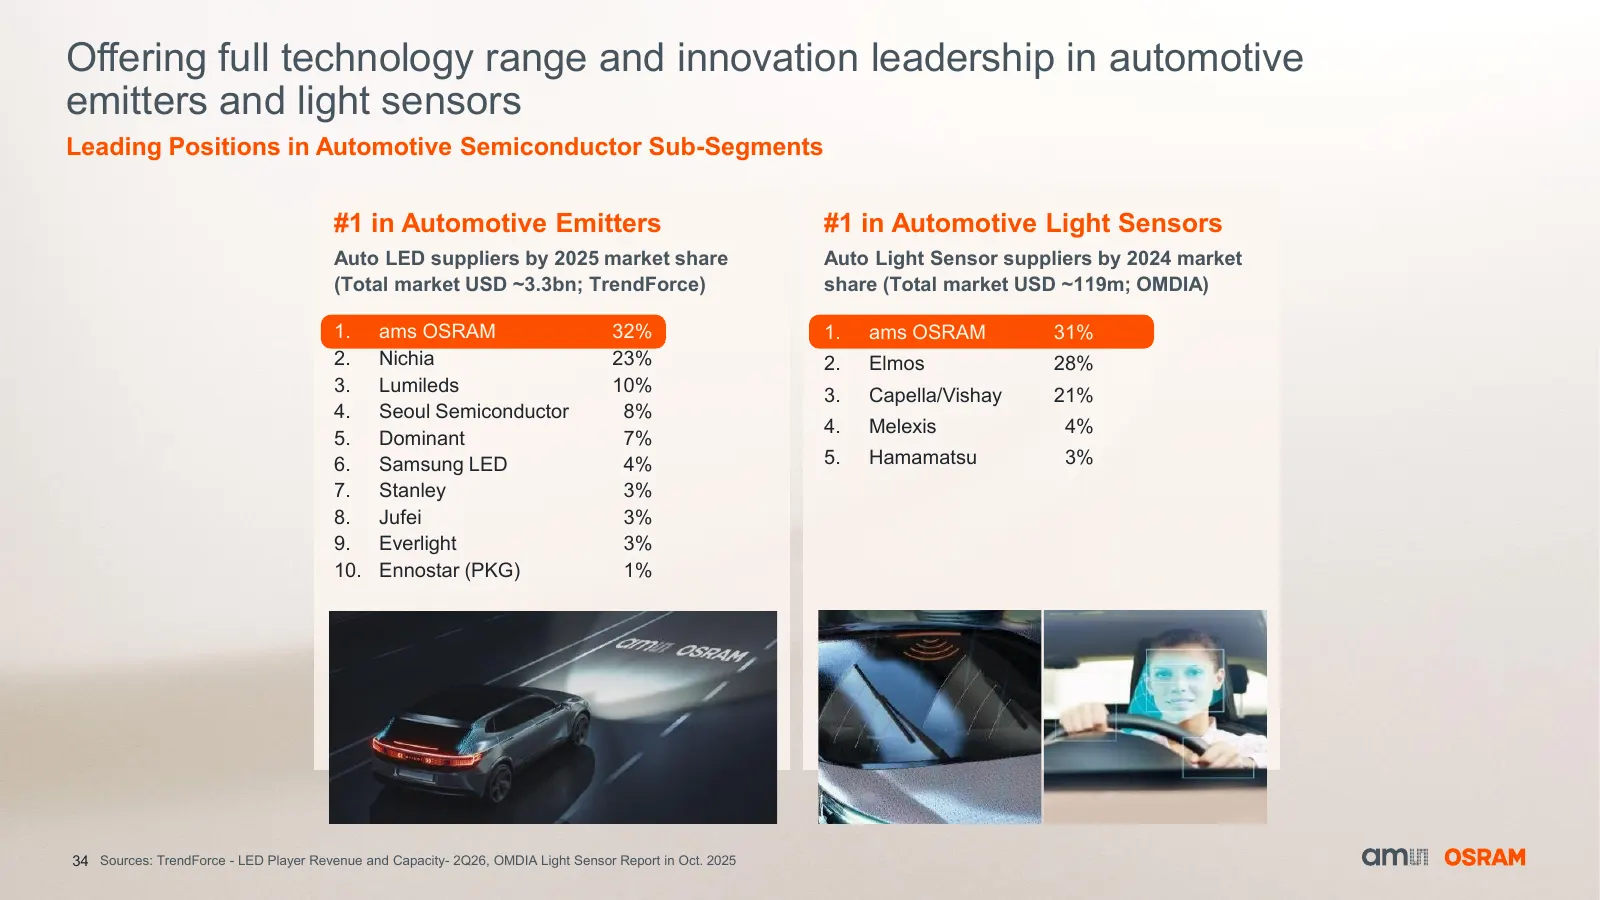
Slide 34: Innovation leadership in automotive emitters and light sensors
Offering full technology range and innovation leadership in automotive emitters and light sensors Leading Positions in Automotive Semiconductor Sub-Segments #1 in Automotive Emitters #1 in Automotive Light Sensors Auto LED suppliers by 2025 market share Auto Light Sensor suppliers by 2024 market (To
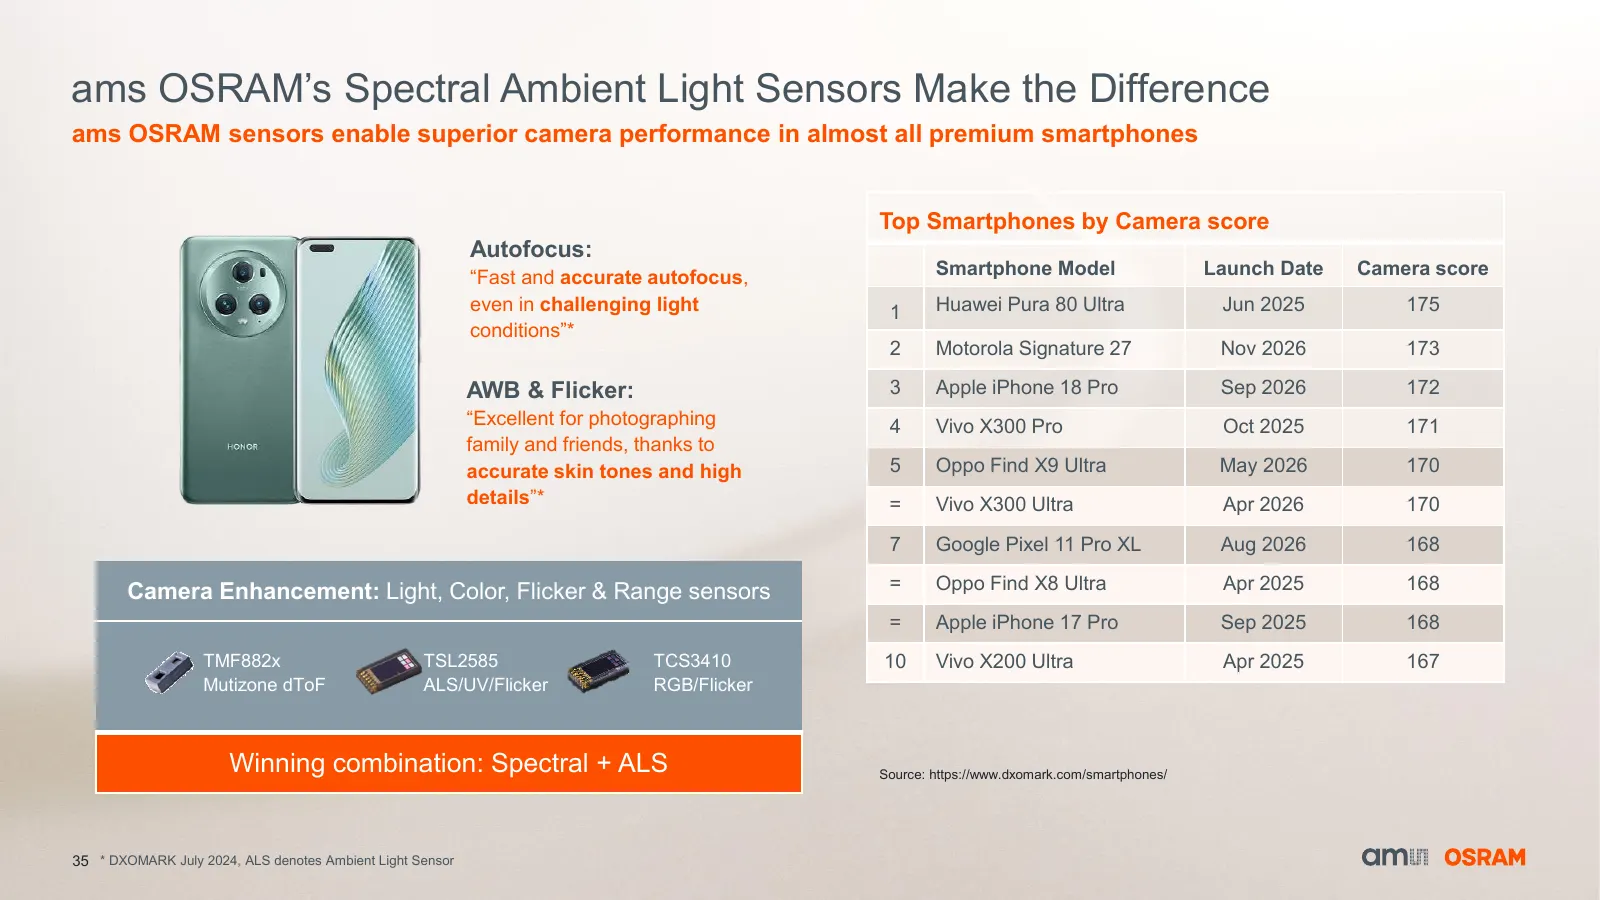
Slide 35: Spectral Ambient Light Sensors Make the Difference
ams OSRAM’s Spectral Ambient Light Sensors Make the Difference ams OSRAM sensors enable superior camera performance in almost all premium smartphones Top Smartphones by Camera score Autofocus: “Fast and accurate autofocus, Smartphone Model Launch Date Camera score even in challenging light 1 Huawei
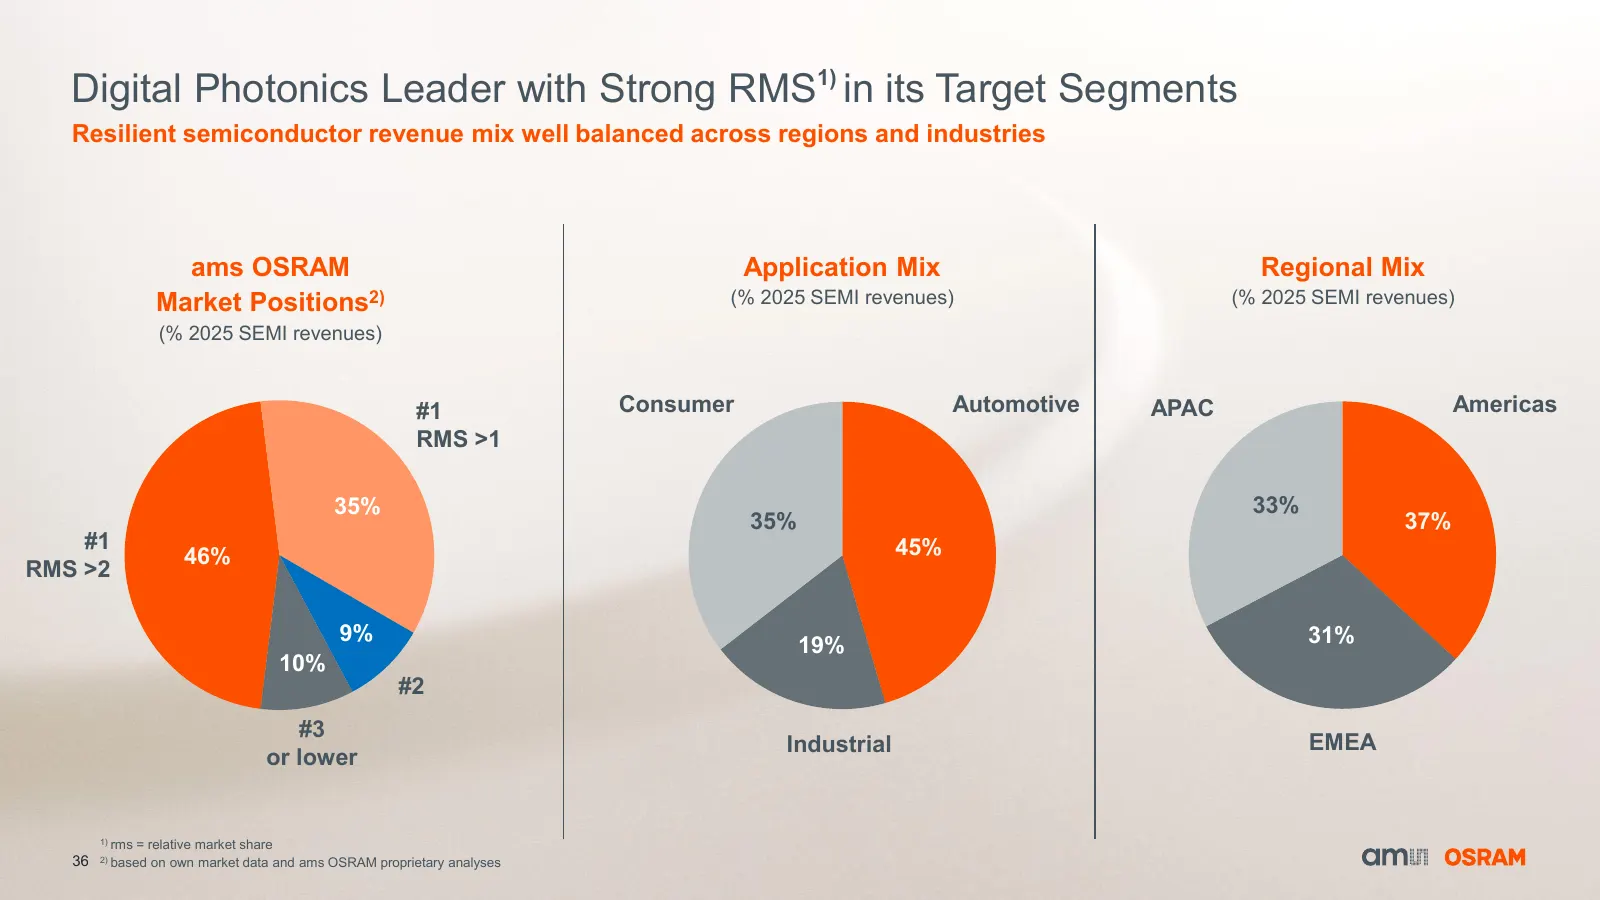
Slide 36: Digital Photonics Leader with Strong RMS in its Target Segments
Digital Photonics Leader with Strong RMS1) in its Target Segments Resilient semiconductor revenue mix well balanced across regions and industries ams OSRAM Application Mix Regional Mix Market Positions2) (% 2025 SEMI revenues) (% 2025 SEMI revenues) (% 2025 SEMI revenues) #1 Consumer Automotive APAC
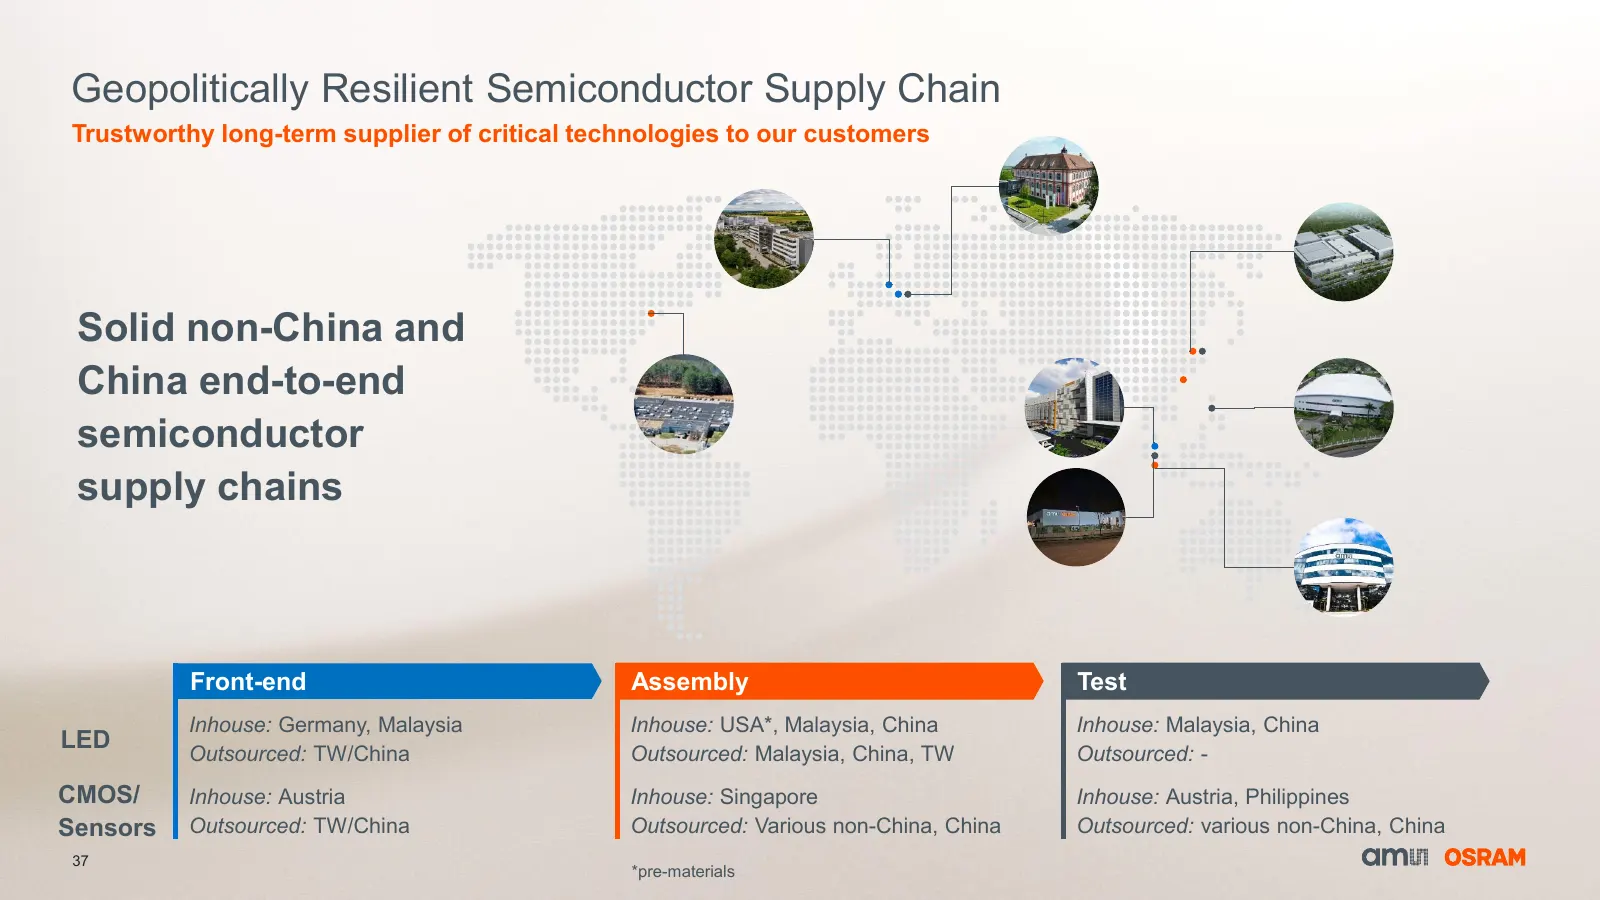
Slide 37: Geopolitically Resilient Semiconductor Supply Chain
Geopolitically Resilient Semiconductor Supply Chain Trustworthy long-term supplier of critical technologies to our customers Solid non-China and China end-to-end semiconductor supply chains Front-end Assembly Test Inhouse: Germany, Malaysia Inhouse: USA*, Malaysia, China Inhouse: Malaysia, China LED
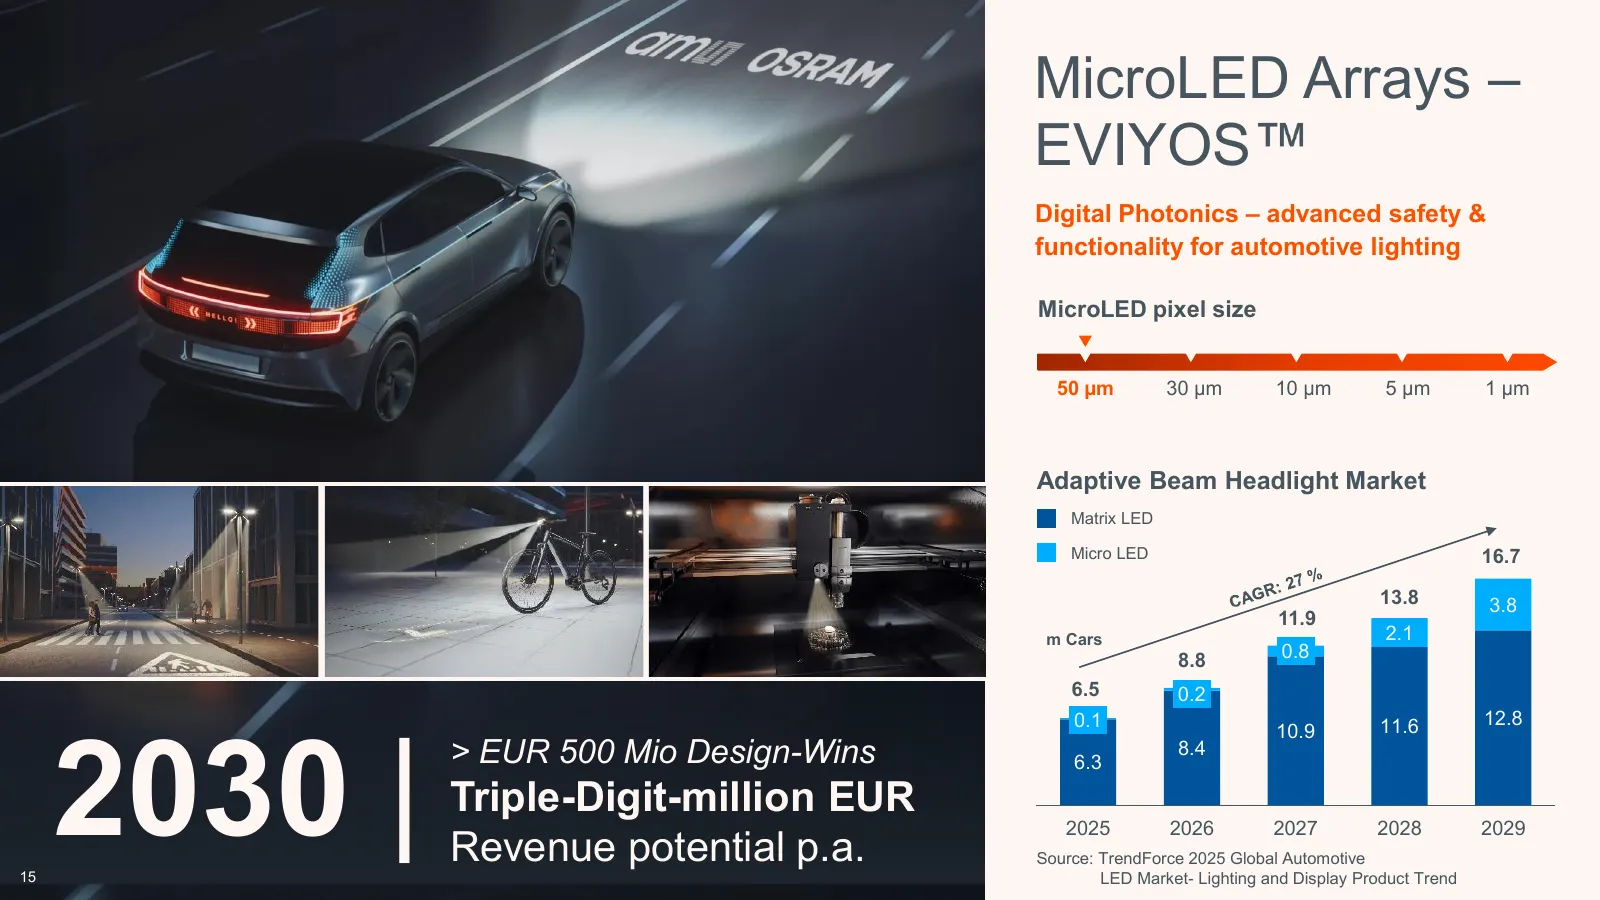
Slide 38: MicroLED Arrays – EVIYOS
MicroLED Arrays – EVIYOS Digital Photonics – advanced safety & functionality for automotive lighting MicroLED pixel size 50 µm 30 µm 10 µm 5 µm 1 µm Adaptive Beam Headlight Market Matrix LED Micro LED 16.7 13.8 3.8 11.9 m Cars 2.1 8.8 0.8 6.5 0.2 0.1 12.8 2030 | 10.9 11.6 > EUR 500 Mio Design-Wins 6
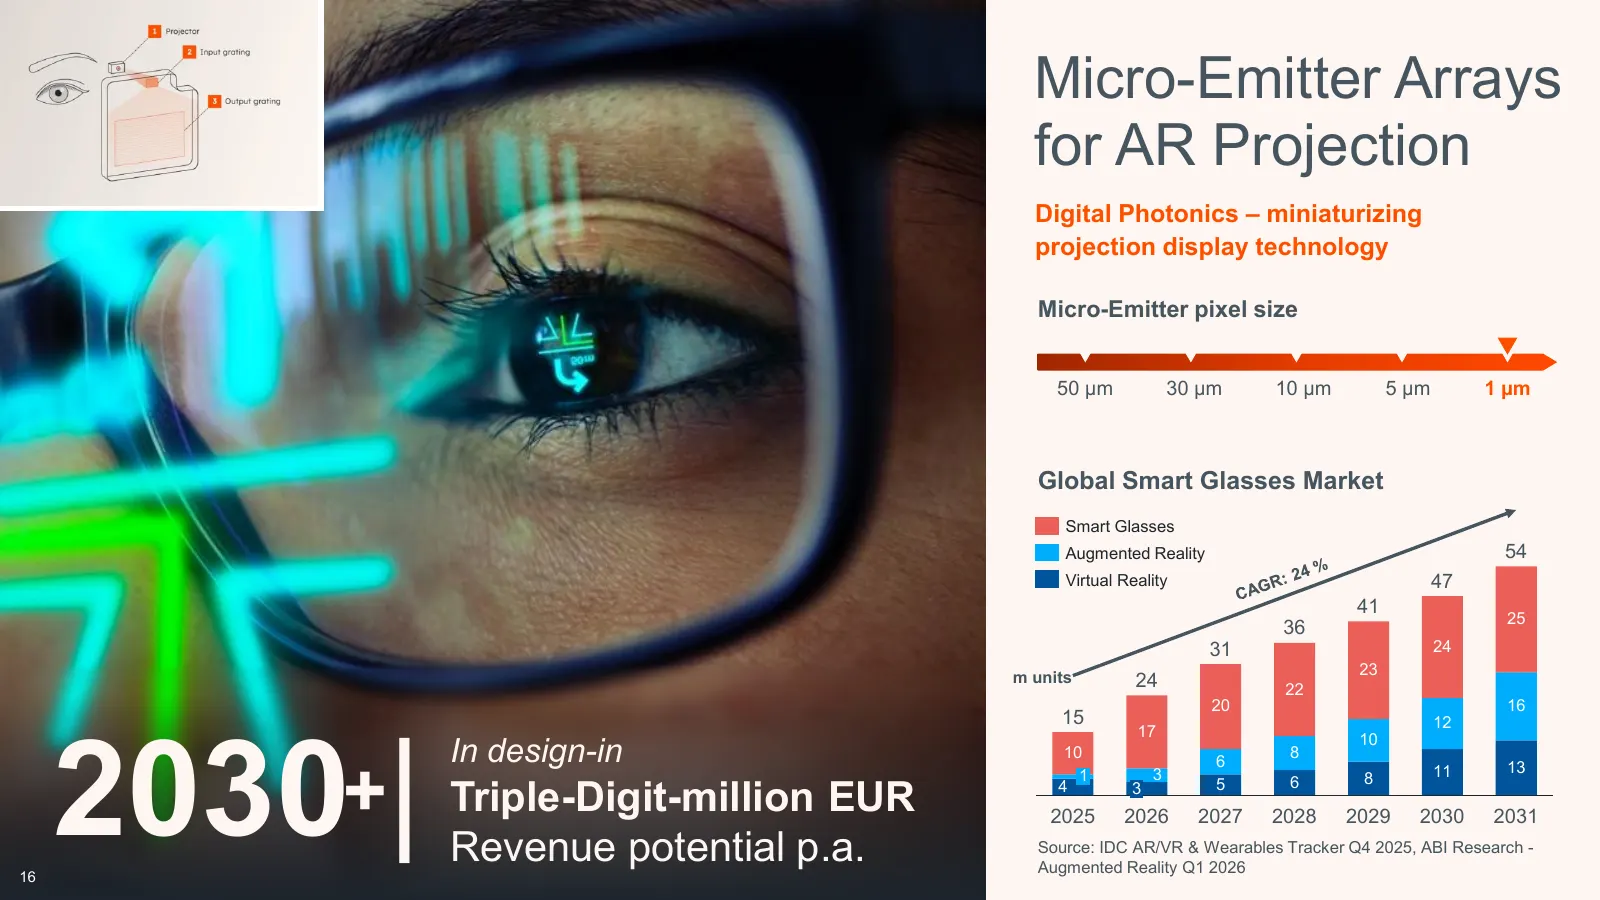
Slide 39: Micro-Emitter Arrays for AR Projection
Micro-Emitter Arrays for AR Projection Digital Photonics – miniaturizing projection display technology Micro-Emitter pixel size 50 µm 30 µm 10 µm 5 µm 1 µm Global Smart Glasses Market Smart Glasses Augmented Reality 54 Virtual Reality 47 41 25 36 31 24 m units 23 24 22 20 16 15 12 2030 | 17 10 In de
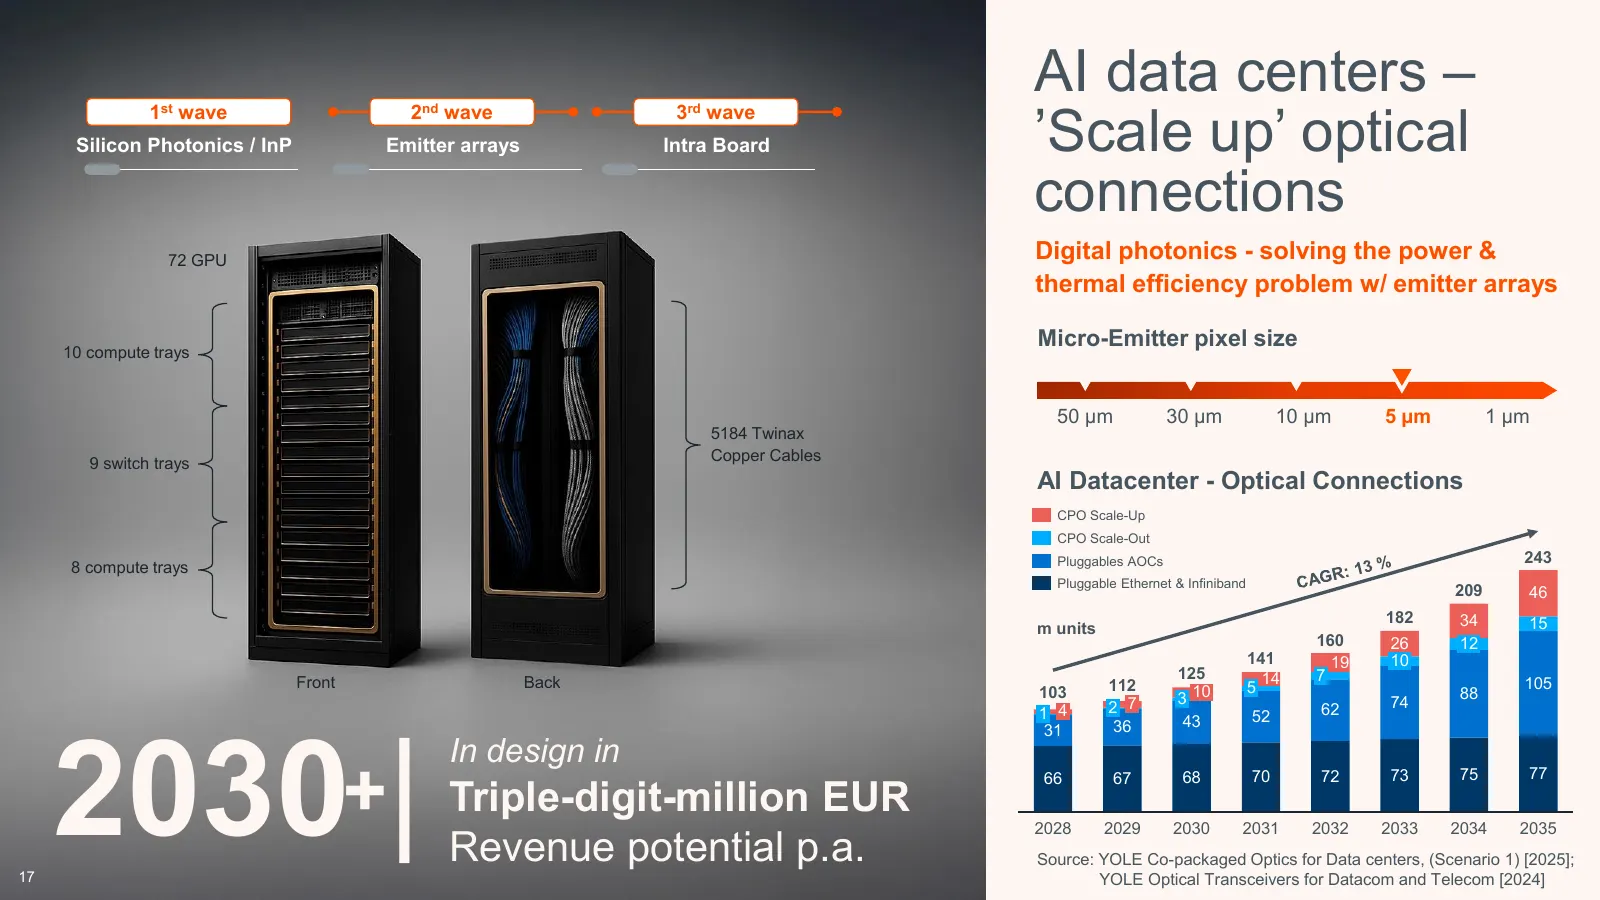
Slide 40: AI data centers – 'Scale up' optical connections
AI data centers – ’Scale up’ optical 1st wave 2nd wave 3rd wave Silicon Photonics / InP Emitter arrays Intra Board connections 72 GPU Digital photonics - solving the power & thermal efficiency problem w/ emitter arrays Micro-Emitter pixel size 10 compute trays 50 µm 30 µm 10 µm 5 µm 1 µm 5184 Twinax
Slide 41: Spectral Sensing
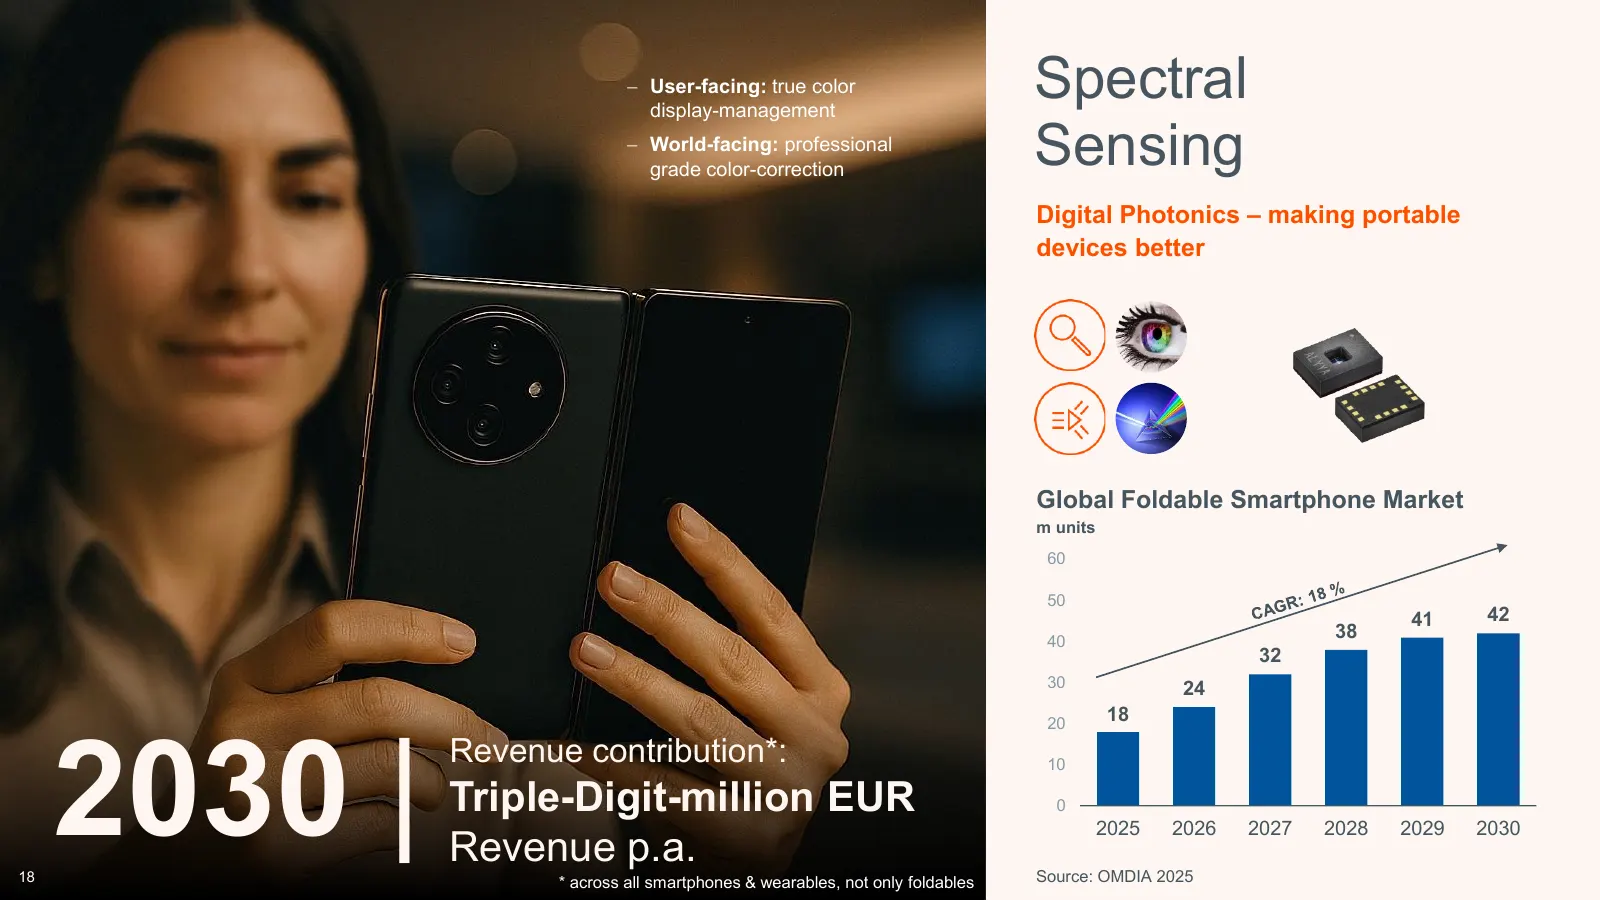
− User-facing: true color display-management Spectral − World-facing: professional grade color-correction Sensing Digital Photonics – making portable devices better Global Foldable Smartphone Market m units 60 50 41 42 40 38 32 30 24 20 18 2030 | Revenue contribution*: 10 Triple-Digit-million EUR 0
Slide 42: Personal Health & Fitness
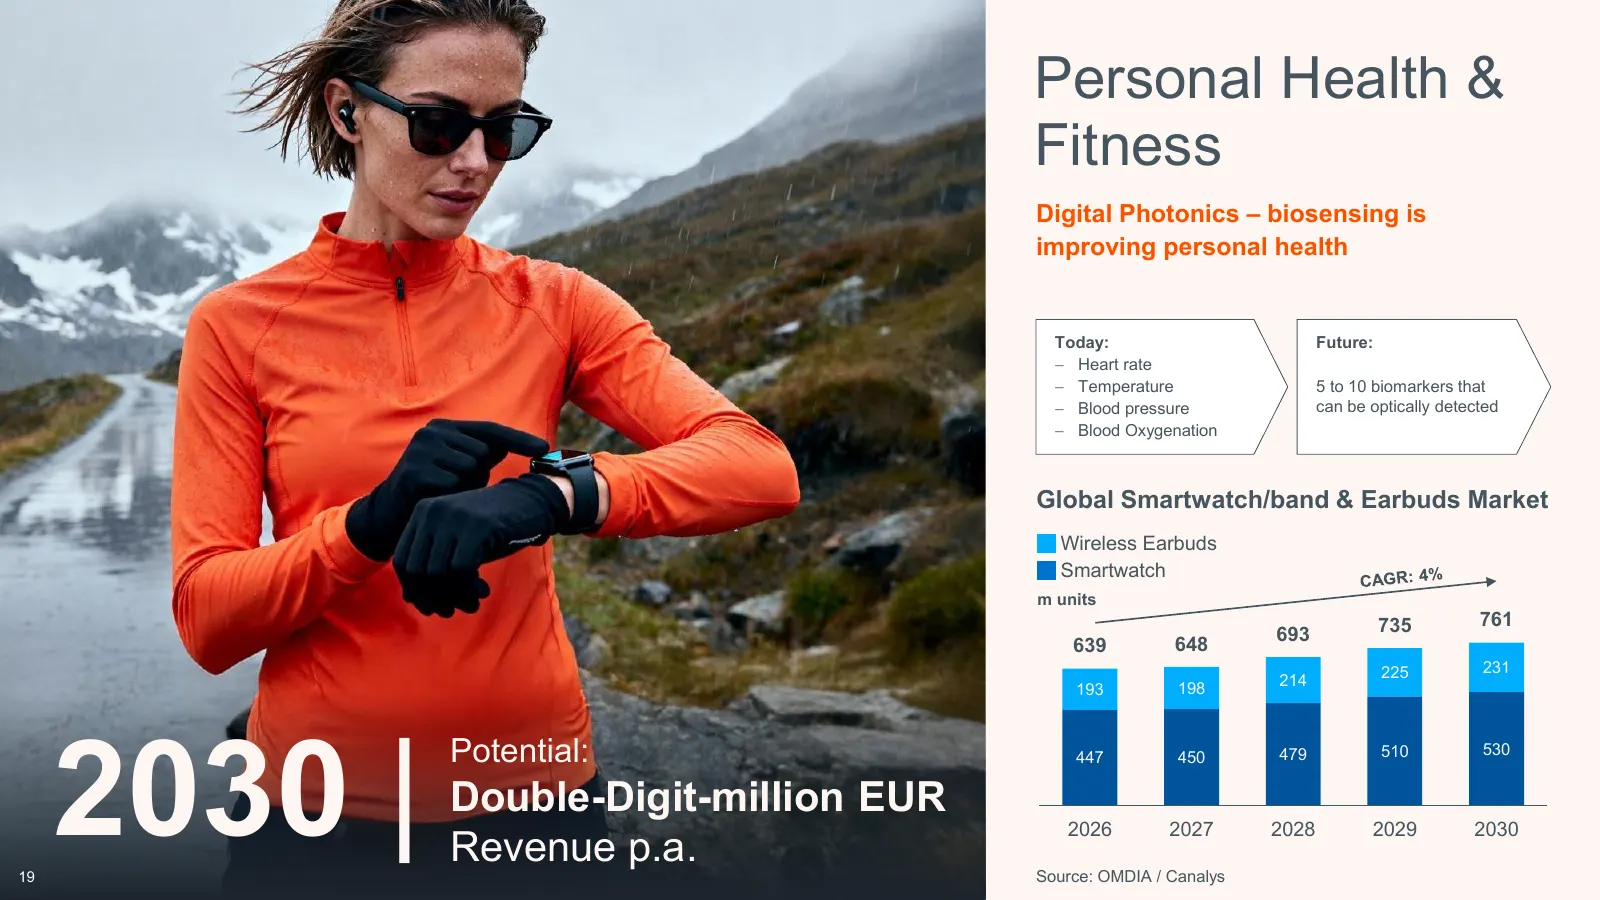
Personal Health & Fitness Digital Photonics – biosensing is improving personal health Today: Future: − Heart rate − Temperature 5 to 10 biomarkers that − Blood pressure can be optically detected − Blood Oxygenation Global Smartwatch/band & Earbuds Market Wireless Earbuds Smartwatch m units 735 761 6
Slide 43: Multizone dToF Sensing
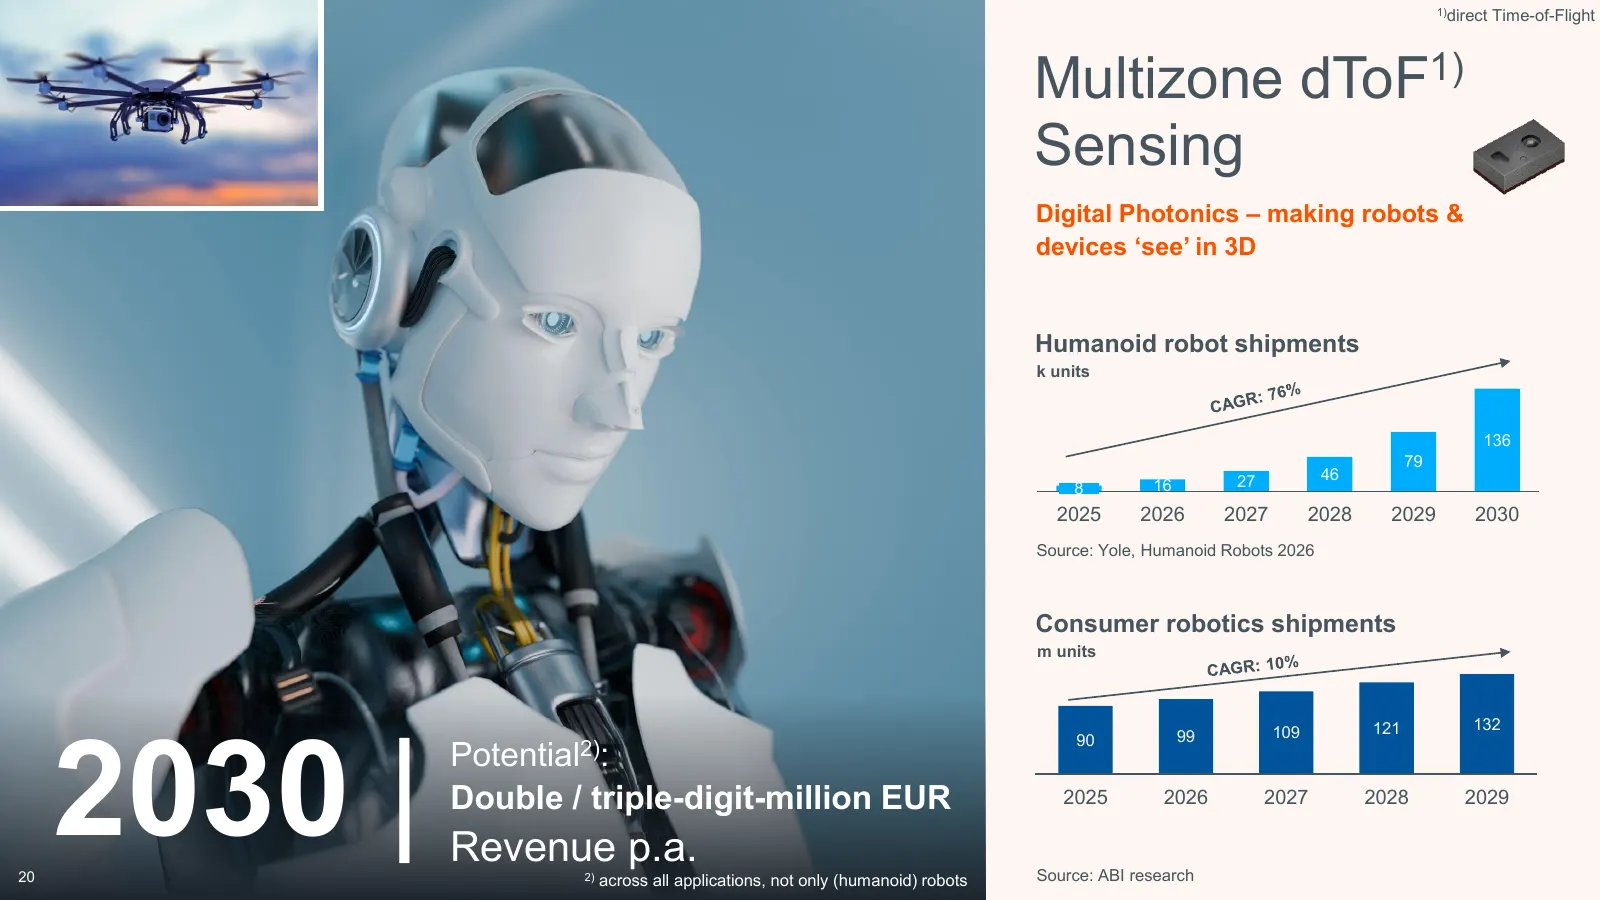
1)direct Time-of-Flight Multizone dToF1) Sensing Digital Photonics – making robots & devices ‘see’ in 3D Humanoid robot shipments k units 136 79 27 46 8 16 2025 2026 2027 2028 2029 2030 Source: Yole, Humanoid Robots 2026 Consumer robotics shipments m units 2030 | 121 132 90 99 109 Potential2): Doubl
Slide 44: Defendable Semiconductor Core Business Grows Profitably
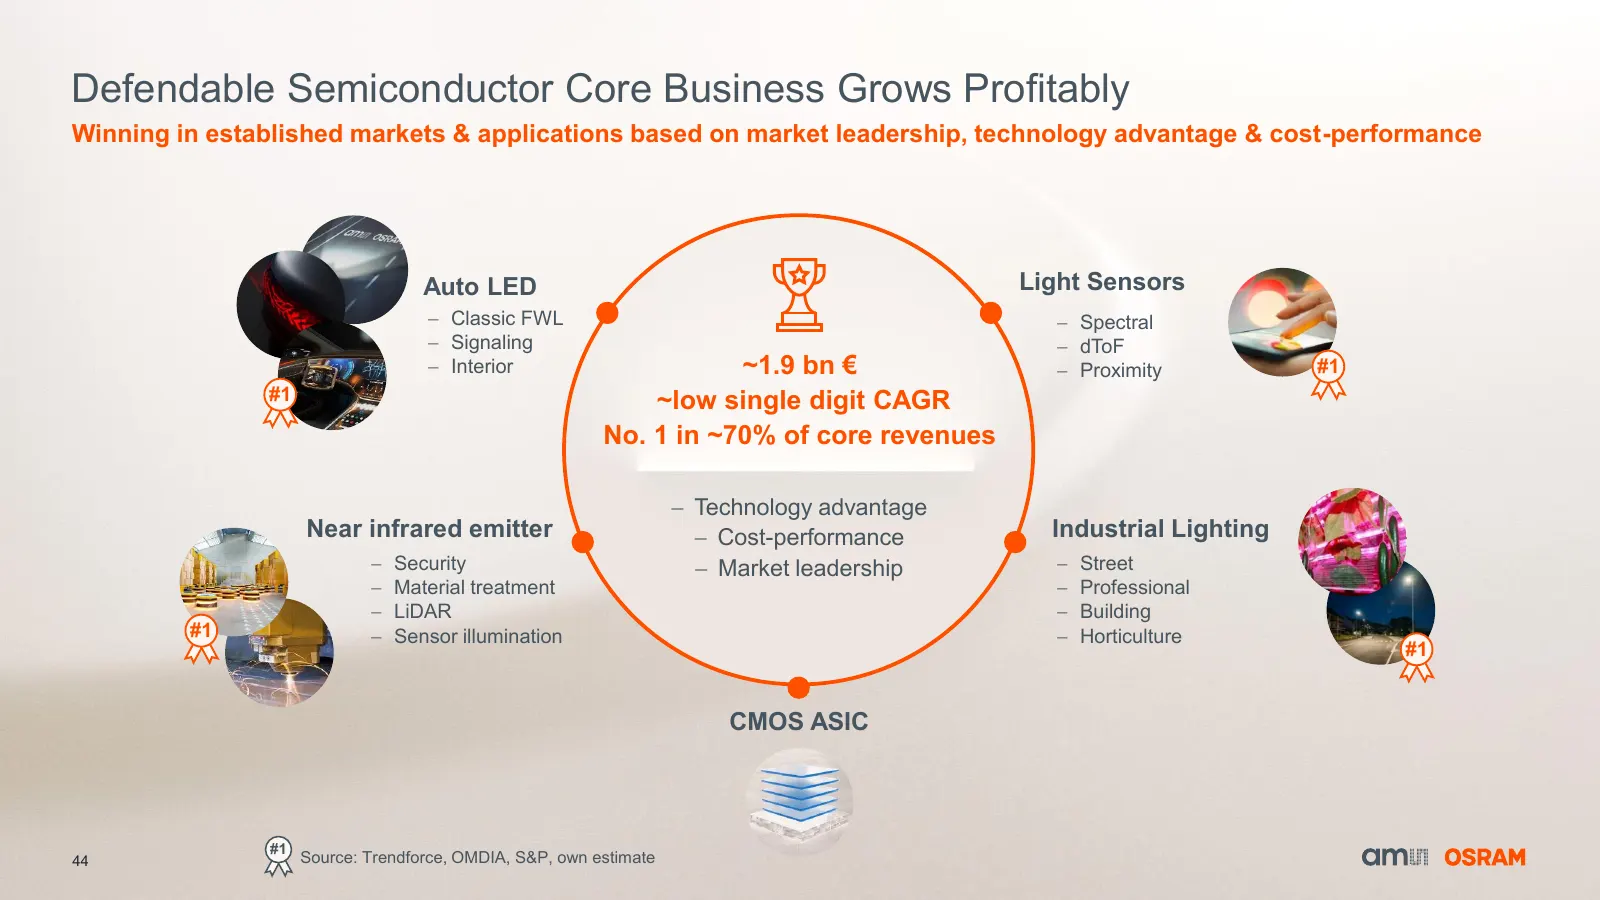
Defendable Semiconductor Core Business Grows Profitably Winning in established markets & applications based on market leadership, technology advantage & cost-performance Auto LED Light Sensors − Classic FWL − Spectral − Signaling − dToF − Interior ~1.9 bn € − Proximity #1 #1 ~low single digit CAGR N
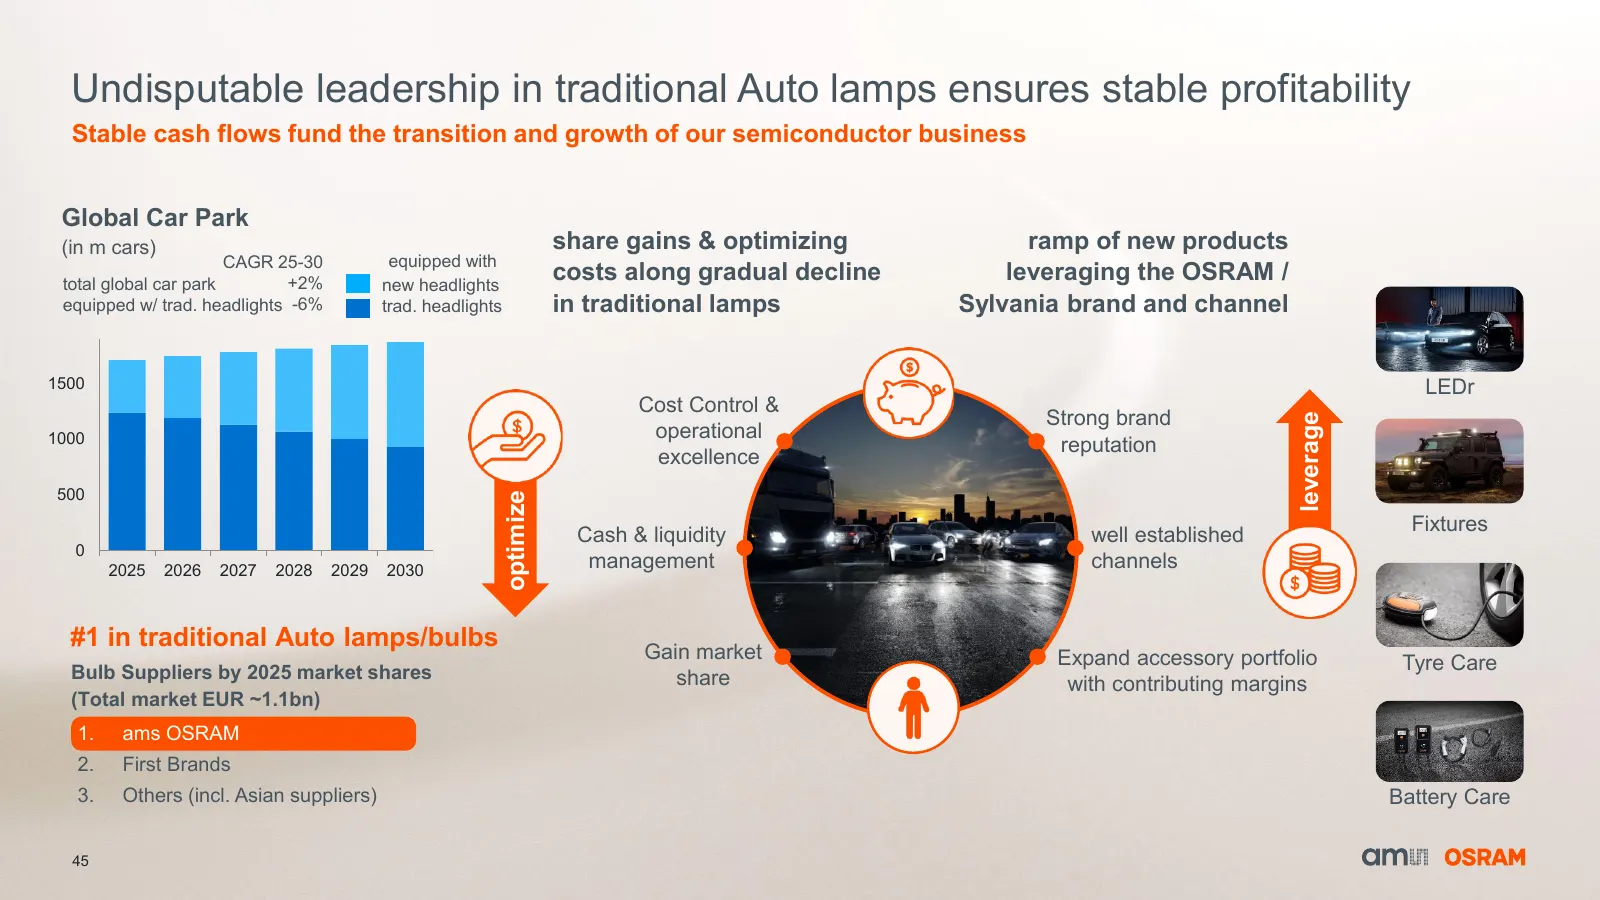
Slide 45: Undisputable leadership in traditional Auto lamps ensures stable profitability
Undisputable leadership in traditional Auto lamps ensures stable profitability Stable cash flows fund the transition and growth of our semiconductor business Global Car Park (in m cars) share gains & optimizing ramp of new products CAGR 25-30 equipped with total global car park +2% new headlights co
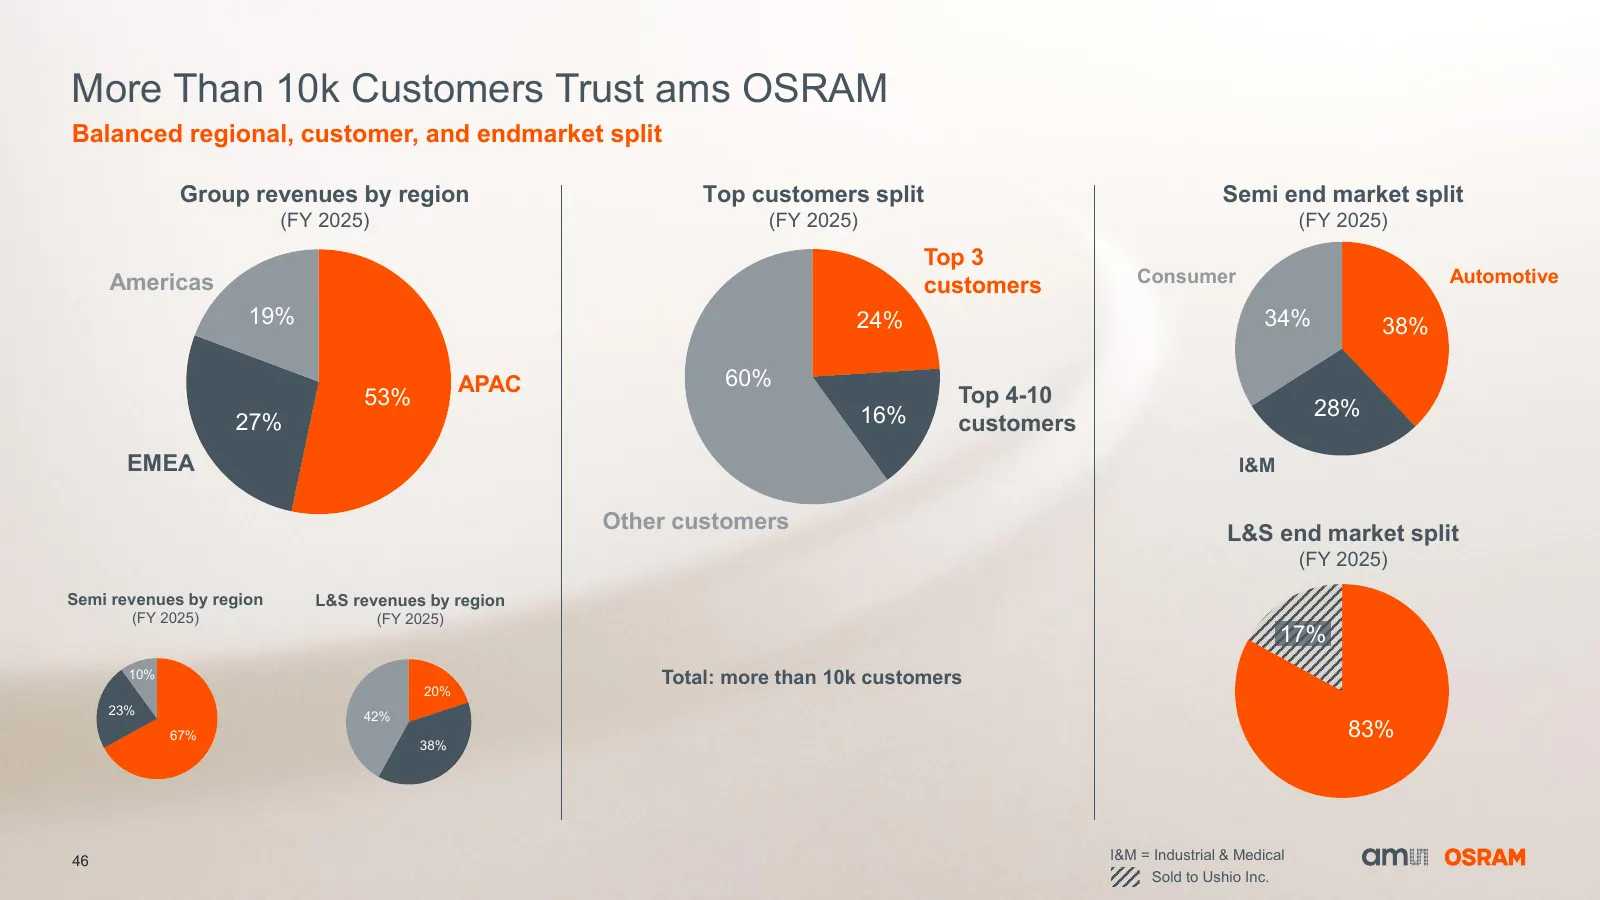
Slide 46: More Than 10k Customers Trust ams OSRAM
More Than 10k Customers Trust ams OSRAM Balanced regional, customer, and endmarket split Group revenues by region Top customers split Semi end market split (FY 2025) (FY 2025) (FY 2025) Top 3 Americas customers Consumer Automotive 19% 24% 34% 38% APAC 60% 53% Top 4-10 16% 28% 27% customers EMEA I&M
Slide 47: ESG commitments
Sense the power of light ESG commitments 47
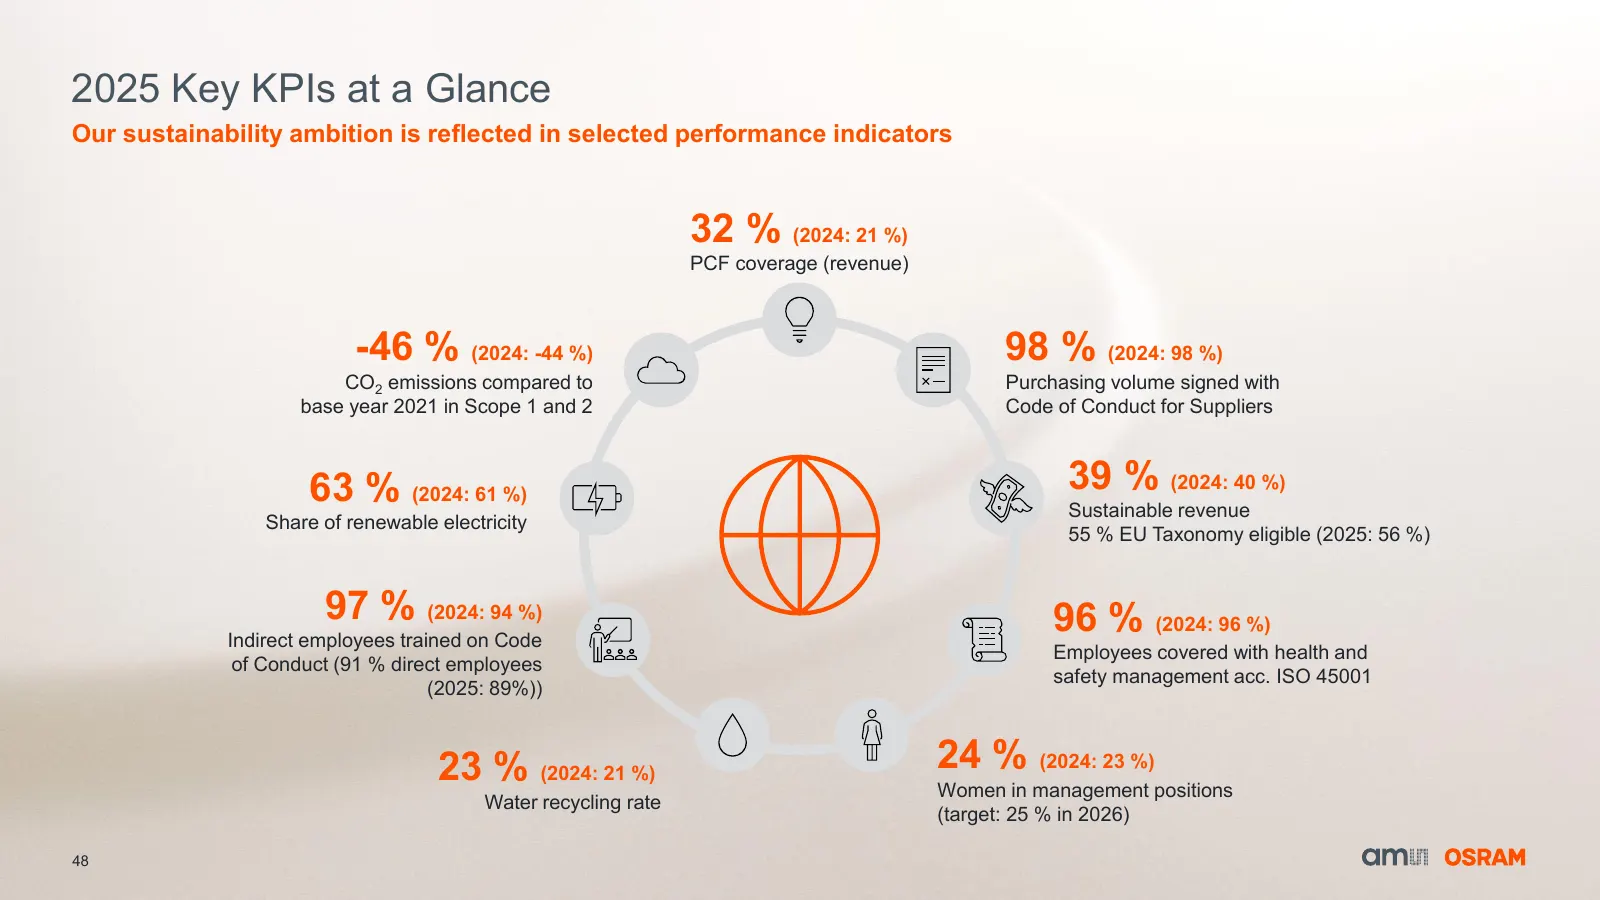
Slide 48: 2025 Key KPIs at a Glance
2025 Key KPIs at a Glance Our sustainability ambition is reflected in selected performance indicators 32 % (2024: 21 %) PCF coverage (revenue) -46 % (2024: -44 %) 98 % (2024: 98 %) CO2 emissions compared to Purchasing volume signed with base year 2021 in Scope 1 and 2 Code of Conduct for Suppliers 6
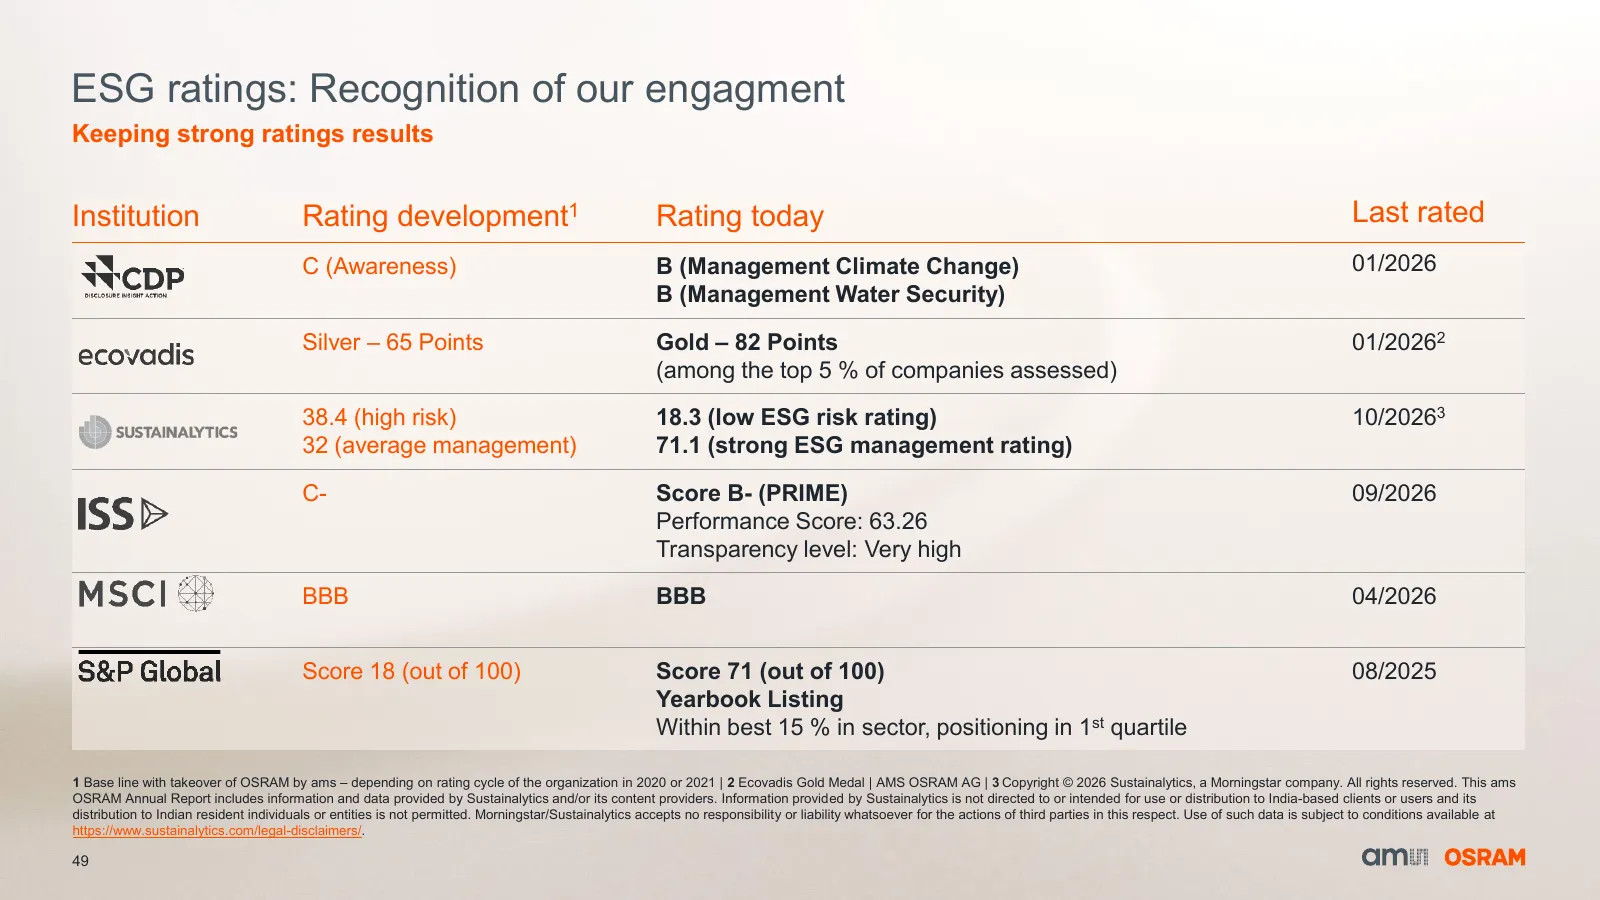
Slide 49: ESG ratings: Recognition of our engagement
ESG ratings: Recognition of our engagment Keeping strong ratings results Institution Rating development1 Rating today Last rated C (Awareness) B (Management Climate Change) 01/2026 B (Management Water Security) Silver – 65 Points Gold – 82 Points 01/20262 (among the top 5 % of companies assessed) 38
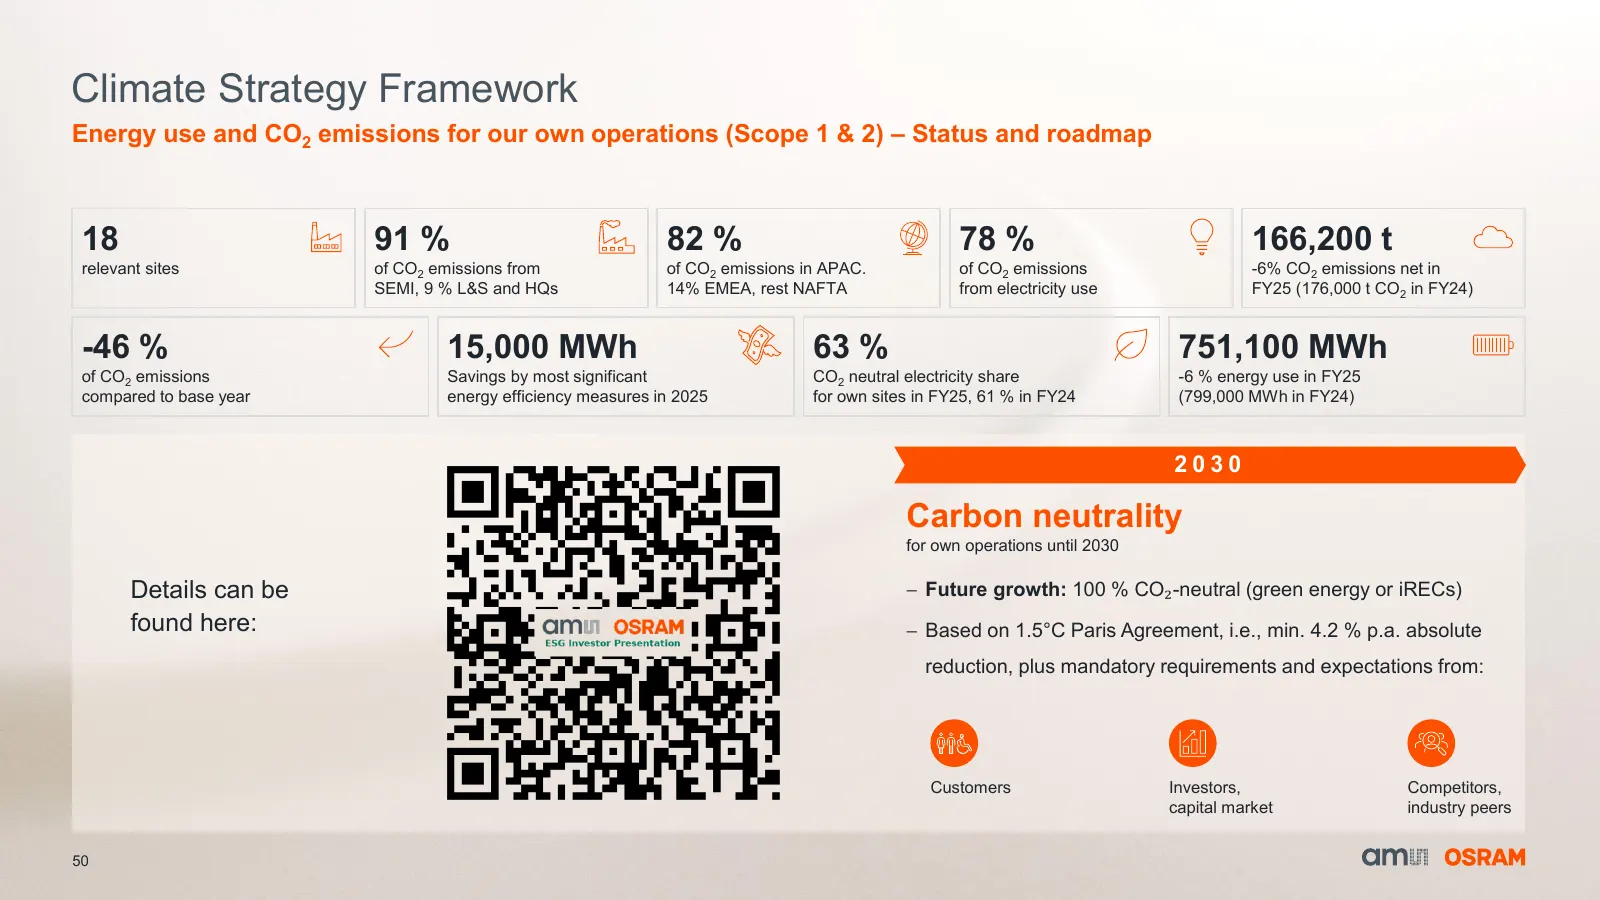
Slide 50: Climate Strategy Framework
Climate Strategy Framework Energy use and CO2 emissions for our own operations (Scope 1 & 2) – Status and roadmap 18 91 % 82 % 78 % 166,200 t relevant sites of CO2 emissions from of CO2 emissions in APAC. of CO2 emissions -6% CO2 emissions net in SEMI, 9 % L&S and HQs 14% EMEA, rest NAFTA from elect

Slide 51: Details on Financials
Sense the power of light Details on Financials 51
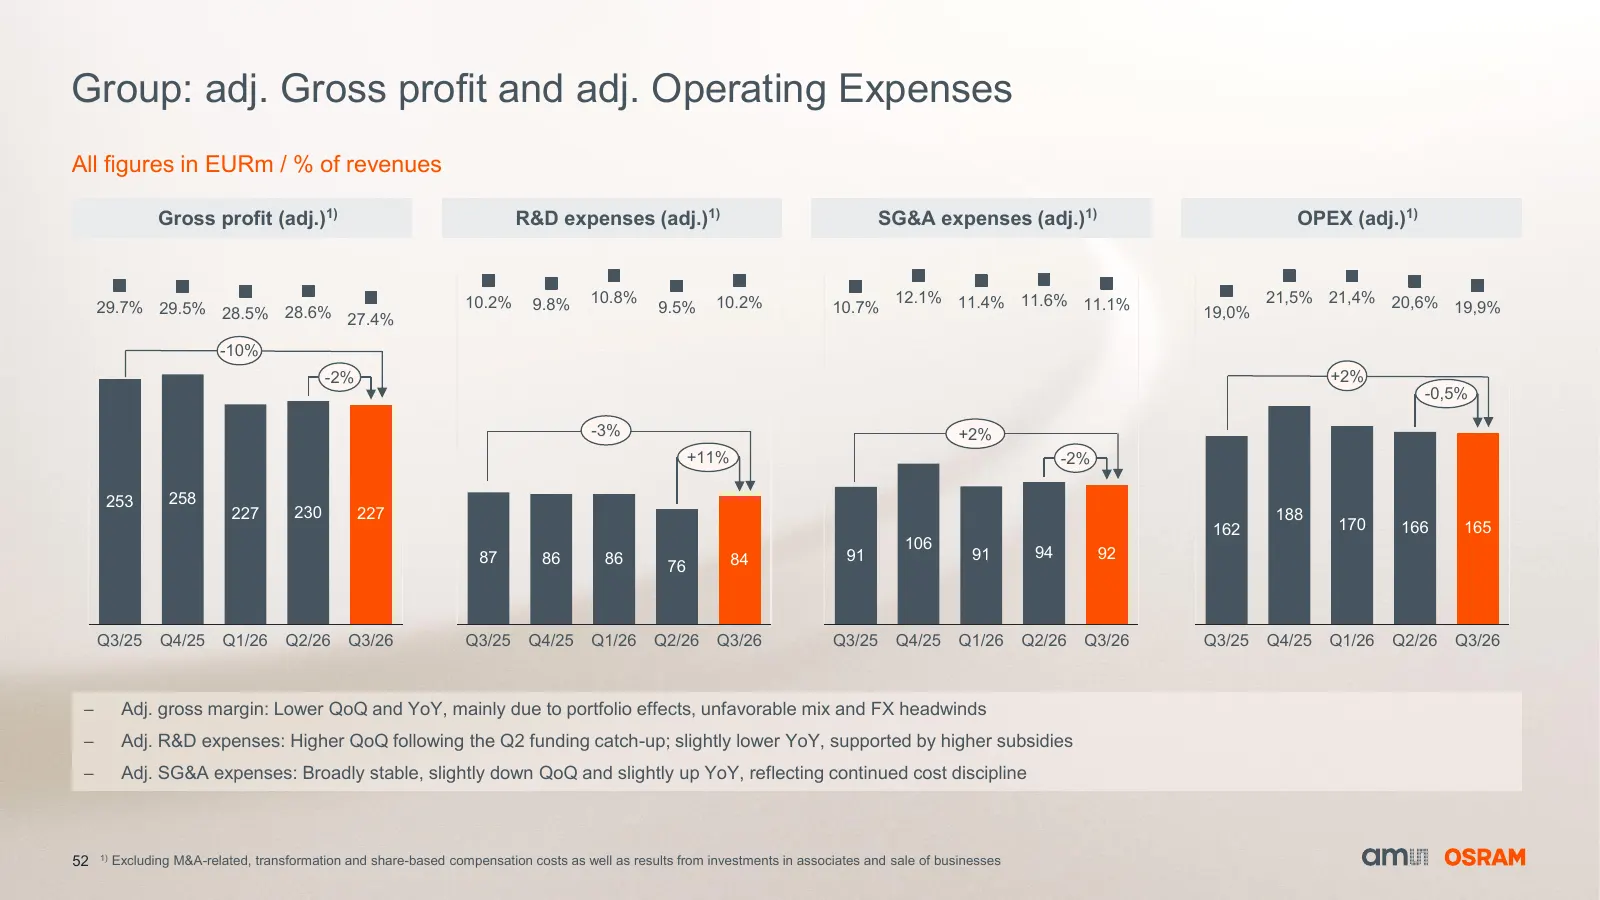
Slide 52: Group: adj. Gross profit and adj. Operating Expenses
Group: adj. Gross profit and adj. Operating Expenses All figures in EURm / % of revenues Gross profit (adj.)1) R&D expenses (adj.)1) SG&A expenses (adj.)1) OPEX (adj.)1) 10.2% 9.8% 10.8% 10.2% 12.1% 11.4% 11.6% 11.1% 21,5% 21,4% 20,6% 29.7% 29.5% 28.5% 28.6% 9.5% 10.7% 19,0% 19,9% 27.4% -10% -2% +2%
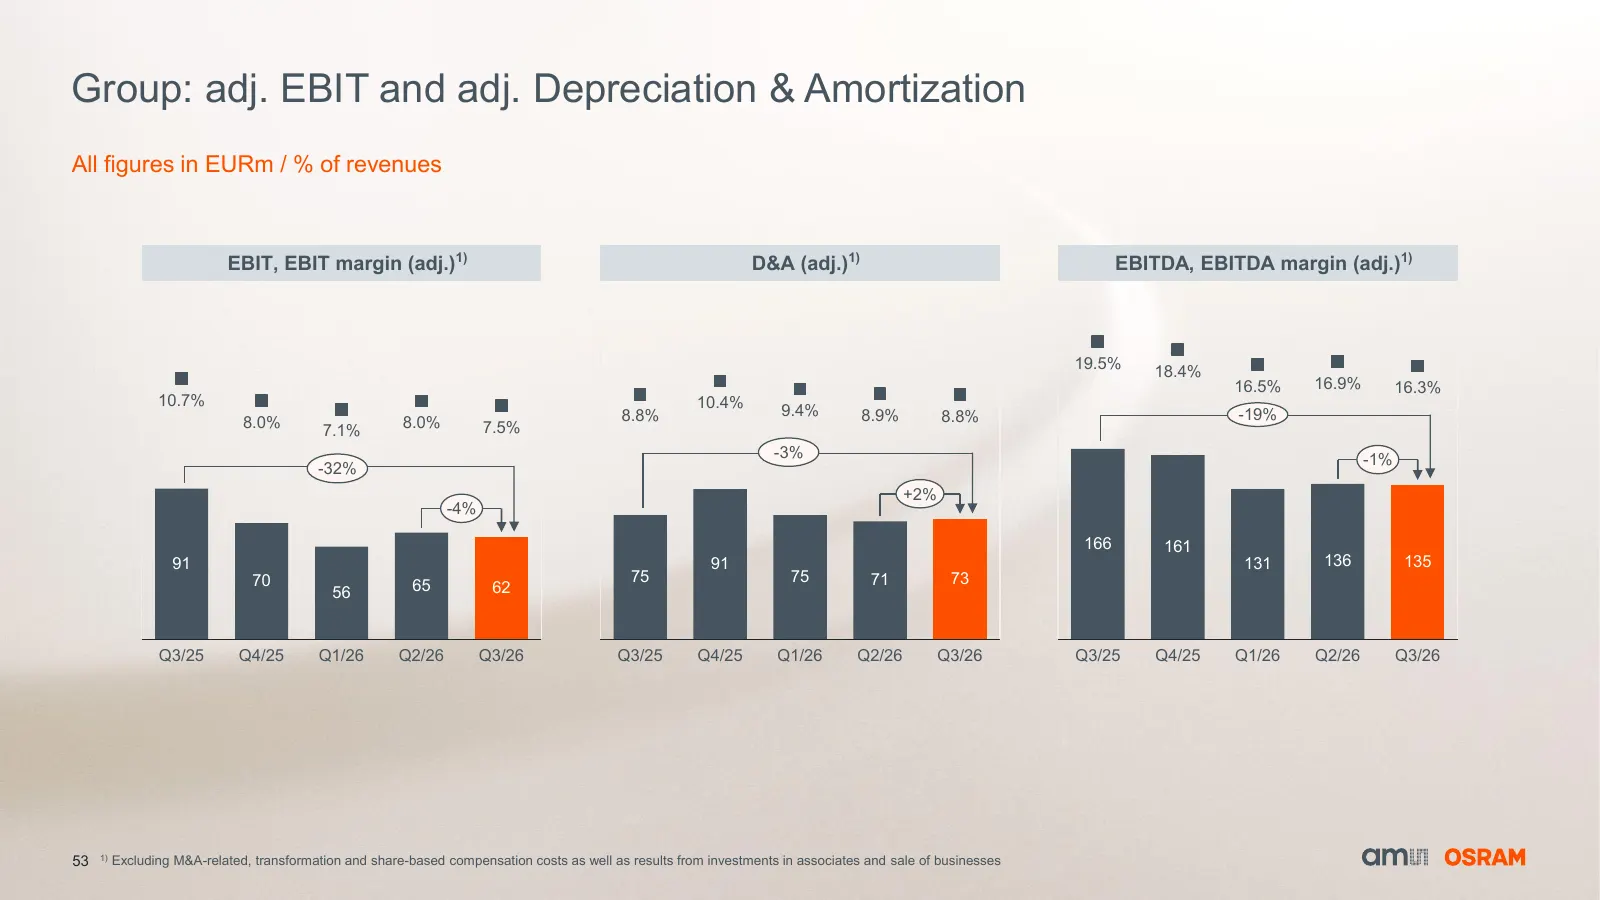
Slide 53: Group: adj. EBIT and adj. Depreciation & Amortization
Group: adj. EBIT and adj. Depreciation & Amortization All figures in EURm / % of revenues EBIT, EBIT margin (adj.)1) D&A (adj.)1) EBITDA, EBITDA margin (adj.)1) 19.5% 18.4% 16.5% 16.9% 16.3% 10.7% 10.4% 8.8% 9.4% 8.9% 8.8% -19% 8.0% 8.0% 7.5% 7.1% -3% -1% -32% +2% -4% 166 161 91 91 131 136 135 70 75
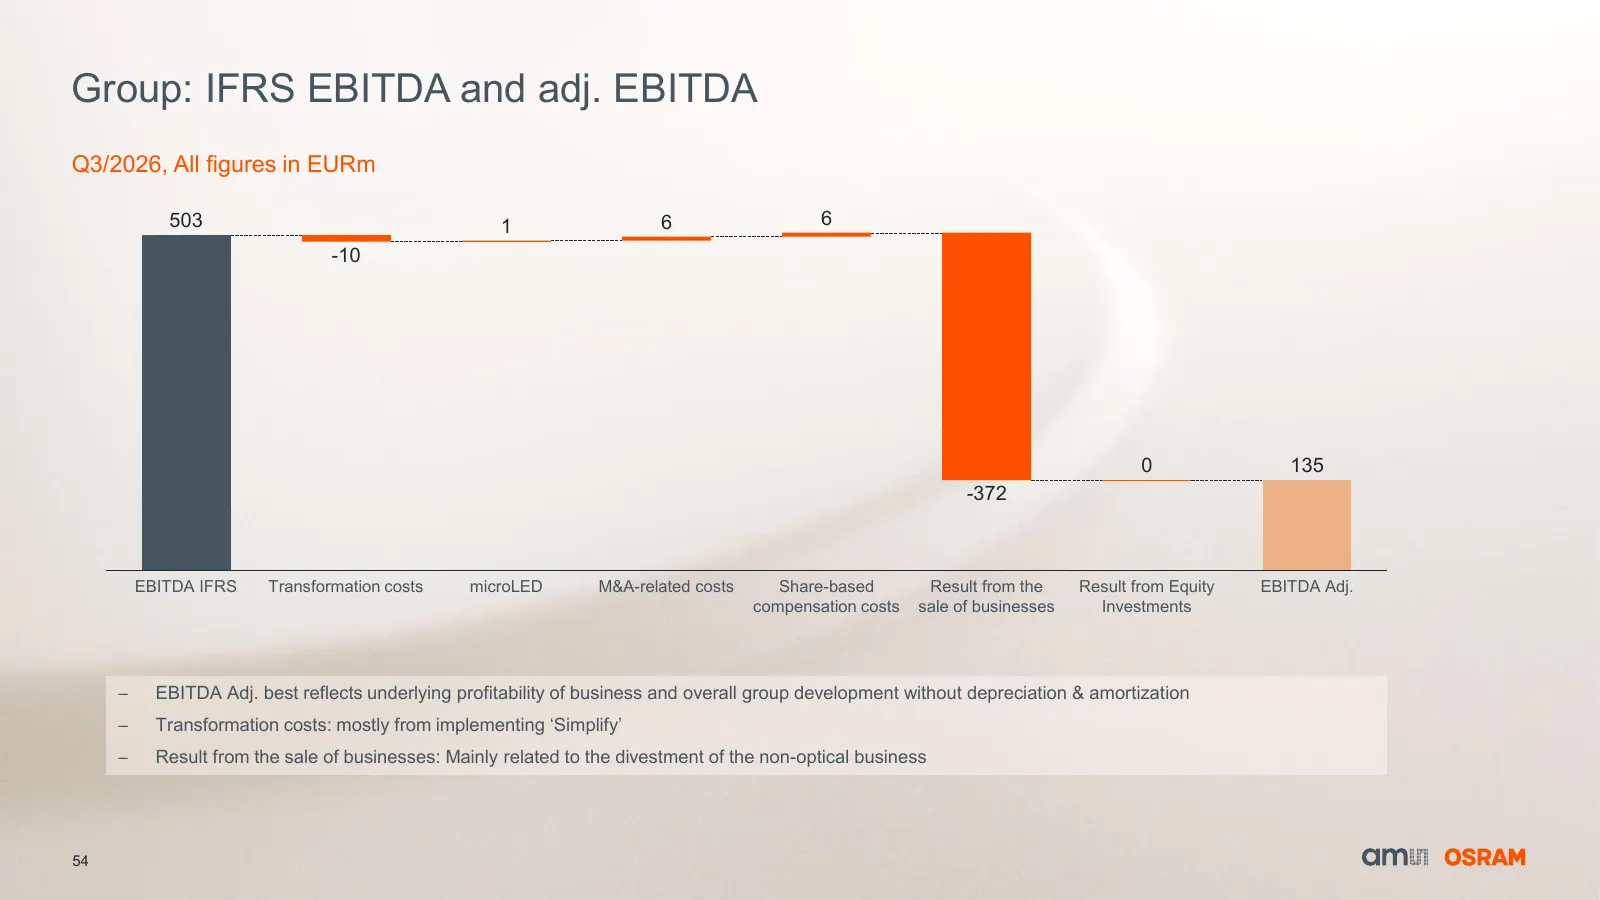
Slide 54: Group: IFRS EBITDA and adj. EBITDA
Group: IFRS EBITDA and adj. EBITDA Q3/2026, All figures in EURm 503 1 6 6 -10 0 135 -372 EBITDA IFRS Transformation costs microLED M&A-related costs Share-based Result from the Result from Equity EBITDA Adj. compensation costs sale of businesses Investments − EBITDA Adj. best reflects underlying pro
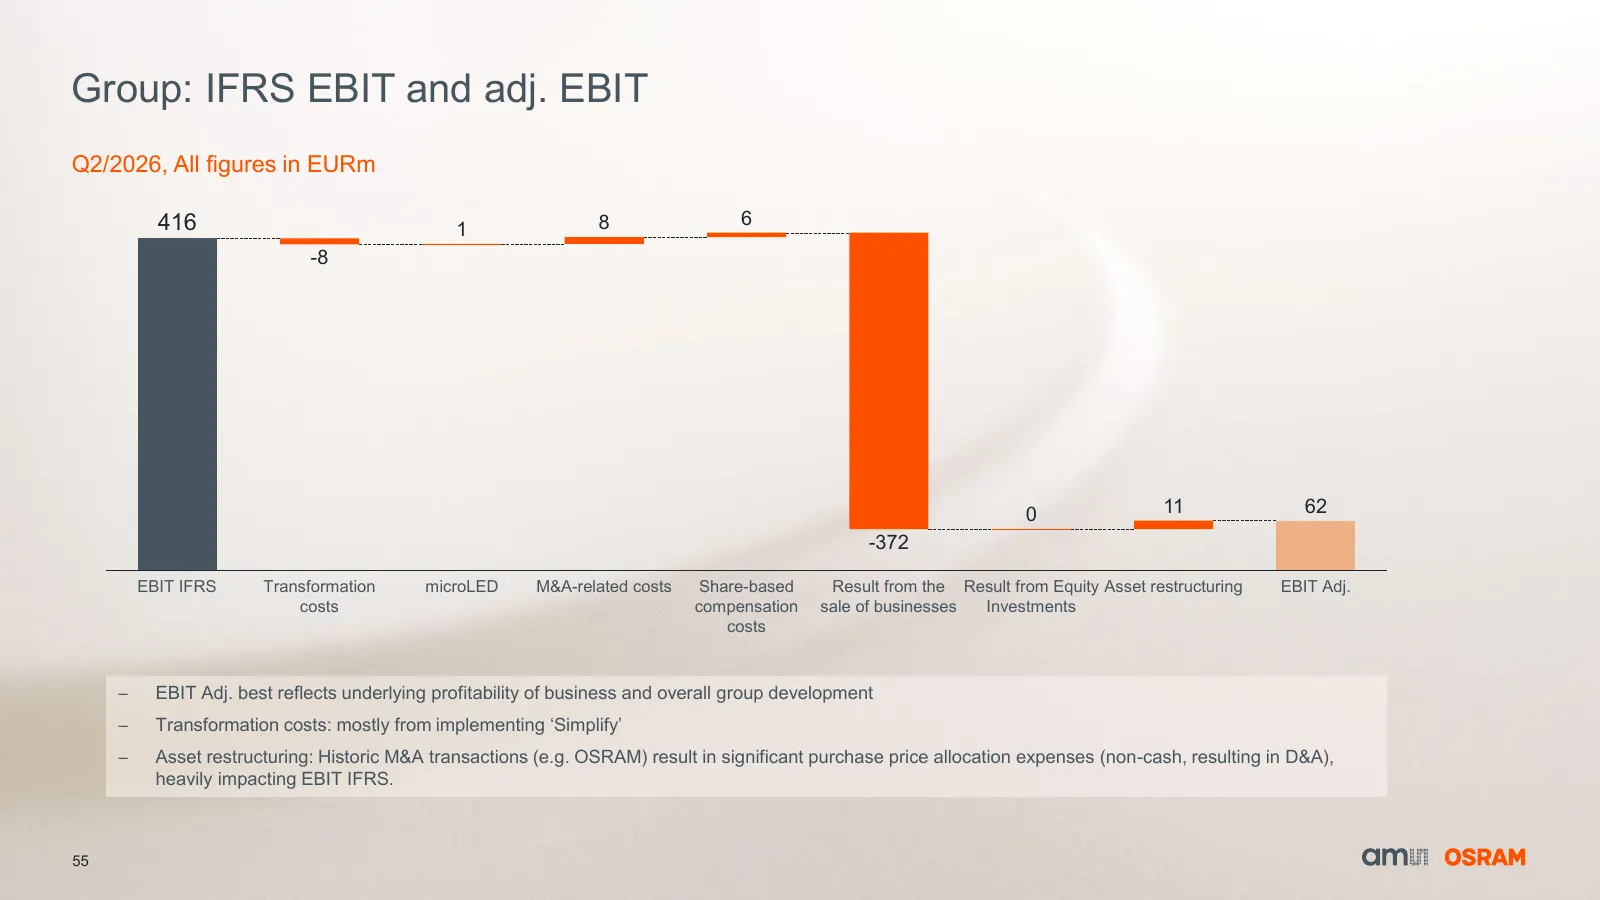
Slide 55: Group: IFRS EBIT and adj. EBIT
Group: IFRS EBIT and adj. EBIT Q2/2026, All figures in EURm 416 8 6 1 -8 0 11 62 -372 EBIT IFRS Transformation microLED M&A-related costs Share-based Result from the Result from Equity Asset restructuring EBIT Adj. costs compensation sale of businesses Investments costs − EBIT Adj. best reflects und
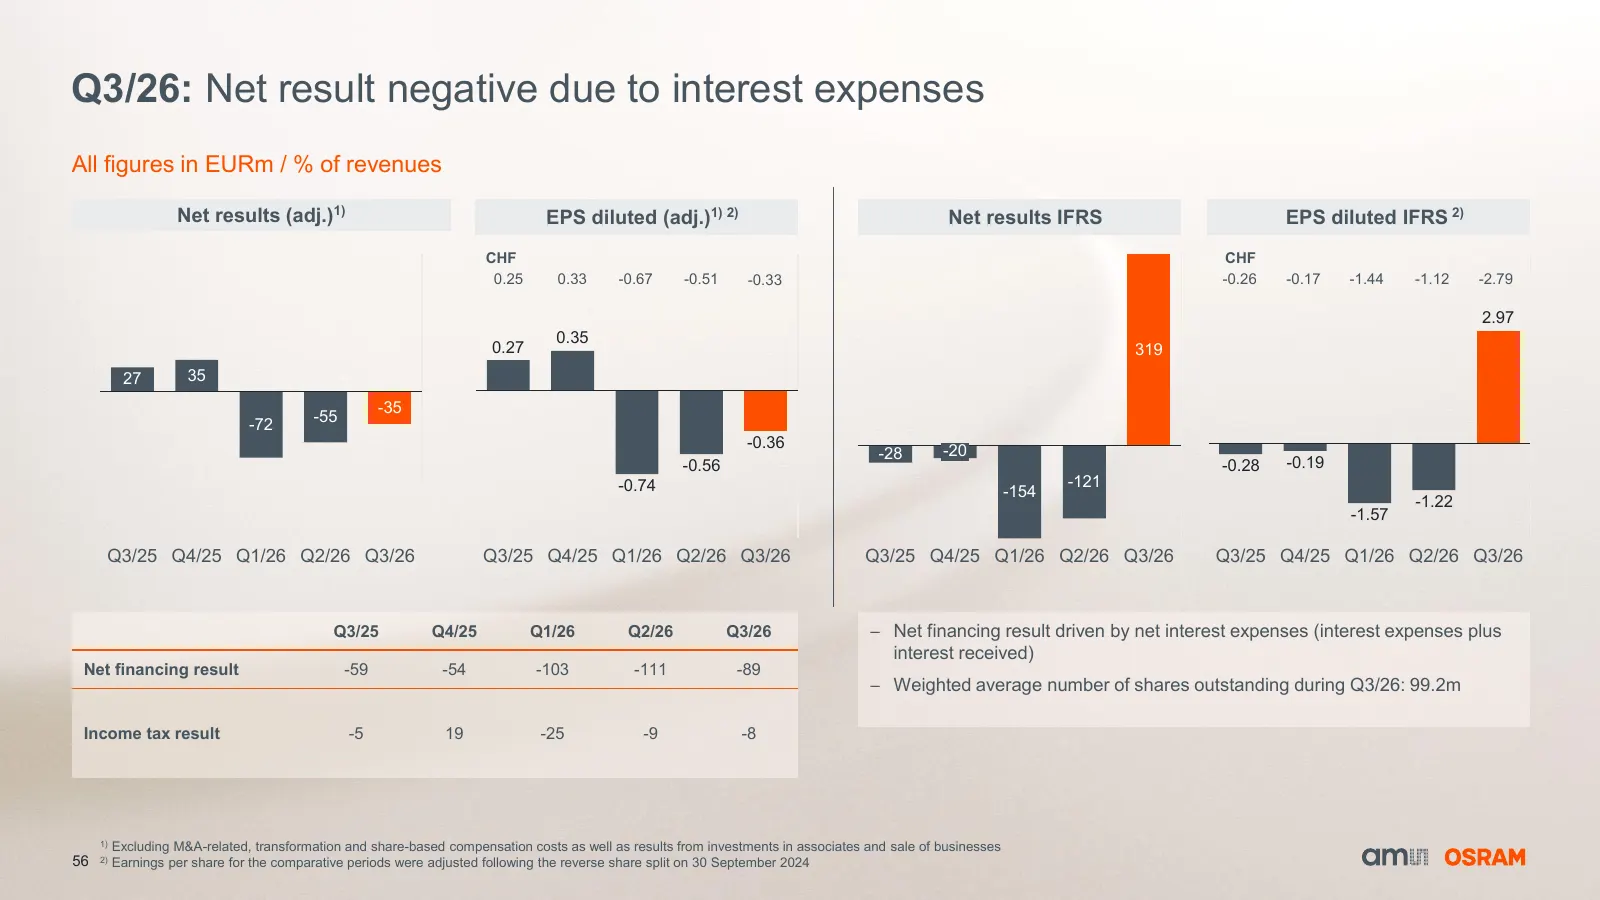
Slide 56: Q3/26: Net result negative due to interest expenses
Q3/26: Net result negative due to interest expenses All figures in EURm / % of revenues Net results (adj.)1) EPS diluted (adj.)1) 2) Net results IFRS EPS diluted IFRS 2) CHF CHF 0.25 0.33 -0.67 -0.51 -0.33 -0.26 -0.17 -1.44 -1.12 -2.79 2.97 0.35 0.27 319 27 35 -35 -72 -55 -0.36 -20 -28 -0.56 -0.28 -
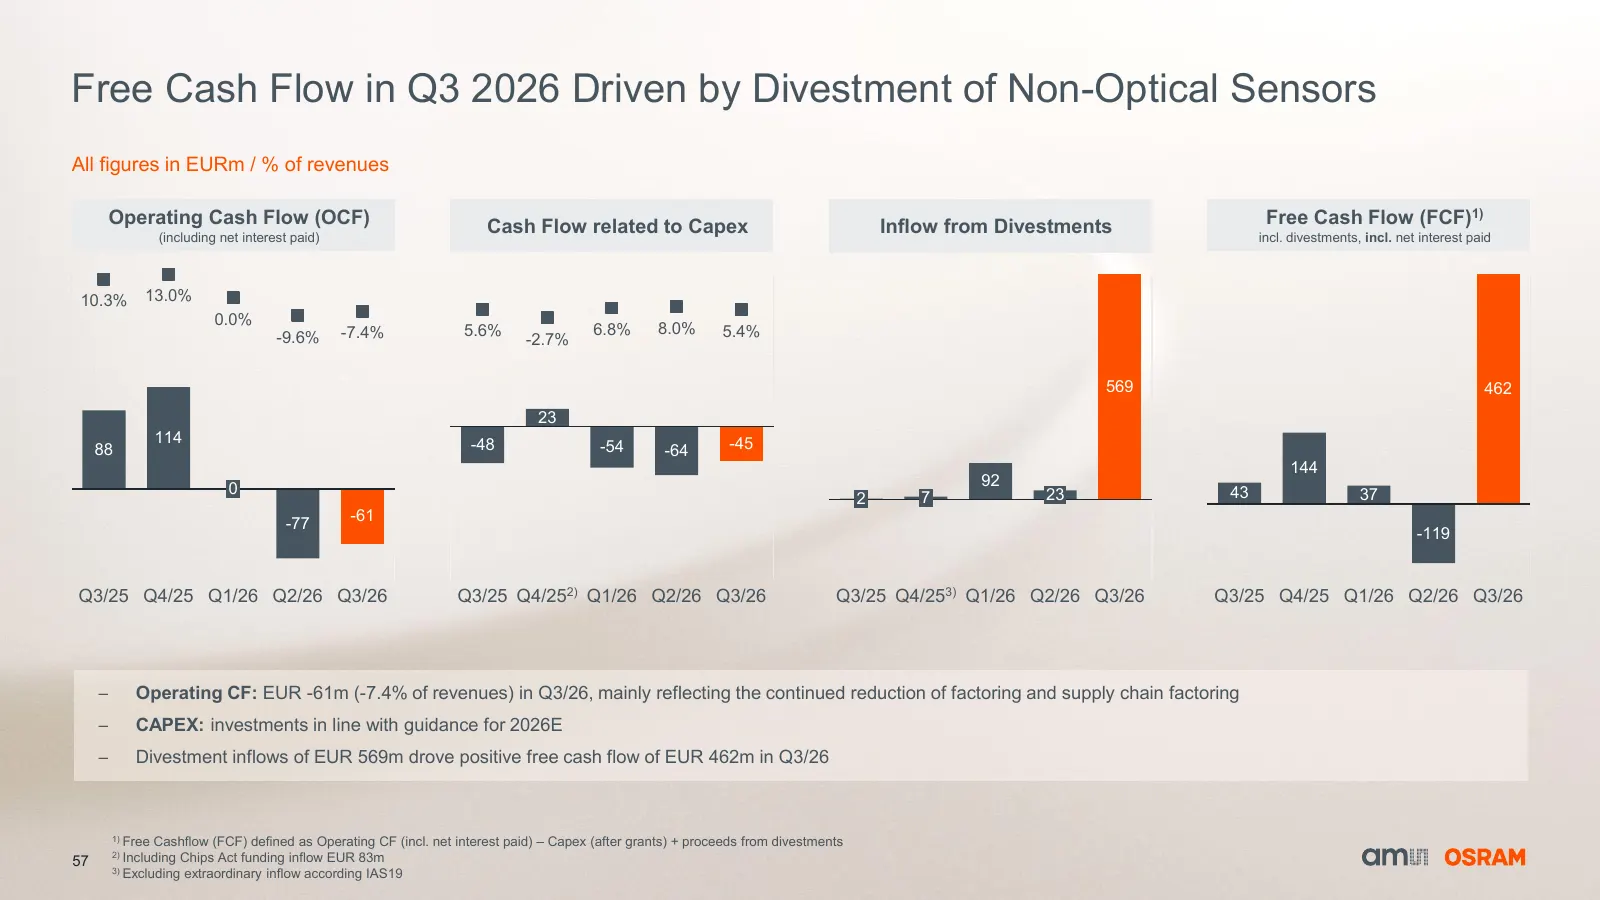
Slide 57: Free Cash Flow in Q3 2026 Driven by Divestment of Non-Optical Sensors
Free Cash Flow in Q3 2026 Driven by Divestment of Non-Optical Sensors All figures in EURm / % of revenues Operating Cash Flow (OCF) Cash Flow related to Capex Inflow from Divestments Free Cash Flow (FCF)1) (including net interest paid) incl. divestments, incl. net interest paid 10.3% 13.0% 0.0% -7.4
Slide 58: Working Capital
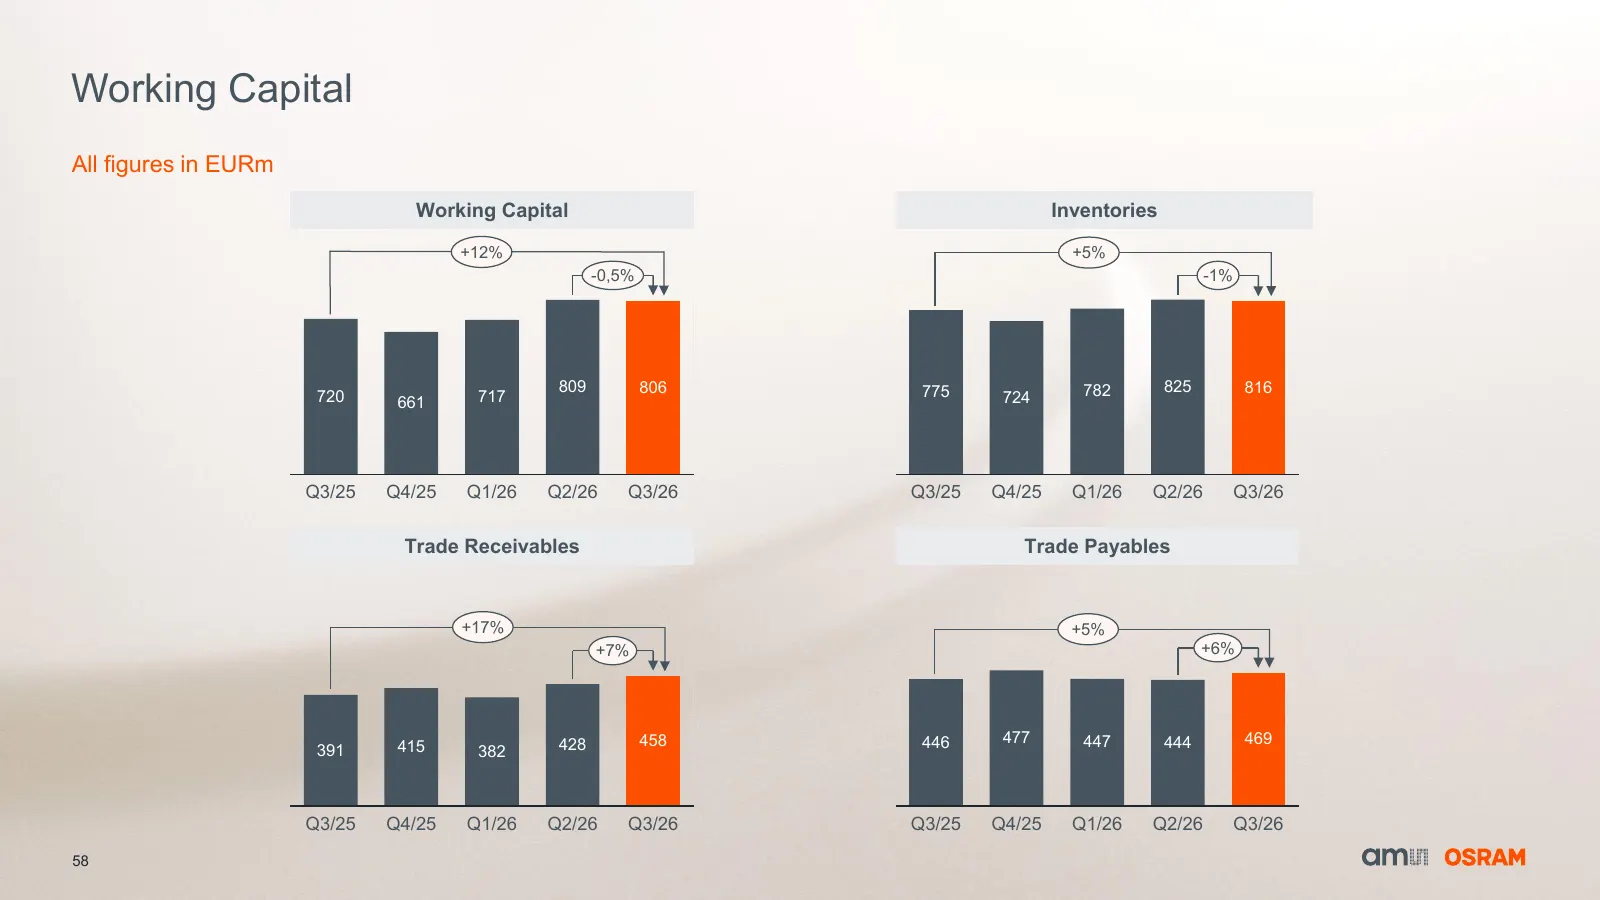
Working Capital All figures in EURm Working Capital Inventories +12% +5% -0,5% -1% 809 806 775 782 825 816 720 661 717 724 Q3/25 Q4/25 Q1/26 Q2/26 Q3/26 Q3/25 Q4/25 Q1/26 Q2/26 Q3/26 Trade Receivables Trade Payables +17% +5% +7% +6% 428 458 446 477 447 444 469 391 415 382 Q3/25 Q4/25 Q1/26 Q2/26 Q3/
Slide 59: ams OSRAM Investor Relations
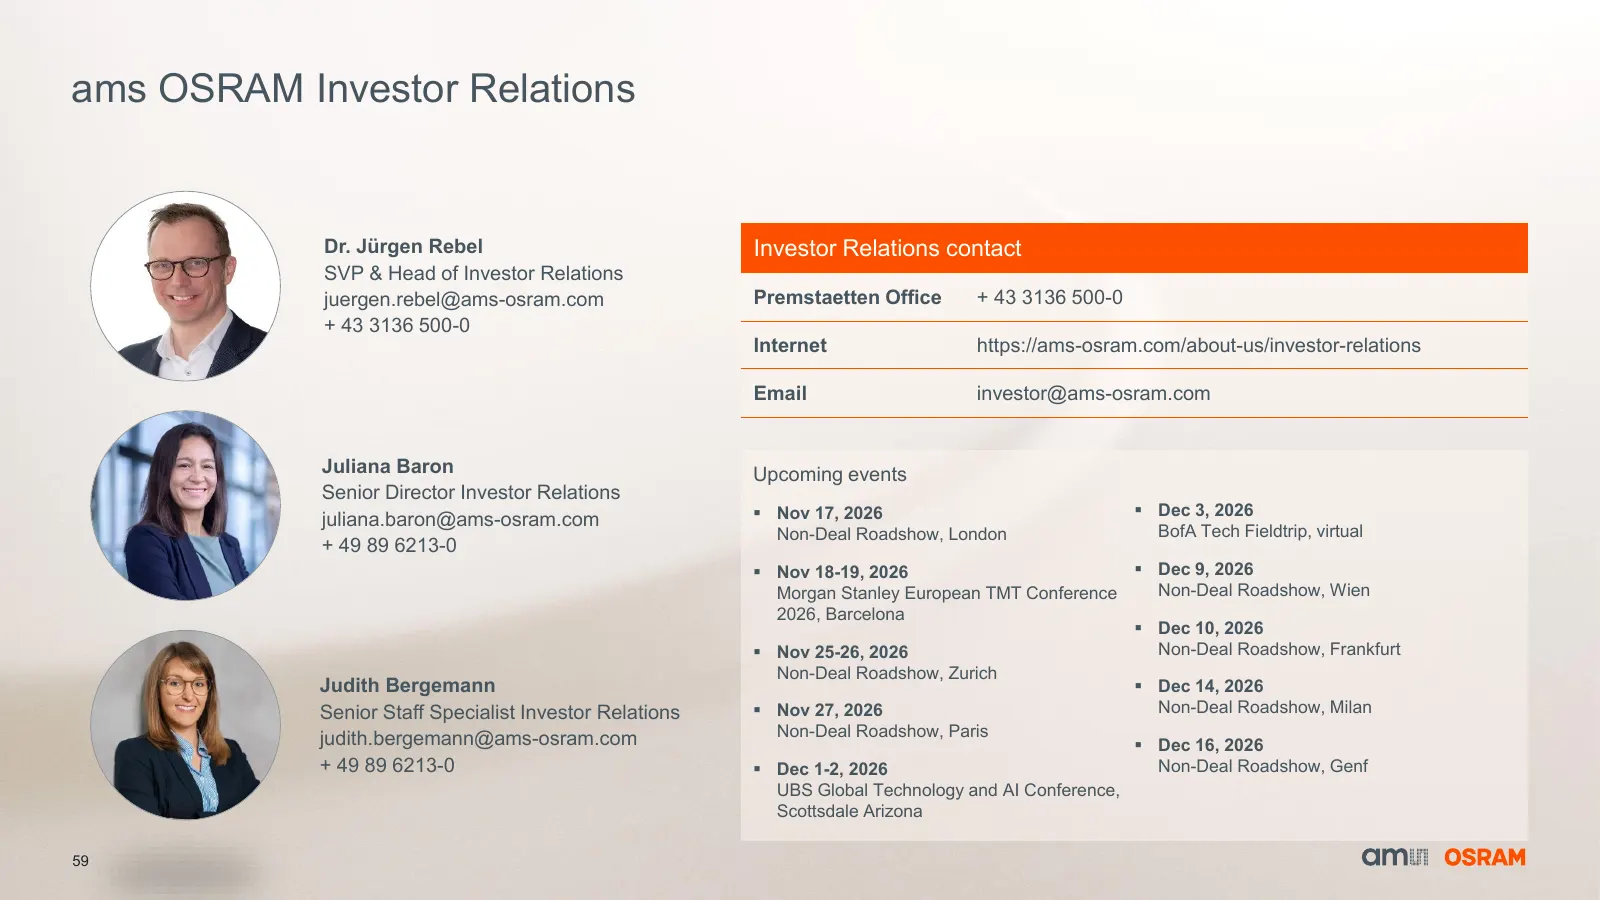
ams OSRAM Investor Relations Dr. Jürgen Rebel Investor Relations contact SVP & Head of Investor Relations juergen.rebel@ams-osram.com Premstaetten Office + 43 3136 500-0 + 43 3136 500-0 Internet https://ams-osram.com/about-us/investor-relations Email investor@ams-osram.com Juliana Baron Upcoming eve

Slide 60: QR code: to find out this presentation online
QR code: to find out this presentation online 60
Source: company website
More decks from ams-OSRAM AG
 Q3 2026 Earnings Presentation16 slides · Nov 13, 2026
 Q2 2026 Earnings Presentation59 slides · Aug 4, 2026
 Q2 2026 Earnings Presentation19 slides · Aug 4, 2026
 Q1 2026 Earnings Presentation54 slides · May 7, 2026
 Q1 2026 Earnings Presentation17 slides · May 7, 2026
 FY2025 Earnings Presentation54 slides · Feb 10, 2026