ams-OSRAM AG · SIX:AMS
ams-OSRAM — Q3 2026 Earnings Presentation
16 slides from ams-OSRAM's earnings presentation, Nov 13, 2026
Slide 1: Third Quarter 2026 Earnings Call
Sense the power of light Third Quarter 2026 Earnings Call – 9:45 a.m. CET Aldo Kamper, CEO Rainer Irle, CFO Dr Juergen Rebel, SVP Investor Relations 13 November 2026
Slide 2: Disclaimer
Disclaimer This presentation contains statements related to our future business and financial performance and future events or developments involving ams OSRAM which include management’s expectations, beliefs, intentions, and strategies concerning future events, such as revenue projections, market d
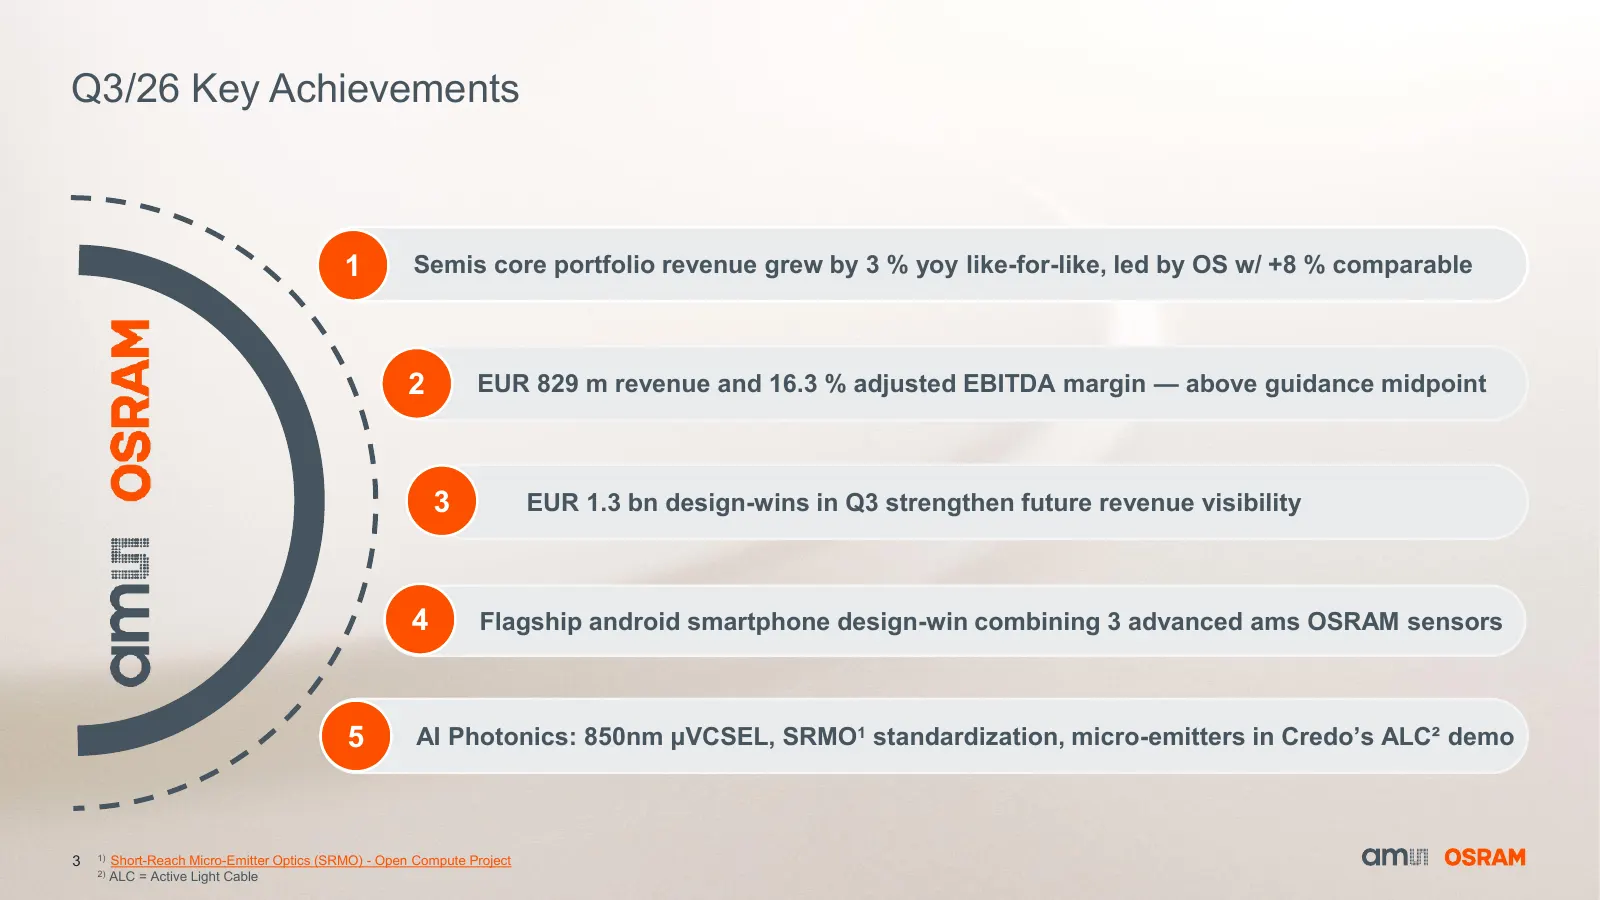
Slide 3: Q3/26 Key Achievements
Q3/26 Key Achievements 1 Semis core portfolio revenue grew by 3 % yoy like-for-like, led by OS w/ +8 % comparable 2 EUR 829 m revenue and 16.3 % adjusted EBITDA margin — above guidance midpoint 3 EUR 1.3 bn design-wins in Q3 strengthen future revenue visibility 4 Flagship android smartphone design-w
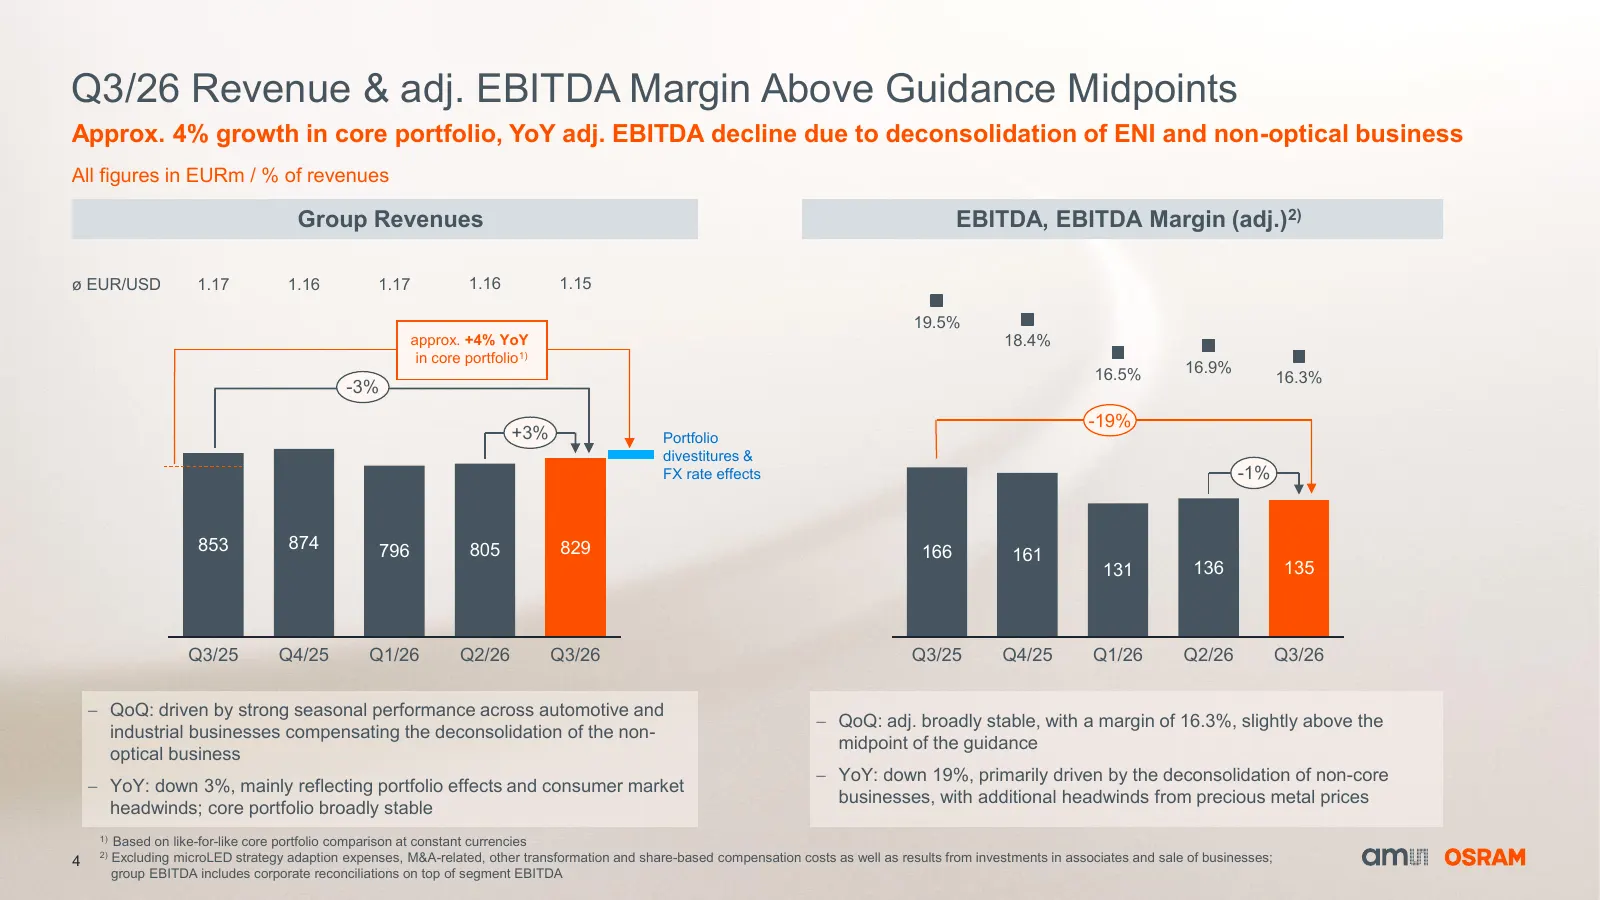
Slide 4: Q3/26 Revenue & adj. EBITDA Margin Above Guidance Midpoints
Q3/26 Revenue & adj. EBITDA Margin Above Guidance Midpoints Approx. 4% growth in core portfolio, YoY adj. EBITDA decline due to deconsolidation of ENI and non-optical business All figures in EURm / % of revenues Group Revenues EBITDA, EBITDA Margin (adj.)2) ø EUR/USD 1.17 1.16 1.17 1.16 1.15 19.5% a
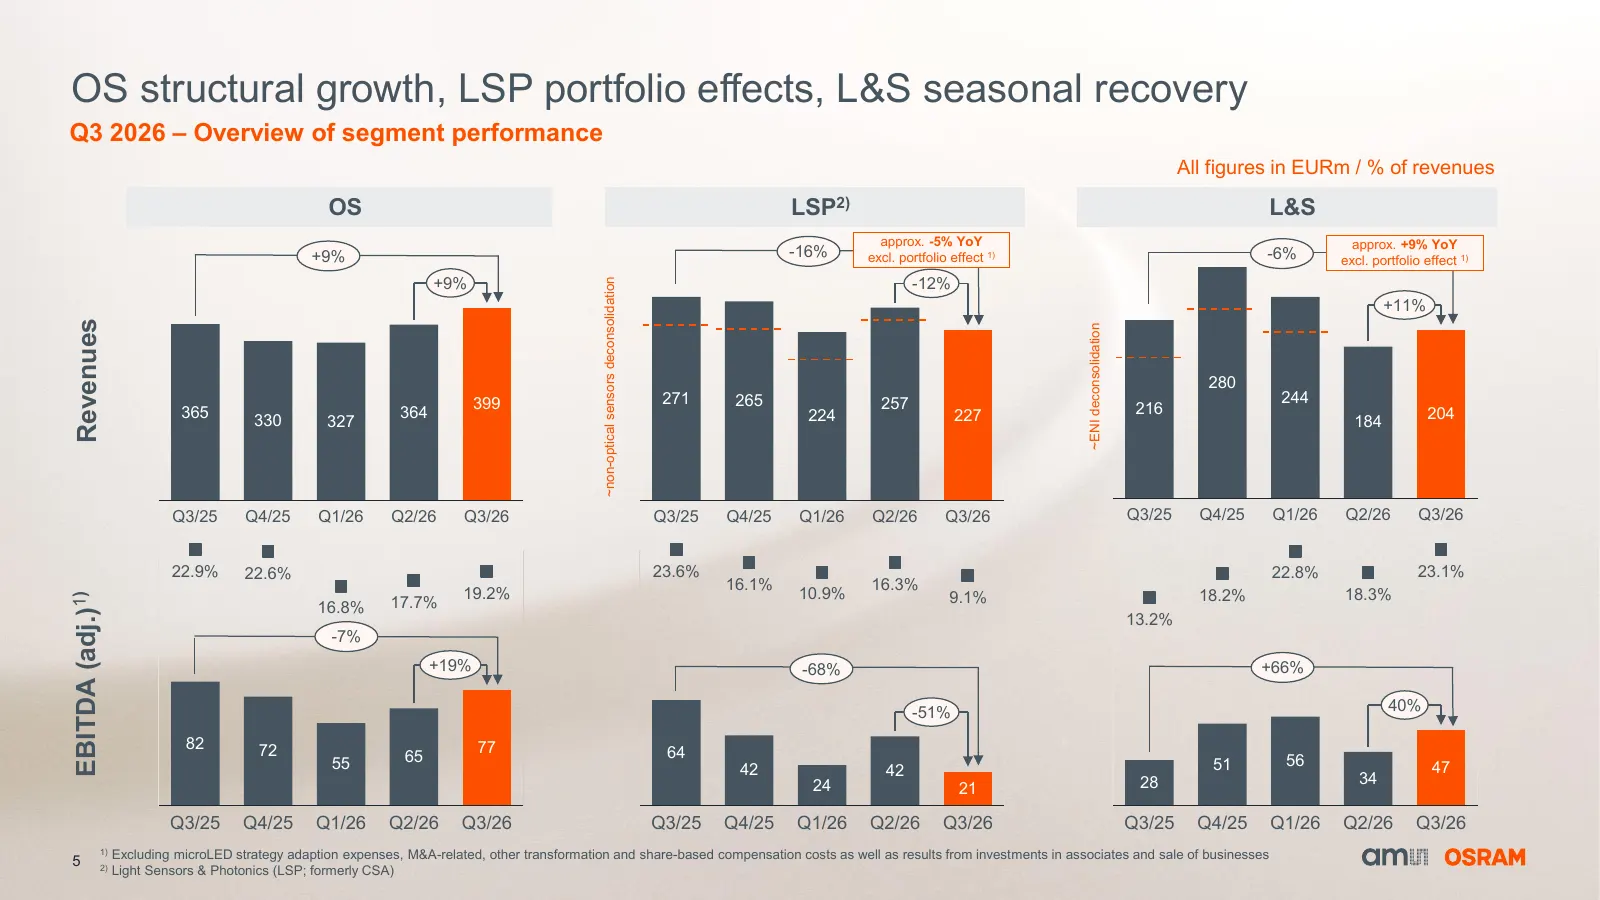
Slide 5: OS structural growth, LSP portfolio effects, L&S seasonal recovery
OS structural growth, LSP portfolio effects, L&S seasonal recovery Q3 2026 – Overview of segment performance All figures in EURm / % of revenues OS LSP2) L&S approx. -5% YoY approx. +9% YoY +9% -16% excl. portfolio effect 1) -6% excl. portfolio effect 1) +9% -12% ~non-optical sensors deconsolidation
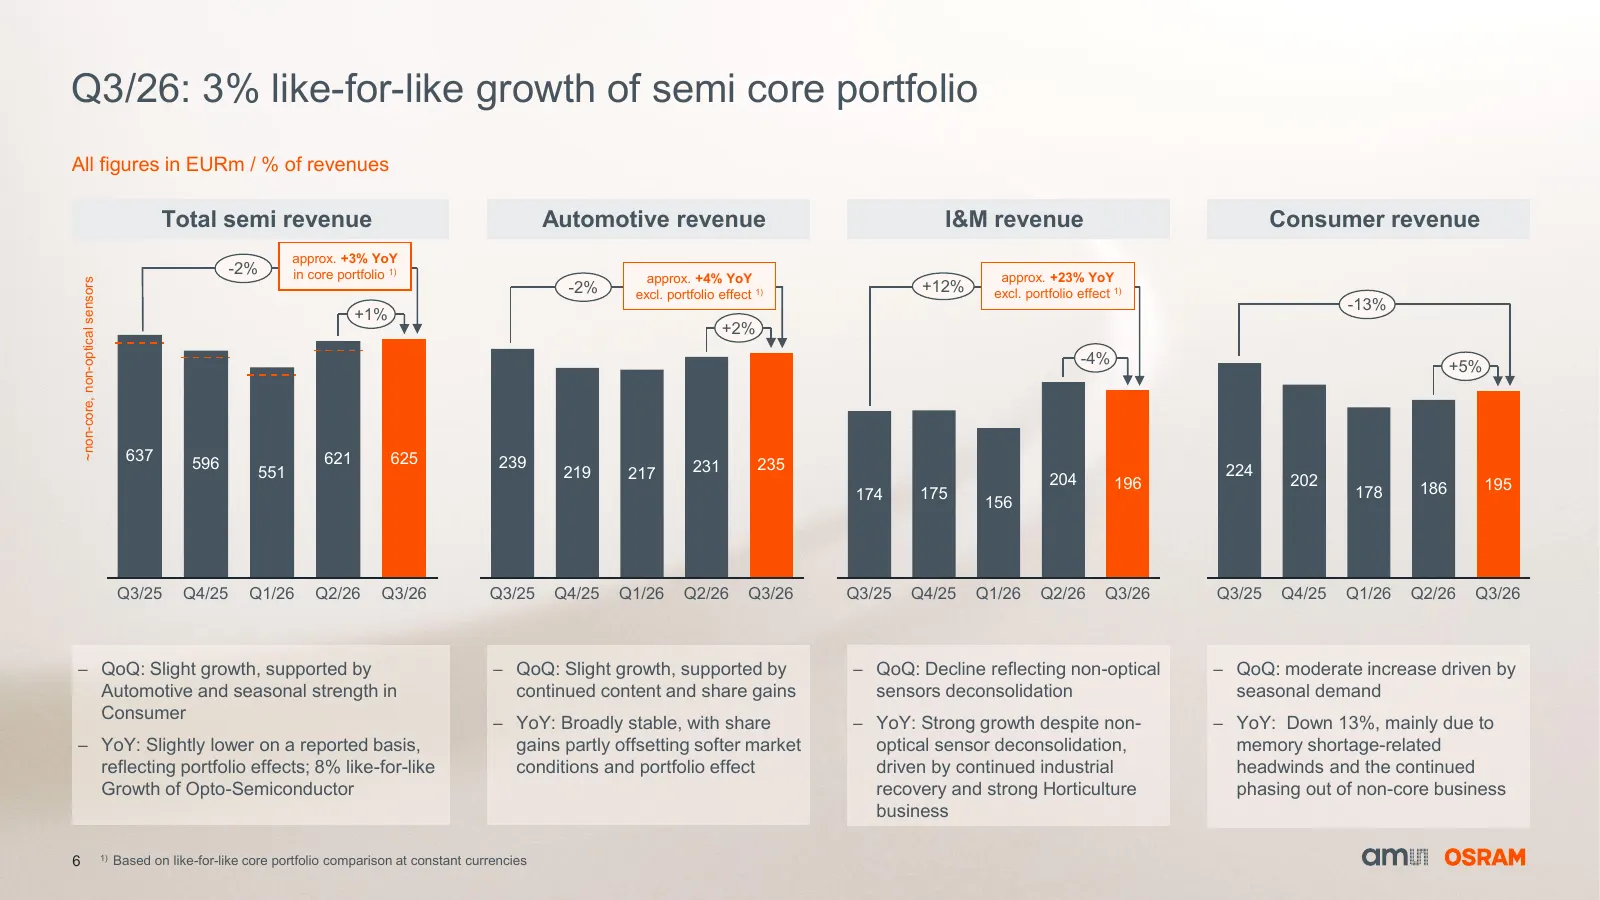
Slide 6: Q3/26: 3% like-for-like growth of semi core portfolio
Q3/26: 3% like-for-like growth of semi core portfolio All figures in EURm / % of revenues Total semi revenue Automotive revenue I&M revenue Consumer revenue approx. +3% YoY -2% in core portfolio 1) approx. +23% YoY approx. +4% YoY ~non-core, non-optical sensors -2% excl. portfolio effect 1) +12% exc
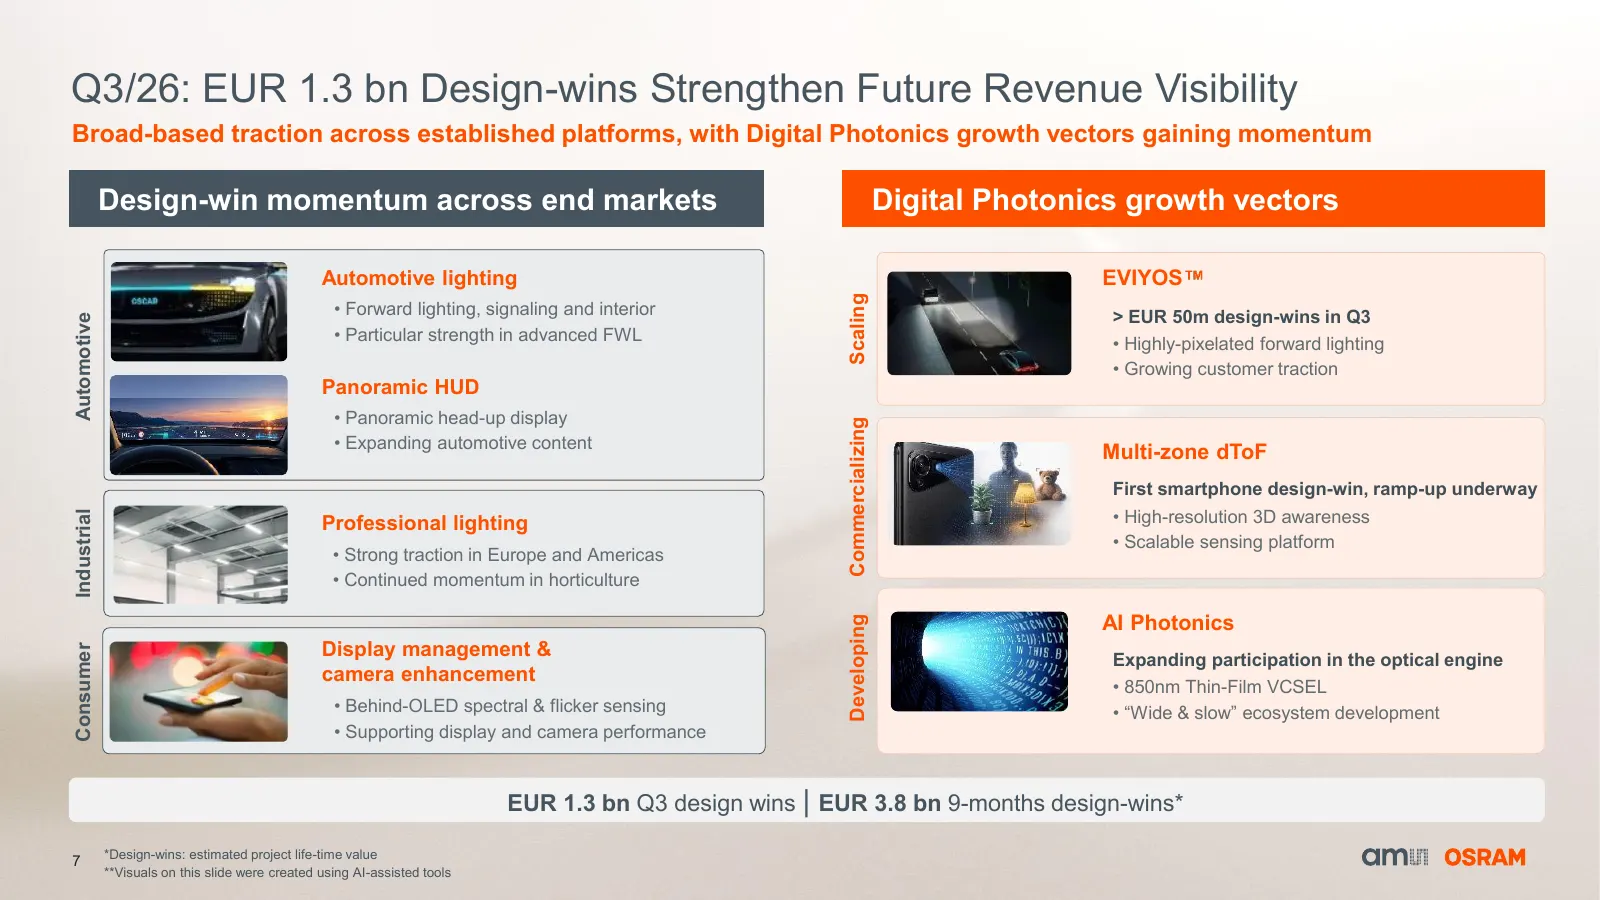
Slide 7: Q3/26: EUR 1.3 bn Design-wins Strengthen Future Revenue Visibility
Q3/26: EUR 1.3 bn Design-wins Strengthen Future Revenue Visibility Broad-based traction across established platforms, with Digital Photonics growth vectors gaining momentum Design-win momentum across end markets Digital Photonics growth vectors Automotive lighting EVIYOS Scaling • Forward lighting,
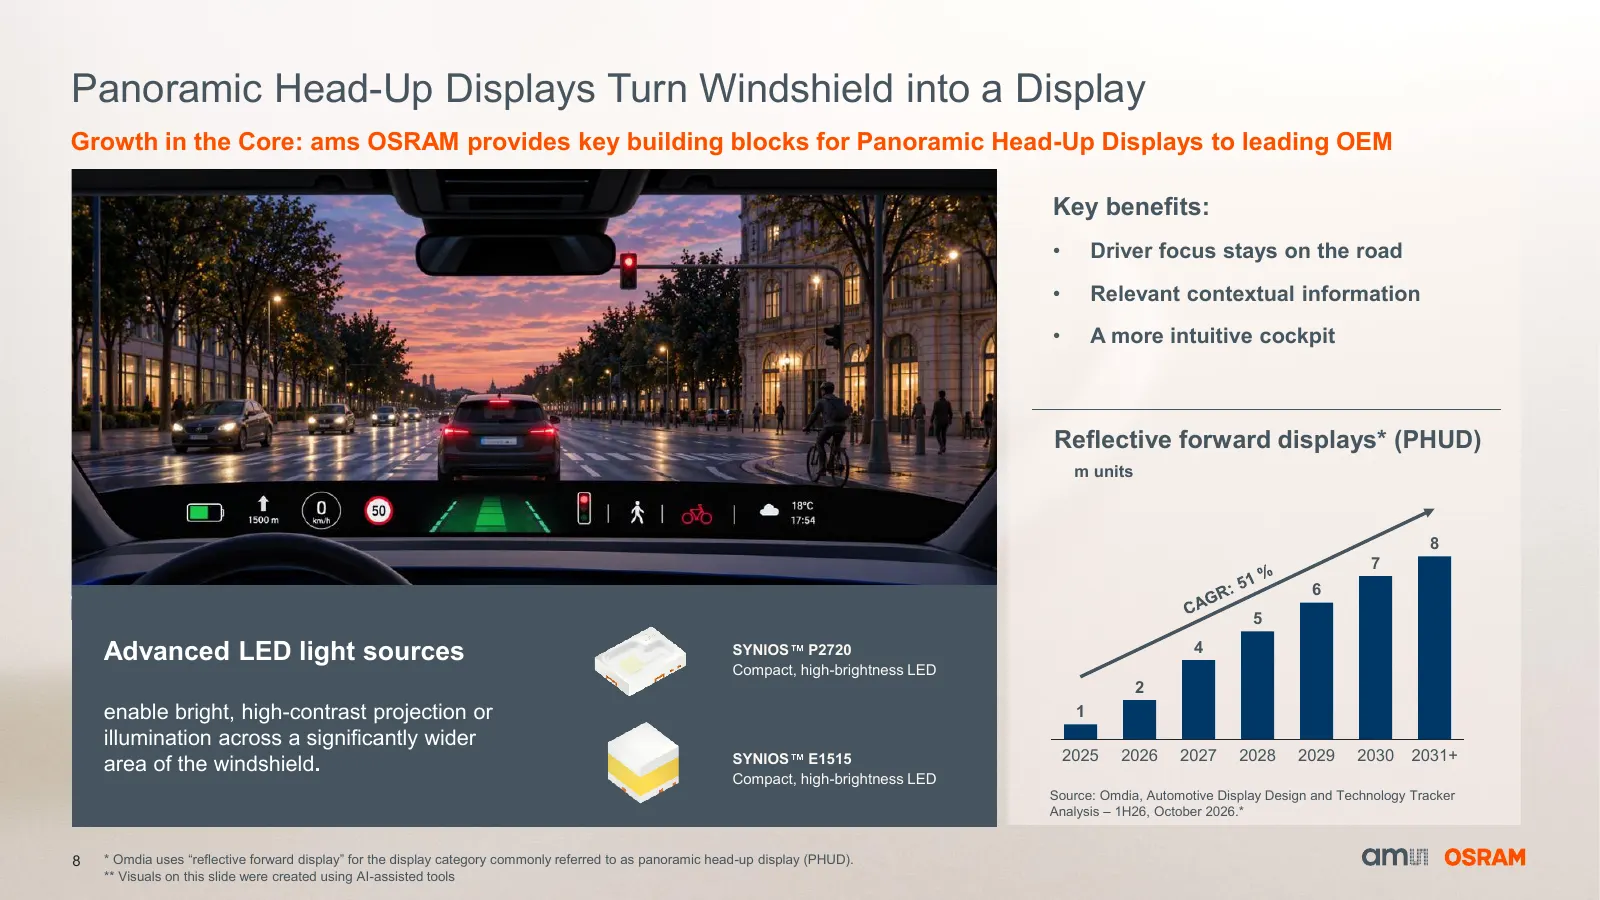
Slide 8: Panoramic Head-Up Displays Turn Windshield into a Display
Panoramic Head-Up Displays Turn Windshield into a Display Growth in the Core: ams OSRAM provides key building blocks for Panoramic Head-Up Displays to leading OEM Key benefits: • Driver focus stays on the road • Relevant contextual information • A more intuitive cockpit Reflective forward displays*
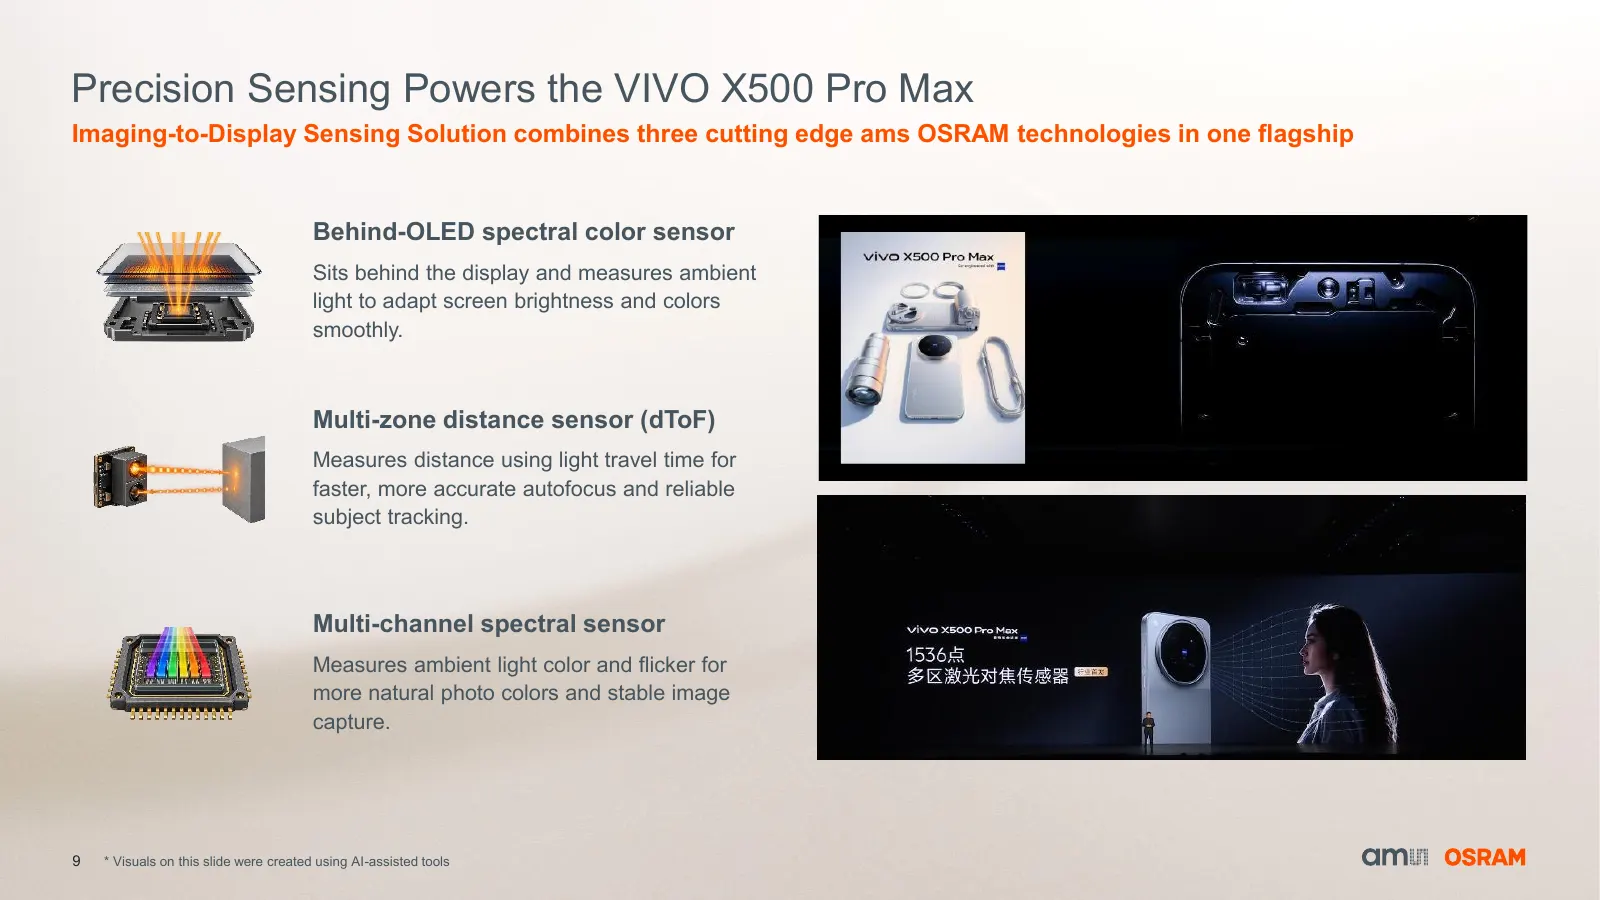
Slide 9: Precision Sensing Powers the VIVO X500 Pro Max
Precision Sensing Powers the VIVO X500 Pro Max Imaging-to-Display Sensing Solution combines three cutting edge ams OSRAM technologies in one flagship Behind-OLED spectral color sensor Sits behind the display and measures ambient light to adapt screen brightness and colors smoothly. Multi-zone distan
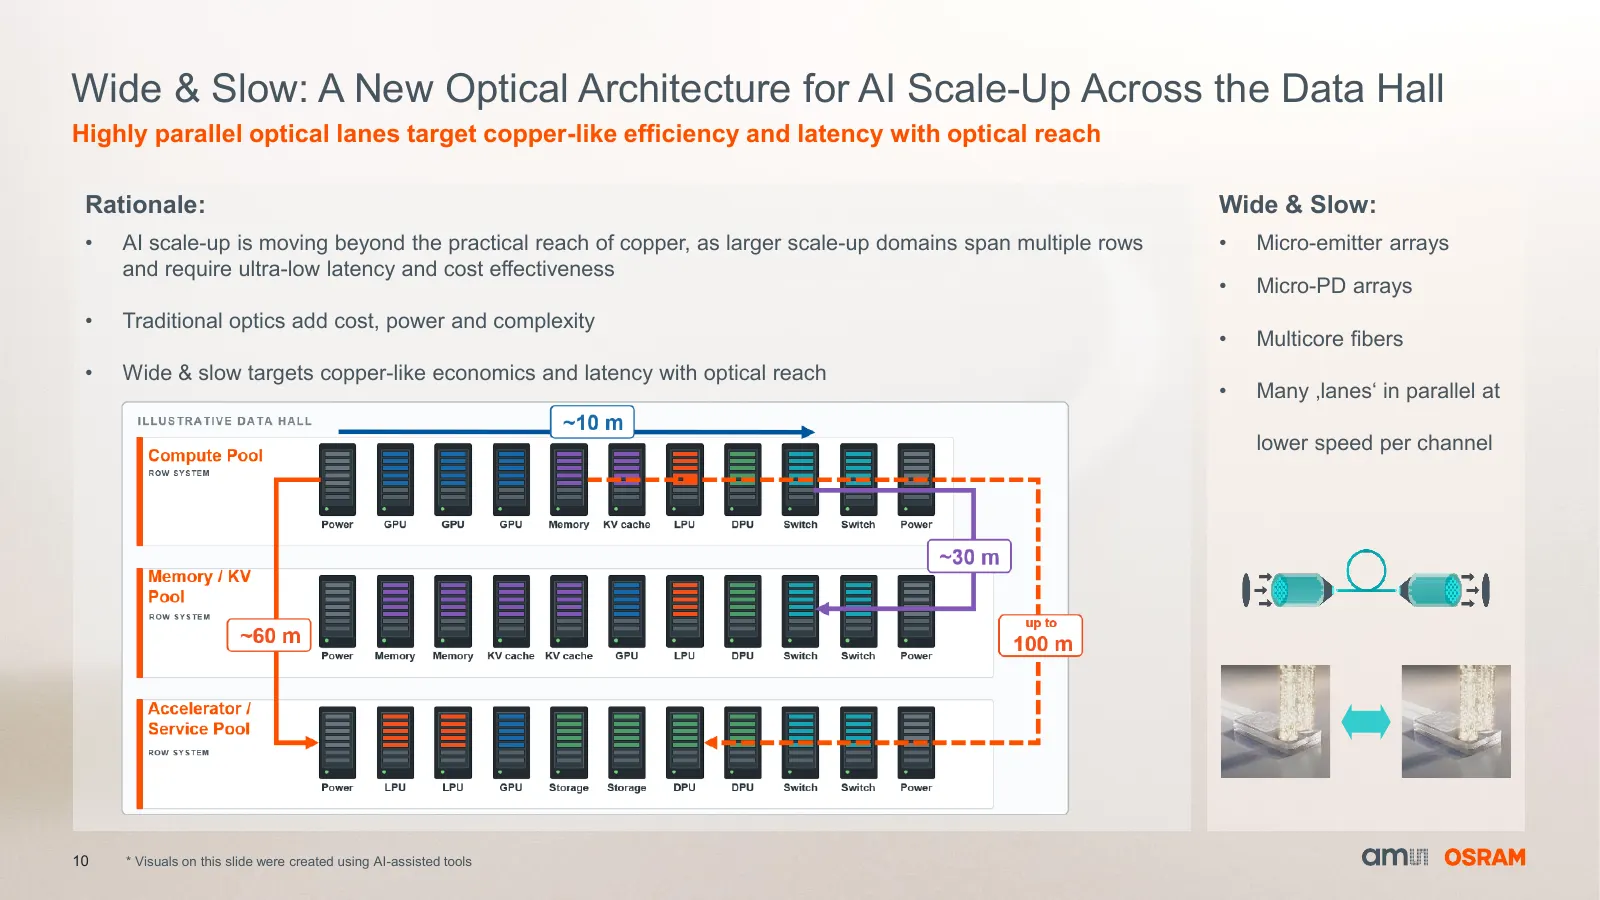
Slide 10: Wide & Slow: A New Optical Architecture for AI Scale-Up Across the Data Hall
Wide & Slow: A New Optical Architecture for AI Scale-Up Across the Data Hall Highly parallel optical lanes target copper-like efficiency and latency with optical reach Rationale: Wide & Slow: • AI scale-up is moving beyond the practical reach of copper, as larger scale-up domains span multiple rows
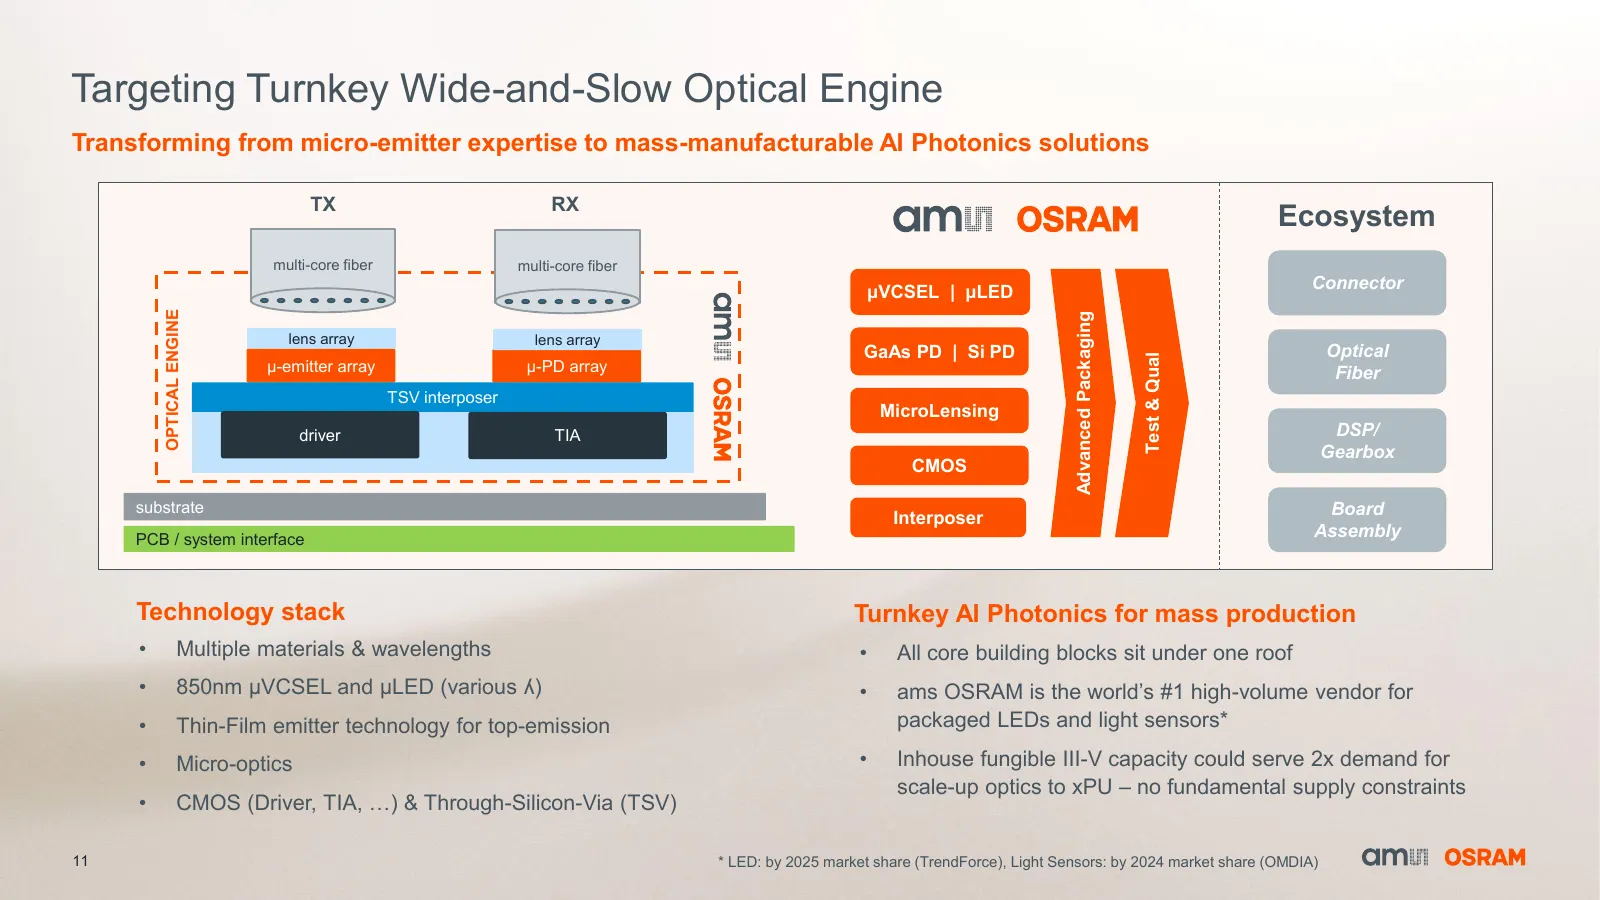
Slide 11: Advanced Packaging: Targeting Turnkey Wide-and-Slow Optical Engine
Targeting Turnkey Wide-and-Slow Optical Engine Transforming from micro-emitter expertise to mass-manufacturable AI Photonics solutions TX RX Ecosystem multi-core fiber multi-core fiber μVCSEL | μLED Connector OPTICAL ENGINE Advanced Packaging lens array lens array GaAs PD | Si PD Optical Test & Qual
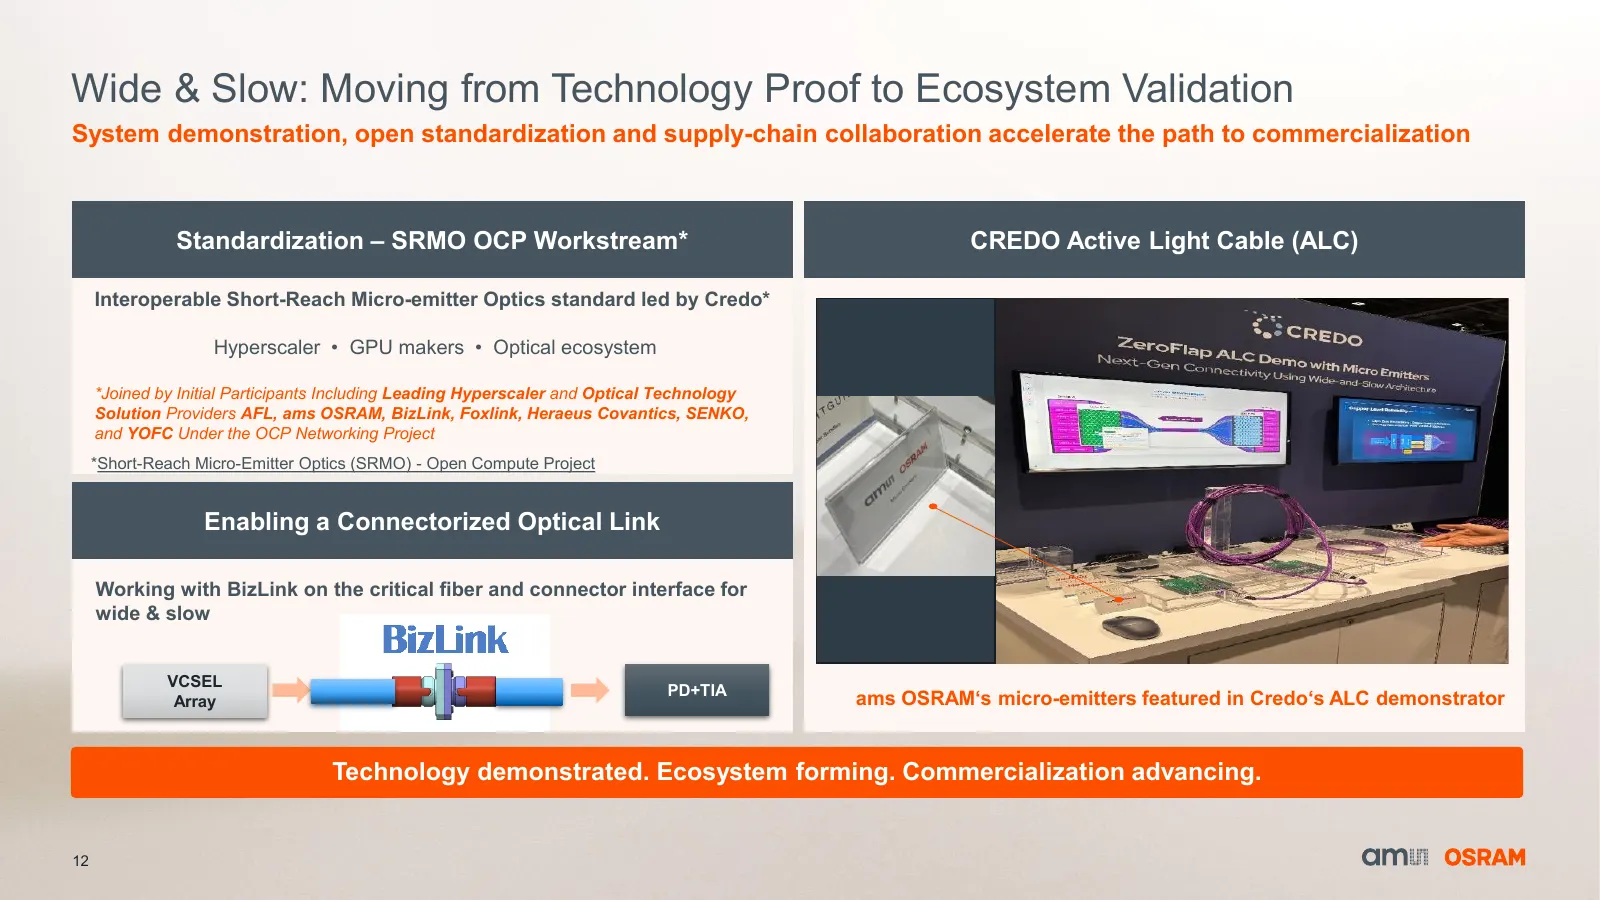
Slide 12: Wide & Slow: Moving from Technology Proof to Ecosystem Validation
Wide & Slow: Moving from Technology Proof to Ecosystem Validation System demonstration, open standardization and supply-chain collaboration accelerate the path to commercialization Standardization – SRMO OCP Workstream* CREDO Active Light Cable (ALC) Interoperable Short-Reach Micro-emitter Optics st
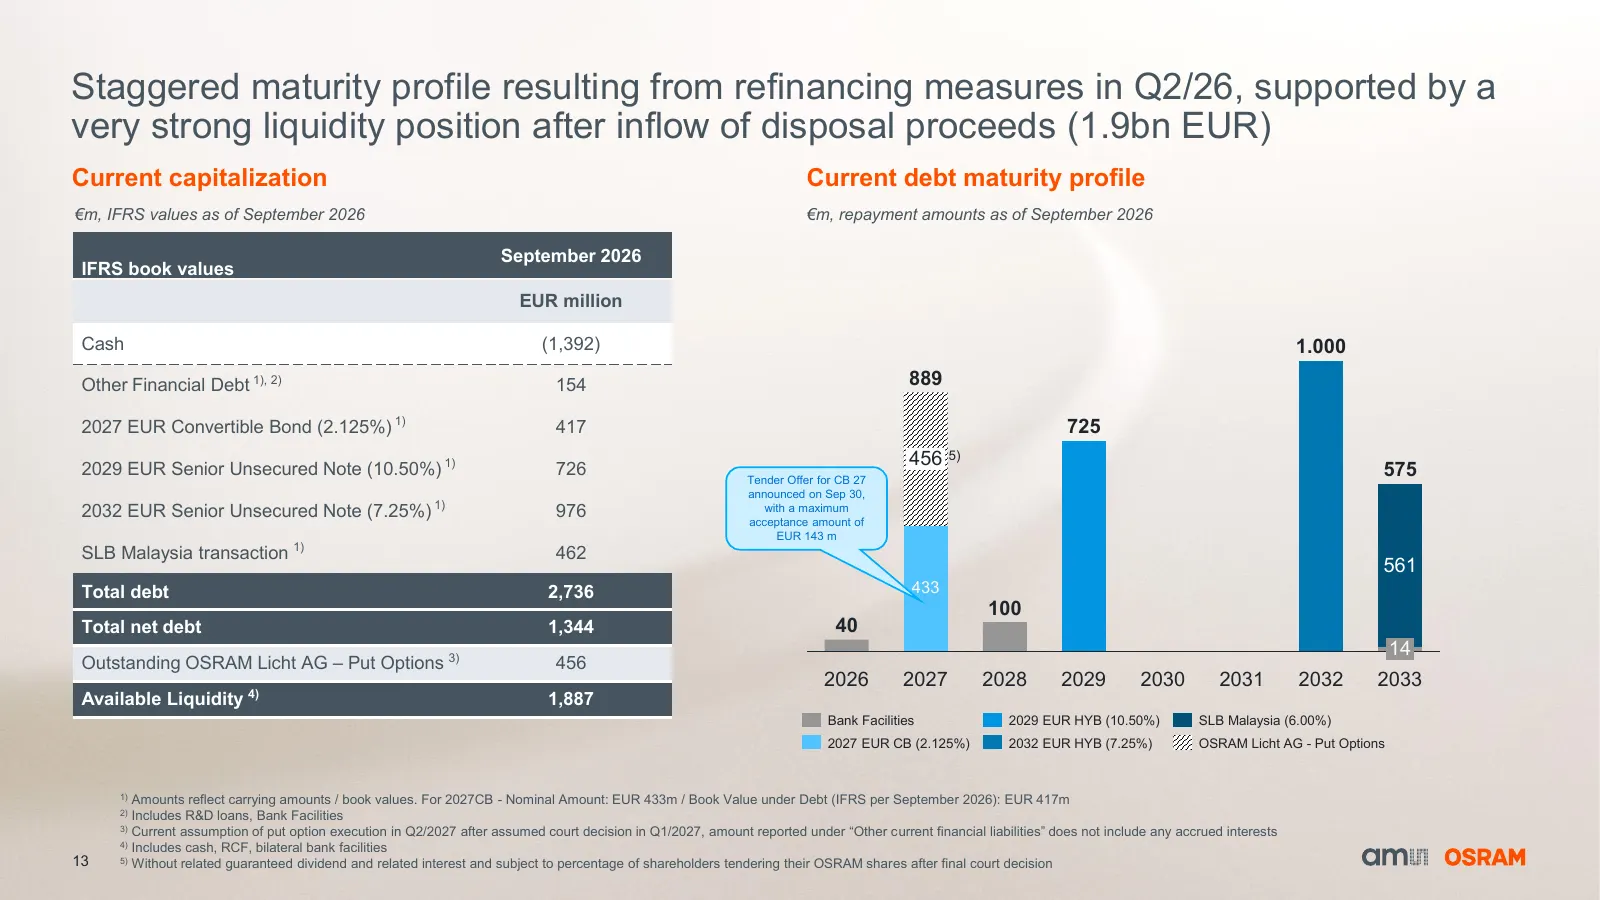
Slide 13: Staggered maturity profile resulting from refinancing measures in Q2/26
Staggered maturity profile resulting from refinancing measures in Q2/26, supported by a very strong liquidity position after inflow of disposal proceeds (1.9bn EUR) Current capitalization Current debt maturity profile €m, IFRS values as of September 2026 €m, repayment amounts as of September 2026 €m
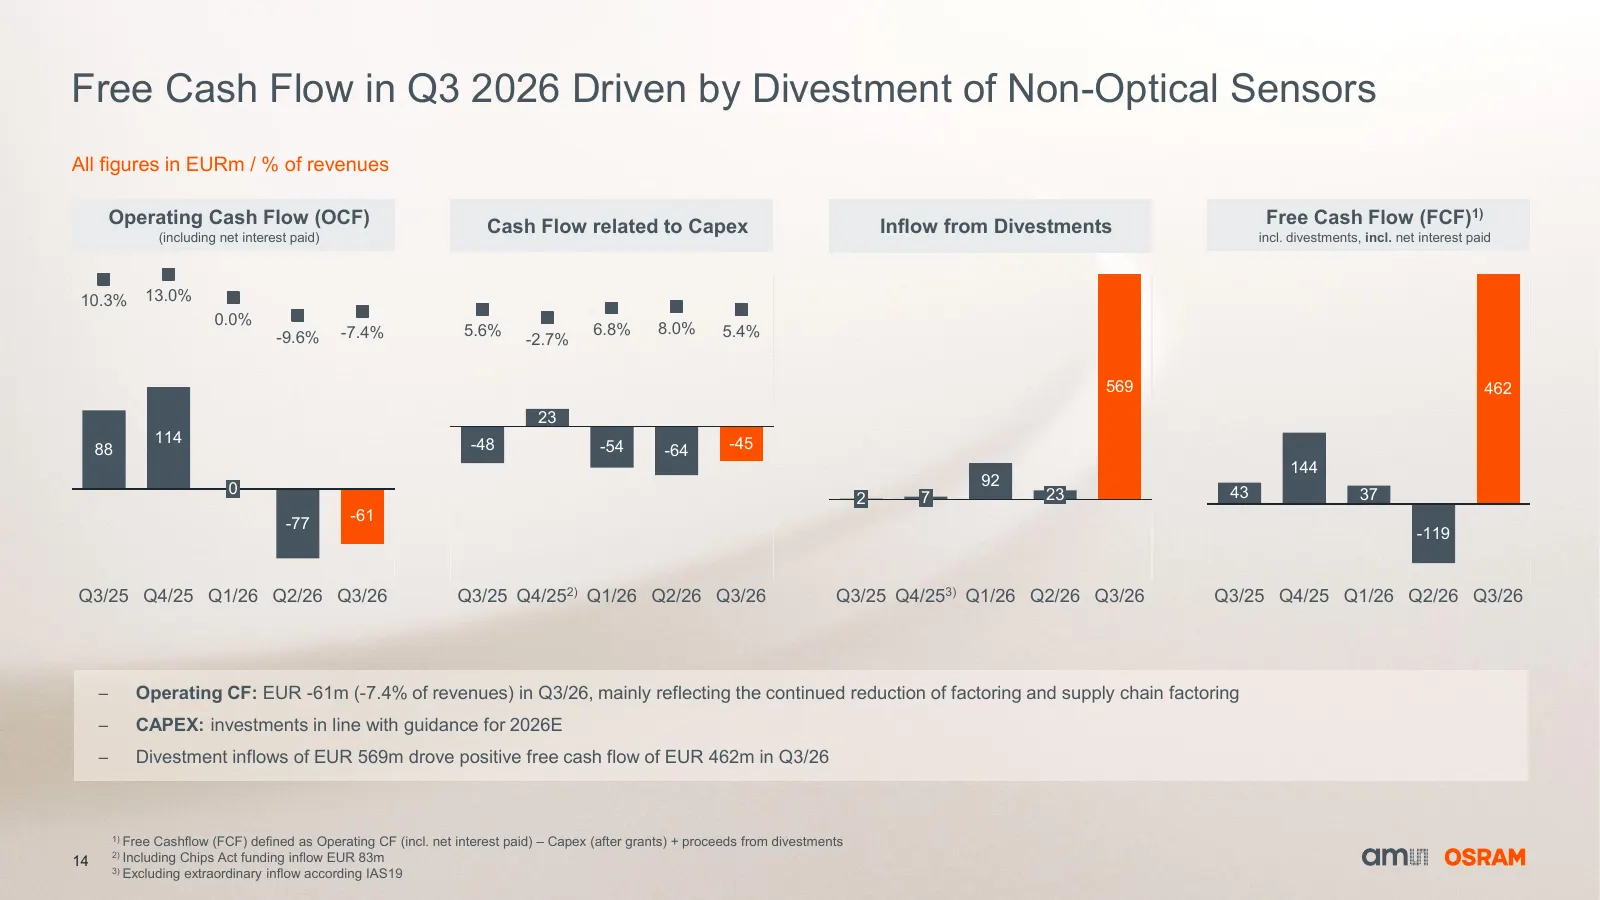
Slide 14: Free Cash Flow in Q3 2026 Driven by Divestment of Non-Optical Sensors
Free Cash Flow in Q3 2026 Driven by Divestment of Non-Optical Sensors All figures in EURm / % of revenues Operating Cash Flow (OCF) Cash Flow related to Capex Inflow from Divestments Free Cash Flow (FCF)1) (including net interest paid) incl. divestments, incl. net interest paid 10.3% 13.0% 0.0% -7.4
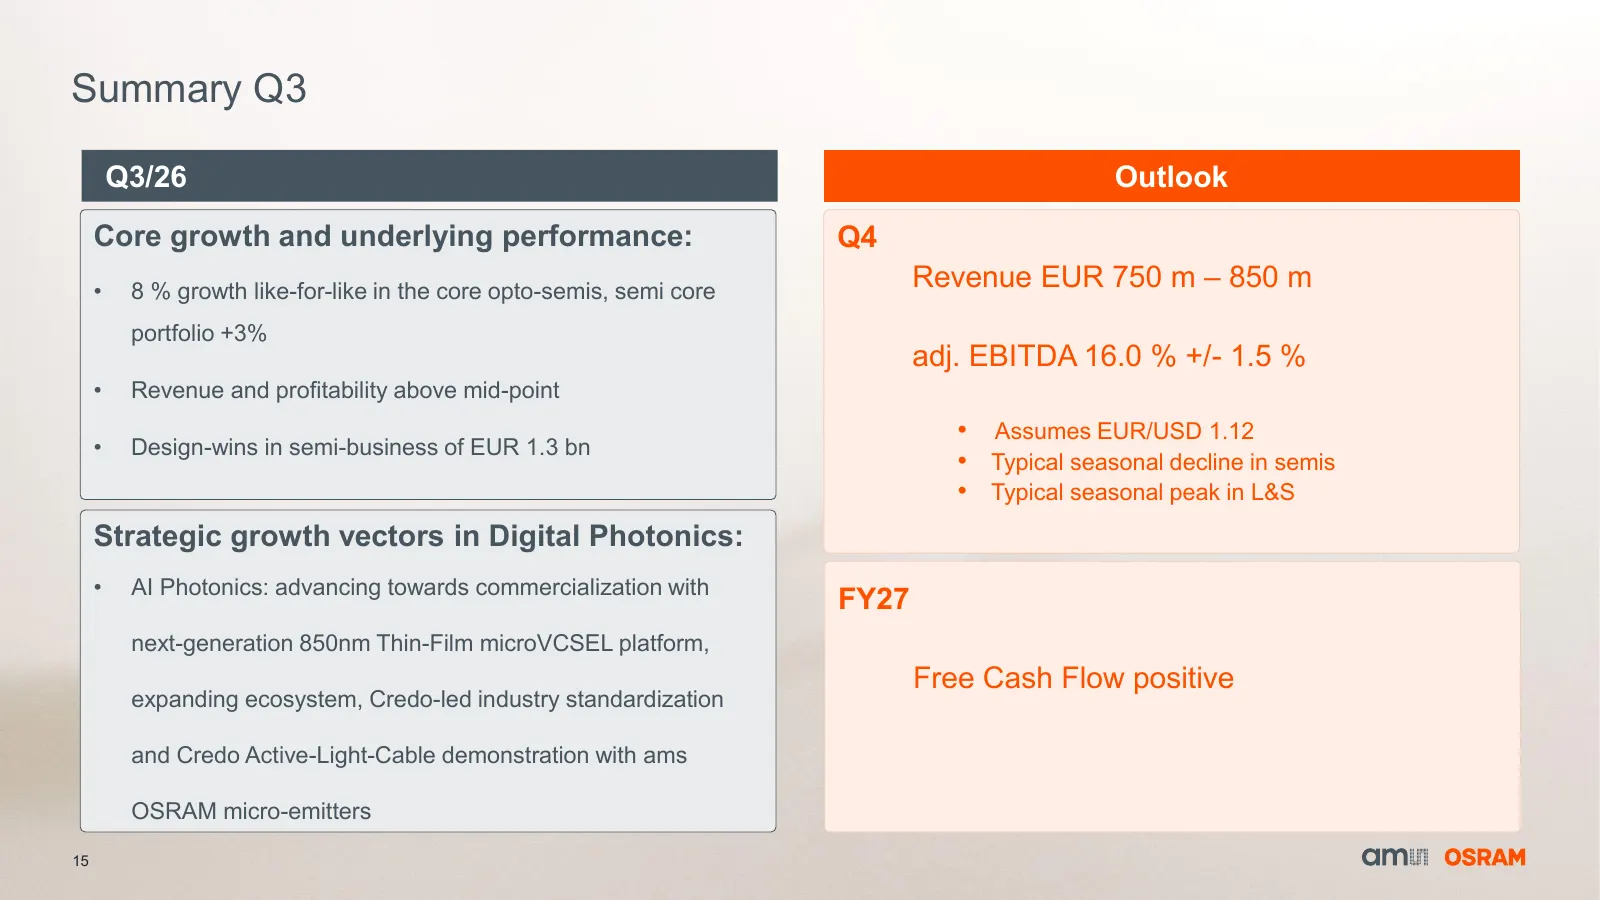
Slide 15: Summary Q3
Summary Q3 Q3/26 Outlook Core growth and underlying performance: Q4 • 8 % growth like-for-like in the core opto-semis, semi core Revenue EUR 750 m – 850 m portfolio +3% adj. EBITDA 16.0 % +/- 1.5 % • Revenue and profitability above mid-point • Assumes EUR/USD 1.12 • Design-wins in semi-business of E
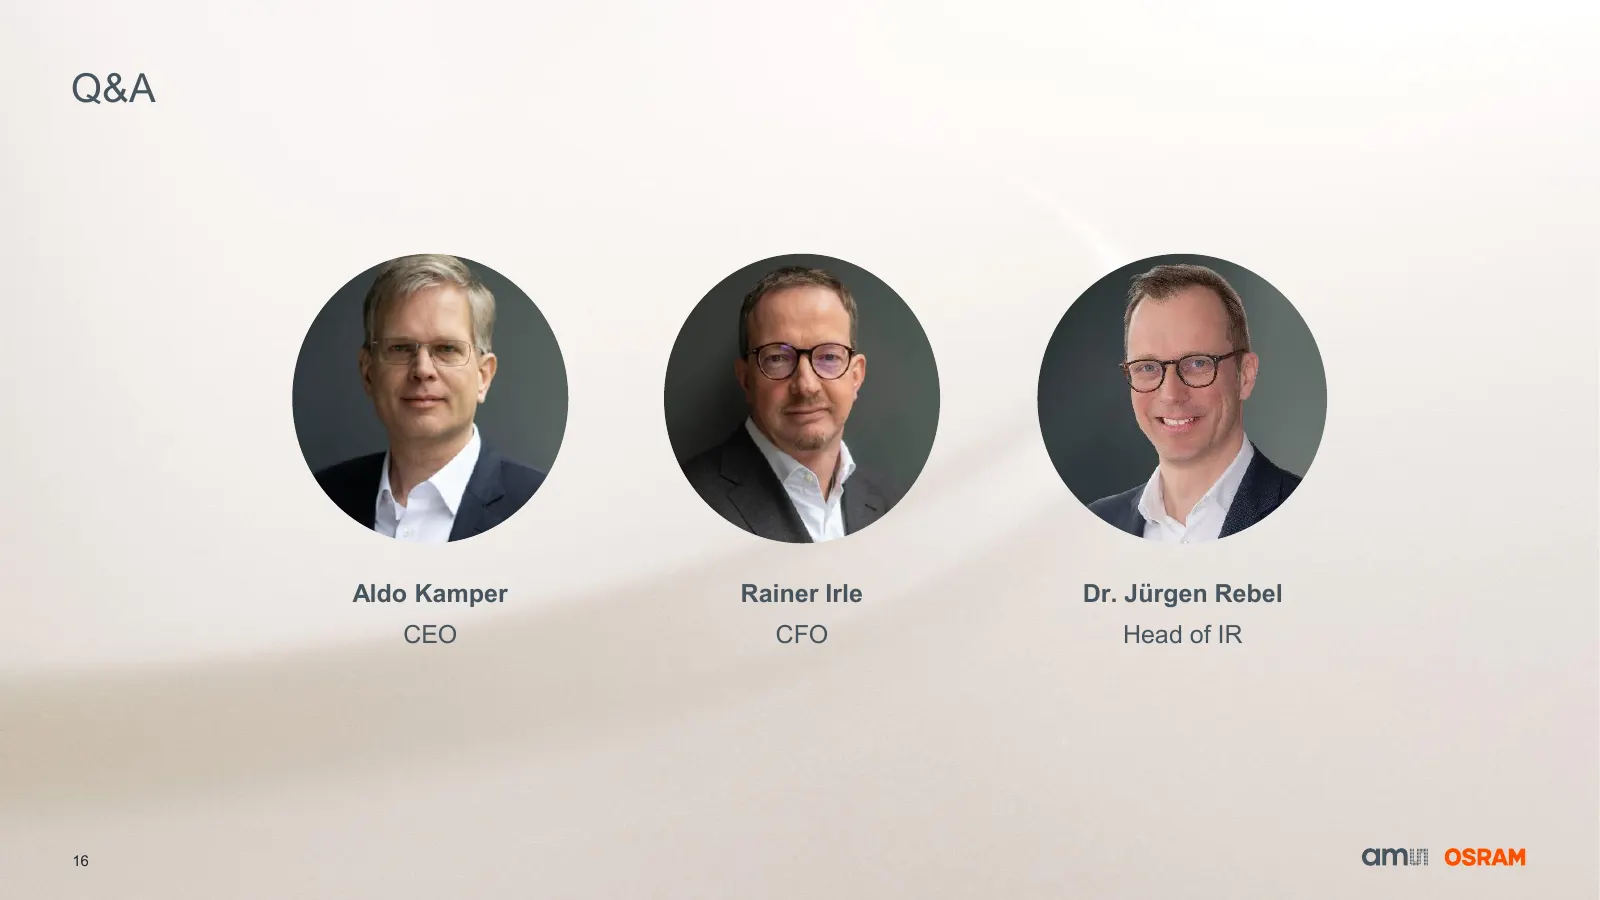
Slide 16: Q&A
Q&A Aldo Kamper Rainer Irle Dr. Jürgen Rebel CEO CFO Head of IR 16
Source: company website
More decks from ams-OSRAM AG
 Q3 2026 Earnings Presentation60 slides · Nov 13, 2026
 Q2 2026 Earnings Presentation59 slides · Aug 4, 2026
 Q2 2026 Earnings Presentation19 slides · Aug 4, 2026
 Q1 2026 Earnings Presentation54 slides · May 7, 2026
 Q1 2026 Earnings Presentation17 slides · May 7, 2026
 FY2025 Earnings Presentation54 slides · Feb 10, 2026