Endeavour International — Credit Suisse First Boston 2005 Energy Summit
34 slides from Endeavour International's conference presentation, Feb 2, 2005
Slide 1: Credit Suisse First Boston 2005 Energy Summit
John Seitz Co-Chief Executive Officer Credit Suisse First Boston 2005 Energy Summit February 2, 2005 Exhibit 99.1
Slide 2: Cautionary Statement
Cautionary Statement This is an oral presentation which is accompanied by slides. Investors are urged to review our SEC filings. This presentation contains certain forward-looking statements regarding various oil and gas discoveries, oil and gas exploration, development and production activities, an
Slide 3: Investment Opportunity
Investment Opportunity Proven management team Experienced and successful technical, business development and support staff North Sea poised for renaissance Pre-eminent 3D seismic data base foundation (includes Mega Merge) Aggressive multi-country strategy Attractive exploration, exploitation, commer
Slide 4: Management Team
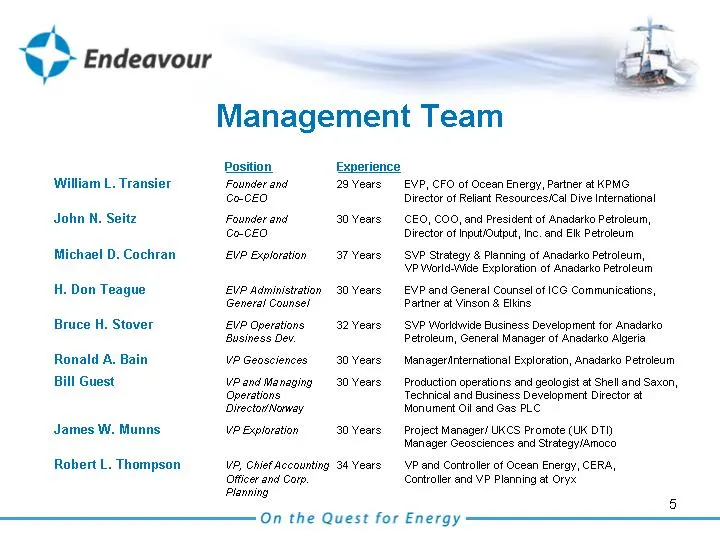
Management Team Position Experience William L. Transier Founder and 29 Years EVP, CFO of Ocean Energy, Partner at KPMG Co-CEO Director of Reliant Resources/Cal Dive International John N. Seitz Founder and 30 Years CEO, COO, and President of Anadarko Petroleum, Co-CEO Director of Input/Output, Inc. a
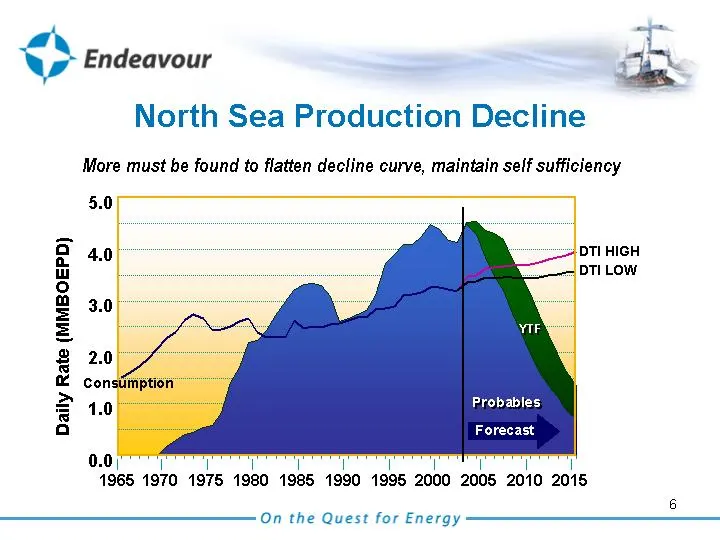
Slide 5: North Sea Production Decline
North Sea Production Decline More must be found to flatten decline curve, maintain self sufficiency Daily Rate (MMBOEPD) 0.0 1.0 2.0 3.0 4.0 5.0 Forecast Probables YTF 1970 1980 1975 1985 1990 1995 2000 2005 2015 2010 1965 Consumption DTI HIGH DTI LOW
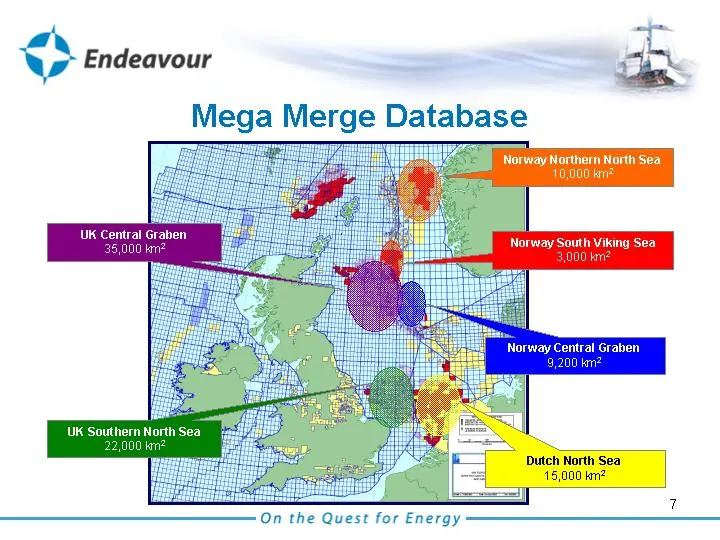
Slide 6: Mega Merge Database
Mega Merge Database UK Central Graben 35,000 km2 Norway Northern North Sea 10,000 km2 Norway Central Graben 9,200 km2 UK Southern North Sea 22,000 km2 Norway South Viking Sea 3,000 km2 Dutch North Sea 15,000 km2
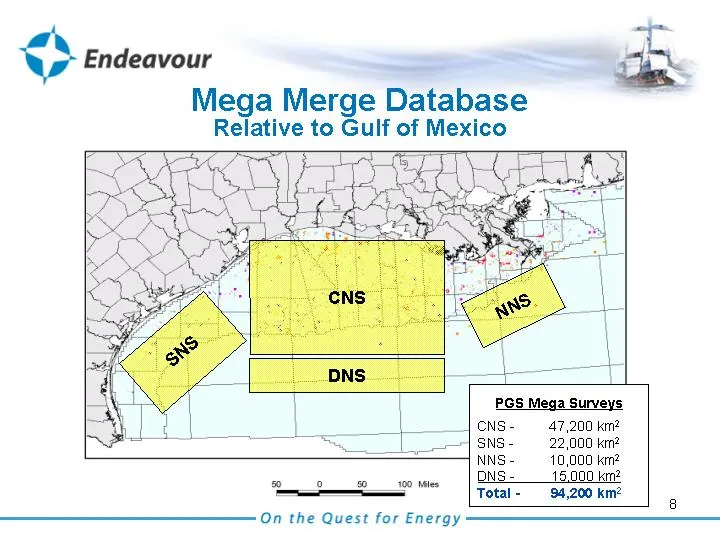
Slide 7: Mega Merge Database Relative to Gulf of Mexico
Mega Merge Database Relative to Gulf of Mexico SNS NNS CNS PGS Mega Surveys .. CNS - 47,200 km2 SNS - 22,000 km2 NNS - 10,000 km2 DNS - 15,000 km2 Total - 94,200 km2 DNS
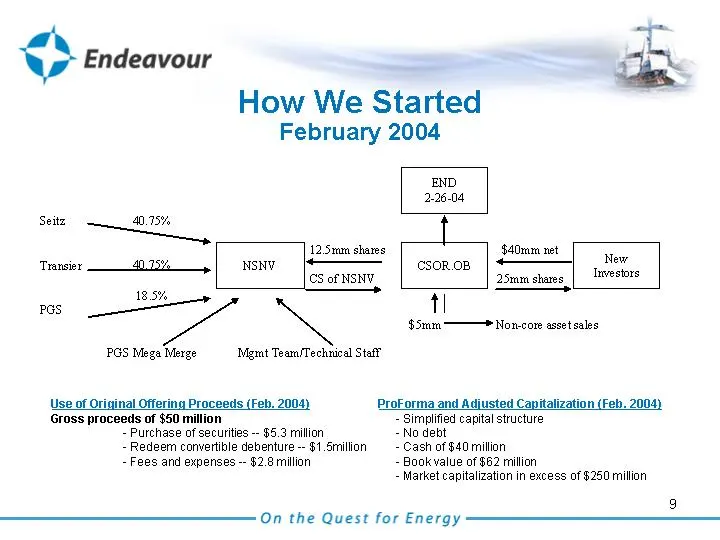
Slide 8: How We Started
How We Started February 2004 Use of Original Offering Proceeds (Feb. 2004) Gross proceeds of $50 million - Purchase of securities -- $5.3 million - Redeem convertible debenture -- $1.5million - Fees and expenses -- $2.8 million ProForma and Adjusted Capitalization (Feb. 2004) - Simplified capital st
Slide 9: What We Have Accomplished
What We Have Accomplished Acquired license for 3D Mega Merge (79,200 KM2 of seismic data) Merged with CSOR, creating Endeavour (Feb. 26, 2004) Raised common equity, sold non-core assets, eliminated all debt and simplified capital structure Generated portfolio of exploration prospects with over 1 bil
Slide 10: 2005 Activity
2005 Activity UK 22nd round work program Participation in UK 23rd round Drill up to 4 exploration wells in UKCS Participation in 9 development/exploitation wells in Norway Holland expansion Thailand development
Slide 11: North Sea Opportunity
North Sea Opportunity UK: DTI estimates 16B BOE yet-to-be discovered Norway: NPD estimates 24B BOE yet-to-be discovered 30 - 50% success rates and attractive economics for sizeable fields (20-50 MMBOE) Mega Merge proves effective in high grading opportunities "New" acreage available due to "fallow"
Slide 12: Endeavour Assets
Endeavour Assets On the Quest for Energy 13
Slide 13: North Sea Data
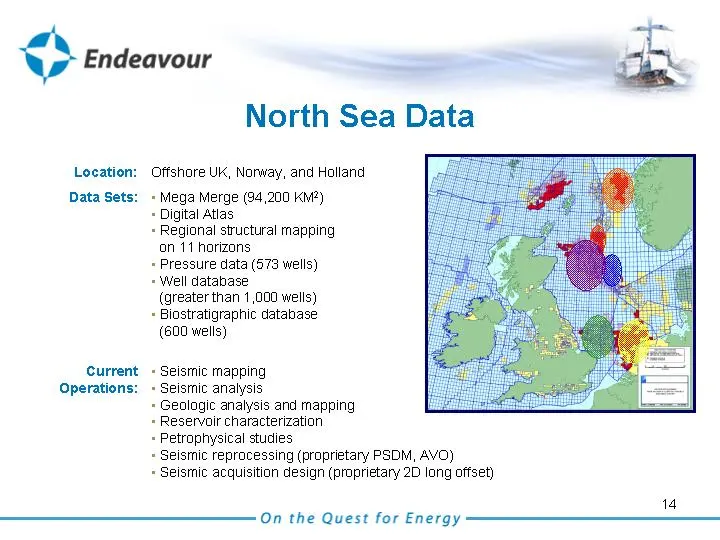
Location: Offshore UK, Norway, and Holland Data Sets: • Mega Merge (94,200 KM2) • Digital Atlas • Regional structural mapping on 11 horizons • Pressure data (573 wells) • Well database (greater than 1,000 wells) • Biostratigraphic database (600 wells) Current • Seismic mapping Operations: • Seismic
Slide 14: Brage Field - Norway
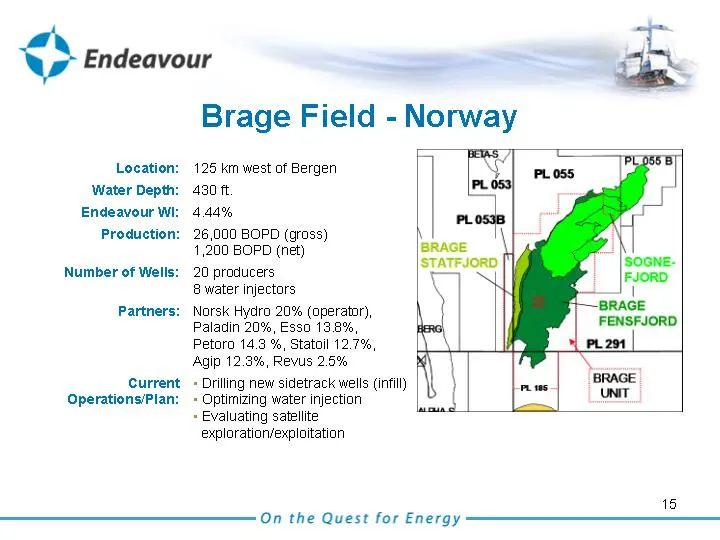
Location: 125 km west of Bergen Water Depth: 430 ft. Endeavour WI: 4.44% Production: 26,000 BOPD (gross) 1,200 BOPD (net) Number of Wells: 20 producers 8 water injectors Partners: Norsk Hydro 20% (operator), Paladin 20%, Esso 13.8%, Petoro 14.3 %, Statoil 12.7%, Agip 12.3%, Revus 2.5% Current • Dril
Slide 15: Njord Field - Norway
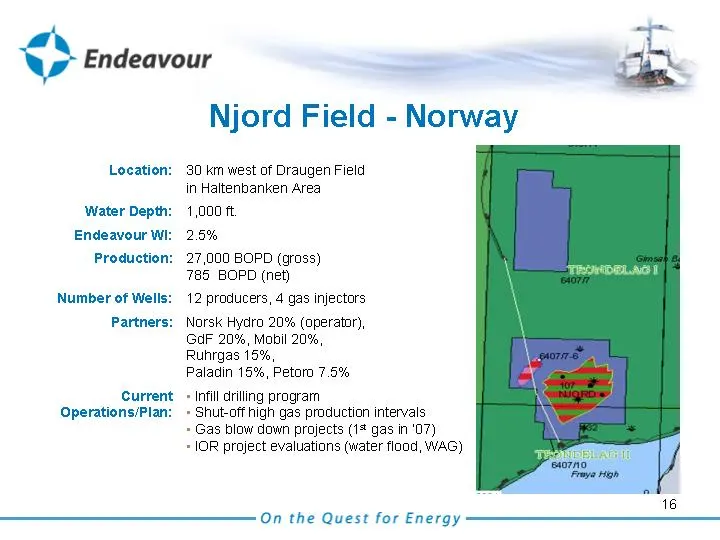
Location: 30 km west of Draugen Field in Haltenbanken Area Water Depth: 1,000 ft. Endeavour WI: 2.5% Production: 27,000 BOPD (gross) 785 BOPD (net) Number of Wells: 12 producers, 4 gas injectors Partners: Norsk Hydro 20% (operator), GdF 20%, Mobil 20%, Ruhrgas 15%, Paladin 15%, Petoro 7.5% Current •
Slide 16: Agat Field (Non-Producing) - Norway
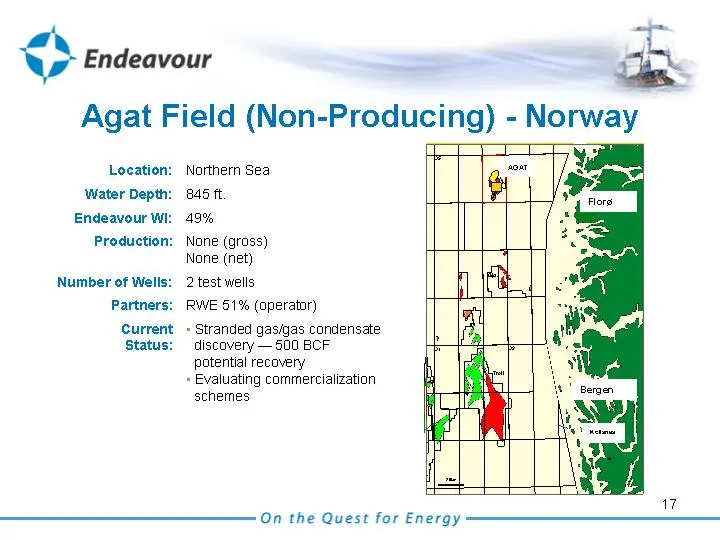
Location: Northern Sea Water Depth: 845 ft. Endeavour WI: 49% Production: None (gross) None (net) Number of Wells: 2 test wells Partners: RWE 51% (operator) Current • Stranded gas/gas condensate Status: discovery - 500 BCF potential recovery • Evaluating commercialization schemes Agat Field (Non-Pro
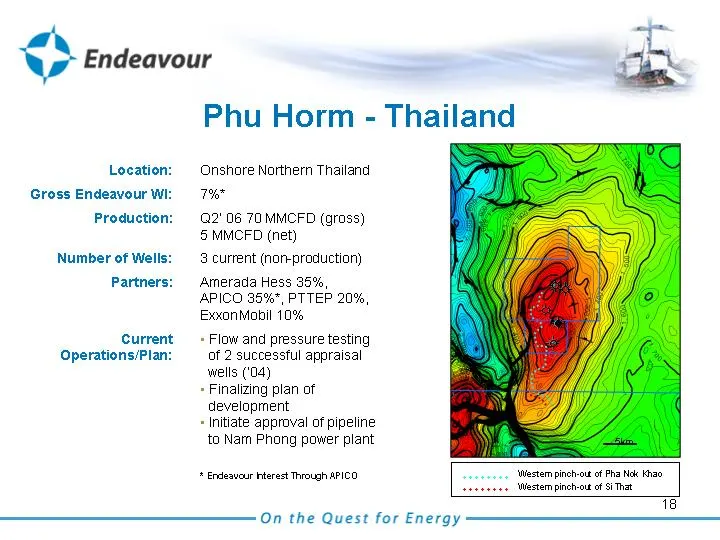
Slide 17: Phu Horm - Thailand
Location: Onshore Northern Thailand Gross Endeavour WI: 7%* Production: Q2' 06 70 MMCFD (gross) 5 MMCFD (net) Number of Wells: 3 current (non-production) Partners: Amerada Hess 35%, APICO 35%*, PTTEP 20%, ExxonMobil 10% Current • Flow and pressure testing Operations/Plan: of 2 successful appraisal w
Slide 18: Endeavour Investment Opportunity
Endeavour Investment Opportunity
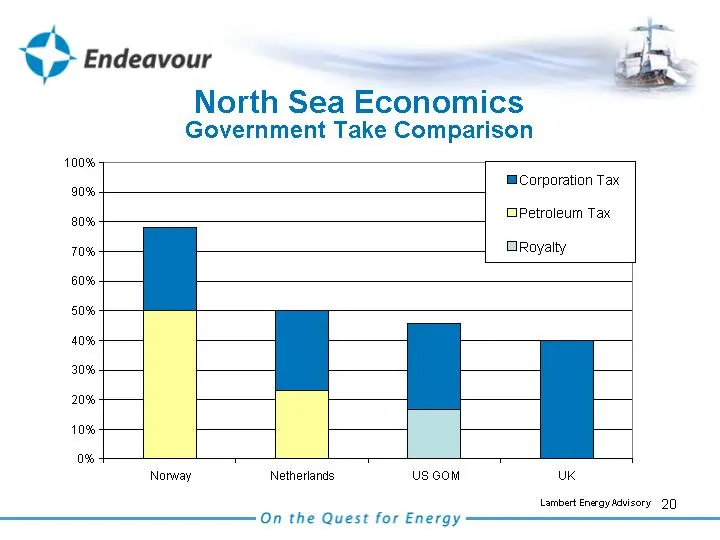
Slide 19: North Sea Economics: Government Take Comparison
North Sea Economics Government Take Comparison 0% 10% 20% 30% 40% 50% 60% 70% 80% 90% 100% Norway Netherlands US GOM UK Corporation Tax Petroleum Tax Royalty Lambert Energy Advisory
Slide 20: North Sea Economics
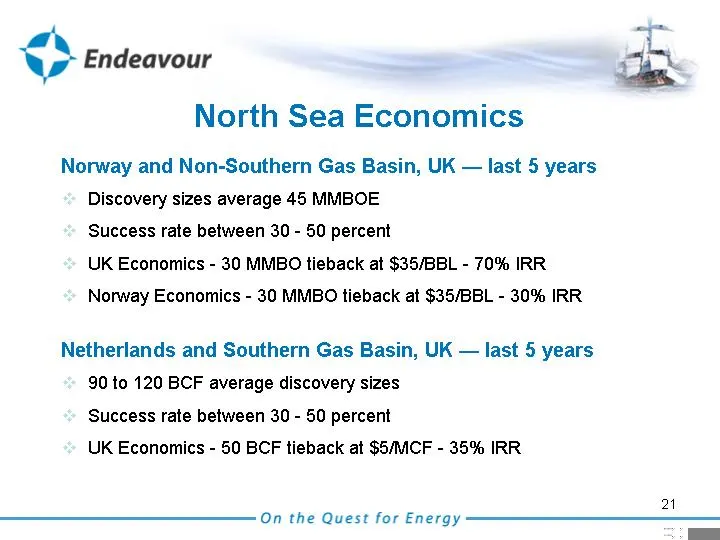
North Sea Economics Norway and Non-Southern Gas Basin, UK - last 5 years Discovery sizes average 45 MMBOE Success rate between 30 - 50 percent UK Economics - 30 MMBO tieback at $35/BBL - 70% IRR Norway Economics - 30 MMBO tieback at $35/BBL - 30% IRR Netherlands and Southern Gas Basin, UK - last 5 y
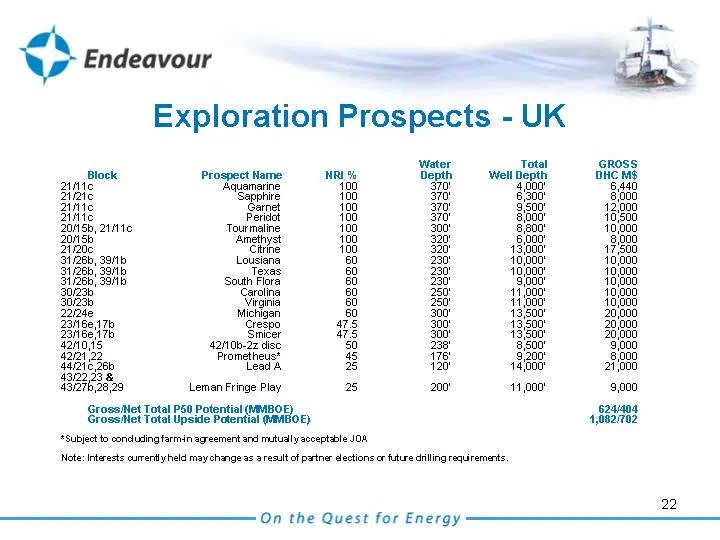
Slide 21: UK Exploration Prospect Table
Water Total GROSS Block Prospect Name NRI % Depth Well Depth DHC M$ 21/11c Aquamarine 100 370' 4,000' 6,440 21/21c Sapphire 100 370' 6,300' 8,000 21/11c Garnet 100 370' 9,500' 12,000 21/11c Peridot 100 370' 8,000' 10,500 20/15b, 21/11c Tourmaline 100 300' 8,800' 10,000 20/15b Amethyst 100 320' 6,000
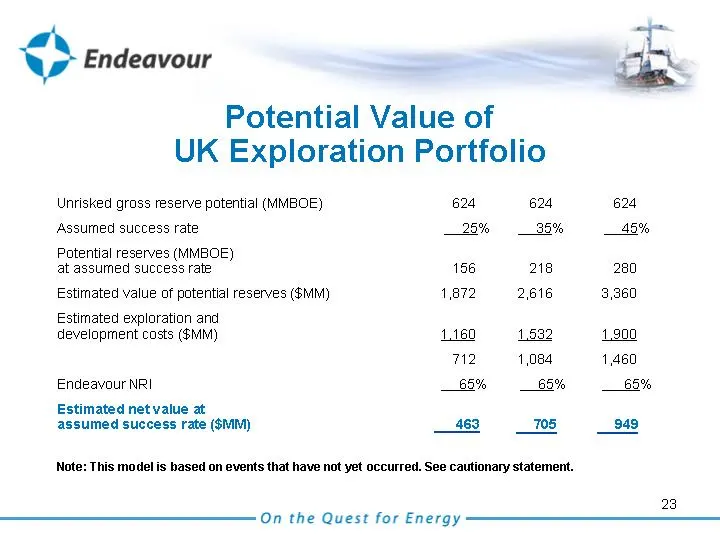
Slide 22: Potential Value of UK Exploration Portfolio
Potential Value of UK Exploration Portfolio Unrisked gross reserve potential (MMBOE) 624 624 624 Assumed success rate 25% 35% 45% Potential reserves (MMBOE) at assumed success rate 156 218 280 Estimated value of potential reserves ($MM) 1,872 2,616 3,360 Estimated exploration and development costs (
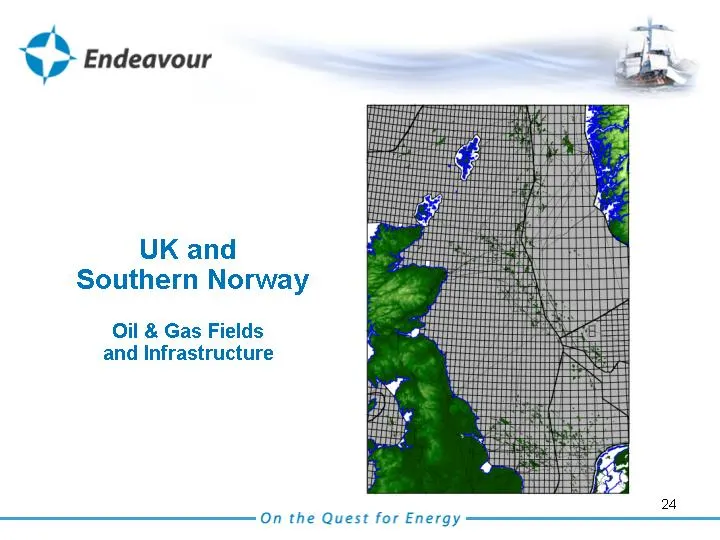
Slide 23: UK and Southern Norway Oil & Gas Fields and Infrastructure
UK and Southern Norway Oil & Gas Fields and Infrastructure
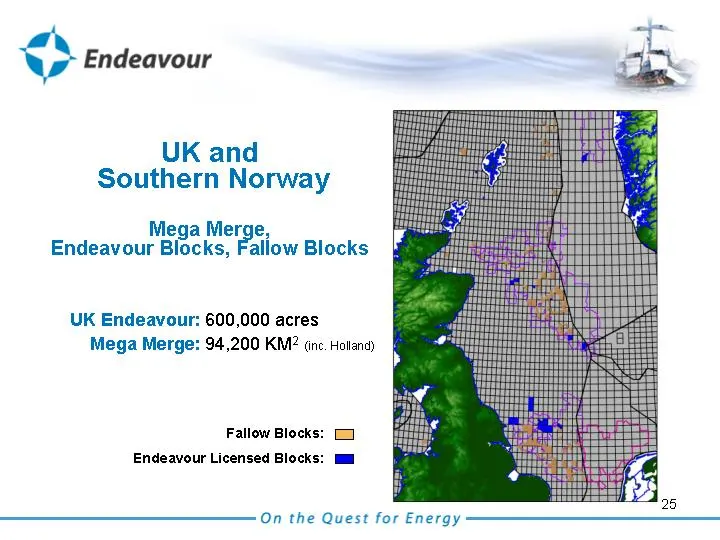
Slide 24: UK and Southern Norway Mega Merge, Endeavour Blocks, Fallow Blocks
UK and Southern Norway Mega Merge, Endeavour Blocks, Fallow Blocks UK Endeavour: 600,000 acres Mega Merge: 94,200 KM2 (inc. Holland) Fallow Blocks: Endeavour Licensed Blocks:
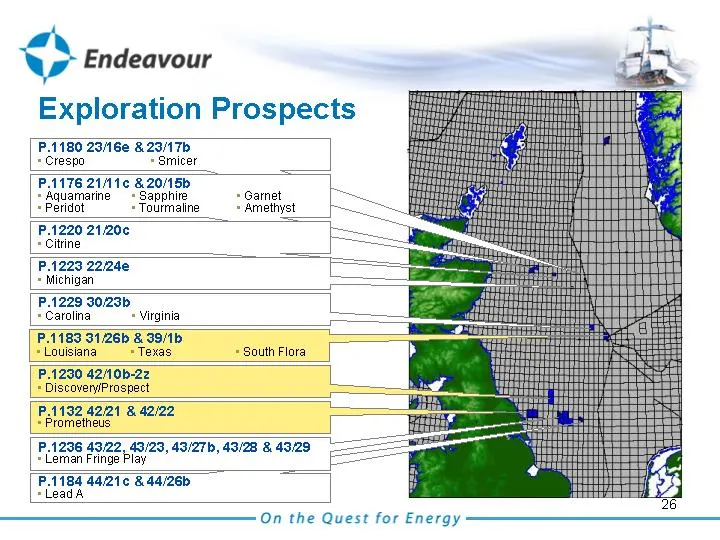
Slide 25: Exploration Prospects
Exploration Prospects P.1184 44/21c & 44/26b • Lead A P.1236 43/22, 43/23, 43/27b, 43/28 & 43/29 • Leman Fringe Play P.1180 23/16e & 23/17b • Crespo • Smicer P.1132 42/21 & 42/22 • Prometheus P.1230 42/10b-2z • Discovery/Prospect P.1183 31/26b & 39/1b • Louisiana • Texas • South Flora P.1229 30/23b
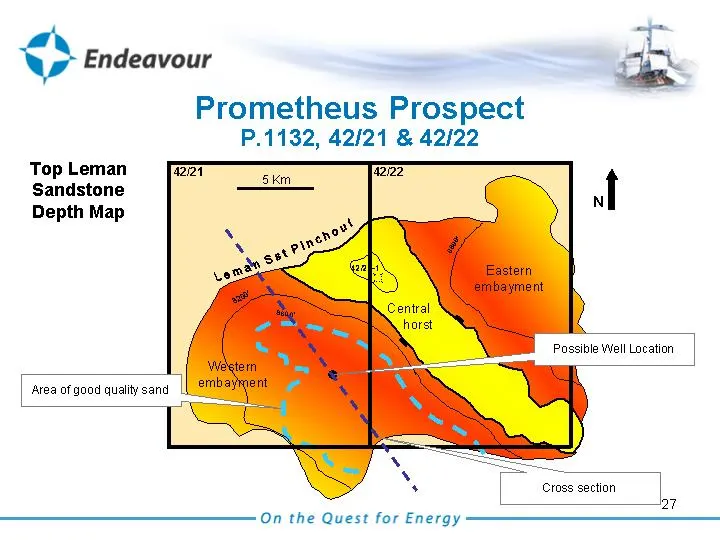
Slide 26: Prometheus Prospect
Prometheus Prospect P.1132, 42/21 & 42/22 Area of good quality sand Possible Well Location Cross section Top Leman Sandstone Depth Map
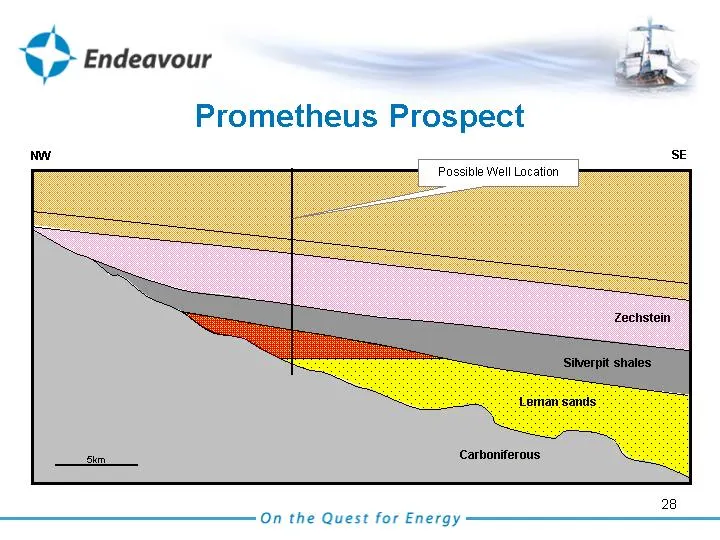
Slide 27: Prometheus Prospect
Prometheus Prospect Possible Well Location
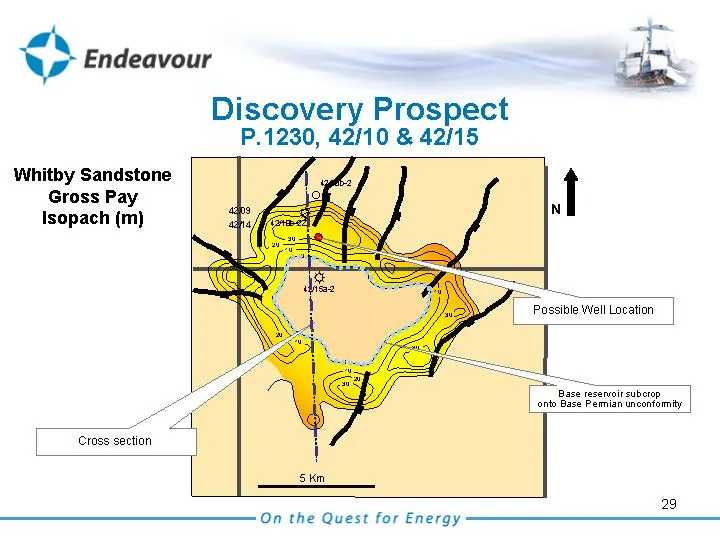
Slide 28: Discovery Prospect P.1230
Discovery Prospect P.1230, 42/10 & 42/15 Whitby Sandstone Gross Pay Isopach (m) Cross section Base reservoir subcrop onto Base Permian unconformity Possible Well Location
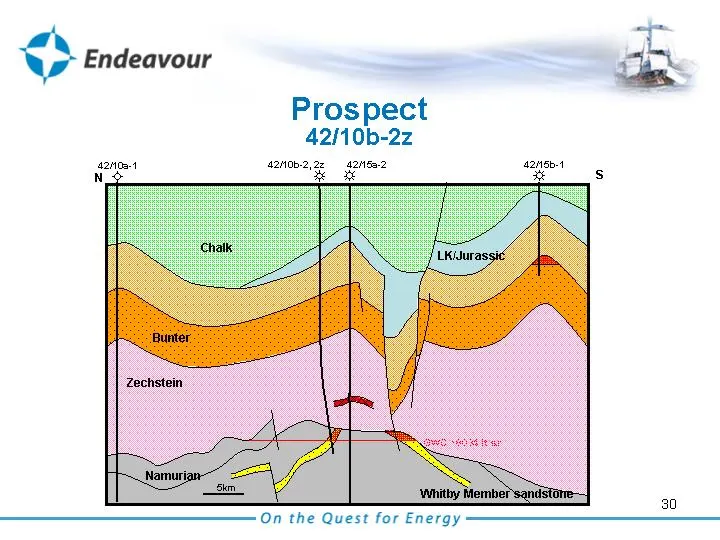
Slide 29: Prospect 42/10b-2z
Prospect 42/10b-2z GWC ~8034 ft ss 42/10b-2, 2z 42/15a-2 42/15b-1 42/10a-1 Bunter Chalk LK/Jurassic Zechstein Whitby Member sandstone Namurian 5km N S
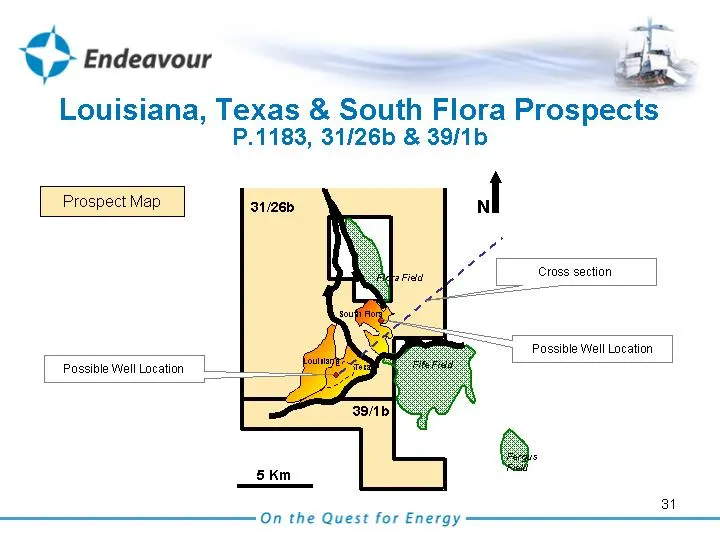
Slide 30: Louisiana, Texas & South Flora Prospects
Prospect Map Flora Field Fife Field Fergus Field Texas Louisiana 31/26b 39/1b 5 Km N South Flora Louisiana, Texas & South Flora Prospects P.1183, 31/26b & 39/1b Possible Well Location Possible Well Location Cross section
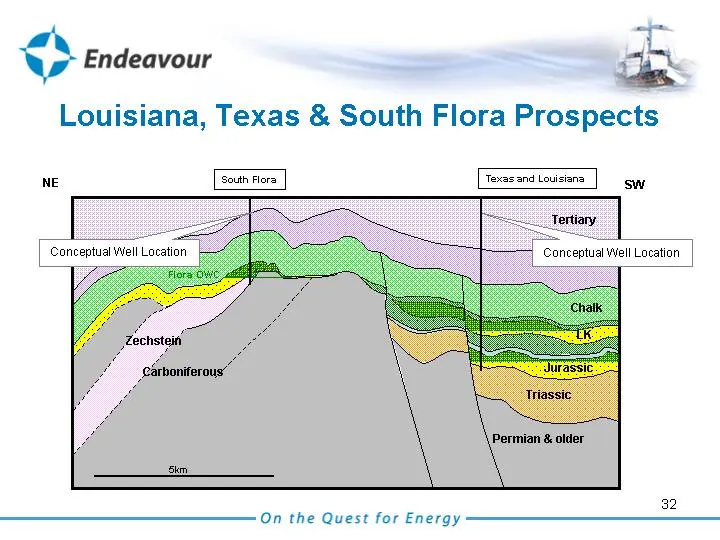
Slide 31: Louisiana, Texas & South Flora Prospects
NE SW 5km South Flora Texas and Louisiana Louisiana, Texas & South Flora Prospects Conceptual Well Location Conceptual Well Location
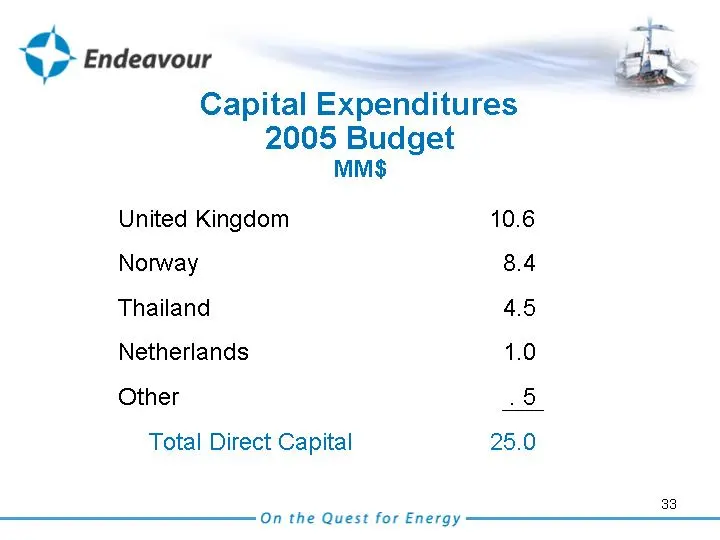
Slide 32: Capital Expenditures 2005 Budget
Capital Expenditures 2005 Budget MM$ United Kingdom 10.6 Norway 8.4 Thailand 4.5 Netherlands 1.0 Other . 5 Total Direct Capital 25.0
Slide 33: Endeavour Investment Summary
Endeavour Investment Summary Experienced and successful management team North Sea - focused strategy Potential to create significant growth and long-term value Attractive risk/reward profile
Slide 34: On the Quest for Energy
On the Quest for Energy 35
Source: SEC EDGAR · 8-K filed Feb 2, 2005
More decks from Endeavour International Corp
 Presentation (May 2015)5 slides · May 7, 2015
 Corporate Update (February 2015)23 slides · Feb 27, 2015
 Debt Investor Presentation (October 2014)16 slides · Oct 14, 2014
 Q2 2014 Earnings Presentation12 slides · Aug 5, 2014
 Proxy Contest (May 2014)45 slides · May 8, 2014
 Q1 2014 Earnings Presentation12 slides · May 7, 2014