Navistar International Corporation
Navistar International — Q1 2016 Earnings Presentation
31 slides from Navistar International's earnings presentation, Mar 8, 2016

Slide 1: Q1 2016 Earnings Presentation
Q1 2016 earnings presentation March 8, 2016 Exhibit 99.2
Slide 2: Safe Harbor Statement and Other Cautionary Notes
Safe Harbor Statement and Other Cautionary Notes Information provided and statements contained in this presentation that are not purely historical are forward-looking statements within the meaning of Section 27A of the Securities Act of 1933, as amended, Section 21E of the Securities Exchange Act of
Slide 3: Agenda
Agenda Overview Troy Clarke Financial Results Walter Borst Summary Troy Clarke
Slide 4: 1st Quarter 2016 Results
1st QUARTER 2016 RESULTS Troy Clarke, President & CEO
Slide 5: Q1 2016 Overview
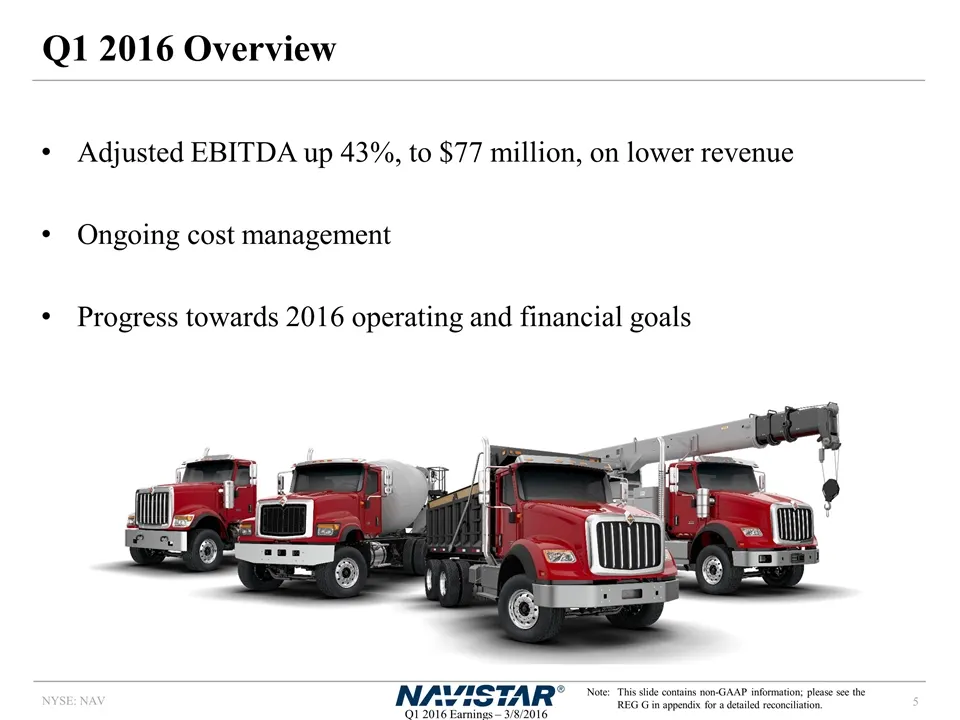
Adjusted EBITDA up 43%, to $77 million, on lower revenue Ongoing cost management Progress towards 2016 operating and financial goals Q1 2016 Overview Note:This slide contains non-GAAP information; please see the REG G in appendix for a detailed reconciliation.
Slide 6: Industry Outlook, Navistar Share
Maintain FY2016 industry outlook of 350,000-380,000 trucks and buses Navistar’s market share improved throughout the quarter Improved order share Industry Outlook, Navistar Share
Slide 7: Used Truck Inventory
Used truck inventory increased in Q1 Reflects industry-wide oversupply and slowdown in Navistar used sales More than halfway through expected MaxxForce receipts Project 2016 and 2017 receipts will be lower than 2014 and 2015 Used Truck Inventory
Slide 8: Investments to Drive Future Market Share
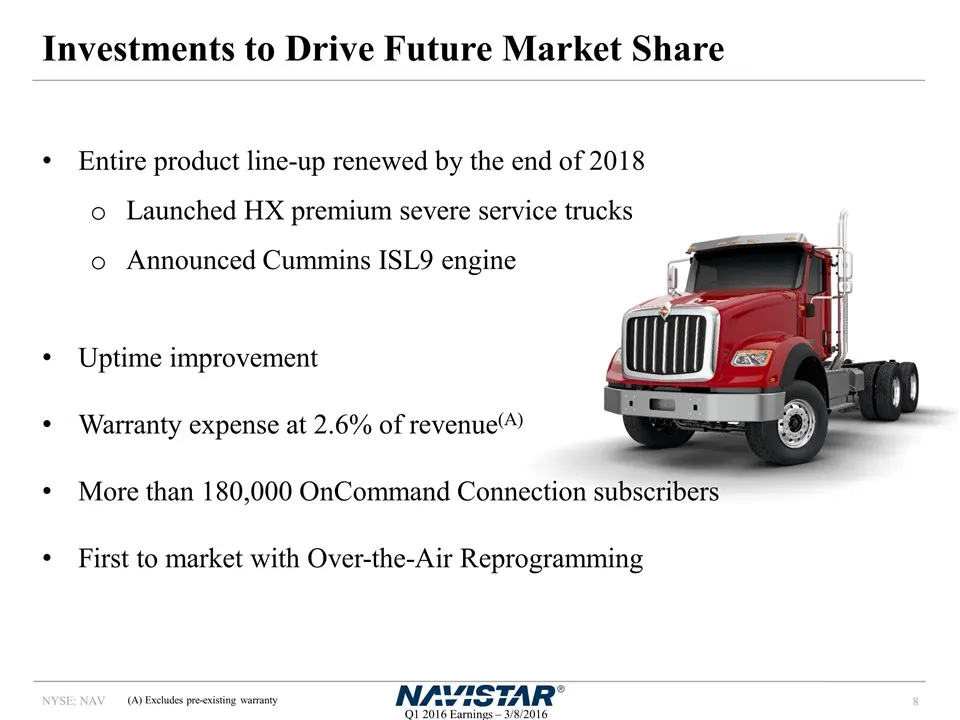
Entire product line-up renewed by the end of 2018 Launched HX premium severe service trucks Announced Cummins ISL9 engine Uptime improvement Warranty expense at 2.6% of revenue(A) More than 180,000 OnCommand Connection subscribers First to market with Over-the-Air Reprogramming Investments to Drive
Slide 9: Financial Results
FINANCIAL RESULTS Walter Borst, Executive Vice President & CFO
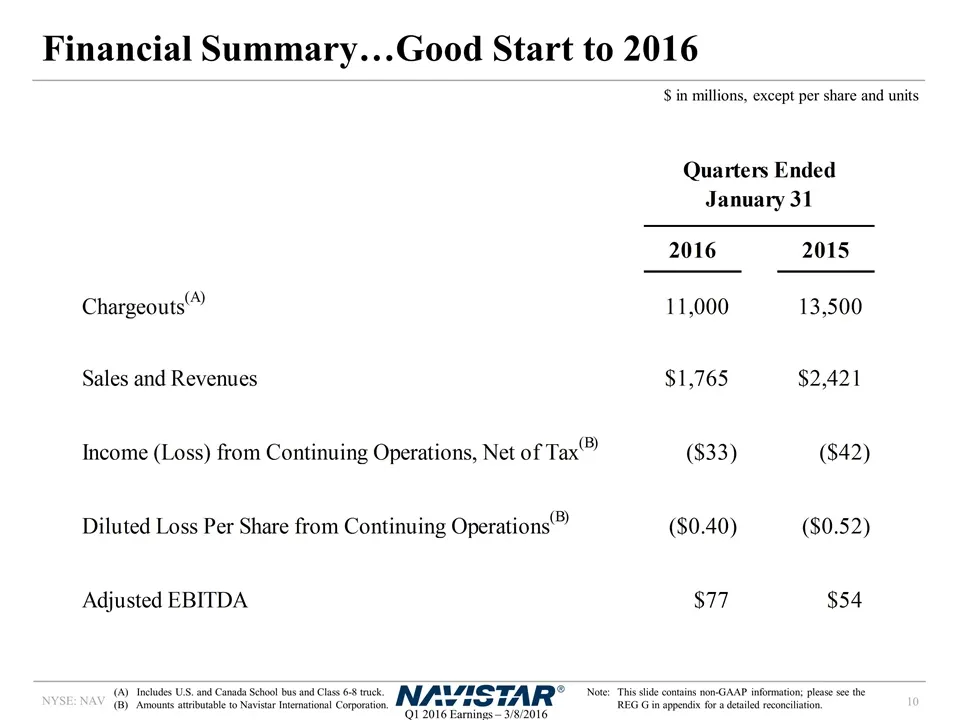
Slide 10: Financial Summary…Good Start to 2016
Financial Summary…Good Start to 2016 Note:This slide contains non-GAAP information; please see the REG G in appendix for a detailed reconciliation. (A) Includes U.S. and Canada School bus and Class 6-8 truck. (B) Amounts attributable to Navistar International Corporation. $ in millions, except per s
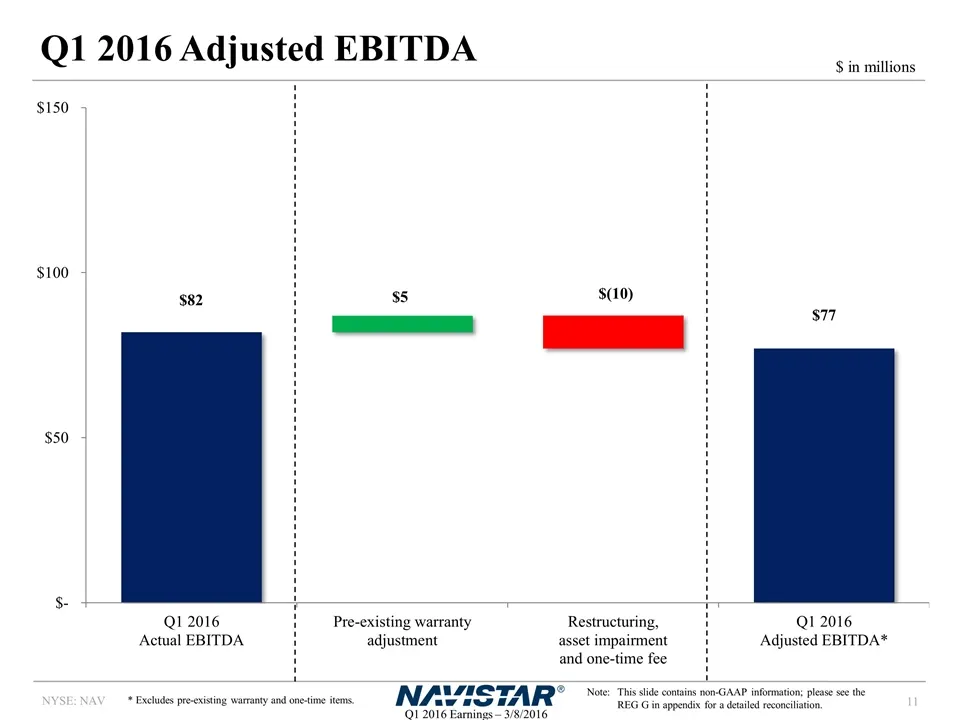
Slide 11: Q1 2016 Adjusted EBITDA
Q1 2016 Adjusted EBITDA $ in millions Note:This slide contains non-GAAP information; please see the REG G in appendix for a detailed reconciliation. * Excludes pre-existing warranty and one-time items.
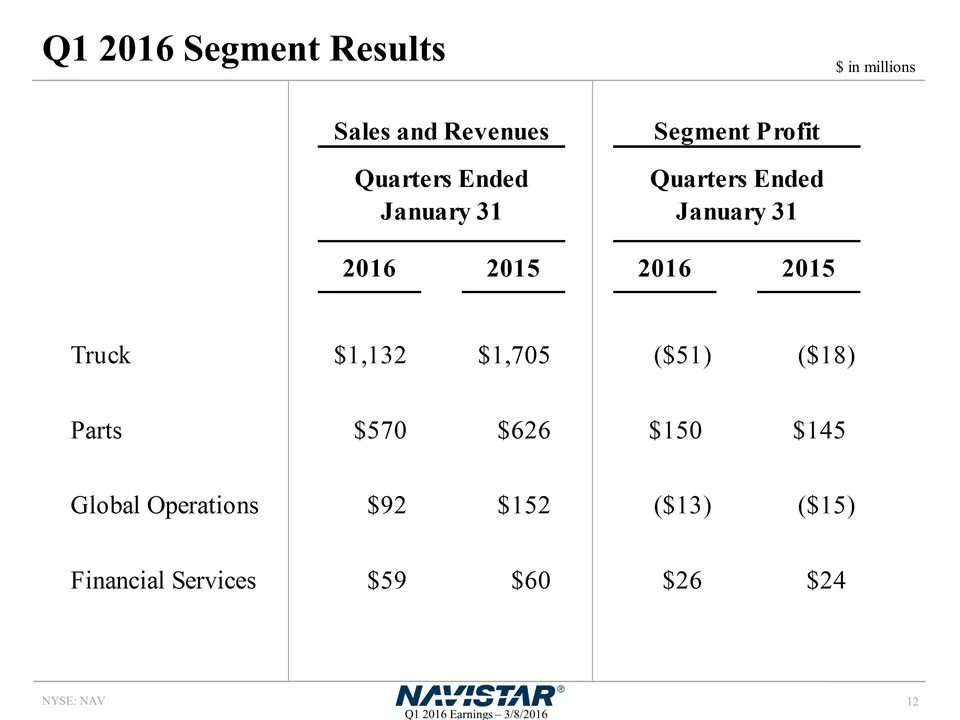
Slide 12: Q1 2016 Segment Results
Q1 2016 Segment Results $ in millions Sales and Revenues Segment Profit Quarters Ended January 31 Quarters Ended January 31 2016 2015 2016 2015 Truck $1,132 $1,705 $-51 $-18 Parts $570 $626 $150 $145 Global Operations $92 $152 $-13 $-15 Financial Services $59 $60 $26 $24
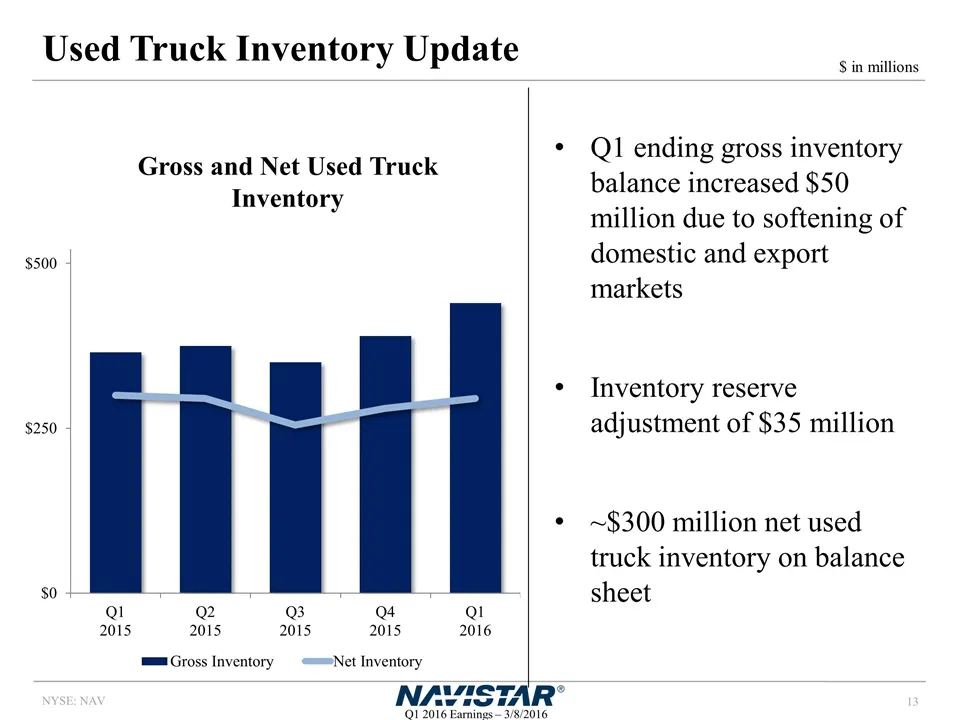
Slide 13: Used Truck Inventory Update
Used Truck Inventory Update Q1 ending gross inventory balance increased $50 million due to softening of domestic and export markets Inventory reserve adjustment of $35 million ~$300 million net used truck inventory on balance sheet Gross and Net Used Truck Inventory $ in millions
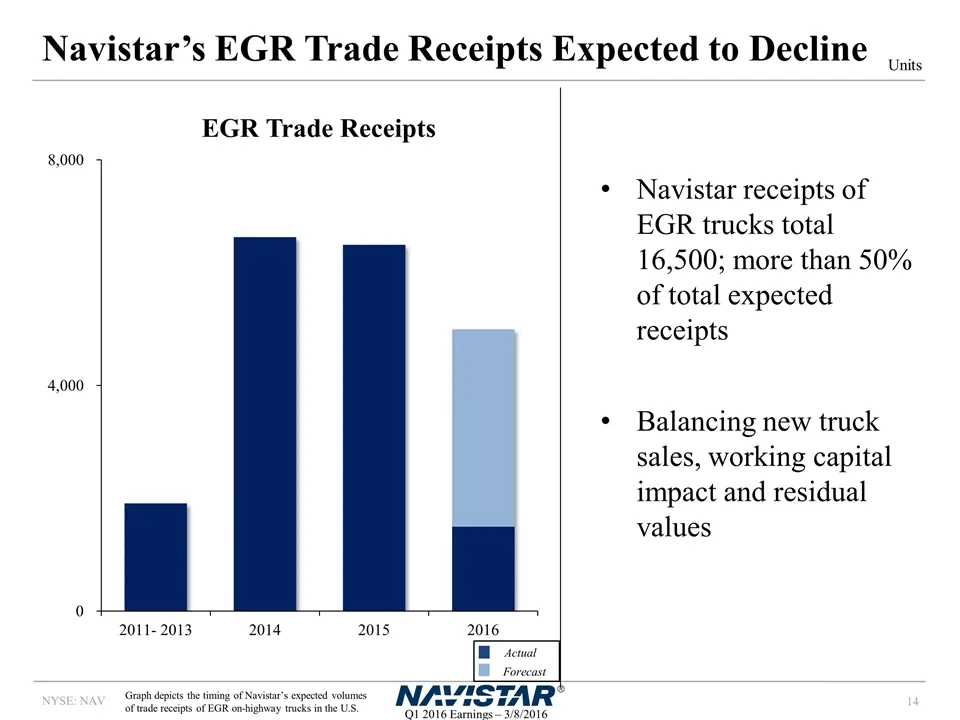
Slide 14: Navistar's EGR Trade Receipts Expected to Decline
Navistar’s EGR Trade Receipts Expected to Decline Navistar receipts of EGR trucks total 16,500; more than 50% of total expected receipts Balancing new truck sales, working capital impact and residual values EGR Trade Receipts Actual Forecast Units Graph depicts the timing of Navistar’s expected volu
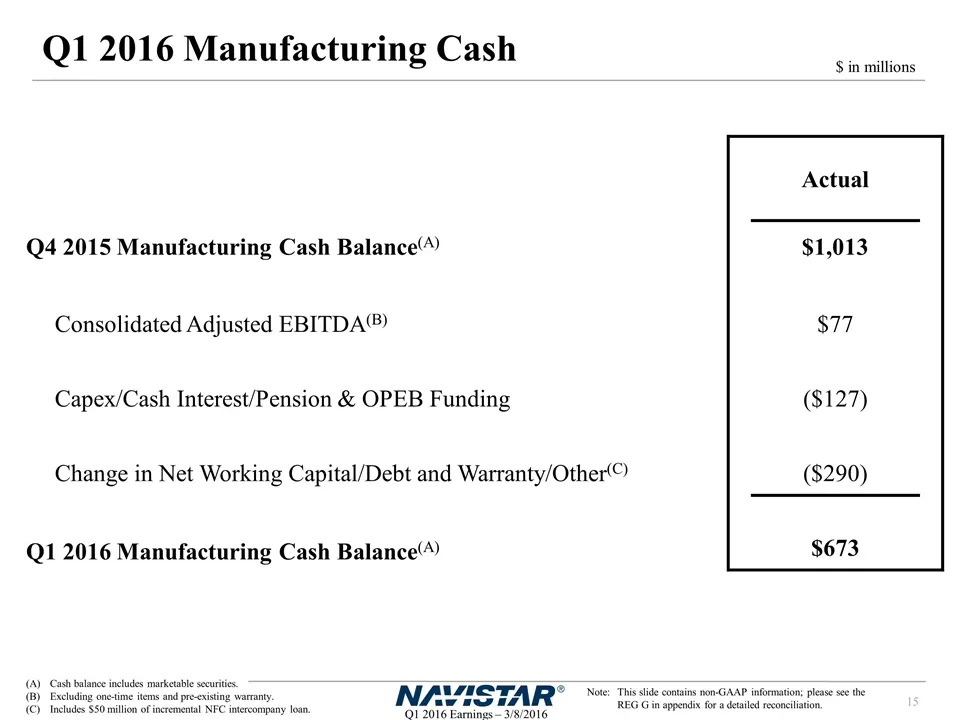
Slide 15: Q1 2016 Manufacturing Cash
Q1 2016 Manufacturing Cash $ in millions Note:This slide contains non-GAAP information; please see the REG G in appendix for a detailed reconciliation. Cash balance includes marketable securities. Excluding one-time items and pre-existing warranty. Includes $50 million of incremental NFC intercompan
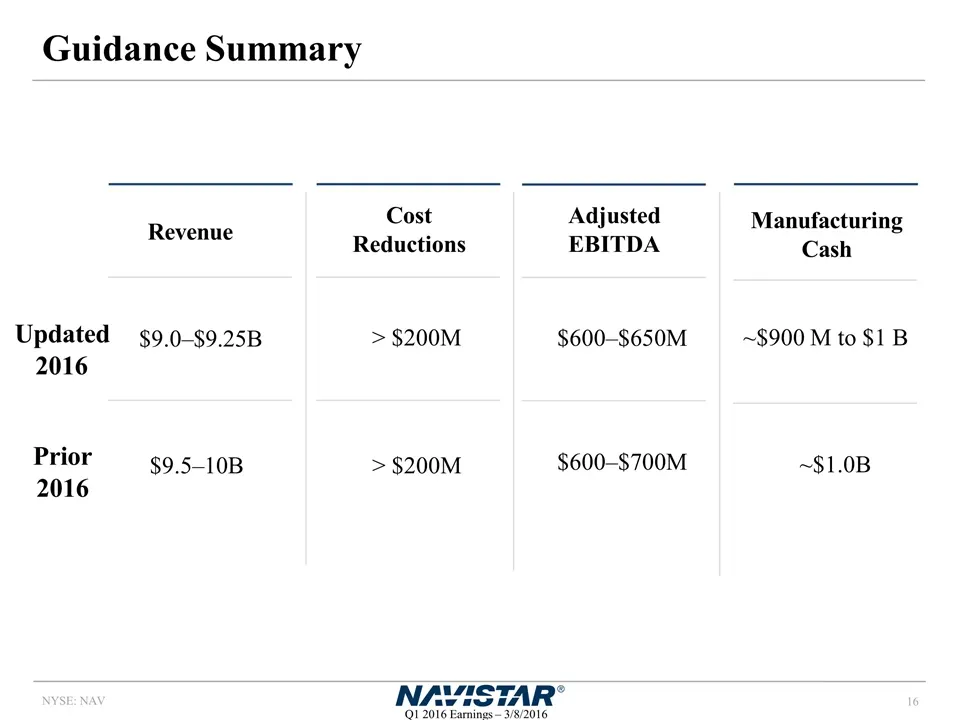
Slide 16: Guidance Summary
Guidance Summary Cost Reductions Adjusted EBITDA $9.0–$9.25B Updated 2016 $600–$650M > $200M ~$900 M to $1 B Revenue Manufacturing Cash $9.5–10B $600–$700M > $200M ~$1.0B Prior 2016
Slide 17: Summary
Summary Troy Clarke, President & CEO
Slide 18: Summary
Summary Demonstrated ability to… Manage and optimize costs Bring exciting products to market Improve Parts business Strengthen our dealer network Well-positioned to achieve 2016 full-year profitability and positive manufacturing free cash flow
Slide 19: Appendix
APPENDIX NAYVISTAR’
Slide 20: Navistar Financial Corporation Highlights
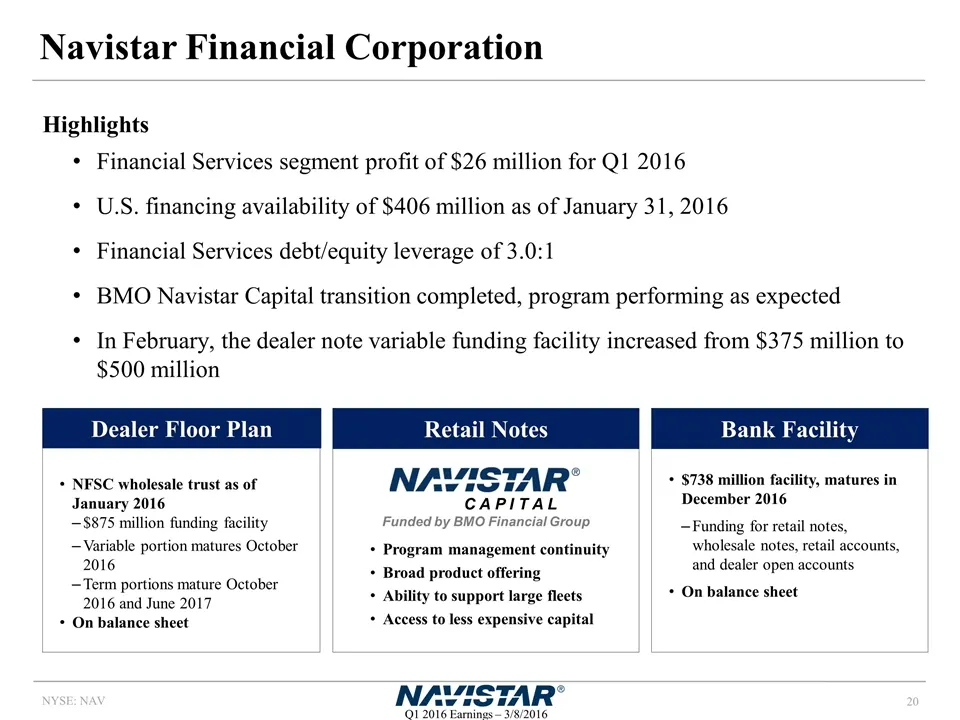
Navistar Financial Corporation Highlights Financial Services segment profit of $26 million for Q1 2016 U.S. financing availability of $406 million as of January 31, 2016 Financial Services debt/equity leverage of 3.0:1 BMO Navistar Capital transition completed, program performing as expected In Febr
Slide 21: Retail Market Share in Commercial Vehicle Segments
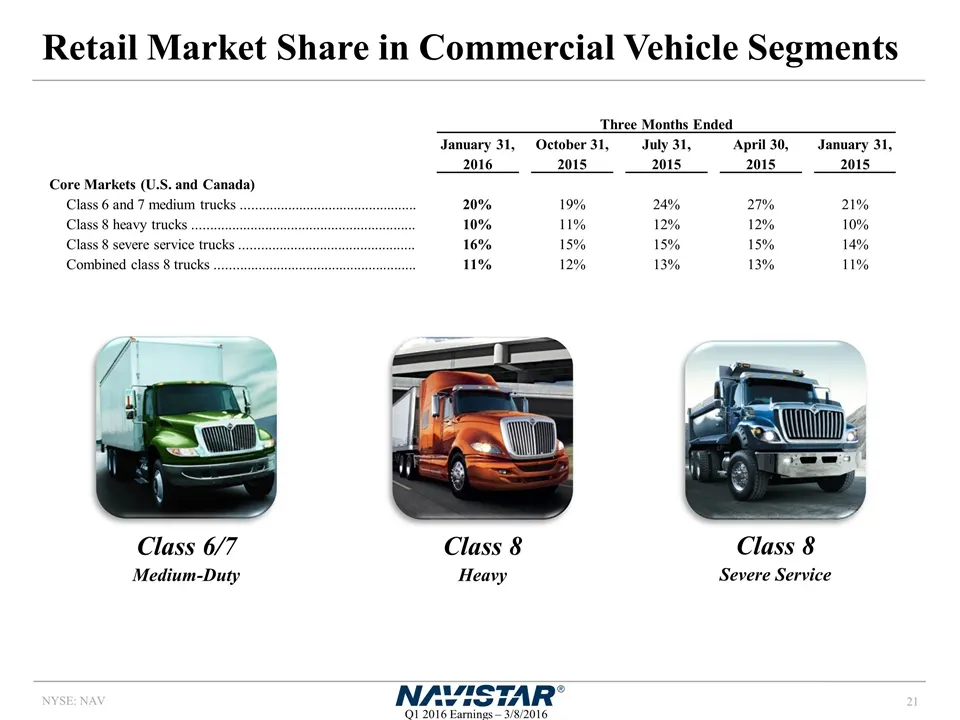
Retail Market Share in Commercial Vehicle Segments Class 6/7 Medium-Duty Class 8 Severe Service Class 8 Heavy Three Months Ended January 31, October 31, July 31, April 30, January 31, 2016 2015 2015 2015 2015 Core Markets (U.S. and Canada) Class 6 and 7 medium trucks ................................
Slide 22: Worldwide Truck Chargeouts
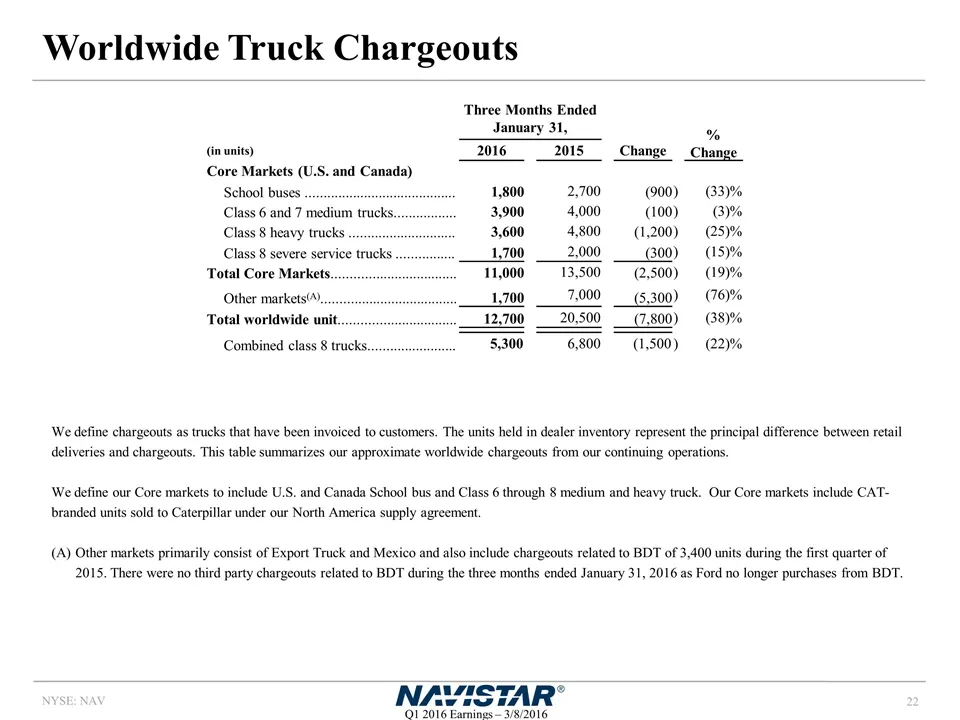
Worldwide Truck Chargeouts We define chargeouts as trucks that have been invoiced to customers. The units held in dealer inventory represent the principal difference between retail deliveries and chargeouts. This table summarizes our approximate worldwide chargeouts from our continuing operations. W
Slide 23: U.S. and Canada Dealer Stock Inventory
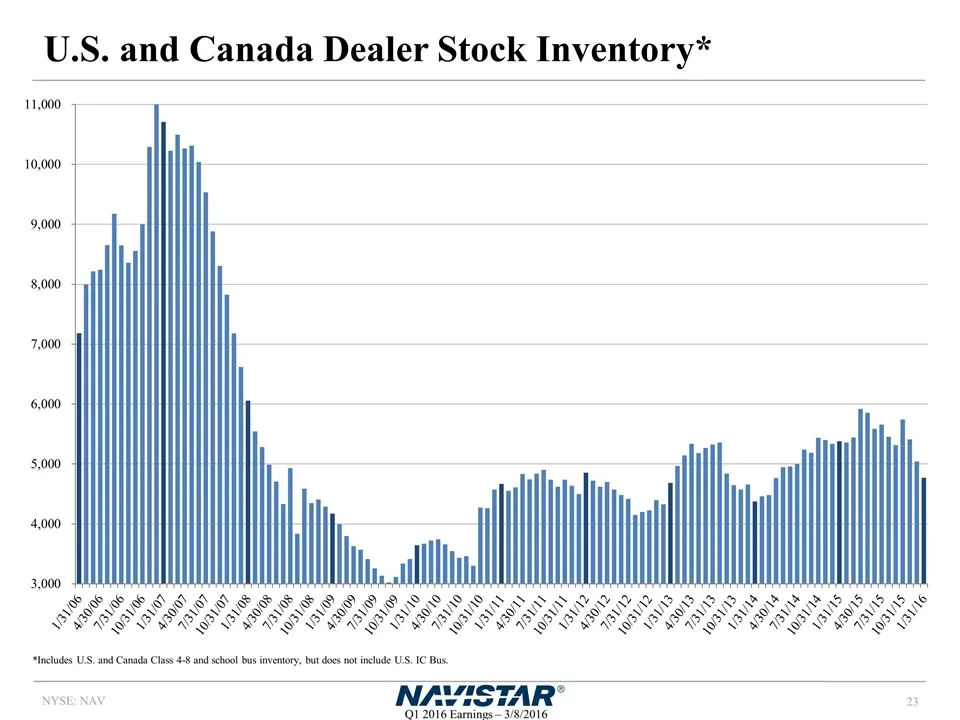
U.S. and Canada Dealer Stock Inventory* *Includes U.S. and Canada Class 4-8 and school bus inventory, but does not include U.S. IC Bus.
Slide 24: Frequently Asked Questions
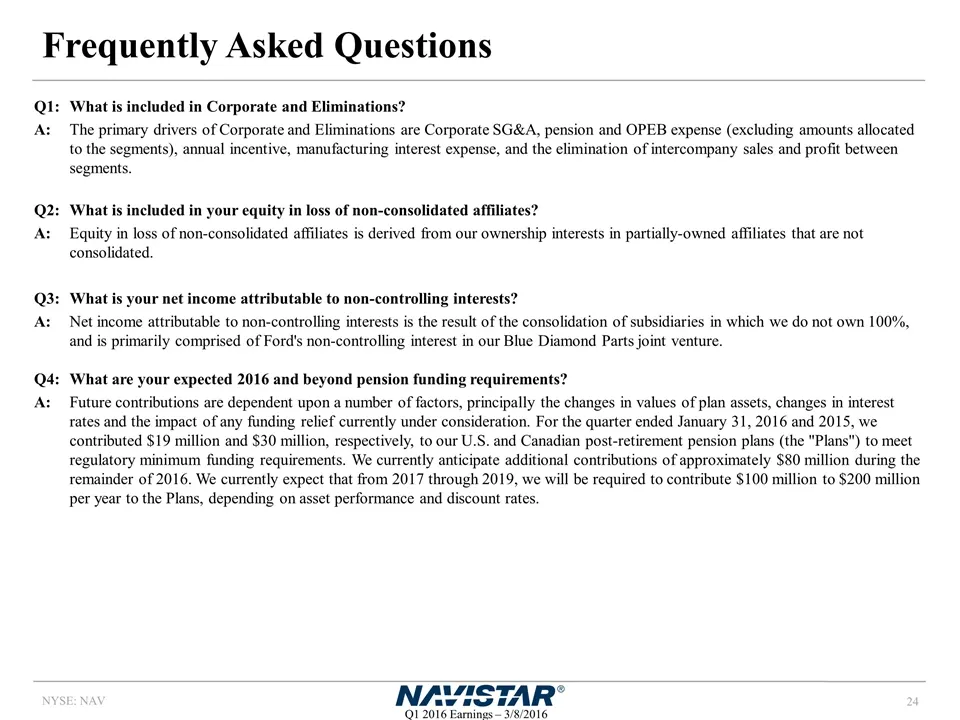
Frequently Asked Questions Q1: What is included in Corporate and Eliminations? A:The primary drivers of Corporate and Eliminations are Corporate SG&A, pension and OPEB expense (excluding amounts allocated to the segments), annual incentive, manufacturing interest expense, and the elimination of inte
Slide 25: Frequently Asked Questions
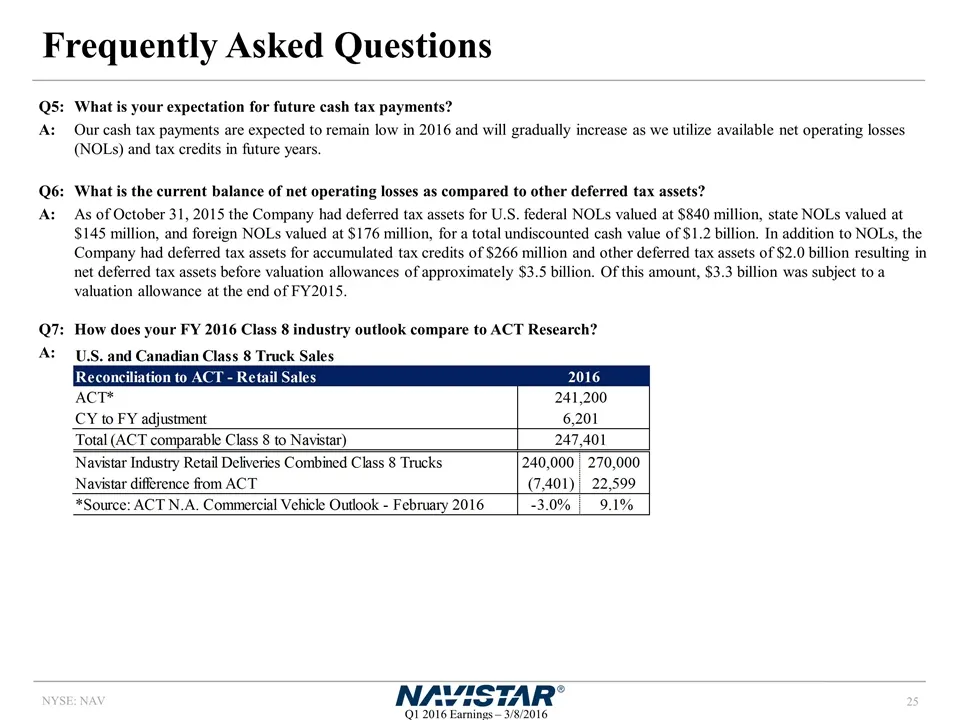
Frequently Asked Questions Q5:What is your expectation for future cash tax payments? A:Our cash tax payments are expected to remain low in 2016 and will gradually increase as we utilize available net operating losses (NOLs) and tax credits in future years. Q6:What is the current balance of net opera
Slide 26: Frequently Asked Questions
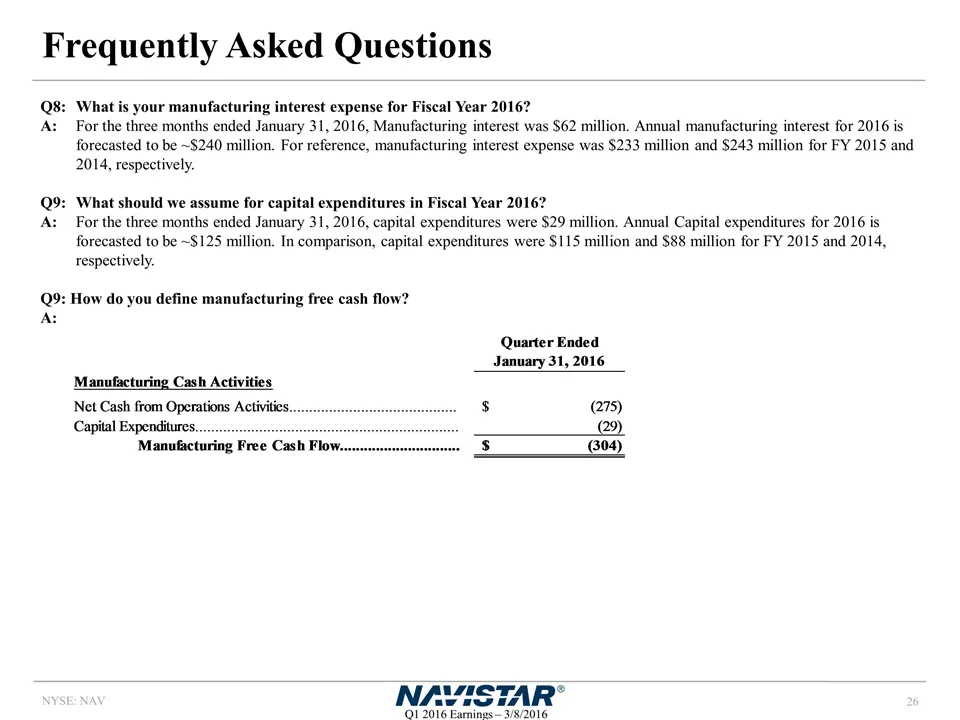
Frequently Asked Questions Q8: What is your manufacturing interest expense for Fiscal Year 2016? A: For the three months ended January 31, 2016, Manufacturing interest was $62 million. Annual manufacturing interest for 2016 is forecasted to be ~$240 million. For reference, manufacturing interest exp
Slide 27: Outstanding Debt Balances
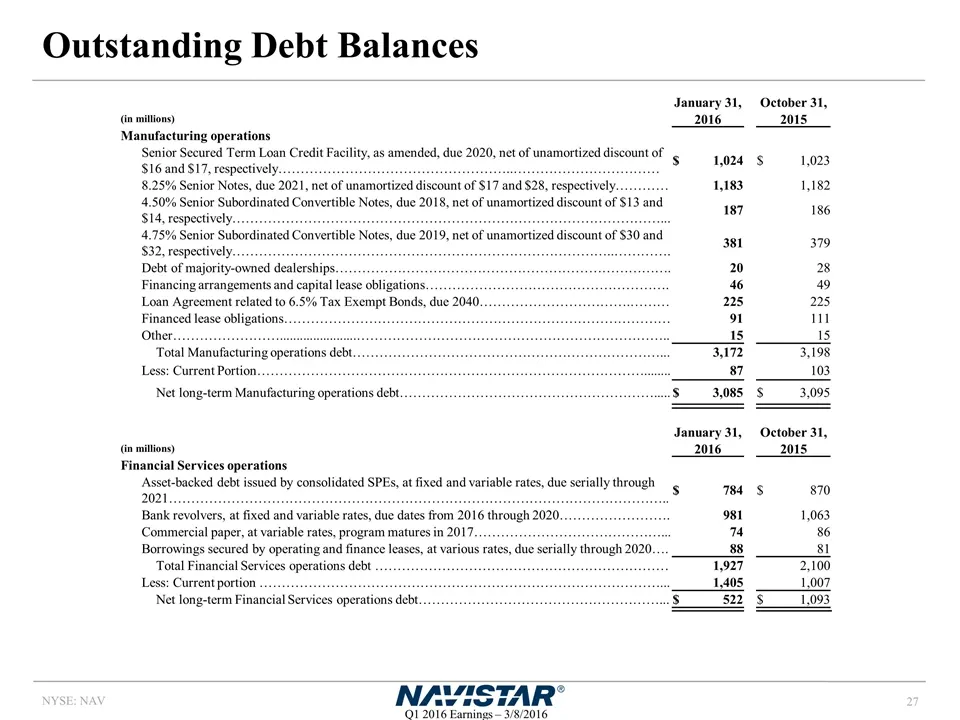
Outstanding Debt Balances January 31, October 31, (in millions) 2016 2015 Manufacturing operations Senior Secured Term Loan Credit Facility, as amended, due 2020, net of unamortized discount of $16 and $17, respectively……………………………………………..…………………………… $ 1,024 $ 1,023 8.25% Senior Notes, due 2021, net
Slide 28: SEC Regulation G Non-GAAP Reconciliation
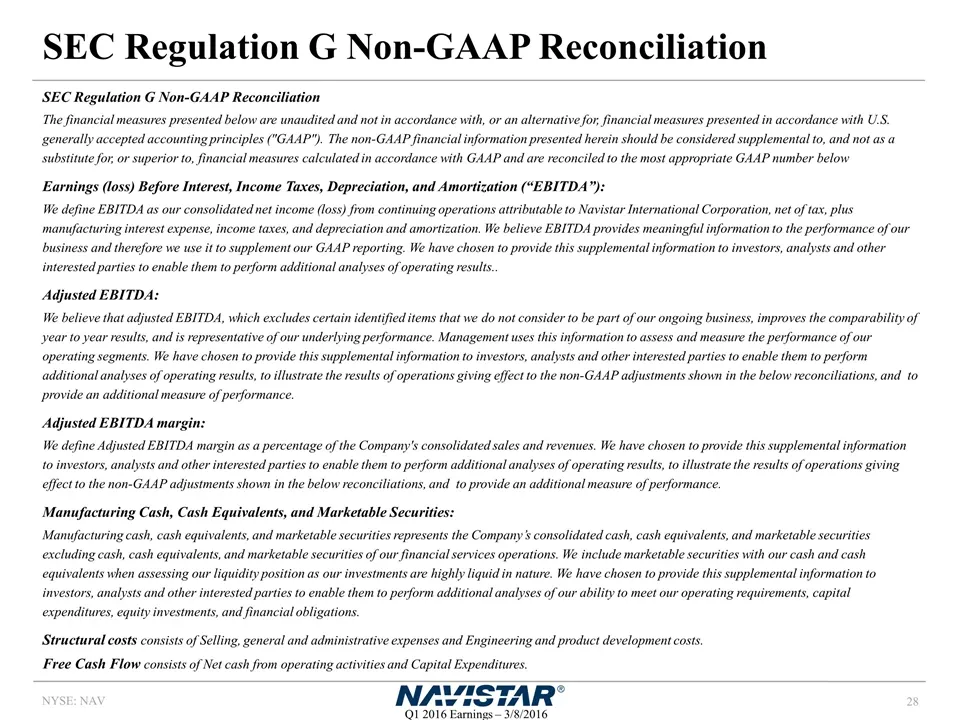
SEC Regulation G Non-GAAP Reconciliation SEC Regulation G Non-GAAP Reconciliation The financial measures presented below are unaudited and not in accordance with, or an alternative for, financial measures presented in accordance with U.S. generally accepted accounting principles ("GAAP"). The non-GA
Slide 29: SEC Regulation G Non-GAAP Reconciliations
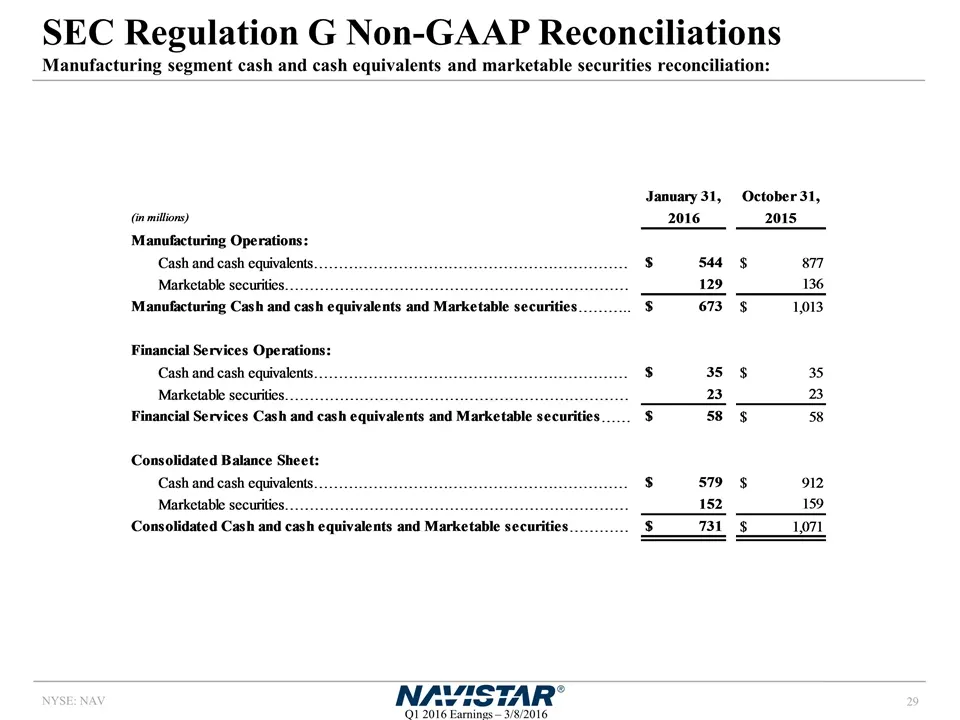
SEC Regulation G Non-GAAP Reconciliations Manufacturing segment cash and cash equivalents and marketable securities reconciliation: January 31, October 31, April 30, January 31, October 31, (in millions) 2016 2015 2015 2015 2014 Manufacturing Operations: Cash and cash equivalents……………………………………………………
Slide 30: SEC Regulation G Non-GAAP Reconciliations
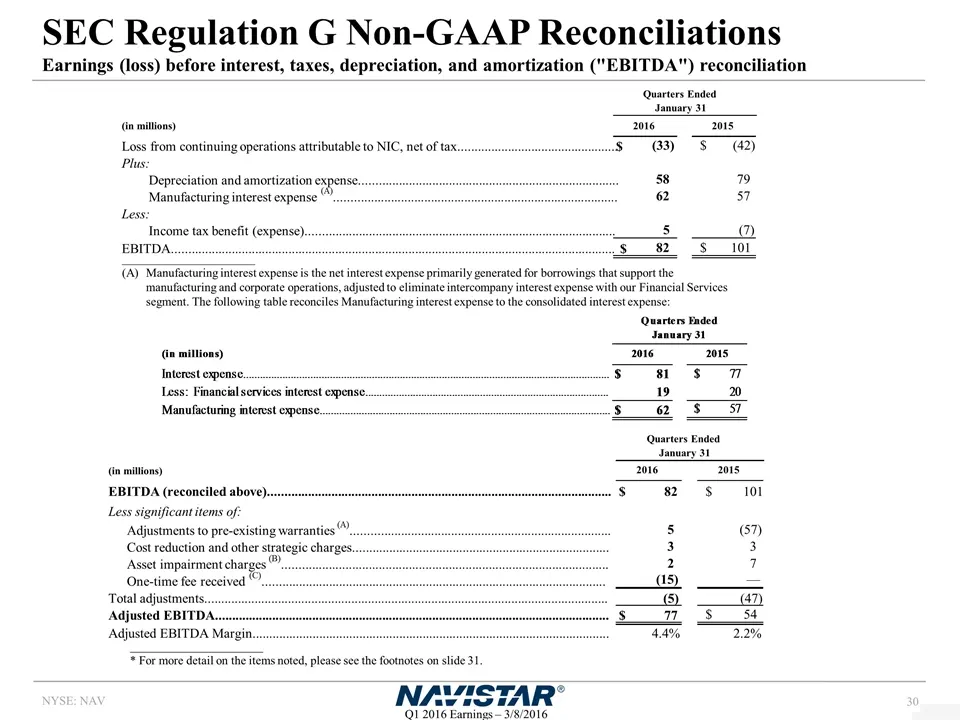
SEC Regulation G Non-GAAP Reconciliations Earnings (loss) before interest, taxes, depreciation, and amortization ("EBITDA") reconciliation ______________________ (A) Manufacturing interest expense is the net interest expense primarily generated for borrowings that support the manufacturing and corpo
Slide 31: Significant Items Included Within Our Results
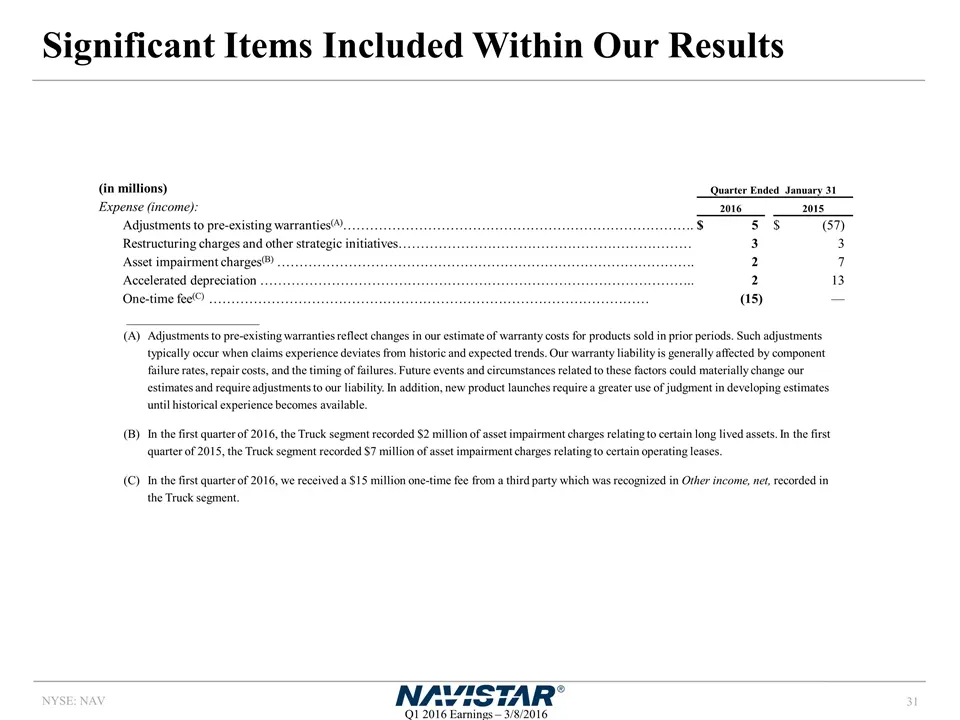
Significant Items Included Within Our Results Quarter Ended January 31 (in millions) Expense (income): 2016 2015 Adjustments to pre-existing warranties(A)……………………………………………………………………. $ 5 $ (57) Restructuring charges and other strategic initiatives………………………………………………………… 3 3 Asset impairment charges(B)
Source: SEC EDGAR · 8-K filed Mar 8, 2016
More decks from Navistar International Corporation
 Q2 2021 Earnings Presentation20 slides · Jun 8, 2021
 Q1 2021 Earnings Presentation20 slides · Mar 9, 2021
 Q4 2020 Earnings Presentation22 slides · Dec 17, 2020
 Q3 2020 Earnings Presentation21 slides · Sep 9, 2020
 Q2 2020 Earnings Presentation21 slides · Jun 4, 2020
 Q1 2020 Earnings Presentation21 slides · Mar 4, 2020