Rudolph Technologies — Investor Presentation (May 2012)
21 slides from Rudolph Technologies's investor presentation, May 30, 2012
Slide 1: Investor Presentation
RUDOLPH TECHNOLOGIES ess. Contro! Investor Presentation Paul McLaughlin, Chairman & CEO Steven Roth, CFO May 2012
Slide 2: Safe Harbor Statement
Safe Harbor Statement This presentation contains forward-looking statements within the meaning of the Private Securities Litigation Reform Act of 1995 (the “Act”) which include the benefit to customers of Rudolph’s products and customer service, business momentum and future growth, Rudolph’s ability
Slide 3: Rudolph Technologies Markets
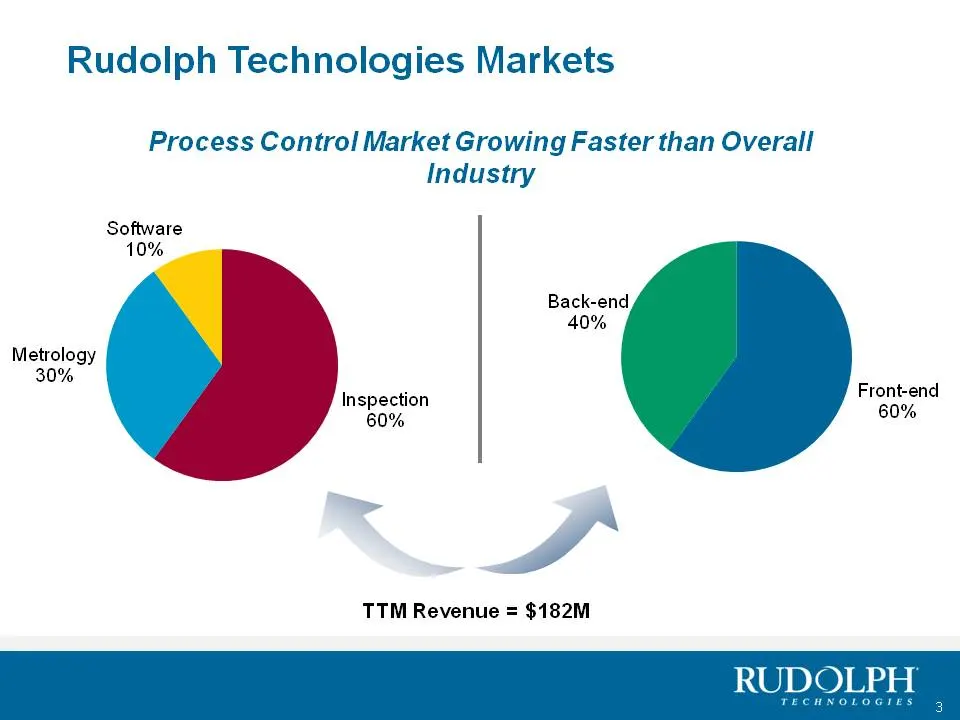
Rudolph Technologies Markets Process Control Market Growing Faster than Overall Industry Software Metrology 30% Ins} i Front-end pection 60% 60% TTM Revenue = $182M
Slide 4: Evolution — Building, Diversifying & Growing
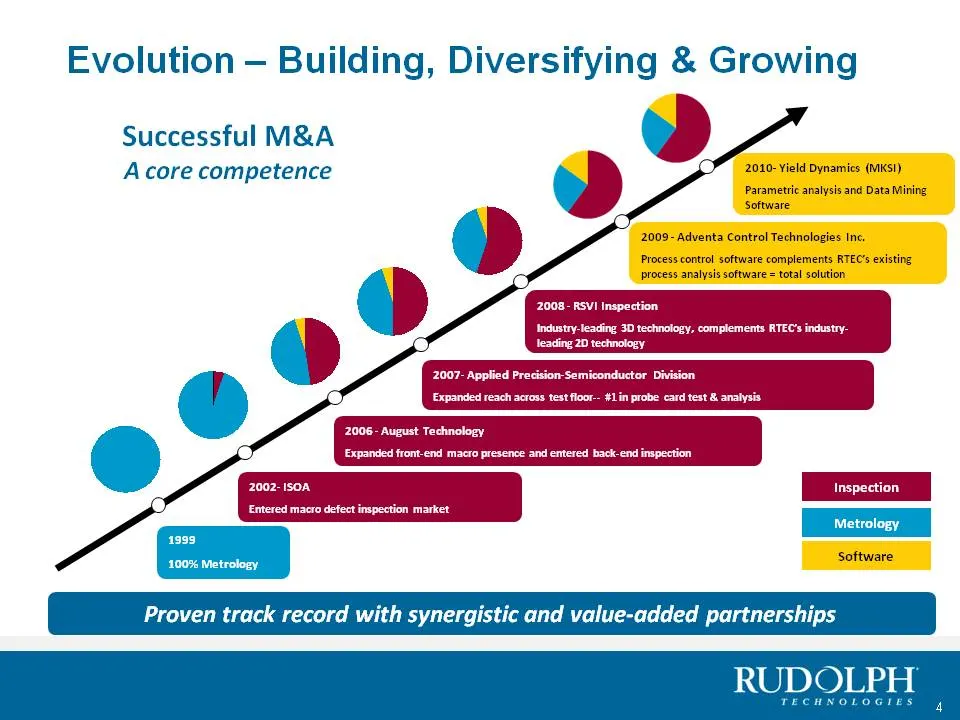
Evolution — Building, Diversifying & Growing Successful M&A 7 4 ] Acore competence ? ae 2010- Yield Dynamics (MKS!) Parametric analysis and Data Mining Software trol Technol are complem | Seles Proven track record with synergistic and value-added partnerships
Slide 5: Rudolph Organic Growth Strategy
Rudolph Organic Growth Strategy + Making continued R&D investments to assure RTEC is: — Well positioned across technology inflections: — Front end node changes at key customers — Back end advanced packaging solutions — Positioning itself for future market share growth * Conducting Joint Development
Slide 6: Rudolph Inorganic Growth Strategy
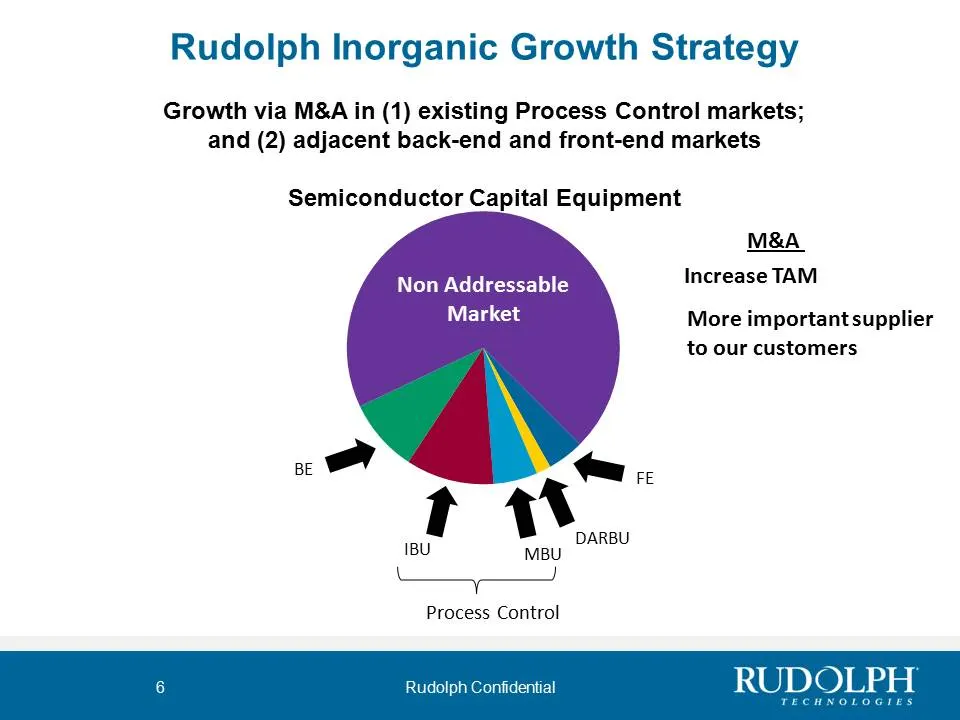
Rudolph Inorganic Growth Strategy Growth via M&A in (1) existing Process Control markets; and (2) adjacent back-end and front-end markets Semiconductor Capital Equipment M&A Non Addressable Increase TAM Market More important supplier to our customers ri. IBU MBU. UW, Process Control
Slide 7: How big is the opportunity in Back-End
How big is the opportunity in Back-End Advanced Packaging is very BIG for Rudolph | will demonstrate
Slide 8: Advanced Packaging = Target Rich Market for RTEC
Advanced Packaging = Target Rich Market for RTEC « Wafer Level Packaging (WLP) is reaching an inflection point: — Challenges of scaling are evident as I/O density increases. « WLP allows greater number of chip-to-chip connections and is becoming necessary at the leading edge of Advanced Packaging.
Slide 9: Rudolph Vision
Rudolph Vision
Slide 10: Rudolph Technologies Vision
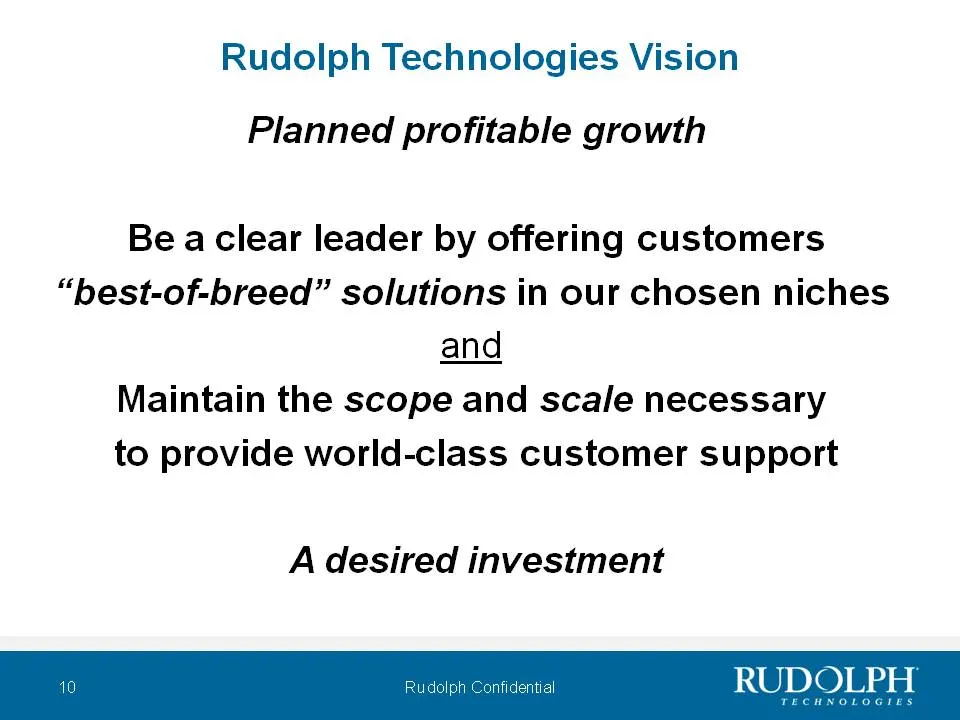
Rudolph Technologies Vision Planned profitable growth Be aclear leader by offering customers “best-of-breed” solutions in our chosen niches and Maintain the scope and scale necessary to provide world-class customer support A desired investment
Slide 11: Global Presence with Local Support
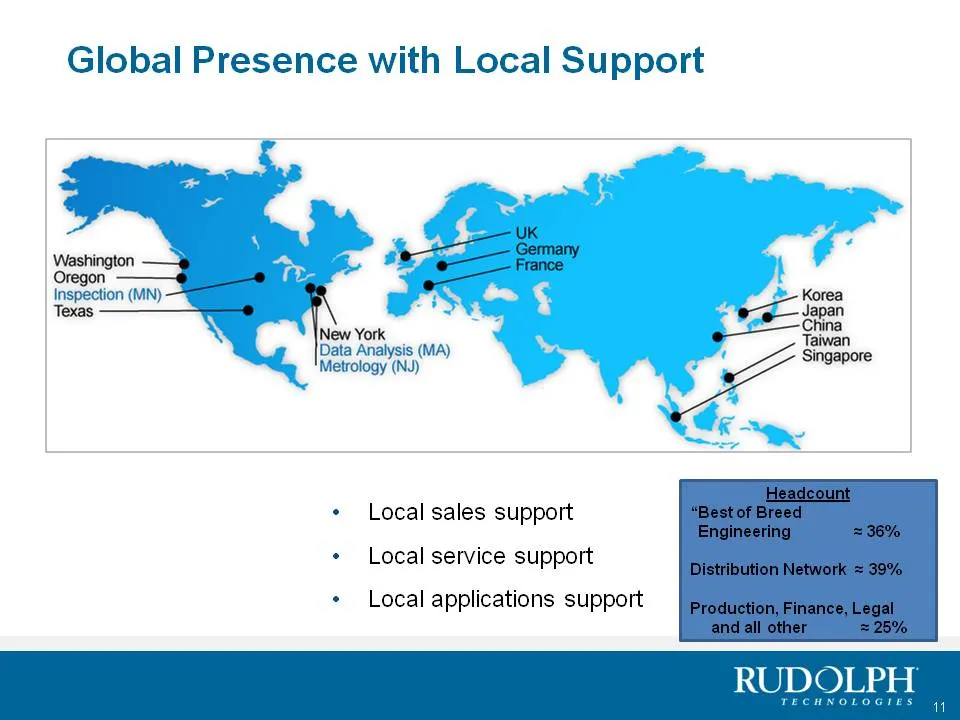
Global Presence with Local Support Oregon Inspection (MN) Texas New York. Data Analysis (MA) Metrology (NJ) + Local sales support + Local service support + Local applications support
Slide 12: Our Markets and Market Share
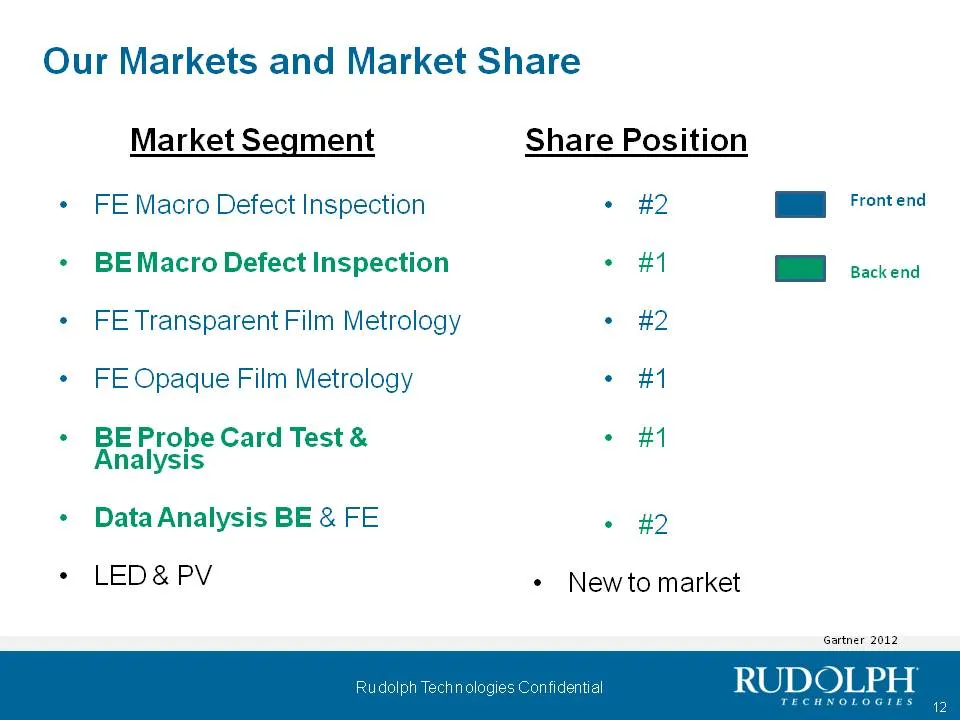
Our Markets and Market Share Market Segment Share Position + FE Macro Defect Inspection ° #2 HS Frontend * BEMacro Defect Inspection ° #1 HH osackend ¢ FE Transparent Film Metrology « #2 * FE Opaque Film Metrology . #1 . Rae Card Test & ° #1 + DataAnalysis BE & FE . #2 + LED& PV + Newto market Gartn
Slide 13: What are the Key Drivers for Rudolph Today?
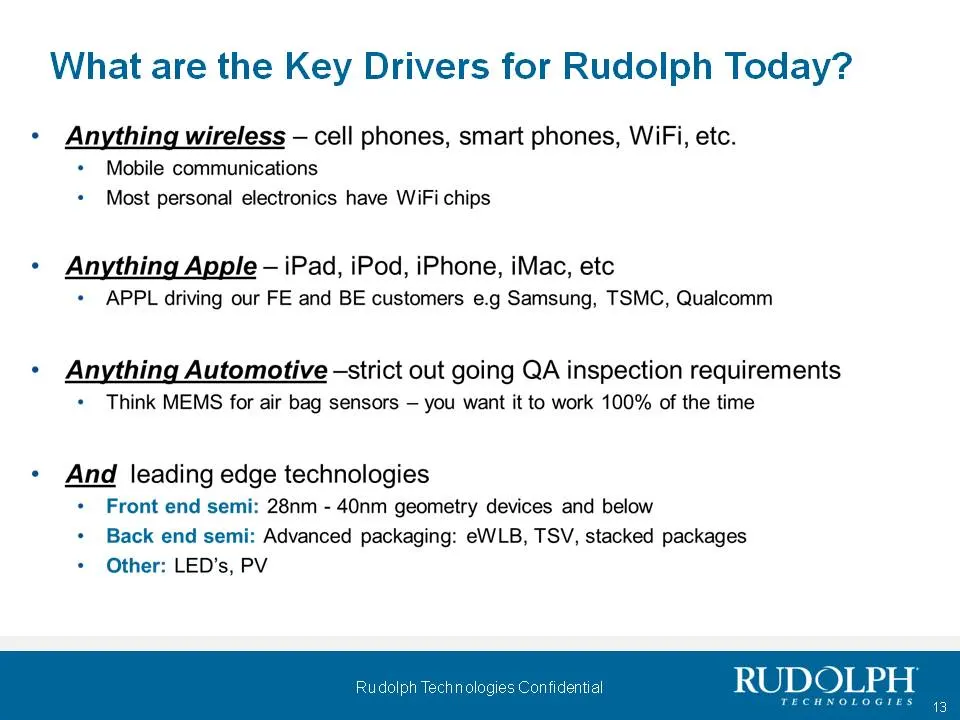
What are the Key Drivers for Rudolph Today? Anything wireless — cell phones, smart phones, WiFi, etc. + Mobile communications + Most personal electronics have WiFi chips Anything Apple — iPad, iPod, iPhone, iMac, etc + APPL driving our FE and BE customers e.g Samsung, TSMC, Qualcomm Anything Automot
Slide 14: Financial Summary
Financial Summary
Slide 15: Structured for Earnings Leverage
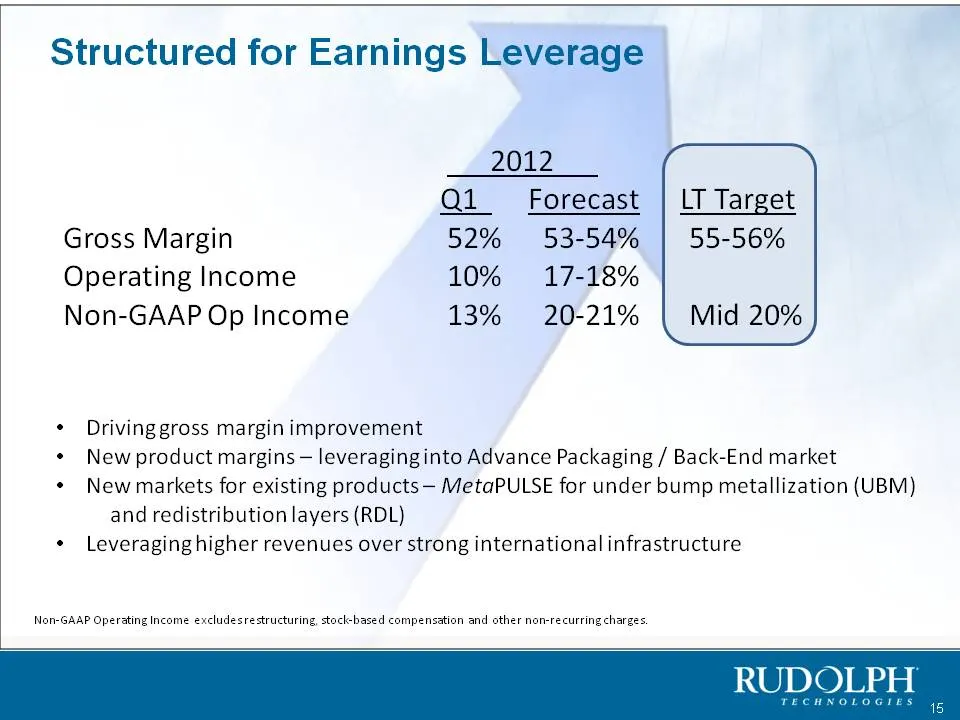
Structured for Earnings Leverage 2012 Ql Forecast | LT Target Gross Margin 52% 53-54% | 55-56% Operating Income 10% 17-18% Non-GAAP Op Income 13% 20-21% | Mid 20% * Drivinggross margin improvement * New product margins — leveraginginto Advance Packaging / Back-End market * New markets for existing p
Slide 16: 2012 Accelerating Growth
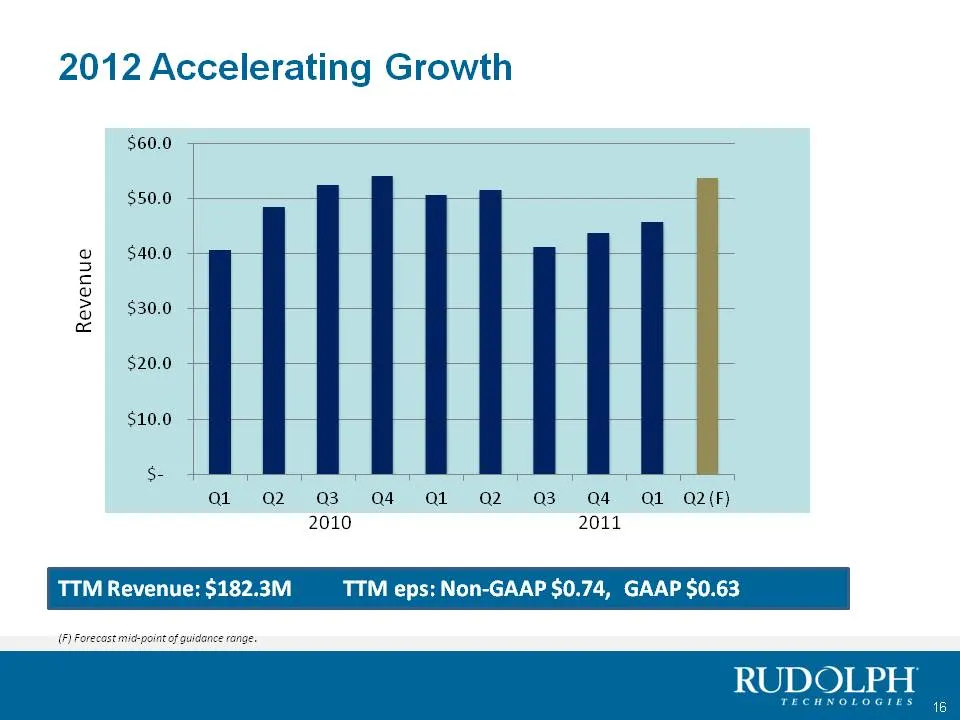
2012 Accelerating Growth $60.0 $50.0 $40.0 $30.0 - $20.0 - $10.0 - Se Q2 a4 a3 a4 at aie) Zan 2011 TTM Revenue: $182.3M TTM eps: Non-GAAP $0.74, GAAP $0.63 (F) Forecast mickpoint of guidance range, Revenue
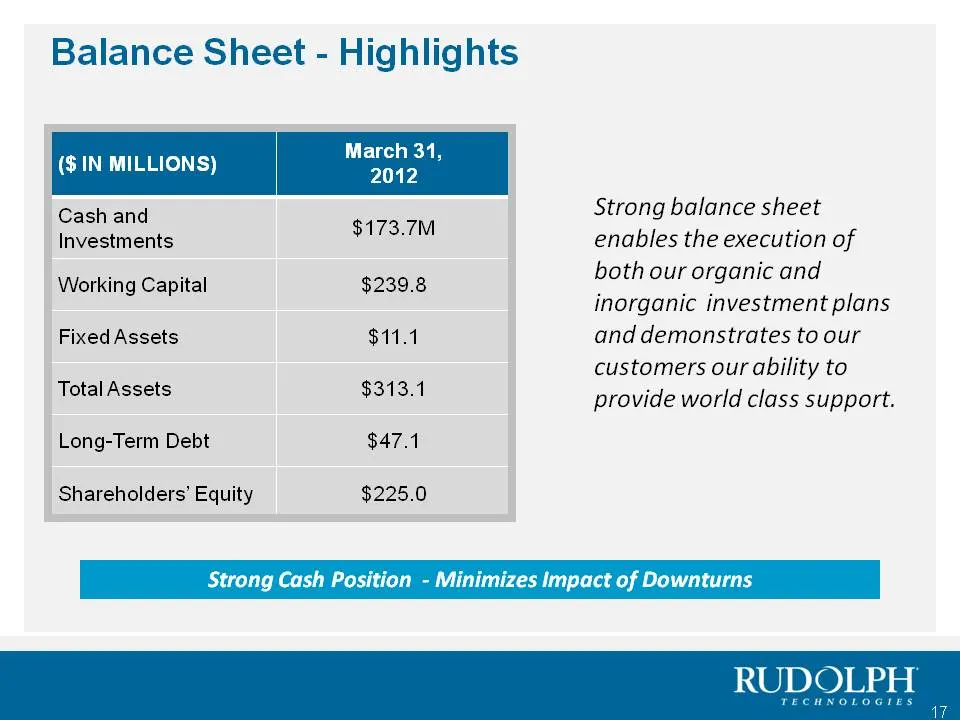
Slide 17: Balance Sheet - Highlights
Balance Sheet - Highlights Cash and | Investments CHAN) Working Capital $239.8 Fixed Assets $11.1 Total Assets $313.1 Long-Term Debt $47.1 Shareholders’ Equity $225.0 evs Strong balance sheet enables the execution of both our organic and inorganic investment plans and demonstrates to our customers o
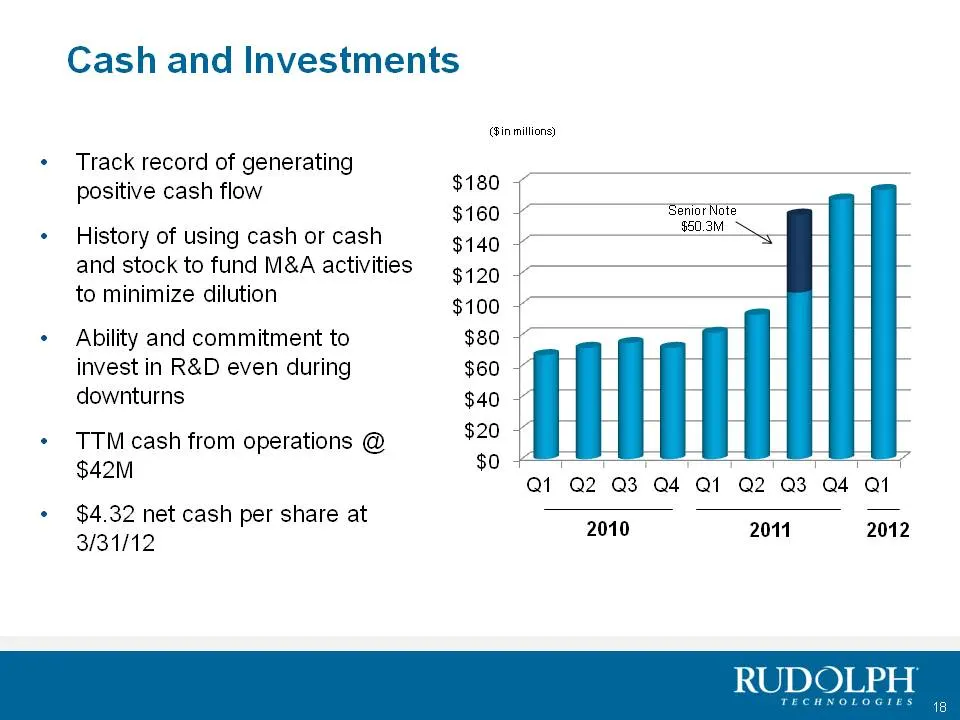
Slide 18: Cash and Investments
Cash and Investments (Bin millions) + Track record of generating positive cash flow $180 $160 senior Note + History of using cash or cash $140 and stock to fund M&A activities $120 to minimize dilution $100 + Ability and commitment to $80 invest in R&D even during $60 downturns $40 $20 * TTMcash fro
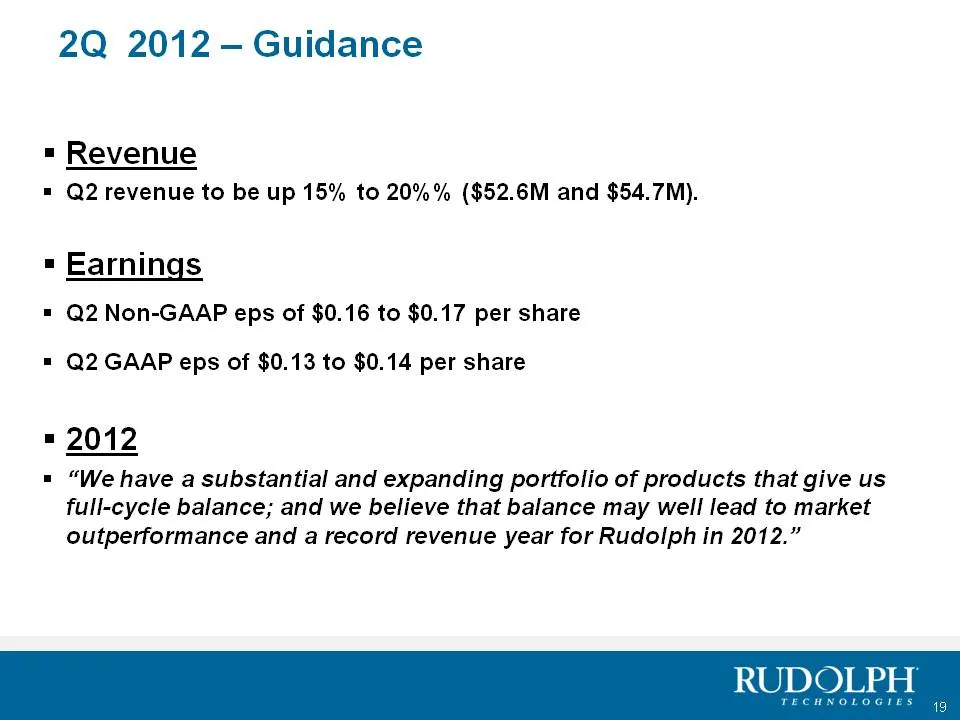
Slide 19: 2Q 2012 — Guidance
2Q 2012 — Guidance = Revenue = Q2 revenue to be up 15% to 20%% ($52.6M and $54.7M). « Earnings = Q2 Non-GAAP eps of $0.16 to $0.17 per share = Q2 GAAP eps of $0.13 to $0.14 per share = 2012 = “We have a substantial and expanding portfolio of products that give us full-cycle balance; and we believe t
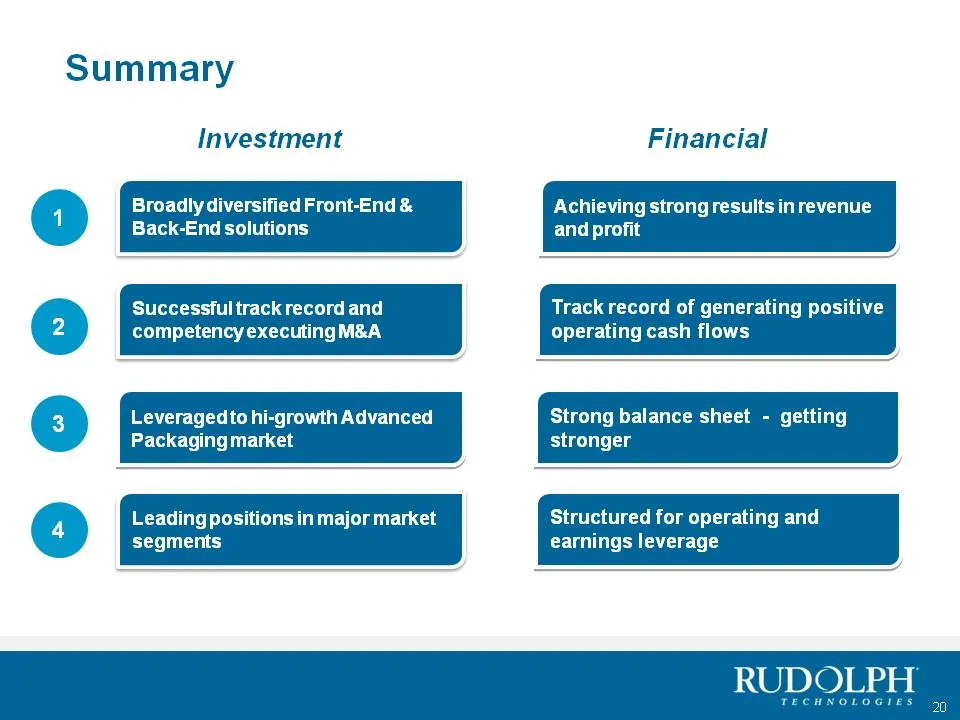
Slide 20: Summary
Summary Investment Financial ) Broadly diversified Front-End & Achieving strong results inrevenue Back-End solutions and profit Successful track record and Track record of generating positive ) competency executingM&A operating cash flows @ Leveragedto hi-growth Advanced Strong balance sheet - getti
Slide 21: Thank You
RUDOLPH TECHNOLOGIES Process. Control. Yield. Thank You
Source: SEC EDGAR · 8-K filed May 30, 2012
More decks from Rudolph Technologies Inc
 Merger or Acquisition (June 2019)12 slides · Jun 24, 2019
 Merger or Acquisition (June 2019)18 slides · Jun 24, 2019
 Investor Day (September 2017)79 slides · Sep 14, 2017
 Shareholder Meeting (May 2015)32 slides · May 22, 2015
 Investor Presentation (February 2015)13 slides · Feb 4, 2015
 Investor Day (February 2015)13 slides · Feb 4, 2015