Westpac Banking Corporation · ASX:WBC
Westpac Banking — Debt Investor Presentation (August 2022)
25 slides from Westpac Banking's debt investor presentation, August 2022
Slide 1: Westpac Banking Corporation Fixed Income Investor Presentation
Westpac Banking Corporation Fixed Income Investor Presentation August 2022 WESTPAC BANKING CORPORATION ABN 33 007 457 141 Fix. Simplify. Perform.
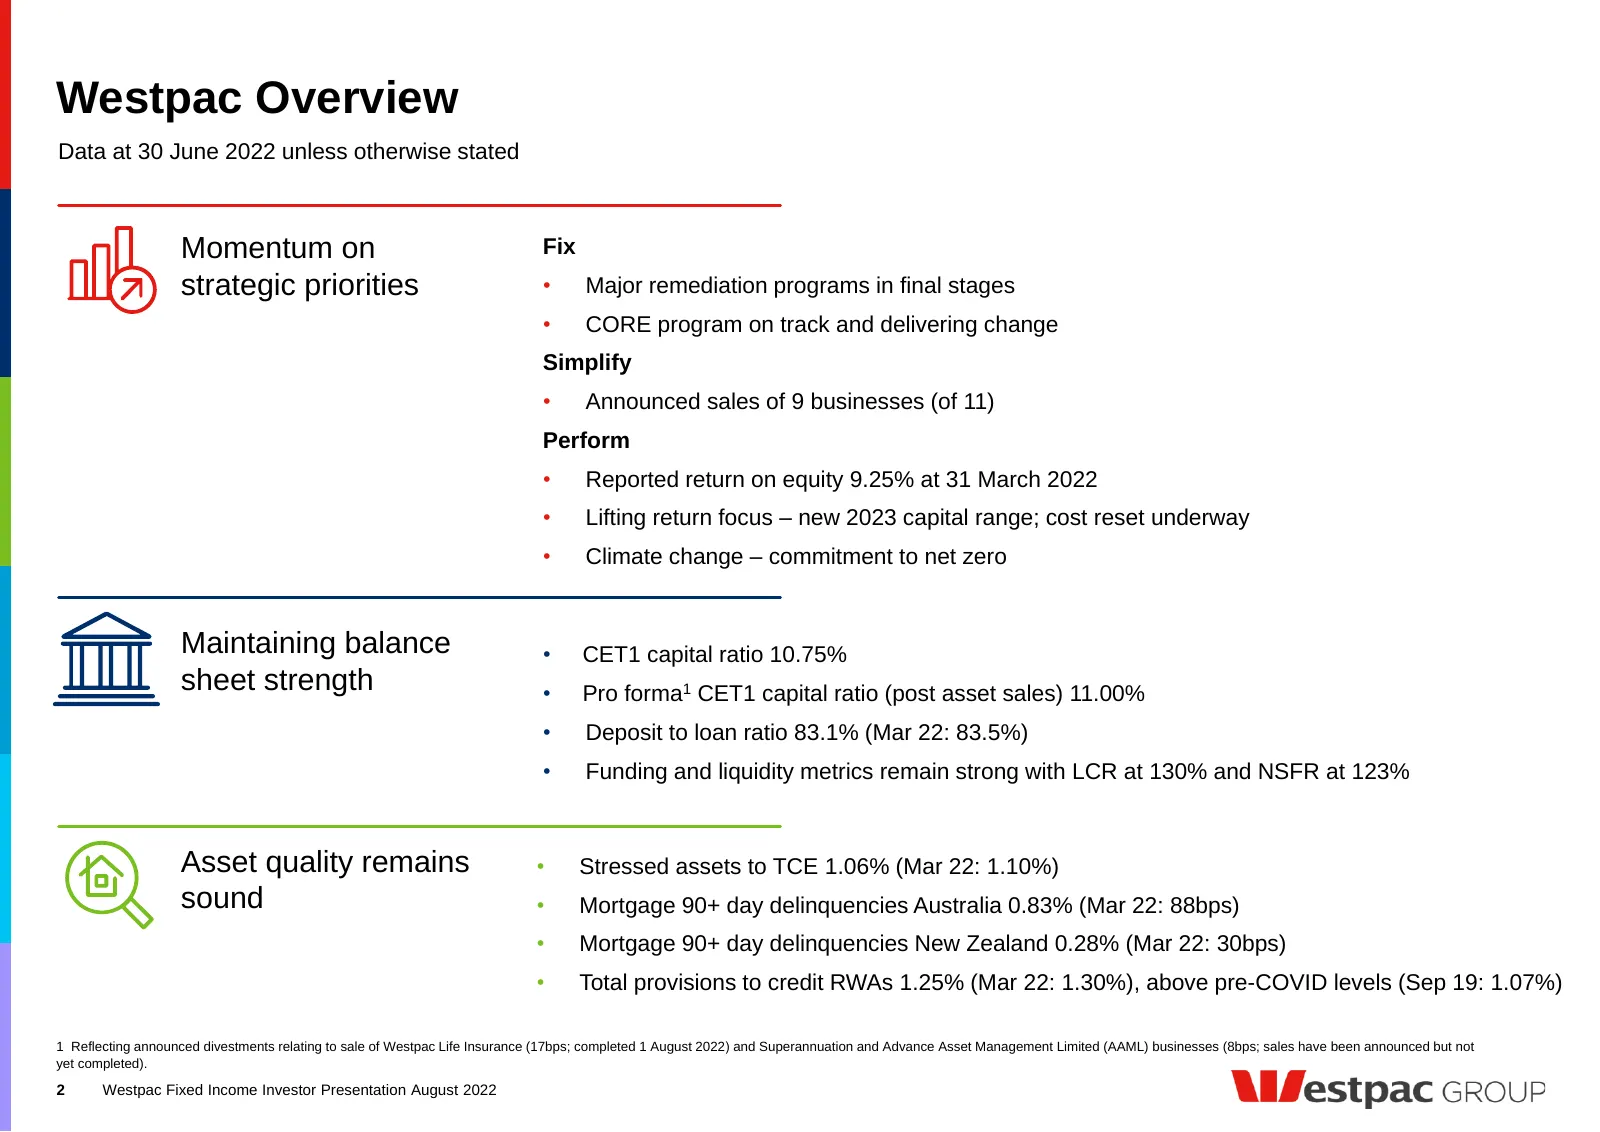
Slide 2: Westpac Overview
Westpac Overview Data at 30 June 2022 unless otherwise stated Momentum on Fix strategic priorities • Major remediation programs in final stages • CORE program on track and delivering change Simplify • Announced sales of 9 businesses (of 11) Perform • Reported return on equity 9.25% at 31 March 2022
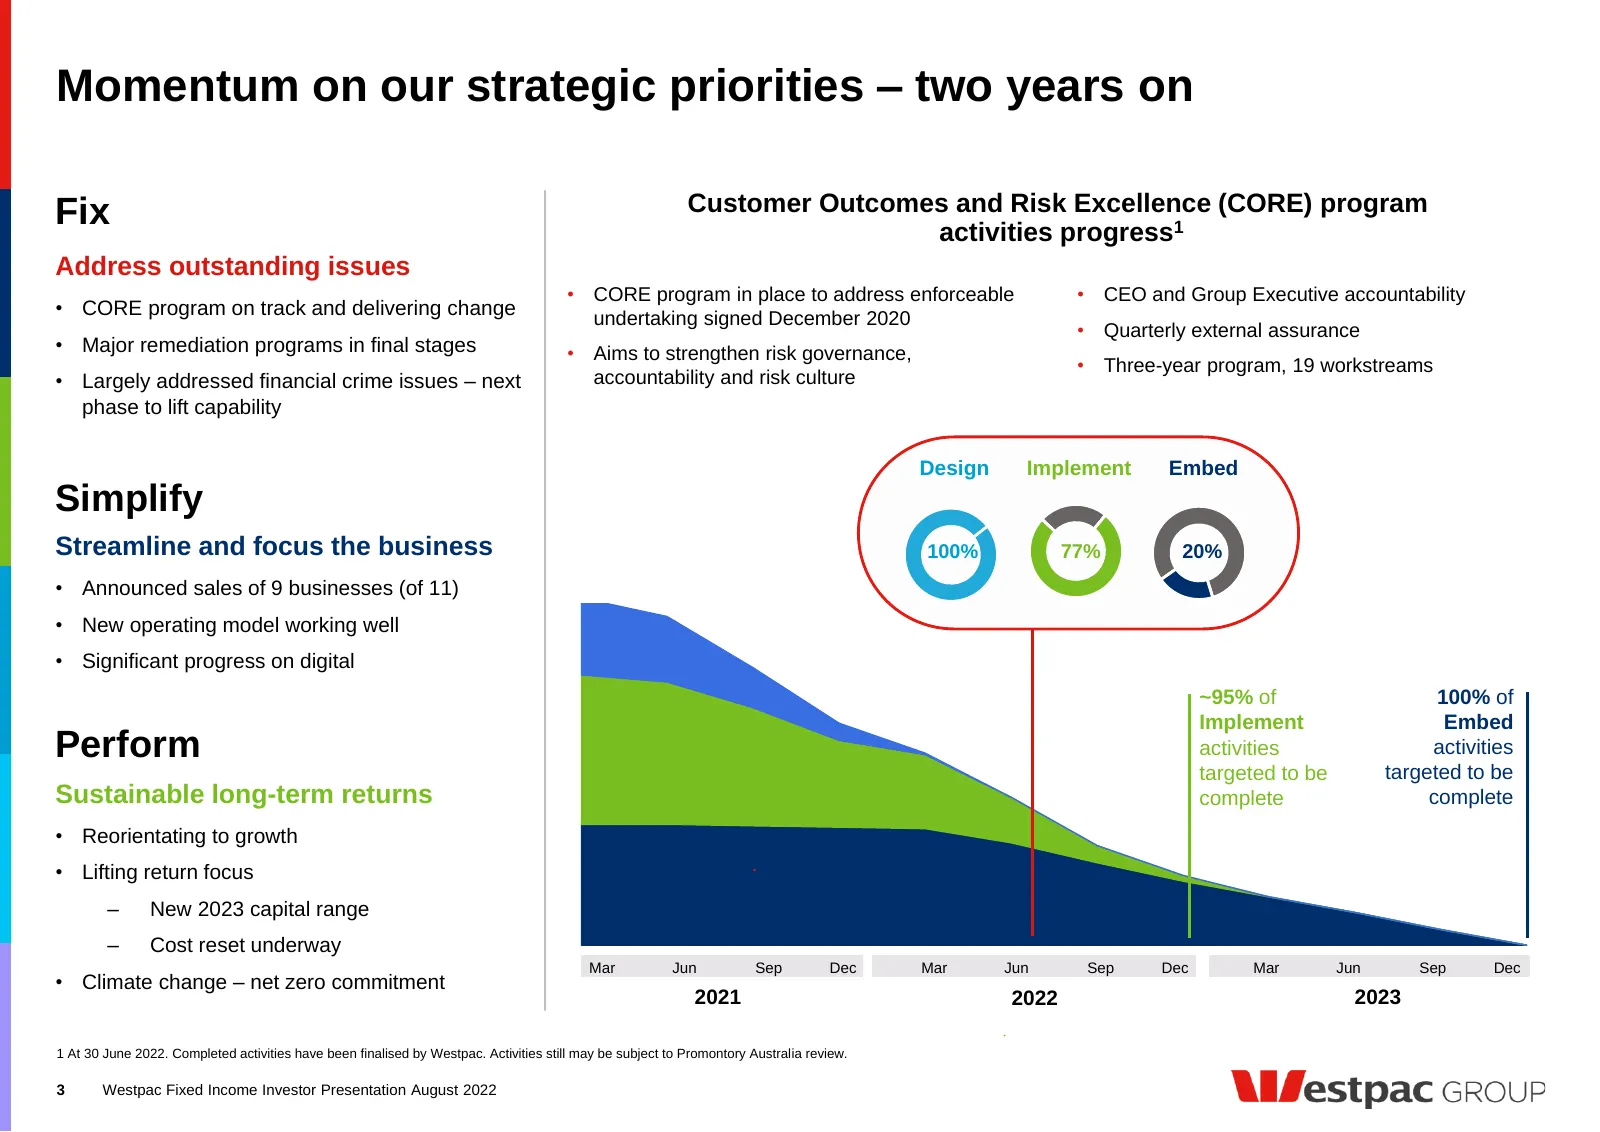
Slide 3: Momentum on our strategic priorities – two years on
Momentum on our strategic priorities – two years on Fix Customer Outcomes and Risk Excellence (CORE) program activities progress1 Address outstanding issues • CORE program in place to address enforceable • CEO and Group Executive accountability • CORE program on track and delivering change undertaki
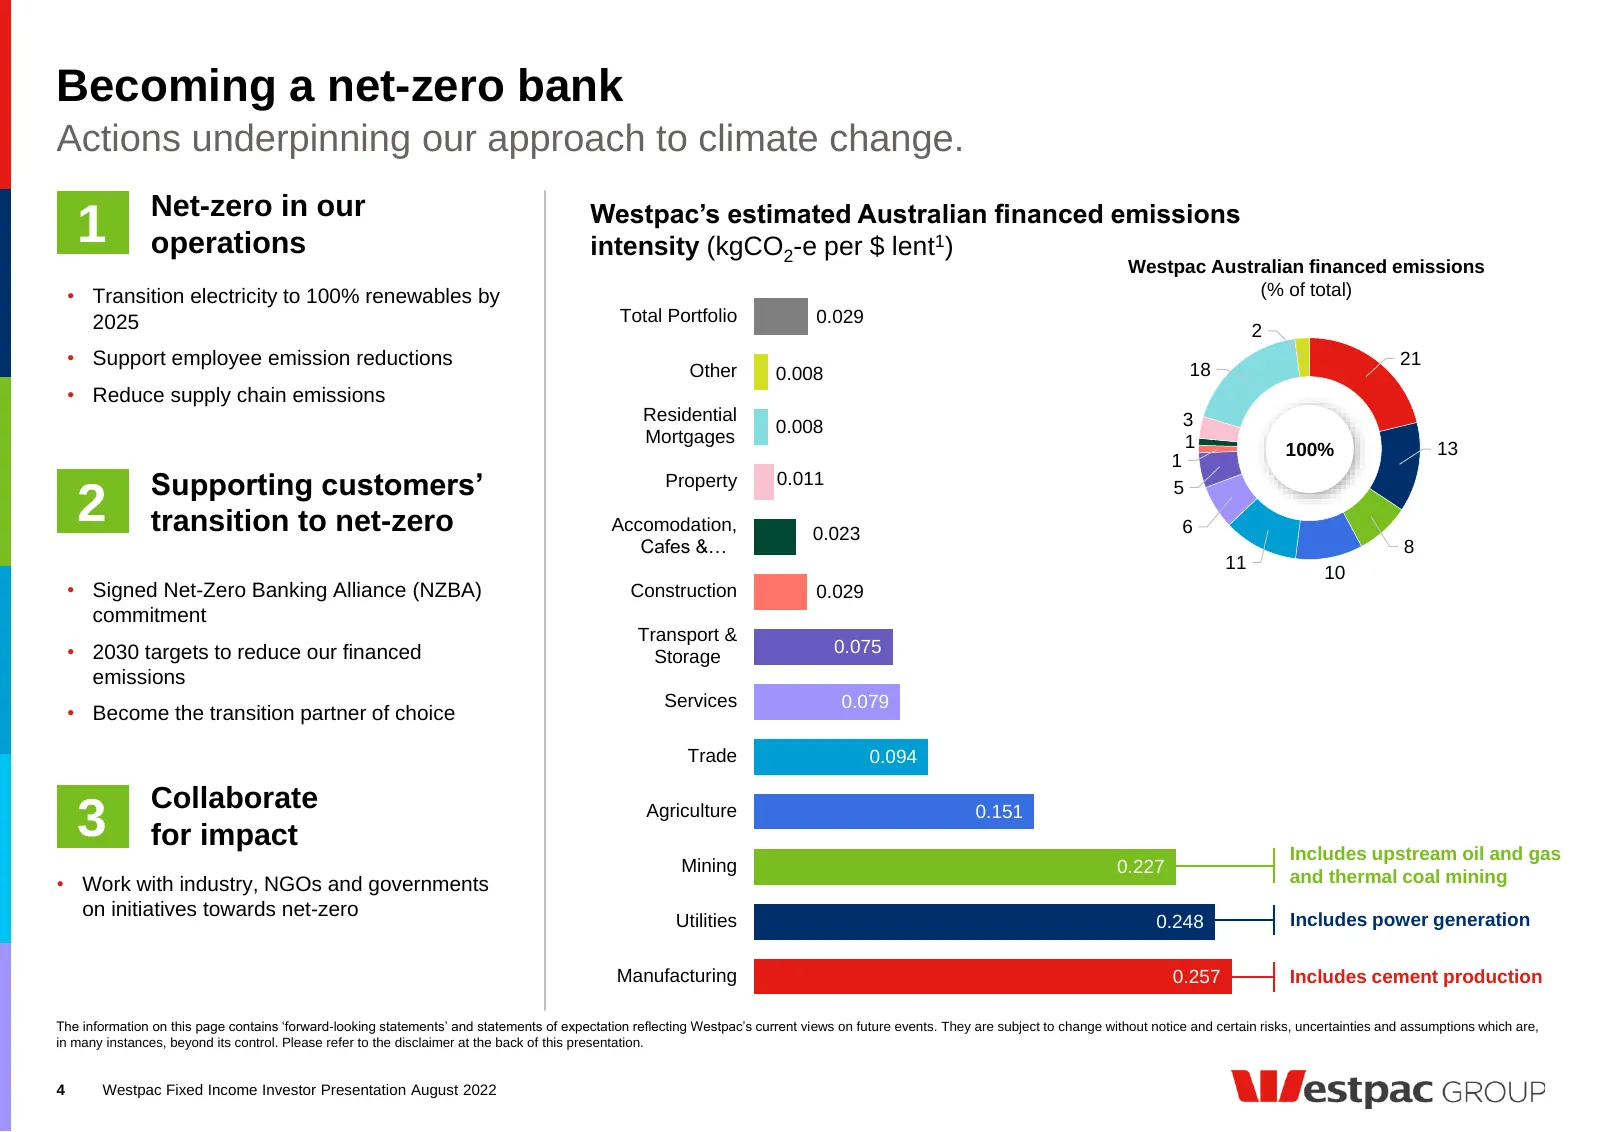
Slide 4: Becoming a net-zero bank
Becoming a net-zero bank Actions underpinning our approach to climate change. Net-zero in our Westpac’s estimated Australian financed emissions 1 operations intensity (kgCO2-e per $ lent1) Westpac Australian financed emissions • Transition electricity to 100% renewables by (% of total) 2025 Total Po
Slide 5: CET1 capital ratio 10.75%; pro forma 11.00%
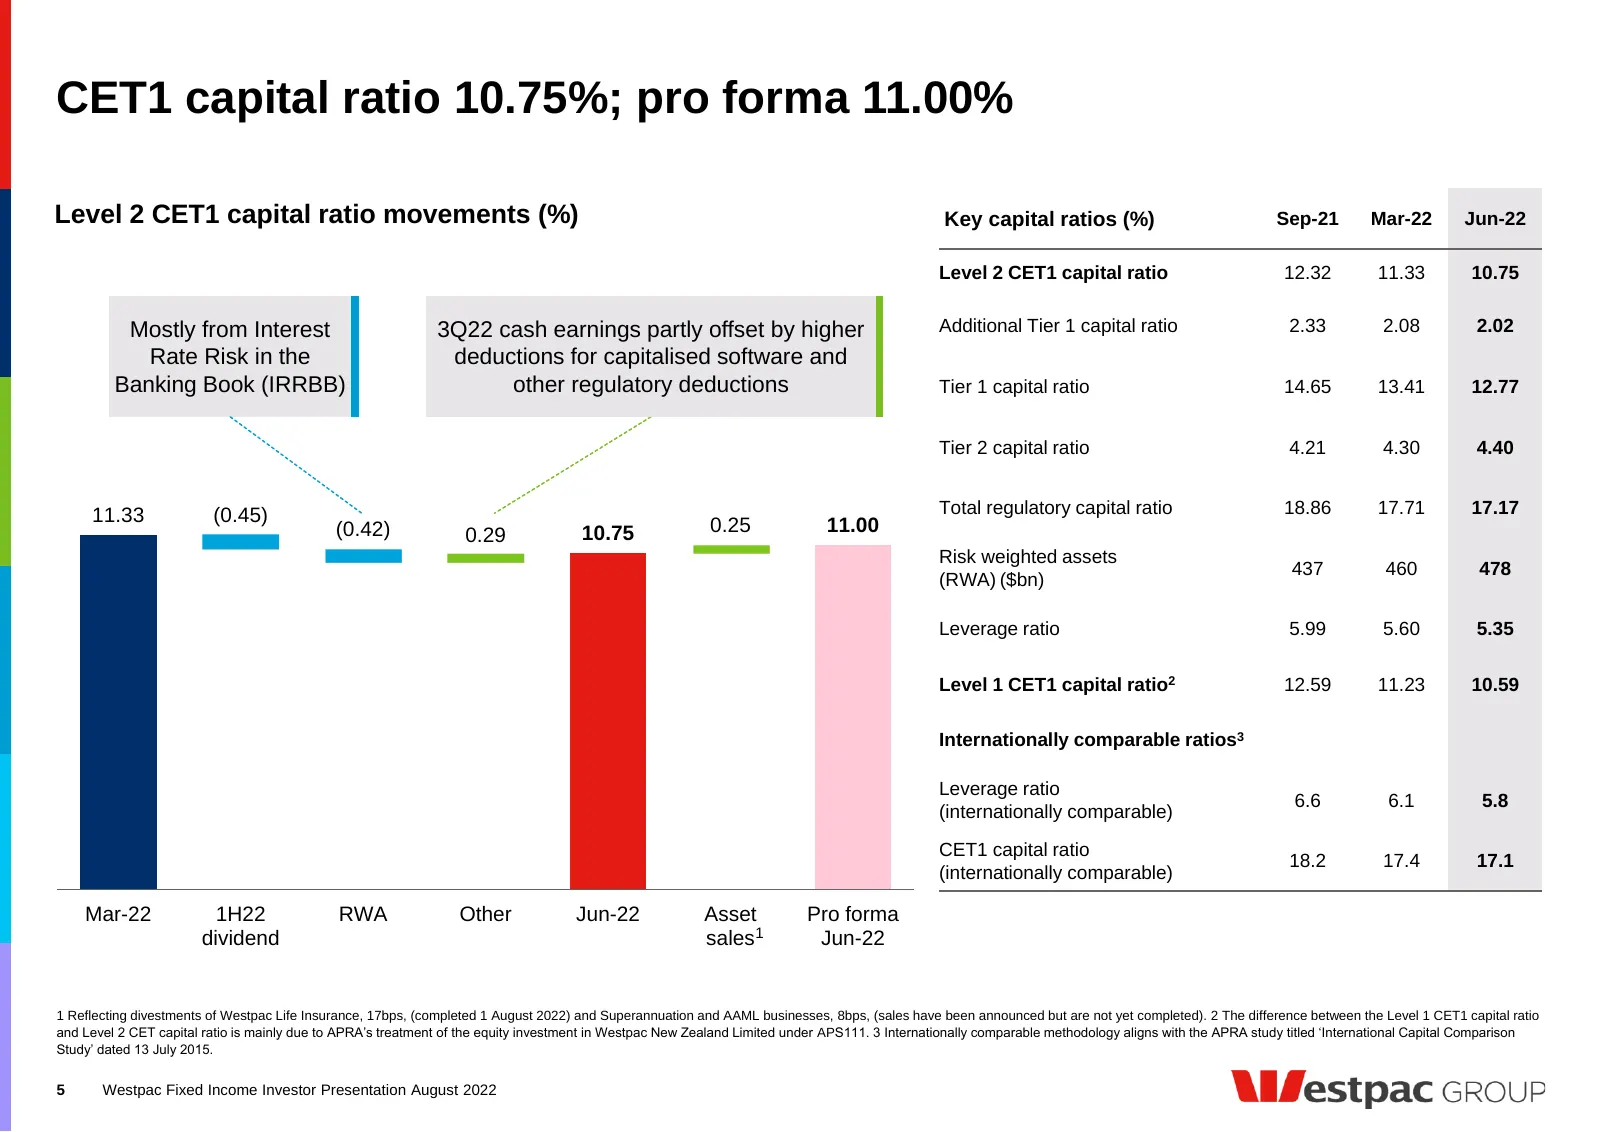
CET1 capital ratio 10.75%; pro forma 11.00% Level 2 CET1 capital ratio movements (%) Key capital ratios (%) Sep-21 Mar-22 Jun-22 Level 2 CET1 capital ratio 12.32 11.33 10.75 Mostly from Interest 3Q22 cash earnings partly offset by higher Additional Tier 1 capital ratio 2.33 2.08 2.02 Rate Risk in th
Slide 6: Update on capital management. APRA's revisions to capital framework and our new operating range
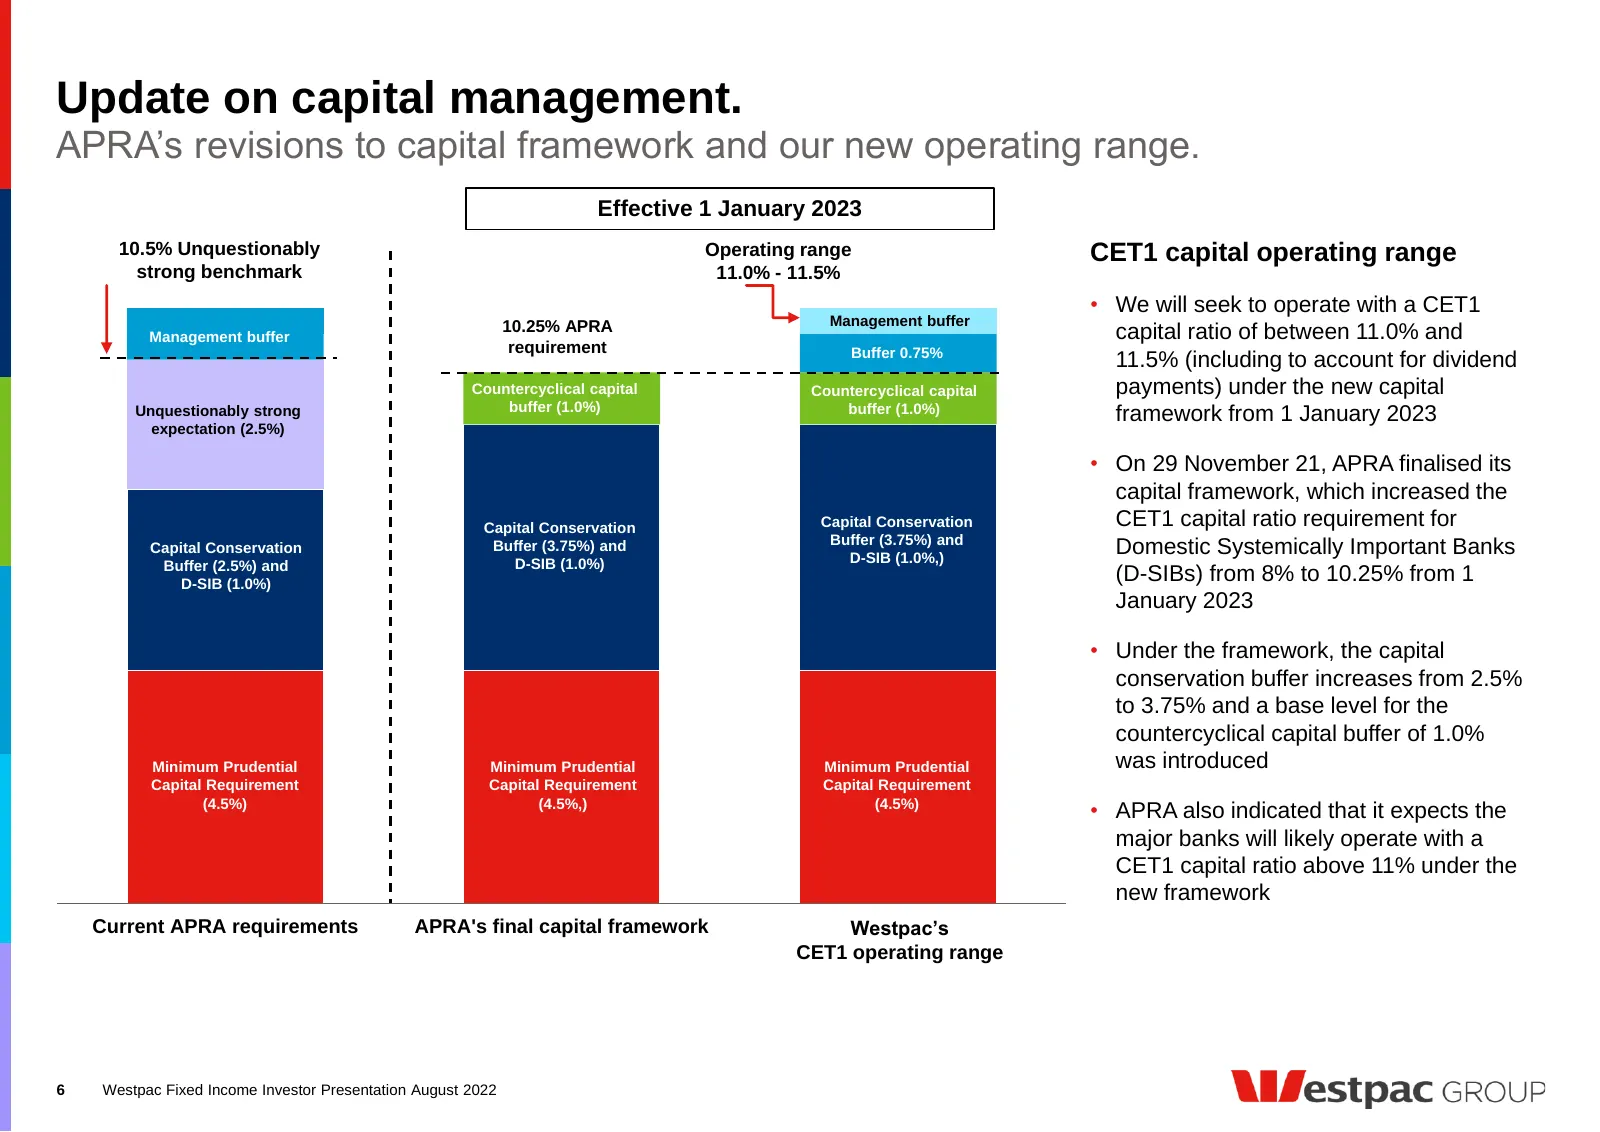
Update on capital management. APRA’s revisions to capital framework and our new operating range. Effective 1 January 2023 10.5% Unquestionably Operating range CET1 capital operating range strong benchmark 11.0% - 11.5% • We will seek to operate with a CET1 10.25% APRA Management buffer Management bu
Slide 7: Impairment provisions
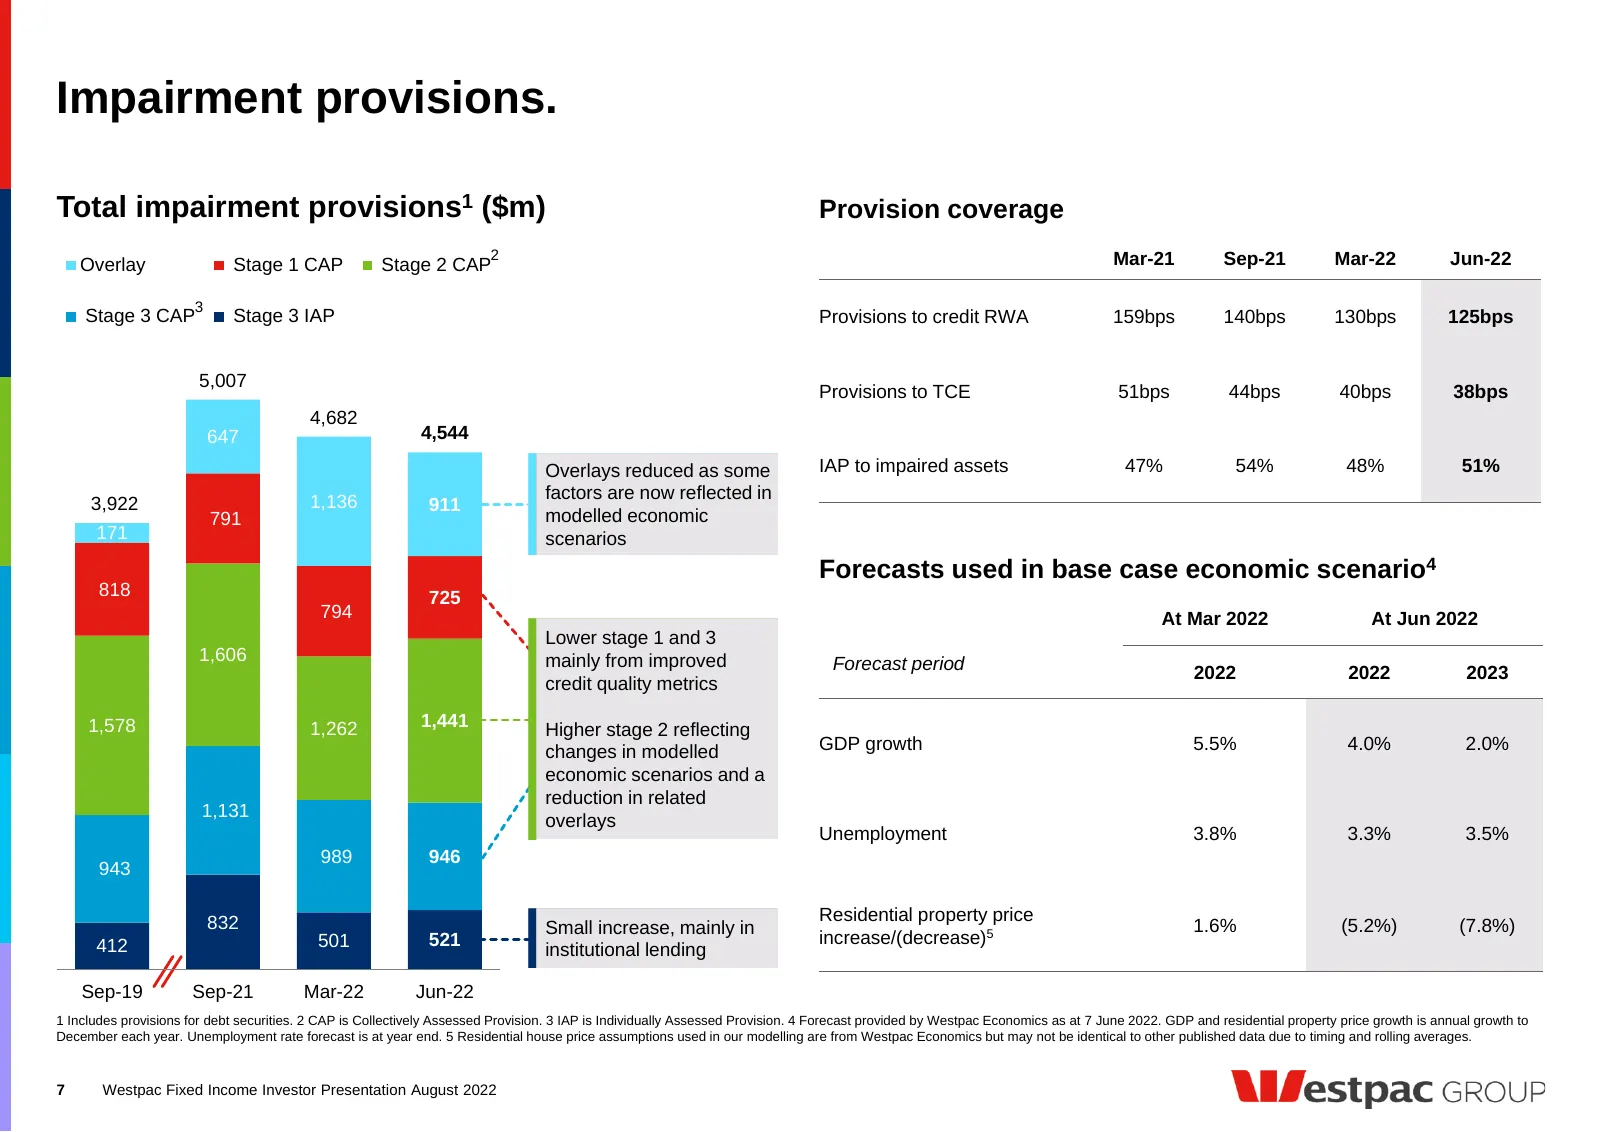
Impairment provisions. Total impairment provisions1 ($m) Provision coverage 2 Mar-21 Sep-21 Mar-22 Jun-22 Overlay Stage 1 CAP Stage 2 CAP 3 Stage 3 CAP Stage 3 IAP Provisions to credit RWA 159bps 140bps 130bps 125bps 5,007 Provisions to TCE 51bps 44bps 40bps 38bps 4,682 647 4,544 Overlays reduced as
Slide 8: Credit quality metrics improved
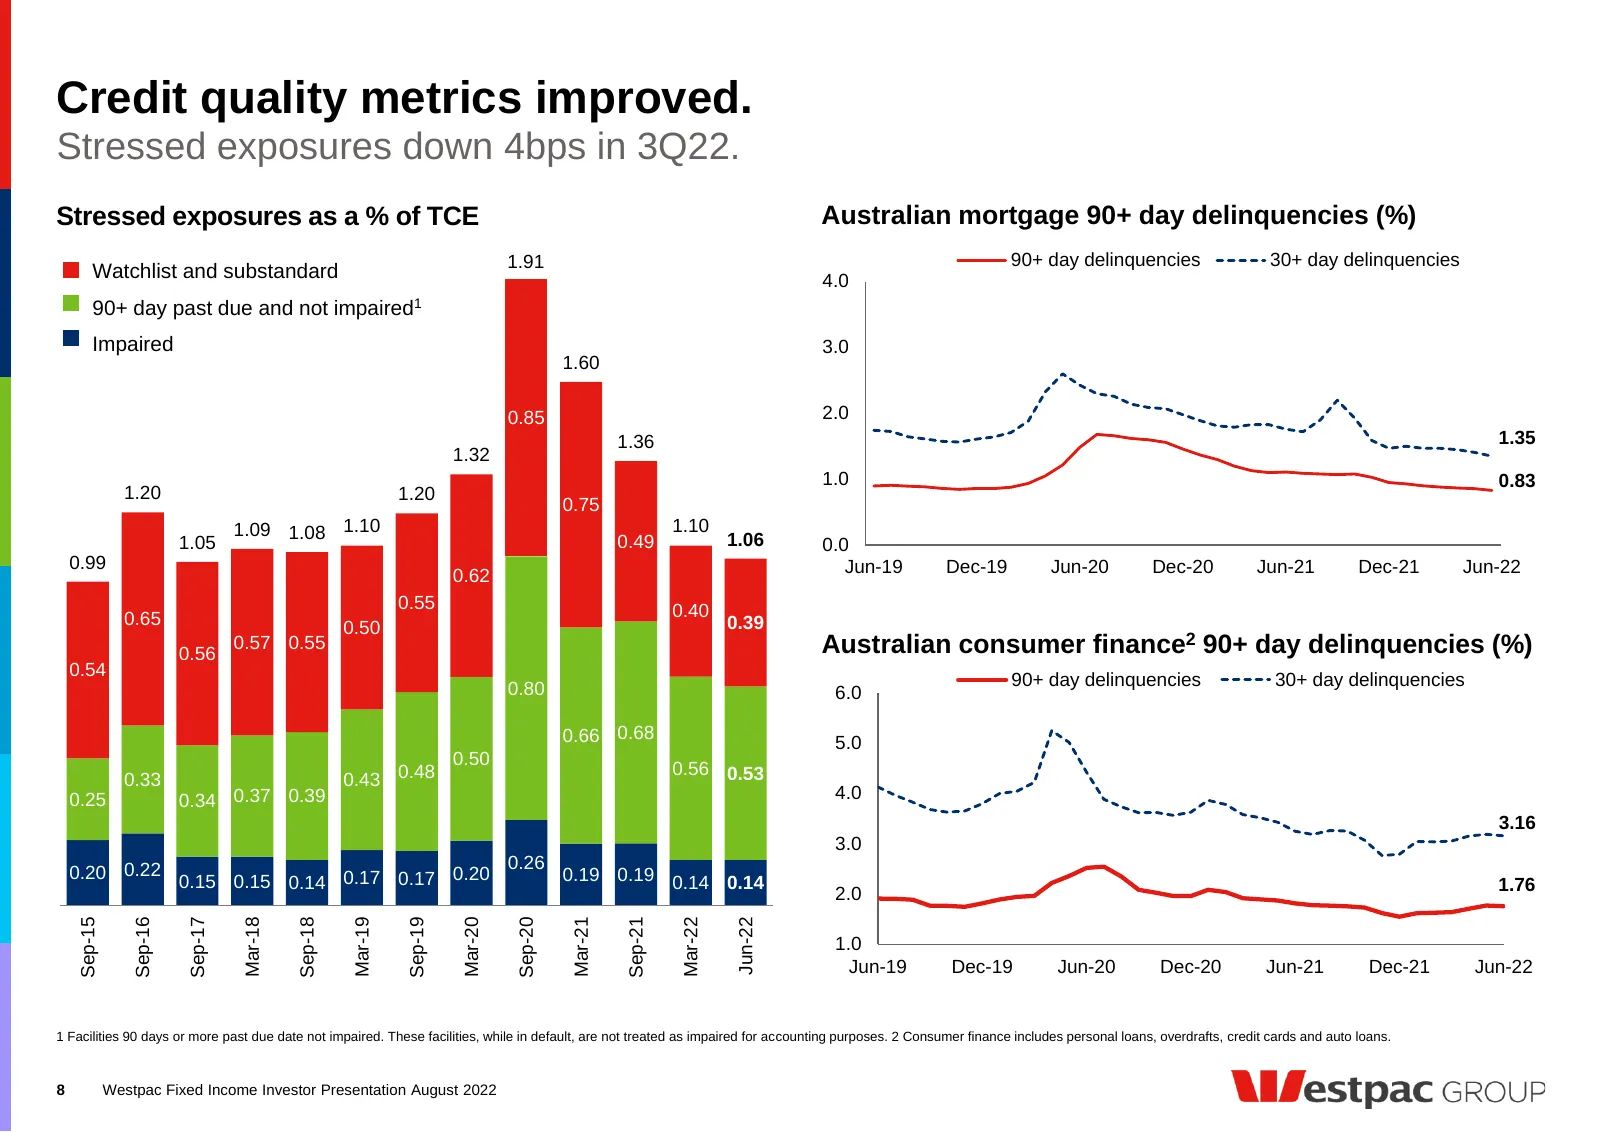
Credit quality metrics improved. Stressed exposures down 4bps in 3Q22. Stressed exposures as a % of TCE Australian mortgage 90+ day delinquencies (%) 1.91 90+ day delinquencies 30+ day delinquencies Watchlist and substandard 4.0 90+ day past due and not impaired1 Impaired 3.0 1.60 0.85 2.0 1.36 1.35
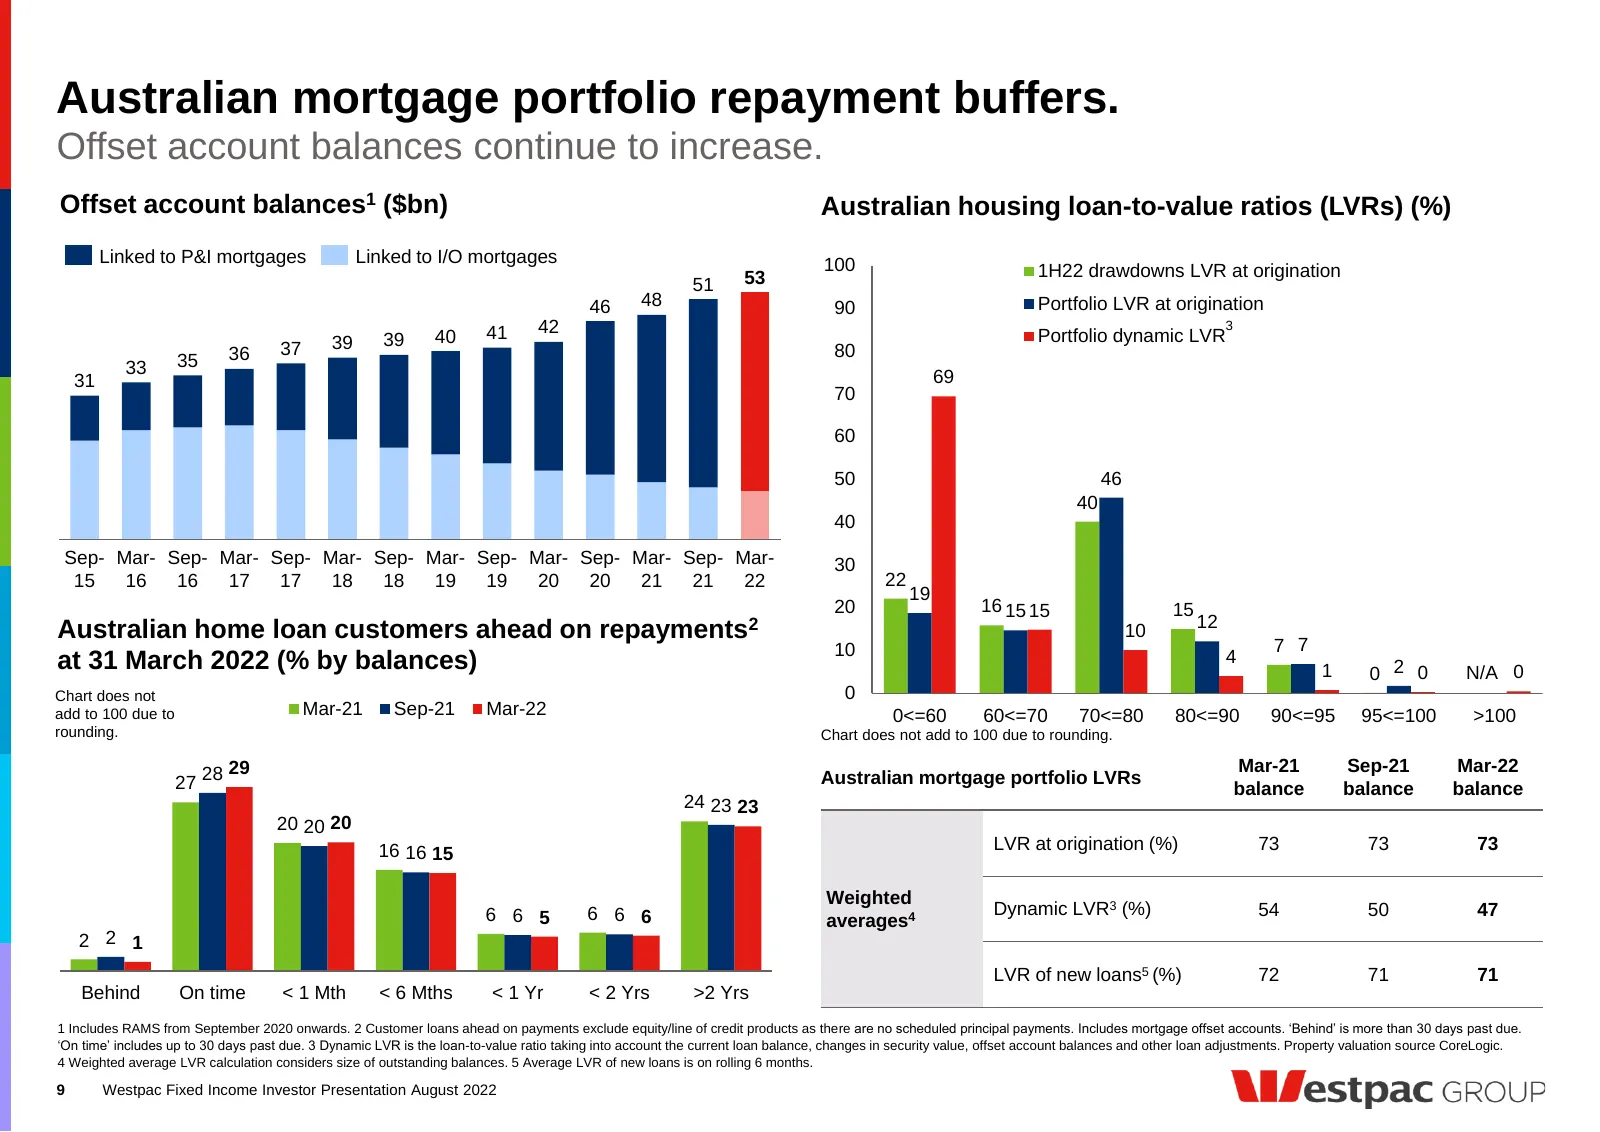
Slide 9: Australian mortgage portfolio repayment buffers
Australian mortgage portfolio repayment buffers. Offset account balances continue to increase. Offset account balances1 ($bn) Australian housing loan-to-value ratios (LVRs) (%) Linked to P&I mortgages Linked to I/O mortgages 100 53 1H22 drawdowns LVR at origination 51 46 48 90 Portfolio LVR at origi
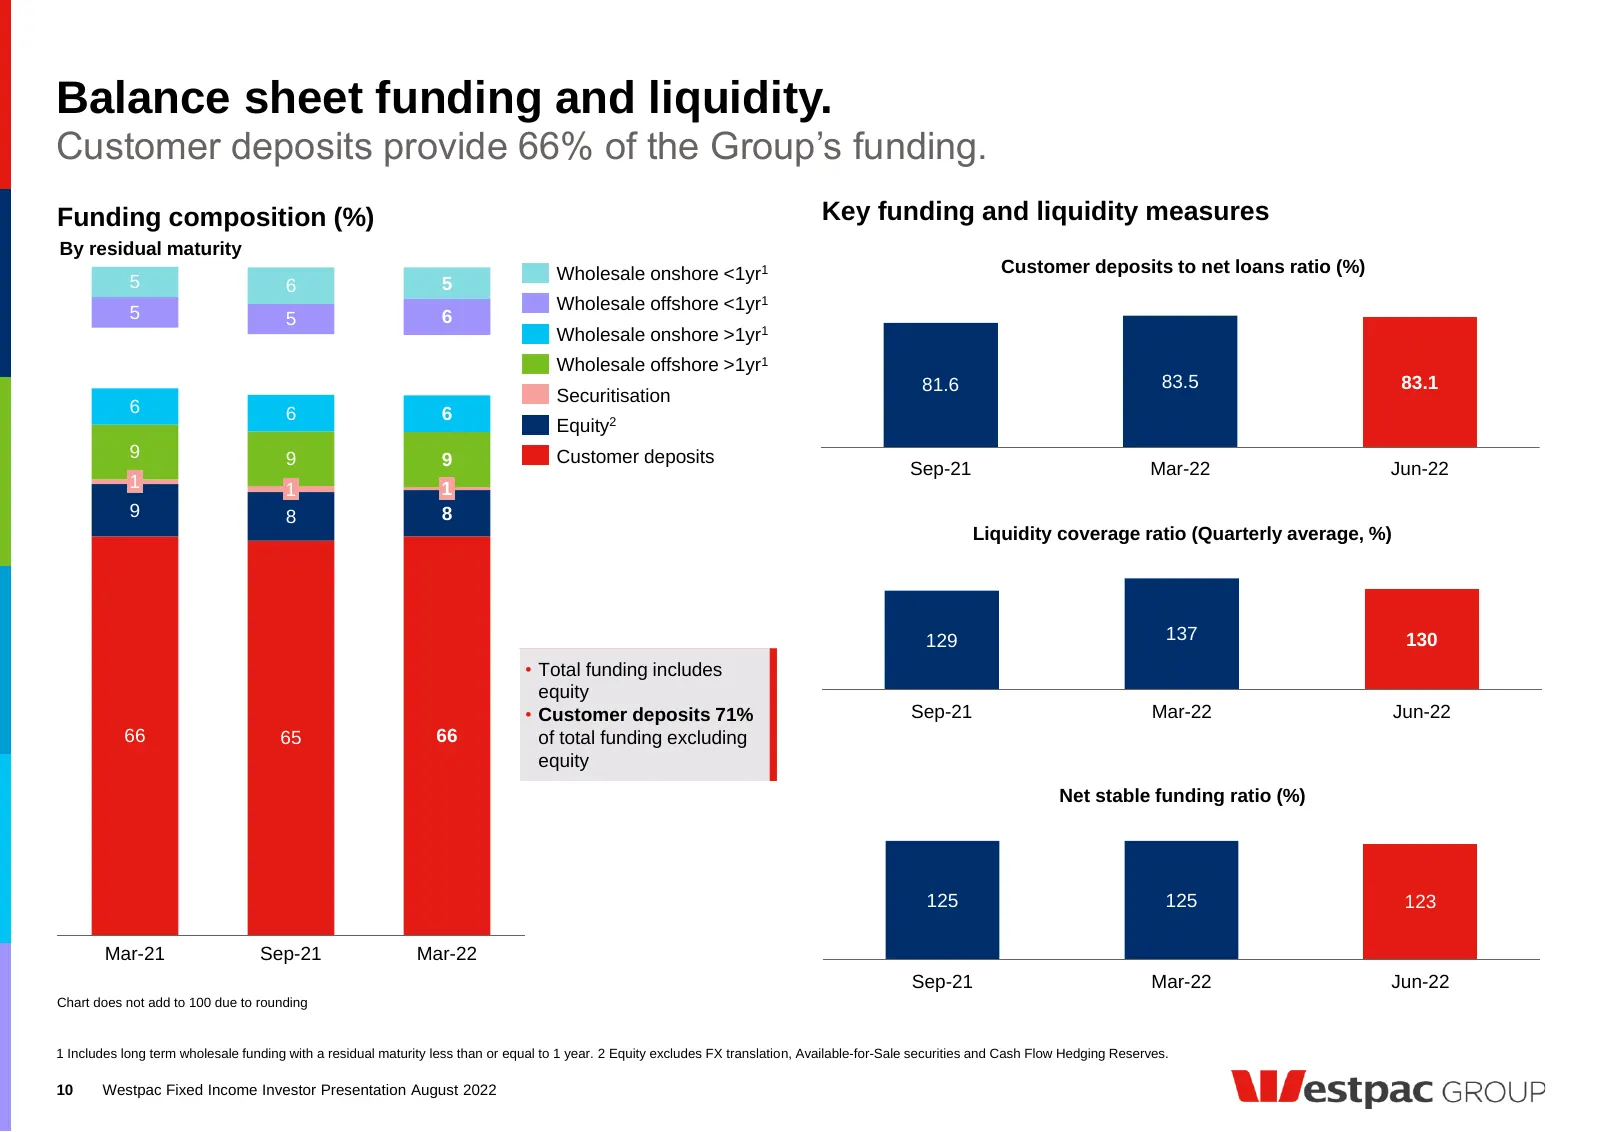
Slide 10: Balance sheet funding and liquidity
Balance sheet funding and liquidity. Customer deposits provide 66% of the Group’s funding. Funding composition (%) Key funding and liquidity measures By residual maturity Wholesale onshore <1yr1 Customer deposits to net loans ratio (%) 5 6 5 5 Wholesale offshore <1yr1 5 6 Wholesale onshore >1yr1 Who
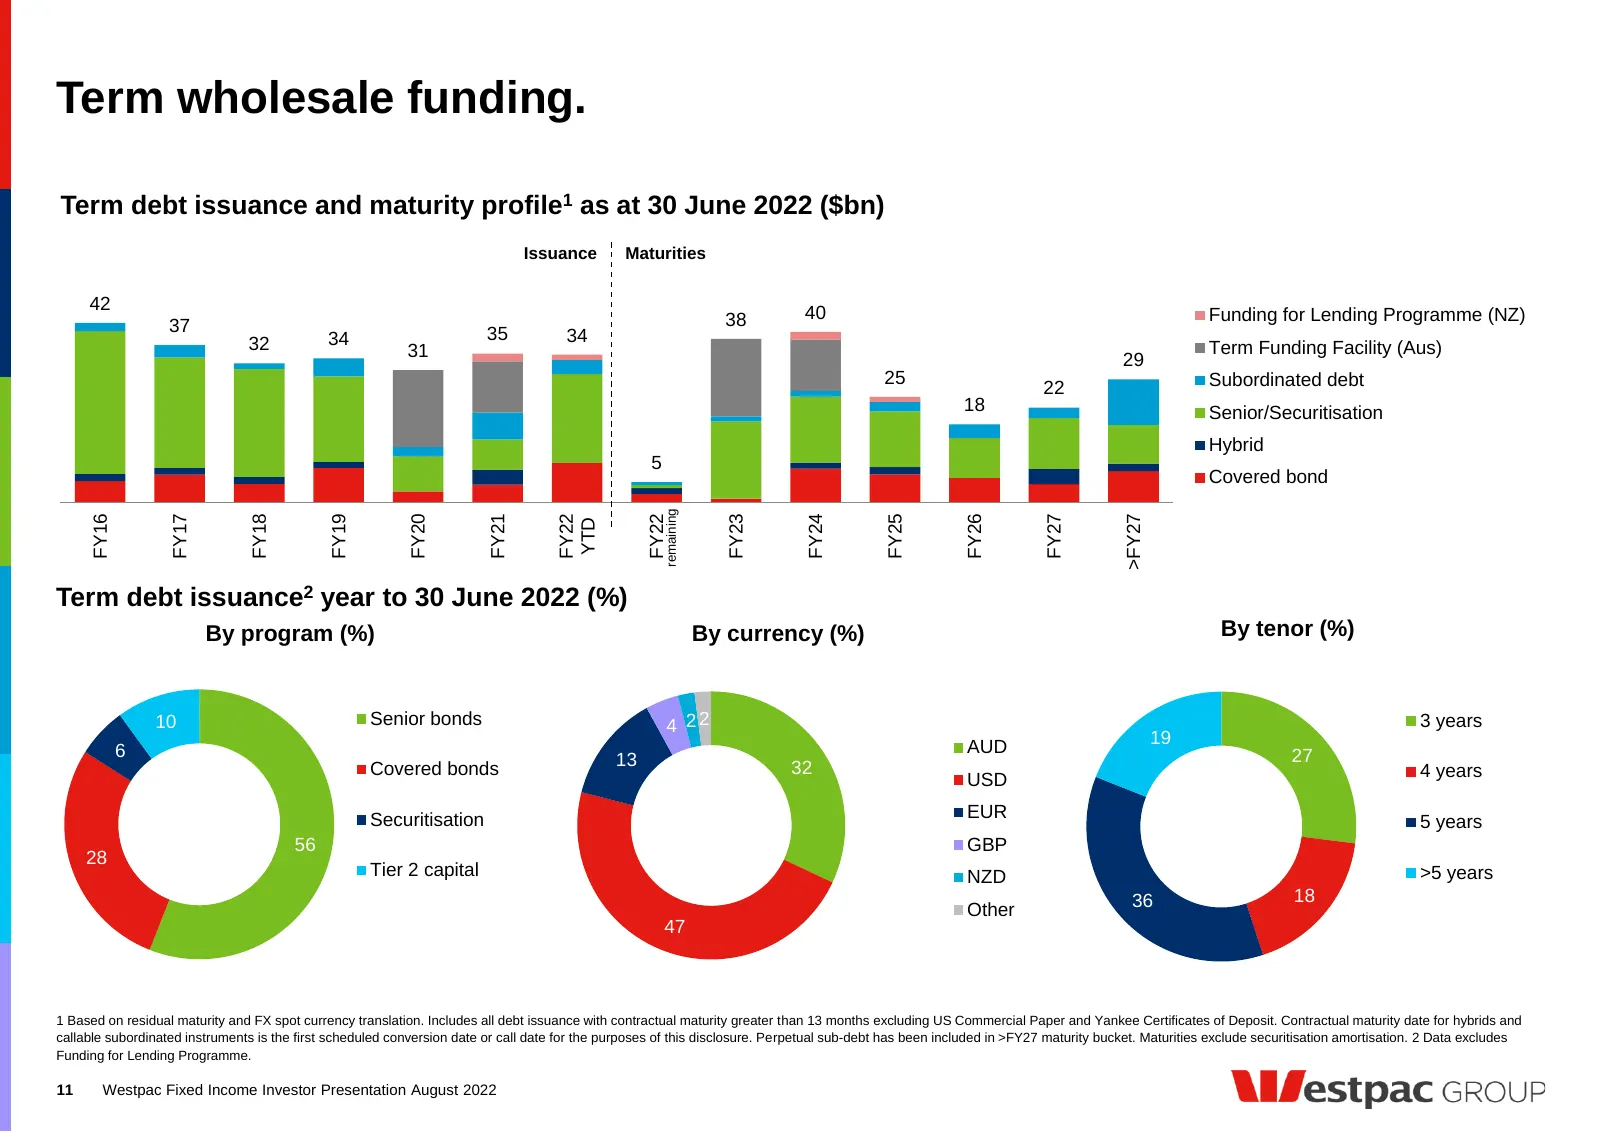
Slide 11: Term wholesale funding
Term wholesale funding. Term debt issuance and maturity profile1 as at 30 June 2022 ($bn) Issuance Maturities 42 40 38 Funding for Lending Programme (NZ) 37 35 32 34 34 31 Term Funding Facility (Aus) 29 25 Subordinated debt 22 18 Senior/Securitisation Hybrid 5 Covered bond remaining FY16 FY17 FY18 F
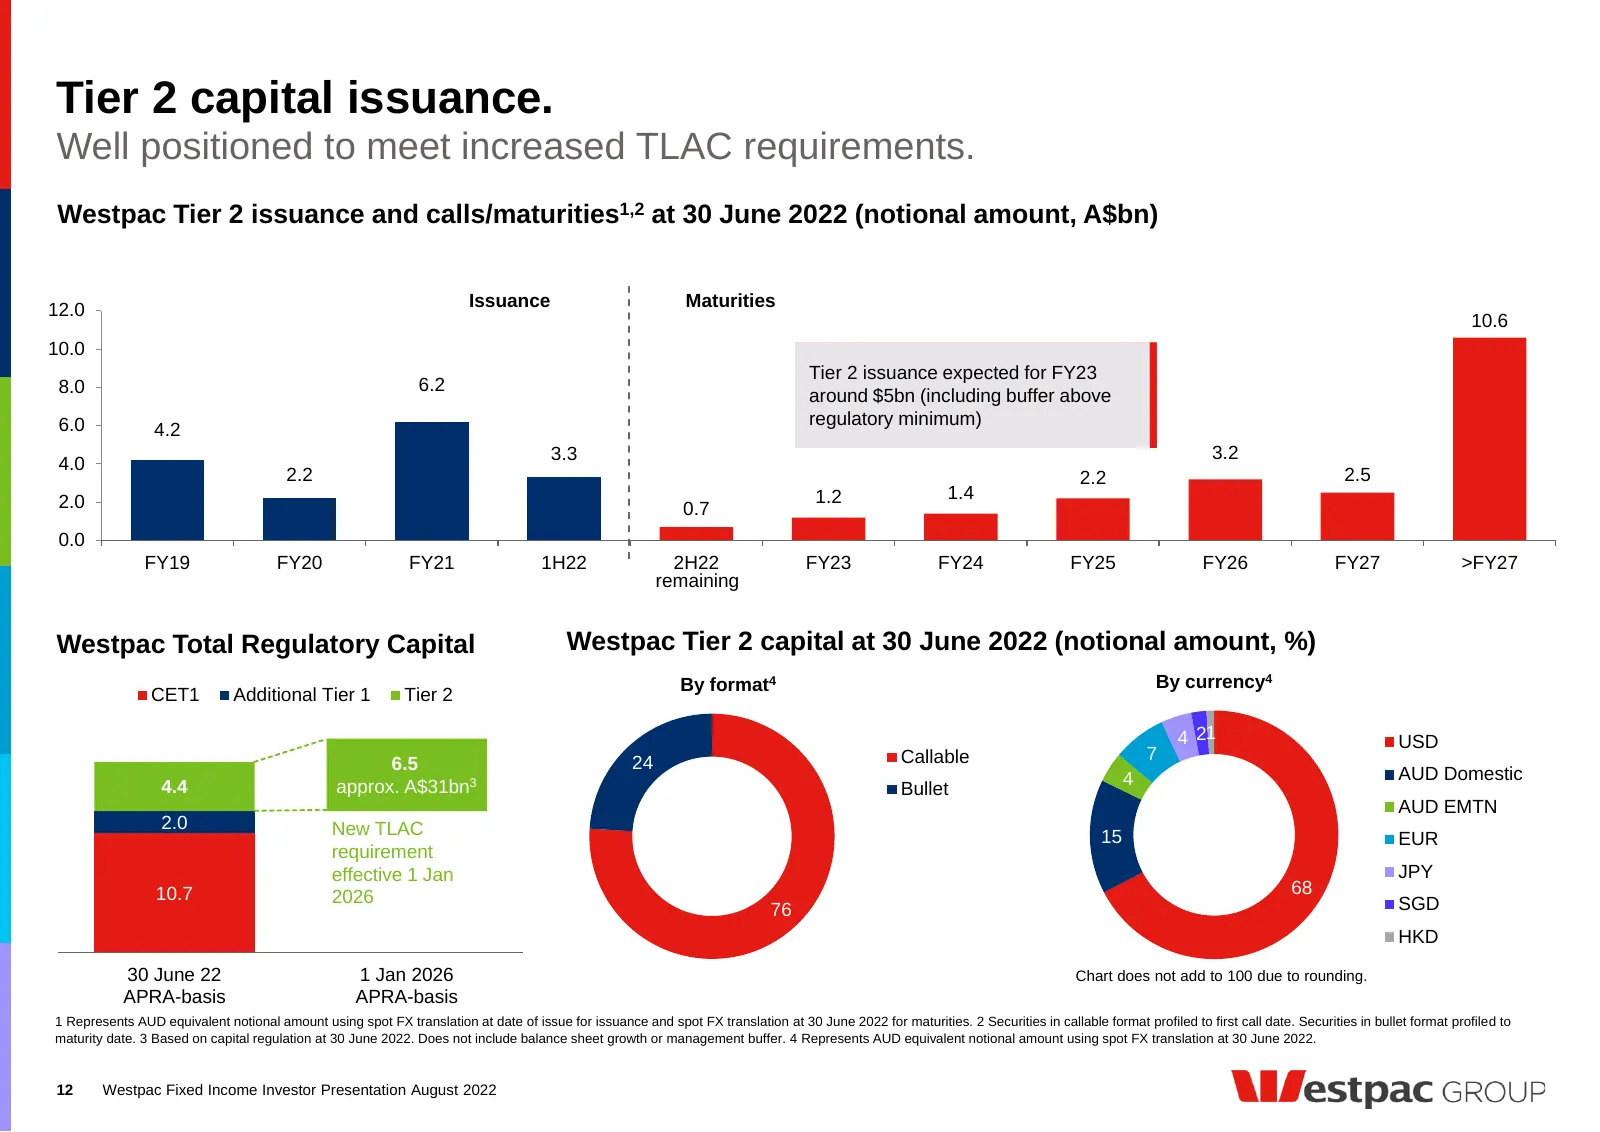
Slide 12: Tier 2 capital issuance
Tier 2 capital issuance. Well positioned to meet increased TLAC requirements. Westpac Tier 2 issuance and calls/maturities1,2 at 30 June 2022 (notional amount, A$bn) 12.0 Issuance Maturities 10.6 10.0 Tier 2 issuance expected for FY23 8.0 6.2 around $5bn (including buffer above 6.0 regulatory minimu
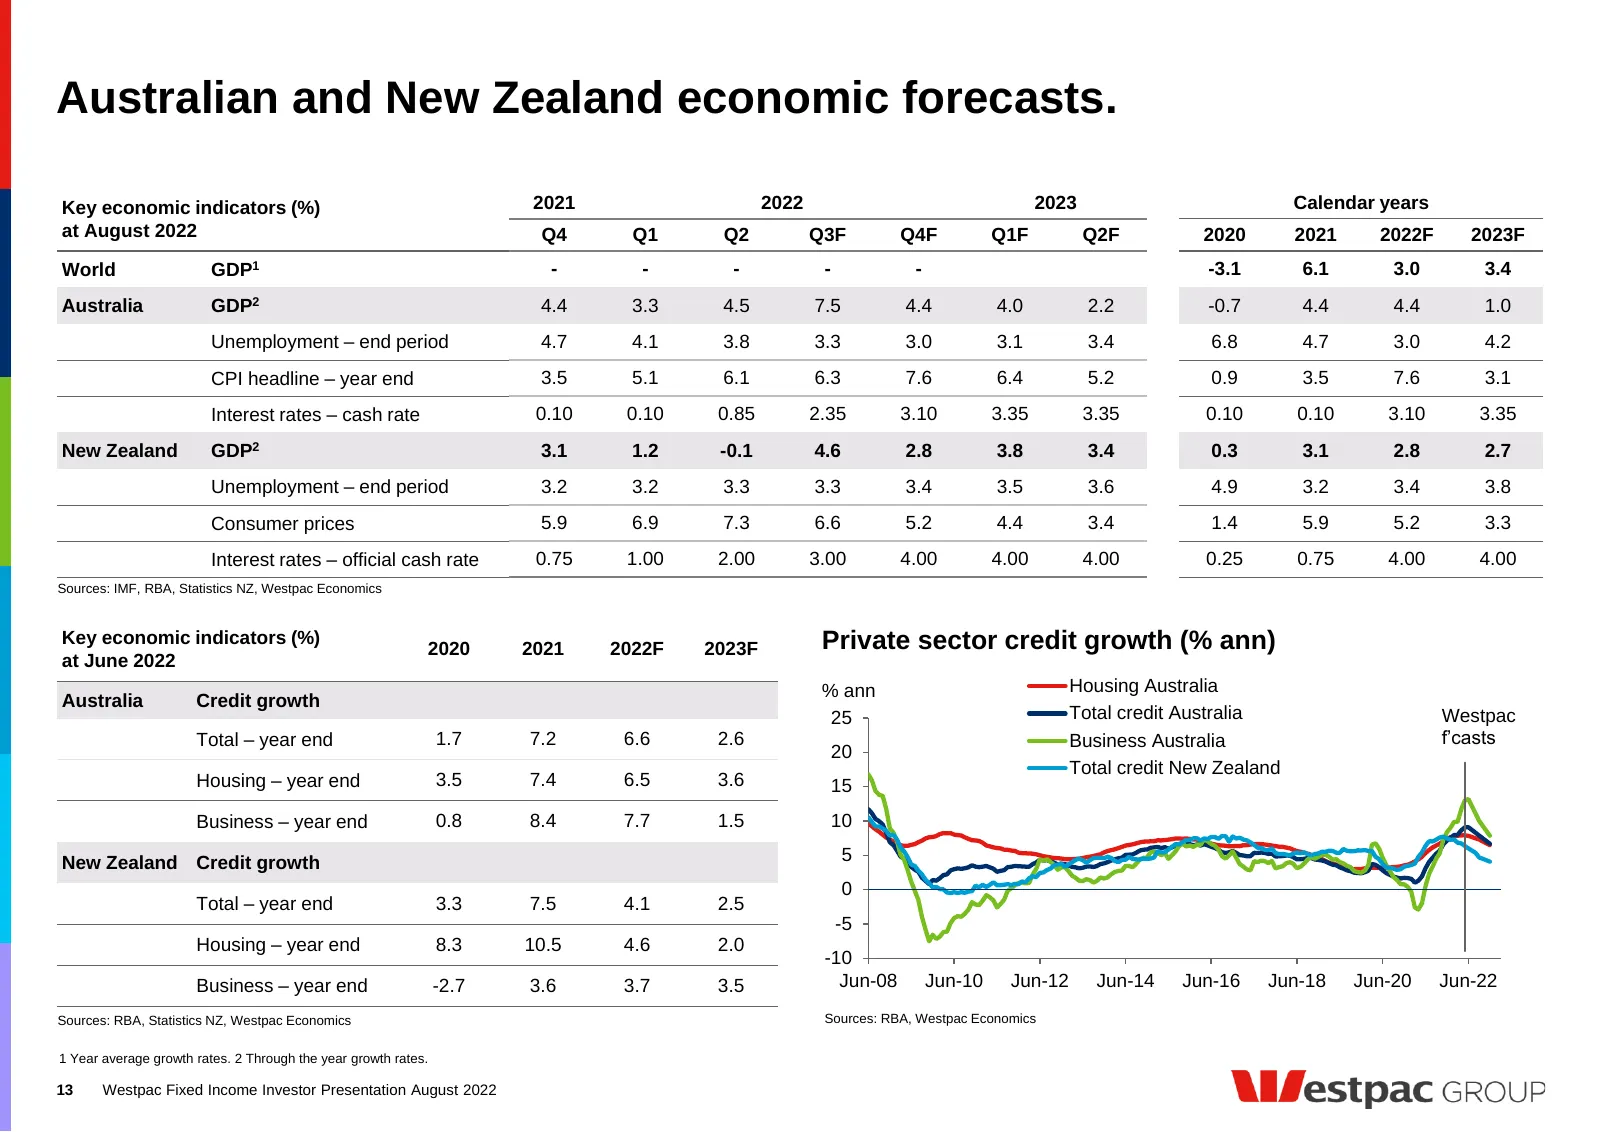
Slide 13: Australian and New Zealand economic forecasts
Australian and New Zealand economic forecasts. Key economic indicators (%) 2021 2022 2023 Calendar years at August 2022 Q4 Q1 Q2 Q3F Q4F Q1F Q2F 2020 2021 2022F 2023F World GDP1 - - - - - -3.1 6.1 3.0 3.4 Australia GDP2 4.4 3.3 4.5 7.5 4.4 4.0 2.2 -0.7 4.4 4.4 1.0 Unemployment – end period 4.7 4.1 3
Slide 14: Further information
Further information Westpac Group
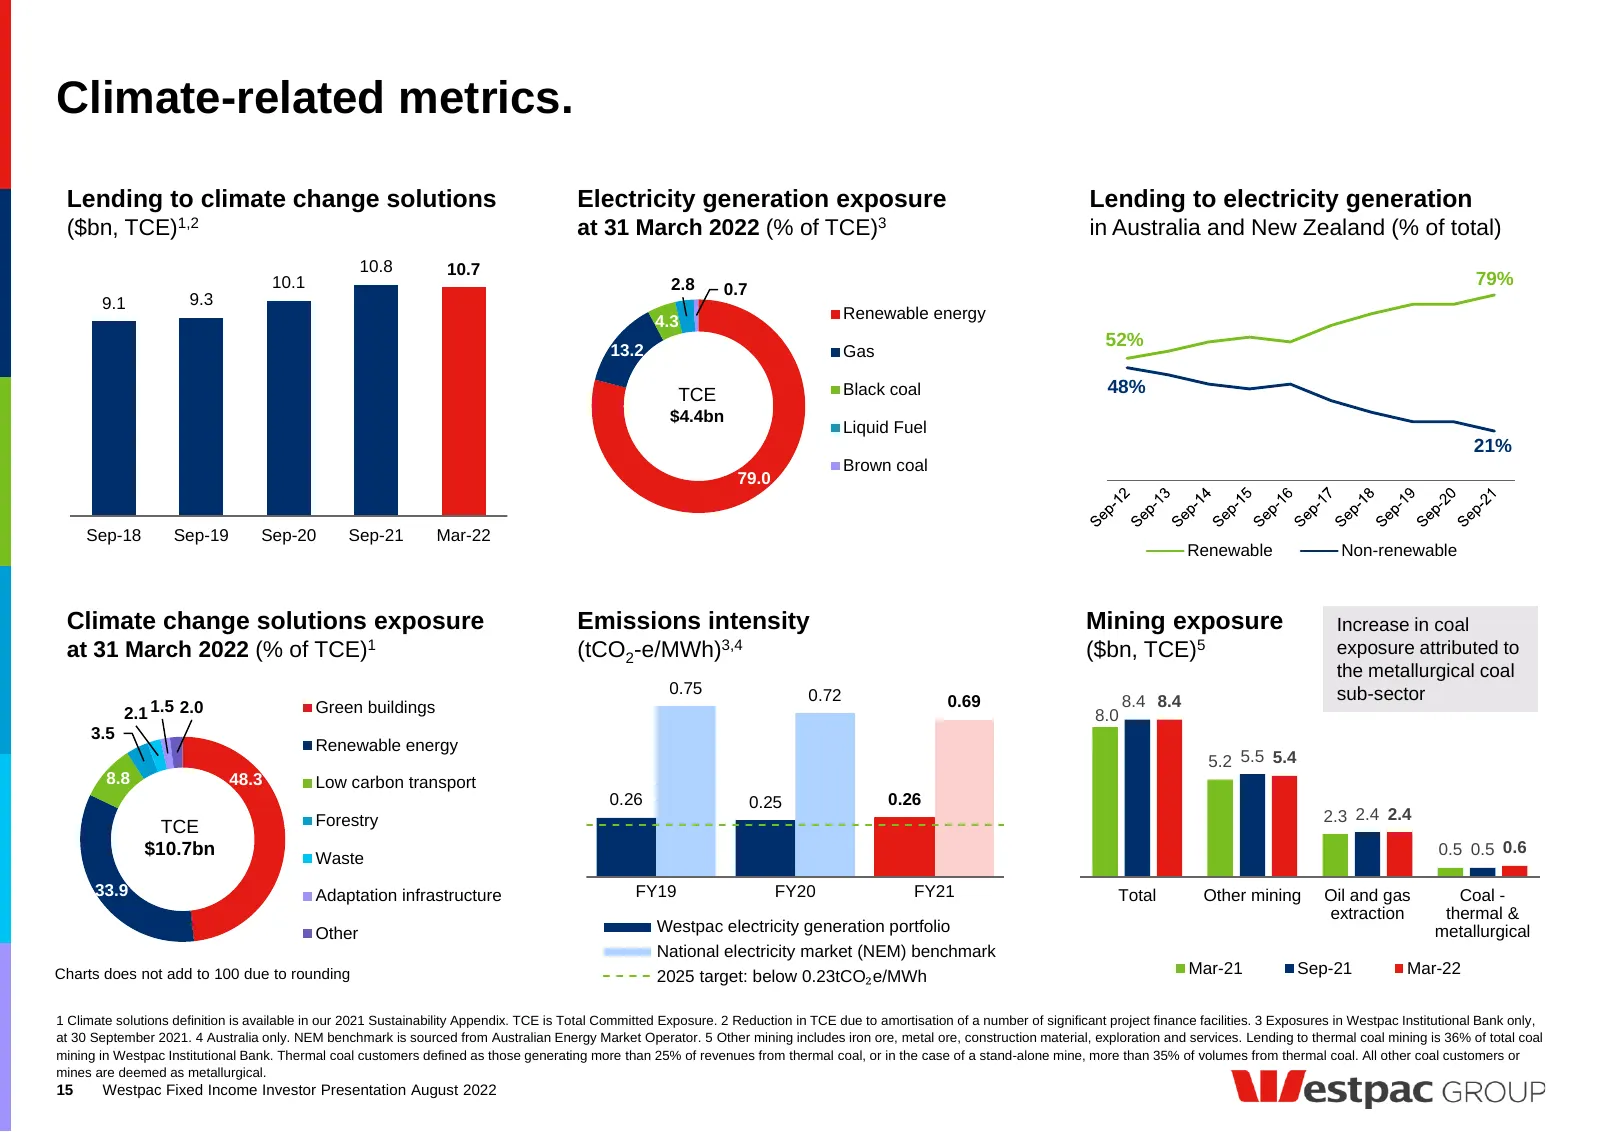
Slide 15: Climate-related metrics
Climate-related metrics. Lending to climate change solutions Electricity generation exposure Lending to electricity generation ($bn, TCE)1,2 at 31 March 2022 (% of TCE)3 in Australia and New Zealand (% of total) 10.8 10.7 10.1 2.8 79% 0.7 9.1 9.3 4.3 Renewable energy 52% 13.2 Gas TCE Black coal 48%
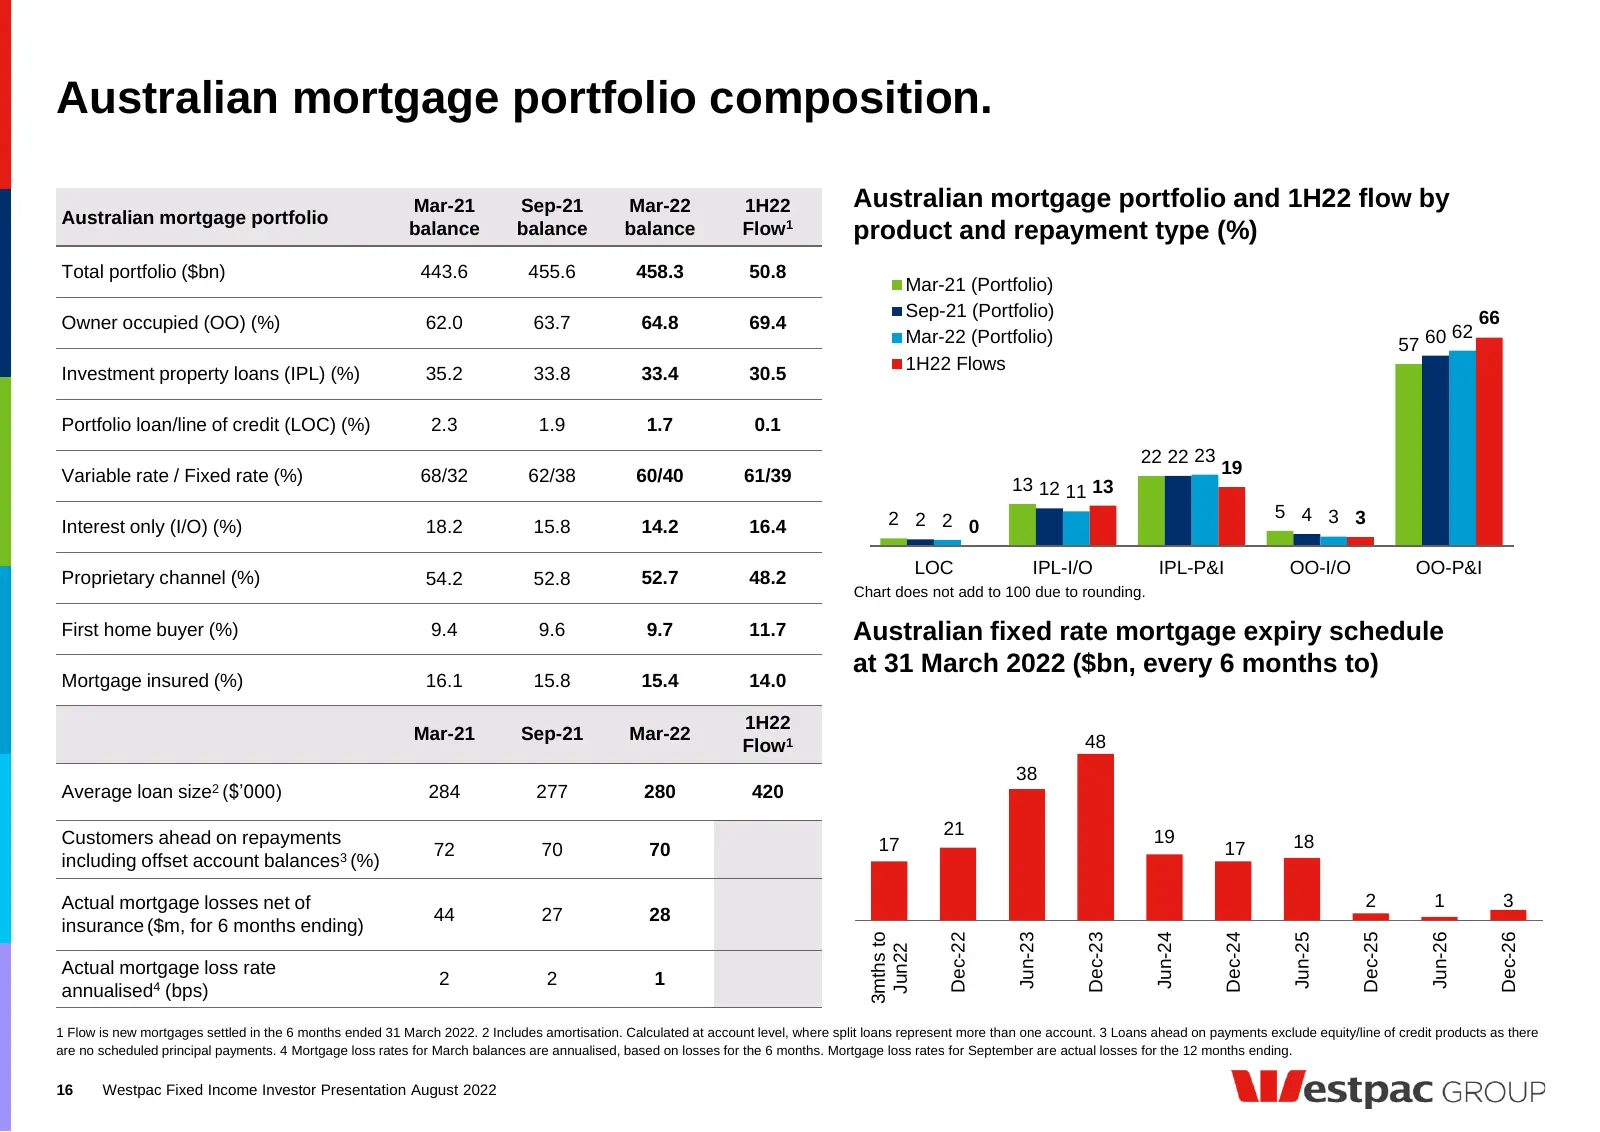
Slide 16: Australian mortgage portfolio composition
Australian mortgage portfolio composition. Mar-21 Sep-21 Mar-22 1H22 Australian mortgage portfolio and 1H22 flow by Australian mortgage portfolio balance balance balance Flow1 product and repayment type (%) Total portfolio ($bn) 443.6 455.6 458.3 50.8 Mar-21 (Portfolio) Sep-21 (Portfolio) 66 Owner o
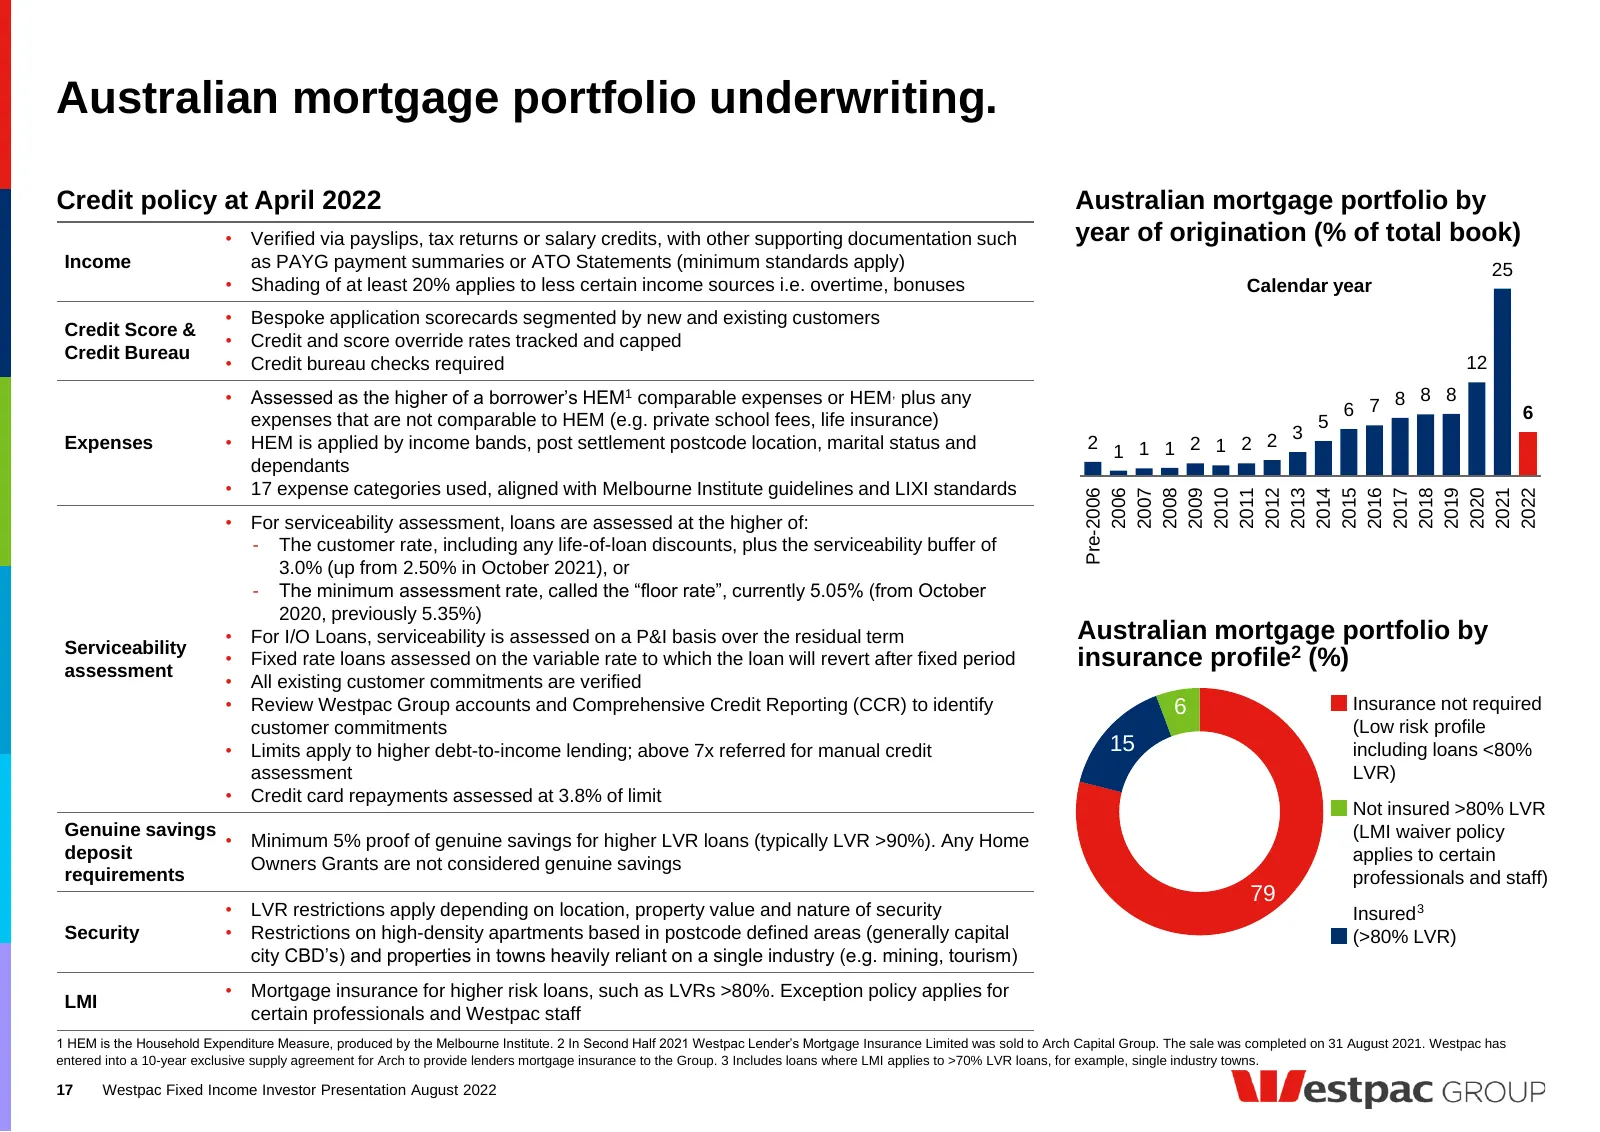
Slide 17: Australian mortgage portfolio underwriting
Australian mortgage portfolio underwriting. Credit policy at April 2022 Australian mortgage portfolio by • Verified via payslips, tax returns or salary credits, with other supporting documentation such year of origination (% of total book) Income as PAYG payment summaries or ATO Statements (minimum
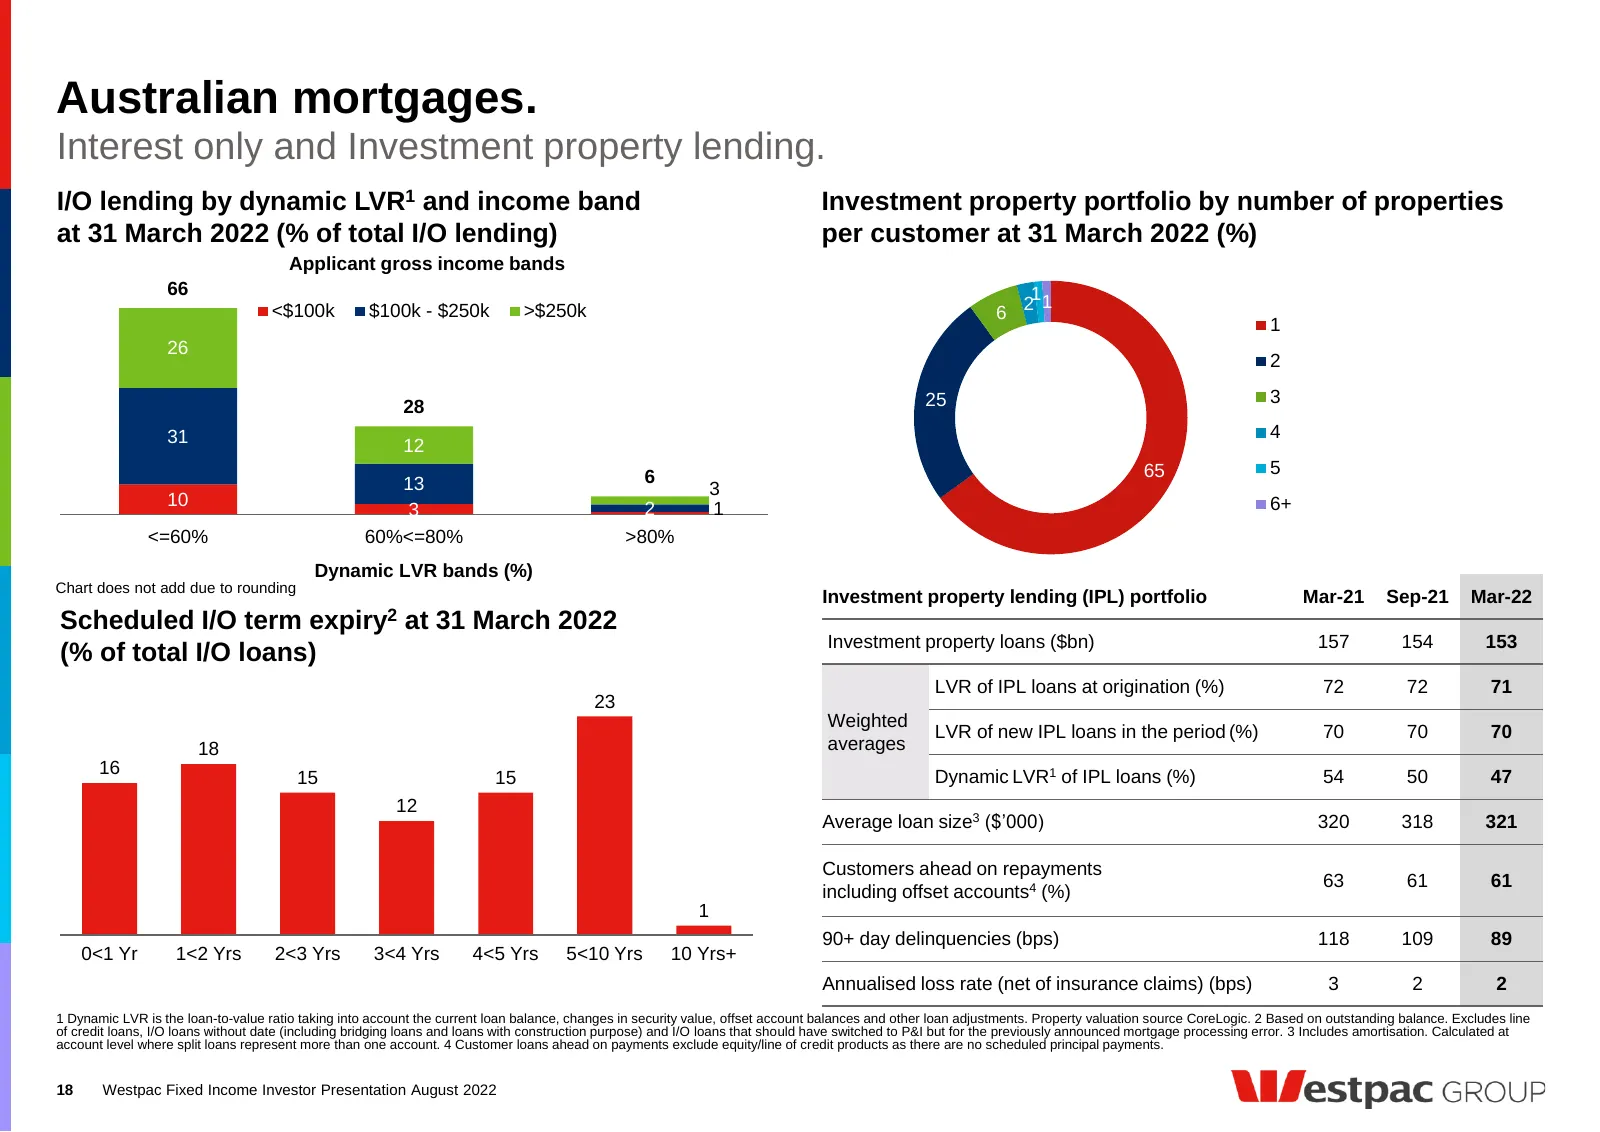
Slide 18: Australian mortgages: Interest only and Investment property lending
Australian mortgages. Interest only and Investment property lending. I/O lending by dynamic LVR1 and income band Investment property portfolio by number of properties at 31 March 2022 (% of total I/O lending) per customer at 31 March 2022 (%) Applicant gross income bands 66 11 <$100k $100k - $250k >
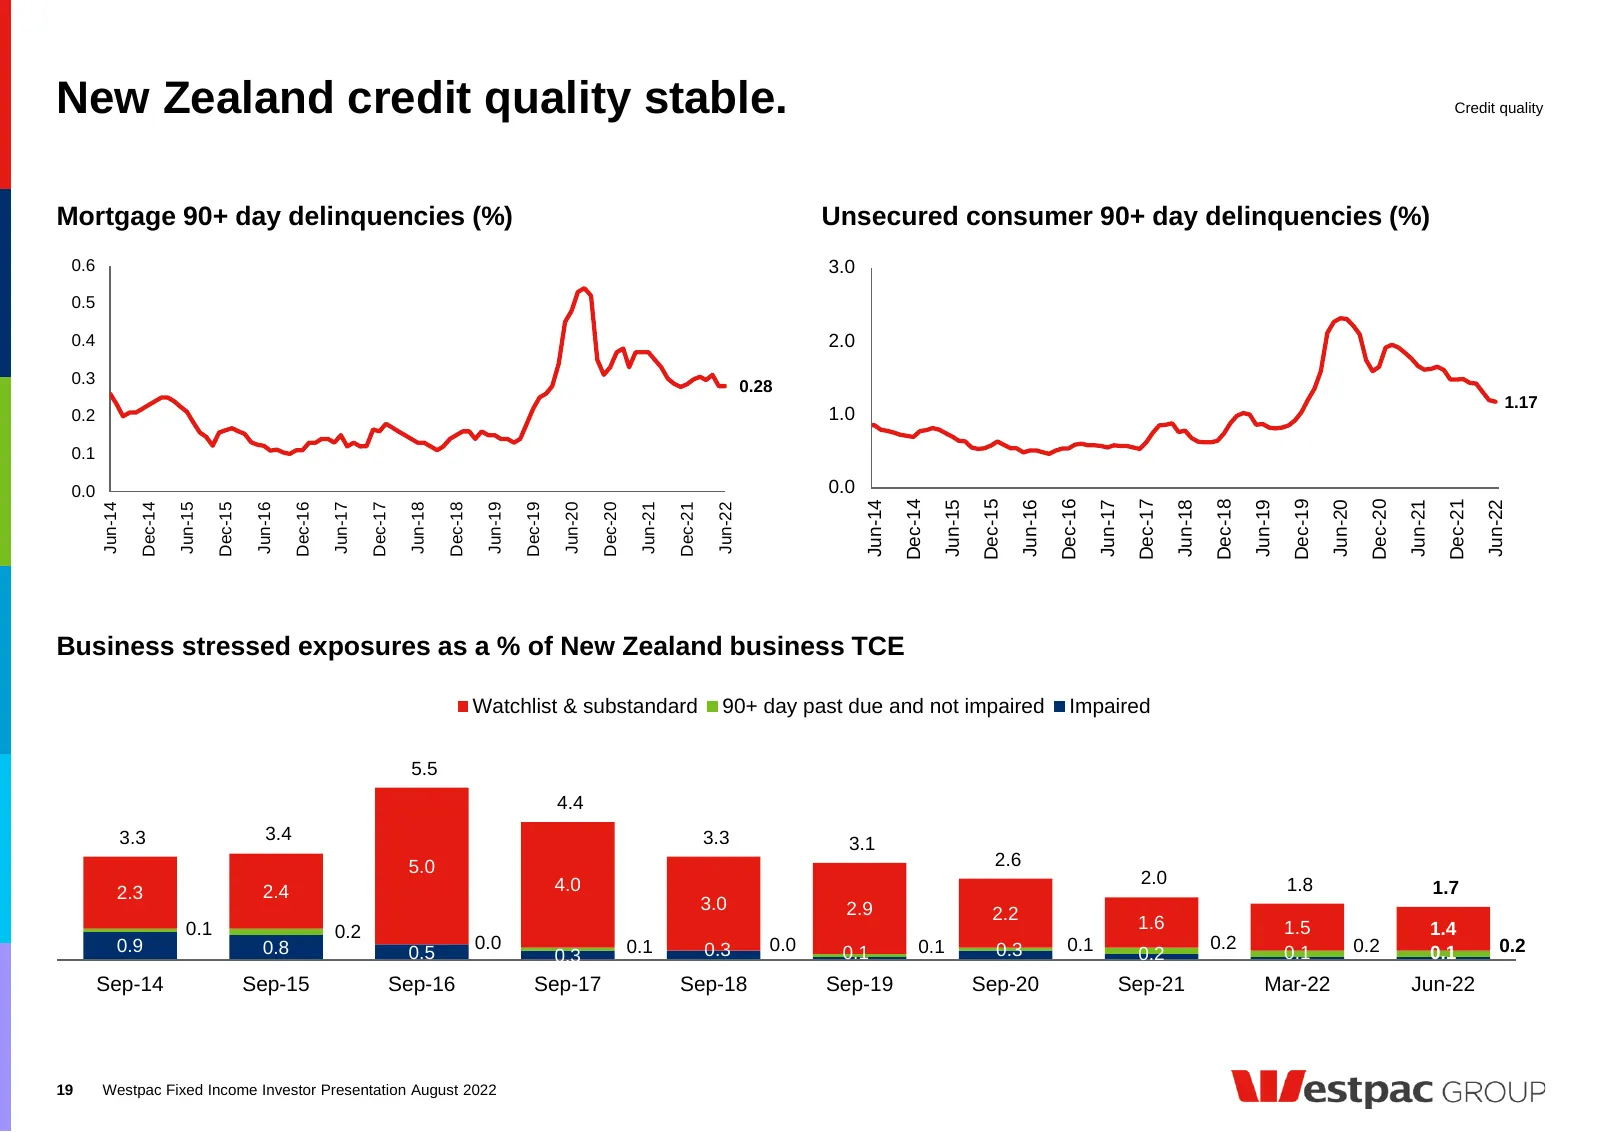
Slide 19: New Zealand credit quality stable
New Zealand credit quality stable. Credit quality Mortgage 90+ day delinquencies (%) Unsecured consumer 90+ day delinquencies (%) 0.6 3.0 0.5 0.4 2.0 0.3 0.28 1.17 0.2 1.0 0.1 0.0 0.0 Dec-14 Dec-15 Dec-16 Dec-17 Dec-18 Dec-19 Dec-20 Dec-21 Jun-14 Jun-15 Jun-16 Jun-17 Jun-18 Jun-19 Jun-20 Jun-21 Jun-
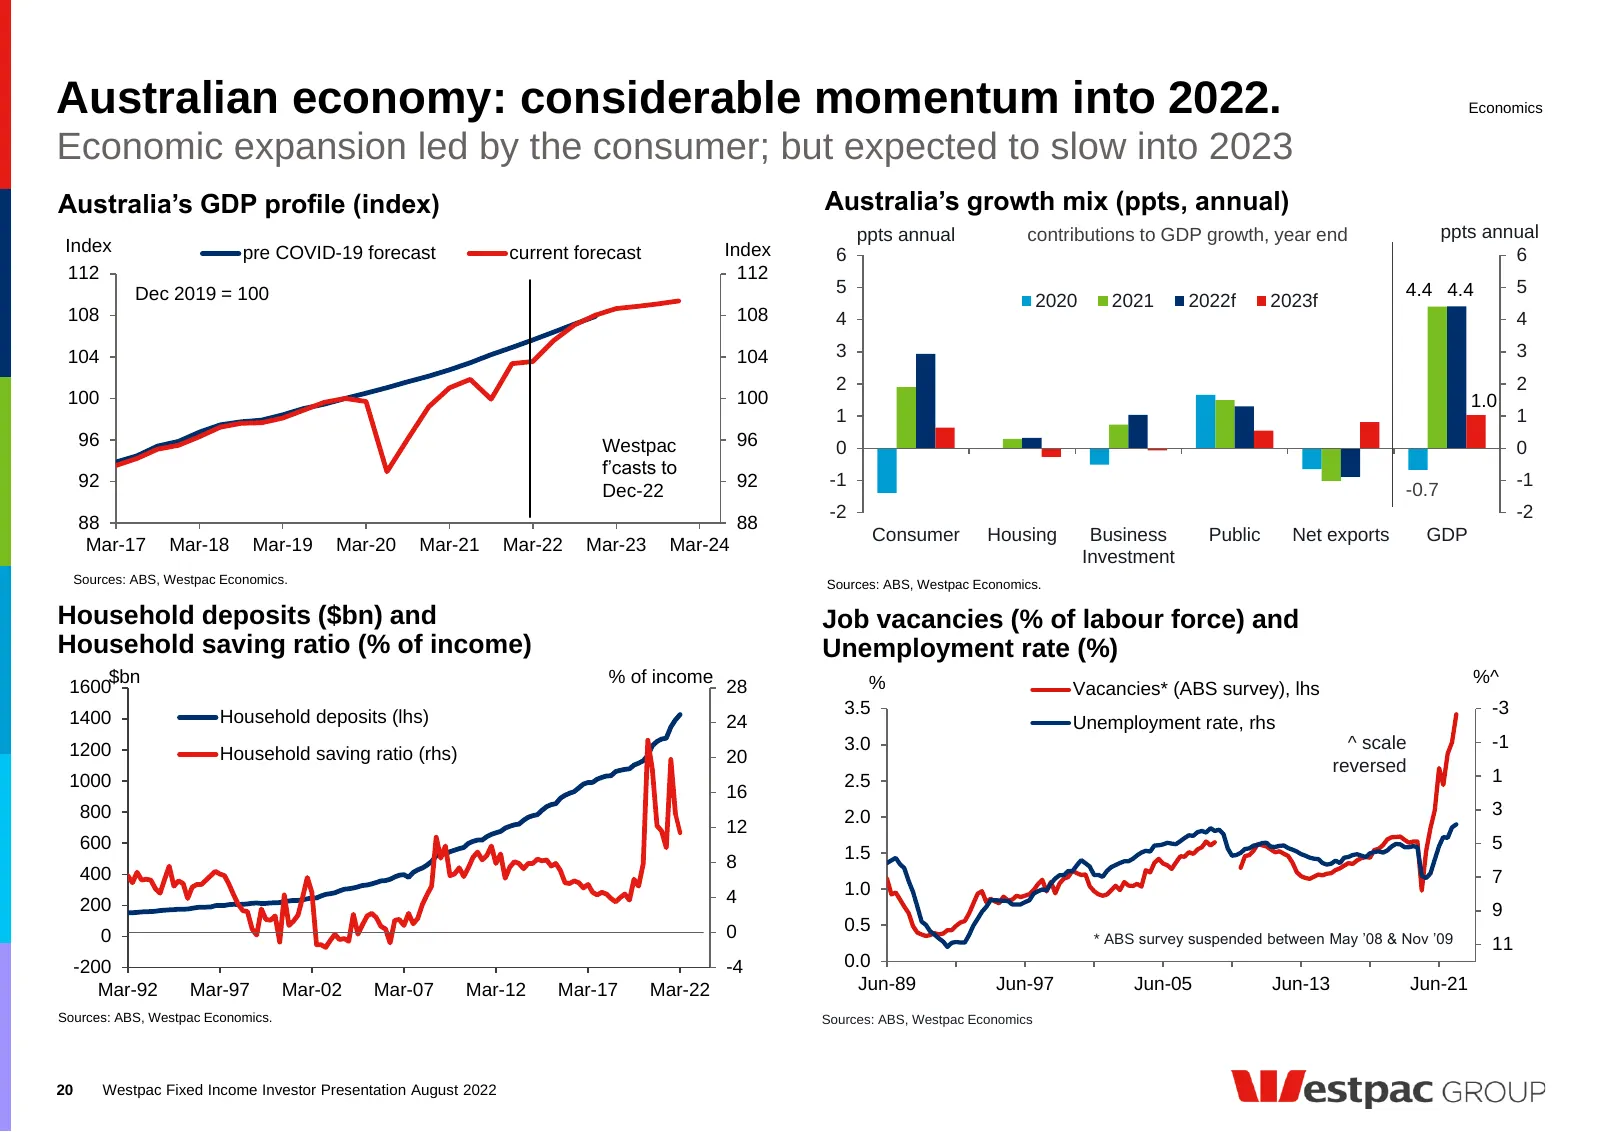
Slide 20: Australian economy: considerable momentum into 2022
Australian economy: considerable momentum into 2022. Economics Economic expansion led by the consumer; but expected to slow into 2023 Australia’s GDP profile (index) Australia’s growth mix (ppts, annual) ppts annual contributions to GDP growth, year end ppts annual Index pre COVID-19 forecast curren
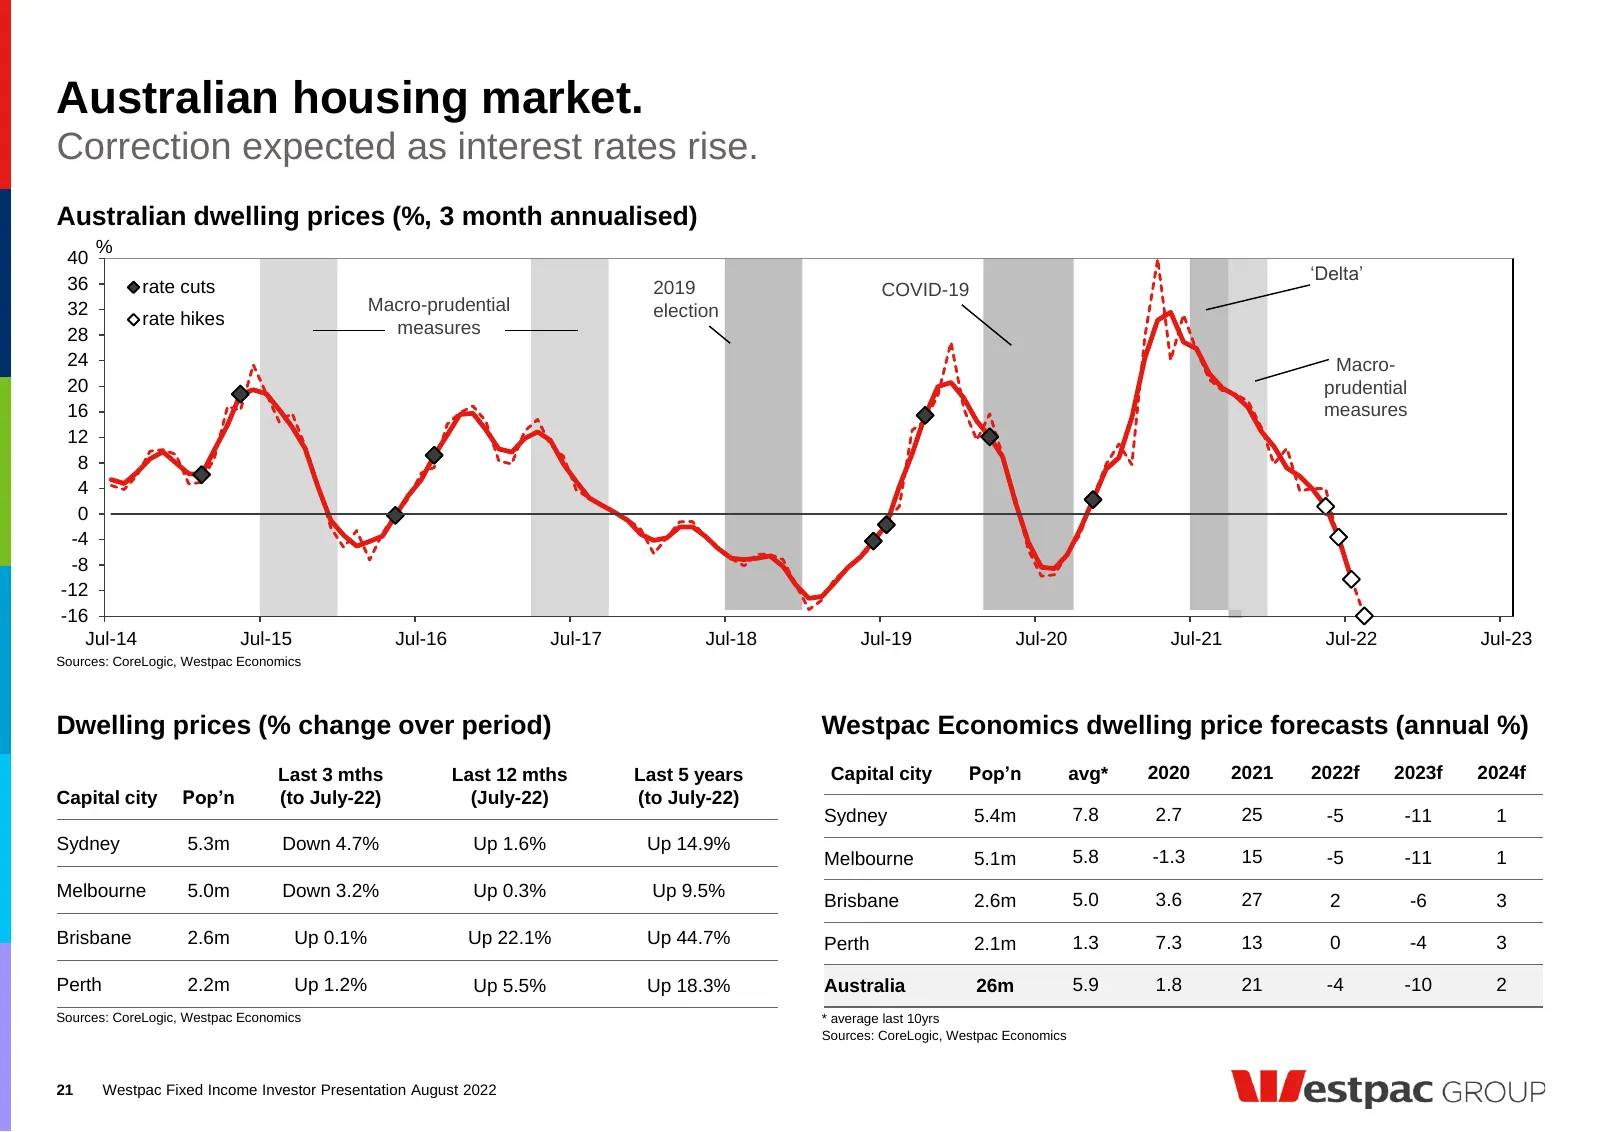
Slide 21: Australian housing market: Correction expected as interest rates rise
Australian housing market. Correction expected as interest rates rise. Australian dwelling prices (%, 3 month annualised) % 40 ‘Delta’ 36 rate cuts 2019 COVID-19 32 Macro-prudential election rate hikes measures 28 24 Macro- 20 prudential 16 measures 12 8 4 0 -4 -8 -12 -16 Jul-14 Jul-15 Jul-16 Jul-17
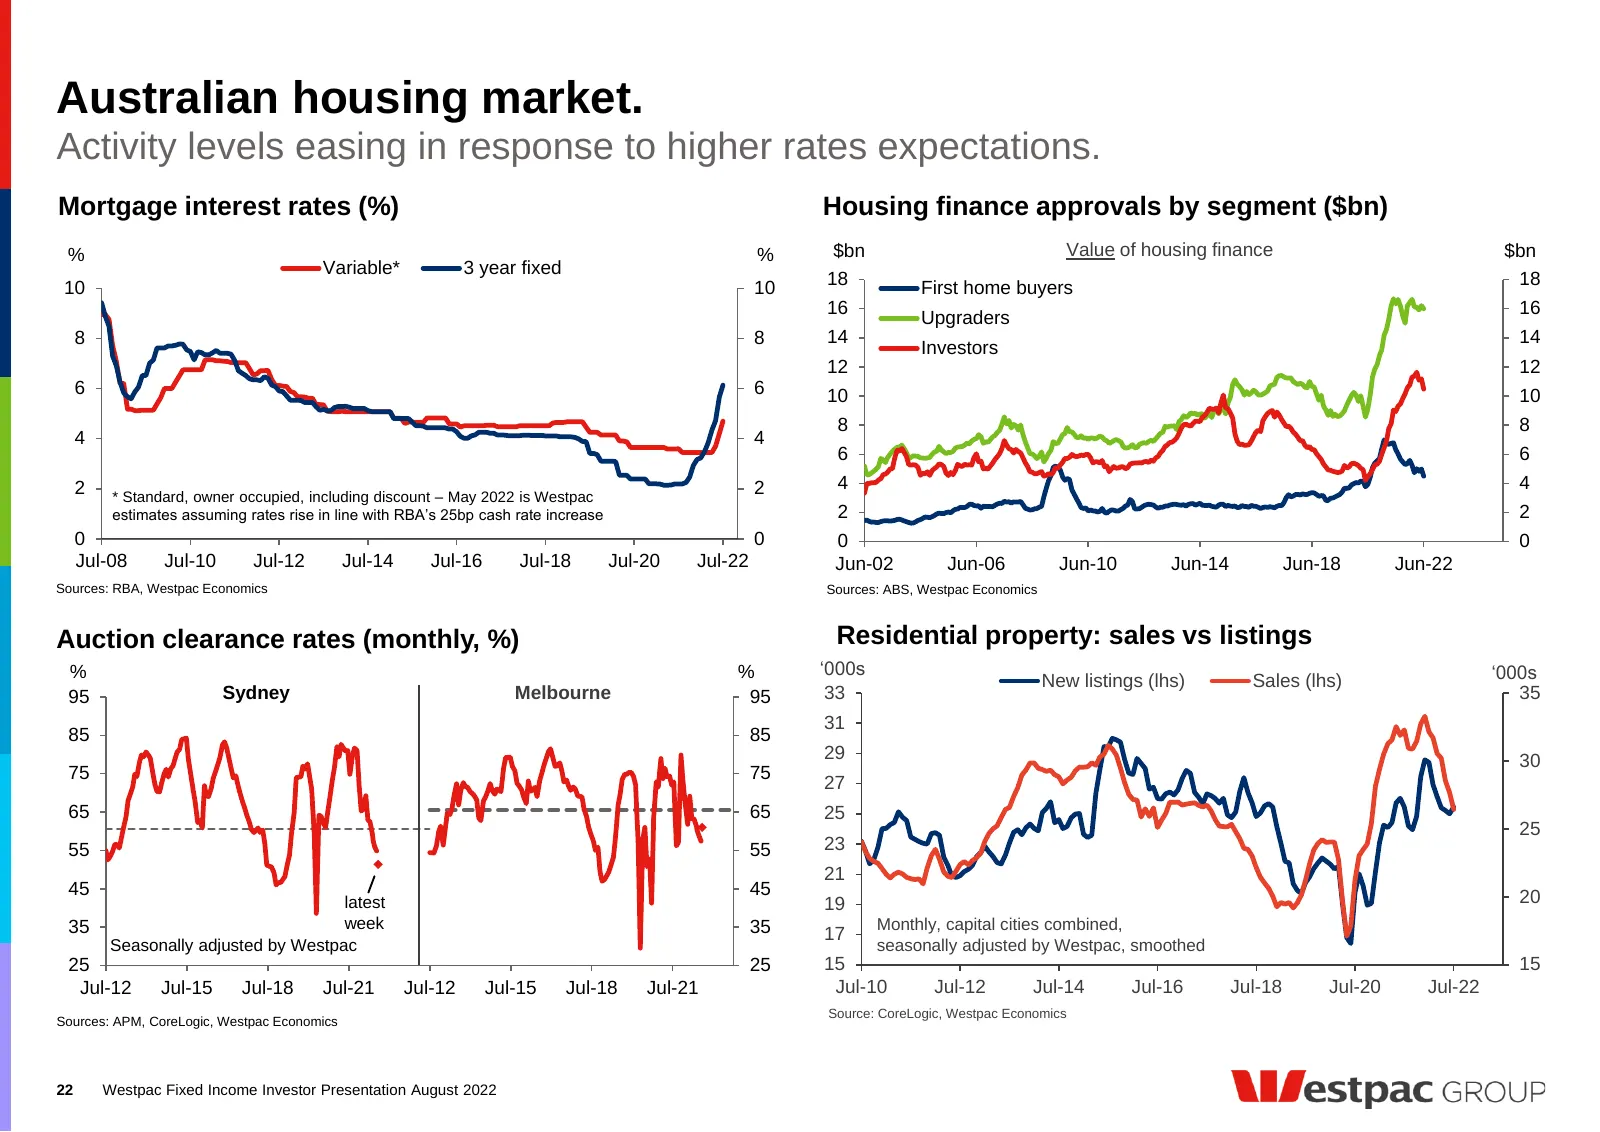
Slide 22: Australian housing market: Activity levels easing
Australian housing market. Activity levels easing in response to higher rates expectations. Mortgage interest rates (%) Housing finance approvals by segment ($bn) % % $bn Value of housing finance $bn Variable* 3 year fixed 10 10 18 First home buyers 18 16 16 Upgraders 8 8 14 14 Investors 12 12 6 6 1
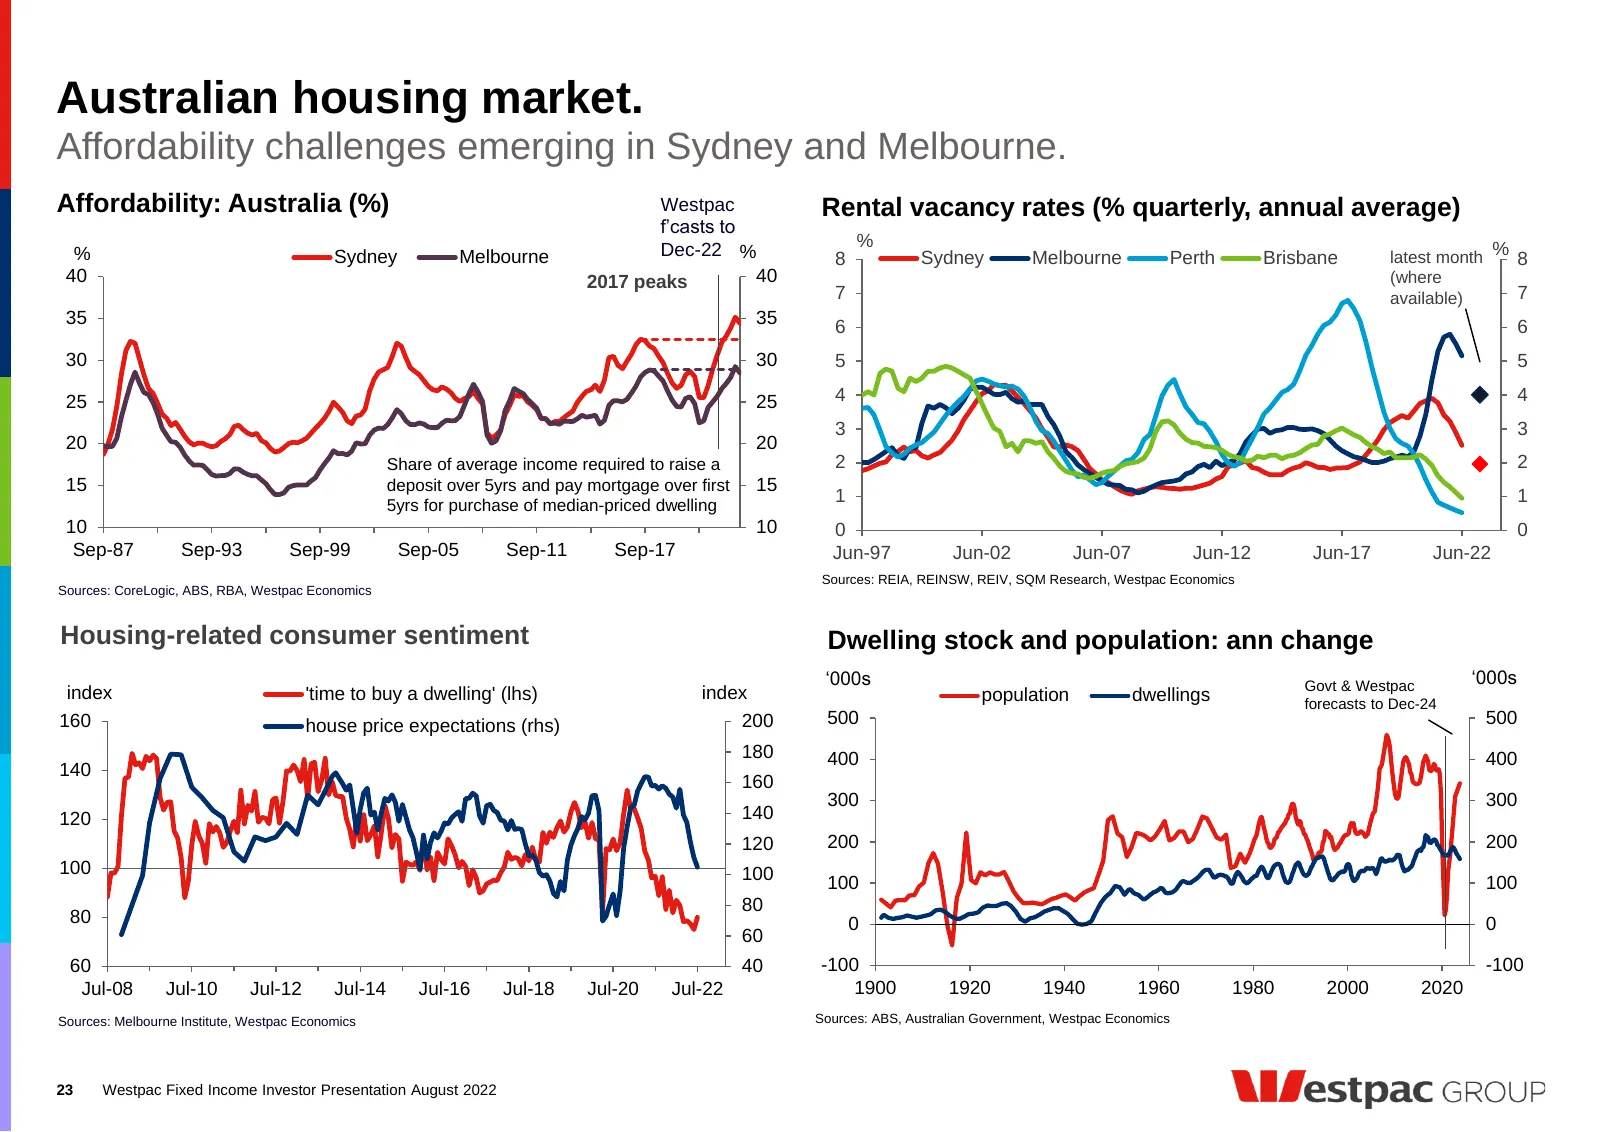
Slide 23: Australian housing market: Affordability challenges emerging
Australian housing market. Affordability challenges emerging in Sydney and Melbourne. Affordability: Australia (%) Westpac Rental vacancy rates (% quarterly, annual average) f’casts to % % Sydney Melbourne Dec-22 % 8 Sydney Melbourne Perth Brisbane latest month % 8 40 2017 peaks 40 (where 7 availabl
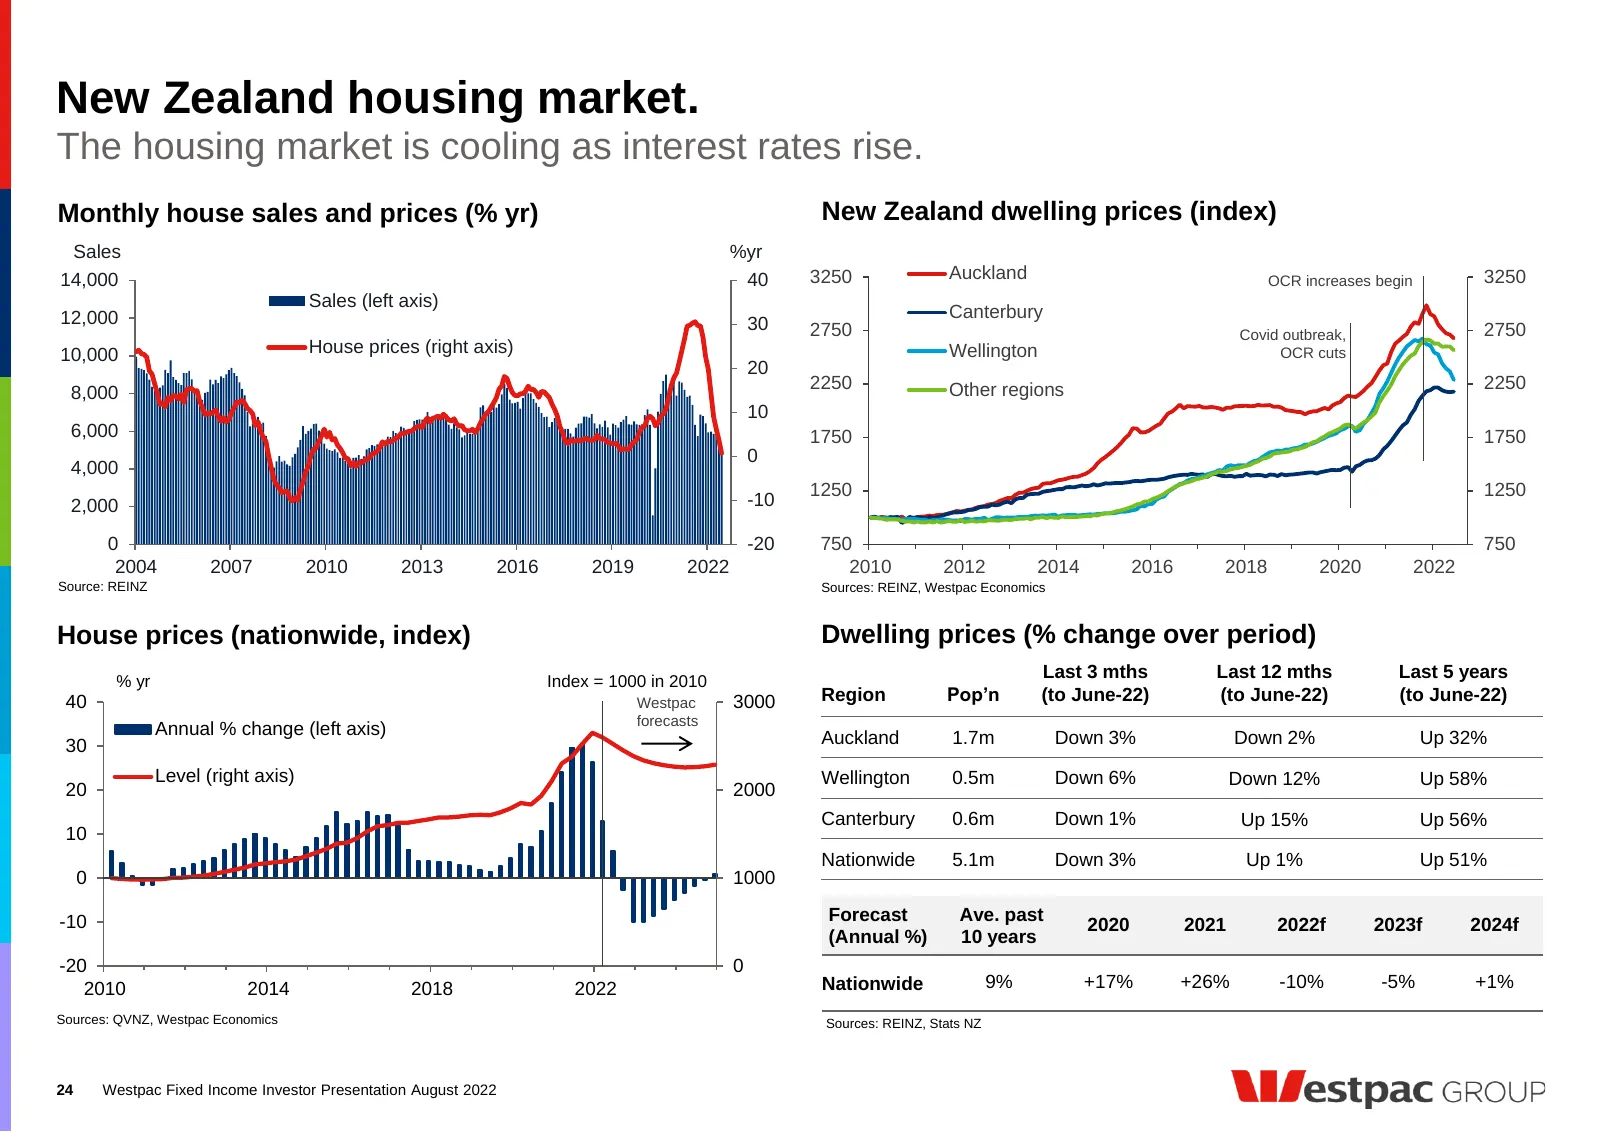
Slide 24: New Zealand housing market
New Zealand housing market. The housing market is cooling as interest rates rise. Monthly house sales and prices (% yr) New Zealand dwelling prices (index) Sales %yr 14,000 40 3250 Auckland OCR increases begin 3250 Sales (left axis) 12,000 Canterbury 30 2750 2750 Covid outbreak, 10,000 House prices
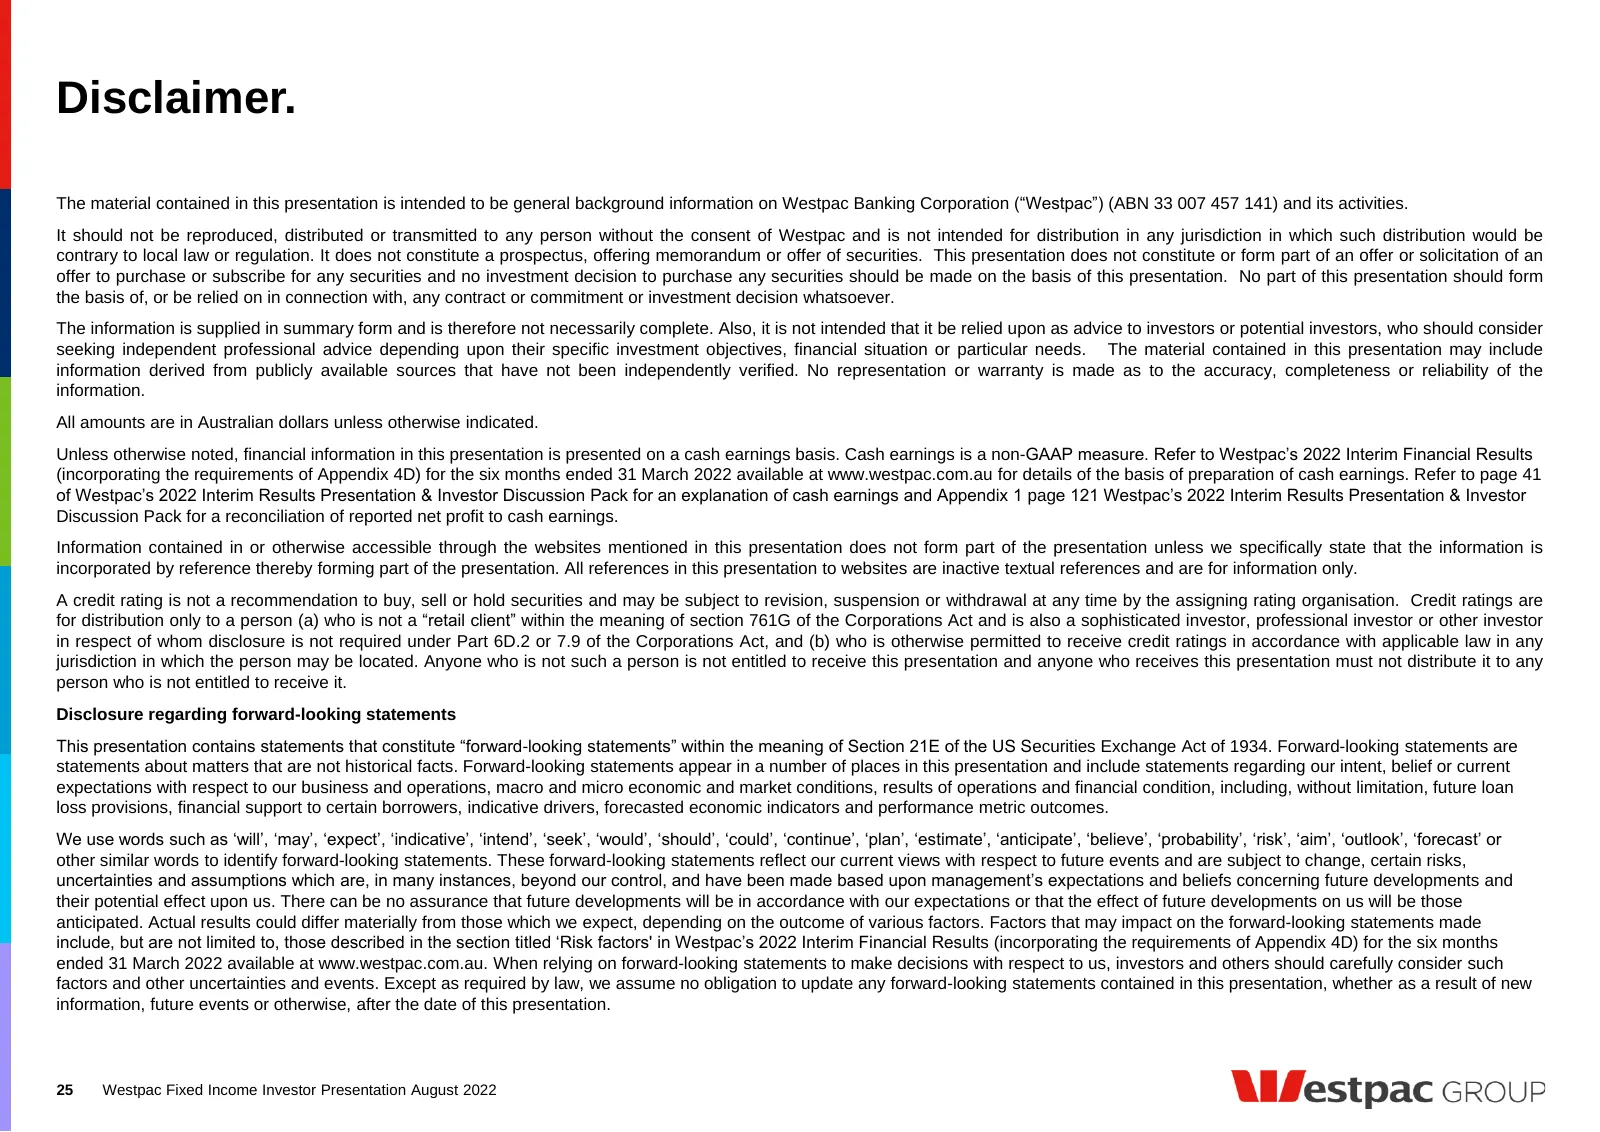
Slide 25: Disclaimer
Disclaimer. The material contained in this presentation is intended to be general background information on Westpac Banking Corporation (“Westpac”) (ABN 33 007 457 141) and its activities. It should not be reproduced, distributed or transmitted to any person without the consent of Westpac and is not
Source: Internet Archive copy of westpac.com.au
More decks from Westpac Banking Corporation
 FY2026 Earnings Presentation155 slides · Nov 2, 2026
 Q3 2026 Earnings Presentation17 slides · Aug 10, 2026
 Westpac New Zealand — Debt Investor Presentation (August 2026)17 slides · August 2026
 1H26 Earnings Presentation125 slides · May 5, 2026
 H1 2026 Earnings Presentation126 slides · May 5, 2026
 Debt Investor Presentation (May 2026)29 slides · May 2026