Curo — Merger or Acquisition (May 2022)
23 slides from Curo's merger presentation, May 19, 2022
Slide 1: Sale of Legacy U.S. Direct Lending Business and Acquisition of First Heritage Credit
Exhibit 99.2 Sale of Legacy U.S. Direct Lending Business and Acquisition of First Heritage Credit Maximizing Shareholder Value While Accelerating CURO’s Leadership Position as a Full Spectrum Financial Services Provider in North America M A Y 1 9 , 2 0 2 2
Slide 2: Disclaimer
D I S C L A I M E R IMPORTANT: You must read the following information before continuing to the rest of the presentation, which is being provided to you for informational purposes only. FORWARD-LOOKING STATEMENTS This presentation contains forward-looking statements. These forward-looking statements
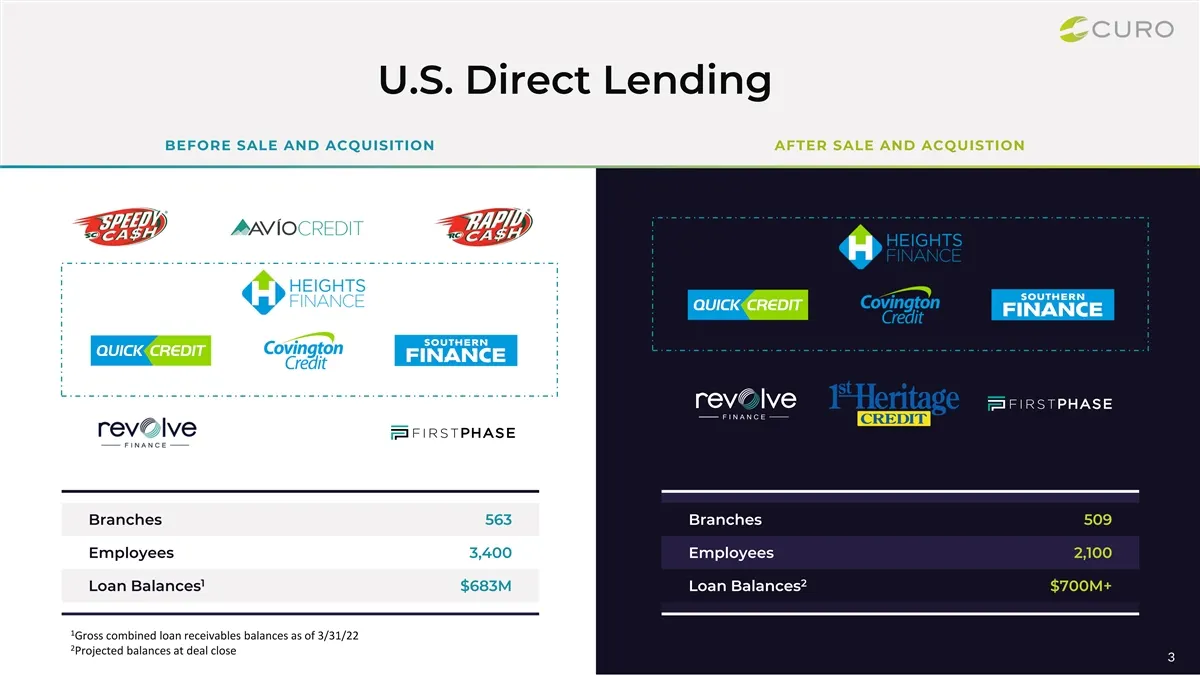
Slide 3: U.S. Direct Lending Before and After Sale and Acquisition
U.S. Direct Lending BEFORE SALE AND ACQUISITION AFTER SALE AND ACQUISTION Branches 563 Branches 509 Employees 3,400 Employees 2,100 1 2 Loan Balances $683M Loan Balances $700M+ 1 Gross combined loan receivables balances as of 3/31/22 2 Projected balances at deal close 3
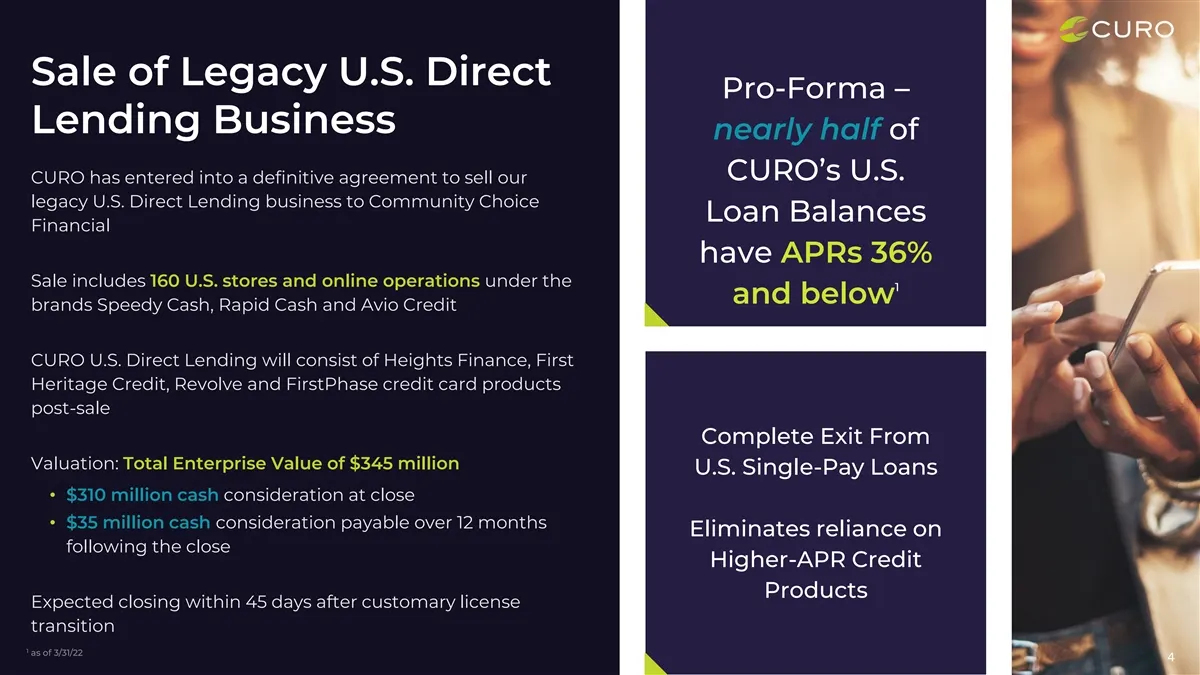
Slide 4: Sale of Legacy U.S. Direct Lending Business
Sale of Legacy U.S. Direct Pro-Forma – Lending Business nearly half of CURO’s U.S. CURO has entered into a definitive agreement to sell our legacy U.S. Direct Lending business to Community Choice Loan Balances Financial have APRs 36% Sale includes 160 U.S. stores and online operations under the 1 an
Slide 5: Acquisition of First Heritage Credit
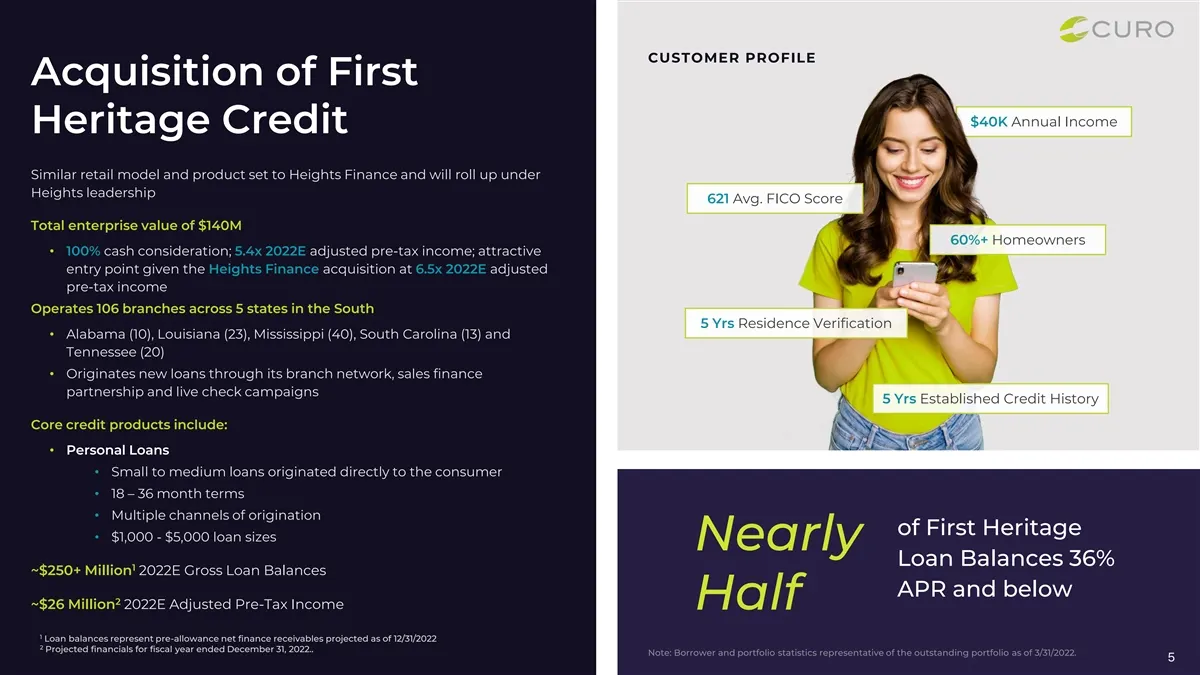
CUSTOMER PROFILE Acquisition of First $40K Annual Income Heritage Credit Similar retail model and product set to Heights Finance and will roll up under Heights leadership 621 Avg. FICO Score Total enterprise value of $140M 60%+ Homeowners • 100% cash consideration; 5.4x 2022E adjusted pre-tax income
Slide 6: Advancing Our Long-Term Strategy
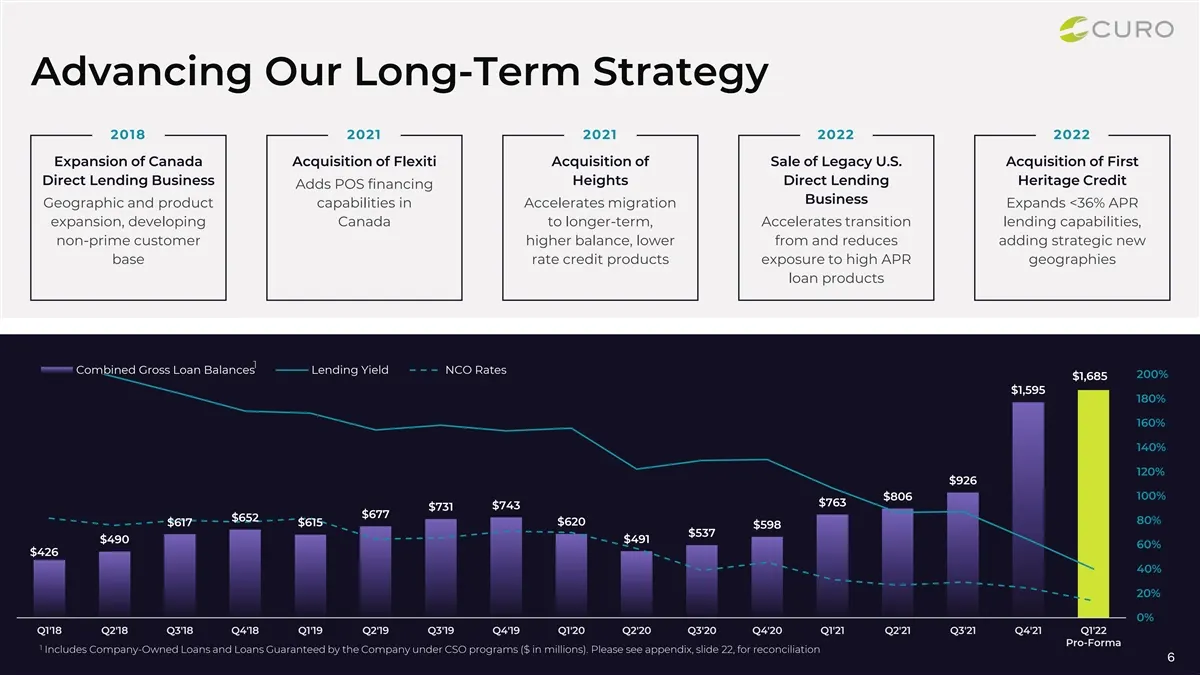
Advancing Our Long-Term Strategy 2018 2021 2021 2022 2022 Expansion of Canada Acquisition of Flexiti Acquisition of Sale of Legacy U.S. Acquisition of First Direct Lending Business Heights Direct Lending Heritage Credit Adds POS financing Business Geographic and product capabilities in Accelerates m
Slide 7: Recap of the Transactions
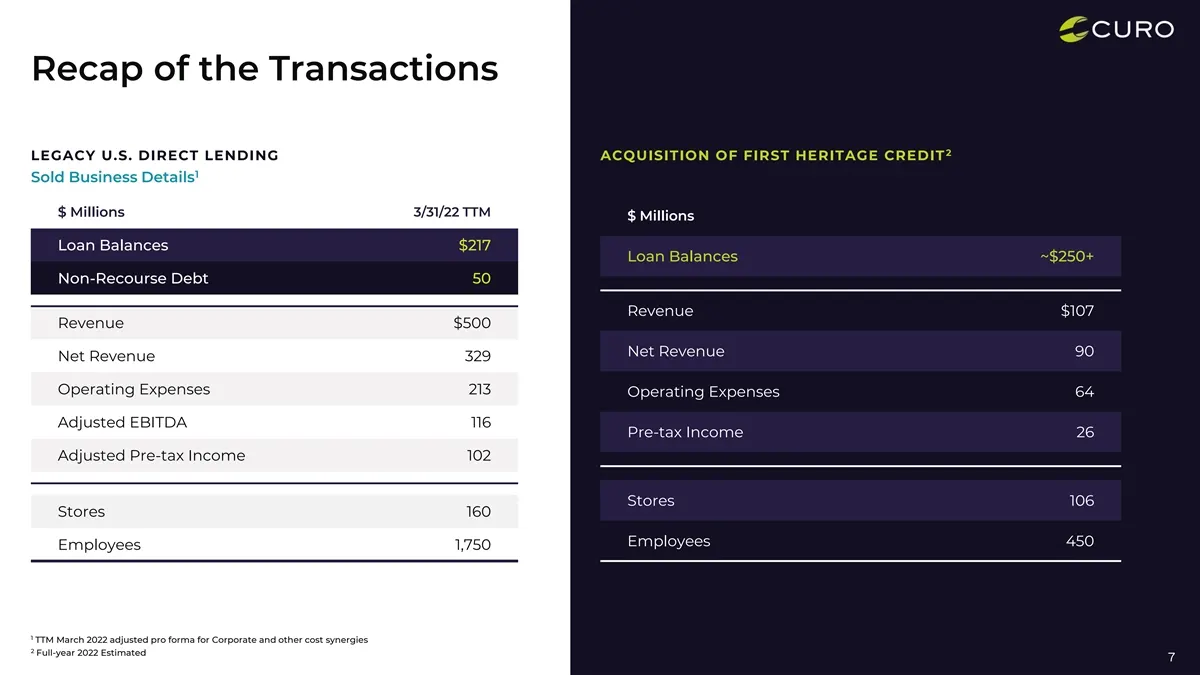
Recap of the Transactions 2 LEGACY U.S. DIRECT LENDING ACQUISITION OF FIRST HERITAGE CREDIT 1 Sold Business Details 3/31/22 TTM $ Millions $ Millions Loan Balances $217 Loan Balances ~$250+ Non-Recourse Debt 50 Revenue $107 Revenue $500 Net Revenue 90 Net Revenue 329 Operating Expenses 213 Operating
Slide 8: 2022 and 2023 Outlook Recap
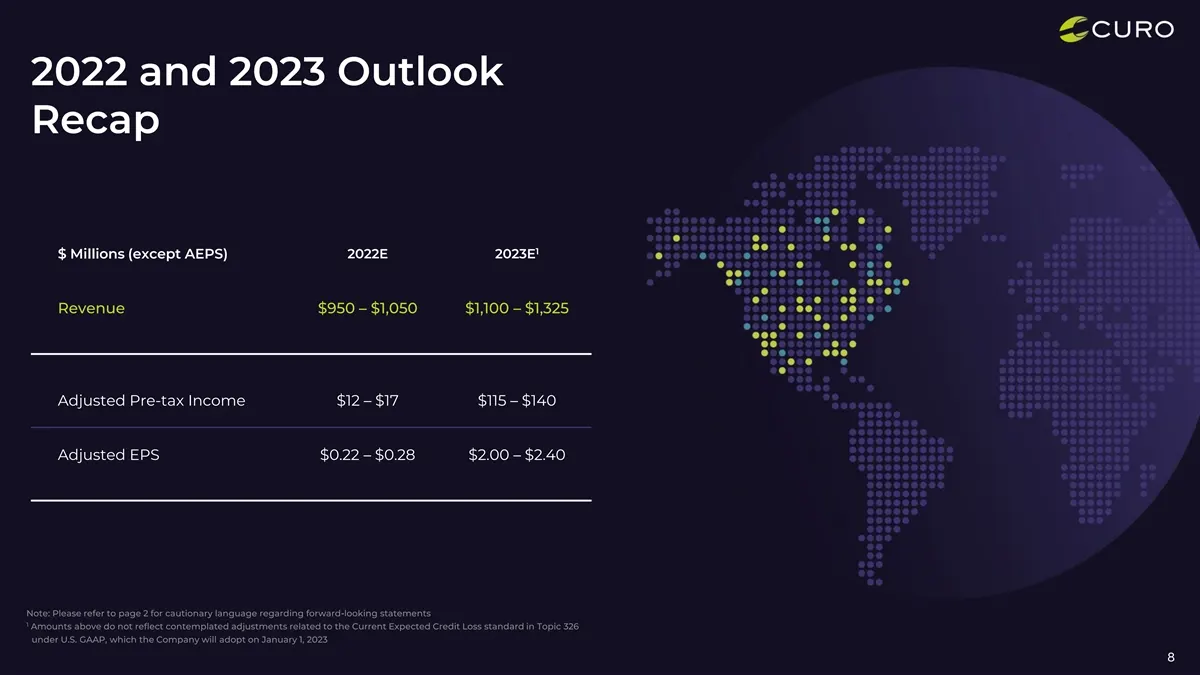
2022 and 2023 Outlook Recap 1 $ Millions (except AEPS) 2022E 2023E Revenue $950 – $1,050 $1,100 – $1,325 Adjusted Pre-tax Income $12 – $17 $115 – $140 Adjusted EPS $0.22 – $0.28 $2.00 – $2.40 8
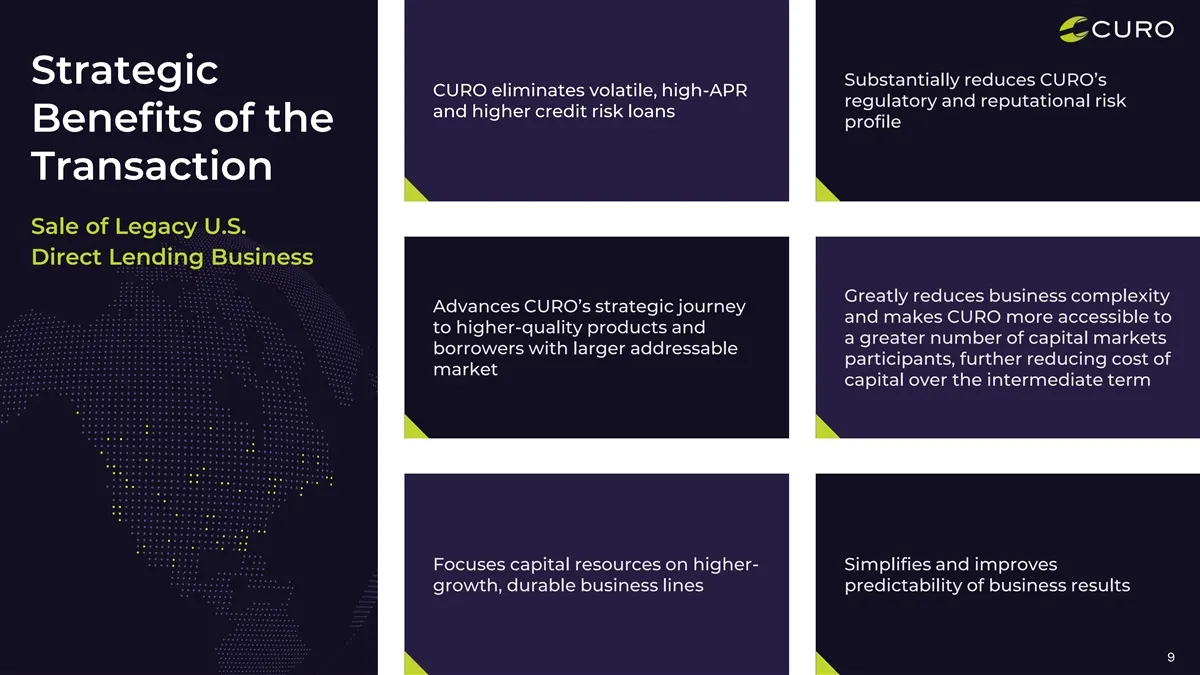
Slide 9: Strategic Benefits of the Transaction: Sale of Legacy U.S. Direct Lending Business
Strategic Substantially reduces CURO’s CURO eliminates volatile, high-APR regulatory and reputational risk and higher credit risk loans profile Benefits of the Transaction Sale of Legacy U.S. Direct Lending Business Greatly reduces business complexity Advances CURO’s strategic journey and makes CURO
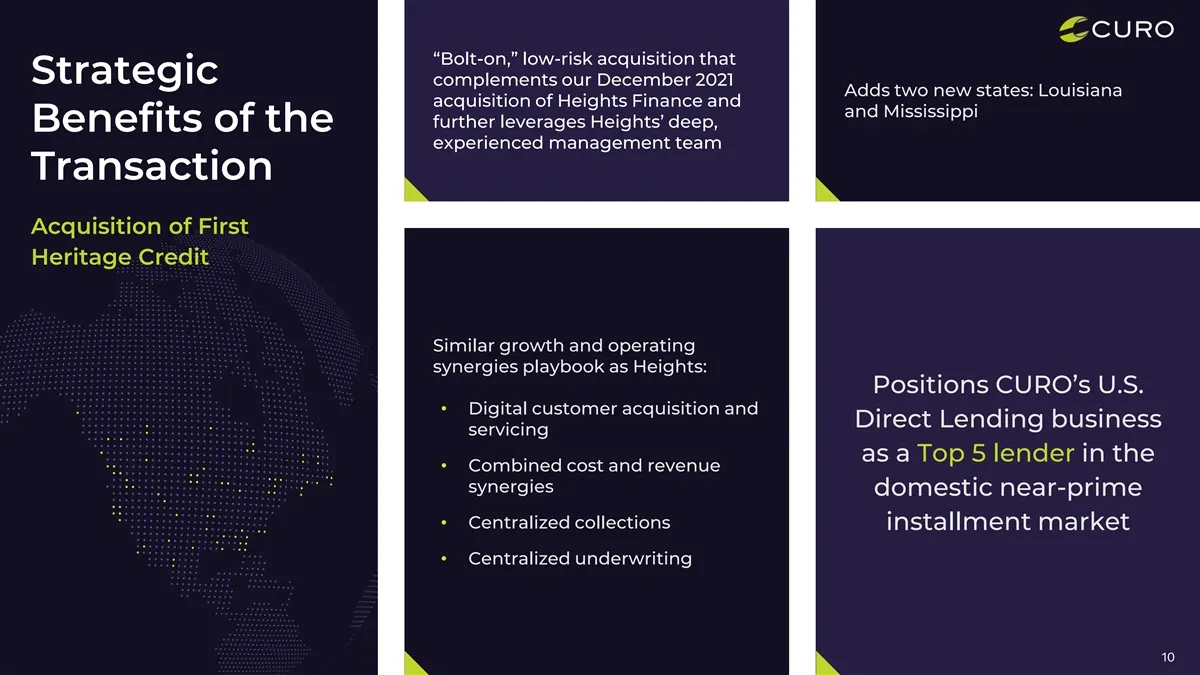
Slide 10: Strategic Benefits of the Transaction: Acquisition of First Heritage Credit
“Bolt-on,” low-risk acquisition that Strategic complements our December 2021 Adds two new states: Louisiana acquisition of Heights Finance and and Mississippi further leverages Heights’ deep, Benefits of the experienced management team Transaction Acquisition of First Heritage Credit Similar growth
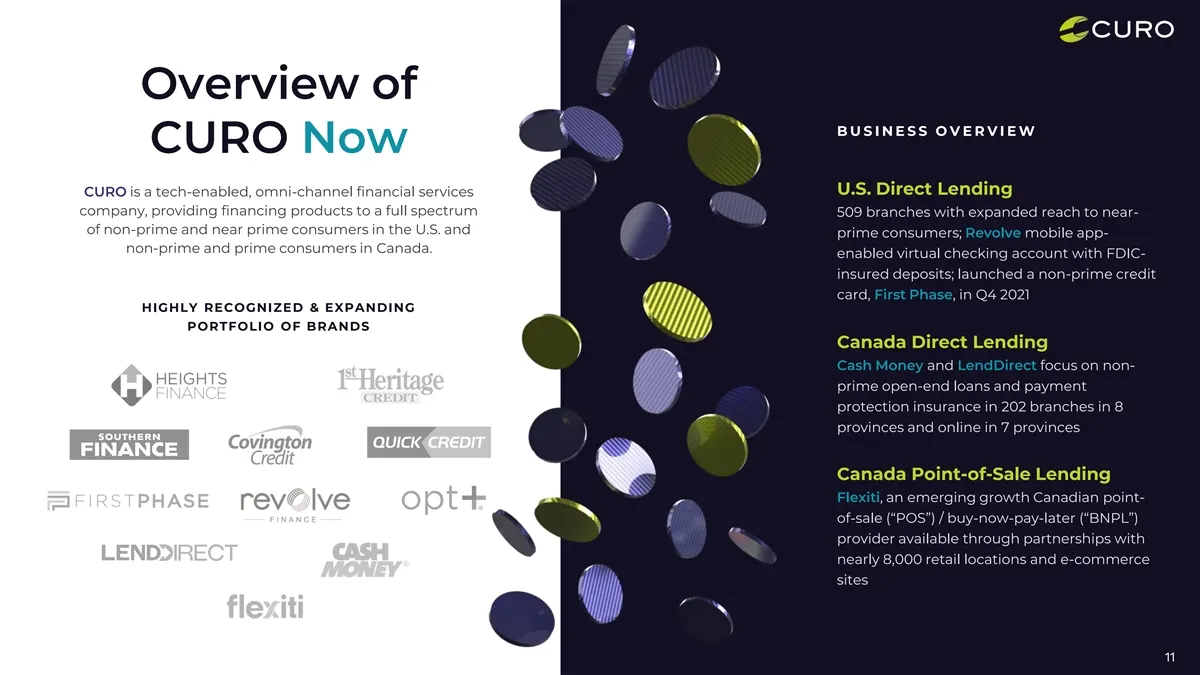
Slide 11: Overview of CURO Now
Overview of B U S I N E S S O V E R V I E W CURO Now U.S. Direct Lending CURO is a tech-enabled, omni-channel financial services company, providing financing products to a full spectrum 509 branches with expanded reach to near- of non-prime and near prime consumers in the U.S. and prime consumers; R
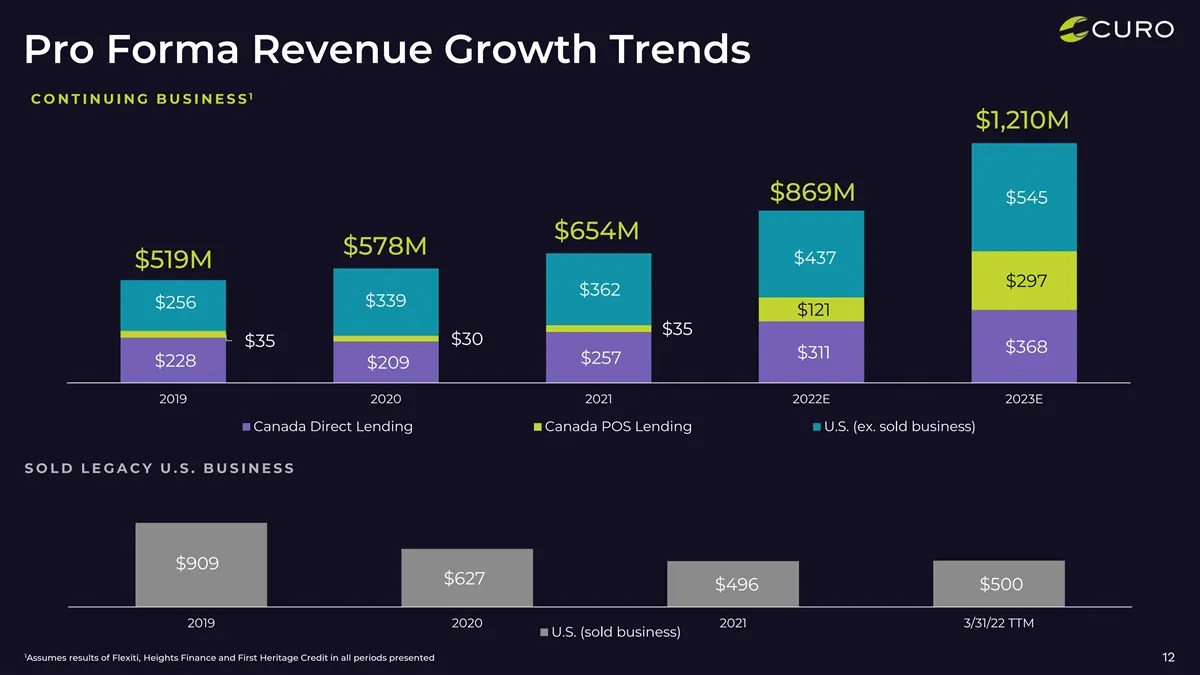
Slide 12: Pro Forma Revenue Growth Trends
Pro Forma Revenue Growth Trends 1 C O N T I N U I N G B U S I N E S S $1,210M $869M $545 $654M $578M $437 $519M $297 $362 $339 $256 $121 $35 $30 $35 $368 $311 $257 $228 $209 2019 2020 2021 2022E 2023E Canada Direct Lending Canada POS Lending U.S. (ex. sold business) S O L D L E G A C Y U . S . B U S
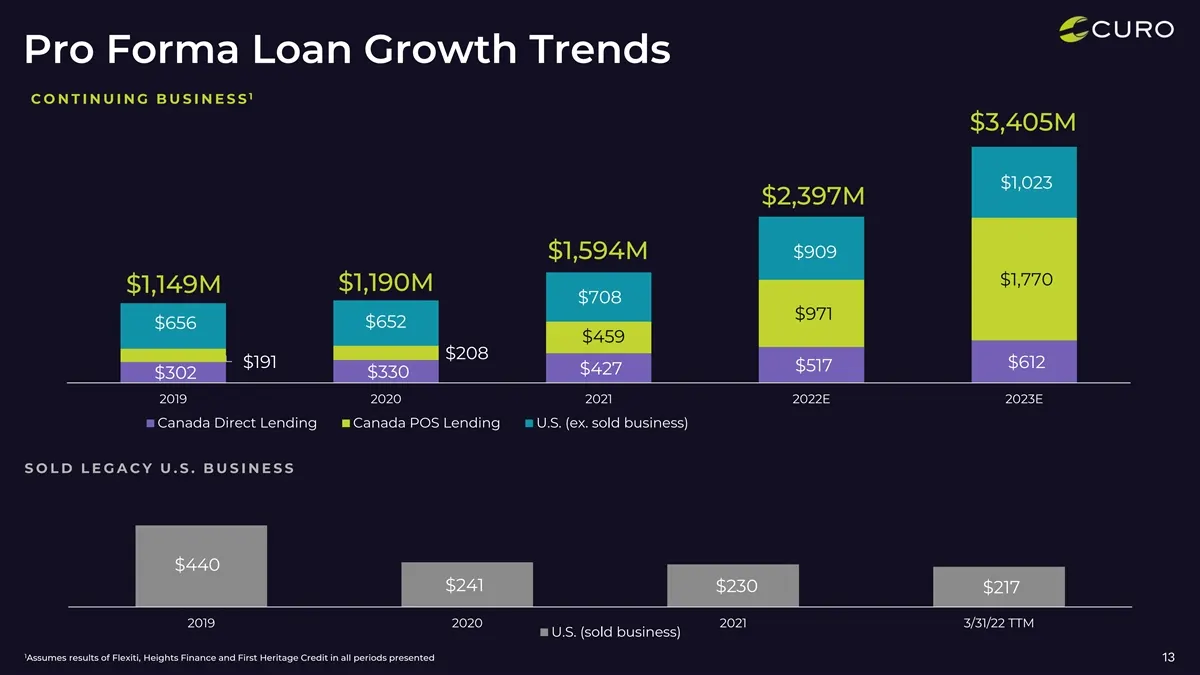
Slide 13: Pro Forma Loan Growth Trends
Pro Forma Loan Growth Trends 1 C O N T I N U I N G B U S I N E S S $3,405M $1,023 $2,397M $1,594M $909 $1,770 $1,190M $1,149M $708 $971 $652 $656 $459 $208 $191 $612 $517 $427 $330 $302 2019 2020 2021 2022E 2023E Canada Direct Lending Canada POS Lending U.S. (ex. sold business) S O L D L E G A C Y U
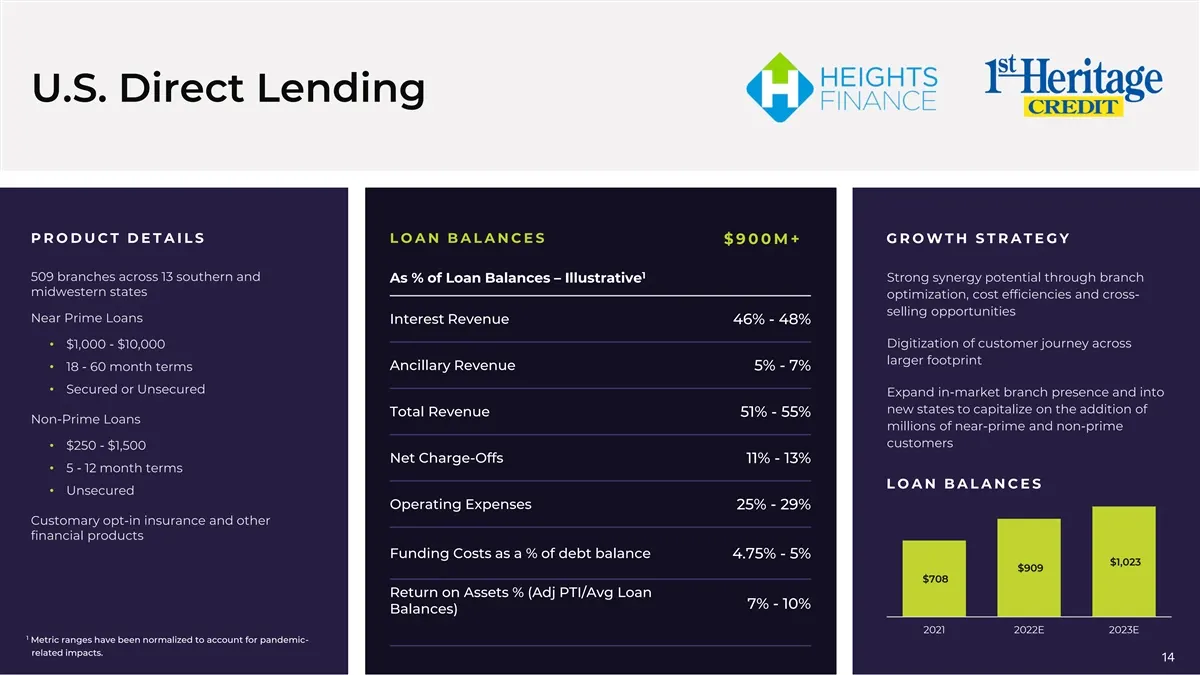
Slide 14: U.S. Direct Lending
U.S. Direct Lending P R O D U C T D E T A I L S L O A N B A L A N C E S $ 9 0 0 M + G R O W T H S T R A T E G Y 1 509 branches across 13 southern and Strong synergy potential through branch As % of Loan Balances – Illustrative midwestern states optimization, cost efficiencies and cross- selling oppo
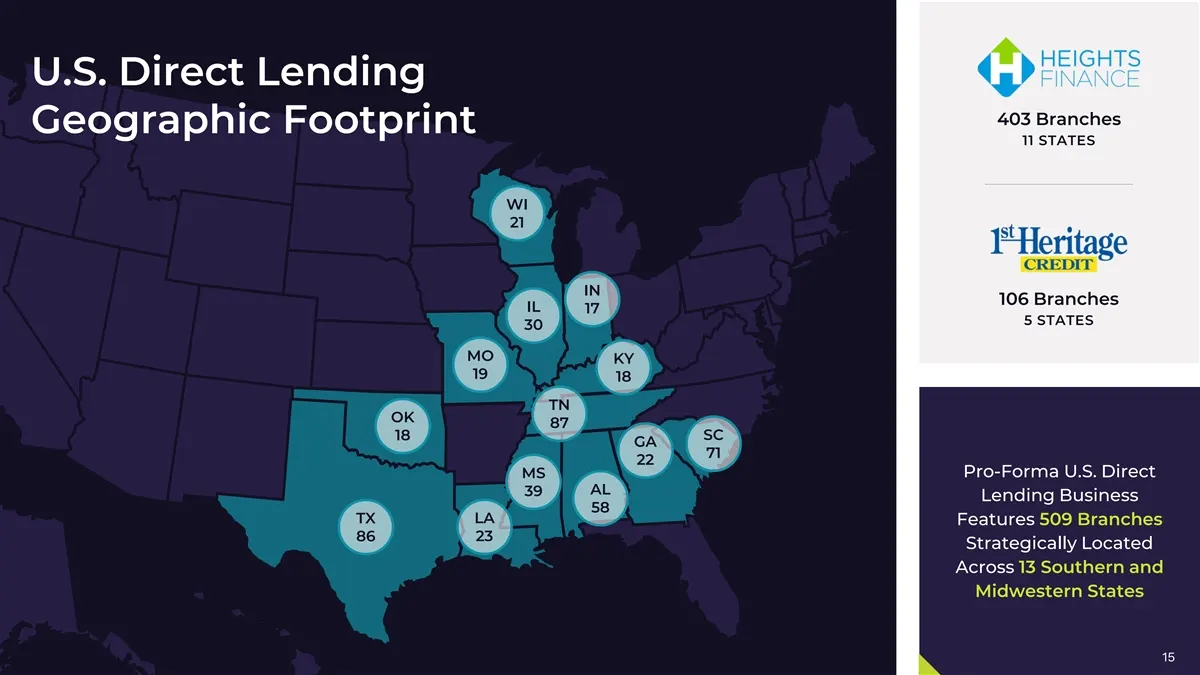
Slide 15: U.S. Direct Lending Branches Geographic Footprint
U.S. Direct Lending 403 Branches Geographic Footprint 11 STATES WI 21 IN 106 Branches IL 17 5 STATES 30 MO KY 19 18 TN OK 87 18 SC GA 71 22 Pro-Forma U.S. Direct MS AL 39 Lending Business 58 TX LA Features 509 Branches 86 23 Strategically Located Across 13 Southern and Midwestern States 15
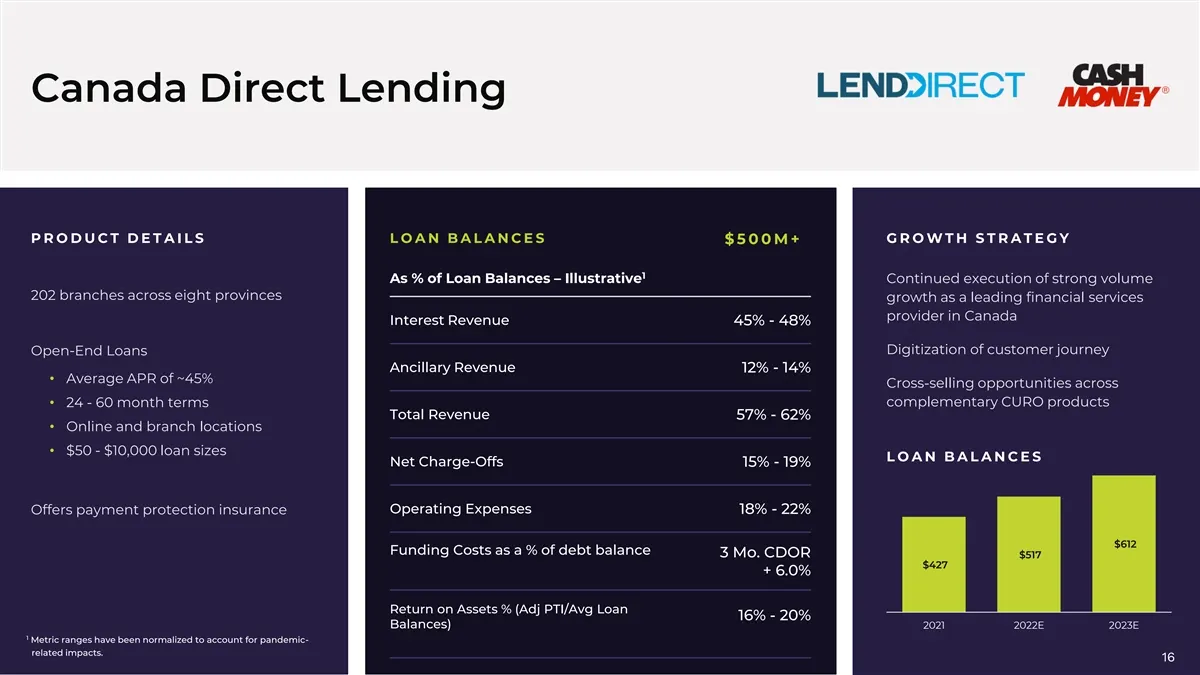
Slide 16: Canada Direct Lending
Canada Direct Lending P R O D U C T D E T A I L S L O A N B A L A N C E S $ 5 0 0 M + G R O W T H S T R A T E G Y 1 As % of Loan Balances – Illustrative Continued execution of strong volume 202 branches across eight provinces growth as a leading financial services provider in Canada Interest Revenue
Slide 17: Canada Point-of-Sale
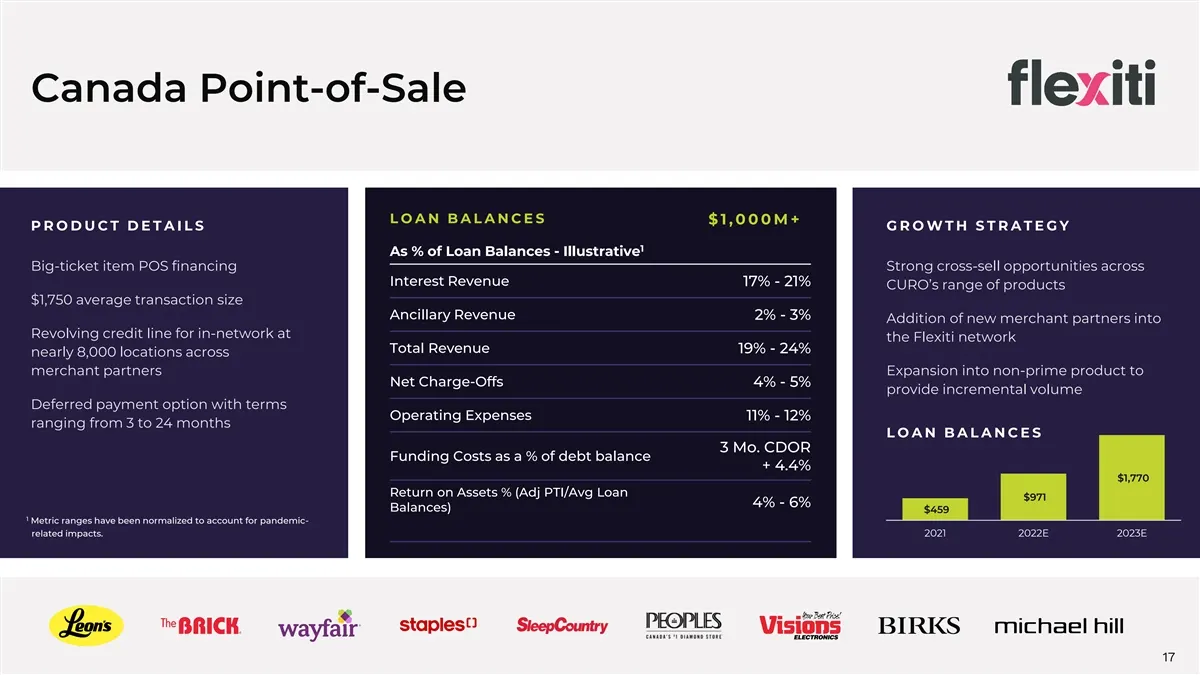
Canada Point-of-Sale L O A N B A L A N C E S $ 1 , 0 0 0 M + P R O D U C T D E T A I L S G R O W T H S T R A T E G Y 1 As % of Loan Balances - Illustrative Big-ticket item POS financing Strong cross-sell opportunities across Interest Revenue 17% - 21% CURO’s range of products $1,750 average transact
Slide 18: CURO Expected to Have a Well-Capitalized Balance Sheet
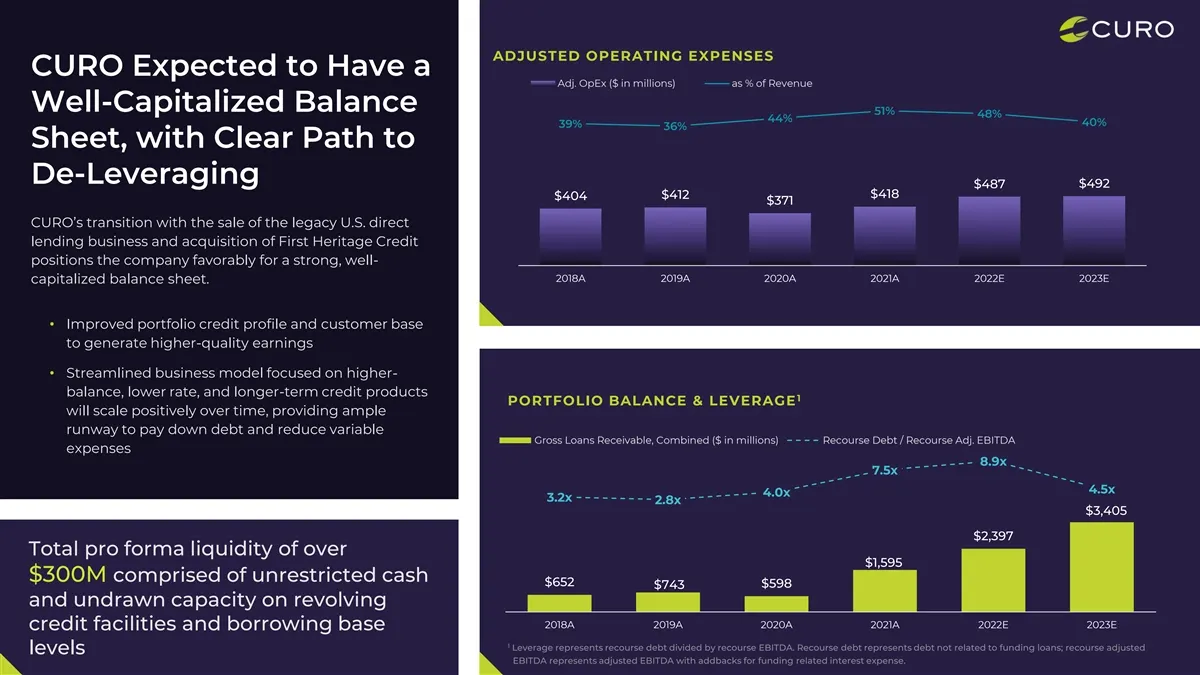
ADJUSTED OPERATING EXPENSES CURO Expected to Have a Adj. OpEx ($ in millions) as % of Revenue Well-Capitalized Balance 51% 48% 44% 40% 39% 36% Sheet, with Clear Path to De-Leveraging $492 $487 $412 $418 $404 $371 CURO’s transition with the sale of the legacy U.S. direct lending business and acquisit
Slide 19: 2022 Earnings Outlook
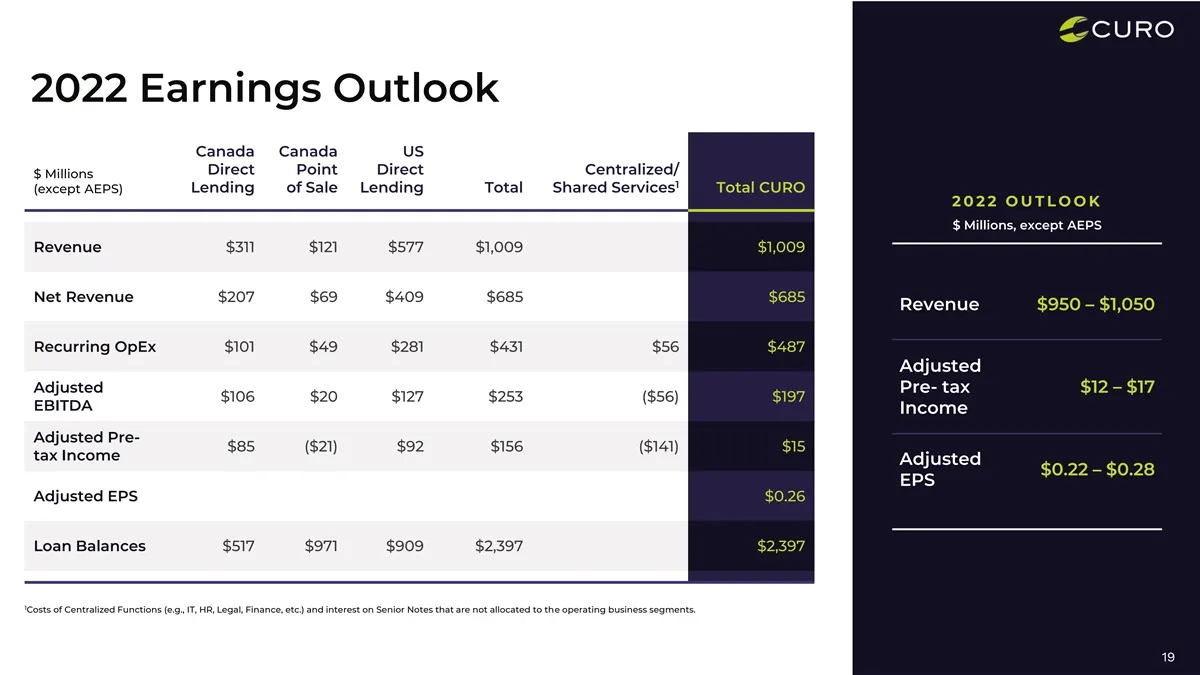
2022 Earnings Outlook Canada Canada US Direct Point Direct Centralized/ $ Millions 1 Lending of Sale Lending Total Shared Services Total CURO (except AEPS) 2 0 2 2 O U T L O O K $ Millions, except AEPS Revenue $311 $121 $577 $1,009 $1,009 Net Revenue $207 $69 $409 $685 $685 Revenue $950 – $1,050 Rec
Slide 20: 2023 Earnings Outlook
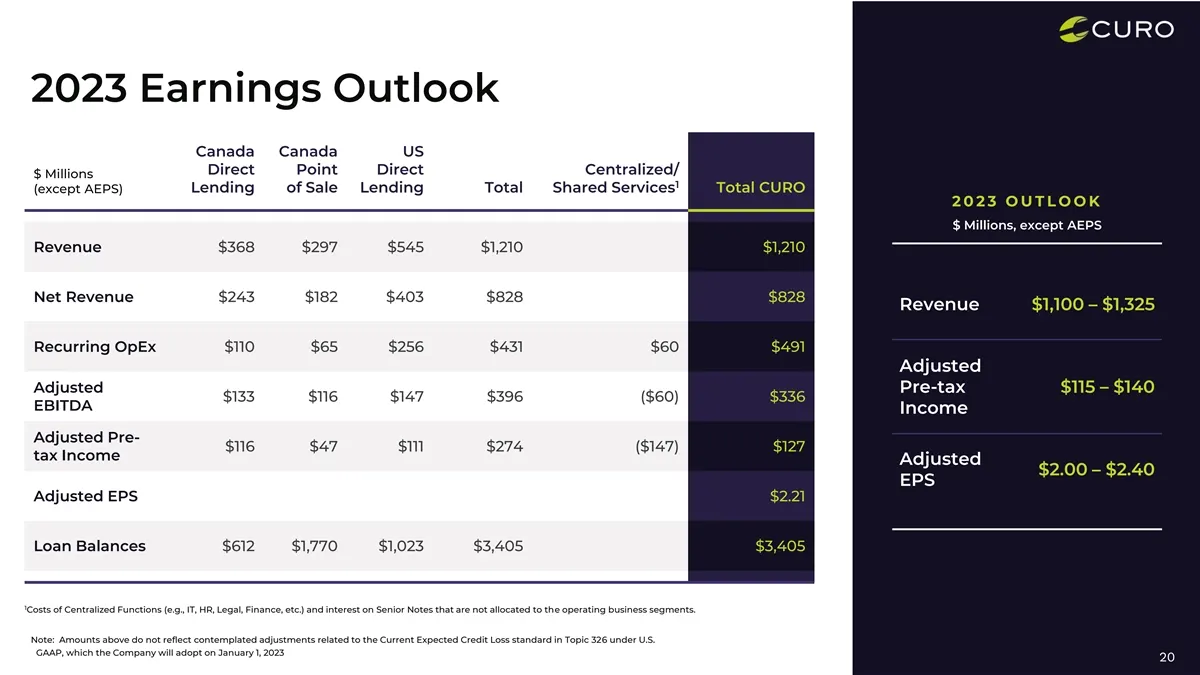
2023 Earnings Outlook Canada Canada US Direct Point Direct Centralized/ $ Millions 1 Lending of Sale Lending Total Shared Services Total CURO (except AEPS) 2 0 2 3 O U T L O O K $ Millions, except AEPS Revenue $368 $297 $545 $1,210 $1,210 Net Revenue $243 $182 $403 $828 $828 Revenue $1,100 – $1,325

Slide 21: Appendix
Appendix 21
Slide 22: Historical Gross Combined Loan Receivables
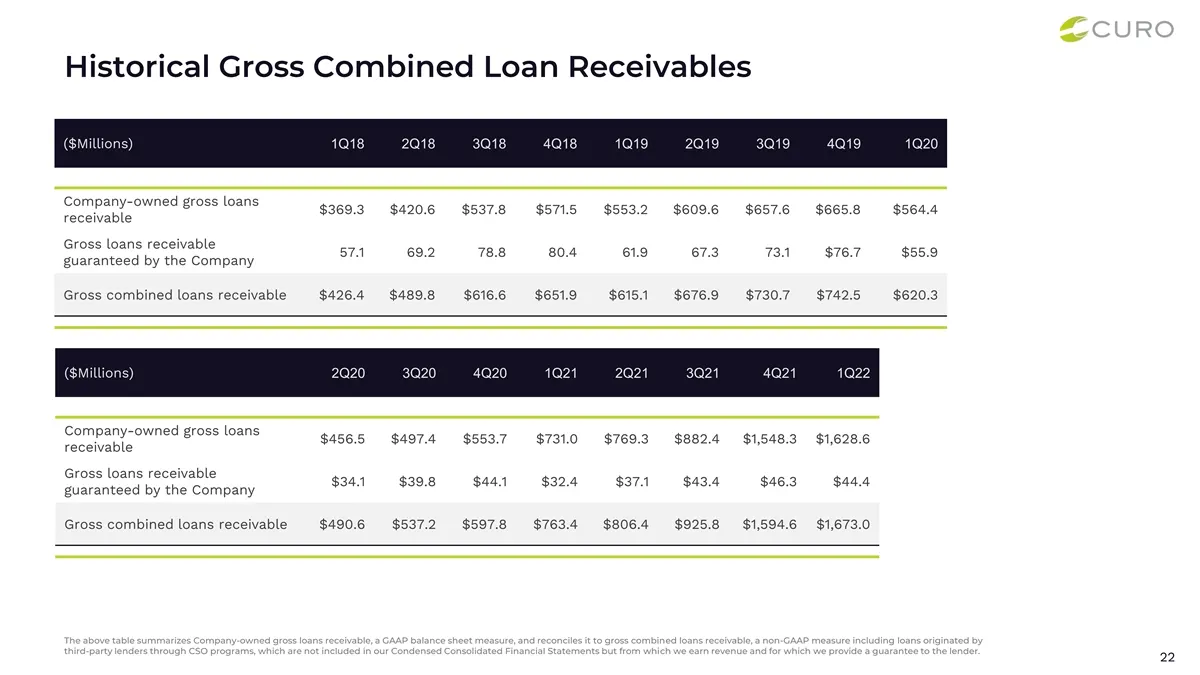
Historical Gross Combined Loan Receivables ($Millions) 1Q18 2Q18 3Q18 4Q18 1Q19 2Q19 3Q19 4Q19 1Q20 Company-owned gross loans $369.3 $420.6 $537.8 $571.5 $553.2 $609.6 $657.6 $665.8 $564.4 receivable Gross loans receivable 57.1 69.2 78.8 80.4 61.9 67.3 73.1 $76.7 $55.9 guaranteed by the Company Gros

Slide 23
Source: SEC EDGAR · 8-K filed May 19, 2022
More decks from Curo Group Holdings Corp
 Q4 2023 Earnings Presentation21 slides · Feb 12, 2024
 Investor Presentation (November 2023)15 slides · Nov 13, 2023
 Q3 2023 Earnings Presentation20 slides · Nov 2, 2023
 Debt Investor Presentation (October 2023)21 slides · Oct 23, 2023
 Investor Presentation (September 2023)15 slides · Sep 25, 2023
 Q2 2023 Earnings Presentation21 slides · Aug 3, 2023