Snap Inc. · NYSE:SNAP
Snap — Q3 2019 Earnings Presentation
19 slides from Snap's earnings presentation, Oct 22, 2019

Slide 1: Q3 2019 Earnings Slides
Q3 2019 Earnings Slides October 22, 2019
Slide 2: Forward-Looking Statements & Non-GAAP Financial Measures
Forward-Looking Statements & Non-GAAP Financial Measures This presentation contains forward-looking statements about us and our industry that involve substantial risks and uncertainties. All statements other than statements of historical facts contained in this presentation, including statements reg
Slide 3: Third Quarter Financial Highlights
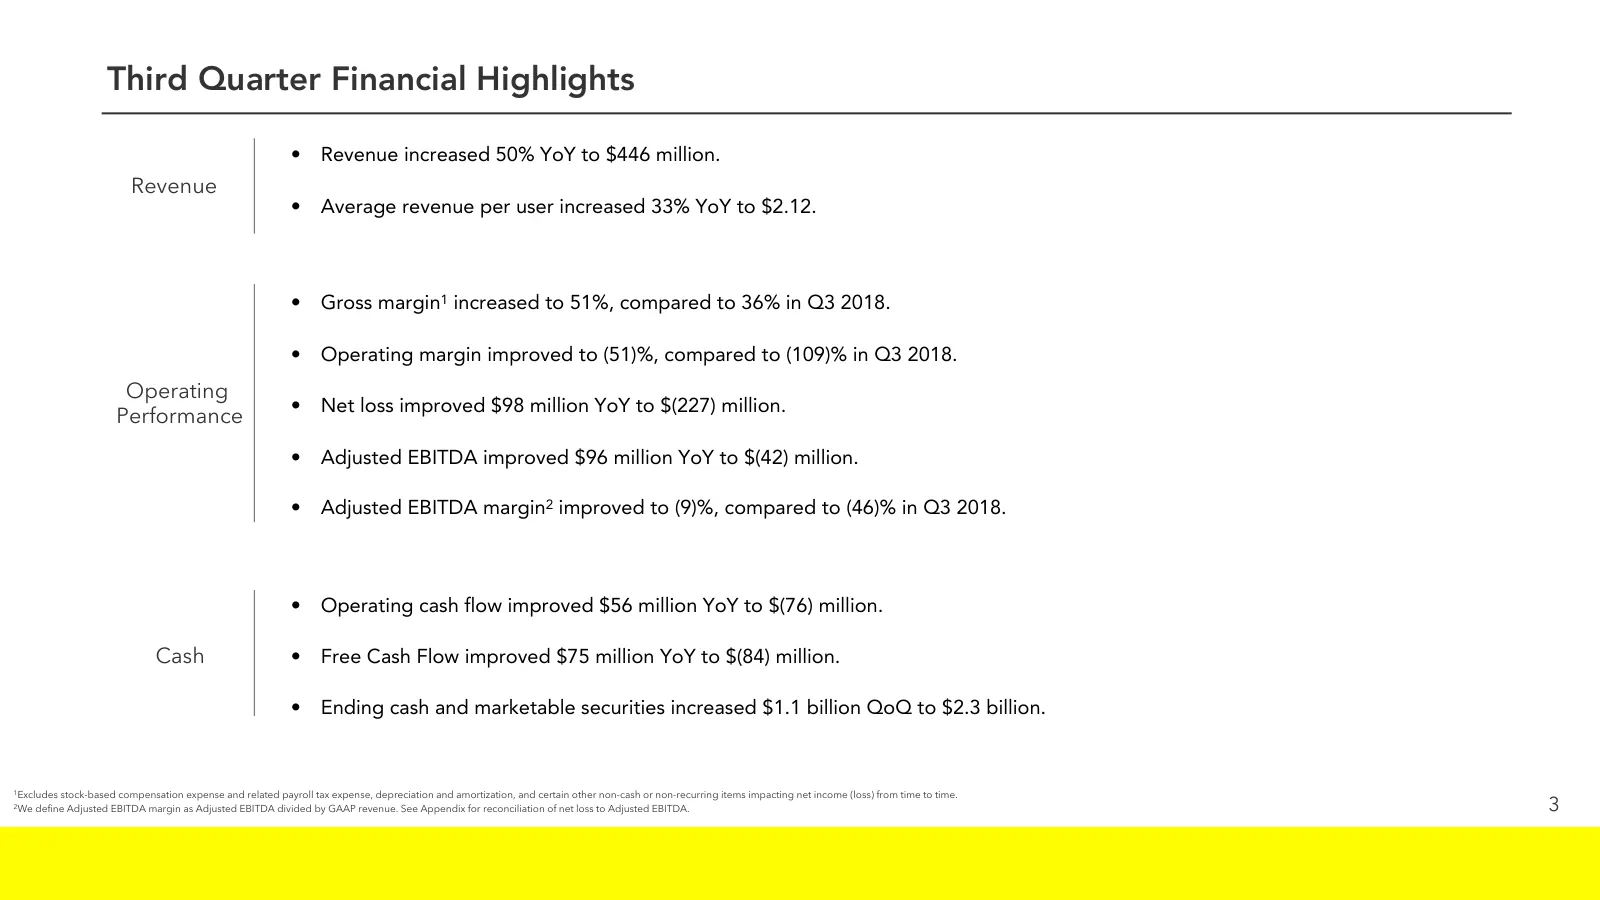
Third Quarter Financial Highlights • Revenue increased 50% YoY to $446 million. Revenue • Average revenue per user increased 33% YoY to $2.12. • Gross margin1 increased to 51%, compared to 36% in Q3 2018. • Operating margin improved to (51)%, compared to (109)% in Q3 2018. Operating • Net loss impro
Slide 4: Business Highlights
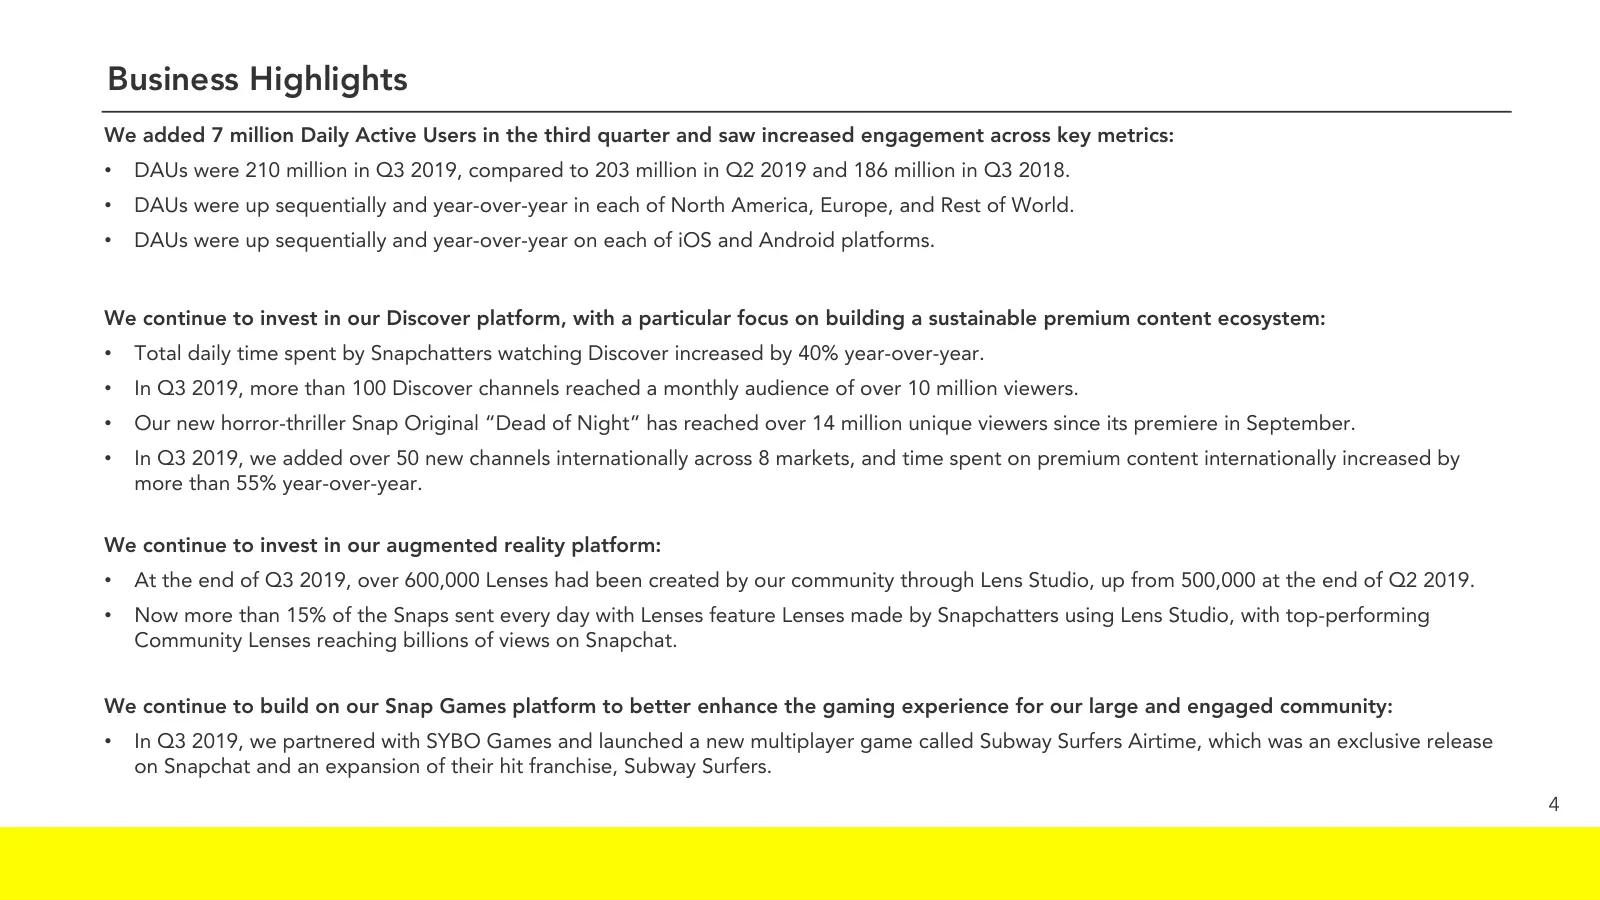
Business Highlights We added 7 million Daily Active Users in the third quarter and saw increased engagement across key metrics: • DAUs were 210 million in Q3 2019, compared to 203 million in Q2 2019 and 186 million in Q3 2018. • DAUs were up sequentially and year-over-year in each of North America,
Slide 5: Business Highlights (Continued)
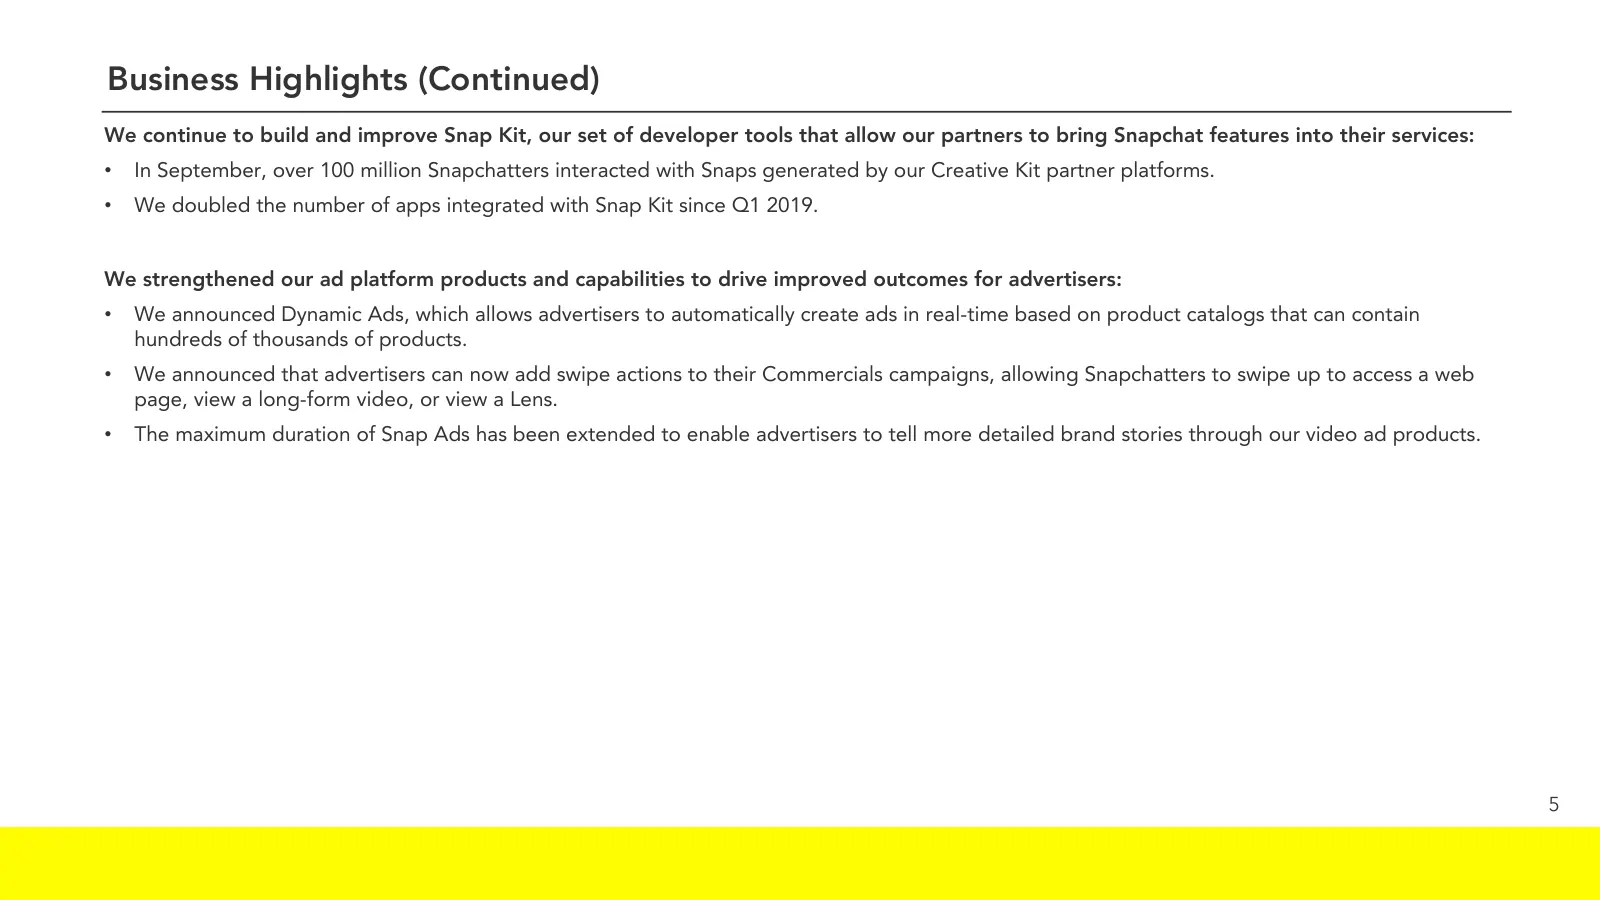
Business Highlights (Continued) We continue to build and improve Snap Kit, our set of developer tools that allow our partners to bring Snapchat features into their services: • In September, over 100 million Snapchatters interacted with Snaps generated by our Creative Kit partner platforms. • We doub
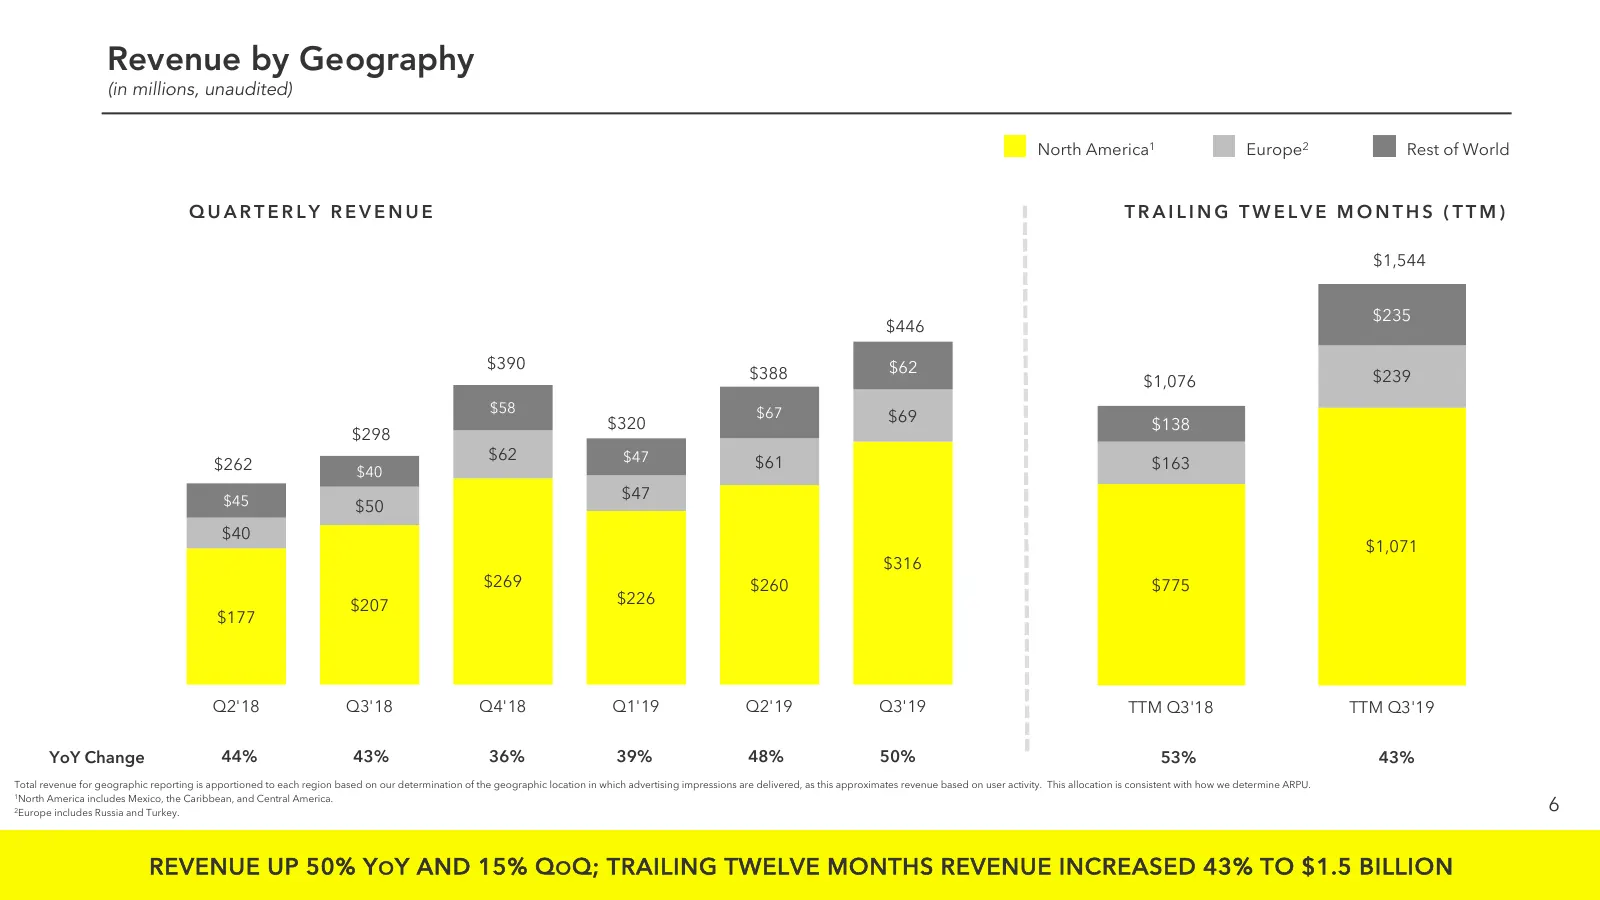
Slide 6: Revenue by Geography
Revenue by Geography (in millions, unaudited) North America1 Europe2 Rest of World QUARTERLY REVENUE TRAILING TWELVE MONTHS (TTM) $1,544 $235 $446 $390 $62 $388 $1,076 $239 $58 $67 $320 $69 $138 $298 $62 $47 $61 $262 $40 $163 $45 $47 $50 $40 $1,071 $316 $269 $260 $775 $207 $226 $177 Q2'18 Q3'18 Q4'1
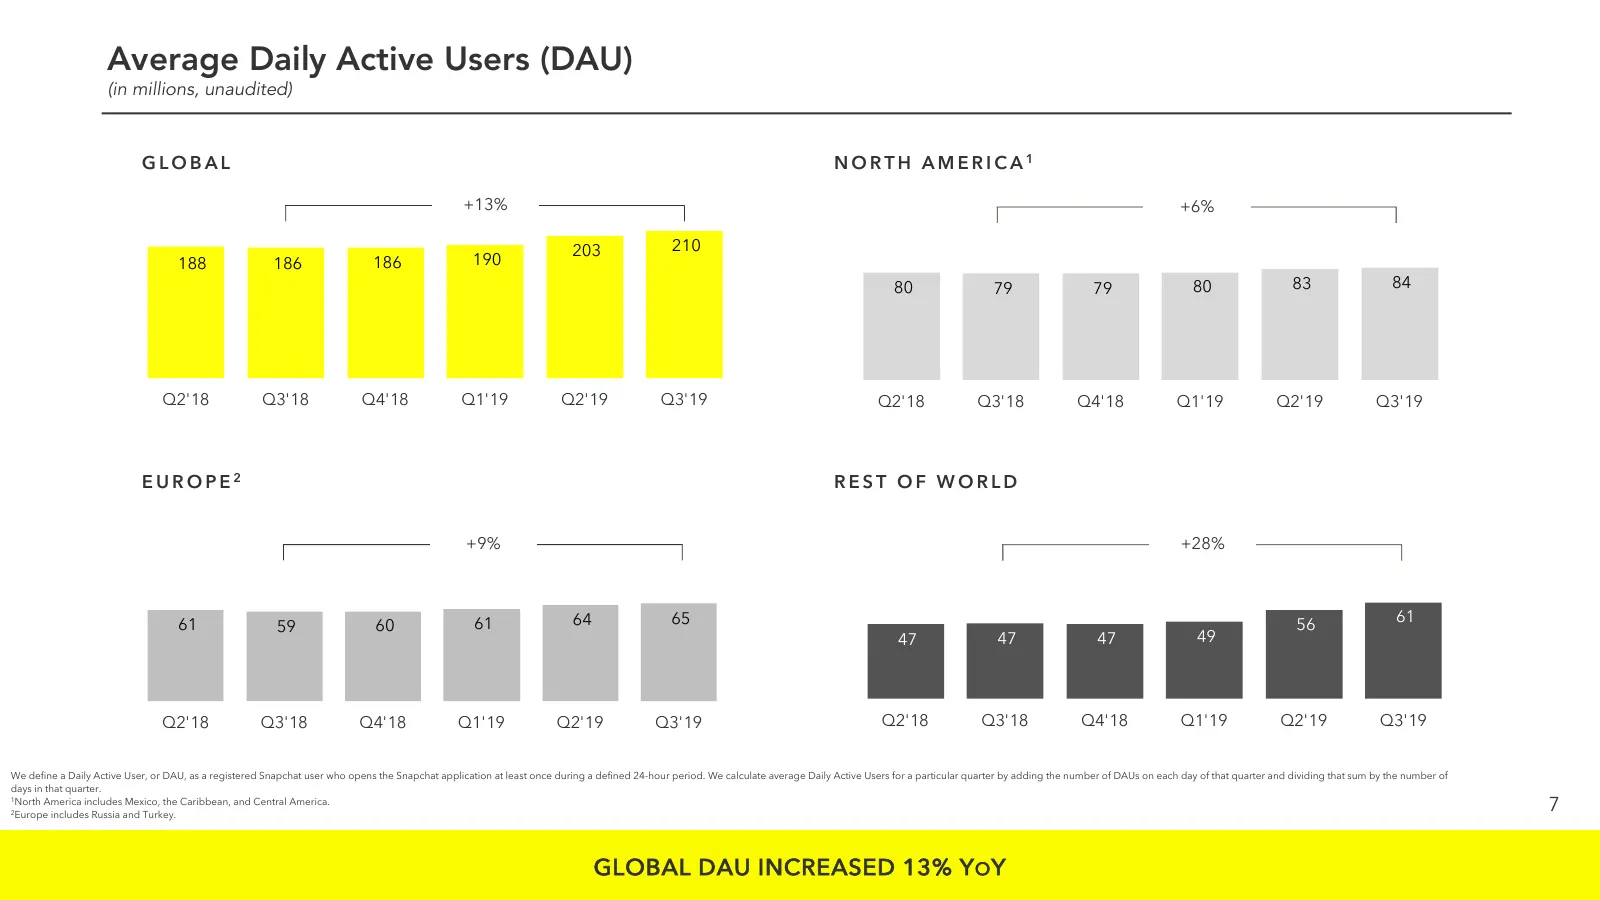
Slide 7: Average Daily Active Users (DAU)
Average Daily Active Users (DAU) (in millions, unaudited) GLOBAL NORTH AMERICA1 +13% +6% 203 210 188 186 186 190 80 79 79 80 83 84 Q2'18 Q3'18 Q4'18 Q1'19 Q2'19 Q3'19 Q2'18 Q3'18 Q4'18 Q1'19 Q2'19 Q3'19 EUROPE2 REST OF WORLD +9% +28% 61 61 64 65 56 61 59 60 47 47 47 49 Q2'18 Q3'18 Q4'18 Q1'19 Q2'19
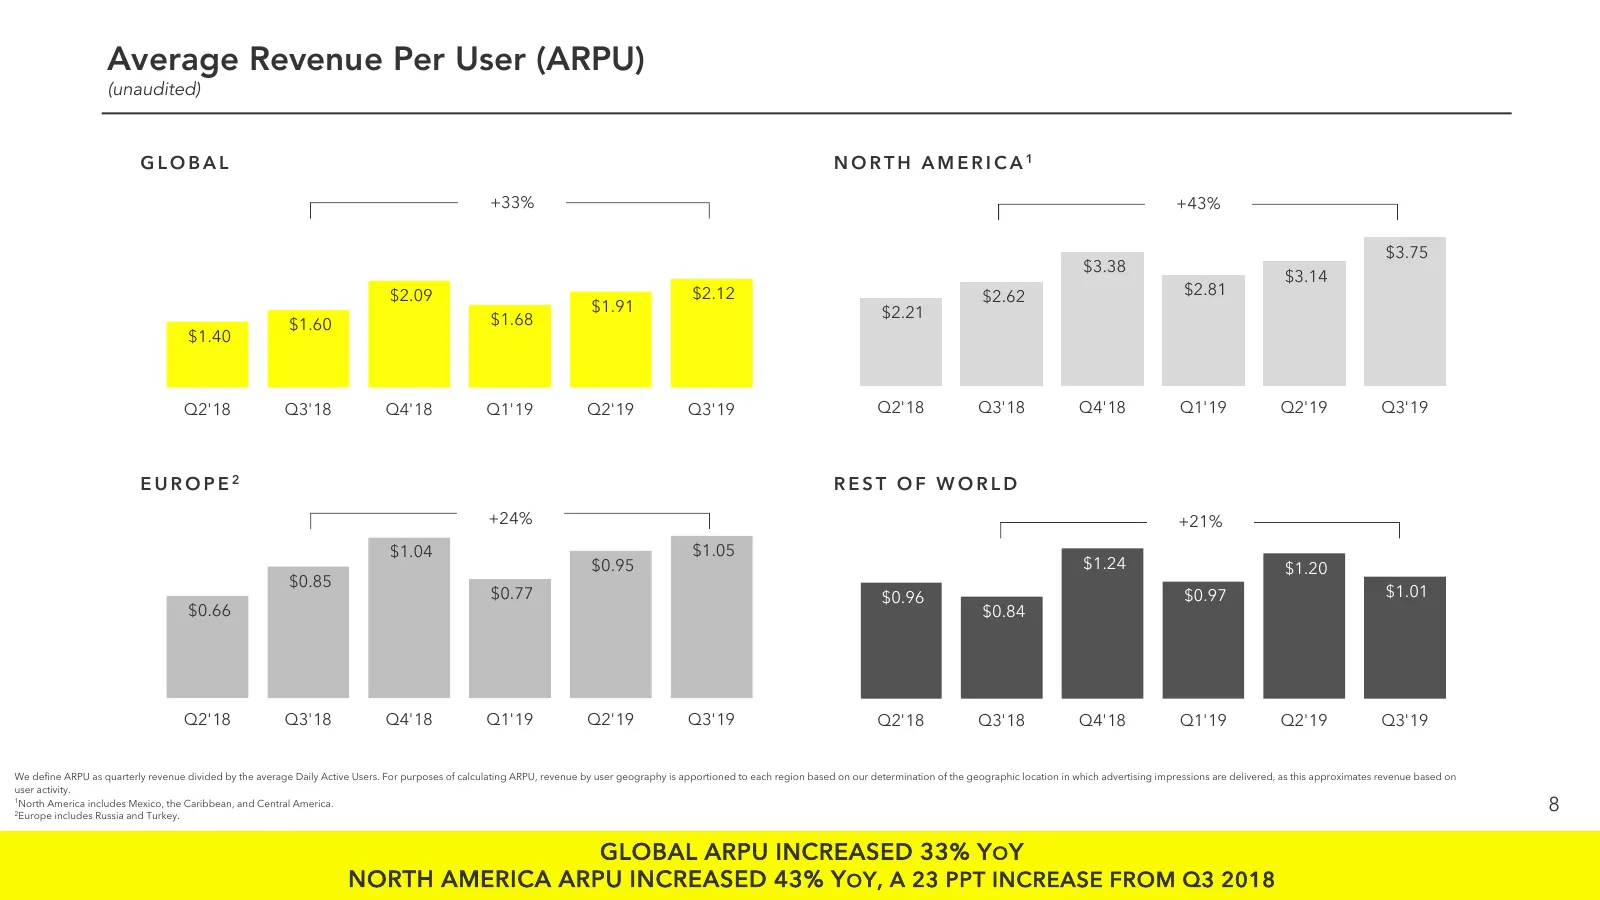
Slide 8: Average Revenue Per User (ARPU)
Average Revenue Per User (ARPU) (unaudited) GLOBAL NORTH AMERICA1 +33% +43% $3.75 $3.38 $3.14 $2.09 $2.12 $2.62 $2.81 $1.91 $2.21 $1.60 $1.68 $1.40 Q2'18 Q3'18 Q4'18 Q1'19 Q2'19 Q3'19 Q2'18 Q3'18 Q4'18 Q1'19 Q2'19 Q3'19 EUROPE2 REST OF WORLD +24% +21% $1.04 $1.05 $0.95 $1.24 $1.20 $0.85 $0.77 $0.96
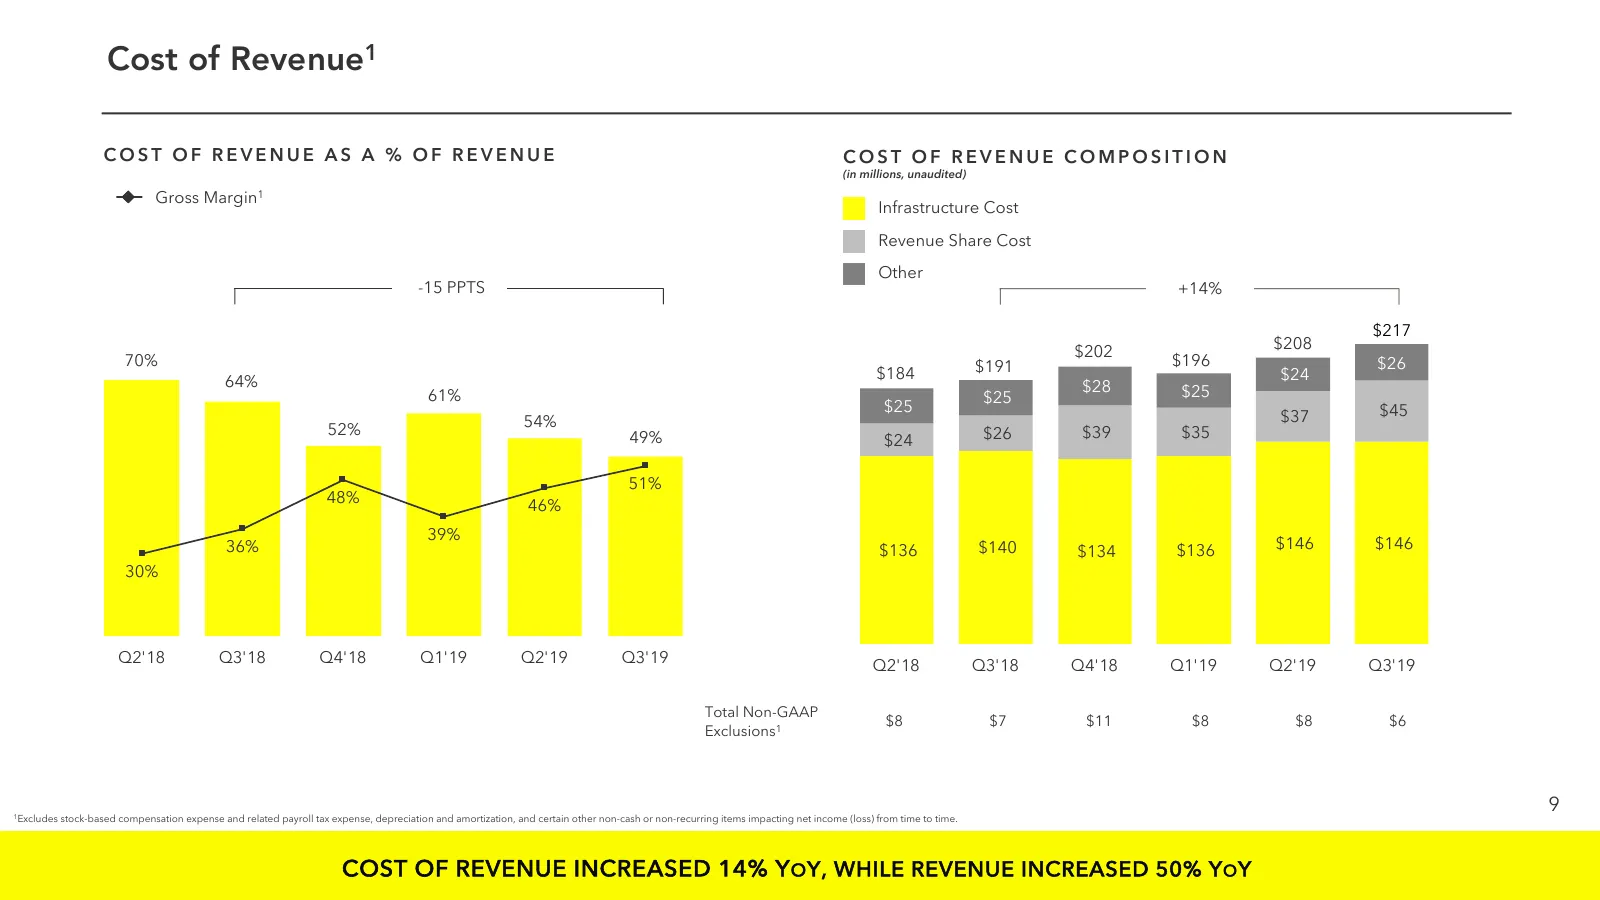
Slide 9: Cost of Revenue
Cost of Revenue1 COST OF REVENUE AS A % OF REVENUE COST OF REVENUE COMPOSITION (in millions, unaudited) Gross Margin1 Infrastructure Cost Revenue Share Cost Other -15 PPTS +14% $217 $202 $208 70% $191 $196 $26 64% $184 $24 $28 $25 61% $25 $25 $45 54% $37 52% 49% $26 $39 $35 $24 51% 48% 46% 39% 36% $
Slide 10: Operating Expenses
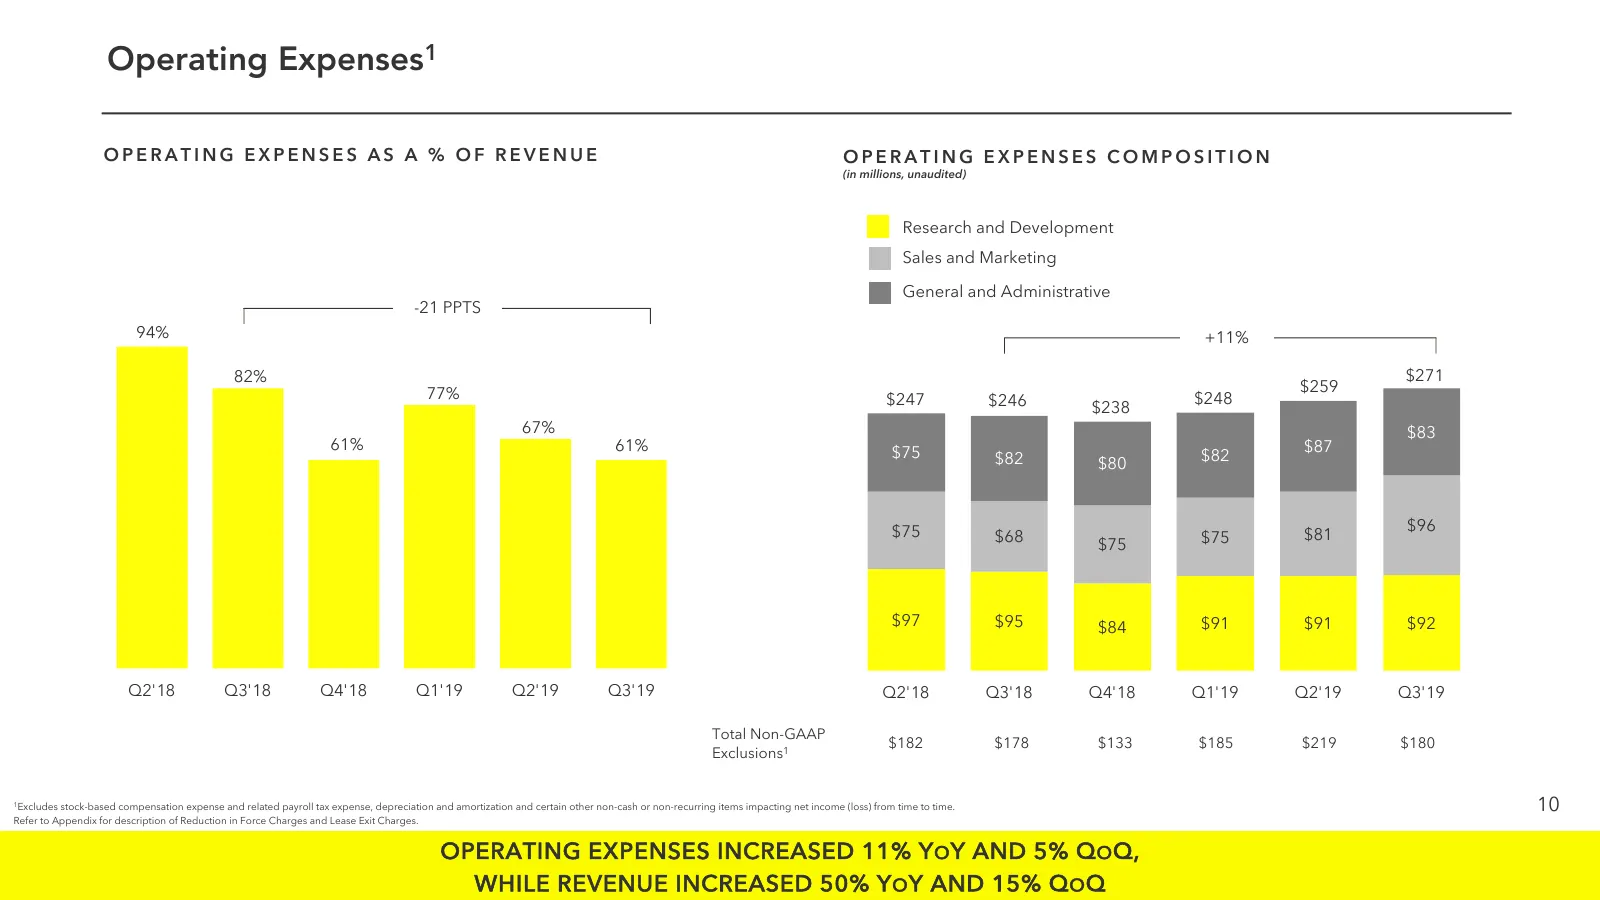
Operating Expenses1 OPERATING EXPENSES AS A % OF REVENUE OPERATING EXPENSES COMPOSITION (in millions, unaudited) Research and Development Sales and Marketing General and Administrative -21 PPTS 94% +11% 82% $271 77% $259 $247 $246 $248 $238 67% $83 61% 61% $75 $87 $82 $82 $80 $75 $96 $68 $75 $81 $75
Slide 11: Net Loss & Adjusted EBITDA
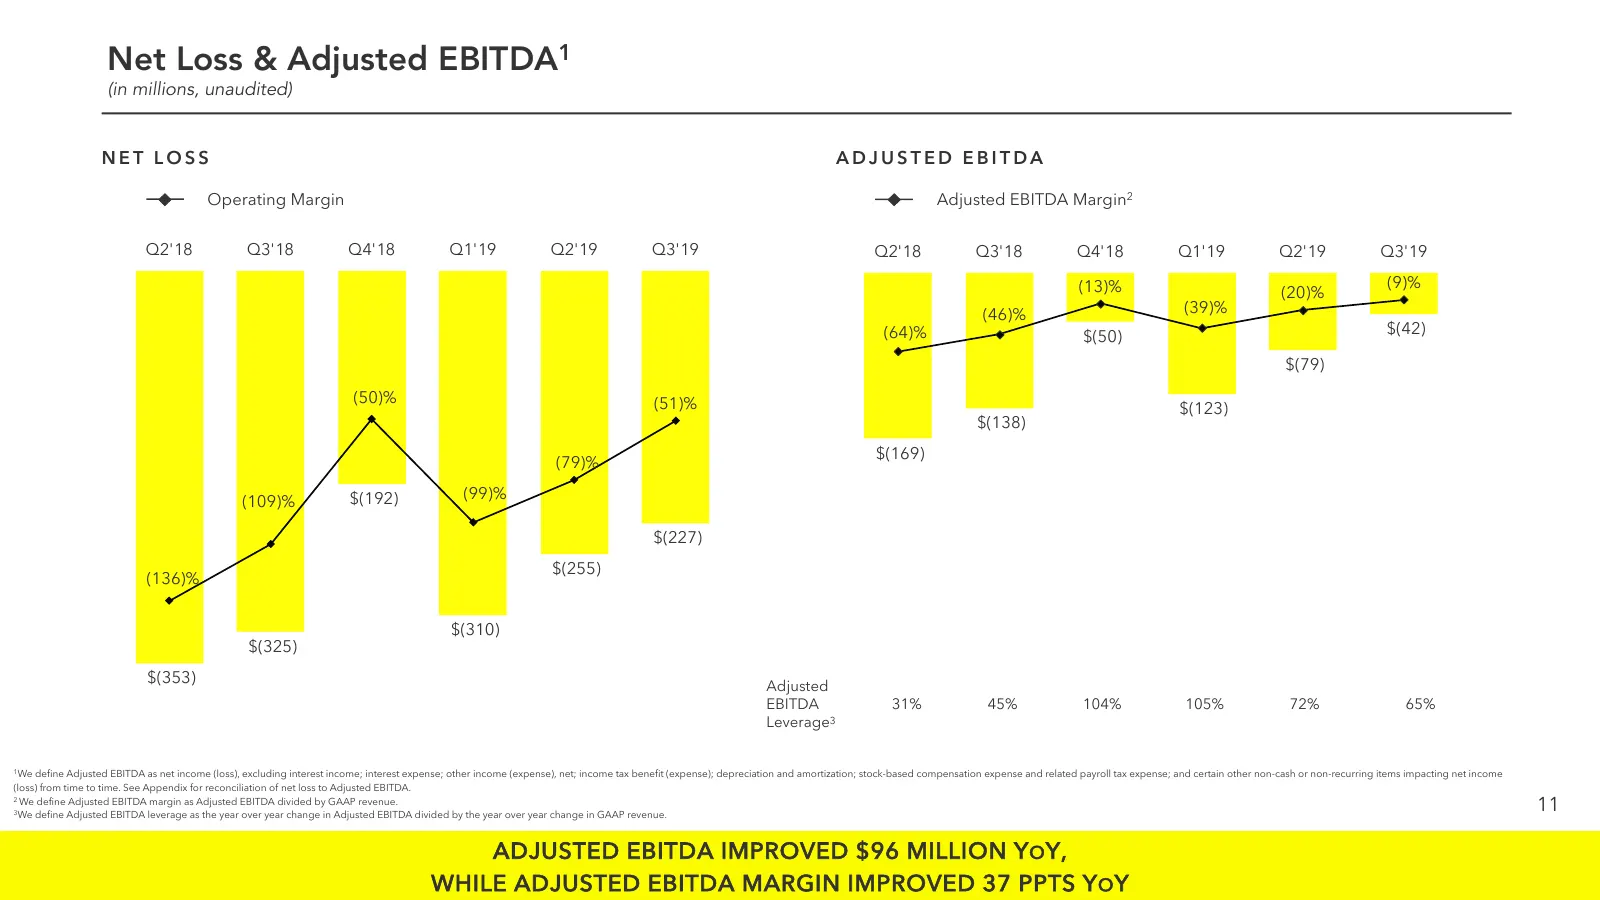
Net Loss & Adjusted EBITDA1 (in millions, unaudited) NET LOSS ADJUSTED EBITDA Operating Margin Adjusted EBITDA Margin2 Q2'18 Q3'18 Q4'18 Q1'19 Q2'19 Q3'19 Q2'18 Q3'18 Q4'18 Q1'19 Q2'19 Q3'19 (13)% (9)% (20)% (46)% (39)% (64)% $(50) $(42) $(79) (50)% (51)% $(123) $(138) $(169) (79)% $(192) (99)% (109
Slide 12: Diluted Net Loss Per Share & Common Shares Outstanding Plus Shares Underlying Stock-Based Awards
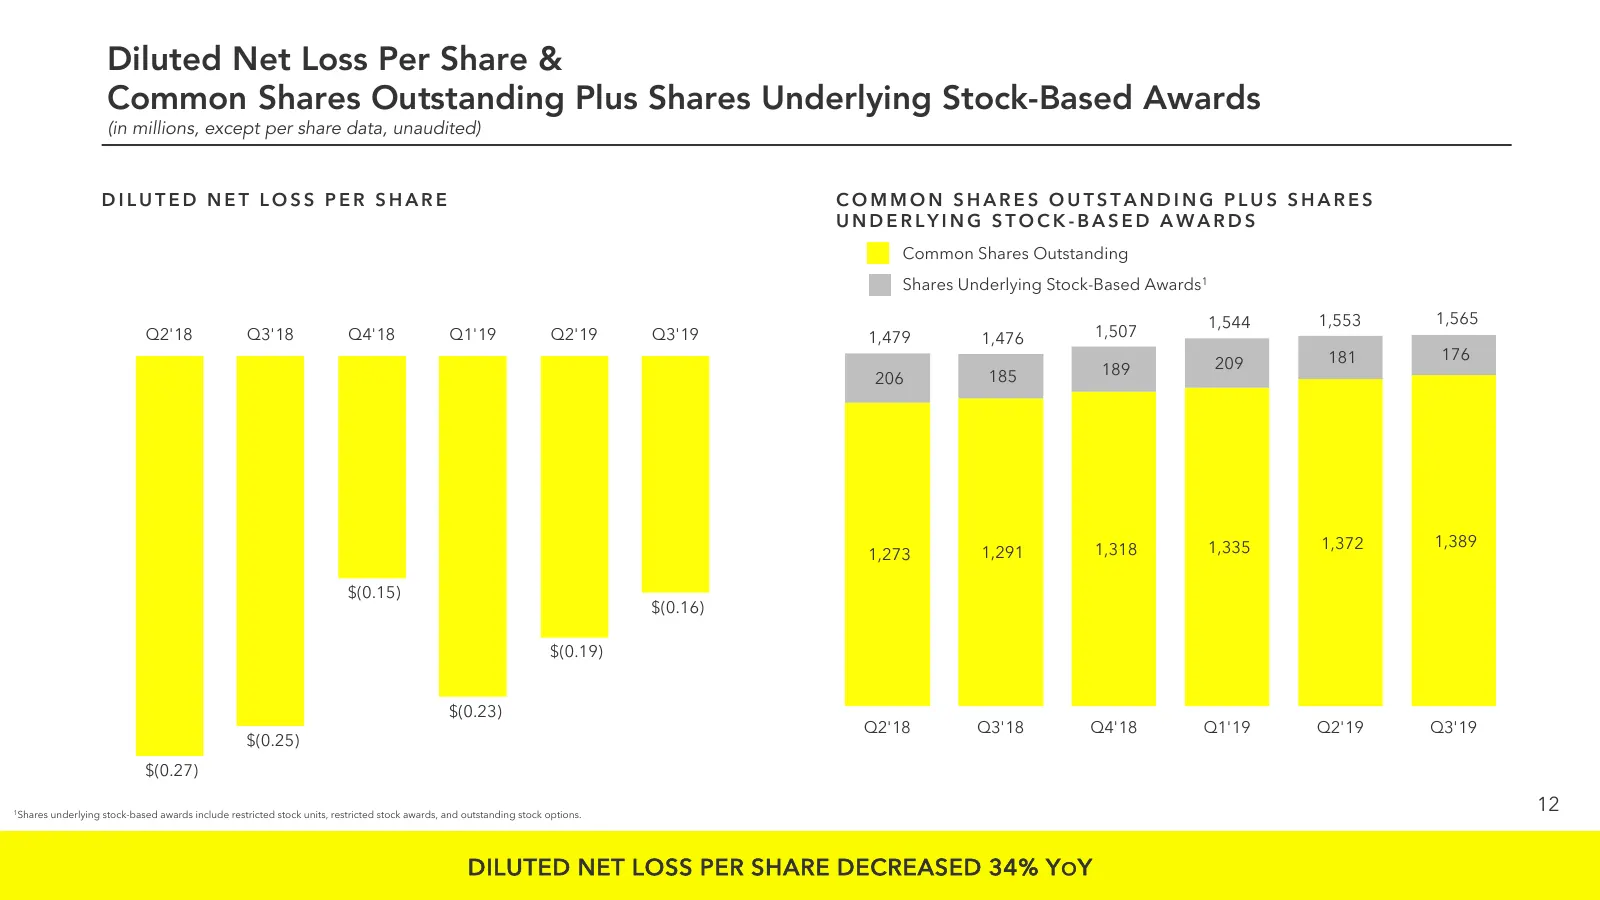
Diluted Net Loss Per Share & Common Shares Outstanding Plus Shares Underlying Stock-Based Awards (in millions, except per share data, unaudited) DILUTED NET LOSS PER SHARE COMMON SHARES OUTSTANDING PLUS SHARES UNDERLYING STOCK-BASED AWARDS Common Shares Outstanding Shares Underlying Stock-Based Awar
Slide 13: Free Cash Flow
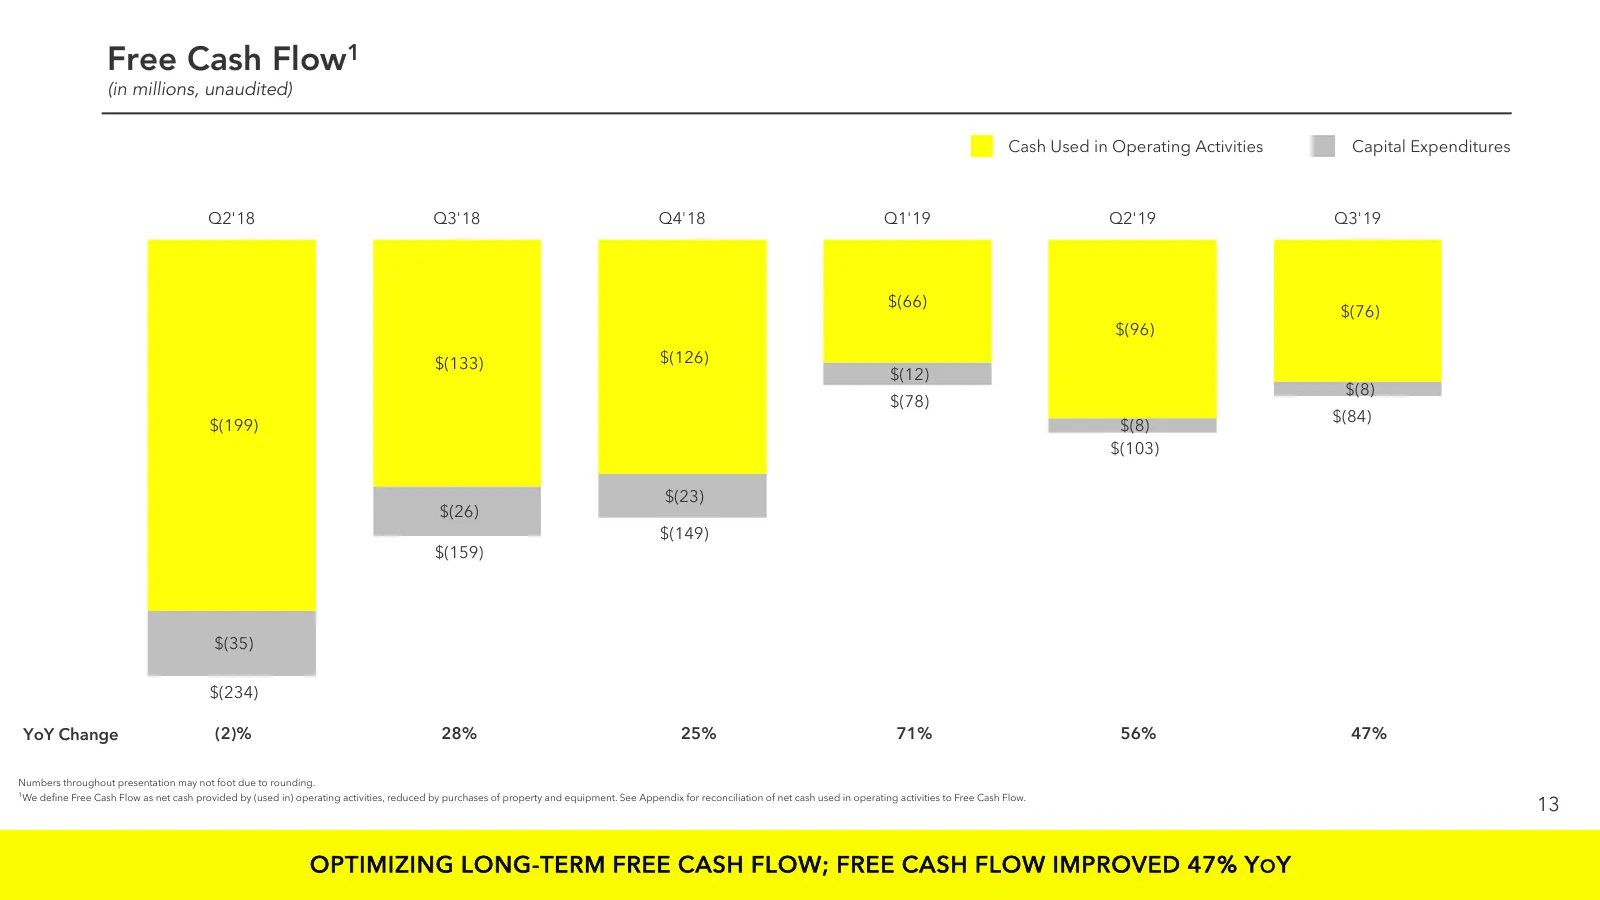
Free Cash Flow1 (in millions, unaudited) Cash Used in Operating Activities Capital Expenditures Q2'18 Q3'18 Q4'18 Q1'19 Q2'19 Q3'19 $(66) $(76) $(96) $(133) $(126) $(12) $(8) $(78) $(84) $(199) $(8) $(103) $(23) $(26) $(149) $(159) $(35) $(234) YoY Change (2)% 28% 25% 71% 56% 47% Numbers throughout
Slide 14: Financial Guidance
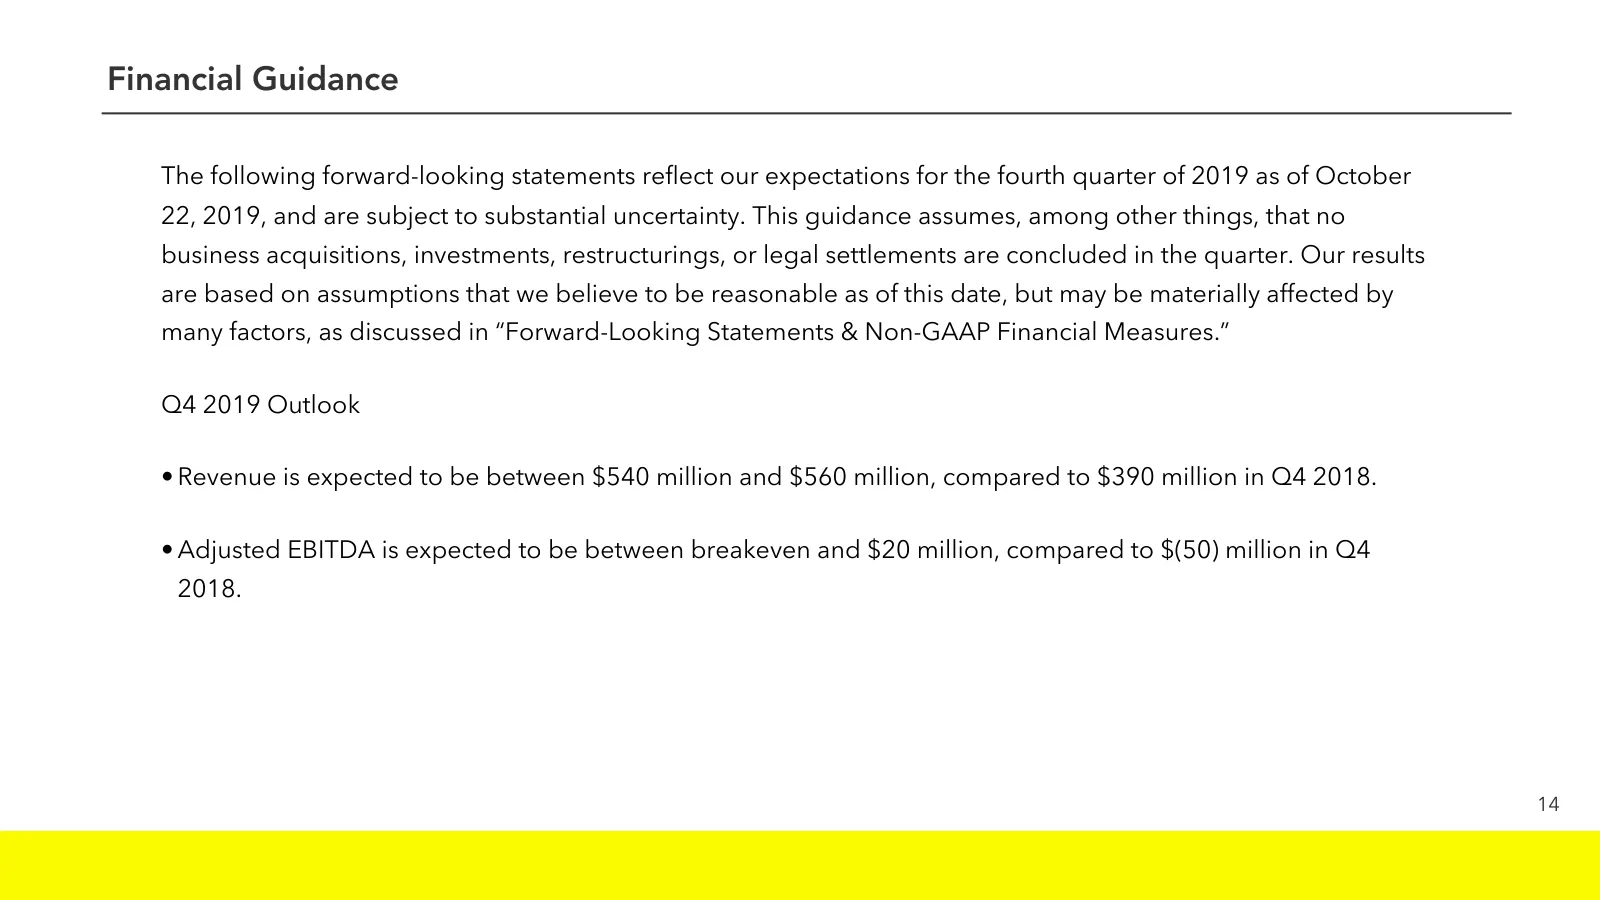
Financial Guidance The following forward-looking statements reflect our expectations for the fourth quarter of 2019 as of October 22, 2019, and are subject to substantial uncertainty. This guidance assumes, among other things, that no business acquisitions, investments, restructurings, or legal sett

Slide 15: Appendix
Appendix
Slide 16: Non-GAAP Financial Measures Reconciliation
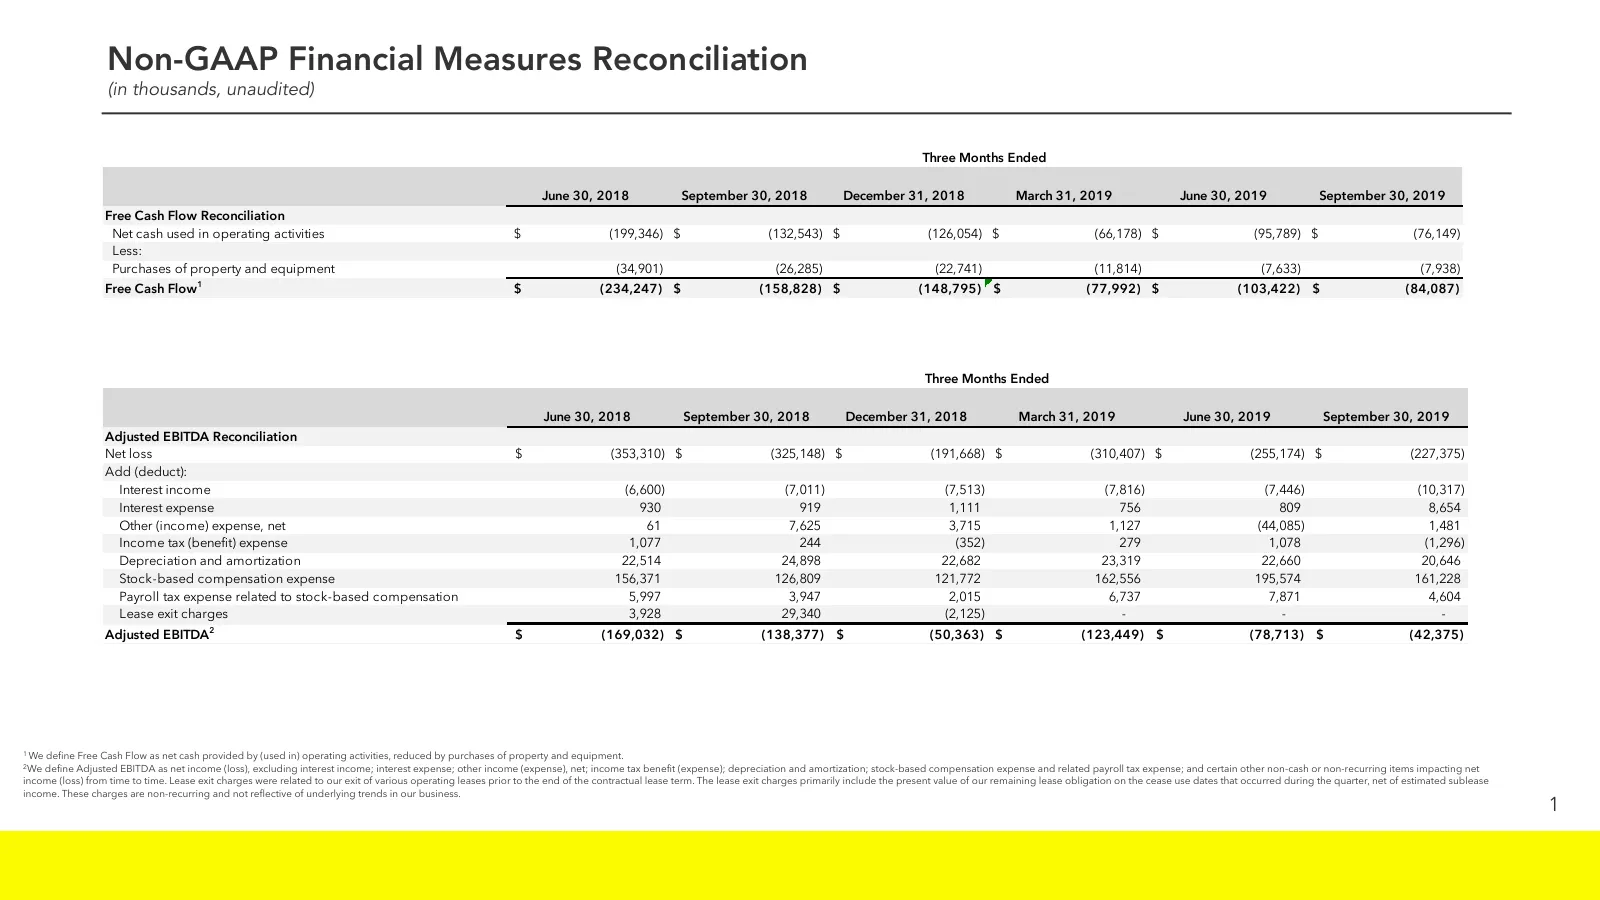
Non-GAAP Financial Measures Reconciliation (in thousands, unaudited) Three Months Ended June 30, 2018 September 30, 2018 December 31, 2018 March 31, 2019 June 30, 2019 September 30, 2019 Free Cash Flow Reconciliation Net cash used in operating activities $ (199,346) $ (132,543) $ (126,054) $ (66,178
Slide 17: Non-GAAP Financial Measures Reconciliation (Continued)
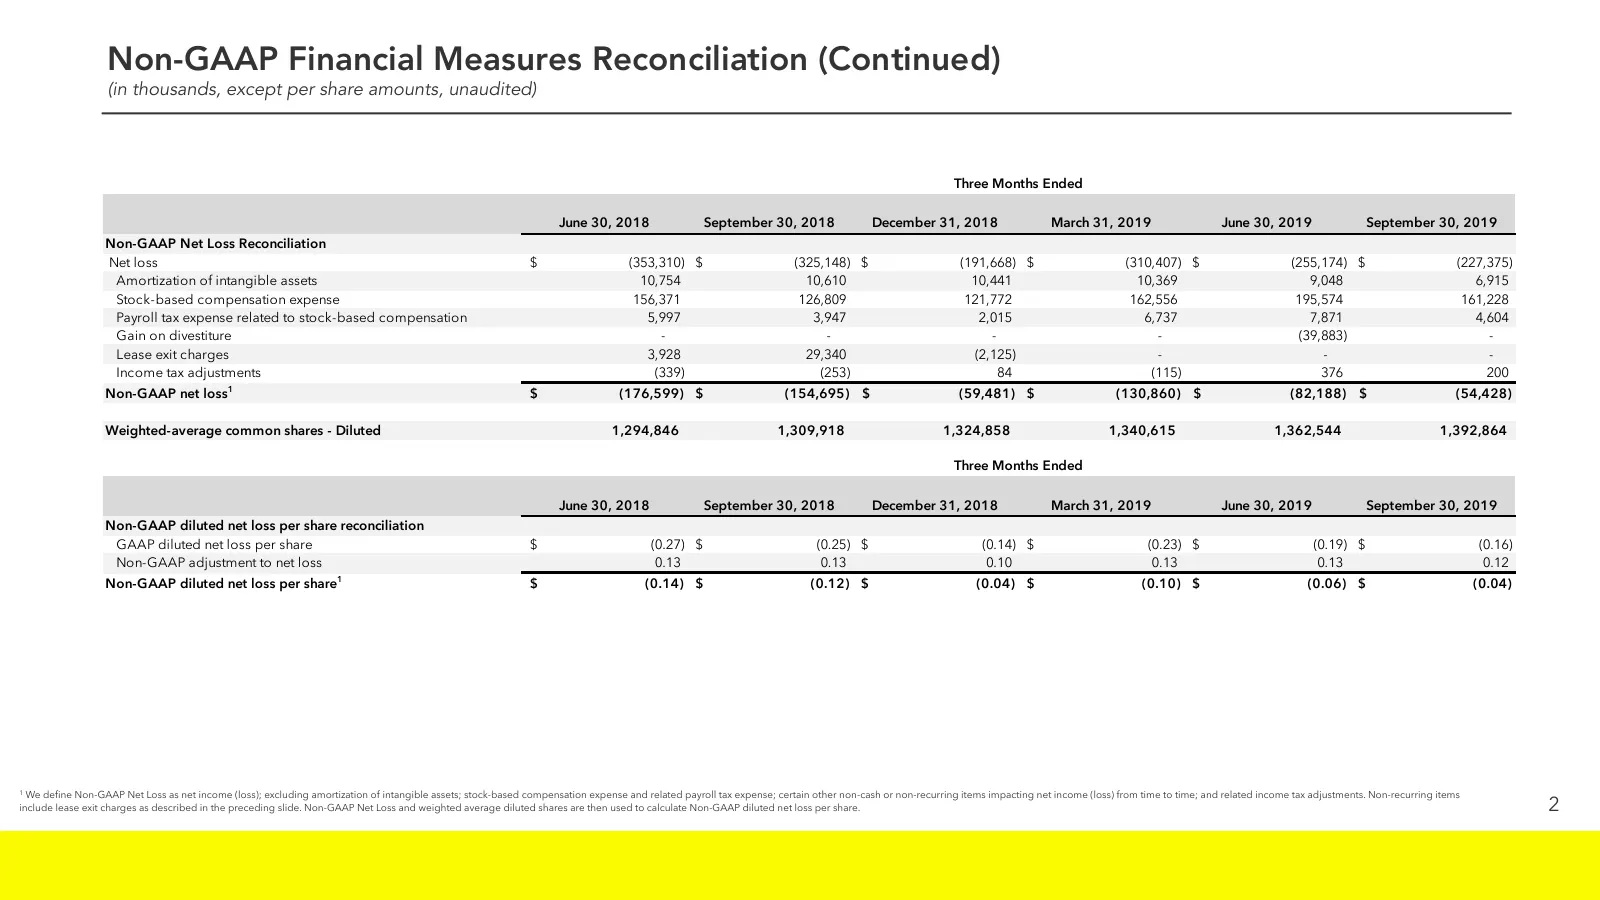
Non-GAAP Financial Measures Reconciliation (Continued) (in thousands, except per share amounts, unaudited) Three Months Ended June 30, 2018 September 30, 2018 December 31, 2018 March 31, 2019 June 30, 2019 September 30, 2019 Non-GAAP Net Loss Reconciliation Net loss $ (353,310) $ (325,148) $ (191,66
Slide 18: Note Regarding User Metrics and Other Data
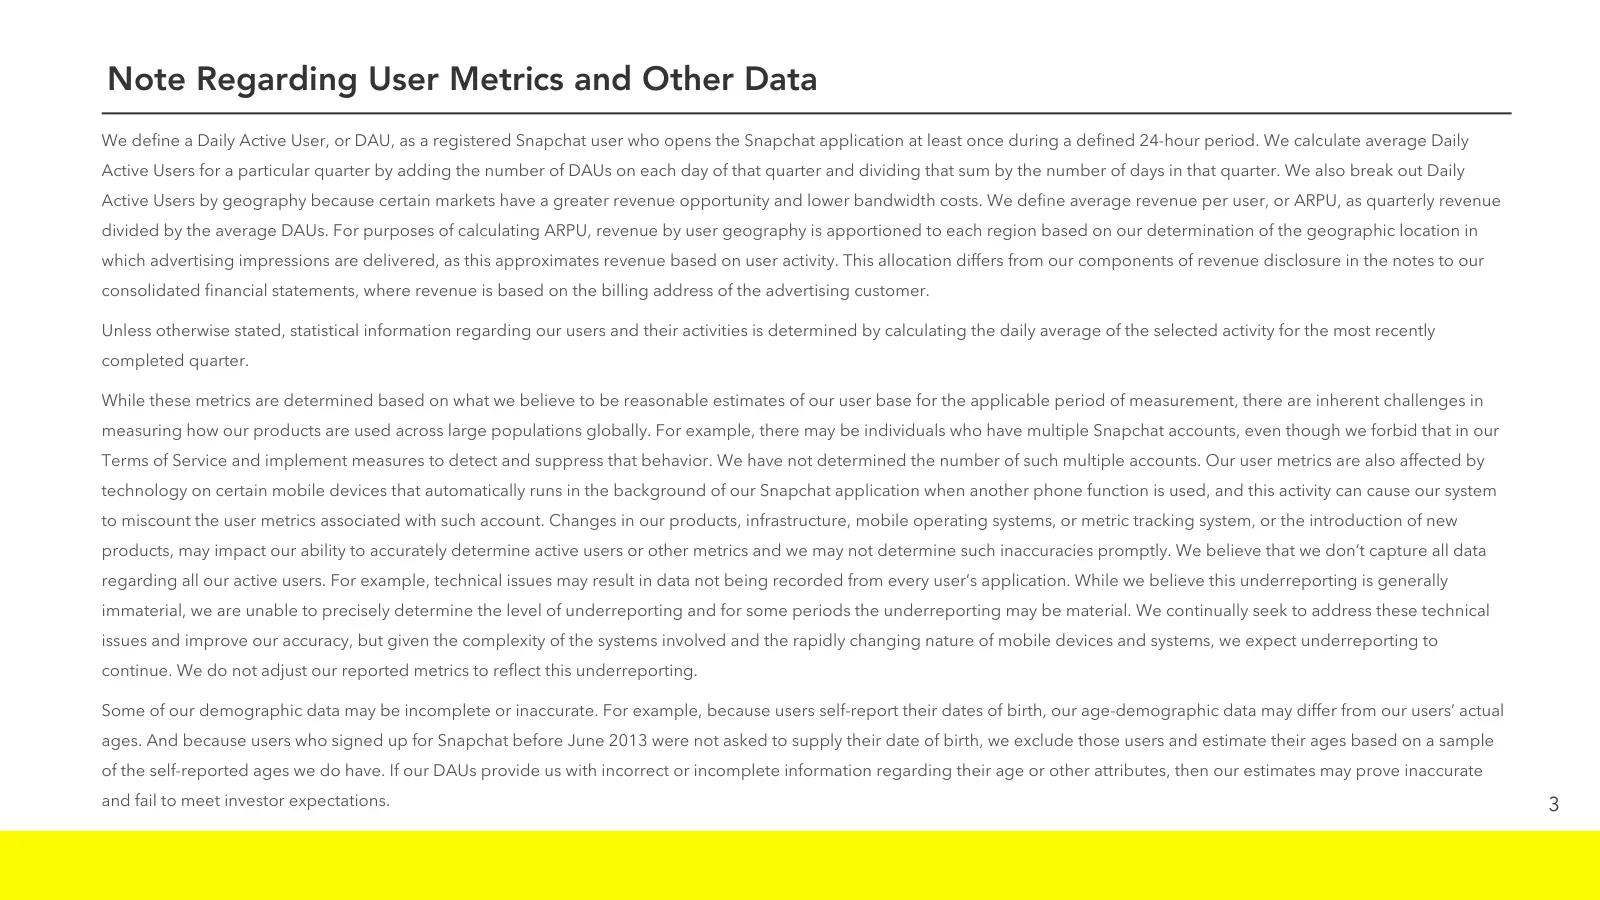
Note Regarding User Metrics and Other Data We define a Daily Active User, or DAU, as a registered Snapchat user who opens the Snapchat application at least once during a defined 24-hour period. We calculate average Daily Active Users for a particular quarter by adding the number of DAUs on each day
Slide 19: Note Regarding User Metrics and Other Data (Continued)
Note Regarding User Metrics and Other Data (Continued) We currently use an analytics platform that we developed and operate and we count a DAU only when a user opens the application and only once per user per day. We believe this methodology accurately measures our user engagement. We have multiple
Source: Internet Archive copy of s25.q4cdn.com
More decks from Snap Inc.
 Q2 2026 Earnings Presentation21 slides · Aug 3, 2026
 Q1 2026 Earnings Presentation22 slides · May 6, 2026
 Corporate Update (April 2026)10 slides · April 2026
 Q4 2025 Earnings Presentation32 slides · Feb 4, 2026
 Q3 2025 Earnings Presentation24 slides · Nov 5, 2025
 Q2 2025 Earnings Presentation24 slides · Aug 5, 2025